Article

Learning Global Evapotranspiration Dataset Corrections from a Water Cycle Closure Supervision

1
Graduate School of System Informatics, Kobe University, Kobe 657-8501, Japan
2
Laboratoire d’Etude du Rayonnement et de la Matière en Astrophysique et en Atmosphère, Observatoire de Paris, 75014 Paris, France
*
Author to whom correspondence should be addressed.
These authors contributed equally to this work.
Remote Sens. 2024, 16(1), 170; https://doi.org/10.3390/rs16010170
Submission received: 30 October 2023 / Revised: 21 December 2023 / Accepted: 27 December 2023 / Published: 31 December 2023
(This article belongs to the Special Issue Machine Learning for Spatiotemporal Remote Sensing Data)

Abstract

:
Evapotranspiration (E) is one of the most uncertain components of the global water cycle (WC). Improving global E estimates is necessary to improve our understanding of climate and its impact on available surface water resources. This work presents a methodology for deriving monthly corrections to global E datasets at 0.25 resolution. A principled approach is proposed to firstly use indirect information from the other water components to correct E estimates at the catchment level, and secondly to extend this sparse catchment-level information to global pixel-level corrections using machine learning (ML). Several E satellite products are available, each with its own errors (both random and systematic). Four such global E datasets are used to validate the proposed approach and highlight its ability to extract seasonal and regional systematic biases. The resulting E corrections are shown to accurately generalize WC closure constraints to unseen catchments. With an average deviation of 14% from the original E datasets, the proposed method achieves up to 20% WC residual reduction on the most favorable dataset.

1. Introduction

Evapotranspiration (E) is a physical process involving soils, plants, and the surrounding weather conditions. It is a fundamental process for the climate system as it links the surface and the atmosphere through the water, energy, and carbon cycles [1] by providing moisture and heat to the atmosphere. E can be broken down into different components: transpiration, interception loss, bare soil evaporation, snow sublimation, and open water evaporation [2].
However, E is difficult to measure. The most accurate method is based on local measurements of vertical turbulent fluxes using in situ eddy covariance measurements [3]. From these turbulent fluxes, the sensible and latent heat are derived, and the latter is converted to E using the latent heat of vaporization for water. Unfortunately, these in situ data are very sparse on the globe, as shown by the FLUXNET dataset, which collects most of the available data [3]. The spatial representativeness of such datasets is limited, especially over heterogeneous landscapes and unmonitored regions [2].
Over the last two decades, global E estimates have been available from satellite observations and surface energy balance [4] on the one hand, and physically based models [5,6] on the other. Among the latter, the Penman–Monteith (PM) equation [5,6] is considered the standard model. This equation gives a reference evapotranspiration based on a radiation term related to temperature and an aerodynamic term related to vapor pressure deficit and wind speed [7]. Such a reference E is representative of a well-watered grass surface and can be further modulated by crop- and soil-specific coefficients such as the stress factor to give the actual E [5,6].
Due to the frequent unavailability of weather variables needed for their calculations, many crop models have moved towards empirical approaches that simplify the PM model to calculate the reference evapotranspiration from fewer meteorological variables by neglecting some of them and estimating the model parameters through calibration. The latter can be divided into two categories: parametric methods that rely only on temperature [8,9] and radiation-based approaches that take into account both solar radiation and temperature [10,11,12].
Satellite-based E products have improved our understanding of E processes worldwide, enhancing our understanding of hydrological processes [13], land surface energy partitioning [14], and its link to the carbon cycle [15] at multiple temporal and spatial scales.
However, E processes are not directly measured by satellites. Global E datasets are derived from indirect observations and hand-crafted equations based on specific assumptions and parameterizations. Raw observations (i.e., radiation) have to go through a chain of processing to provide useful information (e.g., on temperature and vegetation). Uncertainties arise from random and systematic errors in the retrieval process due to sampling, instrument noise and satellite coverage, instrument changes, calibration, etc. Once the variables are available, E is estimated using a physical model. Uncertainties then arise from the physical formula itself and its calibrated parameters. Errors in the global E product are input errors propagated through the simplified model to the output [16]. It has been shown that the relatively higher consistency between E estimates is a result of using the same physical formula but with different meteorological inputs [17].
Current global datasets suffer from both random and systematic errors that hinder our ability to close the water cycle on a global scale, including (i) systematic errors in semi-arid regimes and tropical forests, (ii) imperfect representations of water stress and canopy interception, and (iii) a poorly constrained partitioning of terrestrial evaporation into its different components [2,18]. Furthermore, E estimates are constrained by their underlying model, which considers only precipitation as a source of moisture and omits lateral inputs from irrigation floodplains [19]. It is worth investigating whether the water mass conservation constraint can help us mitigate some systemic errors in global E datasets.
Thanks to the water mass conservation (i.e., water budget, WB) over a river basin, E is linked to precipitation P, total water storage change d S , and river discharge R at the basin scale:
P d S R E = 0 .
Since observation errors in all components prevent us from satisfying the above WB equation at the global scale, various integration frameworks based on optimal interpolation (OI) [20,21], variational assimilation [22], or the Kalman filter [23,24] have been proposed to use the WB equation as a tool to correct each individual component at the basin scale. In particular, the OI approach combines the multiplicity of data products and the coherence between them, as well as a priori estimates of individual component uncertainties, to partition the WB residual into individual component corrections. The resulting catchment-level corrections have been shown to improve agreement with in situ observations [21,25]. Unfortunately, because these approaches rely on the observed river discharge R, they are limited to the catchment scale and can only be applied to monitored catchments.
Two important objectives should be considered: (1) to extrapolate such OI basin-scale E estimates from sparse basin-level data, and (2) to extrapolate these results to other unmonitored basins. This would allow better monitoring of E processes within the monitored basins, validate and calibrate the land surface model at global scales, or improve current E datasets.
Zhang et al. (2017) [17] have attempted to obtain a closed WB at the pixel scale by using a modelled runoff instead of an observed one. This obviously reduces the observational focus of the method, which can lead to some difficulties. For example, runoff only accounts for vertical water exchange without considering horizontal exchange through river routing. Secondly, R measurements take into account human activities that affect streamflow but are not included in current models. It would therefore be preferable to rely on observed river discharge instead.
Another approach is to generalize the basin scale E corrections to the pixel scale. This can be accomplished by assuming a relationship between the E corrections and a set of environmental indices (EIs) known to influence E process. Given the above assumption, one can try to regress E corrections from these explanatory variables at the basin level and apply this relationship to pixel-wise inputs to derive pixel-wise E corrections. This would allow the observational focus of the method to be maintained by relying on observed runoff at the catchment level. Such an approach was first proposed recently [25] using a quasi-linear regression model.
Machine learning (ML) has recently been used in hydrology to model runoff from precipitation [26], or to correct precipitation on a global scale using river discharge information over multiple small catchments [27]. Recently, [28] trained a deep learning algorithm on eddy covariance fed with satellite observations to model the transpiration stress factor before embedding this data-driven formulation into a process-based model of E to obtain a global hybrid E model.
In this work, we propose a principled approach using modern machine learning (ML) tools to extrapolate sparse basin-level corrections to the pixel scale.
The overall strategy used in this paper is shown in Figure 1. The problem is divided into four parts. (1) First, optimal interpolation (OI) is applied at the basin scale to estimate a correction of E using the four components of the terrestrial water cycle (WC). This results in a basin scale correction of E. (2) These E corrections are then collocated to the ensemble of pixels included in each basin. This database is then made up of pixel-level and basin-level information, which is a challenge for training an ML model. (3) An ML model is built with pixel-level inputs and basin-level outputs. The scheme shows how the same correction model is applied to each of the pixels of a basin, then the obtained E-corrections are aggregated to obtain basin-level output data. This allows a pixel model (i.e., yellow points) to be trained using a multi-resolution architecture. This aggregated monitoring is an innovative way of dealing with such cases. (4) The obtained pixel-level model (yellow dots) can then be used to infer E corrections at the pixel level.
The datasets used in this study are presented in Section 2. Section 3.3 describes the methodology used to estimate E-corrections at the catchment scale and Section 4 presents the methodology proposed to generalize these corrections to the pixel level. The results of the E correction are presented in Section 5 and the evaluation is carried out in Section 6. Finally, conclusions and perspectives are given in Section 7.

2. Datasets Used in This Study

All datasets presented in this section have been projected onto a common spatial grid with a spatial resolution of 0.25 and aggregated to monthly intervals where necessary. Temporal aggregation was performed by simple summation and averaging. Table 1 summarizes the different variables used in this study, which are described in more detail below.

2.1. Evapotranspiration (E) Estimates

While several E products exist in the literature, four datasets have been selected because of their different empirical equation for calculating E and/or the different inputs they use. They are representative of the state of the art in global E-estimation and the interested reader should refer to the appropriate reference for in-depth evaluations of individual products.
The Global Land Evaporation Amsterdam Model (GLEAM) algorithm was first developed to use satellite observations to estimate E by maximizing the amount of input derived from space sensors. GLEAM derives the different components of terrestrial evaporation separately as (1) transpiration, (2) soil and open water evaporation, and (3) canopy interception and sublimation [2,29]. The vapor flux is calculated separately for each of these components and then aggregated for each land cover type. GLEAM uses the empirical energy-based Priesley–Taylor (PT) formula [11] to calculate the reference evaporation from the crop as a function of air temperature. The reference evaporation is then converted to transpiration (or soil evaporation) using the stress factor S. This is related to the microwave optical thickness of the vegetation and a precipitation-forced infiltration model. GLEAM also includes ice and snow sublimation. There are two official products of GLEAM version 3.3. The “va” product uses mainly reanalysis as input (especially for precipitation), while the “vb” product uses mainly satellite-based information to produce a daily estimate with a spatial resolution of 0.25 . In the following, the nomenclature “va” and “vb” is retained.
The Commonwealth Scientific and Industrial Research Organisation (CSIRO)’s global observational Penman–Monteith–Leuning (PML) evapotranspiration dataset [30] uses a parameterized version of the PM equations in which surface conductance is derived from the remotely sensed Leaf Area Index (LAI) [12]. In addition, the PML algorithm included evaporation from precipitation intercepted by vegetation to estimate the three components of E [30]. The PML reference evapotranspiration takes into account both surface energy and atmospheric drivers, and most of the input information comes from the MODIS (Moderate Resolution Imaging Spectroradiometer) Global Evapotranspiration Project [42]. PML is a global monthly dataset with a spatial resolution of 0.5 .
In addition to satellite-based E, climate reanalysis datasets are also a good source of information, as they can provide coherent estimates for all water components. The European Centre for Medium-Range Weather Forecasts (ECMWF) produces an extended global dataset for the land component of the fifth generation of European ReAnalysis (ERA5), hereafter referred to as ERA5-Land [40]. ERA5-Land is used as an alternative source for E. The inherent E product of ERA5-Land is not derived from the conventional satellite-based PM or PT approaches, but is modelled by a fully embedded E module in the global land surface model HTESSEL, which reflects interactions and feedbacks between physical, biological, and biogeochemical processes [43]. The model is forced by atmospheric analysis and short-range forecasts. A land data assimilation constrains the model fields, and soil moisture and soil temperature are corrected using air temperature and relative humidity observations. ERA5-Land E benefits from the introduction of the soil texture map [44] and an improved representation of bare soil evaporation using satellite-based soil moisture [45]. ERA5-Land proposed a global daily estimate of E at a spatial resolution of 0.25 .
A synthetic comparison of E datasets and retrieval algorithms has been made in the literature. Their global accuracy appears to be similar, but larger differences can be observed when focusing on a particular land cover type or climate zone. This is true even when using the same forcing [2]. When evaluated against eddy flux tower observations, no specific algorithm stands out in performance over all land cover types, but the GLEAM dataset tends to show reasonable agreement with ground-based measurements [46] and other independent datasets [47]. Over the well-monitored US domain, the E products successfully capture the overall seasonal cycle, but the quality of their accuracy can vary. ERA5, for example, has the highest uncertainty and tends to overestimate E in summer, while PML has greater discrepancies over certain land cover [48]. GLEAM performs well over forest and savannah, but is less reliable over arid and very wet regions [49]. PML E has been extensively evaluated for different vegetation types, regionally and globally; it has been shown to be less reliable over wet regions [50,51]. GLEAM has been used as an independent dataset to evaluate reanalysis E [40] or important meteorological drivers of turbulent fluxes [14]. Finally, all the datasets considered in this study have been considered as reference E datasets for global water-related studies [17,25,49].

2.2. Other Water Cycle Components

The datasets presented below are used to estimate the additional water components of the WB equation as they are required for the OI to derive catchment-level E corrections.
Precipitation, P: All of the Earth observations (EOs) of precipitation used in this study are multi-instrument and multi-satellite estimates: the Global Precipitation Climatology Project (GPCP) [52]; the Tropical Rainfall Measuring Mission Multi-satellite Precipitation Analysis (TMPA) [33]; and the Multi-Source Weighted-Ensemble Precipitation (MSWEP) [34]. GPCP and TMPA combine active and passive microwave (i.e., imager and radiometer) and infrared data from a geosynchronous satellite. These estimates incorporate rain gauge observations from the Global Precipitation Climatology Centre [53,54]. They differ in their retrieval algorithms, merging approaches, spatio-temporal coverage, and resolution. These datasets have already been used in the context of the water budget in [55], where additional information can be found. As for E, ERA-5 precipitation is used here as an additional source for P. MSWEP merges the highest-quality precipitation data sources available for each time point and location, using a combination of rain gauge measurements and several satellite products, including TMPA and GPCP and two reanalyses (ERA-Interim and JRA-55).
Total Water Storage Change, (TWSC), d S : The twin GRACE satellites provide a unique opportunity to monitor the water stored in the land [56]. d S estimates are based on GRACE and GRACE-Follow On satellites. d S includes surface water (wetlands, floodplains, lakes, rivers, and artificial reservoirs), soil moisture, snow cover, glaciers and groundwater. Three datasets are available: The Jet Propulsion Laboratory (JPL) product [35]; the Centre for Space Research (CSR) product [36]; and the German Research Centre for Geosciences (GFZ) product [37]. They are based on the classical spherical harmonic (SH) decomposition of GRACE measurements. SH solutions solve monthly gravity anomalies (i.e., inter-satellite range-rate measurements) as water mass variations using a truncated decomposition of the signal based on a spherical function.
River discharge, Q: Monthly streamflow data are obtained from the Global Stream-flow Indices and Metadata archive (GSIM) [39], a worldwide collection of metadata and indices derived from more than 35,000 daily streamflow time series. GSIM is a compilation of monthly streamflow time series based on twelve freely accessible streamflow databases (seven national databases and five international collections) [39]. This dataset is filtered in Section 3.1 to select measurements suitable for our study.

2.3. Environmental Indices (EIs)

The required E corrections to improve the original E estimates are related to the quality of the original E datasets. It is assumed here that their errors are related to some environmental conditions. Note that our model is not intended to estimate E, but rather E errors in the original E estimates. The aim is therefore to regress the E corrections from a set of environmental indices (EIs):
Surface temperature ( T S ) drives E as it constrains the available energy for the vaporization process over soil and leaf stomatal opening of trees for the transpiration process.
Soil Moisture ( S M ) constrains water availability at the surface and in the root zoom that can be evaporated or transpired. Over a water-limited region, when moisture is lacking, plants transpire less water.
Vegetation Indices can quantify certain characteristics of vegetation; the Normalized Difference Vegetative Index ( N D V I ) is an observation-based index of how lush the vegetation is in one area of the world compared to another. This drives both transpiration and interception processes. In addition to N D V I , the Leaf Area Index ( L A I ) is a model-based index that provides information on the canopy cover of vegetation. Different vegetation types (e.g., deciduous versus evergreen) show different relationships between N D V I and L A I as they modulate interception and transpiration processes.
Water Availability is computed as the precipitation minus evapotranspiration ( P E ). It is a climatic water balance index of atmospheric leaching. It is used as a water excess/deficit in the atmosphere. It is used to distinguish water- and energy-limited environments. It was shown to be an impacting factor on the budget residual [25].
The bottom part of Table 1 summarizes the environmental indices that have been considered in this study; S M , T s , L A I , and P E are provided by the ERA5-Land archive [31], while N D V I is provided by the MODIS dataset.

3. Obtaining E Correction at Catchment Scale

3.1. A Set of Basins around the World

Our approach relies on observed river discharge R to estimate WB imbalances. We are therefore limited by the availability and suitability of R measurements. We rely on the GSIM database [39] as a source of R measurements.
For each river discharge measurement, we use the MERIT [38] topography to obtain the associated contributing catchment, as the water budget closure performed at the catchment scale uses the quantities of Table 1 averaged over the basins.
The GSIM database [39] was screened based on two attributes: at least one year of data in the closure period (2002–2015) and a catchment area greater than 10,000 km 2 . To avoid over-representation of catchments with dense river discharge measurements, we further discarded pairs of catchments with more than 60% overlap in drainage area. After this filtering, the resulting dataset contains a total of 662 catchments.
We split this dataset catchment-wise into a set of 496 training catchments, used to optimize our ML model, and a set of 166 test catchments, used to evaluate the ability of the model to generalize to unseen E regimes. Due to the coarse resolution of the GRACE measurements, larger catchments have been shown to have reduced uncertainty in their d S component. We have therefore included the largest catchments, those with a drainage area greater than 10 6 km 2 , in the training set to ensure that the model is trained to regress E corrections with the least uncertainty. To rigorously control for model overfitting, we also ensure that the training and test sets do not contain overlapping catchments; when we randomly sample a catchment for training, we also include all its parent and child catchments in the same training set. Figure 2 shows the location and split of each catchment in the dataset (top) and the distribution of the aridity index (calculated as mean potential evaporation divided by mean precipitation), ranging from 0 (humid) to 1 (very dry), over the training and test splits (bottom).
Ideally, we would like to sample basins covering all possible environmental types, latitudes, sizes, or climatologies in order to optimize our correction model and learn from the full range of E regimes on a global scale. However, we are limited by the availability of river discharge measurements, and the assembled dataset presented in Figure 2 represents our best effort to collect a diverse dataset of basin measurements across the globe.

3.2. Non-Closure of the Water Budget

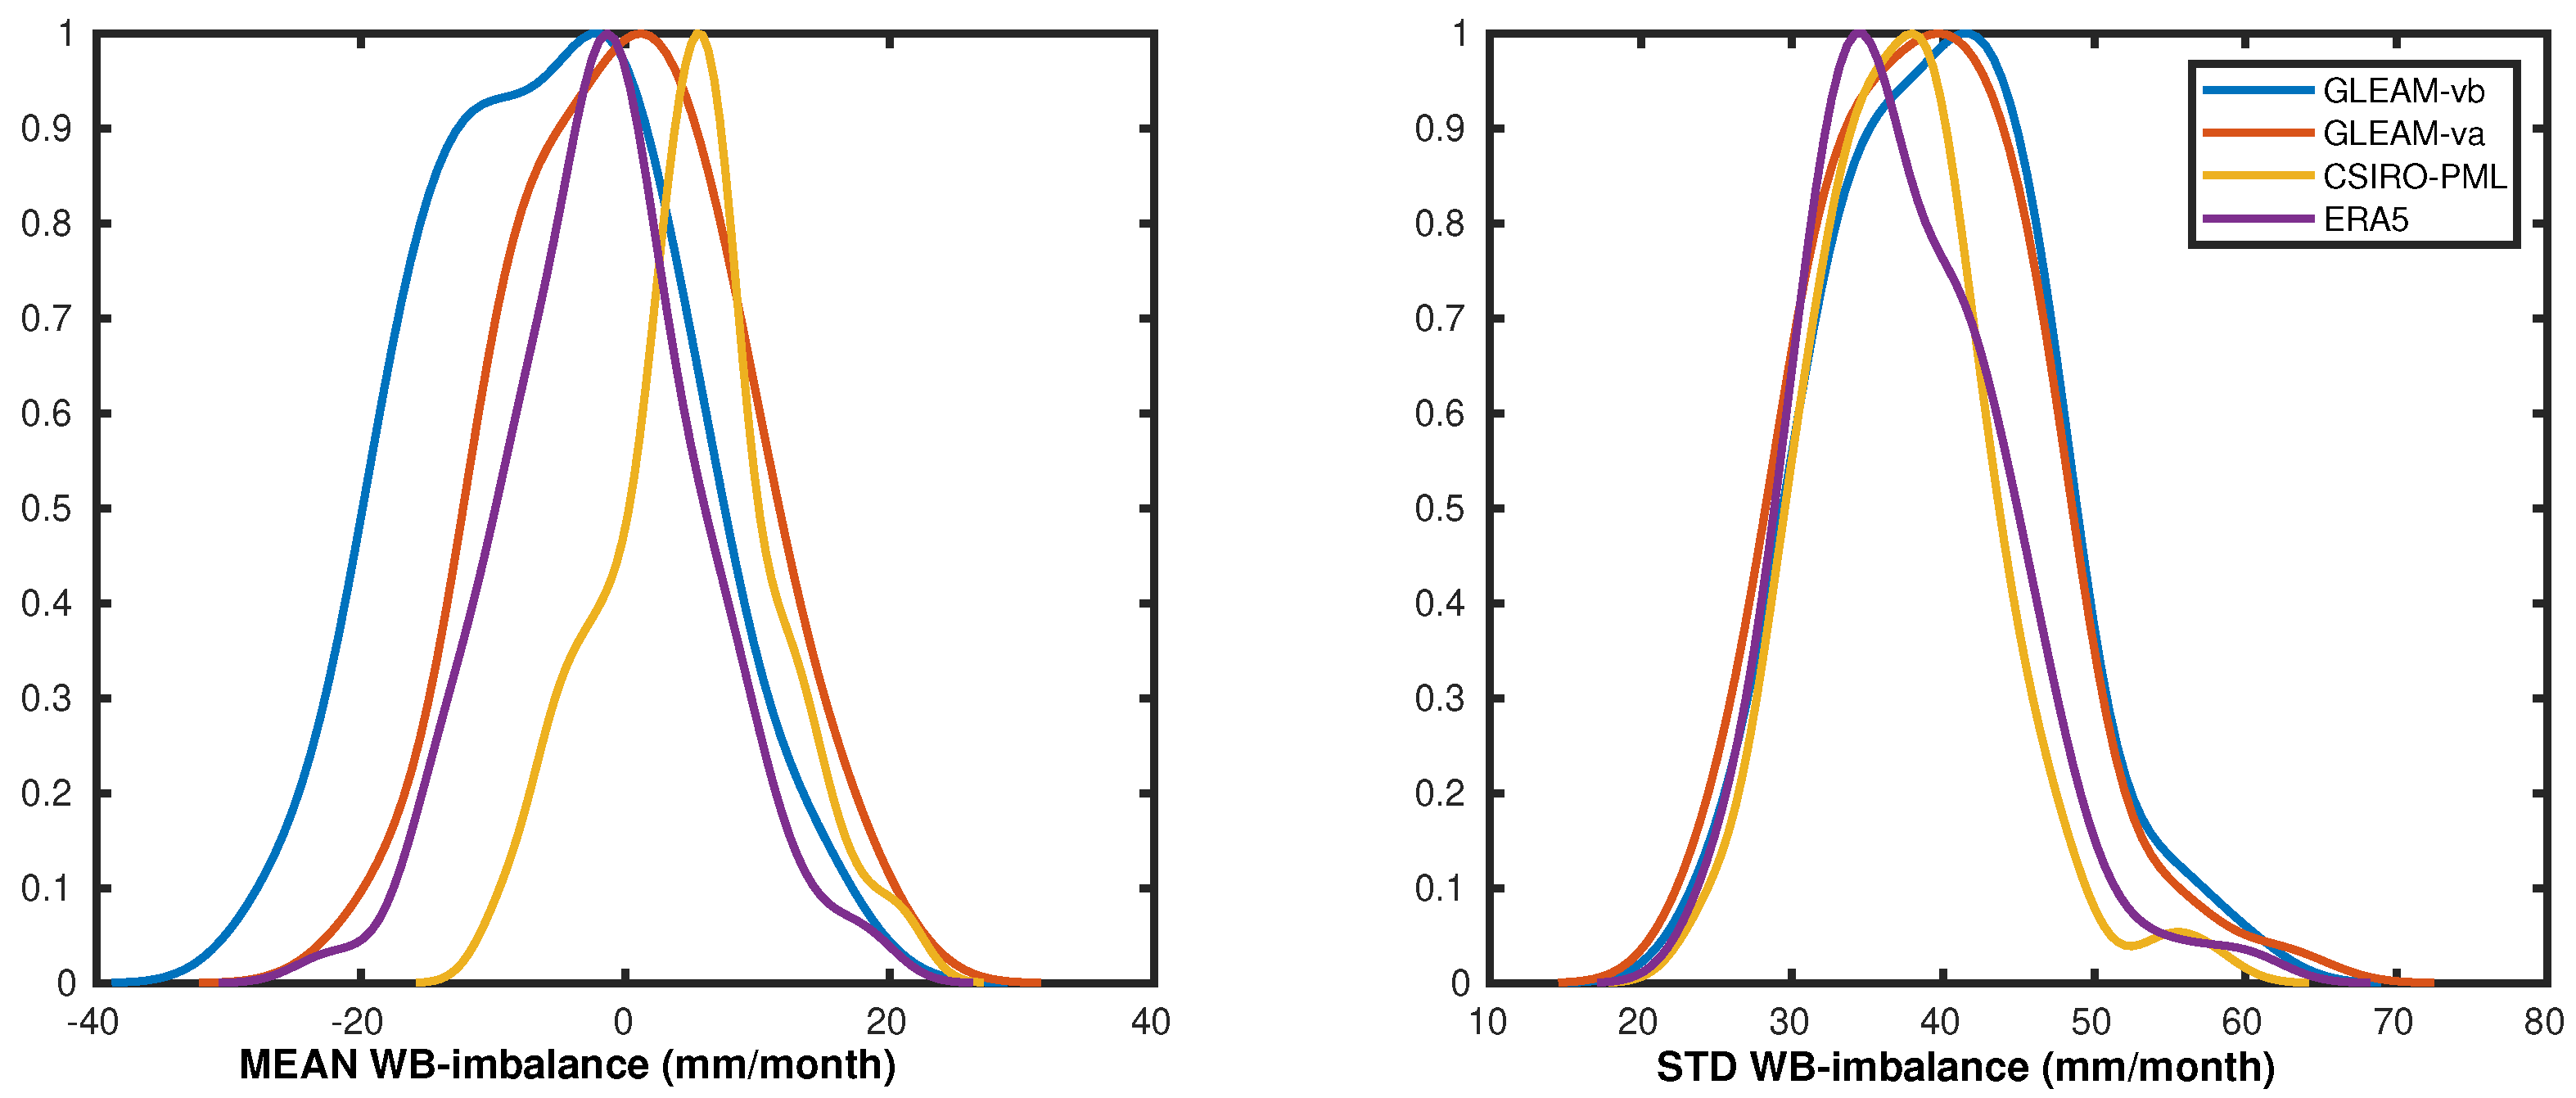
A first diagnostic to check the quality of the current evaporation datasets is to investigate how well the WB closes when we use the best available information for each water component. Figure 3 shows the Probability Density Function (PDF, obtained via the Kernel Density Function) of the mean (left) and the standard deviation (STD, right) of the WB imbalance at the catchment scale using the four selected E datasets. As the same source of information is used for P, d S , and R, the imbalances shown in Figure 3 are related to the inconsistencies between each E dataset and the other hydrological components. This figure decomposes the catchment imbalance in terms of mean (left) and STD (right) PDFs over the basins to better highlight systematic imbalances and imbalance fluctuations.
GLEAM-va and ERA5-Land E show a distribution of the catchment WB imbalance mean broadly centered on zero. ERA5-Land shows a narrower distribution and thus a better systematic consistency with other WC components. GLEAM-va shows a large negative bias in WB imbalance and thus a global systematic overestimation compared to what the other WB components tell us about the water budget. Finally, PML E shows a positive bias and thus an underestimation of E on a global scale. A mean imbalance PDF centered on zero means that, on average (over the basins), there is no systematic global bias, but this does not exclude a bias for individual basins (about half with a systematic positive bias and the other half with a negative bias). The goal of the correction model will be to reduce these systematic biases for each basin as much as possible. The PDFs of the STD show a common value of about 40 mm/month, with GLEAM-vb showing a slightly higher STD. This means that the temporal evolution of the imbalances (at the monthly scale) does not really vary from one E dataset to the next. It also shows that the monthly variations in the imbalances are significant compared to their mean value. The adjustment model should also try to reduce these variations, for example, by reducing the seasonality of the imbalances.

3.3. Optimal Interpolation (OI)

To optimize the water component estimates at the basin scale so that the WC is balanced, the OI technique allows us to merge and integrate in a coherent way the various datasets presented in Section 2.1 and Section 2.2 at the catchment scale. The OI approach is applied over all the basins of the database presented in Section 3.1. The notations are presented in this section but more methodological details can be found in [20]. The key concept of this approach is the use of the water budget equation as an extra source of information to be used along with the satellite estimate of the water component in order to find the best estimates that balance the water budget while being close to the satellite’s original description. If the state vector X = ( P , E , R , d S ) describes the water cycle at the catchment scale, then the WB written in Equation (1) can be rewritten equivalently as G · X = 0 , using the WB closure operator G = [ 1 1 1 1 ] .
The first step of the integration process consists in the “Simple Weighting” (SW) of all the available datasets for each water component [20]. All the datasets for a given component are first seasonally bias-corrected to the ensemble mean climatology and then averaged. Compared to the use of a single dataset per water component, using multiple datasets allow us to better characterize the water component in reducing random error and systematic bias [20].
We denote X S W = ( P S W , E S W , R S W , d S S W ) and B its prescribed error covariance matrix. The OI solution consists in a post-processing step to impose the closure constraint on the previously obtained solution X S W [20]:
X O I = K O I · X S W , K O I = ( I B · G t ( G · B · G t ) · G )
Here, B is diagonal (i.e., no covariance error between water components), where each error variance is a percentage of the mean value ( 5 P ¯ 100 , 7 E ¯ 100 , 10 d S ¯ 100 , 4 R ¯ 100 ) for all the water components, as derived in [18] based on a careful review of the literature on this topic.
The OI method allows obtaining an optimized representation of the WC at the basin scale through the updated state vector X O I = ( P O I , E O I , R O I , d S O I ) . The advantages of the OI solution are numerous. This methodology provides a solution that closes the WC budget at the catchment scale. It is a well-established approach with a clear mathematical background. The sources of uncertainty in the input information are controlled, they are exploited to obtain the optimal solution, and an a posteriori uncertainty assessment is also provided. Each assumption is clear, and other physical or statistical constraints could be introduced into this framework if available.
However, this method can only be used if the four water components (P, E, d S , and R) are available. This means that it can only be used for the basins presented in Section 3.1. An extrapolation strategy would be required to obtain results on a global scale. This has been attempted, for example, in [25], as mentioned in the Introduction section. Another inconvenience is that the integration is performed at the basin scale and we would like to obtain results at the original spatial resolution of the satellite datasets (i.e., pixel scale) instead.

4. Propagating E Corrections from Catchment to Pixel Scale

Our aim is to generalize the improvements in E estimation brought by the OI at the catchment scale to the pixel scale. The OI results are taken as a reference. It is then assumed that the E error estimates in the global datasets can be derived from a set of auxiliary environmental indices (EO) x characterizing the E error regime of each E dataset. It is proposed to regress the corrections of the OI from these auxiliary variables x. Our model is based on two main novel ideas:
First, we use a sum-aggregated formulation of the learning problem to generalize the catchment-scale corrections of the OI to pixel-wise E corrections. The model computes pixel-wise corrections from pixel-wise climate index variables. The model outputs are then spatially aggregated to estimate catchment-scale corrections. Regression is performed on the aggregated outputs and regressed on the OI corrections.
Second, we take a probabilistic view of the global E dataset estimates and their corrections:; we consider the E datasets as providing us with prior knowledge of the true pixel-scale E distribution, and formulate the regression of E corrections from auxiliary variables as a likelihood distribution. This allows us to use a principled Maximum A Posteriori (MAP) formulation of the problem to derive a compromise between the dataset-provided E values and the OI-derived E corrections.

4.1. Notations

Let c C t r denote the set of training catchments and c C t e the set of test catchments. Each catchment c is associated with a set of pixels p P c that are covered by the catchment drainage area. For each pixel p and month t, the dataset includes a set of D auxiliary variables, which we summarize in vector notation as x p , t R D . Using similar notation, we can write y p , t = E p , t O I E p , t to denote the pixel-wise corrections y p , t between the dataset E p , t and the corrected E ^ p , t . Note that we do not have knowledge of either y p , t nor E ^ p , t at the pixel scale; we instead have access to catchment-wise corrections (from the OI). For a given catchment c and month t, the catchment-wise corrections are defined as the sum of pixel-wise corrections over the basin:
Y c , t = E c , t O I E c , t = p P c y p , t
Finally, we denote by f θ ( x p , t ) our model that aims to regress y p , t from x p , t . In the following, we will omit the p , t subscript when needed to improve the readability.

4.2. A probabilistic Formulation

A probabilistic approach is used here on the dataset of E estimates and their corrections y. We consider each dataset to provide us with prior knowledge on the pixel-wise corrected values E ^ in the form of a Gaussian distribution centered on E: P ( E O I ) = N ( E | σ E ) . A recent review paper [18] has estimated the relative uncertainty of current global E datasets to be around 7%. Following their estimation, we thus parameterize the prior with σ E = 7 · E 100 . We can rewrite this prior distribution in terms of y as P ( y ) = N ( 0 | 7 · E 100 ) .
Similarly, we explicitly model uncertainty over y corrections regressed from x by defining a conditional distribution p ( y | x ) . Following the Bayesian terminology, we refer to this conditional distribution as the likelihood, and parameterize it as a Gaussian distribution p ( y | x ) = N ( h θ ( x ) | σ y ) . The function h θ ( x ) is introduced to parameterize the mean of the likelihood distribution. The parameters θ are estimated by fitting h θ ( x ) to the training data, as explained in the following subsection. σ y quantifies the uncertainty over the regressed corrections. A constant uncertainty estimate σ y is used over all spatio-temporal samples, whose value we calibrate on a held-out validation split.
Given the prior distribution P ( y ) provided by global E datasets and the likelihood p ( y | x ) derived from inputs x, we define the correction model f θ ( x ) as the Maximum A Posteriori (MAP) (i.e., the maximum over the posterior distribution):
f θ ( x ) = max y p ( y | x ) P ( y )
f θ ( x ) = max y N ( h θ ( x ) | σ y ) × N ( 0 | σ E )
As both distributions are considered Gaussian, we can derive a closed-form formulation for f θ ( x ) as:
f θ ( x ) = σ E 2 × h θ ( x ) + 0 × σ y 2 σ y 2 + σ E 2
f θ ( x ) = h θ ( x ) 1 + 100 × σ y 7 × E 2
The rationale behind this MAP formulation is to maximize the use of both the catchment-level correction information and the dataset estimates. Catchment-scale correction information and the estimates provided by the dataset are used (1) to find corrections that are close to those of the OI derived at the catchment scale, and (2) to reduce the corrections as much as possible so that the new E estimates are close to the original information, the existing dataset, which includes all the expertise on E retrieval.
The use of relative E uncertainty estimates σ E is advantageous because it allows corrections to be scaled with global E dataset estimates. Indeed, we expect E estimates to be less error-prone (in absolute values) in arid regimes (where E values are close to zero) than in humid regimes (where E estimates take on higher values). This assumption translates well into the proposed model, as it can be seen from Equation (8) that the correction converges to zero with E.

4.3. Catchment-Level Supervision

Ground-truth pixel-wise corrections y are not available to supervise the training of our pixel-wise regression model f θ ( x ) . Instead, the OI framework provides us with catchment-level corrections Y.
Several strategies can be considered for regressing pixel-level corrections from catchment-level ground truth. Perhaps the simplest approach would be to aggregate inputs x at the catchment level, train the model on catchment-level state–error associations, and apply the learned associations to pixel-level data. Unfortunately, we found that this approach resulted in suboptimal corrections. We conjecture that this is due to the fact that the pixel-level and catchment-level input feature distributions differ significantly due to the smoothing effect of aggregation over large catchments, often with high intra-catchment heterogeneity. This problem is known as “domain shift” (i.e., when the training, validation, and test data are drawn from a probability distribution that is different from the distribution of the data on which the predictive model is applied), which is a hot topic in ML in the geosciences [57].
We instead adopt another strategy, in which we first apply the model on each of the pixels of the catchment, yielding a set of pixel-wise corrections for the catchment. We then aggregate the model output by summation, and regress the aggregated sum of corrections to the catchment label Y. For a given catchment c and month t, the catchment-level correction F θ ( c , t ) computed by our model is thus:
F θ ( c , t ) = p P c , t f θ ( x p , t )
Using a Mean Squared Error (MSE) loss, the supervision signal L and optimization problem are defined as:
L ( θ ) = 1 T c C t r t T F θ ( c , t ) Y c , t 2
θ = min θ Θ L ( θ )

4.4. Experiment Details

Following standard ML methodology, the dataset is divided into a training and a validation set, on which we train and calibrate the model and evaluate the ability of the model to generalize its learned corrections to unseen data. The splits have been carefully defined so that any overlapping catchment pair belongs to the same split to avoid data leakage from the training to the test set, as detailed in Section 3.1 and illustrated in Figure 2.
The h θ function was parameterized as a Multi-Layer Perceptron (MLP) with four hidden layers. Each hidden layer consists of 512 neurons with Rectified Linear Unit (ReLU) activations. We apply a scaled hyperbolic tangent to the output of the model as a soft thresholding strategy to constrain the model output between two sigmas of the training split ground truth corrections. This strategy is used as a safeguard to prevent rare extremes in the input distribution from generating physically meaningless E correction outliers.
The model weights were initialized using the He initialization scheme [58], and the model was trained to minimize the loss function of Equation (9) using the Adam optimizer [59], with a learning rate of 0.001 and the default parameter β = ( 0.5 , 0.99 ) . For the memory constraint, we used a mini-batch sampling strategy in which each batch consists of 50 catchments randomly sampled from the dataset. For each selected catchment, every 192 months were included in the mini-batch. We trained the model over 40 iterations on the training dataset. Our implementation is based on the PyTorch framework [60] and run on an Nvidia RTX Titan GPU. Code for reproducing this work is available at the following URL: https://github.com/TristHas/etcorrections (last accessed on 29 December 2023).

5. E-Correction Modeling Results

The correction model aims to correct the E datasets towards the OI solution, but at a pixel resolution and without river discharge information. The bias and seasonal and monthly corrections of the model are examined below.

5.1. Spatial Analysis of the Bias Corrections

Bias for the E corrections at the pixel scale is shown for the four selected datasets in Figure 4 over the globe. The maps are computed as the mean monthly correction over the full considered period (2002–2015). All four corrections capture climatic spatial transitions well, but differ on the regional scale in terms of absolute mean correction values. The two GLEAM corrections share a spatial pattern with systematic low mean correction values in Europe and the Amazon. The fact that E estimates sharing the same underlying model assumptions (i.e., using the PT model) exhibit similar correction spatial patterns is a positive point because it shows that the E corrections have a model dependency. The GLEAM-vb version shows a stronger correction than GLEAM-va over tropical areas. Over these regions, the difference in terms of absolute mean value of the correction is then due to the difference in the input data sources on which the two GLEAM versions rely. GLEAM-va exhibits higher corrections than GLEAM-vb over the Intertropical Convergence Zone in Africa. Finally, the corrections strongly increase GLEAM E estimates over India, which cannot be related to climate, as it is very localized (this will be examined further in the following). While GLEAM-va and ERA5-Land E estimates share the same precipitation input (i.e., P from ERA5 reanalysis), ERA5-Land and GLEAM-va corrections differ at the global scale. This confirms that errors are more impacted by the model choice than by their input source. The correction reduces ERA5-Land E estimates over semi-arid regions (e.g., Central USA, South Africa, Australia, and South America), where precipitation is the key climatic factor controlling E. At the global scale, ERA5-Land correction shows a lower value in the range [−15, 15]. This is consistent with the findings of Figure 3 (left). CSIRO-PML has a global positive bias, which could be related to a global bias in its precipitation input, as it uses an older version of reanalysis (ERA-Interim).

5.2. Seasonal Analysis of the Corrections

A particularly interesting feature of the correction framework is the ability to exploit the seasonal bias correction. To analyze the seasonal correction for the different products, Figure 5 shows the seasonal cycle for the four E estimates before (dashed lines) and after (continuous line) adding the E correction. This is performed for eight major river basins in different climates on Earth: humid continental (Danube), humid subtropical (Mississippi, Yangtze), tropical (Congo, Amazon), arid/temperate (Murray), tropical/temperate (Ganges), and snow/cold (Ob).
Figure 5 first shows that the correction does not modify the original datasets too much at the basin scale, as the seasonal cycle of the corrected ET remains included in the spread of the original E, which describes all possible behavior of E (e.g., from different algorithms and inputs). This is reasonable, as the main information about E comes from the original datasets. However, the correction of a particular dataset can represent up to 15–20% of its original value, which is significant. It can be seen that after the correction, the dispersion of the datasets is largely reduced, with a convergence towards the OI solution (Section 3.3), as intended. Thanks to the correction, the new E estimates reach an OI consensus, not only on the original E datasets, but also with the other components. A particular E dataset may be quite far from the consensus, indicating a problem with that dataset over a particular basin: GLEAM-vb over the Danube, ERA5-Land over the Murray, or CSIRO-PML over the Ob.
It can also be seen in Figure 5 that the correction is state-dependent, with different corrections for basins or seasons. This can be seen, for example, in the decrease or increase in the seasonal mean E in spring and an increase in summer for the ERA5-Land and CSIRO-PML estimates over the Ganges.
The correction can also modify the peak of E, as can be seen over the Ob, where the peak shifts from June to July after the correction.
Over the Amazon, in addition to correcting the annual mean, the seasonal cycle correction also reduces the amplitude of the seasonal cycle. This is not the case for another tropical basin such as the Congo, suggesting that the need for the correction is not only climate regime-dependent and could be related to problems in the original estimates of E, in the parameterization of the reference evapotranspiration, or in the inputs used to estimate it.
Figure 6 depicts the ML-based corrections for GLEAM-vb, for winter (JFM), spring (AMJ), summer (JAS), and autumn (OND). The corrections are consistent with the time-mean corrections drawn in Figure 4 (left, top). However, the use of seasonal biases for GLEAM-vb adds dynamic information, and spatial gradient patterns are emphasized with the more complex correction model. Over high latitudes, the correction model implies a reduction mainly during the warm season (spring and summer) when E is high. These regions are energy-limited, i.e., water is available but the energy required to evaporate it is not. In water-limited areas, such as arid and semi-arid regions, the model estimates an increase in E during spring and summer (when the monsoon brings water). This may reflect an underestimation of water availability for this type of region in the GLEAM model. Over the equator, the corrections reduce E throughout the year, highlighting an overestimation of E for these areas. This ability to extract seasonal biases is critical to understanding the quality and shortcomings of E retrievals, and potentially reducing uncertainties in current datasets.

5.3. Water Cycle Closure Results

The aim of the correction model is to better close the water balance by extrapolating the OI results. It is therefore important to check whether this is achieved with the correction model. The reduction in the WB imbalance is only examined here for the catchments of the test split. As these catchments were not used to train the model, the observed improvements in their WB balance should reflect the ability of our model to generalize its WB closure ability globally.
The Root Mean Square (RMS) of the imbalance is examined in several configurations: (1) using the original E datasets (Org.); (2) using an average correction bias for each pixel (Org. + Bias); (3) using a seasonal correction (Org. + Season); or (4) the full correction model (Org. + Monthly). Configuration (2) means that the corrections are averaged over all time steps, and configuration (3) means that the corrections are averaged for each month of the year. Table 2 summarizes the effects of these corrections. Seasonal revisions refer to a monthly average revision.
The modelled corrections reduce the WB imbalance for the four original E datasets, but to different extents. Gleam-vb shows the largest improvements, with the imbalance reduced by up to 20% using the monthly correction. The seasonal bias term has a stronger effect than the static bias alone, consistent with the results in Figure 5, where the correction model is shown to have a strong seasonal signal. Using the correction at the monthly resolution improves the overall imbalance, meaning that some of the seasonal anomalies can be captured by the correction model.
The effect of catchment size on both the original E dataset errors (left) and the relative improvement brought by our corrections is examined in Figure 7. Smaller catchments show both higher original dataset closure errors (left) and smaller improvements after correction (right). This may be due to the coarse resolution of GRACE d S ; random errors arise from the aggregation of these coarse observations over smaller catchments, which accumulate into higher original average errors. The correction model does not aim to correct these errors, as they are not representative of any pixel-scale systemic phenomena that can be explained by the model input. This results in slightly lower correction capabilities for small catchments.
However, as expected, the correction model does not close the WB perfectly. Firstly, the objective of the correction model is to replicate the results of the OI and extend to unseen locations not used in the training database. However, the OI advantage is not perfect and is hand-tailored to each basin. OI has access to more information, in particular the river discharge R, which allows us to close the water budget. Furthermore, even in an ideal scenario where the ML model could perfectly match the training database, the model would not close the WB due to unavoidable errors assumed in other components. Finally, the ML correction model is asked to do more than the OI, in particular to extrapolate to any situation in the world, and this is something that is more ambitious than what the OI can do. Second, the ML model is not perfect for several reasons. The OI training database does not take into account all possible relationships between E errors and variables characterizing their regime. The samples are limited in space and time. Probably most importantly, the input variables used in this study are unlikely to be exhaustive in characterizing the regime causing the E errors.

5.4. Land Cover-Based Correction Analysis

As bias exhibits different spatial patterns, it is interesting to distinguish correction biases over various land cover types. Figure 8 depicts the PDF of the mean correction over different land cover classes: cropland rainfed, cropland irrigated, mosaic cropland, deciduous broadleaved tree, and tree broadleaved evergreen.
The PDFs show the distribution of average corrections (i.e., bias correction), over all the pixels from a given land class, over our catchment database. A negative value indicates a reduction in E and positive values represent an increase.
The GLEAM corrections (top row) show the most contrasting distributions, in particular positive corrections over irrigated cropland and negative corrections over deciduous evergreen areas. The latter is particularly prevalent over the Amazon region, where GLEAM corrections tend to be large negative values. The CSIRO-PML and ERA5-Land datasets show no particular bias for irrigated areas and a slightly positive bias for broadleaved evergreen areas.
Figure 9 provides additional insight into the relationship between E errors and corrections with land cover. To understand which land covers are most corrected by the correction model, Figure 9 (top) shows the land cover distribution of pixels with the top 90th percentile corrections. Broadleaved regions dominate the distribution. This is mainly due to high original E values resulting in high E corrections. For the GLEAM datasets, grassland, shrubland, and bare tree regions are also strongly represented. To understand which land cover is best corrected (bottom), catchments with the highest relative improvement are selected and the land cover distribution across these catchments is shown in Figure 9 (bottom). Although broadleaved regions were maximally corrected by our model, these large corrections do not translate into high relative improvements; these land cover classes are underrepresented in the best corrected regions compared to the global dataset region (in purple). In contrast, shrubland and grassland are relatively well-represented in these regions, suggesting a better ability of the model to correct E for these land cover classes.

5.5. Quality Assessment Index

The ML correction model aims to correct different E estimates so that they mimic the OI solution by better closing the WB at the catchment level. The reference E O I used to control the training of the model is therefore common to all E corrections, regardless of the original dataset. It was remarked in Section 5.3 that the dispersion of the corrected datasets was reduced compared to the dispersion of the original datasets.
In this context, a corrected dataset that is far from this consensus is a sign of a difficulty in that particular dataset, and consequently in the corrected dataset. Based on this idea, a quality flag is developed here. Bringing the E estimates closer together gives confidence in the validity of the corrections, while maintaining a large E spread indicates that the correction process has a problem. We therefore measure the pixel-wise variance V between the E datasets, before and after corrections, and report the ratio of the corrected E variance to the original variance: V c o r r V o r g in Figure 10. High values of this ratio indicate a lower confidence in the E corrections.
This map highlights two specific environments where the correction could be problematic: the river pixels of the Amazon mainstream and the snowy polar pixels of Greenland. Both have very specific E processes: open water evaporation over the Amazon and sublimation over high latitudes. The important point is that these two processes are not well-represented in the training database and therefore may not be well-represented by our E correction model.
However, this diagnosis is not perfect. Another potentially problematic region of this map could be arid areas where E estimates are very close to zero, with a very small variance V o r i g . The corrections applied to these areas are small in absolute terms (thanks to the MAP formulation), but result in a large relative increase in variance due to the small original variance V o r g associated with small E estimates. Therefore, such regions are not a concern for the E correction model.

6. Evaluation Using Auxiliary Observations

6.1. Validation Using Flux Tower Evaporation

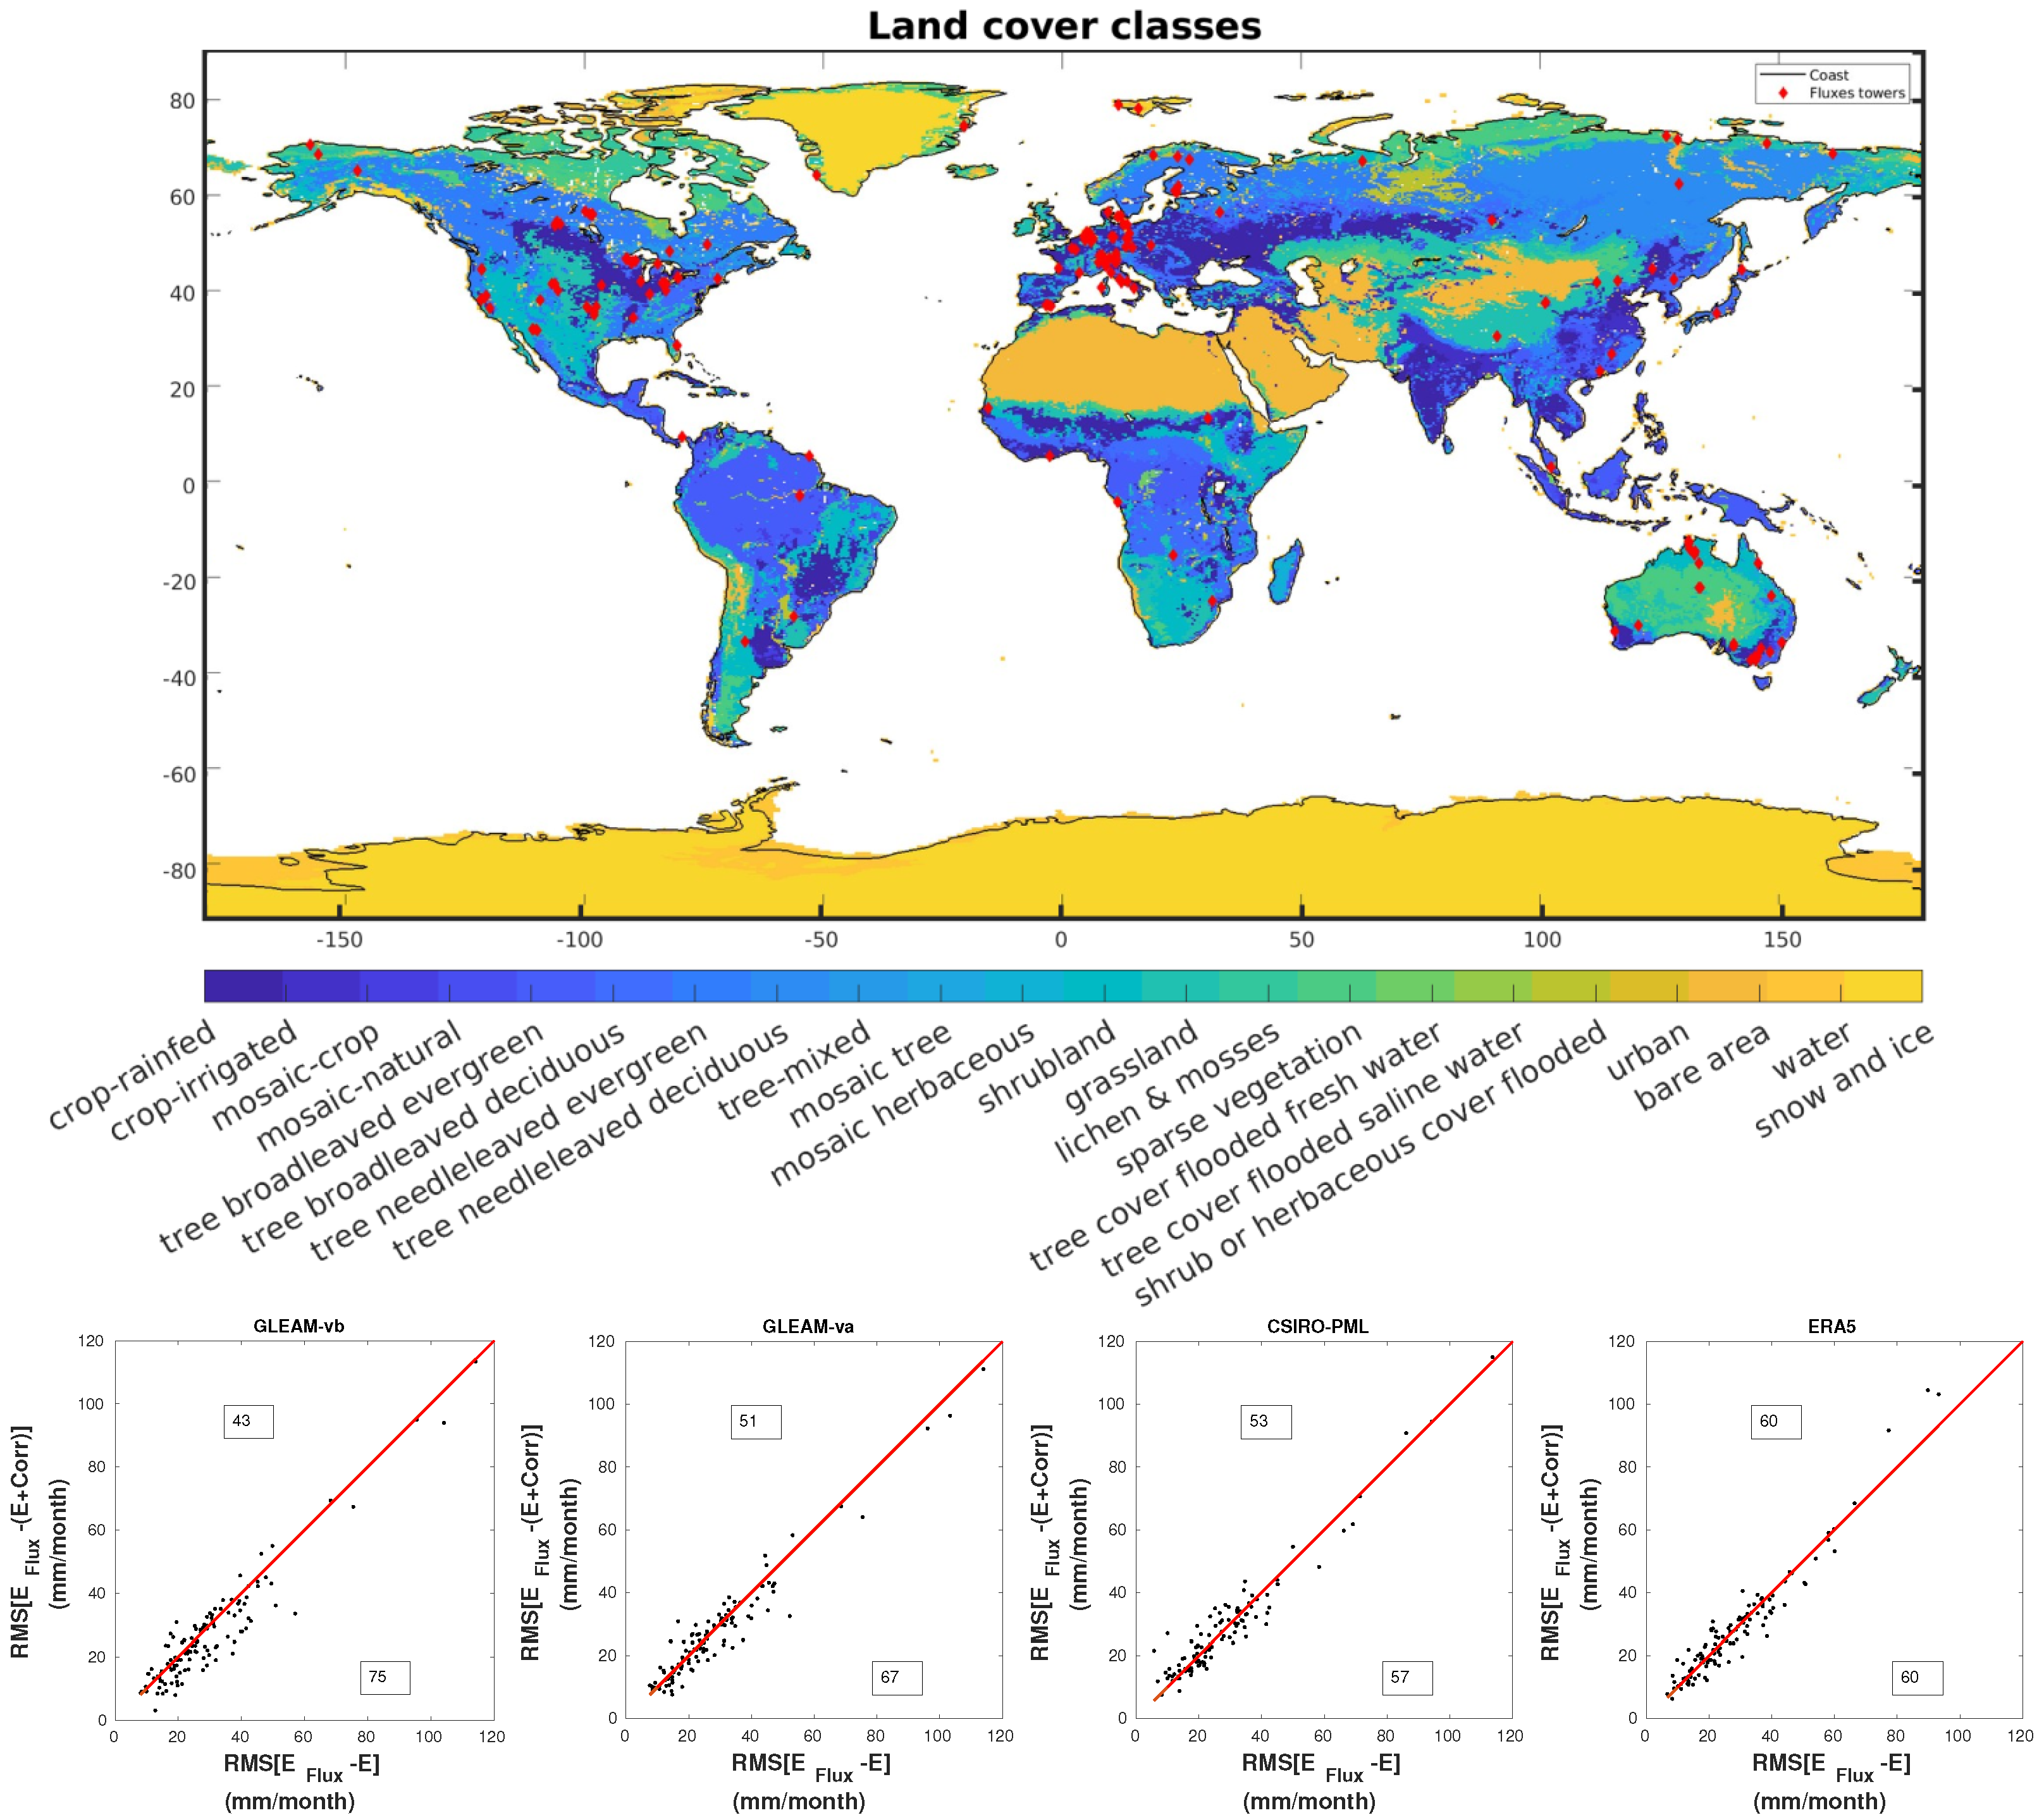
It is always challenging to validate gridded E estimates using in situ point measurements due to the difference in footprint from the field scale to the 0 . 25 grid resolution used here [2]. In this experiment, we use the global FLUXNET database [3] as a source of in situ E measurements. FLUXNET gathers hundreds of flux tower measurements, for various types of land cover. The location of the flux tower is shown in Figure 11 (top), overlaid on ESA CCI land cover.
The RMS of the difference between the in situ flux E and the four gridded datasets is computed, before and after correction. The evaluation is conducted over the 2002–2010 period but the temporal extent varies between tower measurements. The sparsity of the data and the lack of measurements in some regions are evident and show that FLUXNET is not representative enough of the E variability at the global scale. Figure 11 (bottom) shows the RMS scatterplot before (x-axis) and after (y-axis) the seasonal corrections. The 1:1 line is shown to highlight the improvement; each dot located under this line shows a reduction in the RMS with respect to the flux tower after correction. The number of dots above and below the 1:1 line is shown in boxes in the scatterplots. On average, the correction has a positive impact on the distance to the in situ measurements. The best improvement is obtained for GLEAM-vb dataset, for which the distance is reduced for more than 60% of the stations. Regarding the ERA5-Land dataset, the correction has no significant impact. The comparison with in situ measurements is always limited due to the representativeness of the local foot print compared to the spatial resolution of the satellite-based estimates. It is satisfactory that no degradation is found.
As a complement, Table 3 compares the impact of corrections with various temporal resolutions on the RMS with the in situ measurements. The seasonal correction improves most of the dataset except CSIRO-PML, but it can be seen that the monthly correction slightly degrades this RMS. This means that the pertinent E correction that can be obtained from the indirect measurements of the ML model is a seasonal correction. This finding was also found previously in the literature [61,62]. This seasonal correction is, however, very rich, as it is different for each pixel.
To confirm that the E correction is only relevant to seasonality at the pixel scale, a temporal correlation was also performed comparing the in situ and satellite E before and after the correction. These correlations do not change before and after the corrections, showing that the monthly information is conveyed by the original E datasets and not by their correction.

6.2. Indirect Evaluation Based on River Discharge Reconstruction over the Mississippi

This section aims at quantifying the improvement of spatial river discharge estimation (and thus closing the water budget) inferred by the correction of E. Pixel-wise river discharge R can be estimated as the residual term of Equation (1) from the other three WB components (P, E, and d S ) [63]. Such estimate includes all the error from P, E, and d S aggregated over space. Using our best estimates of P and d S , we can thus derive R estimates using both the original and the corrected E:
R o r g ^ = P S W d S S W E o r g ,
R c o r ^ = P S W d S S W E c o r
The change between R o r g ^ and R c o r ^ results only from the correction in considering the E dataset. It is then possible to evaluate indirectly the impact of the correction using the correlation between reference river discharge and R o r g ^ or R c o r ^ . The simulated R is based on the CaMa-Flood hydrological model [64] in its latest version [65]. The CaMa-Flood model was chosen here, as its flow direction is also used to reconstruct R based on the WB. Correlation is used here as a quality metric because the simulated R might include bias but a good performance in capturing temporal variations in the Mississippi streamflow.
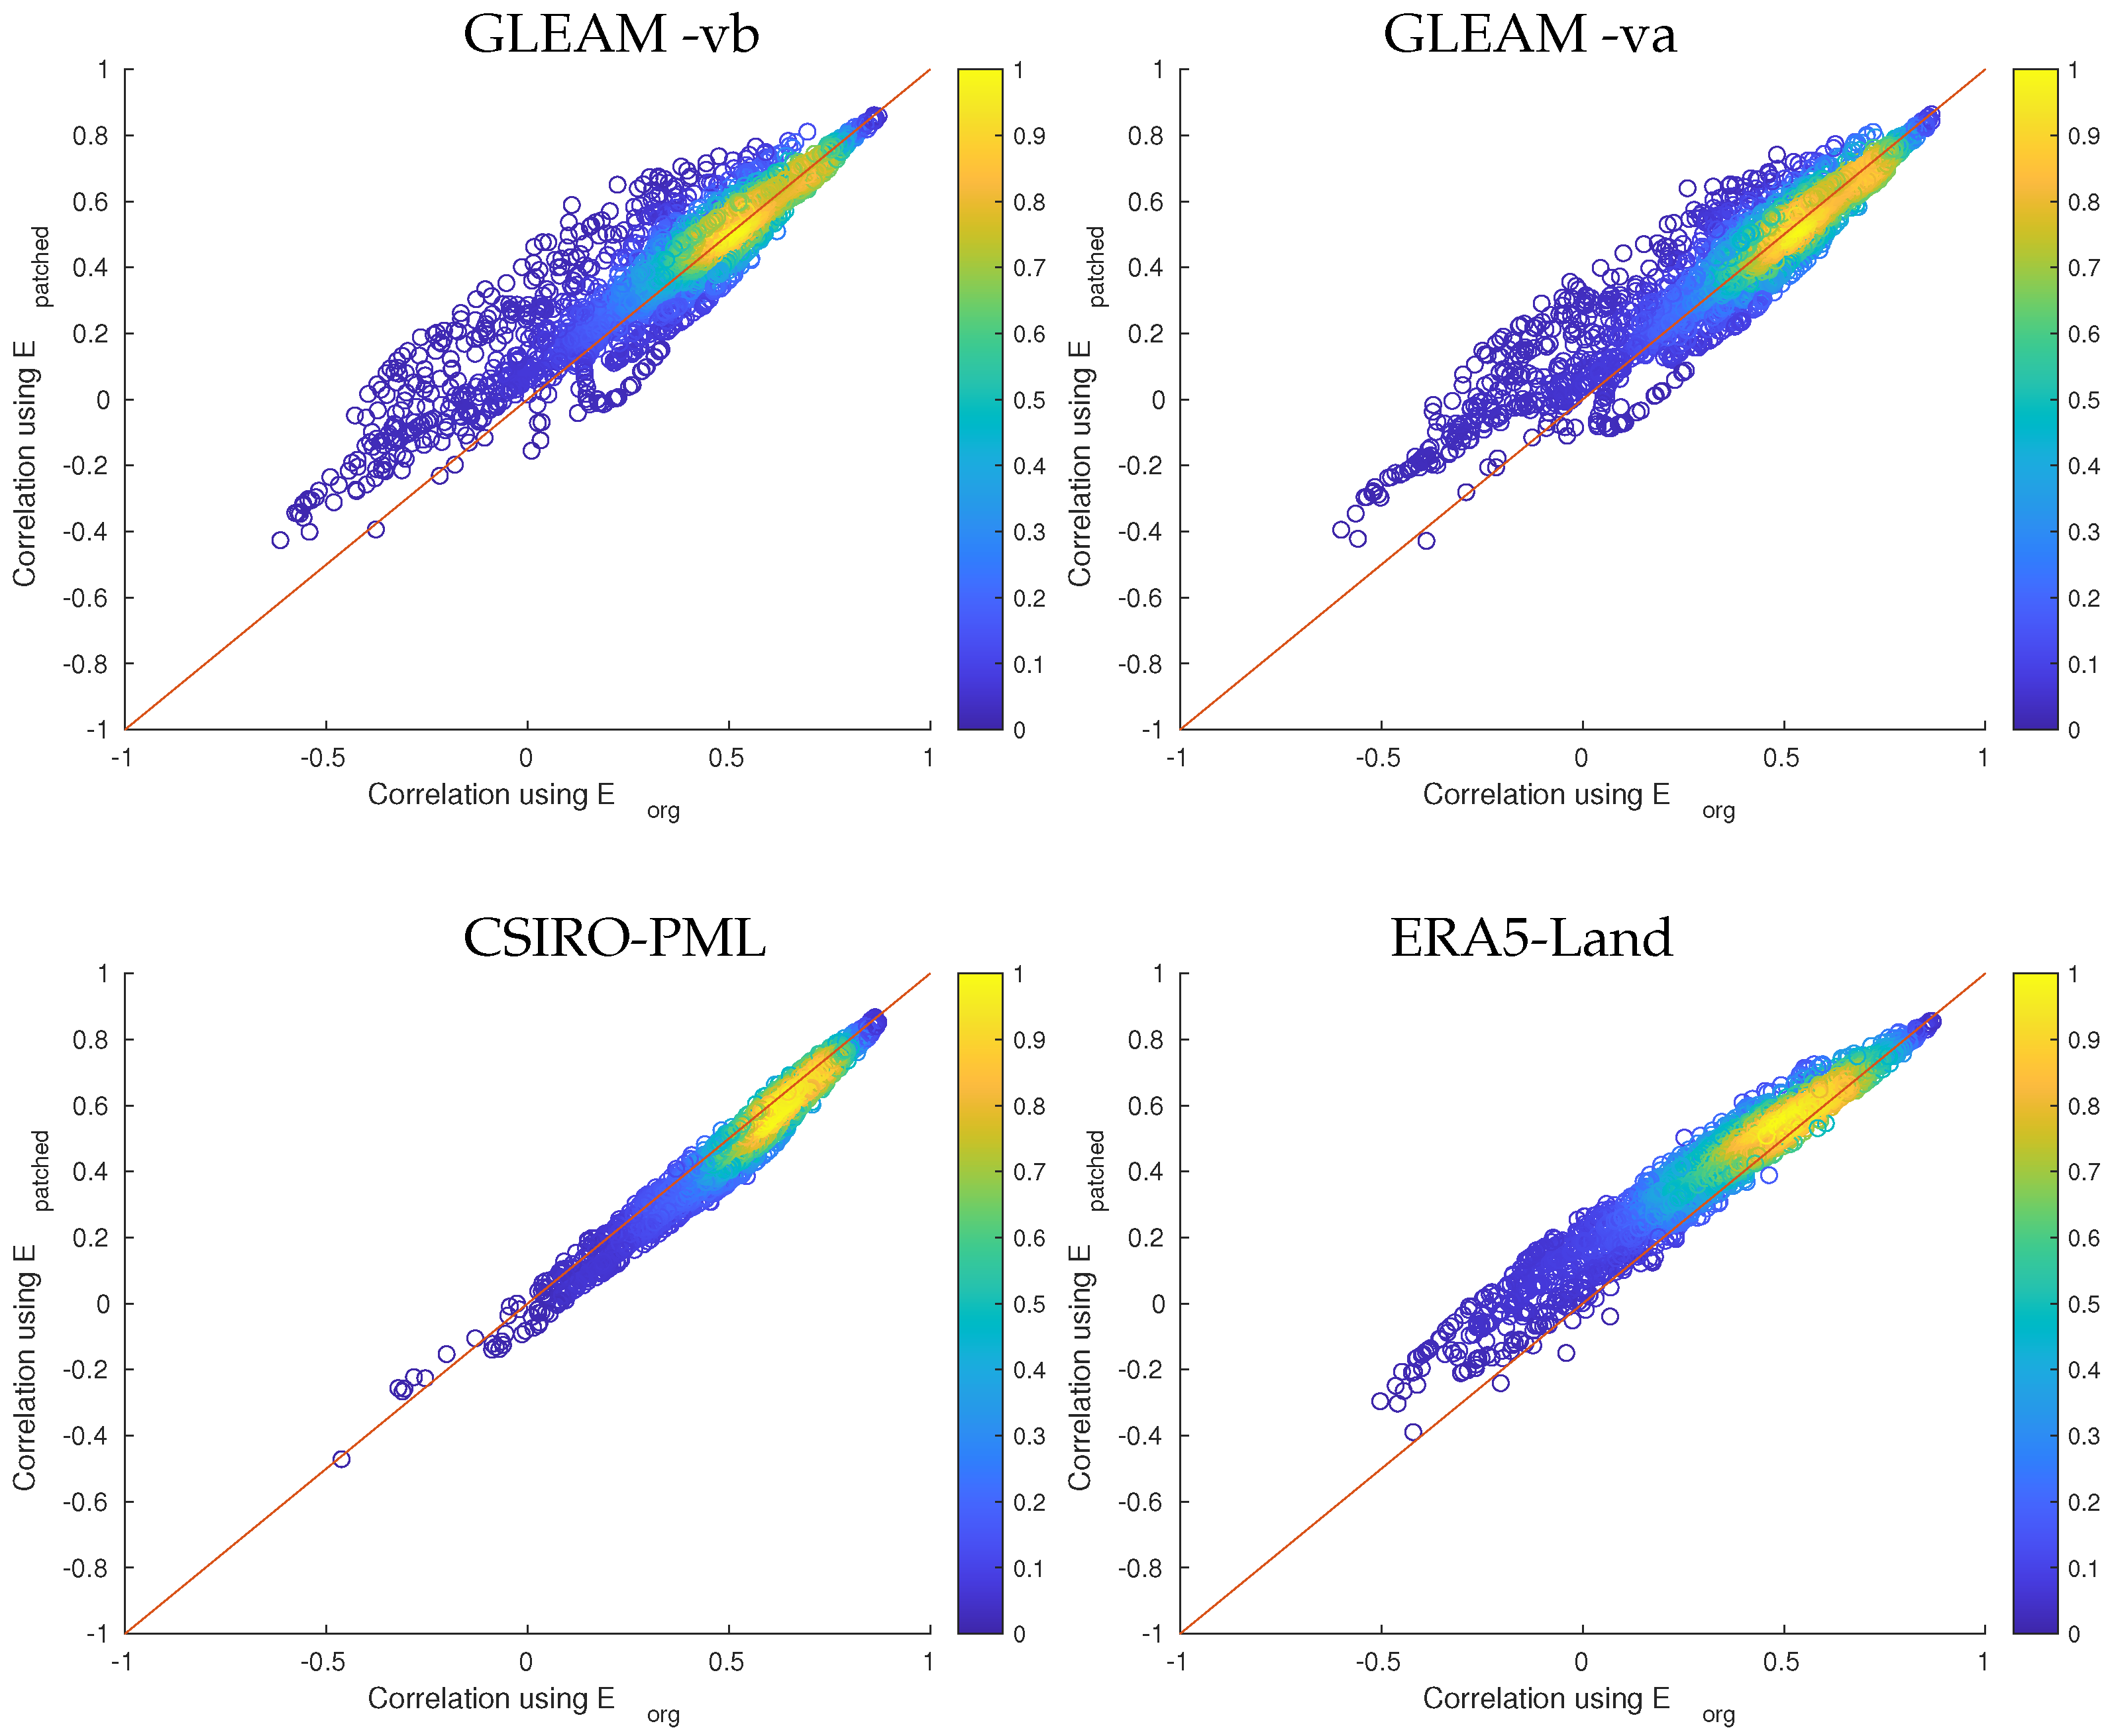
Figure 12 shows the correlations between CaMa-Flood R and R ^ using either the original (left) or corrected (right) E from ERA5-Land. The spatial pattern of the river can be clearly seen. The correction applied on E improves the statistic over the entire basin. The correlation is low over the main streamflow, which might be related to a systematic bias left in the other water components, in particular d S , which has big impact the routing delay from the upstream region to the river stream. The correction has a higher impact on the upstream area where the routing delay can be neglected and the monthly river discharge is related to P E .
Figure 13 shows the results for the four datasets in the form of scatterplots. Again, the correction improves the correlation with simulated R except for CSIRO-PML estimates, for which it has a limited impact. These results are not a direct evaluation of our correction, but the fact that coherency is improved using independent information from the model is a positive point for the evaluation of the correction.

7. Conclusions and Perspectives

Optimal interpolation (OI) is a very good framework for optimizing evaporation estimates. It uses observations of the other water components and the water budget closure to obtain an indirect constraint on evaporation. Each source of information is weighted by its uncertainty specification. OI has been shown to improve the estimates of the individual WB components while reducing the WB residuals. However, OI can only be used at the catchment level and for basins where streamflow measurements are available. A new machine learning model is proposed here to derive an evapotranspiration correction from the OI estimates for these basins, applicable at the pixel level and over the globe.
The proposed model relies on catchment-scale OI monitoring to correct E estimates at the pixel level, based on environmental variables (vegetation or water conditions). The correction model is state-dependent and has a spatial and seasonal pattern. The correction is linked to the land surface class, e.g., an increase in E in irrigated areas. The proposed E correction model reduces the WB imbalance at the catchment scale, while improving its accuracy compared to in situ E point measurements (using FLUXNET data). The reconstruction of river discharge using the corrected E is improved compared to using the original E for three of the four datasets. The mean correlation is improved by up to 15% for ERA, 6% for GLEAM-vb, and 3% for GLEAM-va. On the contrary, the correlation is degraded (6%) for CSIRO-PML.
The correction model seems to suggest two ways to correct a given E dataset: (1) a bias correction at the pixel level, with a strong surface-type pattern, and (2) a seasonal correction, also at the pixel level. A dedicated model is proposed for each E dataset. Data producers may be interested in optimizing their E estimates by increasing their coherence with the other water components. They could also use it as an analytical tool to investigate where their dataset might have some problems and what might be problematic in its seasonal behavior. However, the monthly E variations should be kept out of the original datasets, as such higher frequency changes need to be estimated based on a more direct E estimation technique, and an indirect budget closure estimation may not be reliable enough for these higher frequencies.
The method proposed here to optimize the E estimates relies on the use of indirect information and may be affected by sources of error in P, R, and d S , but will certainly be refined with the improvement of individual satellite estimates for each component. This method can be improved. The number of catchments in our database could be increased, technical developments could be added to the ML algorithm, and the OI solution used to obtain the target corrections is not perfect and could be further improved. However, the main bottleneck for this problem is the information content of the model inputs. It was mentioned that these inputs should be related to the errors in the original E dataset, namely environmental conditions that could explain why the E estimates are inaccurate. For example, the presence of irrigation could play a role, and these areas had a particular signature in our model, even though this information was not used in the model. Working closely with the E data producers could help to isolate the relevant information that could be added to the correction model. In addition to the E experiment presented in this article, the development of catchment-scale monitoring training to obtain a pixel-scale model is a general principle that should be very useful in future applications. The seasonal corrections proposed for a given E dataset should provide useful insights for E modellers.
Beyond the presented application on E, the proposed machine learning method allows us to train models based on learning databases with different spatial resolution. The aggregation principle in the neural network architecture could serve many purposes, such as correcting for water components other than E, or facilitating downscaling schemes.

Author Contributions

T.H. and V.P. have equally contributed to the design, implementation, and analysis of the results presented in this paper. F.A. has contributed the original idea for this study, has helped in the analysis and definition of the experiments, and has led the revision of the paper. T.T. has provide funding as well as deep reviewing of the draft and discussion. All authors have read and agreed to the published version of the manuscript.

Funding

Part of this research has been funded by the Japanese Society for the Promotion of Science’s Grant-in-Aid for Early-Career Scientists number 20K19823, and the European Space Agency through contract N°4000136793/21/I-DT-lr.

Data Availability Statement

All data used in input of this study are freely available, and their references are given in Section 2. The resulting global grid-scale E correction can be obtained upon request to the authors.

Acknowledgments

The authors would like to thank the European Space Agency, and in particular Espen Volden for partly supporting this study in the framework of the future EO science for society ESA program. We would also like to thank the Centre National d’Etudes Spatiales (CNES) for supporting the postdoc position of Victor Pellet.

Conflicts of Interest

The authors declare no conflicts of interest nor potential commercial interests.

References

  1. Fisher, J.B.; Melton, F.; Middleton, E.; Hain, C.; Anderson, M.; Allen, R.; McCabe, M.F.; Hook, S.; Baldocchi, D.; Townsend, P.A.; et al. The future of evapotranspiration: Global requirements for ecosystem functioning, carbon and climate feedbacks, agricultural management, and water resources. Water Resour. Res. 2017, 53, 2618–2626. [Google Scholar] [CrossRef]
  2. Miralles, D.G.; De Jeu, R.A.M.; Gash, J.H.; Holmes, T.R.H.; Dolman, A.J. Magnitude and variability of land evaporation and its components at the global scale. Hydrol. Earth Syst. Sci. 2011, 15, 967–981. [Google Scholar] [CrossRef]
  3. Falge, E.; Aubinett, M.; Bakwin, P.; Baldocchi, D.; Berbigier, P.; Hernhofer, C.; Black, T.; Ceulemans, R.; Davis, K.; Dolman, A.; et al. Fluxnet Research Network Site Characteristics, Investigators, and Bibliography, 2016; ORNL DAAC: Oak Ridge, TN, USA, 2017. [Google Scholar] [CrossRef]
  4. Bastiaanssen, W.G.M.; Menenti, M.; Feddes, R.A.; Holtslag, A.A.M. A remote sensing surface energy balance algorithm for land (SEBAL). 1. Formulation. J. Hydrol. 1998, 212–213, 198–212. [Google Scholar] [CrossRef]
  5. Penman, H.L. Natural evaporation from open water, bare soil and grass. In Proceedings of the Royal Society of London; Series A, Mathematical and Physical Sciences; The Royal Society: London, UK, 1948; Volume 193, pp. 120–145. [Google Scholar]
  6. Monteith, J. Evaporation and the Environment in the State and Movement of Water in Living Organisms. In Proceedings of the Society for Experimental Biology; Cambridge University Press: Cambridge, UK, 1965; pp. 205–234. [Google Scholar]
  7. Shuttleworth, W.J. Terrestrial Hydrometeorology, 1st ed.; John Wiley & Sons, Ltd.: Oxford, UK, 2012. [Google Scholar] [CrossRef]
  8. Thornthwaite, C.W. An Approach toward a Rational Classification of Climate. Geogr. Rev. 1948, 38, 55–94. [Google Scholar] [CrossRef]
  9. Tegos, A.; Malamos, N.; Koutsoyiannis, D. RASPOTION—A New Global PET Dataset by Means of Remote Monthly Temperature Data and Parametric Modelling. Hydrology 2022, 9, 32. [Google Scholar] [CrossRef]
  10. Jensen, M.; Haise, H. Estimating evapotranspiration from solar radiation. J. Irrig. Drain. Div. 1963, 89, 15–41. [Google Scholar] [CrossRef]
  11. Priestley, C.; Taylor, R. On the Assessment of Surface Heat Flux and Evaporation Using Large-Scale Parameters. Mon. Weather. Rev. 1972, 100, 81–92. [Google Scholar] [CrossRef]
  12. Leuning, R.; Kriedemann, P.E.; McMurtrie, R.E. Simulation of evapotranspiration by trees. Agric. Water Manag. 1991, 19, 205–221. [Google Scholar] [CrossRef]
  13. Fassoni-Andrade, A.C.; Fleischmann, A.S.; Papa, F.; de Paiva, R.C.D.; Wongchuig, S.; Melack, J.M.; Moreira, A.A.; Paris, A.; Ruhoff, A.; Barbosa, C.C.F.; et al. Amazon hydrology from space: Scientific advances and future challenges. Rev. Geophys. 2021, 59, e2020RG000728. [Google Scholar] [CrossRef]
  14. Martens, B.; Schumacher, J.; Wouters, H.; Muñoz-Sabater, J.; Verhoest, N.E.C.; Miralles, D.G. Evaluating the land-surface energy partitioning in ERA5. Geosci. Model Dev. 2020, 13, 4159–4181. [Google Scholar] [CrossRef]
  15. Yuan, W.; Liu, S.; Yu, G.; Bonnefond, J.-M.; Chen, J.; Davis, K.; Desai, A.R.; Goldstein, A.H.; Gianelle, D.; Rossi, F.; et al. Global estimates of evapotranspiration and gross primary production based on MODIS and global meteorology data. Remote Sens. Environ. 2010, 114, 1416–1431. [Google Scholar] [CrossRef]
  16. Tran, B.N.; van der Kwast, J.; Seyoum, S.; Uijlenhoet, R.; Jewitt, G.; Mul, M. Uncertainty Assessment of Satellite Remote Sensing-based Evapotranspiration Estimates: A Systematic Review of Methods and Gaps. EGUsphere 2023, 27, 4505–4528. [Google Scholar] [CrossRef]
  17. Zhang, Y.; Pan, M.; Sheffield, J.; Siemann, A.; Fisher, C.; Liang, M.; Beck, H.; Wanders, N.; MacCracken, R.; Houser, P.R.; et al. A Climate Data Record (CDR) for the global terrestrial water budget: 1984–2010. Hydrol. Earth Syst. Sci. Discuss. 2017, 22, 241–263. [Google Scholar] [CrossRef]
  18. Dorigo, W.; Dietrich, S.; Aires, F.; Brocca, L.; Carter, S.; Cretaux, J.-F.; Dunkerley, D.; Enomoto, H.; Forsberg, R.; üntner, A.G.; et al. Closing the water cycle from observations across scales: Where do we stand? Bull. Am. Meteorol. Soc. 2021, 102, 1–95. [Google Scholar] [CrossRef]
  19. Van Dijk, A.I.; Schellekens, J.; Yebra, M.; Beck, H.E.; Renzullo, L.J.; Weerts, A.; Donchyts, G. Global 5 km resolution estimates of secondary evaporation including irrigation through satellite data assimilation. Hydrol. Earth Syst. Sci. 2018, 22, 4959–4980. [Google Scholar] [CrossRef]
  20. Aires, F. Combining Datasets of Satellite-Retrieved Products. Part I: Methodology and Water Budget Closure. J. Hydrometeorol. 2014, 15, 1677–1691. [Google Scholar] [CrossRef]
  21. Pellet, V.; Aires, F.; Munier, S.; Fernández Prieto, D.; Jordá, G.; Arnoud Dorigo, W.; Polcher, J.; Brocca, L. Integrating multiple satellite observations into a coherent dataset to monitor the full water cycle - Application to the Mediterranean region. Hydrol. Earth Syst. Sci. 2019, 23, 465–491. [Google Scholar] [CrossRef]
  22. Rodell, M.; Beaudoing, H.; L’Ecuyer, T.; Olson, W.; Famiglietti, J.; Houser, P.; Adler, R.; Bosilovich, M.; Clayson, C.; Chambers, D.; et al. The Observed State of the Water Cycle in the Early 21st Century. J. Clim. 2015, 28, 8289–8318. [Google Scholar] [CrossRef]
  23. Sahoo, A.K.; Pan, M.; Troy, T.J.; Vinukollu, R.K.; Sheffield, J.; Wood, E.F. Reconciling the global terrestrial water budget using satellite remote sensing. Remote Sens. Environ. 2011, 115, 1850–1865. [Google Scholar] [CrossRef]
  24. Pan, M.; Sahoo, A.K.; Troy, T.J.; Vinukollu, R.K.; Sheffield, J.; Wood, E.F. Multisource estimation of long-term terrestrial water budget for major global river basins. J. Clim. 2012, 25, 3191–3206. [Google Scholar] [CrossRef]
  25. Munier, S.; Aires, F. A new global method of satellite dataset merging and quality characterization constrained by the terrestrial water cycle budget. Remote. Sens. Environ. 2017, 205, 119–203. [Google Scholar] [CrossRef]
  26. Kratzert, F.; Klotz, D.; Brenner, C.; Schulz, K.; Herrnegger, M. Rainfall-runoff modelling using Long Short-Term Memory (LSTM) networks. Hydrol. Earth Syst. Sci. 2018, 22, 6005–6022. [Google Scholar] [CrossRef]
  27. Beck, H.E.; Wood, E.F.; McVicar, T.R.; Zambrano-Bigiarini, M.; Alvarez-Garreton, C.; Baez-Villanueva, O.M.; Sheffield, J.; Karger, D.N. Bias Correction of Global High-Resolution Precipitation Climatologies Using Streamflow Observations from 9372 Catchments. J. Clim. 2020, 33, 1299–1315. [Google Scholar] [CrossRef]
  28. Koppa, A.; Rains, D.; Hulsman, P.; Poyatos, R.; Miralles, D.G. A deep learning-based hybrid model of global terrestrial evaporation. Nat. Commun. 2022, 13, 1–11. [Google Scholar] [CrossRef] [PubMed]
  29. Martens, B.; Miralles, D.G.; Lievens, H.; van der Schalie, R.; de Jeu, R.A.M.; érnandez-Prieto, D.F.; Beck, H.E.; Dorigo, W.A.; Verhoest, N.E.C. GLEAM v3: Satellite-based land evaporation and root-zone soil moisture. Geosci. Model Dev. Discuss. 2016, 10, 1903–1925. [Google Scholar] [CrossRef]
  30. Zhang, Y.; Pena Arancibia, J.; McVicar, T.; Chiew, F.; Vaze, J.; Zheng, H.; Wang, Y.P. Monthly global observation-driven Penman-Monteith-Leuning (PML) evapotranspiration and components. CSIRO Data Collect. 2016. [Google Scholar] [CrossRef]
  31. Hersbach, H.; Bell, B.; Berrisford, P.; Hirahara, S.; Horányi, A.; Muñoz-Sabater, J.; Nicolas, J.; Peubey, C.; Radu, R.; Schepers, D.; et al. The ERA5 global reanalysis. Q. J. R. Meteorol. Soc. 2020, 146, 1999–2049. [Google Scholar] [CrossRef]
  32. Huffman, G.J.; Adler, R.F.; Morrissey, M.M.; Bolvin, D.T.; Curtis, S.; Joyce, R.; McGavock, B.; Susskind, J.; Huffman, G.J.; Adler, R.F.; et al. Global Precipitation at One-Degree Daily Resolution from Multisatellite Observations. J. Hydrometeorol. 2001, 2, 36–50. [Google Scholar] [CrossRef]
  33. Huffman, G.J.; Bolvin, D.T.; Nelkin, E.J.; Wolff, D.B.; Adler, R.F.; Gu, G.; Hong, Y.; Bowman, K.P.; Stocker, E.F. The TRMM Multisatellite Precipitation Analysis (TMPA): Quasi-Global, Multiyear, Combined-Sensor Precipitation Estimates at Fine Scales. J. Hydrometeorol. 2007, 8, 38–55. [Google Scholar] [CrossRef]
  34. Beck, H.E.; van Dijk, A.I.J.M.; Levizzani, V.; Schellekens, J.; Miralles, D.G.; Martens, B.; de Roo, A. MSWEP: 3-hourly 0.25deg; global gridded precipitation by merging gauge, satellite, and reanalysis data. Hydrol. Earth Syst. Sci. 2017, 21, 589–615. [Google Scholar] [CrossRef]
  35. Watkins, M.M.; Yuan, D.-N. GRACE Gravity Recovery and Climate Experiment JPL Level-2 Processing Standards Document For Level-2 Product Release 05.1; Jet Propulsion Laboratory, California Institute of Technology: Pasadena, CA, USA, 2014. [Google Scholar]
  36. Bettadpur, S. GRACE 327-742 (CSR-GR-12-xx) GRAVITY RECOVERY AND CLIMATE EXPERIMENT UTCSR Level-2 Processing Standards Document) (For Level-2 Product Release 0005), GRACE 327–742, Center for Space Research Publ. GR-12-xx, Rev. 4.0, University of Texas at Austin, 16 pp. 2012. Available online: http://icgem.gfz-potsdam.de/L2-CSR0005_ProcStd_v4.0.pdf (accessed on 29 October 2023).
  37. Dahle, C.; Flechtner, F.; Gruber, C.; König, D.; König, R.; Michalak, G.; Neumayer, K.-H. GFZ GRACE Level-2 Processing Standards Document for Level-2 Product Release 0005. 2013. Available online: http://icgem.gfz-potsdam.de/L2-GFZ_ProcStds_0005_v1.1-1.pdf (accessed on 29 October 2023).
  38. Yamazaki, D.; Ikeshima, D.; Sosa, J.; Bates, P.D.; Allen, G.H.; Pavelsky, T.M. MERIT Hydro: A High-Resolution Global Hydrography Map Based on Latest Topography Dataset. Water Resour. Res. 2019, 55, 5053–5073. [Google Scholar] [CrossRef]
  39. Do, H.X.; Gudmundsson, L.; Leonard, M.; Westra, S. The Global Streamflow Indices and Metadata Archive (GSIM)-Part 1: The production of a daily streamflow archive and metadata. Earth Syst. Sci. Data 2018, 10, 765–785. [Google Scholar] [CrossRef]
  40. Muñoz-Sabater, J.; Dutra, E.; Agustí-Panareda, A.; Albergel, C.; Arduini, G.; Balsamo, G.; Boussetta, S.; Choulga, M.; Harrigan, S.; Hersbach, H.; et al. ERA5-Land: A state-of-the-art global reanalysis dataset for land applications. Earth Syst. Sci. Data 2021, 13, 4349–4383. [Google Scholar] [CrossRef]
  41. Didan, K. MOD13C2 MODIS/Terra Vegetation Indices Monthly L3 Global 0.05Deg CMG V006 [Data Set]. 2015. Distributed by NASA EOSDIS Land Processes Distributed Active Archive Center. Available online: https://lpdaac.usgs.gov/products/mod13c2v006/ (accessed on 29 October 2023).
  42. Mu, Q.; Zhao, M.; Running, S.W. Improvements to a MODIS global terrestrial evapotranspiration algorithm. Remote Sens. Environ. 2011, 115, 1781–1800. [Google Scholar] [CrossRef]
  43. Balsamo, G.; Albergel, C.; Beljaars, A.; Boussetta, S.; Brun, E.; Cloke, H.; Dee, D.; Dutra, E.; Munøz-Sabater, J.; Pappenberger, F.; et al. ERA-Interim/Land: A global land surface reanalysis data set. Hydrol. Earth Syst. Sci. 2015, 19, 389–407. [Google Scholar] [CrossRef]
  44. Balsamo, G.; Beljaars, A.; Scipal, K.; Viterbo, P.; van den Hurk, B.; Hirschi, M.; Betts, A.K. A Revised Hydrology for the ECMWF Model: Verification from Field Site to Terrestrial Water Storage and Impact in the Integrated Forecast System. J. Hydrometeorol. 2009, 10, 623–643. [Google Scholar] [CrossRef]
  45. Albergel, C.; Balsamo, G.; De Rosnay, P.; Muñoz-Sabater, J.; Boussetta, S. A bare ground evaporation revision in the ECMWF land-surface scheme: Evaluation of its impact using ground soil moisture and satellite microwave data. Hydrol. Earth Syst. Sci. 2012, 16, 3607–3620. [Google Scholar] [CrossRef]
  46. Michel, D.; Jiménez, C.; Miralles, D.G.; Jung, M.; Hirschi, M.; Ershadi, A.; Martens, B.; Mccabe, M.F.; Fisher, J.B.; Mu, Q.; et al. The WACMOS-ET project—Part 1: Tower-scale evaluation of four remote-sensing-based evapotranspiration algorithms. Hydrol. Earth Syst. Sci. 2016, 20, 803–822. [Google Scholar] [CrossRef]
  47. Miralles, D.G.; Jiménez, C.; Jung, M.; Michel, D.; Ershadi, A.; Mccabe, M.F.; Hirschi, M.; Martens, B.; Dolman, A.J.; Fisher, J.B.; et al. The WACMOS-ET project - Part 2: Evaluation of global terrestrial evaporation data sets. Hydrol. Earth Syst. Sci. 2016, 20, 823–842. [Google Scholar] [CrossRef]
  48. Yu, X.; Quian, L.; Wang, W.; Hu, X.; Dong, J.; Pi, Y.; Fan, K. Comprehensive evaluation of terrestrial evapotranspiration from different models under extreme condition over conterminous United States. Agric. Water Manag. 2023, 289, 108555. [Google Scholar] [CrossRef]
  49. Lu, J.; Wang, G.; Chen, T.; Li, S.; Hagan, D.F.T.; Kattel, G.; Peng, J.; Jiang, T.; Su, B.; Jung, M. A harmonized global land evaporation dataset from model-based products covering 1980–2017. Earth Syst. Sci. Data 2021, 13, 5879–5898. [Google Scholar] [CrossRef]
  50. Zhang, Y.Q.; Leuning, R.; Chiew, F.H.S.; Wang, E.L.; Zhang, L.; Liu, C.M.; Sun, F.B.; Peel, L.M.C.; She, Y.J.; Jung, M. Decadal Trends in Evaporation from Global Energy and Water Balances. J. Hydrometeor. 2012, 13, 379–391. [Google Scholar] [CrossRef]
  51. Zhang, Y.Q.; Kong, D.; Gan, F.; Chiew, F.H.S.; McVicar, T.R.; Zhang, Q.; Yang, Y. Coupled estimation of 500m and 8-day resolution global evapotranspiration and gross primary production in 2002–2017. Remote Sens. Environ. 2019, 222, 3165–3182. [Google Scholar] [CrossRef]
  52. Adler, R.F.; Huffman, G.J.; Chang, A.; Ferraro, R.; Xie, P.-P.; Janowiak, J.; Rudolf, B.; Schneider, U.; Curtis, S.; Bolvin, D.; et al. The Version-2 Global Precipitation Climatology Project (GPCP) Monthly Precipitation Analysis (1979–Present). J. Hydrometeorol. 2003, 4, 1147–1167. [Google Scholar] [CrossRef]
  53. Schneider, U.; Rudolf, B.; Becker, A.; Ziese, M.; Finger, P.; Meyer-Christoffer, A.; Schneider, U. GPCC’s new land surface precipitation climatology based on quality-controlled in situ data and its role in quantifying the global water cycle. Theor. Appl. Climatol. 2011, 115, 15–40. [Google Scholar] [CrossRef]
  54. Schneider, U.; Becker, A.; Ziese, M.; Rudolf, B. Global Precipitation Analysis Products of the GPCC. Internet Publ. 2014, 1–13. [Google Scholar]
  55. Pellet, V.; Aires, F.; Yamazaki, D.; Papa, F. Satellite monitoring of the water cycle over the Amazon using upstream/downstream dependency. Part 1: Methodology and initial evaluation. Water Resour. Res. 2021, 2020, 1–26. [Google Scholar]
  56. Tapley, B.D.; Bettadpur, S.; Watkins, M.; Reigber, C. The gravity recovery and climate experiment: Mission overview and early results. Geophys. Res. Lett. 2004, 31, 9. [Google Scholar] [CrossRef]
  57. Rodriguez-Vazquez, J.; Fernandez-Cortizas, J.M.; Perez-Saura, D.; Molina, M.; Campoy, P. Overcoming Domain Shift in Neural Networks for Accurate Plant Counting in Aerial Images. Remote Sens. 2023, 15, 1700. [Google Scholar] [CrossRef]
  58. He, K.; Zhang, X.; Ren, S.; Sun, J. Delving deep into rectifiers: Surpassing human-level performance on imagenet classification. In Proceedings of the IEEE International Conference on Computer Vision, Santiago, Chile, 7–13 December 2015; pp. 1026–1034. [Google Scholar]
  59. Kingma, D.P.; Ba, J. Adam: A method for stochastic optimization. arXiv 2014, arXiv:1412.6980. [Google Scholar]
  60. Paszke, A.; Gross, S.; Chintala, S.; Chanan, G.; Yang, E.; DeVito, Z.; Lin, Z.; Desmaison, A.; Antiga, L.; Lerer, A. Automatic Differentiation in Pytorch. 2017. Available online: https://note.wcoder.com/files/ml/automatic_differentiation_in_pytorch.pdf (accessed on 29 October 2023).
  61. Rodell, M.; Houser, P.; Jambor, U.; Gottschalck, J.; Mitchell, K.; Meng, C.-j.; Arsenault, K.; Cosgrove, B.; Radakovich, J.; Bosilovich, M.; et al. The global land data assimilation system. Bull. Am. Meteor. Soc. 2004, 85, 381–394. [Google Scholar] [CrossRef]
  62. Rodell, M.; Mcwilliam, E.B.S.; Famiglietti, J.S.; Beaudoing, H.K.; Nigro, J. Estimating evapotranspiration using an observation based terrestrial water budget. Hydrol. Process. 2011, 25, 4082–4092. [Google Scholar] [CrossRef]
  63. Pellet, V.; Aires, F.; Yamazaki, D.; Zhou, X.; Paris, A. A first continuous and distributed satellite-based mapping of river discharge over the Amazon. J. Hydrol. 2022, 614, 128481. [Google Scholar] [CrossRef]
  64. Yamazaki, D.; Kanae, S.; Kim, H.; Oki, T. A physically based description of floodplain inundation dynamics in a global river routing model. Water Resour. Res. 2011, 47, 4. [Google Scholar] [CrossRef]
  65. Zhou, X.; Ma, W.; Echizenya, W.; Yamazaki, D. The uncertainty of flood frequency analyses in hydrodynamic model simulations. Nat. Hazards Earth Syst. Sci. 2021, 21, 1071–1085. [Google Scholar] [CrossRef]
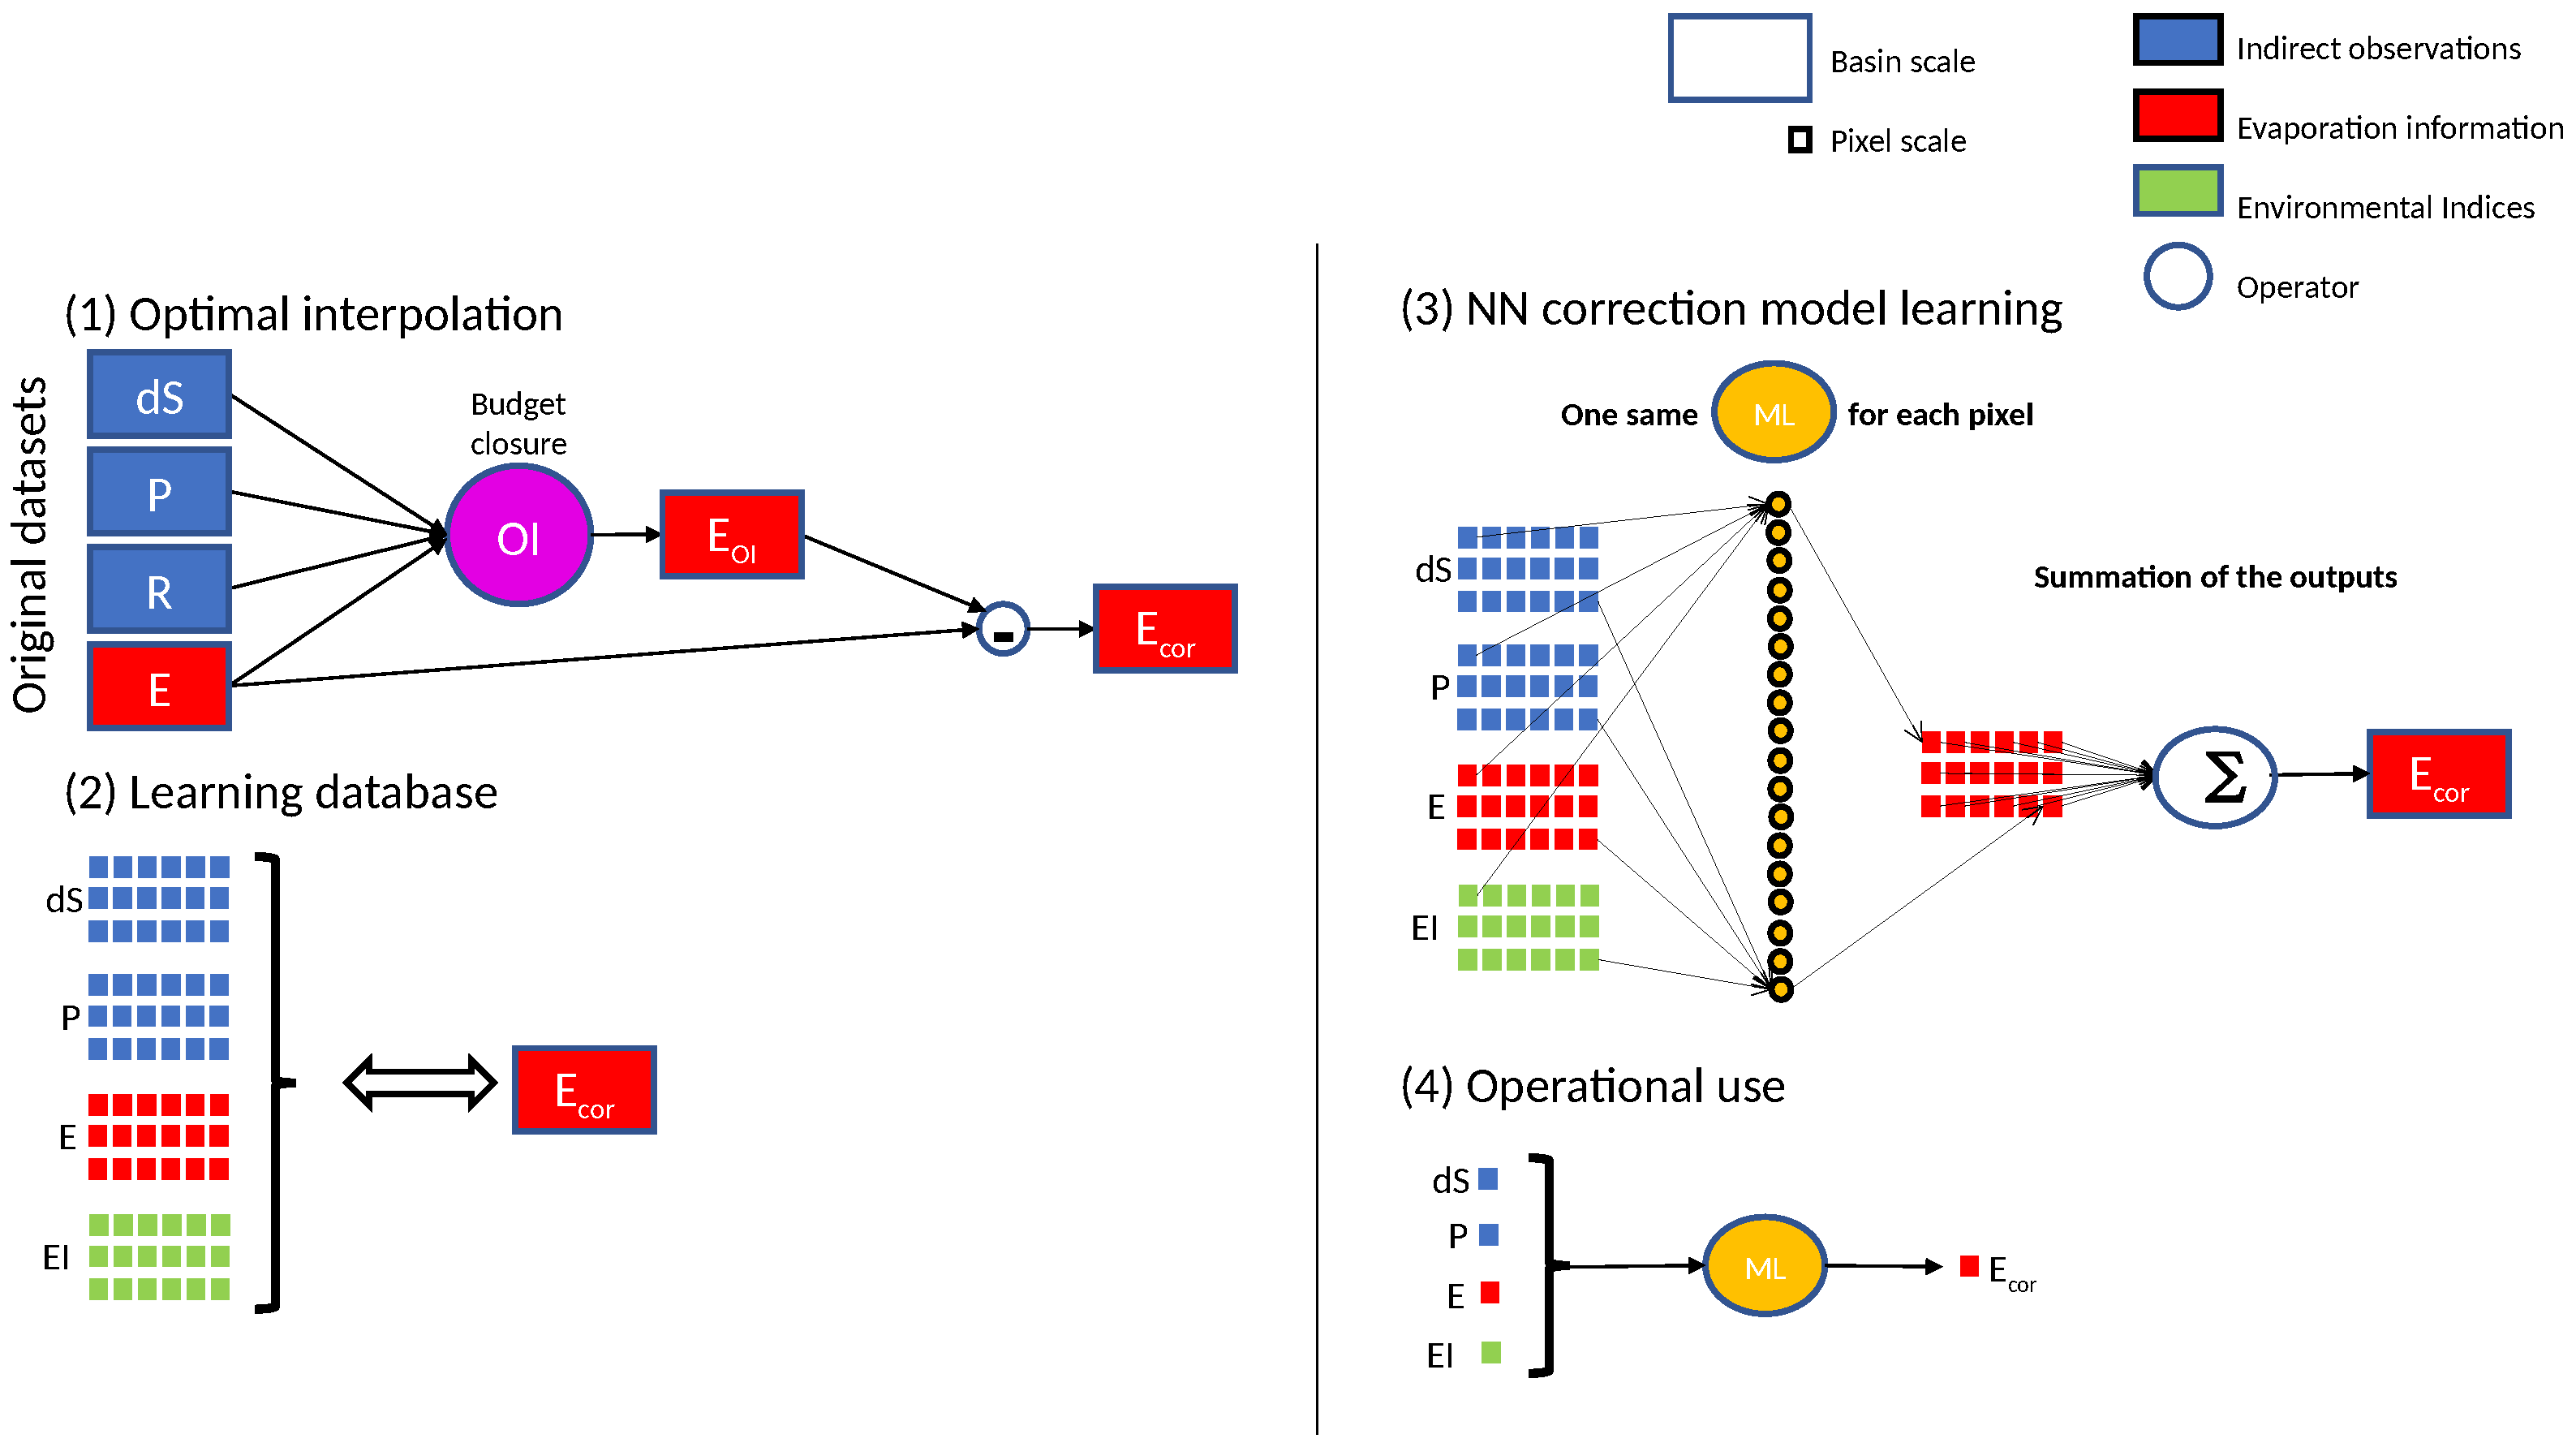
Figure 1. Overview of the strategy used in this paper. (1) Basin-scale optimal interpolation is used to estimate an evapotranspiration correction E c o r from the four hydrological cycle components: precipitation P, water storage difference d S , runoff R, and evapotranspiration E. (2) A training database is built by collocating the resulting basin-scale corrections (right) with the pixel information of each basin, including d S , P, E, and environmental indices ( E I s). (3) The ML model has two important features; it uses the same pixel-level correction model (yellow dots) and it aggregates the pixel corrections to obtain a basin-level value. It is therefore trained with pixels as inputs and basin scale data as outputs. (4) The resulting pixel-level model is used operationally to correct each pixel individually.
Remotesensing 16 00170 g001
Figure 2. Illustration of the catchments of our dataset. (top) Spatial distribution of catchments, in red for training and in blue for evaluation. The colors are intentionally transparent to highlight the overlap between the different catchments considered in the database. (Bottom) Aridity index distribution over training and test catchments. The collected dataset covers a wide range of climatic conditions.
Remotesensing 16 00170 g002
Figure 3. PDFs of the mean (left) and the standard deviation (STD, right) of the WB imbalance (in mm/month) at catchment scale using the average of available estimate for P, d S , and R, for the four E datasets: GLEAM-vb, GREAM-va, CSIRO-PML, and ERA-5.
Remotesensing 16 00170 g003
Figure 4. Static corrections (bias) in mm/month for the four considered E datasets. Red (resp. blue) color indicates region and dataset for which the E is underestimated (resp. overrestimated) in original datset.
Remotesensing 16 00170 g004
Figure 5. Evapotranspiration seasonal cycle (in mm/month) before (dashed lines) and after (continuous lines) correction for the main river located in various climates. The corrections increase consensus among the seasonal E cycles.
Remotesensing 16 00170 g005
Figure 6. Seasonal corrections (in mm/month) for GLEAM-vb dataset. Corrections are shown for the four seasons: winter (JFM), spring (AMJ), summer (JAS), and autumn (OND).
Remotesensing 16 00170 g006
Figure 7. The original E dataset closure errors in mm/month (left) and on the relative improvements brought by the correction model in % (right) as a function of catchment size (in 10 3 km 2 ) in log scale.
Remotesensing 16 00170 g007
Figure 8. PDF of the bias correction of the four E datasets (in mm/month) for four land cover classes: cropland rainfed (blue), cropland irrigated (red), mosaic cropland (yellow), deciduous broadleaved tree (purple), and tree broadleaved evergreen (green). Arrows indicate either that there is an increase or a reduction in E due to the correction for a particular land cover type.
Remotesensing 16 00170 g008
Figure 9. Impact of land cover on the scale and accuracy of the E correction model. (Top) Land cover distribution of maximally corrected pixels (90th percentile top corrections in absolute values). (Bottom) Land cover distribution over catchments best corrected by our model (catchments with 90th percentile top relative WB closure improvements). The purple bars represent the global land cover distribution over our full dataset for comparison.
Remotesensing 16 00170 g009
Figure 10. Correction quality flag (higher values are problematic regions) based on the corrected E dispersion.
Remotesensing 16 00170 g010
Figure 11. (Top): Location of the in situ flux tower used in the evaluation and the main land cover class, at 0.25 resolution. (Bottom): Scatterplot of the RMS of the difference between in situ and satellite E, before (x-axis) and after (y-axis) correction. The 1:1 line is indicated in red.
Remotesensing 16 00170 g011
Figure 12. Correlation between CaMa-Flood river discharge and WB-based reconstruction relying on E before (left) and after (right) correction. The correlation is improved using corrected E, specifically over upstream areas.
Remotesensing 16 00170 g012
Figure 13. Scatterplot of the correlation between simulated river discharge and WB-based reconstruction relying on E before (x-axis) and after (y-axis) correction for the four E datasets. The PDF of the grid distribution is shown in the color bar.
Remotesensing 16 00170 g013
Table 1. Overview of the datasets used in this study. The analysis is performed here on the common coverage period 2002–2015, at the monthly scale.
DatasetCoverageSpatial
Resolution ( )
Temporal
Resolution
Reference
Evapotranspiration
GLEAM v3.3b2003–20170.25daily[29]
GLEAM v3.3a1980–20170.25daily[29]
CSIRO-PML1980–20120.5monthly[30]
ERA-51980–20170.256 h[31]
Precipitation
GPCP1979–20151monthly[32]
TMPA2002–20150.25daily[33]
MSWEP1979–20150.5daily[34]
ERA-51980–20150.256 h[31]
Water storage
JPL2002–20171monthly[35]
CSR2002–20171monthly[36]
GFZ2002–20171monthly[37]
River network and discharge
Flow directionstatic0.25NA[38]
Discharge1980–2015NAmonthly[39]
Auxiliary information used in the ML-correction model
Soil moisture1980–20150.256 h[40]
Surface temperature1980–20150.256 h[40]
LAI1980–20150.256 h[40]
NDVI1980–20150.25daily[41]
P-E1980–20150.256 h[31]
Table 2. WB imbalance RMS (in mm/month). Org. refers to the original E dataset evaluation, and subsequent columns refer to bias and seasonal and monthly corrected E. Statistics are provided for the four original E datasets. Imbalances are estimated using the SW values for E, R, and d S (see Section 3.3).
DatasetOrg.Org. + BiasOrg. + SeasonOrg. + Monthly
GLEAM vb41.439.036.532.6
GLEAM va40.238.736.532.5
CSIRO-PML38.538.336.632.2
ERA5-Land38.538.537.132.4
Table 3. Evaluation using in situ flux tower from FLUXNET (RMS in mm/month). Org. refers to the original E dataset evaluation, and subsequent columns refer to bias and seasonal and monthly corrected E.
DatasetOrg.Org. + BiasOrg. + SeasonOrg. + Monthly
GLEAM vb29.228.126.627.5
GLEAM va27.727.326.827.7
CSIRO-PML27.827.528.128.7
ERA5-Land27.627.327.528.6
Disclaimer/Publisher’s Note: The statements, opinions and data contained in all publications are solely those of the individual author(s) and contributor(s) and not of MDPI and/or the editor(s). MDPI and/or the editor(s) disclaim responsibility for any injury to people or property resulting from any ideas, methods, instructions or products referred to in the content.