Abstract
Building extraction refers to the automatic identification and separation of buildings from the background in remote sensing images. It plays a significant role in urban planning, land management, and disaster monitoring. Deep-learning methods have shown advantages in building extraction, but they still face challenges such as variations in building types, object occlusions, and complex backgrounds. To address these issues, SDSNet, a deep convolutional network that incorporates global multi-scale feature extraction and cross-level feature fusion, is proposed. SDSNet consists of three modules: semantic information extraction (SIE), multi-level merge (MLM), and semantic information fusion (SIF). The SIE module extracts contextual information and improves recognition of multi-scale buildings. The MLM module filters irrelevant details guided by high-level semantic information, aiding in the restoration of edge details for buildings. The SIF module combines filtered detail information with extracted semantic information for refined building extraction. A series of experiments conducted on two distinct public datasets for building extraction consistently demonstrate that SDSNet outperforms the state-of-the-art deep-learning models for building extraction tasks. On the WHU building dataset, the overall accuracy (OA) and intersection over union (IoU) achieved impressive scores of 98.86% and 90.17%, respectively. Meanwhile, on the Massachusetts dataset, SDSNet achieved OA and IoU scores of 94.05% and 71.6%, respectively. SDSNet exhibits a unique advantage in recovering fine details along building edges, enabling automated and intelligent building extraction. This capability effectively supports urban planning, resource management, and disaster monitoring.
1. Introduction
Buildings extraction from remote sensing imagery has always been a highly relevant and popular topic [1,2,3]. It plays a crucial role in urban planning [4], disaster prevention [5,6,7], and digital mapping [8,9]. For instance, governments and urban planners can leverage the extracted building information to gain insights into urban development, formulate development policies, and more. When dealing with natural disasters such as floods, earthquakes, and fires, understanding the locations and density of buildings is crucial for emergency response and disaster management. Building extraction can help determine which areas are affected and where rescue and rebuilding efforts should be focused. Additionally, the results of building extraction are often integrated into geographic information systems to support map creation, navigation, geolocation services, and other applications related to spatial data.
During World War II, aerial reconnaissance became an important military tool and gradually developed aerial photography technology. With the development of aerial photography technology, people began to use aerial photography to obtain image information of the earth’s surface. This phase is known as early aerial remote sensing. In 1972, Landsat 1 was successfully launched, becoming the first remote sensing satellite to provide Earth observation data. The launch of the Landsat series of satellites marked the beginning of the era of satellite remote sensing, which enables large areas of the Earth’s surface to be observed by high-resolution satellite sensors. In the 1990s, high-resolution remote sensing technology was significantly developed. During this period, commercial satellites such as QuickBird and IKONOS were launched one after another and provided higher-resolution remote sensing image data, which further improved the accuracy and detail of Earth observation. The availability of many high-resolution remote sensing images [10,11,12] has the potential to improve the quality of building boundary detection. However, in practical applications, extracting buildings accurately from remote sensing imagery remains a formidable challenge that has captured the attention of numerous researchers. Buildings differ greatly in shape, size, height, location, and the materials used, leading to significant intra-class variation. Furthermore, an increase in image resolution can delineate building outlines more thoroughly, but it also introduces more noise and amplifies the appearance of non-building objects within the target building region. Therefore, the following challenges still persist:
(1) Occlusion challenges: In remote sensing imagery, buildings can often be occluded by trees, other structures, or shadows. The overlapping relationship between buildings and occluding objects can make it difficult to accurately extract the boundaries of buildings.
(2) Complex backgrounds: High-resolution remote sensing images often contain complex background information such as trees, grass, vehicles, pedestrians, and more. These unrelated elements can disrupt the building extraction process and elevate the potential for misclassification.
(3) Diversity and variability: Buildings exhibit variations in shape, size, color, and structure across regions, times, and even neighboring areas. Additionally, the appearance of a building can change due to renovations, demolition, or additions, which further complicates the building-extraction process.
The relevant structures are depicted in Figure 1. Achieving reliable and accurate extraction of buildings remains a challenging but significant task in the field of remote sensing.
Currently, the widely used methods for building extraction can be broadly categorized into the following two groups: traditional methods and deep-learning-based approaches. Traditional methods typically involve extracting the geometric properties of buildings using manual techniques, followed by classification, clustering, or segmentation algorithms for building identification. Sirmacek et al. [13] proposed a building-extraction method using multiple cues. Zhang et al. [14] and Zhong et al. [15] utilized spectral features to improve the performance of building extraction. Attempts have also been made to harness the potential of building edges [16,17], roof texture information [18,19], and building shadows [20,21] for building-extraction tasks. However, researchers struggle to extract sufficient semantic features from buildings, leading to poor extraction results. Despite the significant achievements of manually designed feature-based methods, their generalization capability is limited. This is primarily due to manually crafted features, which possess task-specific, over-specified, and incomplete characteristics. In the context of building extraction from high-resolution remote sensing images, these drawbacks become even more apparent.
Over the course of several decades, deep-learning has achieved tremendous successes, with deep neural networks (DNNs) being applied across various domains, including computer vision [22,23,24] and natural language processing [25]. Subsequently, it was discovered that using deep neural networks for building extraction still achieved impressive results [26,27]. Given that both building-extraction and semantic-segmentation tasks require dense pixel predictions, numerous design principles and ideas adopted from the field of segmentation have been incorporated into building-extraction algorithms [28,29].
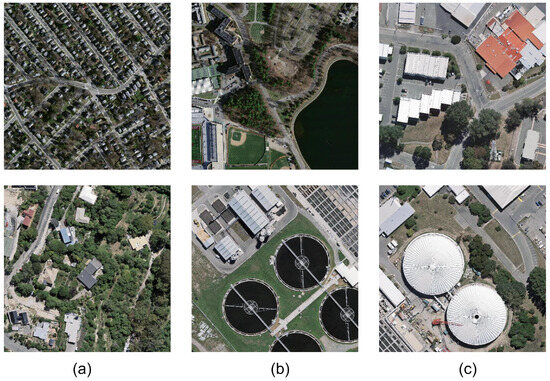
Figure 1.
Challenges in building-extraction task. (a) Demonstrates the issue of buildings being obstructed by trees, other structures, or objects. (b) Shows the complexity of displaying image backgrounds and the difficulty of distinguishing buildings from surrounding objects. (c) The complexity and diversity of buildings are highlighted, emphasizing the significant intra-class differences in building types.

The deep-learning-based method of building extraction does not require manual feature design, as it can automatically learn discriminative features from training data. Due to ongoing advancements in convolutional neural networks (CNNs) and the availability of numerous publicly accessible datasets [30,31], this approach has become increasingly prominent. The CNN architecture most-used for building extraction is the fully convolutional neural network (FCN) [24]. The key distinction between an FCN and a traditional CNN lies in the fact that an FCN replaces the fully connected layer at the end of a CNN with a fully convolutional layer, enabling efficient, precise predictions from pixel to pixel. Although traditional FCN models exhibit good classification performance, they still have certain deficiencies. Firstly, the repeated stacking of downsampling and upsampling processes can result in the loss of crucial fine-grained details, leading to decreased accuracy in predicting building boundaries [32]. Moreover, as the network grows deeper, the receptive field of an FCN fails to capture the necessary global contextual information, resulting in erroneous predictions of the targets [33]. In the field of computer vision, there have been many studies devoted to addressing these two issues. For instance, u-shaped network (U-Net) [34] employs an encoder–decoder architecture, which facilitates the recovery of detailed information lost due to the downsampling process by connecting corresponding feature layers at different network depths. Segmentation network (SegNet) [35] employs a more lightweight encoder structure and incorporates a non-linear upsampling process into the decoder. DeepLabv3 [36] and DeepLabv3+ [37] utilize dilated convolutions to reduce the downsampling process and introduce spatial-pyramid pooling to effectively capture global information. Although the above-mentioned methods have, to some extent, addressed the issues of detail loss during downsampling and insufficient global information capture and have become typical and widely used FCN architectures, there are still some challenges when applying these classical semantic segmentation methods to building-extraction tasks. Firstly, in high-resolution remote sensing images, the surroundings of buildings are intricate and have scale variations greater than those of natural objects in images. Secondly, buildings, being typical man-made structures, possess rich morphological attributes. However, the limited feature-learning capability of models has impacted the effectiveness at building extraction. Consequently, effectively distinguishing between various terrain features and obtaining accurate building boundaries has remained a focal point in remote sensing research.
For the challenges to building extraction mentioned above, many studies have focused on optimizing the performance of building extraction by modifying the network architecture design [38,39,40]. Promising approaches in this regard include integration of deep and shallow features [41,42,43], utilization of multiple receptive fields [44,45,46], and combination of residual connections [47,48,49]. These methods are widely accepted in the field. Multi-participation path neural network (MAP-Net) [50] effectively solves the scale problem by designing parallel paths so as to capture multi-scale features while preserving spatial information, which enables more-robust capturing of long-range feature dependencies of buildings. However, the network may introduce irrelevant information in the processing of shallow features, thereby posing a risk of extraction errors in situations involving occlusion and complex background interference. Bayesian reasoning and representation network (BRRNet) [51] introduces a prediction head that utilizes non-uniform convolutions with different dilation rates to extract global contextual information, which can address challenges posed by the diversity of building shapes. However, in the presence of complex background interference in images, the network may not fully restore detailed information about the buildings. Efficient network (ESFNet) [52] uses separable factorized residual blocks, greatly reducing computational complexity and memory requirements. By decomposing convolution operations into dilation convolutions, the network achieves a reduction in parameter counts at the expense of a small loss of precision. However, this approach may lack stability in the extraction of smaller buildings, potentially leading to omissions and extraction errors. To mitigate parameter and network degradation issues, Wang et al. introduced an effective model known as residual U-Net (RU-Net) [53] for building extraction. It integrates the strengths of U-Net, residual learning, atrous spatial pyramid pooling, and focal loss. The modified residual learning within the U-Net model reduces network parameters and degradation. Atrous spatial pyramid pooling is used to capture multi-scale features and contextual information from the images, while focal loss addresses the problem of class imbalance in classification. To extract building footprints from very-high-resolution (VHR) remote sensing images and digital surface model (DSM) data, Hamidreza and colleagues introduced an end-to-end cross-modal gated fusion network (CMGFNet) [54]. To facilitate cross-modal feature fusion, they proposed a gated fusion module (GFM) for effective integration of both modalities. Furthermore, they introduced a residual-like depth-wise separable convolution (R-DSC) to enhance the performance of the upsampling process while reducing parameters and time complexity in the decoder section. To address the spatial inconsistency problem resulting from independent pixel-level classification, Li et al. introduced an innovative deep adversarial network known as Building-A-Nets [55]. This network concurrently trains a deep convolutional neural network (generator) and an adversarial discriminator network for robust building extraction in remote sensing images. In addition to multi-scale design, attention modules have gained increasing importance in emerging building-extraction methods [56,57,58]. For example, Liu et al. [59] propose a multi-scale U-shaped CNN architecture with edge constraints for building-instance extraction; this approach improves both accuracy and the preservation of fine details. Guo et al. [58] incorporate attention mechanisms by combining them with the U-Net architecture; this dynamic adjustment of the network’s focus on various regions enhances the precision of building extraction by emphasizing important areas. Dual attention network (DANet) [60] improves the performance of image semantic-segmentation tasks through the implementation of dual attention mechanisms: first, auxiliary branches and, second, an efficient and scalable network design. Dense attention network (DAN-Net) [61] enhances the network’s perception of building regions and features by introducing dense attention modules, multi-scale contextual-information-fusion mechanisms, and a loss function based on edge constraints.
Despite the commendable efficacy demonstrated by these deep-learning methodologies in the realm of building-extraction tasks, they still have some limitations. One major issue is the lack of fine-grained detail processing. This implies that these models may face difficulties in accurately extracting building boundaries and complex structures, resulting in less-precise extraction results. This may be attributed to the limitations of the network architecture or the incompleteness of the datasets. To address these challenges, this study proposes a simple but efficient deep-learning model called SDSNet to achieve more-refined building extraction. In order to effectively evaluate our network, extensive experiments were conducted on two publicly available and widely used datasets. The results indicate that our network outperforms the existing state-of-the-art models, including pyramid scene parsing network (PSPNet) [62], DeepLabv3+, MAP-Net, and sparse token transformers (STT) [63], among others, particularly at recovering building edge details. This highlights the significant potential of SDSNet in high-resolution remote-sensing-image-based building extraction.
This research work makes the following main contributions:
(1) A novel deep convolutional neural network (DCNN) model for building extraction from high-resolution remote sensing images is proposed. Our network not only achieves cross-layer feature fusion but also selectively filters feature details, resulting in more-accurate extraction of building boundary information.
(2) In order to address the challenges posed by complex backgrounds and the diversity and variability of buildings, a semantic information extraction (SIE) module is constructed to capture global contextual information from the images, enabling more-refined extraction of semantic feature information and improving the model’s accuracy. As for the challenges in boundary extraction caused by occlusions and irrelevant information in high-resolution remote sensing images, a multi-level merge (MLM) module is created, which utilizes semantic information from high-level features to guide the low-level features and selects the more important detail features through a series of operations. Eventually, a semantic information fusion (SIF) module is built, primarily for fusing the filtered features from the MLM module with the features extracted by the SIE module to prevent the potential loss of certain detail information and to enhance the model’s predictive precision.
(3) Extensive comparative experimental results demonstrate significant performance improvements for the proposed model on building-extraction tasks. Compared to the existing best-performing models, such as Deeplabv3+, our model achieves 1.3% and 0.72% increases in IoU and F1-score, respectively, based on the WHU building dataset, and 1.06% and 0.73% increases in IoU and F1-score, respectively, based on the Massachusetts dataset. This confirms the superiority of SDSNet in building-extraction tasks.
2. Methodology
2.1. Architecture of SDSNet
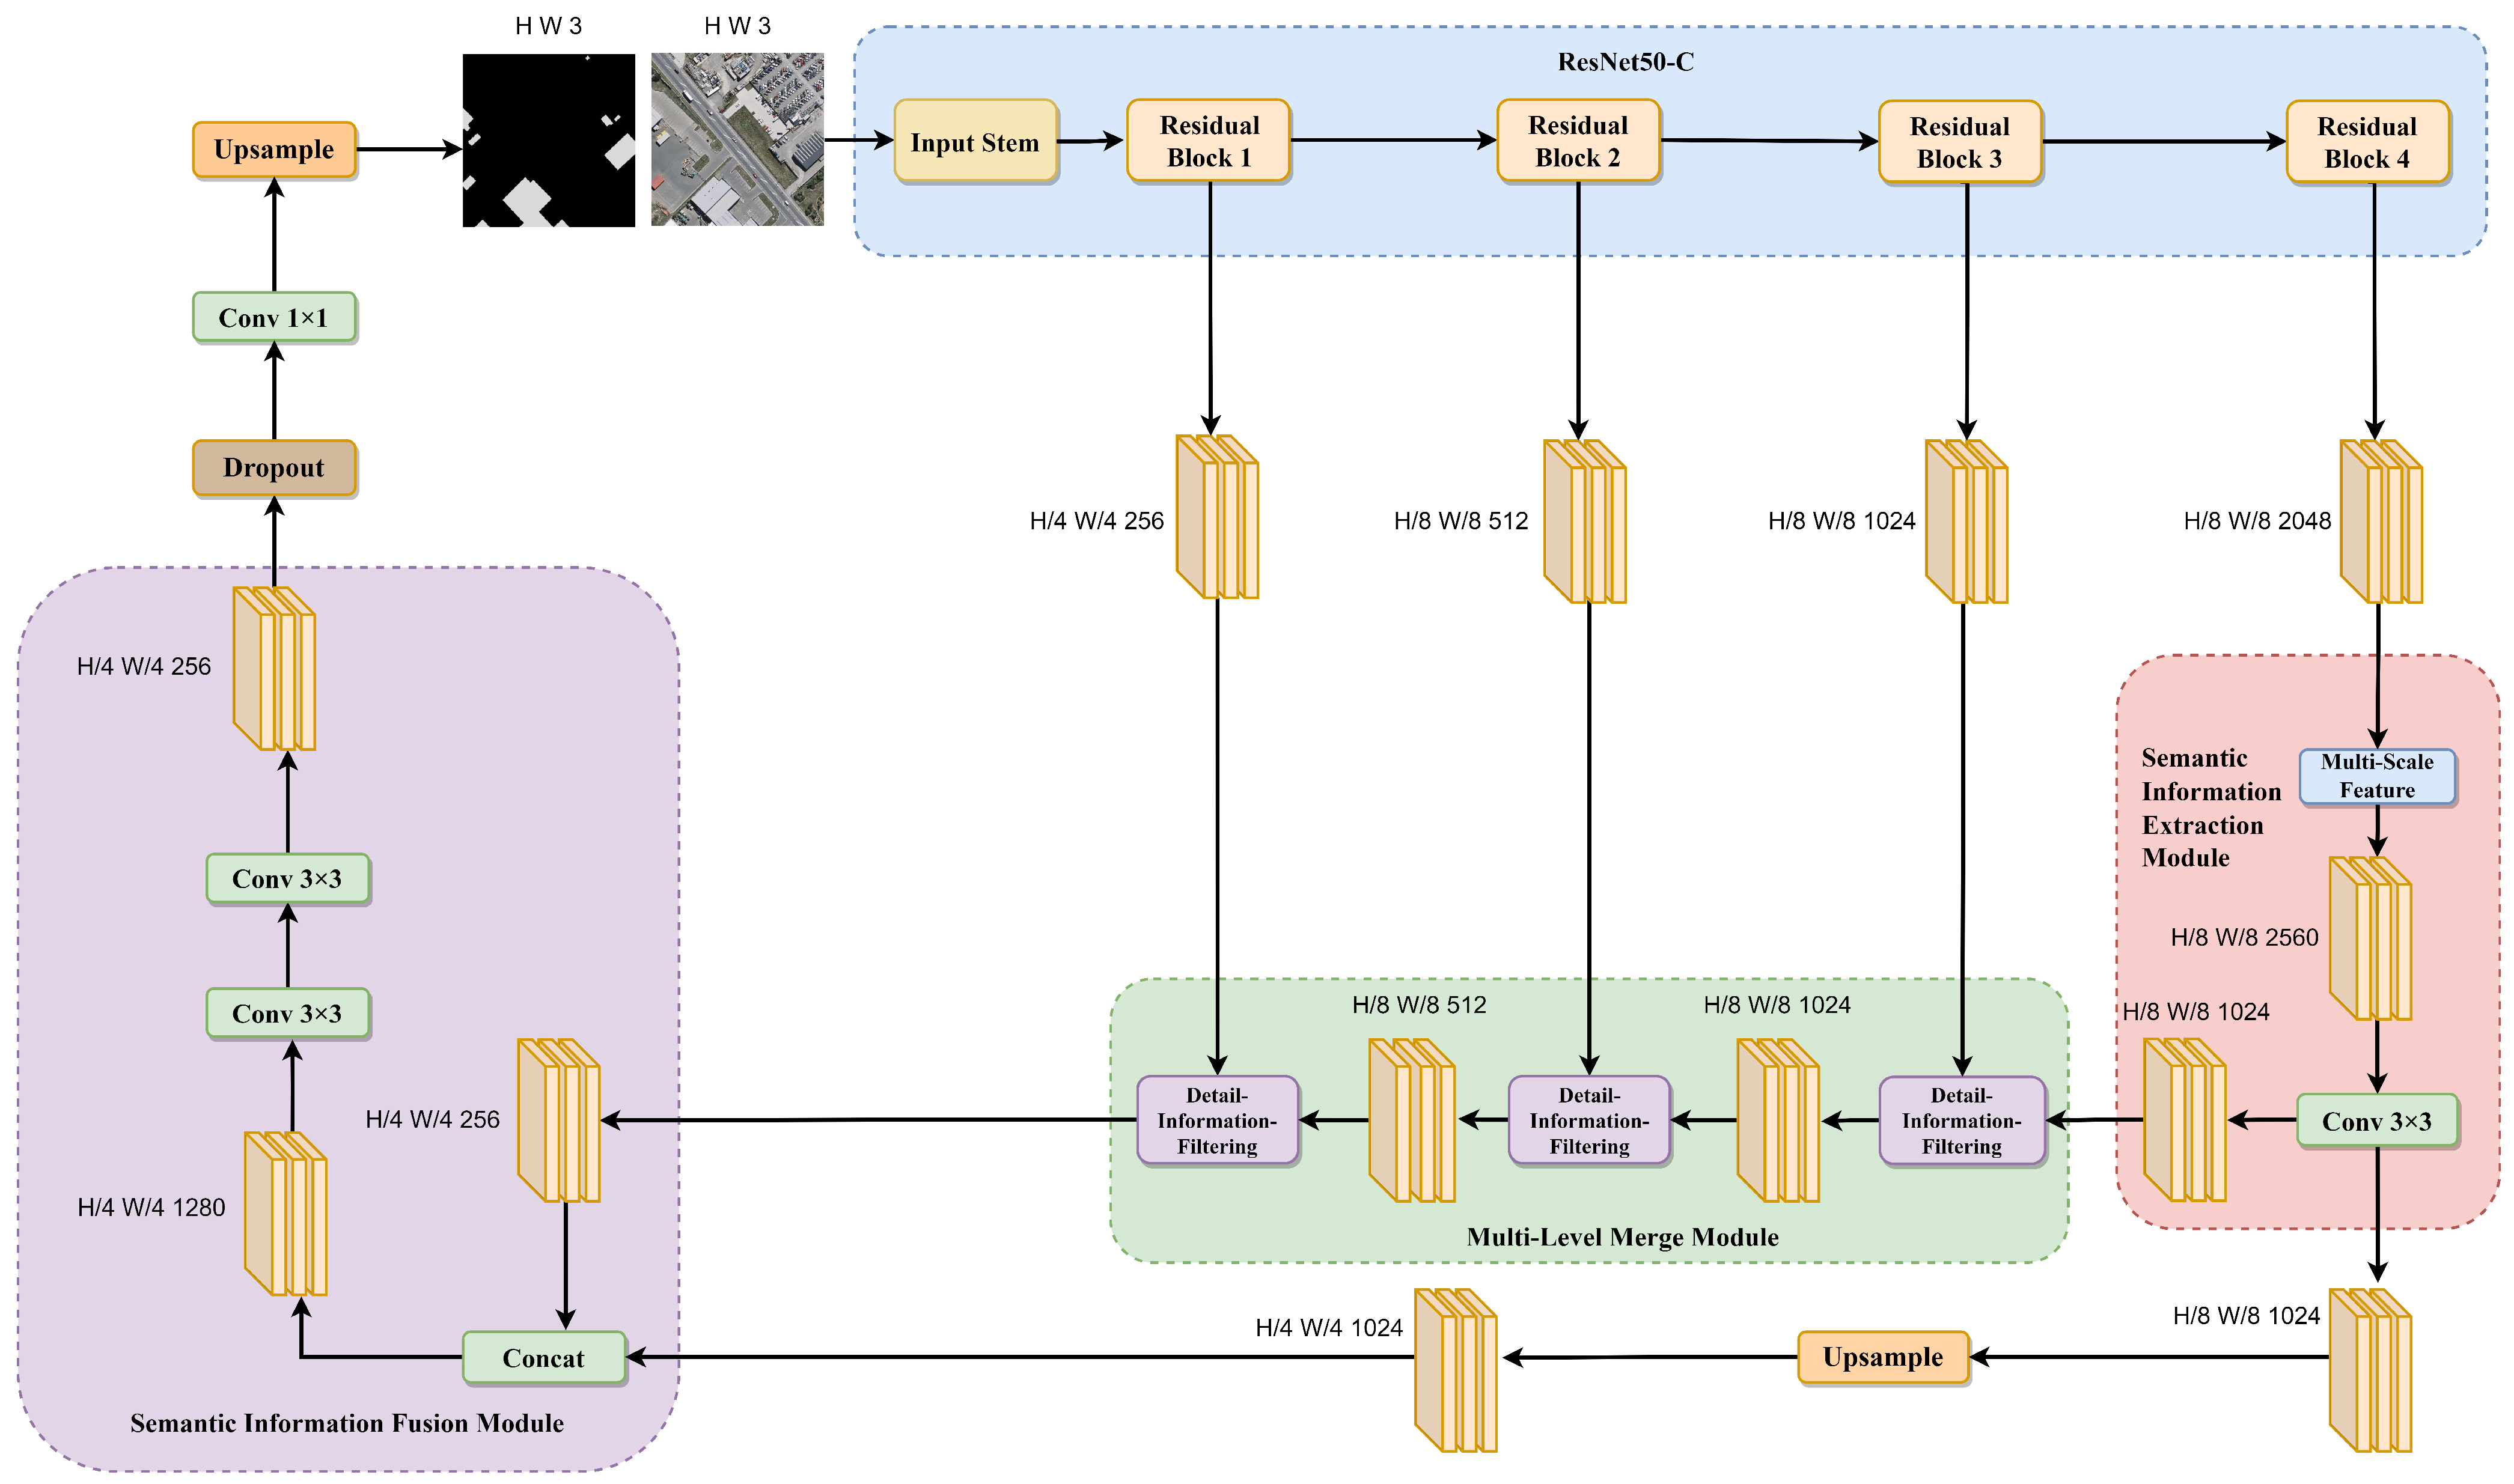
Figure 2 illustrates the overall framework of SDSNet. SDSNet mainly consists of three components: the SIE module, the MLM module, and the SIF module. Firstly, ResNet50-C [64] is introduced as the backbone network and is combined with the SIE module to extract multi-scale contextual information features from the image. Secondly, the MLM module is designed to filter out high-weighted building detail information to refine the construction of boundaries. Finally, in the feature-fusion stage, the SIF module is introduced to precisely integrate features from different levels and enhance the continuity and accuracy of building extraction.
The SIE module primarily consists of the multi-scale-feature sub-module and a convolutional layer. The multi-scale-feature sub-module is utilized to extract information features at various scales, enhancing the receptive field of the network. The final convolutional layer is employed to fuse the multi-scale contextual information while reducing the number of channels in order to capture crucial semantic features in the image.
The MLM module comprises three detail-information-filtering sub-modules, which play a role in filtering out irrelevant features from lower-level feature maps and preserving important detail features related to buildings through multiple rounds of selection and merging.
The SIF module is mainly composed of a concatenation and several convolutional layers. It integrates the feature maps output by the SIE module and the filtered feature maps from the MLM module, resulting in more-accurate feature map information.

Figure 2.
Overview of SDSNet.
Figure 2.
Overview of SDSNet.
2.2. Semantic Information Extraction Module
Using a generic convolutional structure alone to extract buildings results in insufficient receptive field coverage over the building area. This limitation hinders the acquisition of global multi-scale information and long-range context, leading to omissions or incompleteness in the interiors of complex buildings. To resolve this issue, as shown in Figure 3, the multi-scale-feature sub-module is created in the SIE module. A common way to increase the receptive field is by downsampling feature maps. However, the repeated downsampling process and coarse upsampling layers can lead to the loss of crucial details. To address this issue, the multi-scale-feature sub-module introduces dilated convolutions [65], ensuring the augmentation of semantic information from different receptive fields while preserving fine-grained details (without downsampling). This, in turn, enhances the network’s ability to capture global contextual information and improves segmentation accuracy.
For the initial downsampling of the feature map with an 8× reduction and a channel count of 2048, a combination of operations are employed, including global average pooling, 1 × 1 convolution, and upsampling. The relevant formula is as follows:
In this context, denotes the feature vector for the i-th scale, represents the input feature map, denotes the pixel value at position j on the feature map, G denotes global pooling, and N represents the total number of pixels in the feature map. The global pooling operation computes the average value of all the pixel values on the feature map and assigns the result as an element of the feature vector.
In the aforementioned equations, V represents the input feature map, Z represents the output feature map, W indicates the weight of the 1 × 1 convolutional kernel, b represents the bias term, and C represents a 1 × 1 convolution.
Additionally, parallel processing is performed using dilated convolutions with dilation rates of 12, 24, and 36, along with 1 × 1 convolutions. This generates five feature maps with consistent dimensions of 512 channels each. Subsequently, by concatenating these feature maps, a feature map with a channel count of 2560 is obtained. Next, a 3 × 3 convolutional layer is applied to reduce the channel dimensionality to 1024 in order to facilitate the subsequent filtration of detailed information.
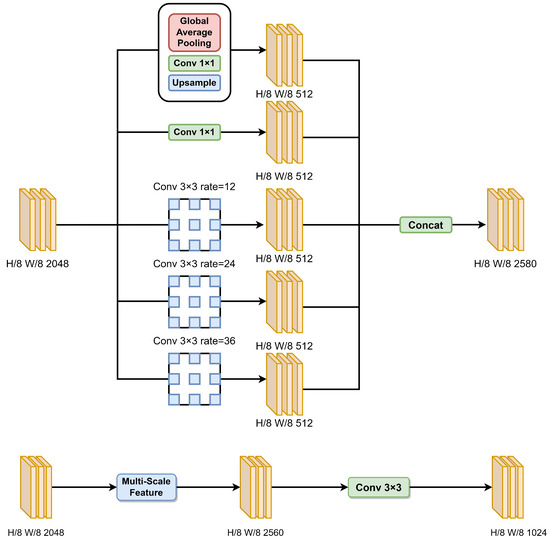
Figure 3.
Structure of multi-scale-feature sub-module and the SIE module.
Figure 3.
Structure of multi-scale-feature sub-module and the SIE module.

2.3. Multi-Level Merge Module
Due to the pooling operation, higher-level features inevitably lose detailed information, which leads to inaccurate distinction of building boundaries despite the model containing semantic information related to the buildings. To minimize the loss of spatial features of the buildings, the MLM module is designed, as shown in Figure 4; it adopts a cascading strategy to gradually recover and optimize the details of the target.
The MLM module comprises three detail-information-filtering sub-modules. Firstly, the feature map with 8× downsampling and 1024 channels, generated by the SIE module, and the feature map with 8× downsampling and 1024 channels from the third block of the backbone network are merged using the first detail-information-filtering sub-module. This results in a downsampling factor of 8× and 1024 channels for the feature map. Subsequently, this merged feature map is further combined with the feature map from the second block of the backbone network, which has a downsampling factor of 8× and 512 channels, using the second detail-information-filtering sub-module. This yields a downsampling factor of 8× and 512 channels for the resulting feature map. Finally, this merged feature map is merged with the feature map from the first block of the backbone network, which has a downsampling factor of 4× and 256 channels, using the third detail-information-filtering sub-module. This generates a downsampling factor of 4× and 256 channels for the final feature map.
Existing methods for fusing higher-level and lower-level features often involve channel-wise concatenation or pixel-wise addition without considering the interdependencies between channels at different levels. Since the lower-level features do not contain sufficient semantic information about buildings, simple concatenation or addition of the higher-level and lower-level features can introduce irrelevant noise from the lower-level feature maps, thereby reducing the effectiveness of feature fusion.To fully exploit the detailed information in the lower-level features and enhance the efficiency of fusion between higher-level and lower-level features, a detail-information-filtering sub-module is developed.
In each detail-information-filtering sub-module, the process begins by subjecting the higher-level feature map to global average pooling, followed by a 1 × 1 convolution, normalization, and an rectified linear unit (RELU) activation function. This yields a feature vector that encapsulates the higher-level semantic information. Subsequently, the lower-level feature map passes through a 3 × 3 convolutional layer, and the resulting feature map is multiplied with the aforementioned feature vector along the channel dimension. This produces a preliminary filtered feature map. Next, the higher-level feature map is subjected to a 1 × 1 convolution, normalization, an RELU activation function, and an upsampling operation. The resulting output is then added to the preliminary filtered feature map and lower-level feature map. This aligns with the concept of residual connections in the ResNet architecture, which allows the network to further learn additional features related to buildings while ensuring the current learning capacity of the network. Moreover, it enhances the network’s ability to eliminate redundant information to a certain extent. This module effectively captures detailed information of buildings by guiding lower-level feature maps through higher-level semantic feature channel vectors to filter information.
The mathematical expression for the specific formula is as follows: let us assume that the size of the higher-level feature X is × × and the size of the lower-level feature Y is × × . The output-fused feature Z, with a size of × × , can be represented by Equation (3):
In the given context, and represent 1 × 1 convolutions, c represents a 3 × 3 convolution, g represents global average pooling, b represents batch normalization, R represents the RELU activation function, and u represents bilinear upsampling.
2.4. Semantic Information Fusion Module
As the network depth increases, the receptive field of the network also gradually expands, enhancing its semantic-expression capabilities. However, this also leads to a decrease in image resolution, causing many fine-grained details to become increasingly blurred after multiple convolution operations in the network. Shallow neural networks have smaller receptive fields, resulting in stronger expressive power for fine-grained features but weaker semantic representation. To tackle this problem, as shown in Figure 5, the SIF module is devised. The selection of features for fusion is based on each module’s capacity to capture complementary information from different sources. As previously detailed regarding the features captured by the SIE and MLM modules, synthesizing various features can effectively enhance the model’s ability to recognize complex spatial patterns of buildings in remote sensing images.
Firstly, the high-level feature map from the SIE module should be concatenated with the feature map filtered through the MLM module. Subsequently, a series of convolutions is applied to reduce the number of channels. Finally, the resulting map, which represents the extracted buildings, is obtained through the utilization of dropout layers, 1 × 1 convolutional layers, and upsampling operations.
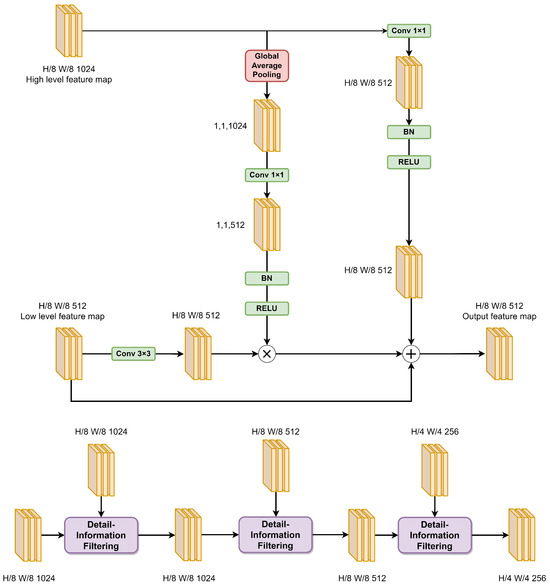
Figure 4.
The structure of detail-information filtering and the MLM module.
Figure 4.
The structure of detail-information filtering and the MLM module.
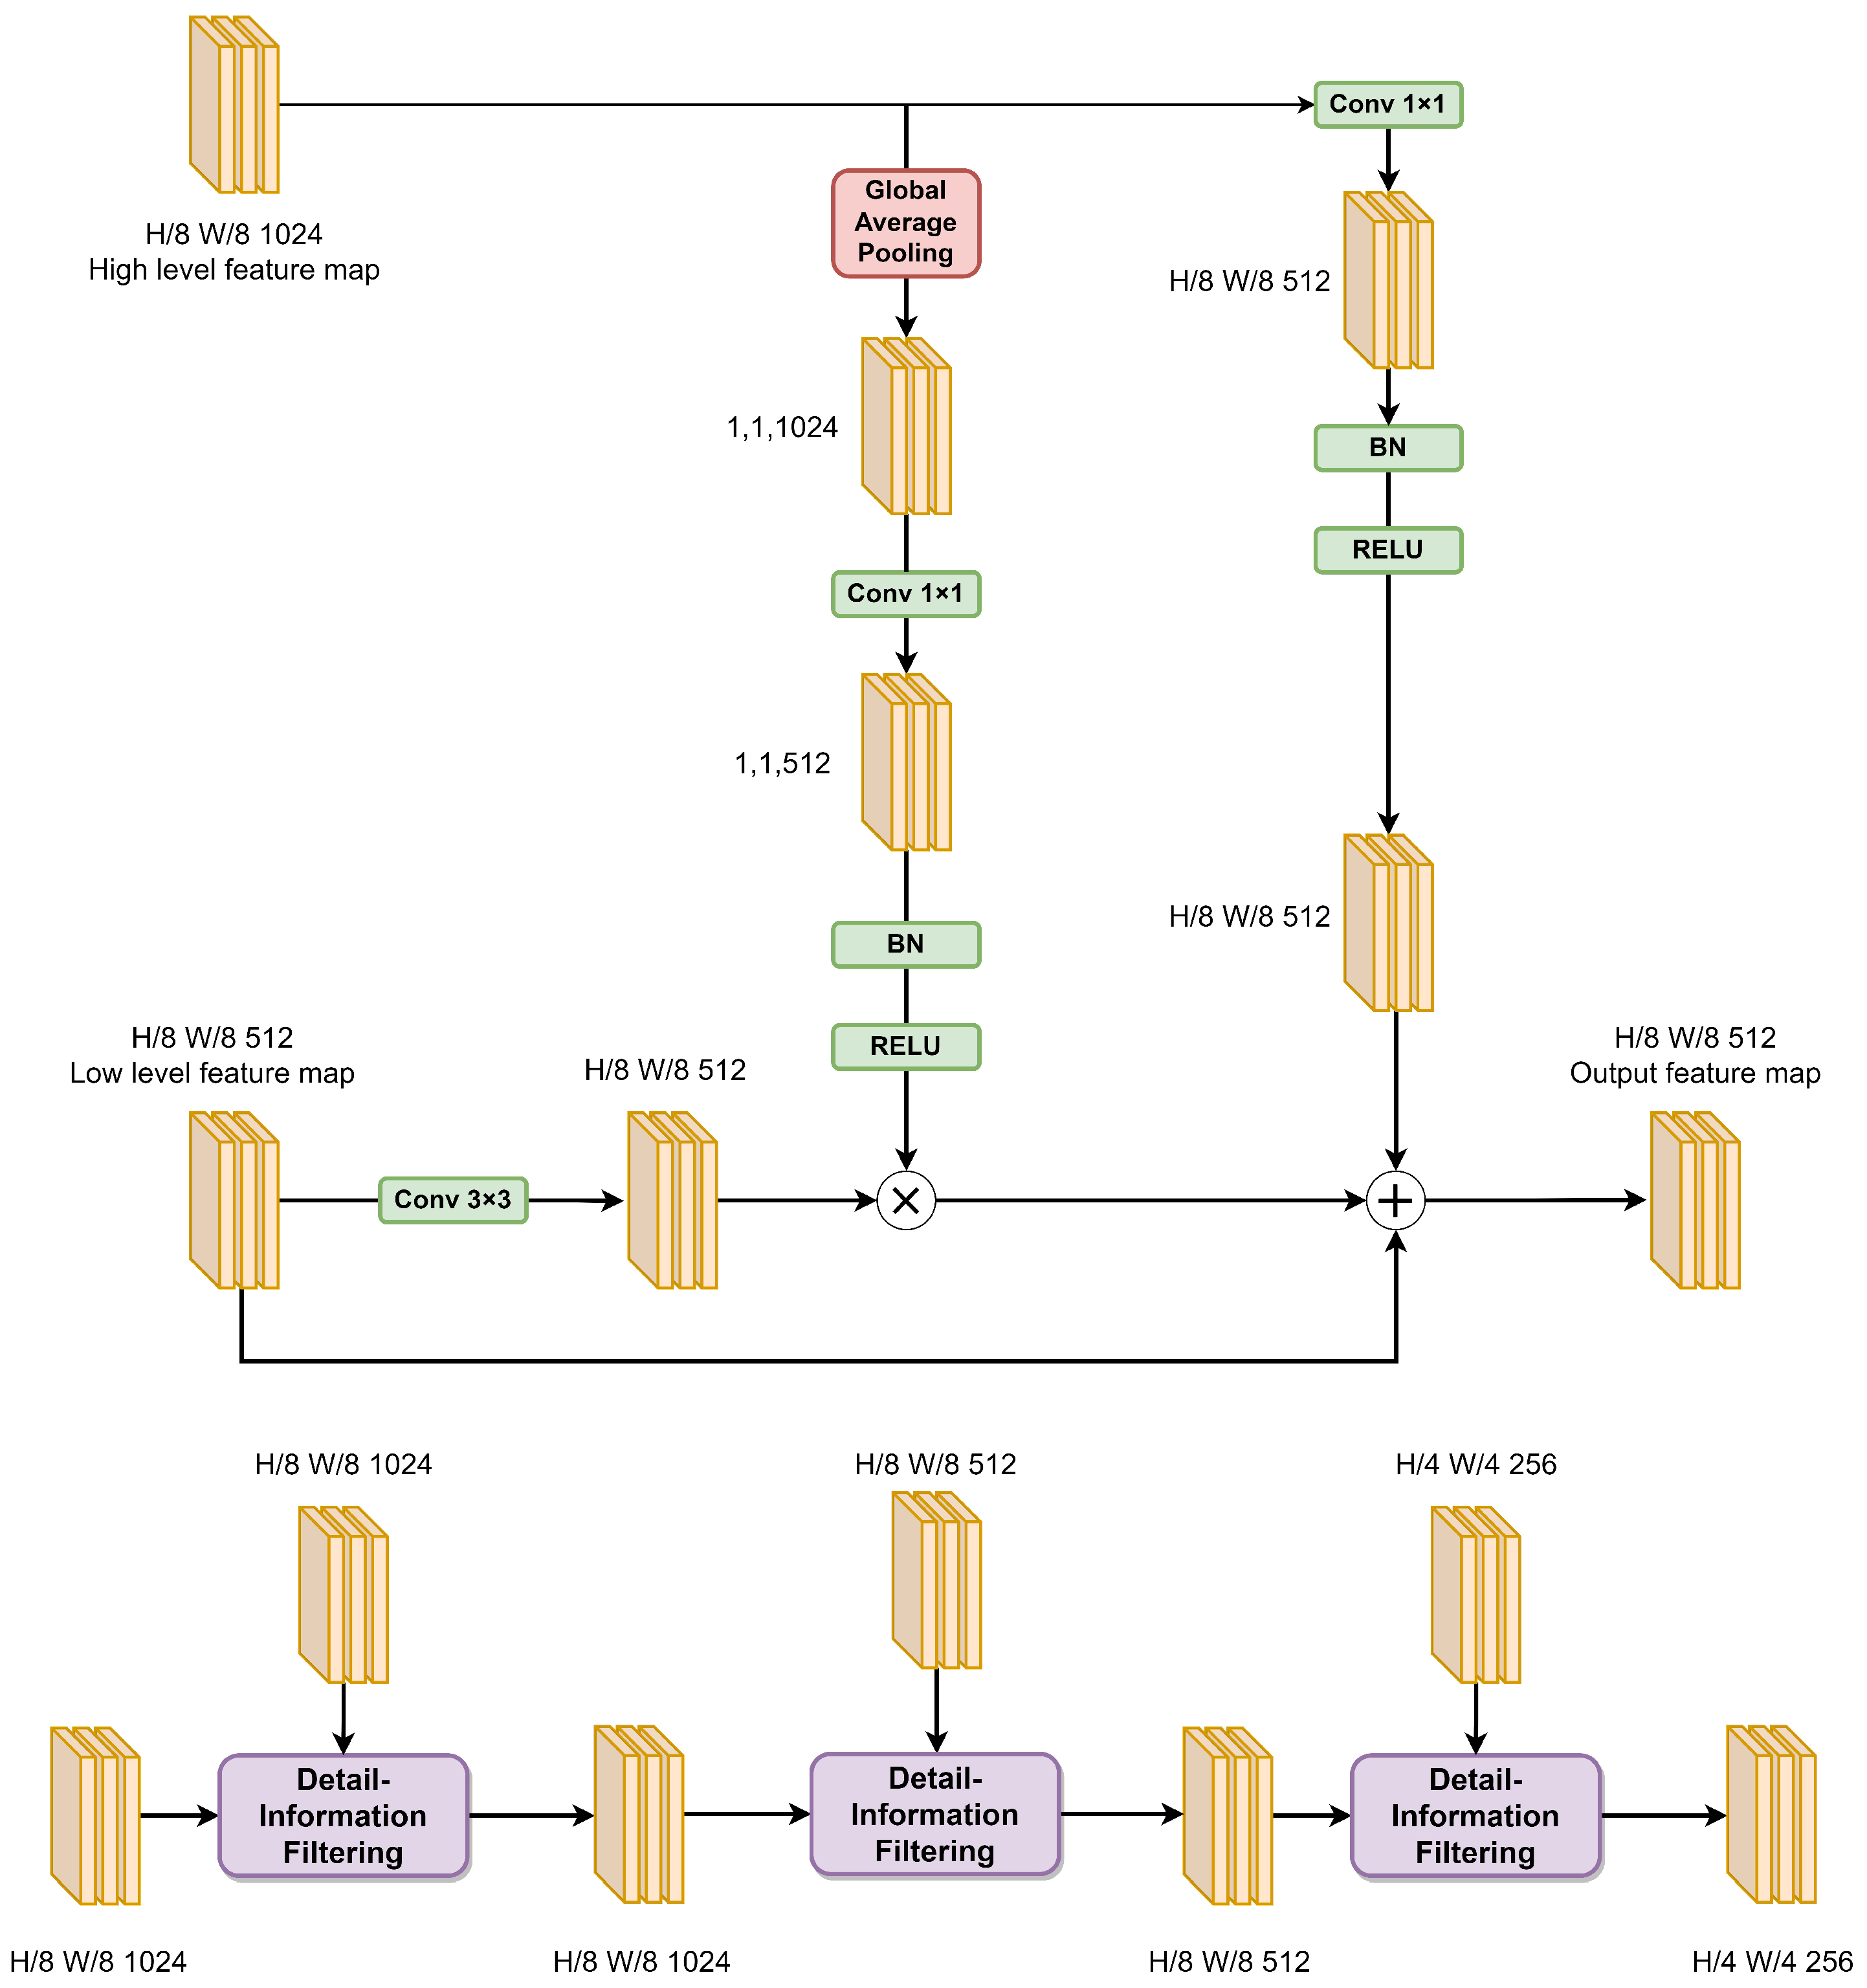
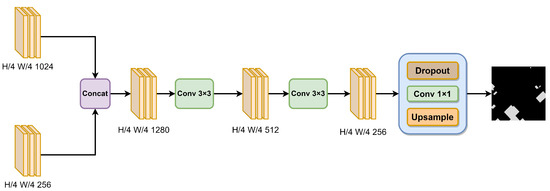
Figure 5.
The structure of the SIF module.
Figure 5.
The structure of the SIF module.

2.5. Loss Function
The binary cross-entropy (BCE) function is chosen as our loss function. In comparison to traditional loss functions such as mean squared error, the BCE loss function yields relatively clearer gradient signals. This contributes to faster convergence and more-stable training because it assigns higher gradients to samples with prediction errors, thereby increasing error propagation in the backpropagation process and accelerating the optimization. In the context of building extraction tasks, this is crucial for the model to quickly learn the features of buildings. Additionally, the task of building extraction essentially belongs to a binary segmentation problem. The combination of BCE with the softmax function is often employed and produces outputs that are more easily interpretable as class probability distributions. In the task of building extraction, it is possible to explicitly delineate the probability distribution of each pixel belonging to either a building or background. The formula is represented by Equation (4):
where y is the true value of the label and is the predicted value.
Cross-entropy is a metric that quantifies the dissimilarity between two different probability distributions of the same random variable. In the context of machine learning, it measures the difference between the true probability distribution and the predicted probability distribution. A lower value of cross-entropy indicates better performance of the model in terms of prediction accuracy. Cross-entropy is commonly used in classification problems in conjunction with the softmax function. The softmax function processes the model’s output to ensure that the predicted probabilities for multiple classes sum up to one. The cross-entropy loss is then calculated to measure the discrepancy between the predicted probabilities and the true labels.
To classify the output of the network, the softmax function is employed as a classifier. It calculates the probability for each class and ensures that the sum of probabilities for all classes equals 1. The probability of pixel l belonging to class i is represented by Equation (5):
where k represents the total number of classification classes, and represents the value of the i-th channel of pixel l.
3. Experiment
3.1. Dataset Introduction
This study utilized two datasets to evaluate the building extraction performance of SDSNet: the WHU building dataset (WHU-Airborne imagery dataset [31]) and the Massachusetts building dataset [66].
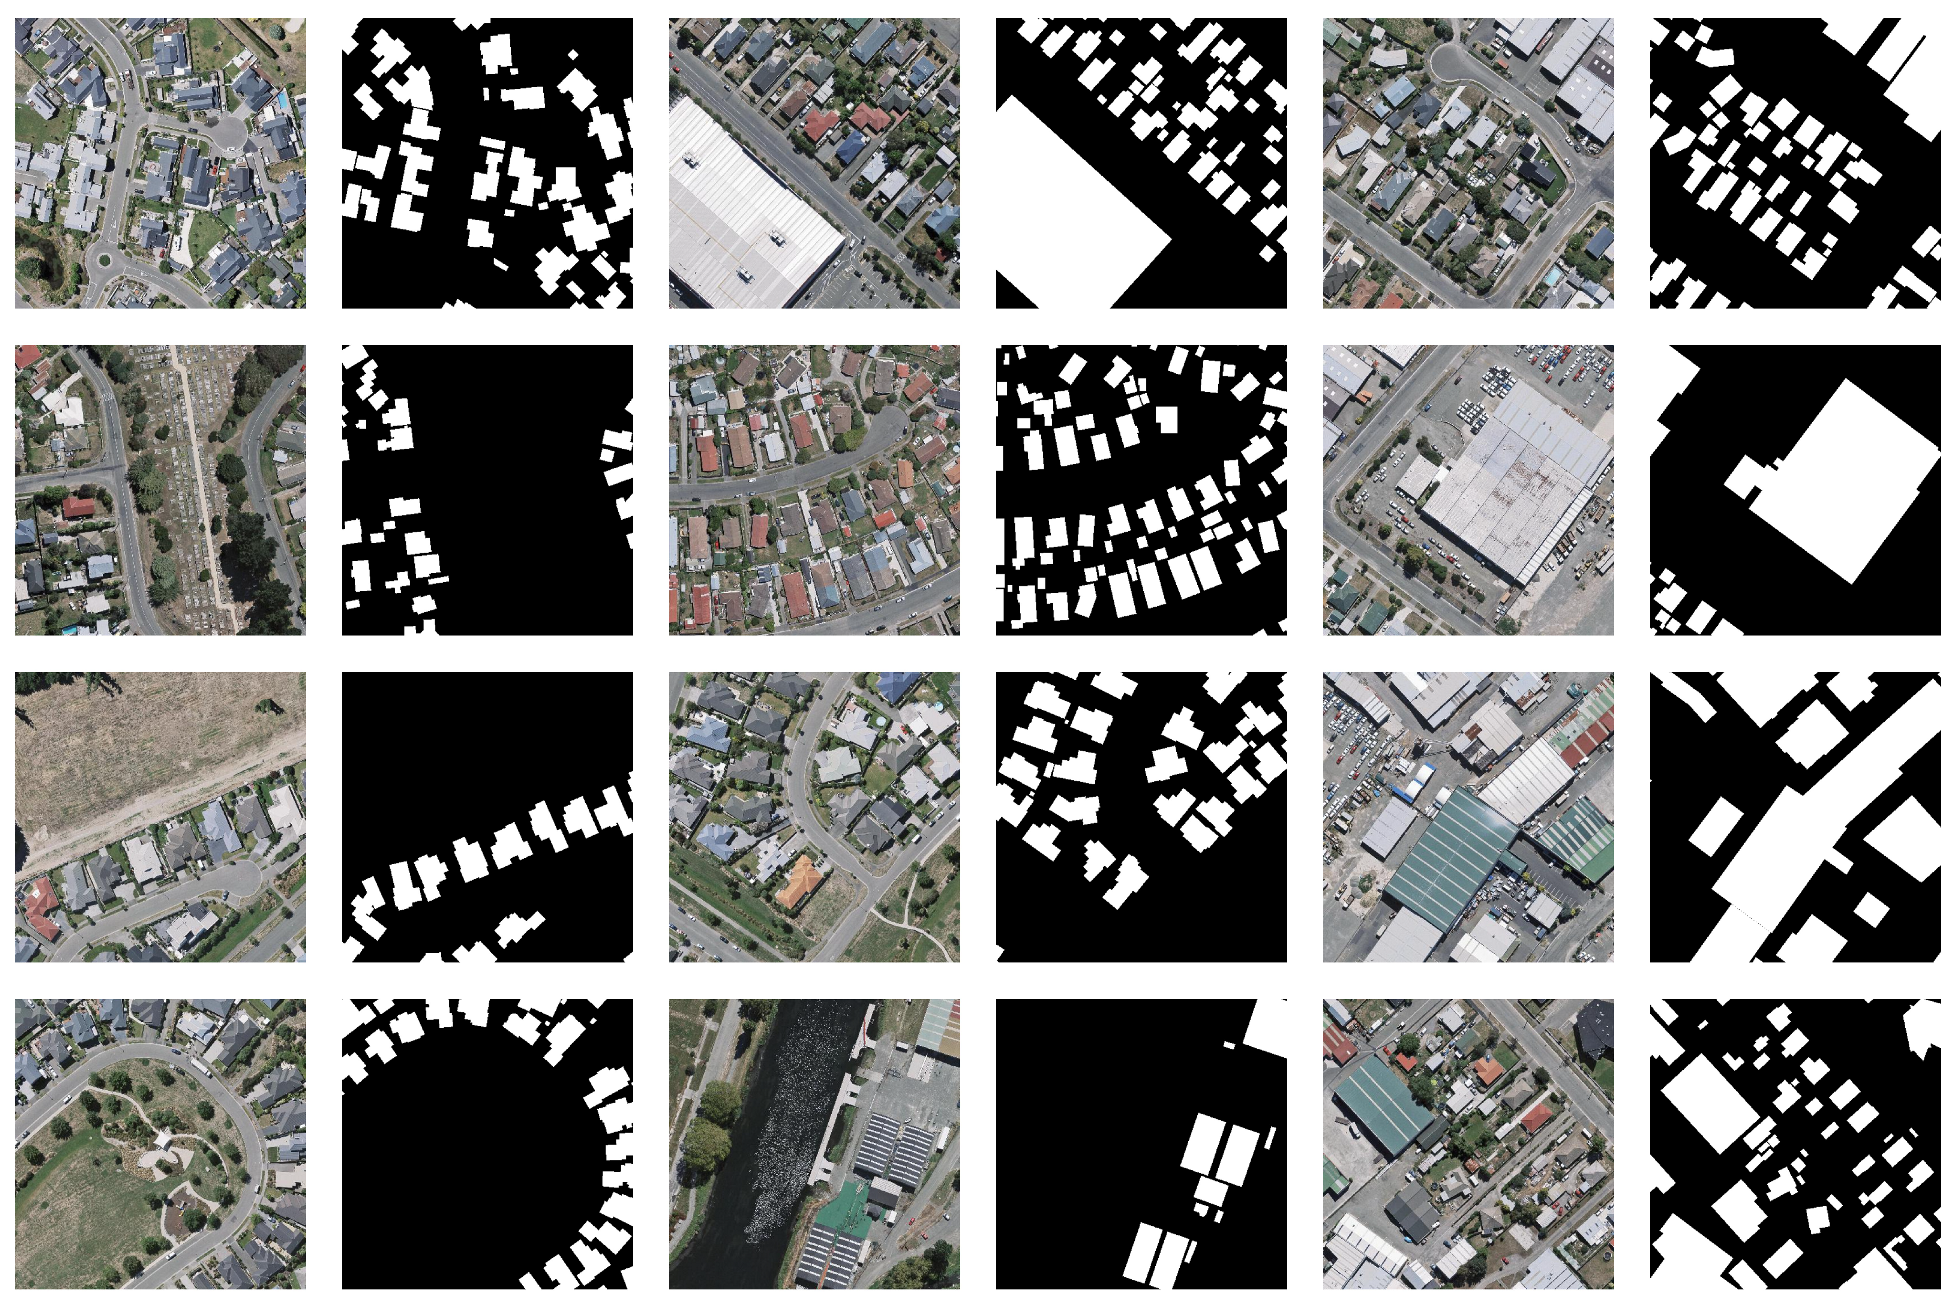
(1) WHU building dataset: The aerial imagery data originate from the New Zealand Land Information Service website; they were captured in Christchurch, New Zealand and cover an approximate area of 450 square kilometers. This dataset covers 187,000 buildings and has a spatial resolution of 0.3 m. It consists of 8189 images that are 512 × 512 in size. The dataset is divided into a training set (130,500 buildings, 4736 images), a validation set (14,500 buildings, 1036 images), and a test set (42,000 buildings, 2416 images). Furthermore, we computed that architectural pixels account for 15.4% of the dataset, while non-architectural pixels comprise 84.6% of the dataset. For subsequent experiments, the original dataset’s training–test split ratio was maintained. Some sample images from the dataset are shown in Figure 6.
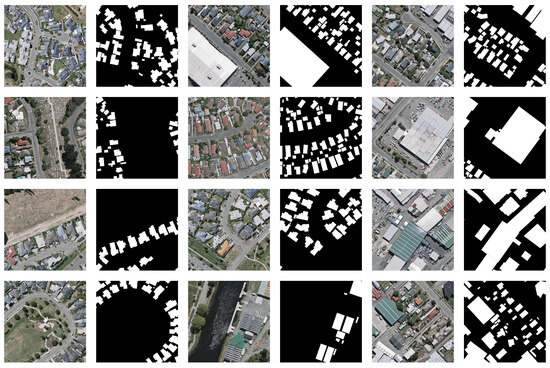
Figure 6.
Some building samples from the WHU building dataset.
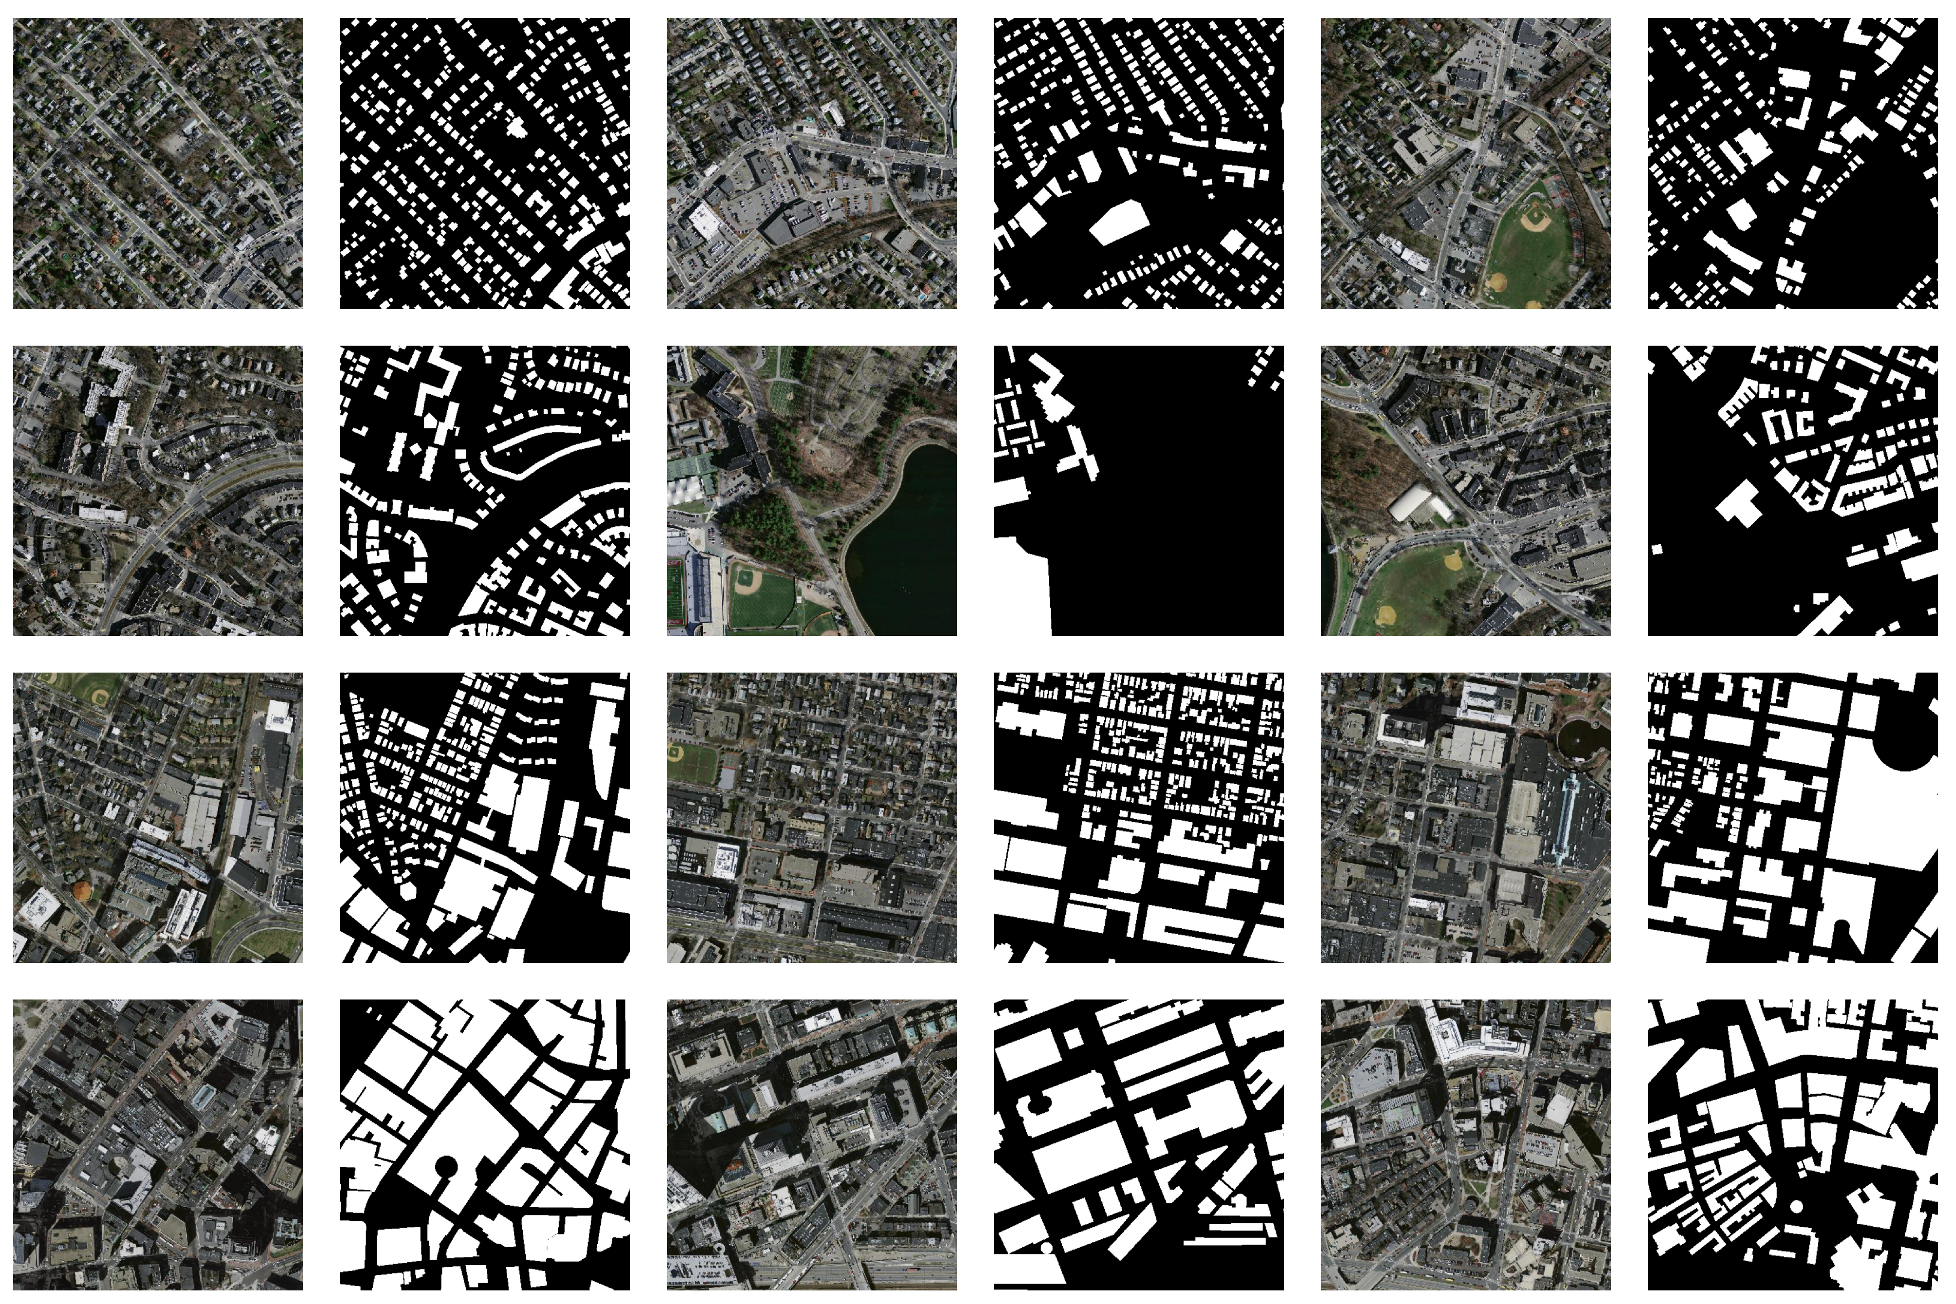
(2) Massachusetts building dataset: The dataset comprises 151 aerial images with a spatial resolution of 1 m in the Boston area. Each image has dimensions of 1500 × 1500 pixels: equivalent to an area of 2.25 square kilometers. Consequently, the entire dataset covers approximately 340 square kilometers. The dataset has been randomly divided into a training set consisting of 137 images, a test set consisting of ten images, and a validation set consisting of four images. This dataset mainly encompasses urban and suburban areas and includes buildings of various scales, such as detached houses and garages, all of which are labeled accordingly. Figure 7 depicts some representative regions from the Massachusetts building dataset.
3.2. Experimental Details
3.2.1. Experimental Settings
All experiments in this study were conducted using the MMSegmentation toolbox v0.29.0 [67] based on the PyTorch framework and implemented on a server equipped with an Intel(R) Core(TM) i7-8700 CPU and two NVIDIA GeForce RTX 2080 Ti 11G GPUs. Through multiple experiments and reference to the recommended configuration for the MMSegmentation toolbox, the following experimental settings were ultimately adopted. The polynomial decay learning strategy was employed, and the learning rate gradually decreased during training iterations until it reached 0.0001 at the end of training. The batch size was set to 4, and the stochastic gradient descent (SGD) was the selected optimizer, for which a random batch of samples is selected in each iteration to compute the gradient of the loss function and update the relevant parameters of the network model. A few parameters for SGD were set in the following manner: initial learning rate of 0.01, momentum of 0.9, and weight decay of 0.0005.
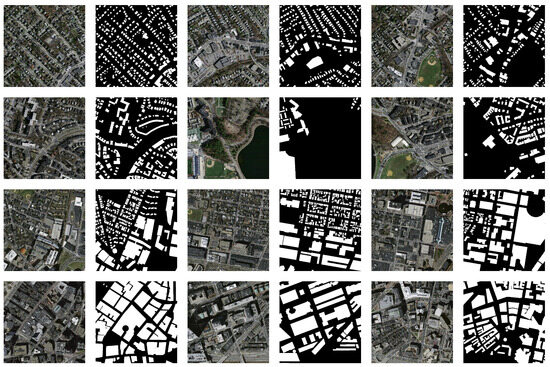
Figure 7.
Some building samples from the Massachusetts building dataset.
Figure 7.
Some building samples from the Massachusetts building dataset.
After extensive tuning, all models were trained for 100 and 150 epochs on the WHU dataset and Massachusetts dataset, respectively, ensuring convergence for each model. It is worth noting that to reduce memory consumption, the original images from the Massachusetts dataset were cropped to a size of 500 × 500. To prevent overfitting and to improve the robustness of the models, a series of methods such as random scaling and random flipping were applied to expand the datasets before training. The random-scaling ratio ranged from 0.5 to 2 times the size of the original image, and there was a 50% probability of applying random flipping to the image, which included both horizontal and vertical flips.
3.2.2. Evaluation Metrics
Intersection over union (), , , , and overall accuracy () are utilized as evaluation metrics. The mathematical expressions for each metric can be represented by Equations (6)–(9):
True positive () represents the number of correctly extracted building pixels. False positive () represents the number of non-building pixels mistakenly identified as building pixels. True negative () represents the number of correctly identified non-building pixels. False negative () represents the number of building pixels mistakenly classified as non-building pixels.
4. Experimental Results and Analysis
4.1. Ablation Study
This section analyzes the necessity of various modules in the network, including SIE and MLM modules. Ablation experiments were performed on the Massachusetts building dataset and the WHU building dataset. The results are shown in Table 1 and Table 2. The ablation experiments on both datasets more fully illustrate the importance of each module. As compared to the WHU building dataset, the Massachusetts dataset features lower resolution and more-complex building structures. Therefore, we provide detailed explanations regarding the experimental results centered around the Massachusetts dataset.

Table 1.
Ablation study results on the Massachusetts building dataset. Bold text indicates the result that performed the best.
Table 2.
Ablation study results on the WHU building dataset. Bold text indicates the result that performed the best.
The ResNet50-C backbone network is employed for the benchmark model of building extraction. In Table 1, it can be observed that we first verified the effectiveness of the SIE module. When utilizing the benchmark model for high-resolution building extraction, the corresponding OA, IoU, and F1-score were 92.73%, 66.06%, and 79.56%, respectively. When employing the SIE module for multi-scale semantic information extraction, the OA, IoU, and F1-score were 92.81%, 66.73%, and 80.05%, respectively. This represents an improvement of 0.08%, 0.67%, and 0.49% over the benchmark. These results indicate that the SIE module effectively captures multi-scale contextual information of buildings in the images, thereby enhancing the performance of building extraction.
Subsequently, upon employing the MLM module to filter detailed information, the OA, IoU, and F1-score were measured at 93.53%, 69.33%, and 81.89%, respectively. This demonstrates an improvement of 0.8%, 3.27%, and 2.33% over the benchmark model. It can be inferred that the MLM module effectively restores the fine-grained details of the buildings. Next, the SIE and MLM modules are both incorporated into the network model, which is the architecture proposed in this paper. With the combined modules, all evaluation metrics reached their highest values, at 94.05%, 71.6%, and 83.45%, respectively. This represents an improvement of 1.32%, 5.54%, and 3.89% compared to the benchmark model. These results validate the effectiveness of each module presented in this paper for the task of building extraction.
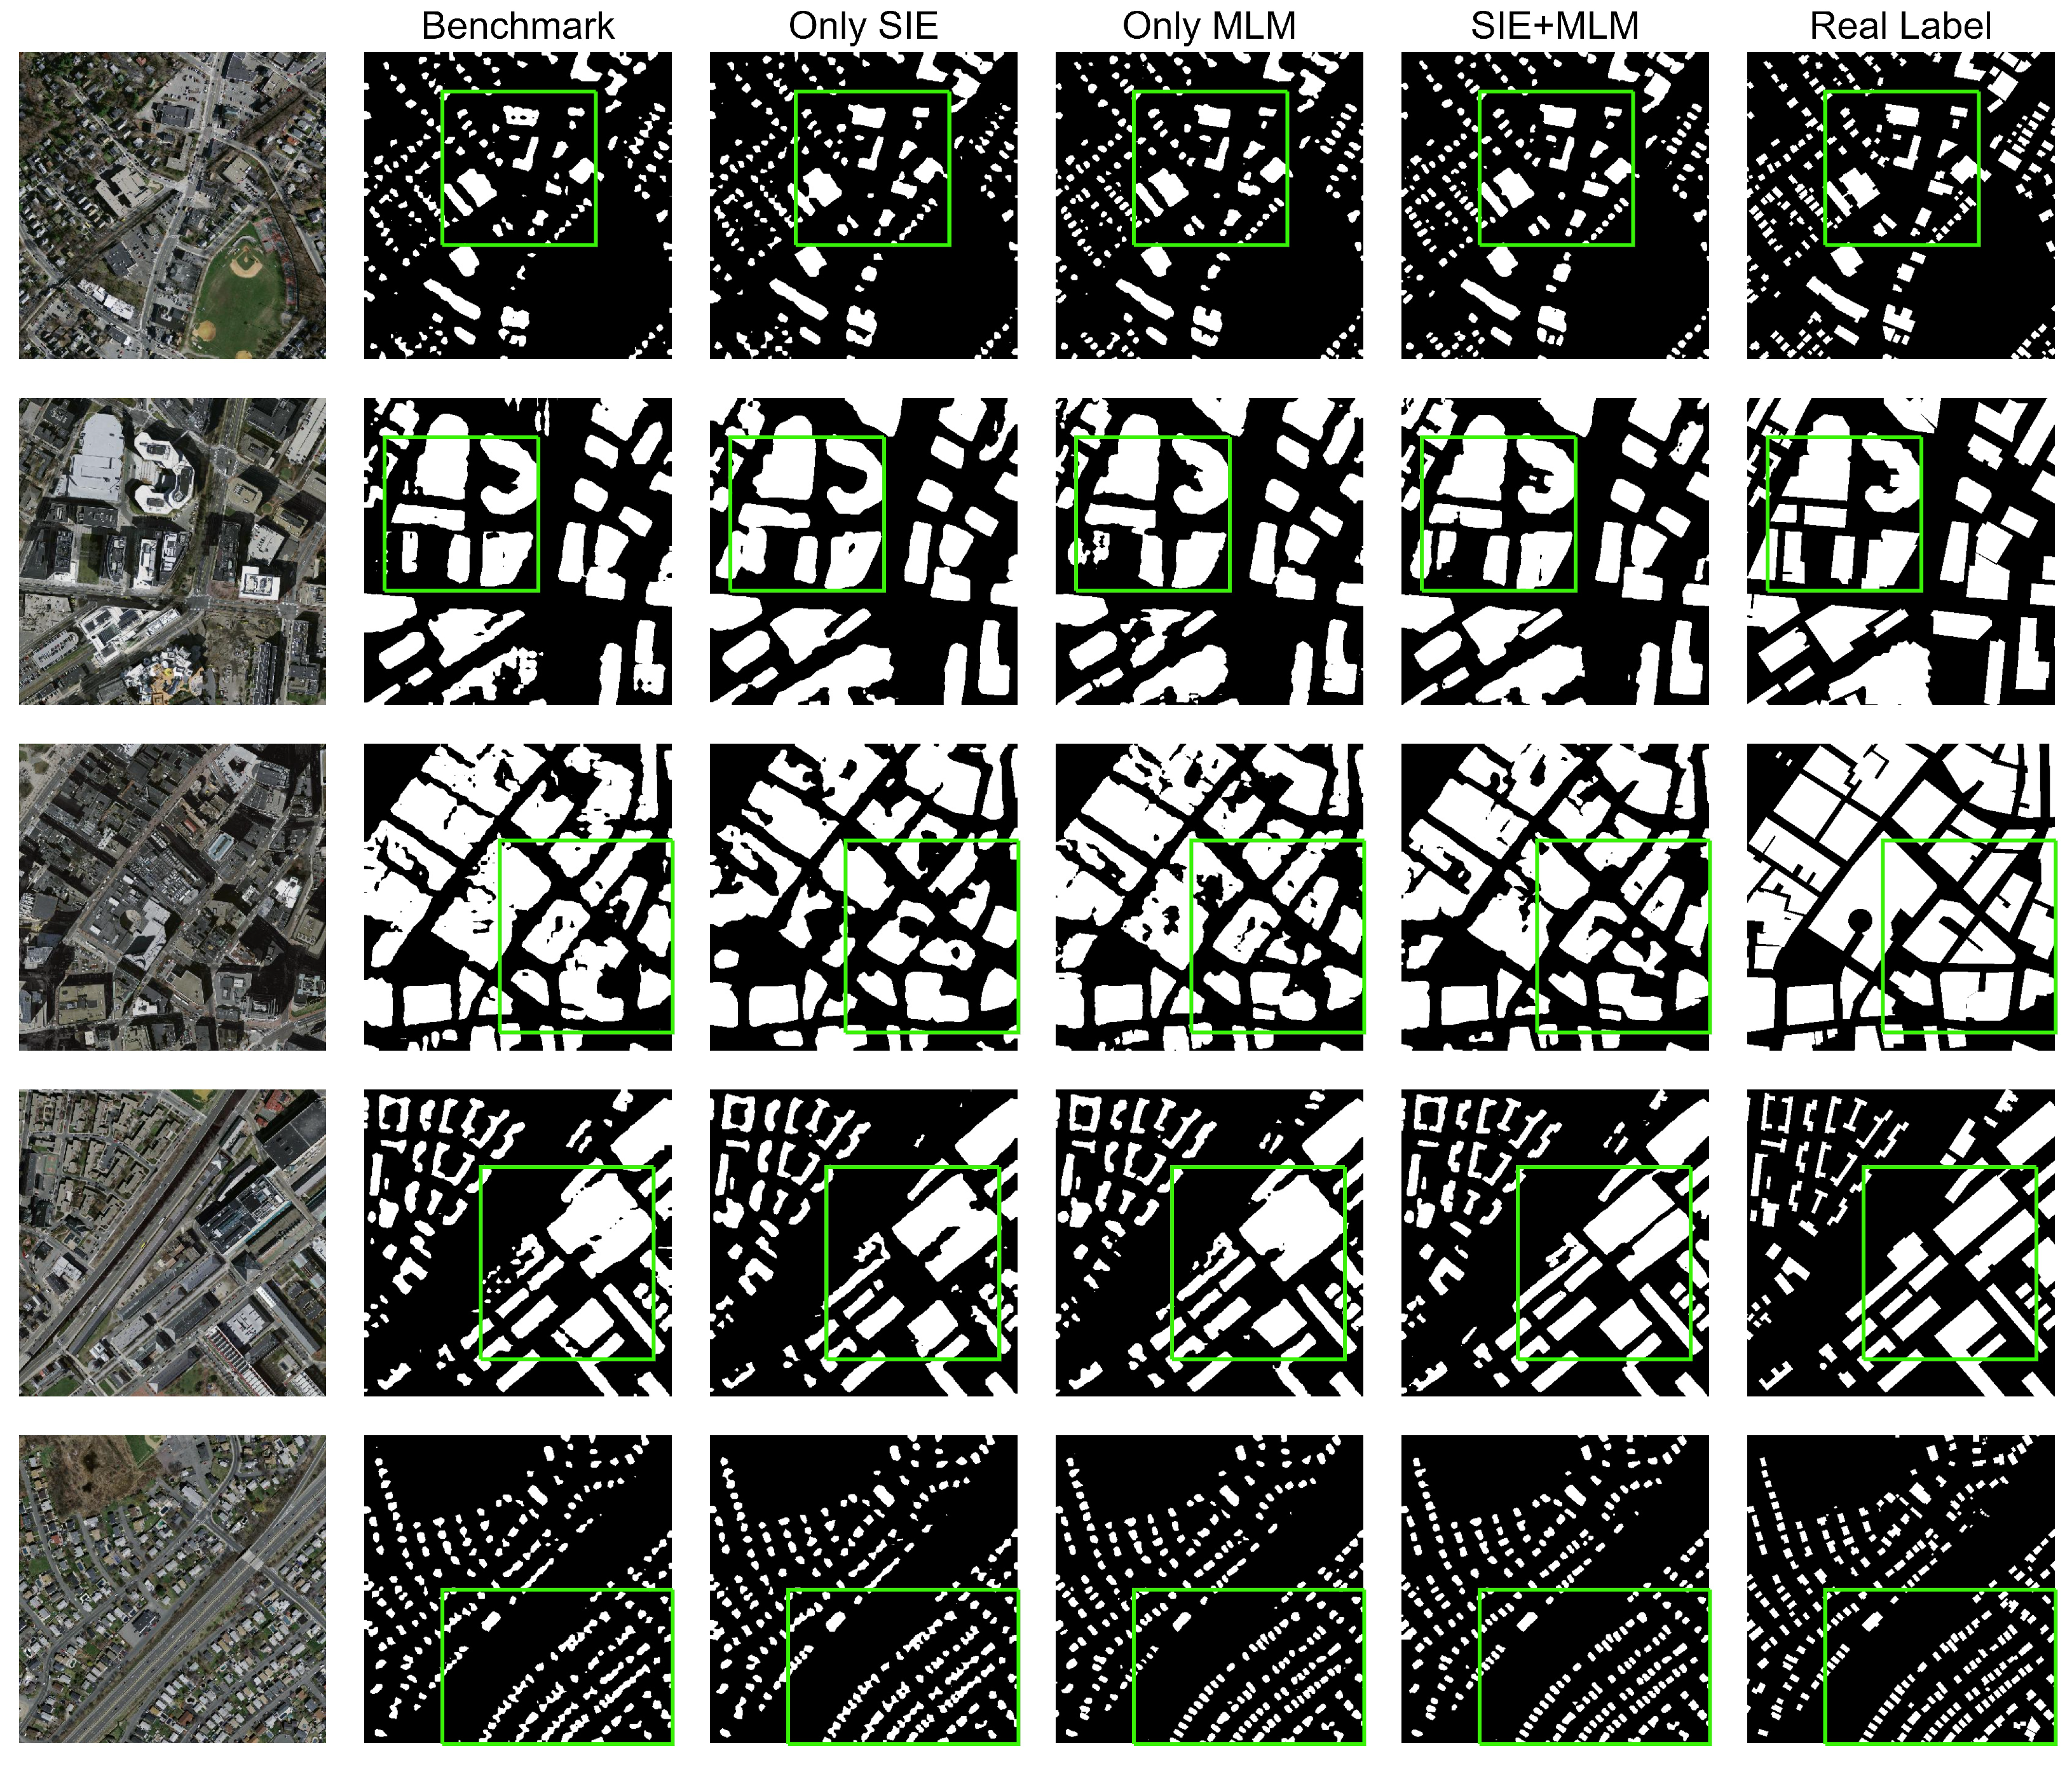
The visual results depicted in Figure 8 demonstrate that the incorporation of both the SIE and MLM modules can significantly enhance the predictive accuracy of building extraction. Moreover, these modules exhibit remarkable effectiveness at recognizing irregular clusters of buildings. This further underscores the undeniable contributions made by each module in the overall model.
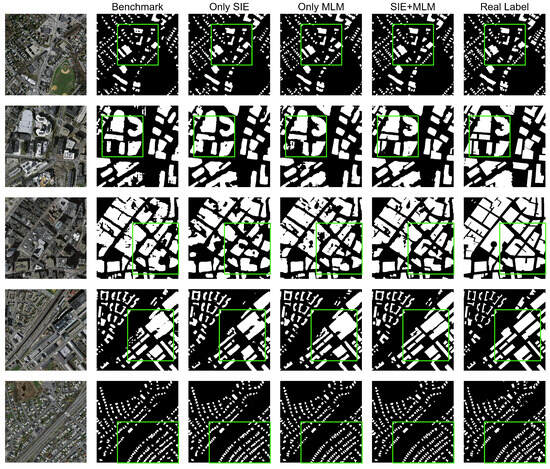
Figure 8.
Visualization of ablation study results based on the Massachusetts building dataset.
Figure 8.
Visualization of ablation study results based on the Massachusetts building dataset.
4.2. Comparative Experiment Analysis
In this study, advanced and widely recognized methods are selected in order to conduct quantitative and qualitative comparisons with SDSNet. The comparative models include DANet, Deeplabv3, Deeplabv3+, object-contextual representations network (OCRNet) [68], PSPNet, Segformer-b5, and U-Net, which represent some traditional semantic segmentation methods, as well as MAP-Net, BuildFormer [69], dual spatial attention transformer net (DSAT-Net) [70], shunted dual skip connection UNet (SDSC-UNet) [71], and STT, which are specifically designed for architectural extraction. All the traditional semantic segmentation model methods were experimented and analyzed on both the WHU building dataset and the Massachusetts building dataset. However, due to variations in how the Massachusetts building dataset is divided in various studies, we conducted experiments only on the WHU dataset for the methods specifically designed for architectural extraction in order to ensure fairness.
4.2.1. Experiments on the WHU Building Dataset
Table 3 vividly presents the results of the comparative experiments. Our model achieved the best performance in terms of OA (98.86%), IoU (90.17%), and F1-score (94.83%). It outperformed U-Net and DeeplabV3+, which were the two highest-performing semantic segmentation networks, by margins of 0.22% and 0.17% in OA, 1.79% and 1.3% in IoU, 1.42% and 0.7% in recall, and 1% and 0.72% in F1-score, respectively. While our model’s precision was slightly lower than that of OCRNet, F1-score is a more persuasive metric, as it considers both recall and precision when evaluating the performance of building extraction models. In addition to comparison with these excellent semantic segmentation models, a full comparison with building extraction models from recent studies was also performed. From the table, it can be observed that SDSNet showed slight performance improvements over MAP-Net and SDSC-UNet. Additionally, compared to other excellent methods, SDSNet achieved improvements of 1.57–3.16% in IOU, 0.87–1.77% in F1-score, 1.52–1.92% in recall, and 0.79–2.1% in precision. This shows that, whether compared to approaches used in recent studies or with conventional method, our method has a few improvements.
Table 3.
On the WHU building dataset, comparisons were made with some well-known image segmentation methods and cutting-edge building extraction techniques. The technologies listed in the second row are all for certain building extraction tasks. Bold text indicates the result that performed the best.
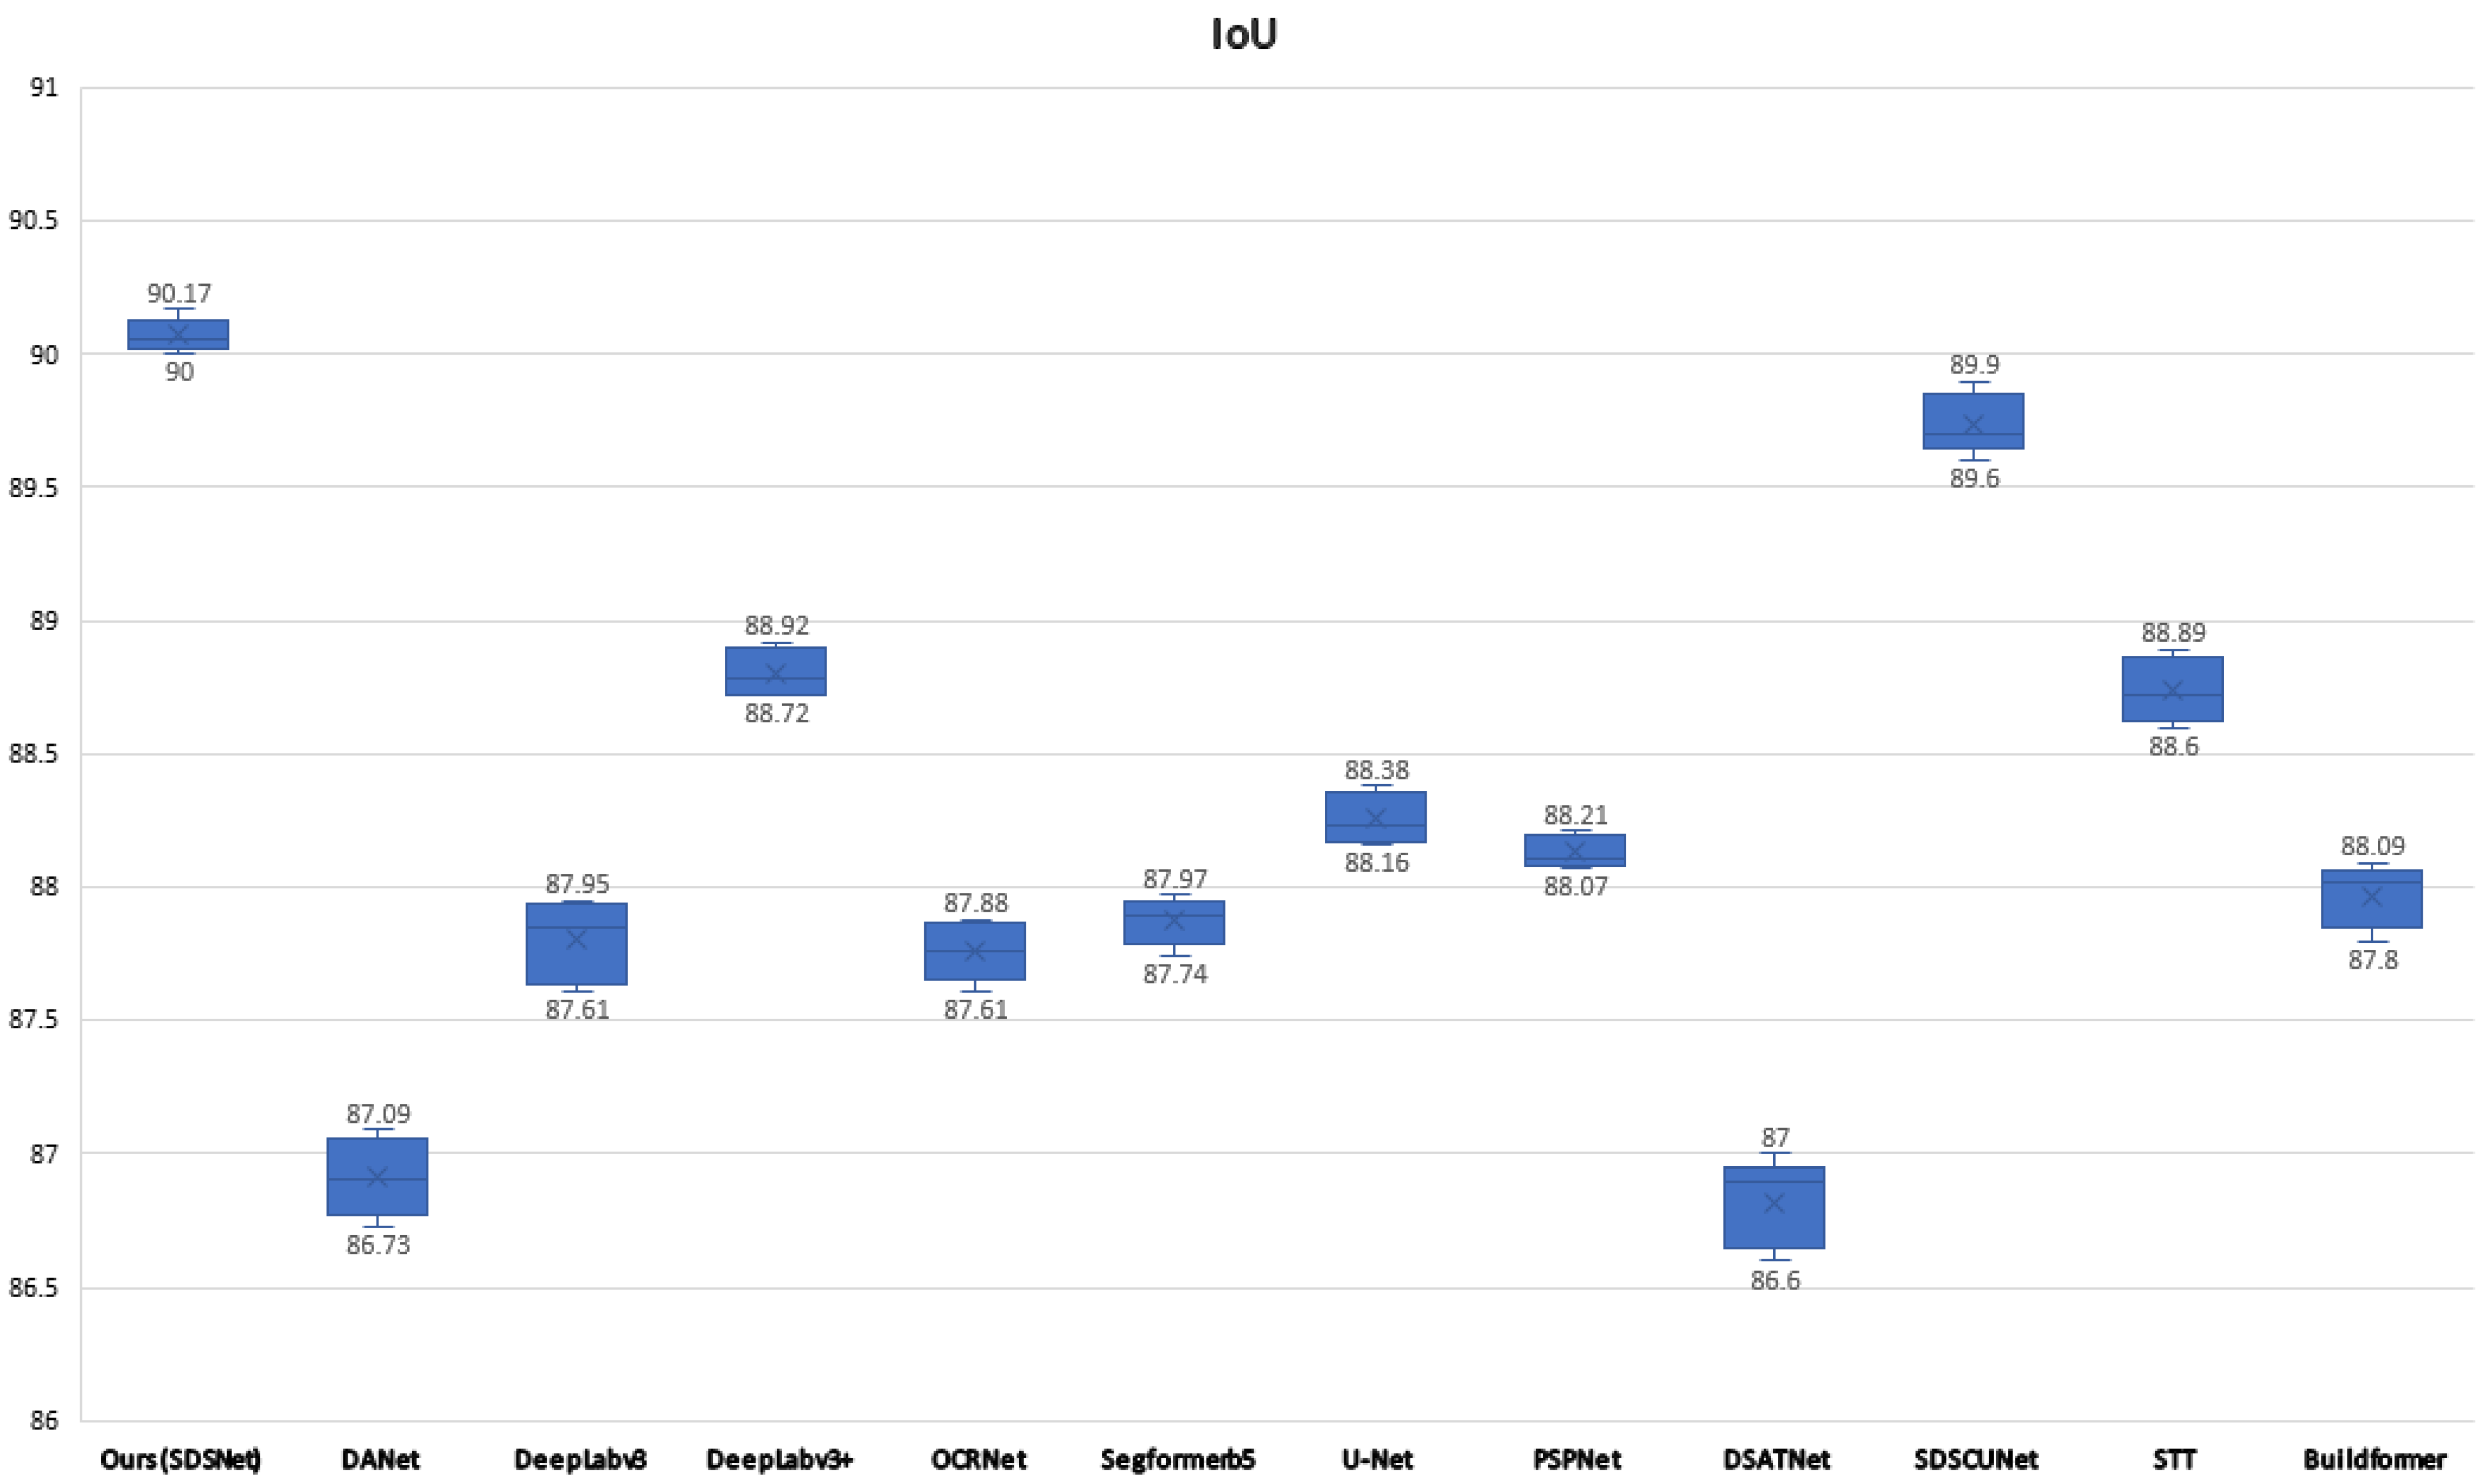
In order to highlight the superiority of our model objectively and to reduce the randomness of comparative experiments. We did a number of repeated experiments and plotted box plots in Figure 9. As can be seen from the figure, after many experiments, the model in this paper outperforms other models on IoU, including some current SOTA models such as DSTANet, SDSC-UNet, STT, and BuildFormer.

Figure 9.
IoUs of different models on the WHU dataset as represented by box plots.
4.2.2. Experiments on the Massachusetts Building Dataset
Table 4 presents the segmentation performance of various models based on the Massachusetts building dataset. Compared to the WHU building dataset, this dataset suffers from lower resolution and a smaller proportion of individual buildings within the images. Consequently, there is a higher likelihood of feature disappearance during the process of feature extraction, resulting in reduced accuracy and making it more challenging to identify buildings. However, according to Table 4, our proposed model still surpasses the current state-of-the-art models: achieving an OA of 94.05%, an IoU of 71.6%, a recall of 80.67%, and an F1-score of 83.45%. Compared to DANet, Deeplabv3+, Segformer-b5, and U-Net, our model demonstrates improvements in these metrics of 0.23% to 1.11%, 1.06% to 4.63%, 1.11% to 3.96%, and 0.73% to 3.23%, respectively. This firmly establishes the superior adaptability of SDSNet over other methods for complex scenarios.
Table 4.
Comparative results on the Massachusetts building dataset. Bold text indicates the result that performed the best.
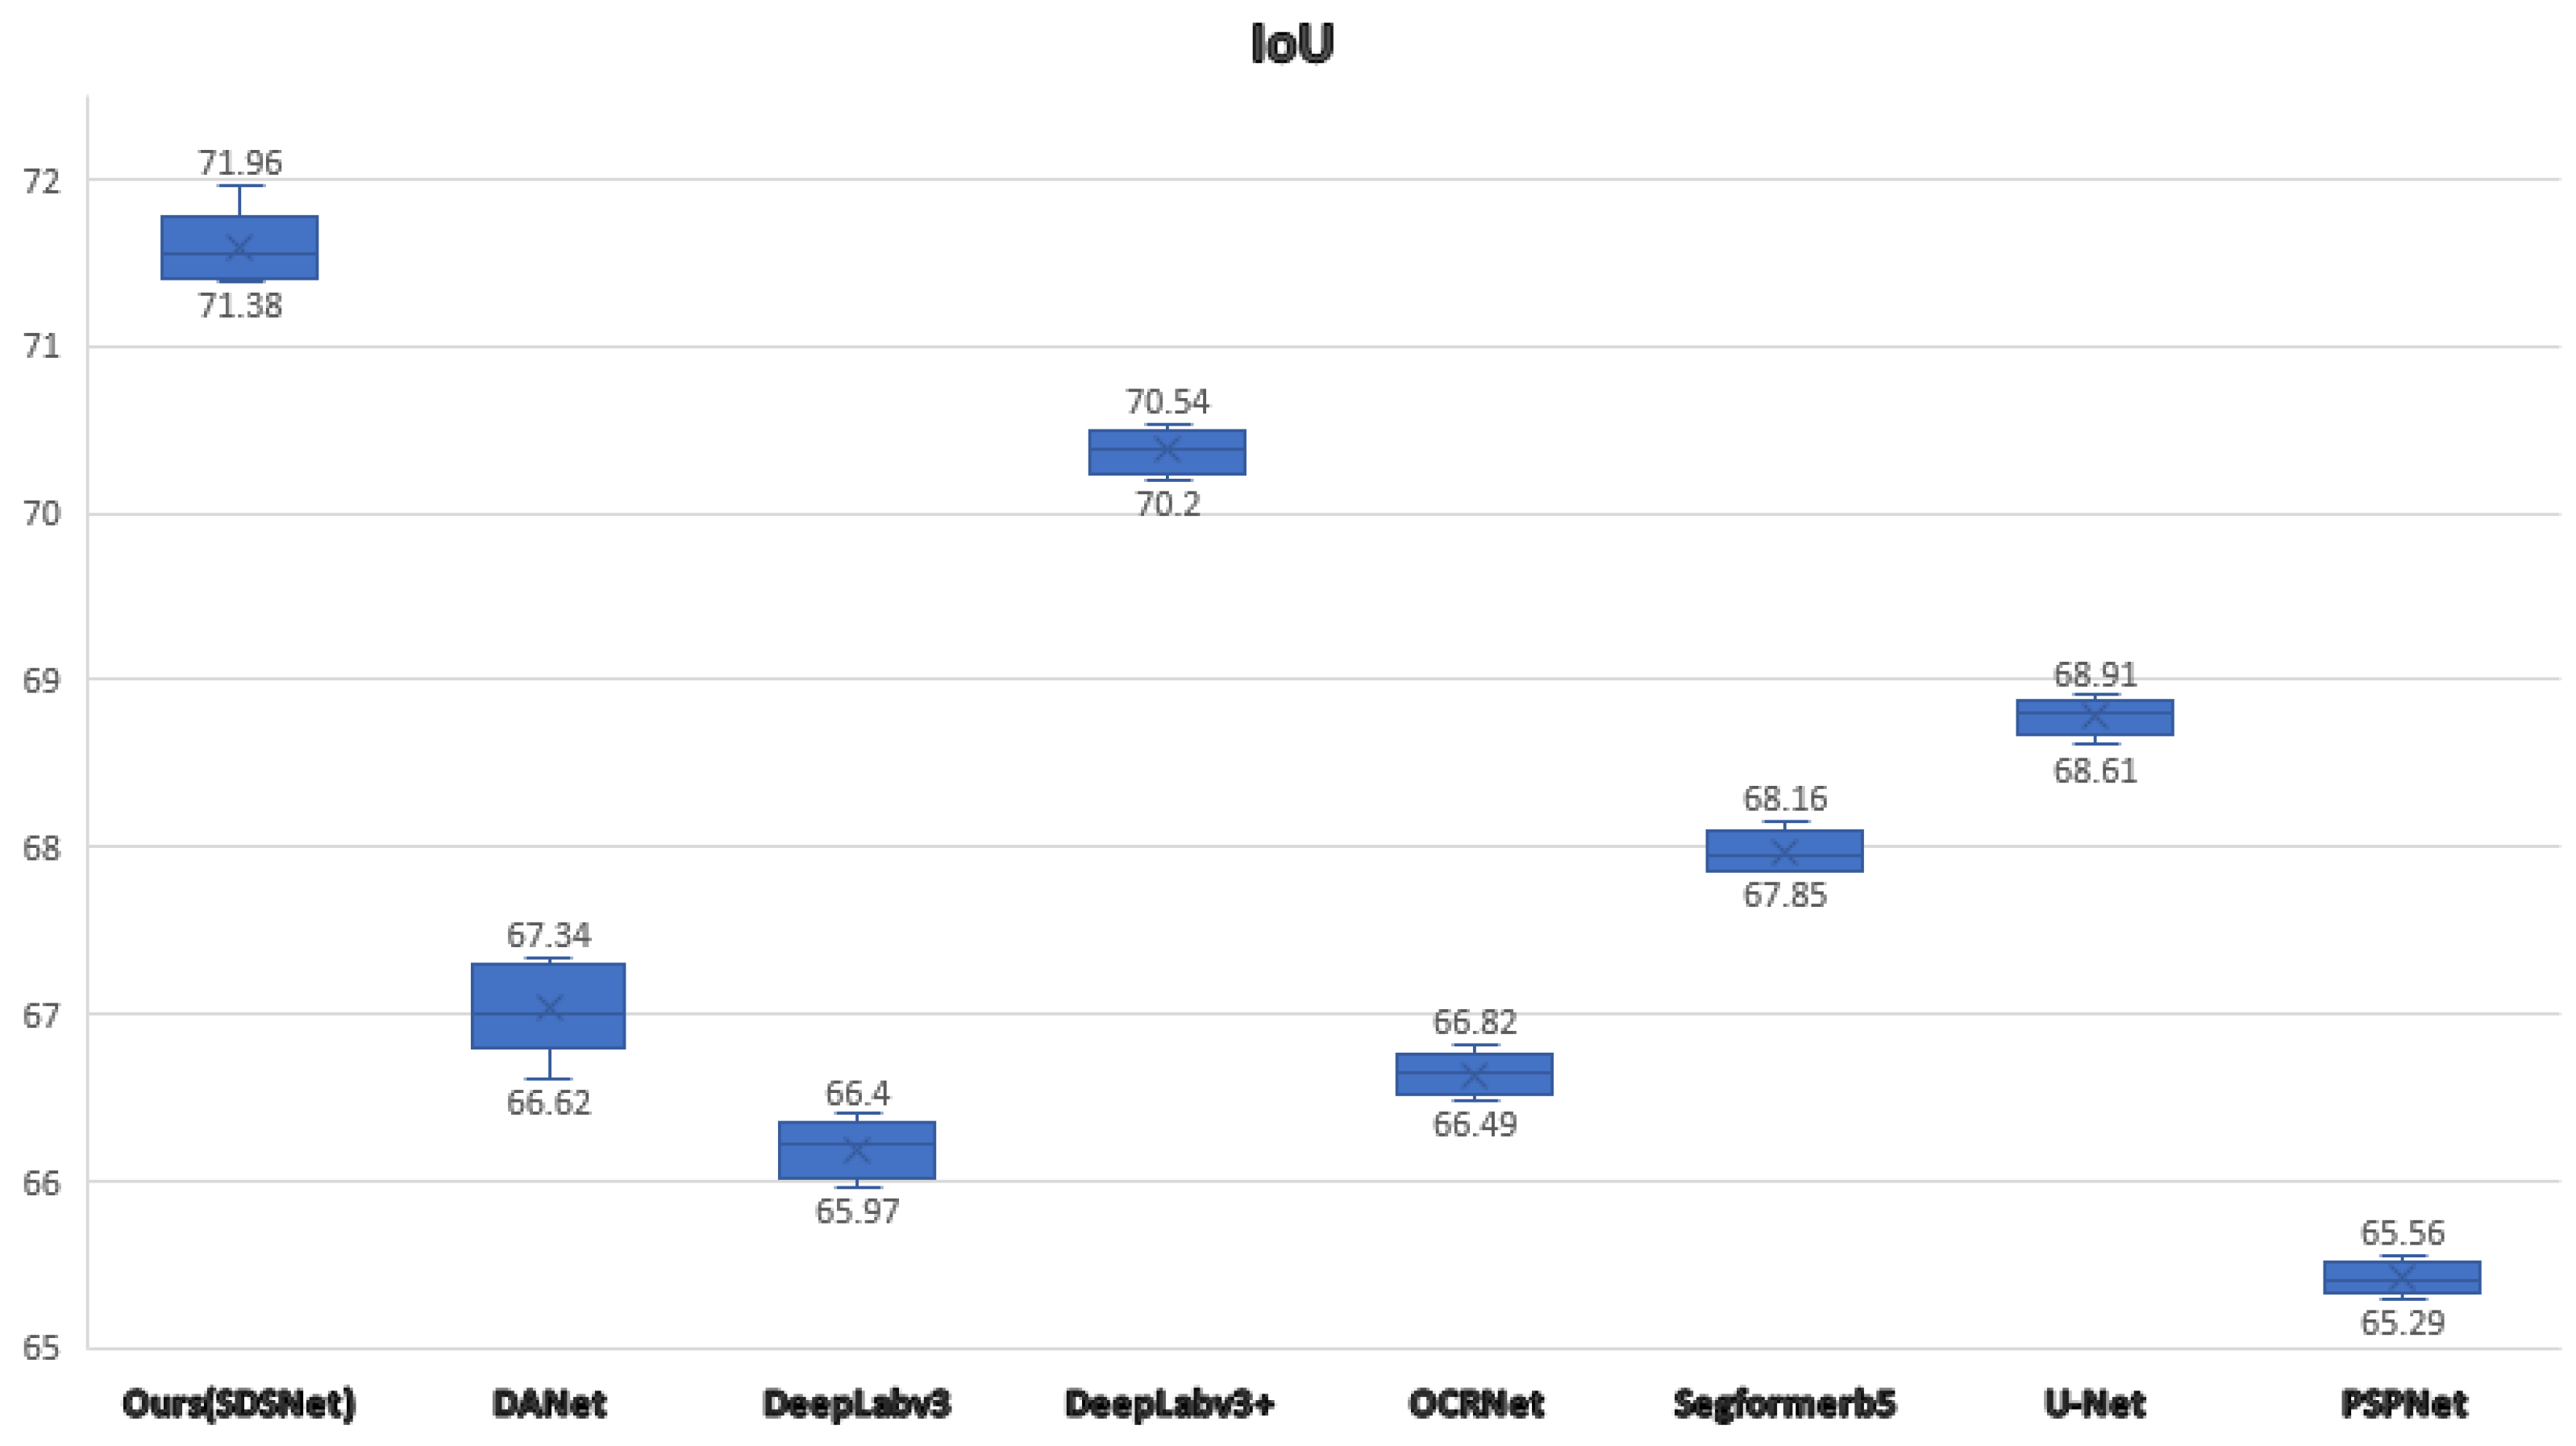
It is worth mentioning that we have also conducted multiple comparative experiments and plotted box plots in Figure 10 to objectively highlight the superiority of SDSNet on the Massachusetts dataset.
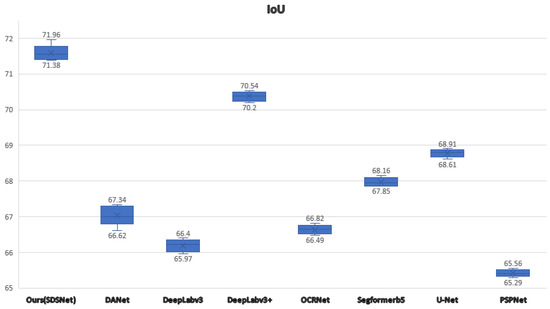
Figure 10.
IoUs of different models on the Massachusetts dataset as represented by box plots.
5. Discussion
5.1. Visualization Analysis
5.1.1. Visualization Analysis on the WHU Building Dataset
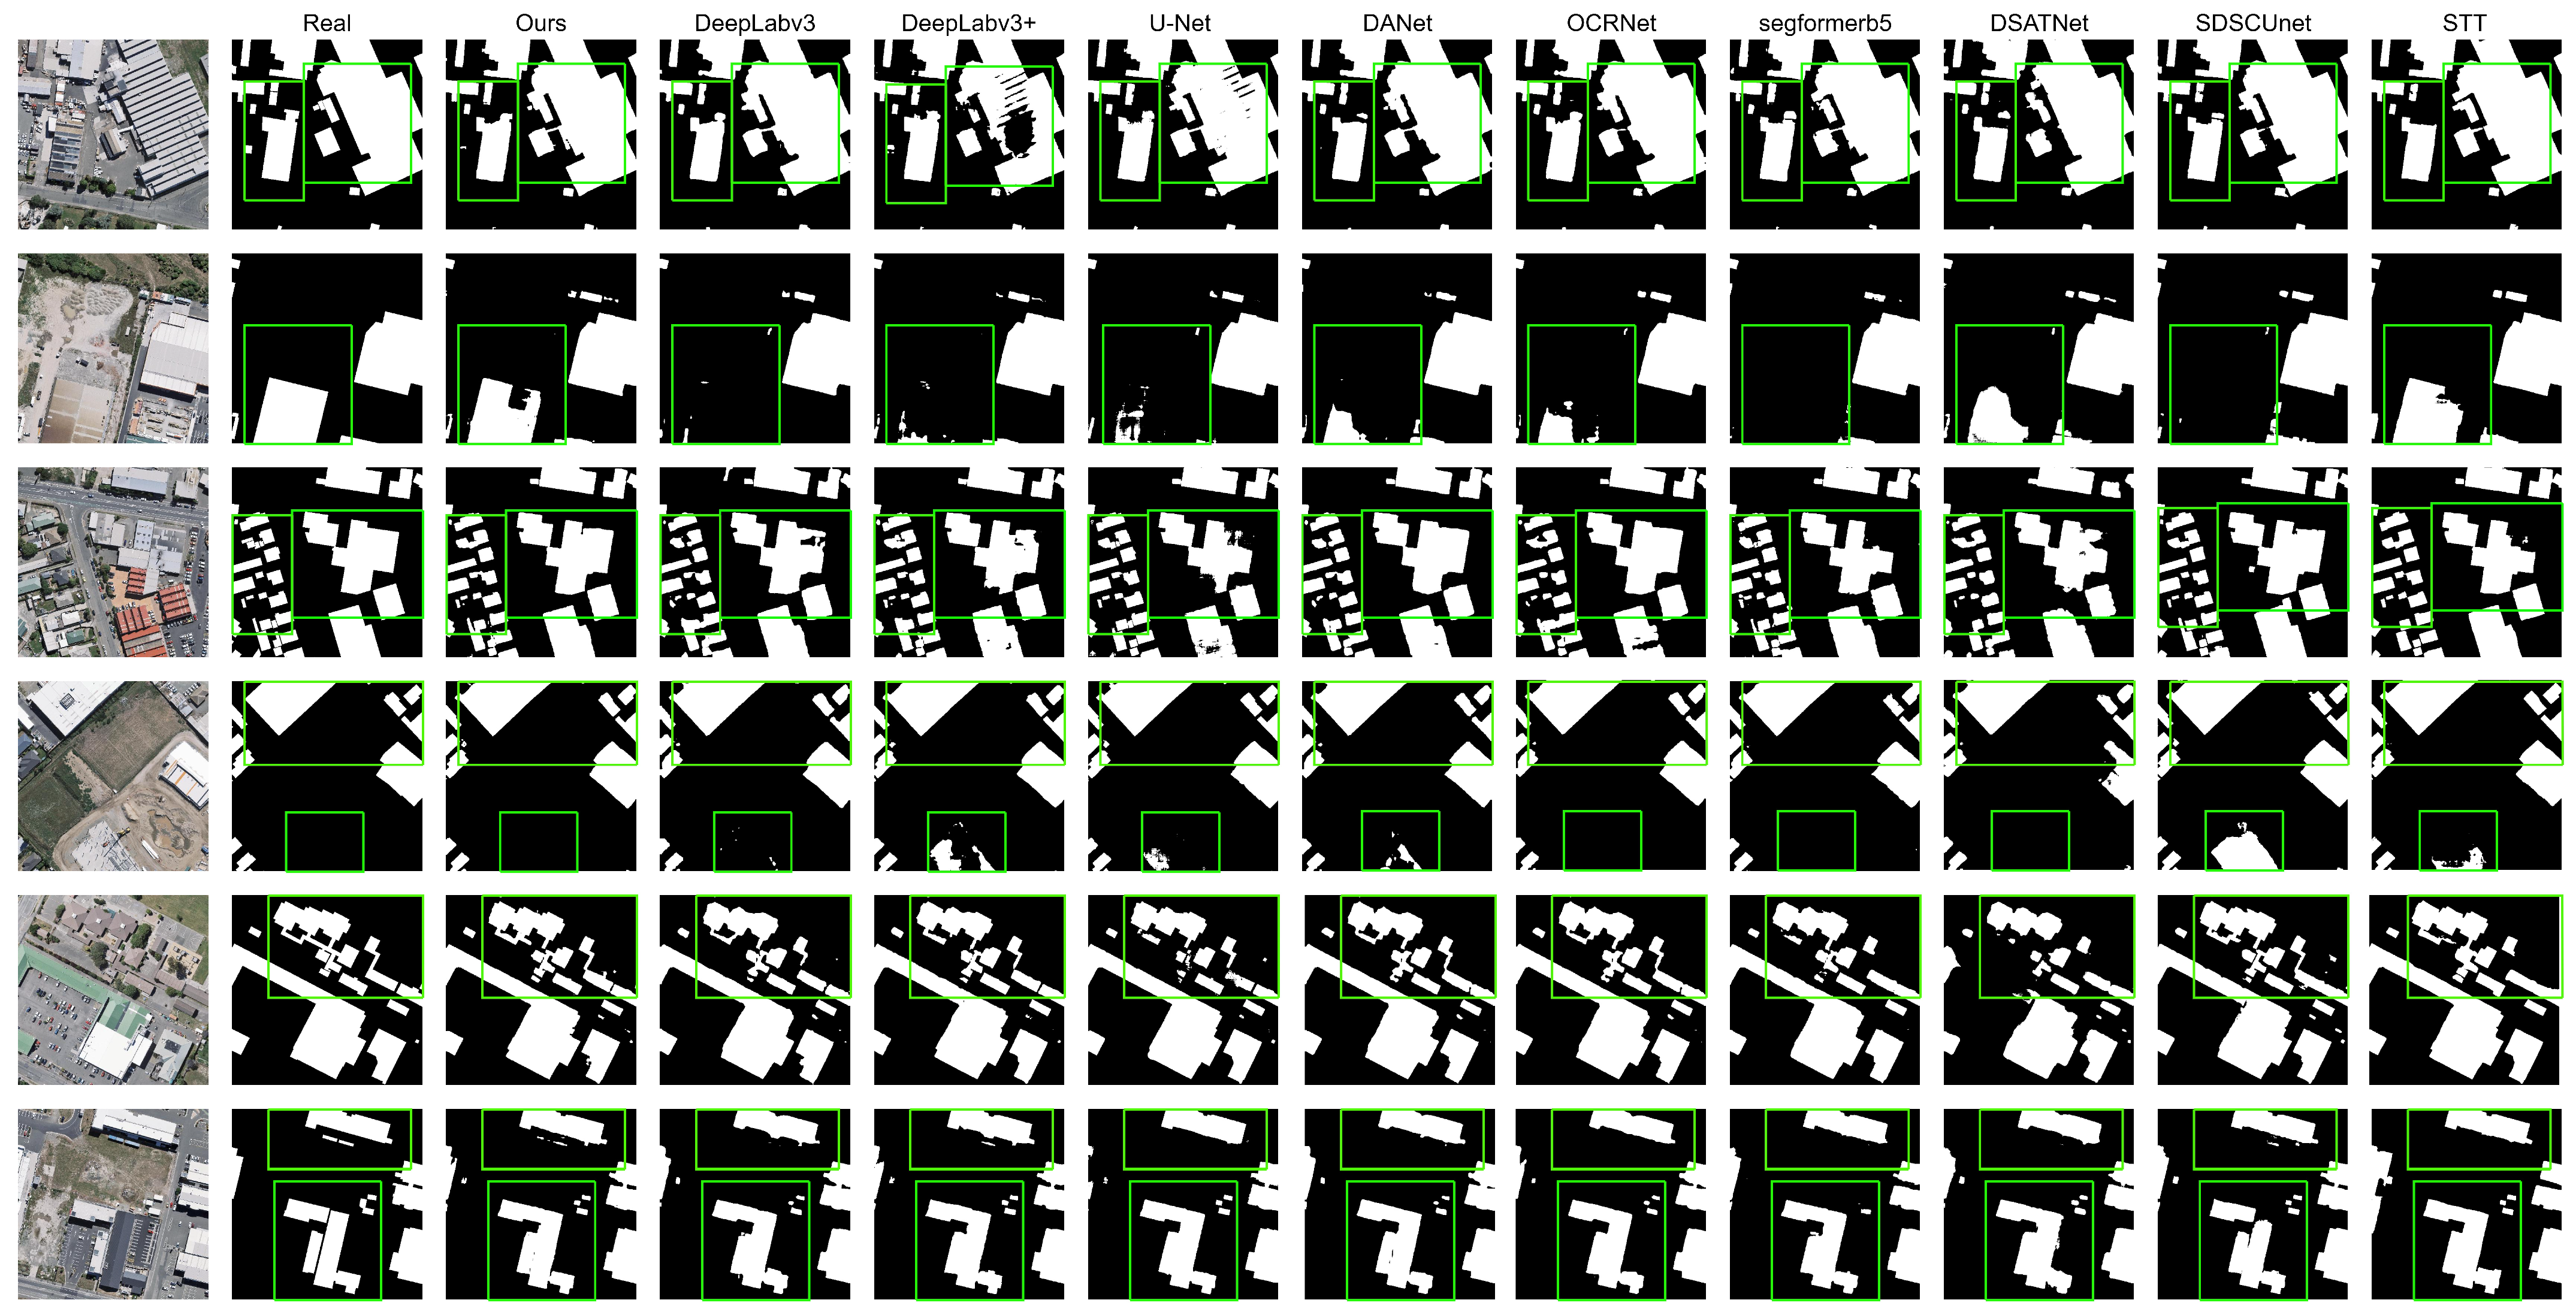
To visually evaluate the building extraction performance of SDSNet, a visualization analysis is conducted, as shown in Figure 11. In these images, different networks that performed exceptionally well in the comparative experiments section are selected for visual presentation. From left to right, they include the ground-truth images, ground-truth labels, and the building extraction results of SDSNet, Deeplabv3, Deeplabv3+, U-Net, DANet, OCRNet, Segformer-b5, DSAT-Net, SDSC-UNet, and STT. In contrast to models that only utilize multi-scale approaches, such as Deeplabv3, SDSNet incorporates the MLM module on top of multi-scale techniques, enabling the capture of more-intricate building features. Unlike the simpler concatenation of low-level features seen in Deeplabv3+ and U-Net, the MLM module demonstrates superiority by filtering out cluttered backgrounds while extracting more-relevant details pertaining to buildings.
As shown in the first, second, and third rows of Figure 11, when faced with buildings of varying sizes, the SIE module of SDSNet captures relevant features of the buildings at different scales and successfully extracts the building contours while preserving internal integrity. In the fourth row, it can be observed that most comparative models incorrectly identify the ground object at the bottom as a building, whereas SDSNet accurately recognizes it as non-building. In the fifth and sixth rows, due to irrelevant information such as tree cover and shadows around the buildings, other models fail to accurately extract the building boundaries. In contrast, SDSNet, aided by the MLM module, which filters information, accurately extracts the building boundary information.
Based on the visualizations, it can be concluded that SDSNet outperforms the aforementioned baselines. With its superior capability to capture multi-scale contextual information and filter detailed features, SDSNet successfully preserves the integrity of building interiors and accurately represents edge details.
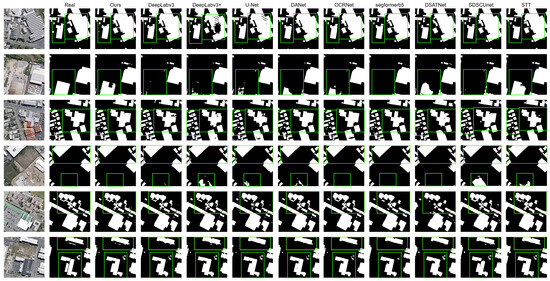
Figure 11.
Visualization of comparative results on the WHU building dataset.
Figure 11.
Visualization of comparative results on the WHU building dataset.
5.1.2. Visualization Analysis on the Massachusetts Building Dataset
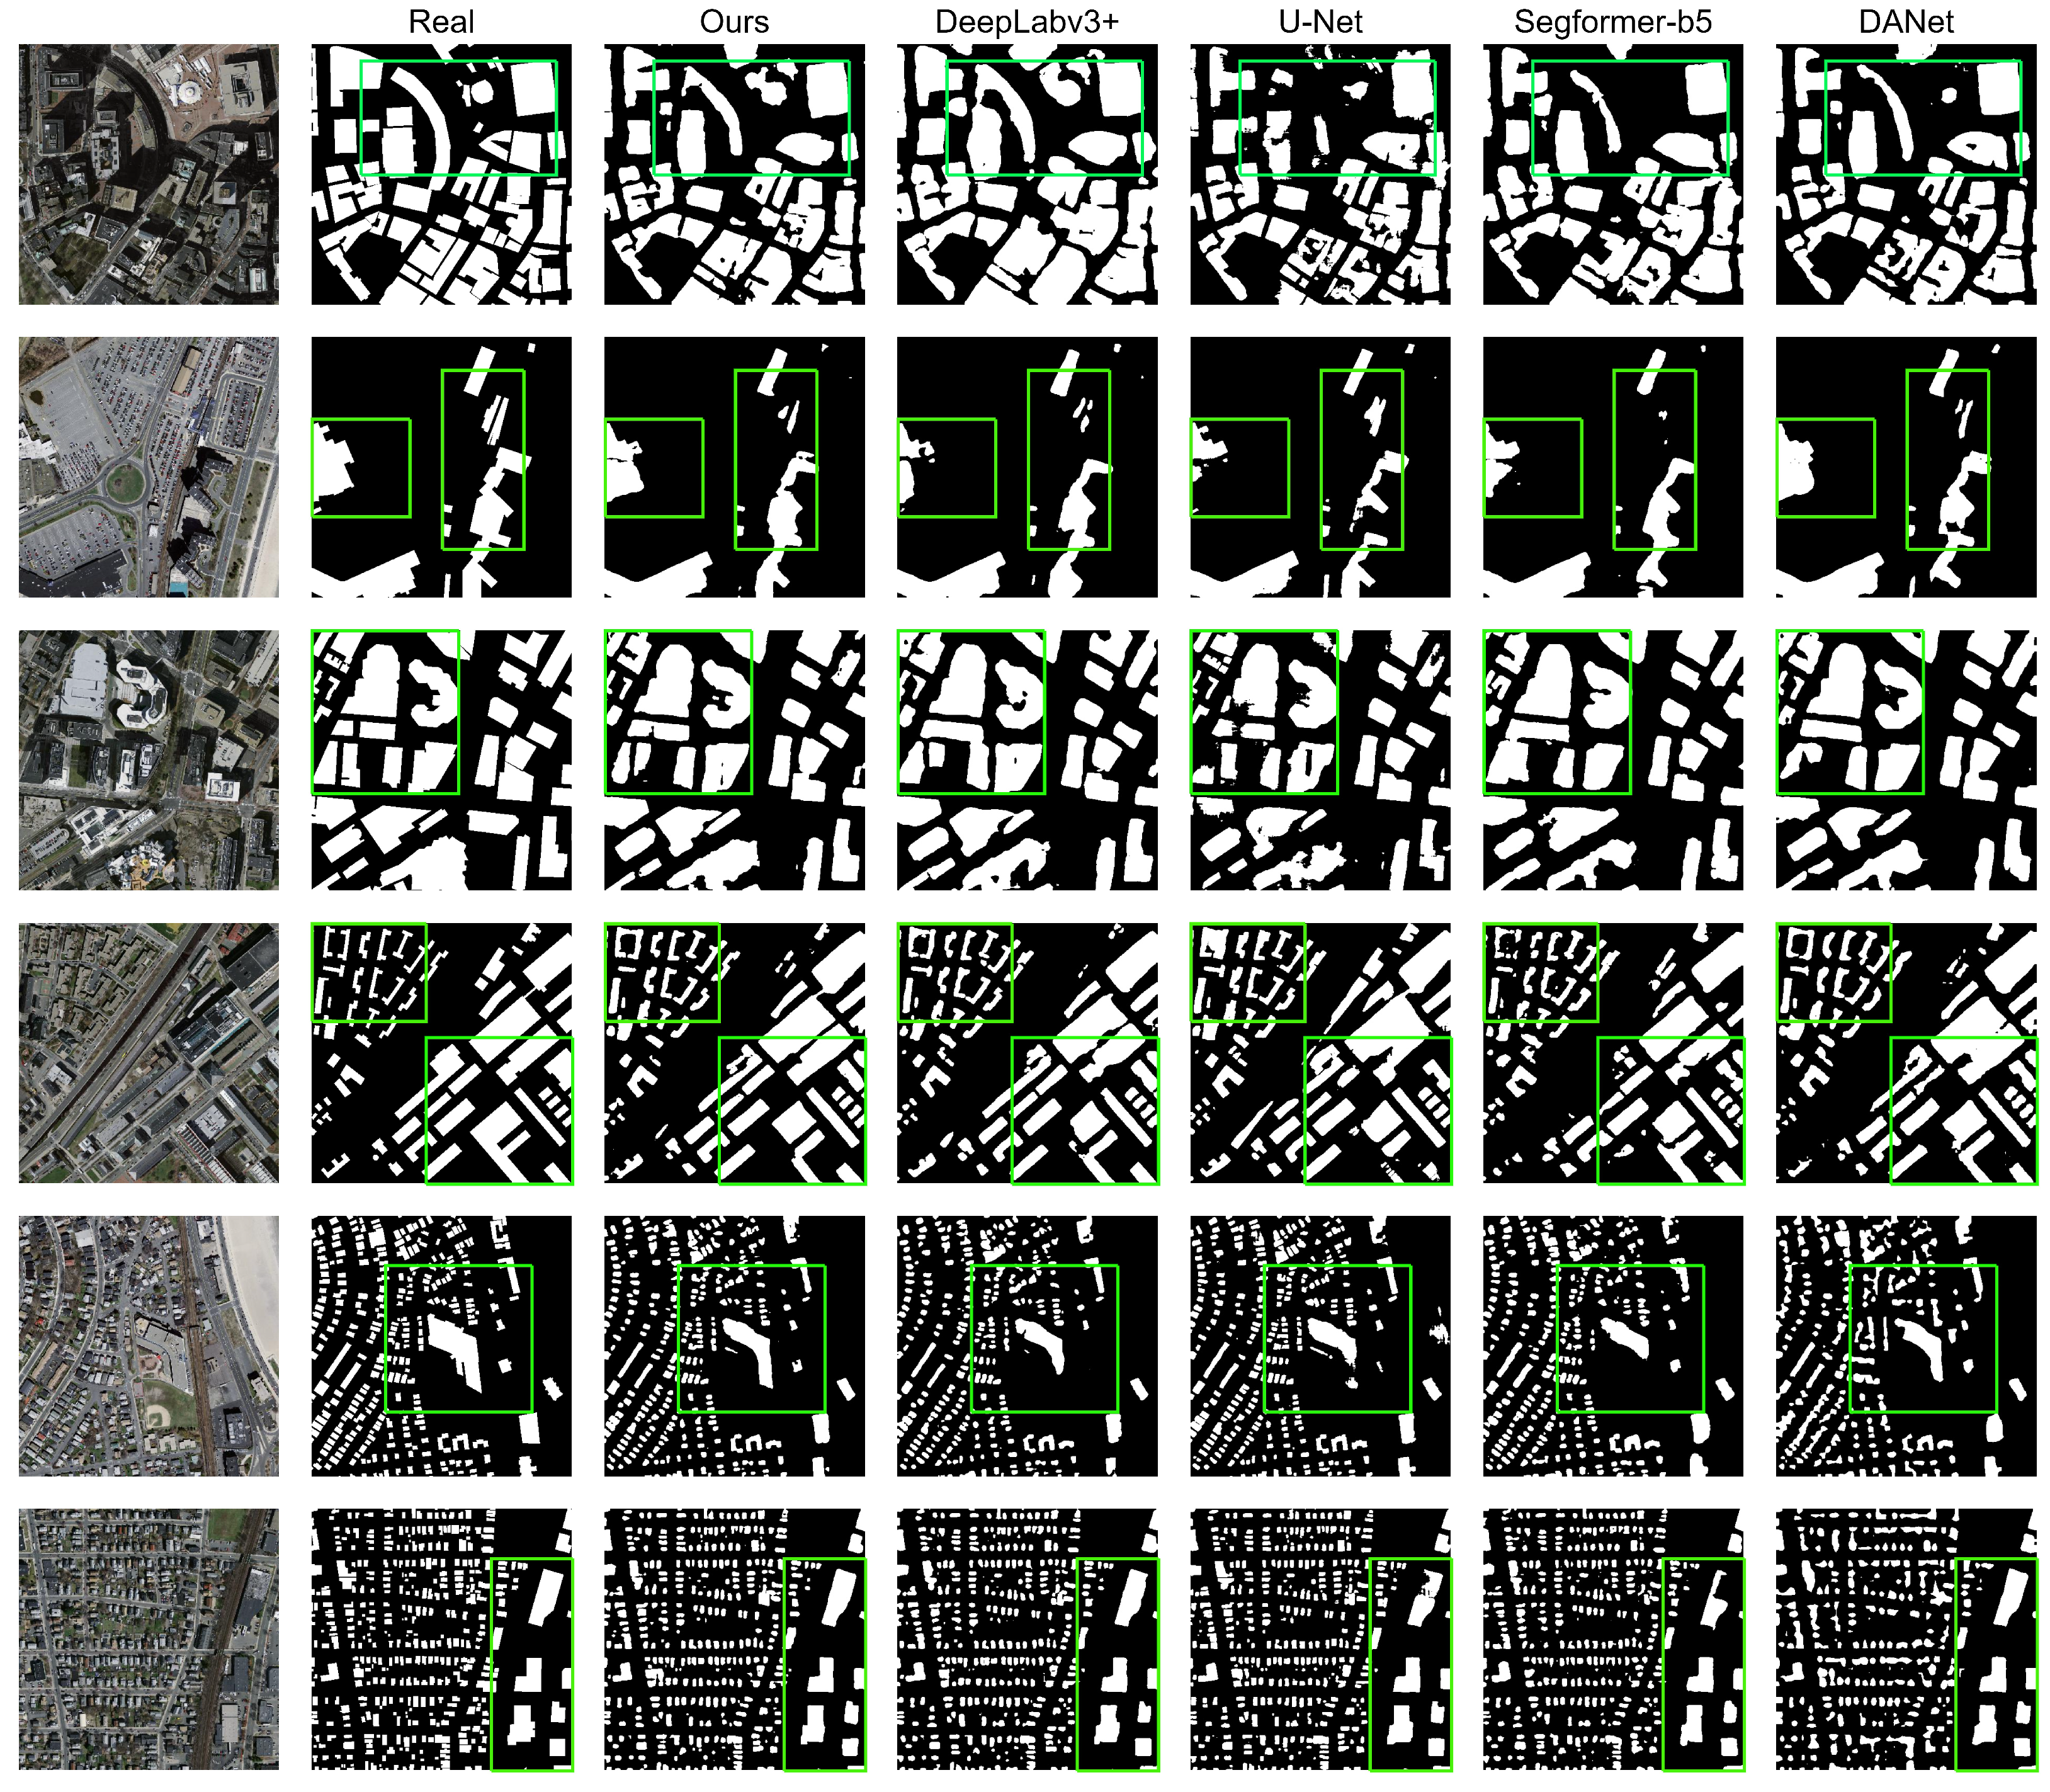
In order to more clearly demonstrate the superiority of our approach, six representative images are selected from the dataset for comparison. The building extraction results of five different networks for these six images are presented in Figure 12. From left to right, the images displayed include the real images, real labels, and the building extraction results of SDSNet, Deeplabv3+, U-Net, Segformer-b5, and DANet. In terms of the extraction results, SDSNet exhibits better adaptability in complex scenarios. For instance, in the first, second, and third rows, when dealing with irregular structures, comparative models struggle to accurately extract the building outlines from the images. However, SDSNet excels in this regard, effectively recognizing them while ensuring their internal integrity. In the fourth, fifth, and sixth rows, although all models can extract buildings, SDSNet demonstrates superior continuity and edge details in the extracted building structures.
The visual results shown in Figure 12 further confirm the remarkable ability of SDSNet to capture small and weak architectural targets and restore fine edge details.
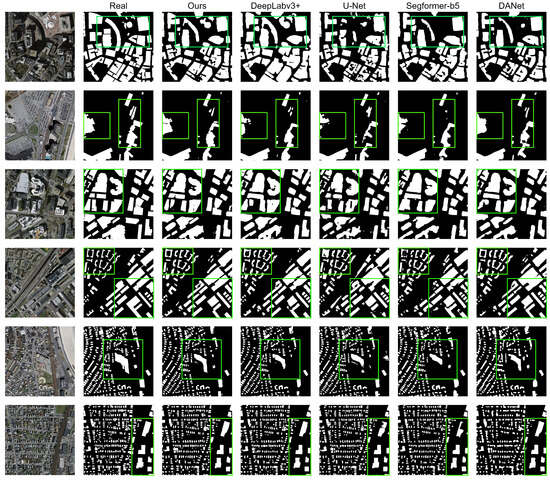
Figure 12.
Visualization of comparative results on the Massachusetts building dataset.
Figure 12.
Visualization of comparative results on the Massachusetts building dataset.
5.2. Experimental Result Analysis
The experimental results show that SDSNet can improve the performance of building segmentation in remote sensing images. The SIE module, constructed with a cascading structure of dilated convolution layers with varying dilation rates, captures semantic information from different receptive fields. This approach more effectively captures global multi-scale contextual information, thereby enhancing the model’s ability to extract semantic feature information. During the segmentation process, high-level feature maps often contain more semantic information, while low-level feature maps, while containing more-detailed information, also retain irrelevant redundant information. In order to reduce the influence of irrelevant information in low-level feature maps on building extraction effectiveness, the MLM module uses semantic features of the high-level feature map to guide the low-level feature map and filter out more-important detail features, thus improving the accuracy of the model. The ablation experiment results also proved this point very effectively. A series of comparative experiments on both datasets shows that the model achieves the best extraction results: even compared to the latest SOTA model. Finally, it is clear from the comparison of the visualization results that SDSNet has the best performance for refining building boundaries and solving building omissions and spatial structural discontinuities compared with other models.
5.3. The Balance between Parameter Cost and the Improvement in Building Extraction
From the comparative experiments, it is evident that SDSNet achieves the best building extraction results at a moderate cost of parameters compared to other classical models. In certain aspects, the improvements introduced by SDSNet are indeed extraordinary.
Task Sensitivity: In scenarios where building extraction demands high precision, even marginal accuracy improvements can be worthwhile. In critical applications, slight advancements might have pivotal impacts on decision making. For instance, highly accurate building extraction results can support detailed urban planning and management, proving valuable for precise land-use planning, infrastructure development, and urban decision making. For the detection of hazardous areas, which often requires higher standards for building extraction in terms of edges and shapes, SDSNet is more adept than other models.
Overall Efficiency Boost: If a minor improvement in model accuracy can reduce subsequent task costs or enhance task efficiency, it can justify a certain increase in the number of parameters. In practical applications such as urban planning, resource management, and disaster monitoring, where automatic building extraction is typically a precursor to further work, a highly accurate model reduces the need for post-processing, thereby saving additional computational and human resources and improving the efficiency of the building extraction process.
Strong Feature Expression Capability: Thanks to the capturing capabilities of the SIE and MLM modules for different features, SDSNet exhibits a more-robust feature expression capability. This aids in capturing small structures and textures in images, especially in complex remote sensing image scenarios, and proves valuable for identifying small or intricate building structures. Furthermore, in complex scenes, SDSNet shows improved adaptability to various features and demonstrates superior performance when handling different types of images.
In practice, there is no one-size-fits-all answer regarding the choice of building extraction model. The key lies in making informed decisions based on specific research goals and application requirements and balancing the trade-off between parameter cost and accuracy improvement.
6. Conclusions
This study introduces SDSNet with the aim of addressing various challenges encountered in building extraction from remote sensing imagery. These challenges include the omission of small buildings, fuzzy building boundaries, discontinuities within structures, and the extraction of irregular building boundaries.
In SDSNet, the SIE module plays a pivotal role in capturing and enhancing rich global multi-scale features. This module contributes to the extraction of buildings with varying sizes and irregular shapes while alleviating issues related to internal building discontinuities. Furthermore, the MLM is instrumental for effectively filtering irrelevant features. This enhances the spatial dimension’s detailed representation, thereby reducing the loss of locally available information. This reinforces the recognition of smaller buildings and maximizes the recovery of building edge details. Lastly, the SIF module establishes connections between layers and seamlessly integrates both semantic and detailed feature information. This effectively enhances the accuracy of building recognition, particularly in complex environments.
Through ablation experiments, the indispensability of each module within SDSNet can be demonstrated. Additionally, experimental results on two publicly available datasets are presented. In comparison with numerous other semantic segmentation and building extraction methods, our SDSNet excels in high-resolution building extraction tasks.
SDSNet facilitates the automated and intelligent extraction of buildings from high-resolution remote sensing imagery, providing robust support for various domains, including urban planning, resource management, and disaster monitoring. In urban planning, the high-precision building extraction results from SDSNet are crucial for urban planners to accurately comprehend the city’s structure and land distribution. Additionally, they can assist with monitoring urban expansion and development trends by providing reliable data support for urban planning. In disaster prevention, the ability of SDSNet to extract buildings with high precision in disaster monitoring aids emergency response teams in gaining a more comprehensive understanding of the affected area. This, in turn, guides disaster relief actions. In digital mapping, the building information extracted by SDSNet can be integrated into GIS: offering high-quality, timely, and updated geographic information for the production of digital maps. Furthermore, SDSNet provides accurate capture of building outlines and details, contributing to the generation of more-refined map data for digital mapping. In our future research endeavors, we will continue to enhance the network. Our goal is to make it applicable to a broader spectrum of semantic segmentation tasks while improving the model’s overall ability to generalize.
Author Contributions
Conceptualization, X.W.; Data curation, X.W.; Formal analysis, M.T.; Methodology, X.W.; Software, X.W.; Validation, M.T.; Writing—original draft, M.T.; Writing—review and editing, Z.Z., K.H., S.W., Y.L. and Y.D. All authors have read and agreed to the published version of the manuscript.
Funding
This paper is funded by geological survey projects conducted by the Geological Survey of China (No. DD20220995, DD20230135, and ZD20220409), the National Natural Science Foundation of China (No. U21A2013 and 41925007), the Opening Fund of the Key Laboratory of Geological Survey and Evaluation of the Ministry of Education (No. GLAB2022ZR02).
Data Availability Statement
Data available on request due to restrictions eg privacy or ethical. The data presented in this study are available on request from the lead author.
Conflicts of Interest
The authors declare no conflicts of interest.
References
- Enemark, S.; Williamson, I.; Wallace, J. Building modern land administration systems in developed economies. Surveyor 2005, 50, 51–68. [Google Scholar] [CrossRef]
- Blaschke, T. Object based image analysis for remote sensing. ISPRS J. Photogramm. Remote Sens. 2010, 65, 2–16. [Google Scholar] [CrossRef]
- Dhande, A.; Malik, R. Design of a highly efficient crop damage detection ensemble learning model using deep convolutional networks. J. Ambient. Intell. Humaniz. Comput. 2023, 14, 10811–10821. [Google Scholar] [CrossRef]
- Liu, G.; Li, J.; Nie, P. Tracking the history of urban expansion in Guangzhou (China) during 1665–2017: Evidence from historical maps and remote sensing images. Land Use Policy 2022, 112, 105773. [Google Scholar] [CrossRef]
- Xiaoli, L.; Zhiqiang, L.; Jiansi, Y.; Yaohui, L.; Bo, F.; Wenhua, Q.; Xiwei, F. Spatiotemporal characteristics of earthquake disaster losses in China from 1993 to 2016. Nat. Hazards 2018, 94, 843–865. [Google Scholar]
- Liu, Y.; Li, Z.; Wei, B.; Li, X.; Fu, B. Seismic vulnerability assessment at urban scale using data mining and GIScience technology: Application to Urumqi (China). Geomat. Nat. Hazards Risk 2019, 10, 958–985. [Google Scholar] [CrossRef]
- Wang, J.; Xue, Y.; Xiao, J.; Shi, D. Diffusion Characteristics of Airflow and CO in the Dead-End Tunnel with Different Ventilation Parameters after Tunneling Blasting. ACS Omega 2023, 8, 36269–36283. [Google Scholar] [CrossRef]
- Zhang, B.; Chen, Z.; Peng, D.; Benediktsson, J.A.; Liu, B.; Zou, L.; Li, J.; Plaza, A. Remotely sensed big data: Evolution in model development for information extraction [point of view]. Proc. IEEE 2019, 107, 2294–2301. [Google Scholar] [CrossRef]
- Cheng, L.; Wang, L.; Feng, R.; Yan, J. Remote sensing and social sensing data fusion for fine-resolution population mapping with a multi-model neural network. IEEE J. Sel. Top. Appl. Earth Obs. Remote Sens. 2021, 14, 5973–5987. [Google Scholar] [CrossRef]
- Li, F.; Li, J.; Han, W.; Feng, R.; Wang, L. Unsupervised Representation High-Resolution Remote Sensing Image Scene Classification via Contrastive Learning Convolutional Neural Network. Photogramm. Eng. Remote Sens. J. Am. Soc. Photogramm. 2021, 87, 577–591. [Google Scholar] [CrossRef]
- Li, L.; Tian, T.; Li, H.; Wang, L. SE-HRNet: A Deep High-Resolution Network with Attention for Remote Sensing Scene Classification. In Proceedings of the IGARSS 2020–2020 IEEE International Geoscience and Remote Sensing Symposium, Waikoloa, HI, USA, 26 September–2 October 2020. [Google Scholar]
- Li, F.; Wang, L.; Han, W. Ensemble Model with Cascade Attention Mechanism for High-Resolution Image Scene Classification. Opt. Express 2020, 28, 22358–22387. [Google Scholar] [CrossRef] [PubMed]
- Sirmaek, B.; Unsalan, C. Urban-Area and Building Detection Using SIFT Keypoints and Graph Theory. IEEE Trans. Geosci. Remote Sens. 2009, 47, 1156–1167. [Google Scholar] [CrossRef]
- Zhang, Y. Optimisation of building detection in satellite images by combining multispectral classification and texture filtering. ISPRS J. Photogramm. Remote Sens. 1999, 54, 50–60. [Google Scholar] [CrossRef]
- Zhong, S.H.; Huang, J.J.; Xie, W.X. A new method of building detection from a single aerial photograph. In Proceedings of the International Conference on Signal Processing, Porto, Portugal, 26–29 July 2008; pp. 1219–1222. [Google Scholar]
- Yong, L.I.; Huayi, W.U. Adaptive Building Edge Detection by Combining Lidar Data and Aerial Images. In Proceedings of the International Archives of the Photogrammetry, Remote Sensing and Spatial Information Sciences Conference, Beijing, China, 3–11 July 2008. [Google Scholar]
- Ferraioli, G. Multichannel InSAR Building Edge Detection. IEEE Trans. Geosci. Remote Sens. 2010, 48, 1224–1231. [Google Scholar] [CrossRef]
- Tiwari, P.S.; Pande, H. Use of laser range and height texture cues for building identification. J. Indian Soc. Remote Sens. 2008, 36, 227–234. [Google Scholar] [CrossRef]
- Awrangjeb, M.; Zhang, C.; Fraser, C.S. Improved building detection using texture information. ISPRS Int. Arch. Photogramm. Remote Sens. Spat. Inf. Sci. 2013, 38, 143–148. [Google Scholar] [CrossRef]
- Liow, Y.T.; Pavlidis, T. Use of Shadows for Extracting Buildings in Aerial Images. Comput. Vis. Graph. Image Process. 1990, 49, 242–277. [Google Scholar] [CrossRef]
- Chen, D.; Shang, S.; Wu, C. Shadow-based Building Detection and Segmentation in High-resolution Remote Sensing Image. J. Multimed. 2014, 9, 181–188. [Google Scholar] [CrossRef]
- Sun, J.; He, K.; Girshick, R.; Ren, S. Faster R-CNN: Towards Real-Time Object Detection with Region Proposal Networks. arXiv 2015, arXiv:1506.01497. [Google Scholar]
- Krizhevsky, A.; Sutskever, I.; Hinton, G. ImageNet Classification with Deep Convolutional Neural Networks. Adv. Neural Inf. Process. Syst. 2012, 25, 1–9. [Google Scholar] [CrossRef]
- Long, J.; Shelhamer, E.; Darrell, T. Fully Convolutional Networks for Semantic Segmentation. IEEE Trans. Pattern Anal. Mach. Intell. 2015, 39, 640–651. [Google Scholar]
- Vaswani, A.; Shazeer, N.; Parmar, N.; Uszkoreit, J.; Jones, L.; Gomez, A.N.; Kaiser, L.; Polosukhin, I. Attention Is All You Need. arXiv 2017, arXiv:1706.03762. [Google Scholar]
- Liu, Y.; Piramanayagam, S.; Monteiro, S.T.; Saber, E. Dense Semantic Labeling of Very-High-Resolution Aerial Imagery and LiDAR with Fully-Convolutional Neural Networks and Higher-Order CRFs. In Proceedings of the IEEE Conference on Computer Vision & Pattern Recognition Workshops, Honolulu, HI, USA, 21–26 July 2017. [Google Scholar]
- Wang, Z.; Xu, N.; Wang, B.; Liu, Y.; Zhang, S. Urban building extraction from high-resolution remote sensing imagery based on multi-scale recurrent conditional generative adversarial network. GIScience Remote Sens. 2022, 59, 861–884. [Google Scholar] [CrossRef]
- Zhou, Y.; Chen, Z.; Wang, B.; Li, S.; Liu, H.; Xu, D.; Ma, C. BOMSC-Net: Boundary optimization and multi-scale context awareness based building extraction from high-resolution remote sensing imagery. IEEE Trans. Geosci. Remote Sens. 2022, 60, 5618617. [Google Scholar] [CrossRef]
- Xu, S.; Deng, B.; Meng, Y.; Liu, G.; Han, J. ReA-Net: A Multiscale Region Attention Network with Neighborhood Consistency Supervision for Building Extraction From Remote Sensing Image. IEEE J. Sel. Top. Appl. Earth Obs. Remote Sens. 2022, 15, 9033–9047. [Google Scholar] [CrossRef]
- Maggiori, E.; Tarabalka, Y.; Charpiat, G.; Alliez, P. Can Semantic Labeling Methods Generalize to Any City? The Inria Aerial Image Labeling Benchmark. In Proceedings of the Igarss IEEE International Geoscience & Remote Sensing Symposium, Fort Worth, TX, USA, 23–28 July 2017. [Google Scholar]
- Ji, S.; Wei, S.; Lu, M. Fully Convolutional Networks for Multisource Building Extraction from an Open Aerial and Satellite Imagery Data Set. IEEE Trans. Geosci. Remote Sens. 2019, 57, 574–586. [Google Scholar] [CrossRef]
- A, X.Z.; A, L.H.; B, G.S.X.A.; C, J.G.A. Parsing very high resolution urban scene images by learning deep ConvNets with edge-aware loss—ScienceDirect. ISPRS J. Photogramm. Remote Sens. 2020, 170, 15–28. [Google Scholar]
- Li, X.; Li, X.; Zhang, L.; Cheng, G.; Tong, Y. Improving Semantic Segmentation via Decoupled Body and Edge Supervision. arXiv 2020, arXiv:2007.10035. [Google Scholar]
- Ronneberger, O.; Fischer, P.; Brox, T. U-Net: Convolutional Networks for Biomedical Image Segmentation; Springer: Cham, Switzerland, 2015. [Google Scholar]
- Badrinarayanan, V.; Kendall, A.; Cipolla, R. SegNet: A Deep Convolutional Encoder-Decoder Architecture for Image Segmentation. IEEE Trans. Pattern Anal. Mach. Intell. 2017, 39, 2481–2495. [Google Scholar] [CrossRef]
- Chen, L.C.; Papandreou, G.; Schroff, F.; Adam, H. Rethinking atrous convolution for semantic image segmentation. arXiv 2017, arXiv:1706.05587. [Google Scholar]
- Chen, L.C.; Zhu, Y.; Papandreou, G.; Schroff, F.; Adam, H. Encoder-Decoder with Atrous Separable Convolution for Semantic Image Segmentation. In Proceedings of the European Conference on Computer Vision, Munich, Germany, 8–14 September 2018. [Google Scholar]
- Zhang, H.; Liao, Y.; Yang, H.; Yang, G.; Zhang, L. A Local-Global Dual-Stream Network for Building Extraction From Very-High-Resolution Remote Sensing Images. IEEE Trans. Neural Netw. Learn. Syst. 2020, 33, 1269–1283. [Google Scholar] [CrossRef] [PubMed]
- Tejeswari, B.; Sharma, S.K.; Kumar, M.; Gupta, K. Building footprint extraction from space-borne imagery using deep neural networks. Int. Arch. Photogramm. Remote Sens. Spat. Inf. Sci. 2022, 43, 641–647. [Google Scholar] [CrossRef]
- He, N.; Fang, L.; Plaza, A. Hybrid first and second order attention Unet for building segmentation in remote sensing images. Sci. China (Inf. Sci.) 2020, 63, 69–80. [Google Scholar] [CrossRef]
- Chen, Y.; Cheng, H.; Yao, S.; Hu, Z. Building Extraction from High-Resolution Remote Sensing Imagery Based on Multi-Scale Feature Fusion and Enhancement. Int. Arch. Photogramm. Remote Sens. Spat. Inf. Sci. 2022, 43, 55–60. [Google Scholar] [CrossRef]
- Liu, Y.; Gross, L.; Li, Z.; Li, X.; Qi, W. Automatic Building Extraction on High-Resolution Remote Sensing Imagery Using Deep Convolutional Encoder-Decoder With Spatial Pyramid Pooling. IEEE Access 2019, 7, 128774–128786. [Google Scholar] [CrossRef]
- Khan, S.D.; Alarabi, L.; Basalamah, S. An encoder–decoder deep learning framework for building footprints extraction from aerial imagery. Arab. J. Sci. Eng. 2023, 48, 1273–1284. [Google Scholar] [CrossRef]
- Xu, S.; Du, M.; Meng, Y.; Liu, G.; Han, J.; Zhan, B. MDBES-Net: Building Extraction From Remote Sensing Images Based on Multiscale Decoupled Body and Edge Supervision Network. IEEE J. Sel. Top. Appl. Earth Obs. Remote Sens. 2023, 17, 519–534. [Google Scholar] [CrossRef]
- Kang, W.; Xiang, Y.; Wang, F.; You, H. EU-Net: An Efficient Fully Convolutional Network for Building Extraction from Optical Remote Sensing Images. Remote Sens. 2019, 11, 2813. [Google Scholar] [CrossRef]
- Wang, Y. JointNet: A Common Neural Network for Road and Building Extraction. Remote Sens. 2019, 11, 696. [Google Scholar]
- Guo, M.; Liu, H.; Xu, Y.; Huang, Y. Building Extraction Based on U-Net with an Attention Block and Multiple Losses. Remote Sens. 2020, 12, 1400. [Google Scholar] [CrossRef]
- Yi, Y.; Zhang, Z.; Zhang, W.; Zhang, C.; Zhao, T. Semantic Segmentation of Urban Buildings from VHR Remote Sensing Imagery Using a Deep Convolutional Neural Network. Remote Sens. 2019, 11, 1774. [Google Scholar] [CrossRef]
- Ye, Z.; Fu, Y.; Gan, M.; Deng, J.; Wang, K. Building Extraction from Very High Resolution Aerial Imagery Using Joint Attention Deep Neural Network. Remote Sens. 2019, 11, 2970. [Google Scholar] [CrossRef]
- Zhu, Q.; Liao, C.; Hu, H.; Mei, X.; Li, H. MAP-Net: Multiple Attending Path Neural Network for Building Footprint Extraction From Remote Sensed Imagery. IEEE Trans. Geosci. Remote Sens. 2021, 59, 6169–6181. [Google Scholar] [CrossRef]
- Shao, Z.; Tang, P.; Wang, Z.; Saleem, N.; Yam, S.; Sommai, C. BRRNet: A Fully Convolutional Neural Network for Automatic Building Extraction from High-Resolution Remote Sensing Images. Remote Sens. 2020, 12, 1050. [Google Scholar] [CrossRef]
- Lin, J.; Jing, W.; Song, H.; Chen, G. ESFNet: Efficient Network for Building Extraction from High-Resolution Aerial Images. IEEE Access 2019, 7, 54285–54294. [Google Scholar] [CrossRef]
- Wang, H.; Miao, F. Building extraction from remote sensing images using deep residual U-Net. Eur. J. Remote Sens. 2022, 55, 71–85. [Google Scholar] [CrossRef]
- Hosseinpour, H.; Samadzadegan, F.; Javan, F.D. CMGFNet: A deep cross-modal gated fusion network for building extraction from very high-resolution remote sensing images. ISPRS J. Photogramm. Remote Sens. 2022, 184, 96–115. [Google Scholar] [CrossRef]
- Li, X.; Yao, X.; Fang, Y. Building-A-Nets: Robust Building Extraction From High-Resolution Remote Sensing Images With Adversarial Networks. IEEE J. Sel. Top. Appl. Earth Obs. Remote Sens. 2018, 11, 3680–3687. [Google Scholar] [CrossRef]
- Beal, J.; Kim, E.; Tzeng, E.; Park, D.H.; Kislyuk, D. Toward Transformer-Based Object Detection. arXiv 2020, arXiv:2012.09958. [Google Scholar]
- Zhou, D.; Wang, G.; He, G.; Long, T.; Luo, B. Robust Building Extraction for High Spatial Resolution Remote Sensing Images with Self-Attention Network. Sensors 2020, 20, 7241. [Google Scholar] [CrossRef]
- Guo, H.; Shi, Q.; Du, B.; Zhang, L.; Ding, H. Scene-Driven Multitask Parallel Attention Network for Building Extraction in High-Resolution Remote Sensing Images. IEEE Trans. Geosci. Remote Sens. 2020, 59, 4287–4306. [Google Scholar] [CrossRef]
- Liu, Y.; Chen, D.; Ma, A.; Zhong, Y.; Xu, K. Multiscale U-Shaped CNN Building Instance Extraction Framework with Edge Constraint for High-Spatial-Resolution Remote Sensing Imagery. IEEE Trans. Geosci. Remote Sens. 2020, 59, 6106–6120. [Google Scholar] [CrossRef]
- Fu, J.; Liu, J.; Tian, H.; Li, Y.; Bao, Y.; Fang, Z.; Lu, H. Dual Attention Network for Scene Segmentation. In Proceedings of the IEEE Conference on Computer Vision and Pattern Recognition, Salt Lake City, UT, USA, 18–22 June 2018. [Google Scholar]
- Yang, H.; Wu, P.; Yao, X.; Wu, Y.; Wang, B.; Xu, Y. Building Extraction in Very High Resolution Imagery by Dense-Attention Networks. Remote Sens. 2018, 10, 1768. [Google Scholar] [CrossRef]
- Zhao, H.; Shi, J.; Qi, X.; Wang, X.; Jia, J. Pyramid Scene Parsing Network. In Proceedings of the IEEE Computer Society, Pittsburgh, PA, USA, 11–13 July 2016. [Google Scholar]
- Chen, K.; Zou, Z.; Shi, Z. Building extraction from remote sensing images with sparse token transformers. Remote Sens. 2021, 13, 4441. [Google Scholar] [CrossRef]
- He, T.; Zhang, Z.; Zhang, H.; Zhang, Z.; Li, M. Bag of Tricks for Image Classification with Convolutional Neural Networks. In Proceedings of the 2019 IEEE/CVF Conference on Computer Vision and Pattern Recognition (CVPR), Long Beach, CA, USA, 15–20 June 2019. [Google Scholar]
- Chen, L.C.; Papandreou, G.; Kokkinos, I.; Murphy, K.; Yuille, A.L. Deeplab: Semantic image segmentation with deep convolutional nets, atrous convolution, and fully connected crfs. IEEE Trans. Pattern Anal. Mach. Intell. 2017, 40, 834–848. [Google Scholar] [CrossRef] [PubMed]
- Mnih, V. Machine Learning for Aerial Image Labeling. Ph.D. Thesis, University of Toronto (Canada), Toronto, ON, Canada, 2013. [Google Scholar]
- Contributors, M. MMSegmentation: OpenMMLab Semantic Segmentation Toolbox and Benchmark. 2020. Available online: https://github.com/open-mmlab/mmsegmentation (accessed on 15 January 2023).
- Yuan, Y.; Chen, X.; Wang, J. Object-Contextual Representations for Semantic Segmentation. arXiv 2019, arXiv:1909.11065. [Google Scholar]
- Wang, L.; Fang, S.; Meng, X.; Li, R. Building extraction with vision transformer. IEEE Trans. Geosci. Remote Sens. 2022, 60, 5625711. [Google Scholar] [CrossRef]
- Zhang, R.; Wan, Z.; Zhang, Q.; Zhang, G. DSAT-Net: Dual Spatial Attention Transformer for Building Extraction from Aerial Images. IEEE Geosci. Remote Sens. Lett. 2023, 20, 6008405. [Google Scholar] [CrossRef]
- Zhang, R.; Zhang, Q.; Zhang, G. SDSC-UNet: Dual Skip Connection ViT-based U-shaped Model for Building Extraction. IEEE Geosci. Remote Sens. Lett. 2023, 20, 6005005. [Google Scholar] [CrossRef]
- Xie, E.; Wang, W.; Yu, Z.; Anandkumar, A.; Alvarez, J.M.; Luo, P. SegFormer: Simple and Efficient Design for Semantic Segmentation with Transformers. Adv. Neural Inf. Process. Syst. 2021, 34, 12077–12090. [Google Scholar]
Disclaimer/Publisher’s Note: The statements, opinions and data contained in all publications are solely those of the individual author(s) and contributor(s) and not of MDPI and/or the editor(s). MDPI and/or the editor(s) disclaim responsibility for any injury to people or property resulting from any ideas, methods, instructions or products referred to in the content. |
© 2023 by the authors. Licensee MDPI, Basel, Switzerland. This article is an open access article distributed under the terms and conditions of the Creative Commons Attribution (CC BY) license (https://creativecommons.org/licenses/by/4.0/).