
Mapping Changes in Fractional Vegetation Cover on the Namib Gravel Plains with Satellite-Retrieved Land Surface Emissivity Data


Abstract
:1. Introduction
- Detection and comparison of changes in emissivity and NDVI time series at multiple sites on the gravel plains and adjacent sand dune sea.
- Interpretation of observed emissivity changes with the rainfall record of the Gobabeb Namib Research Institute (GNRI), photographs from the gravel plains and corresponding NDVI changes.
- Finally, we introduce a method to estimate fractional vegetation cover from MOD21 band 29 emissivities and demonstrate its feasibility using existing field measurements.
2. Methods
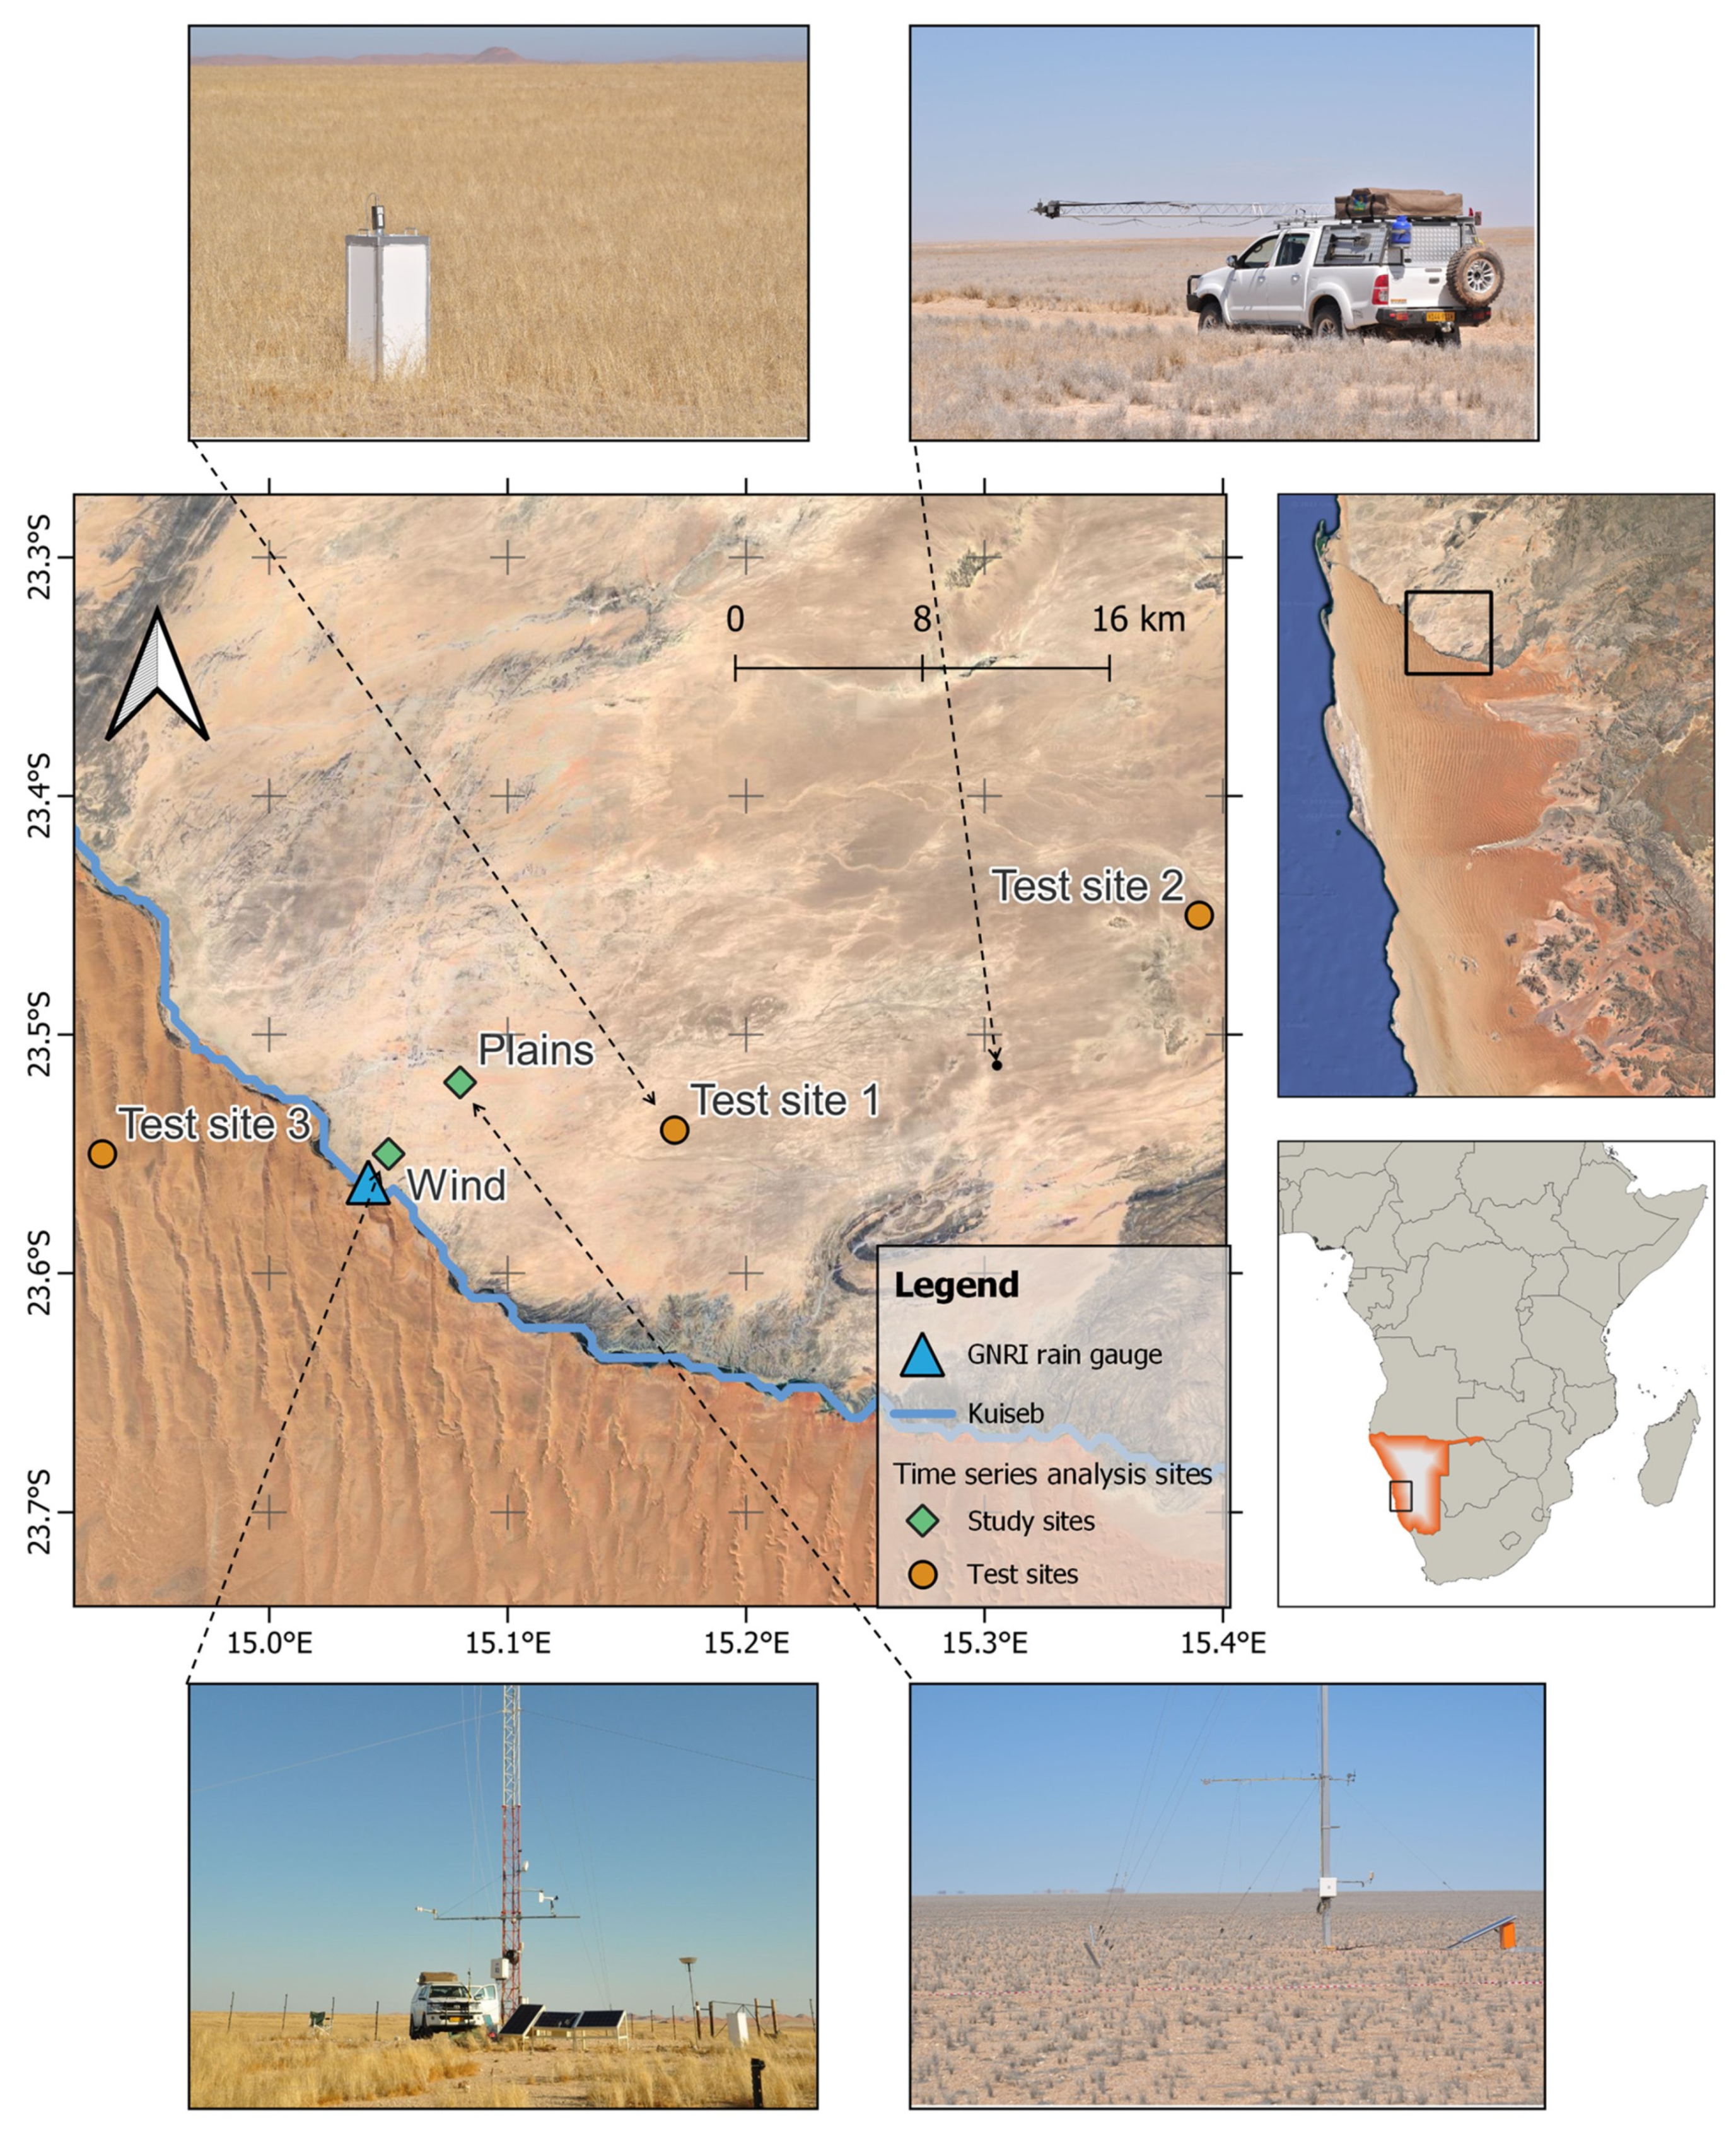
2.1. Study Site
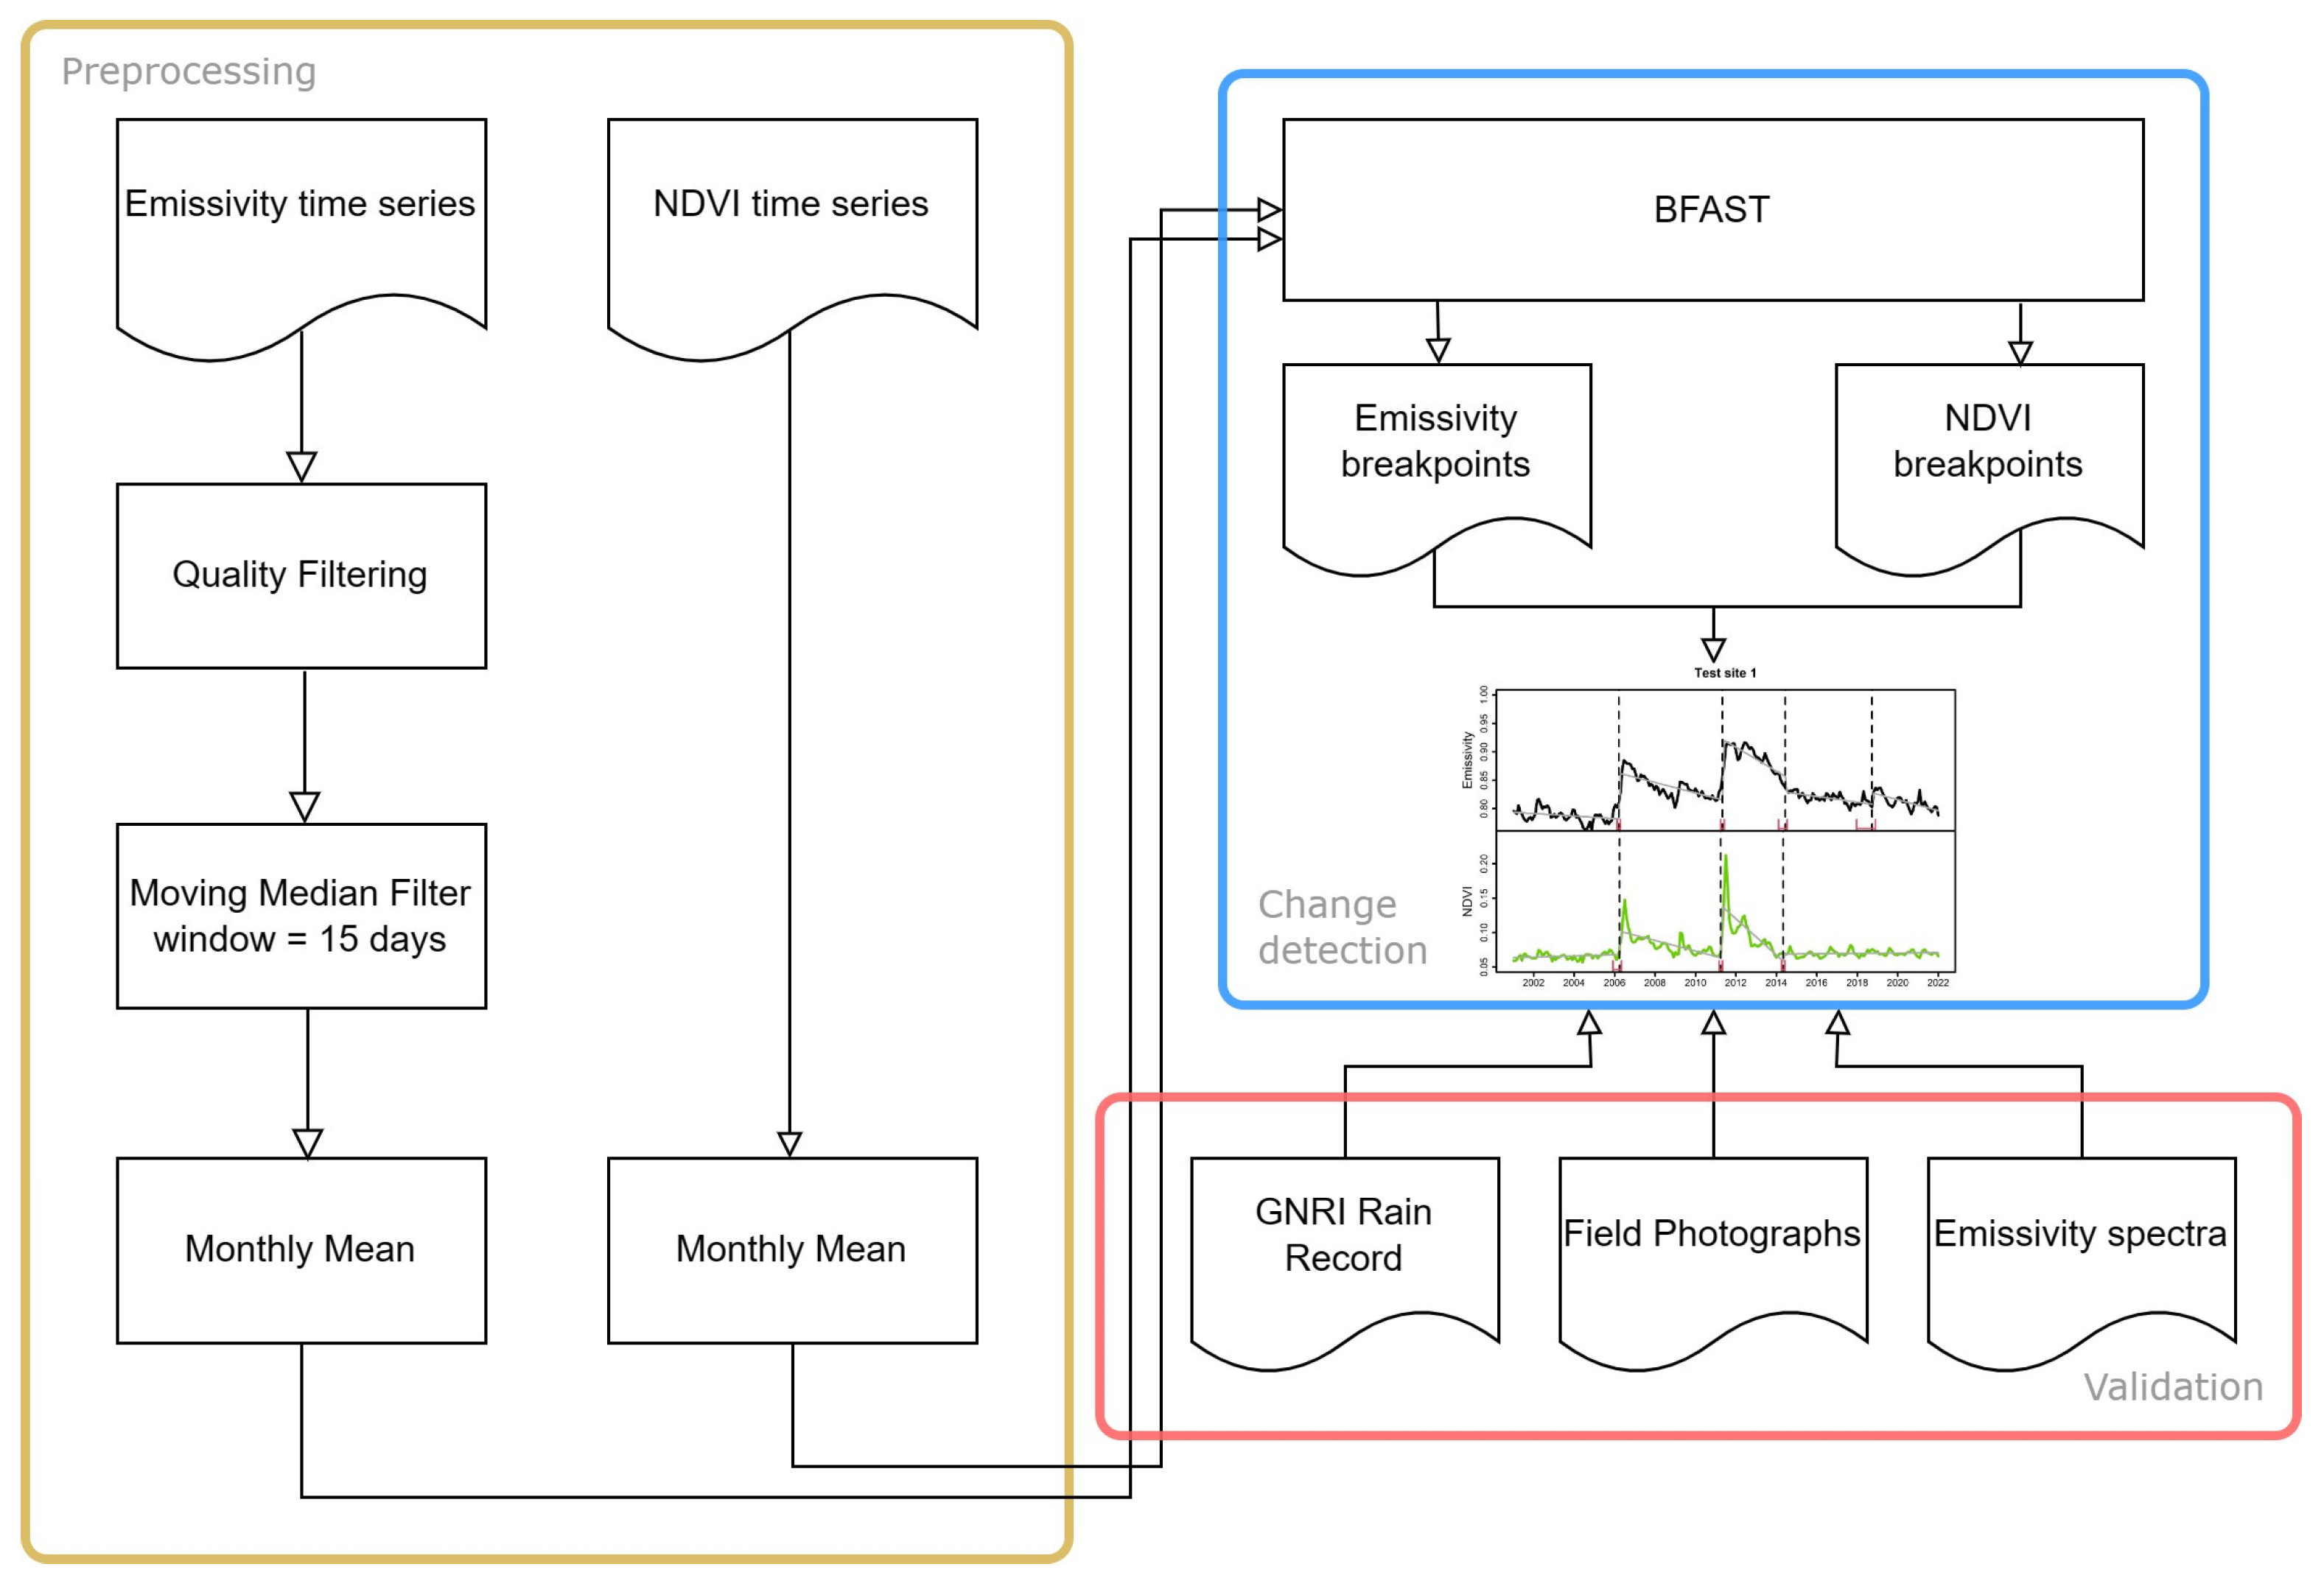
2.2. Change Detection with BFAST
2.3. Datasets and Data Preparation
2.3.1. Satellite-Based Data
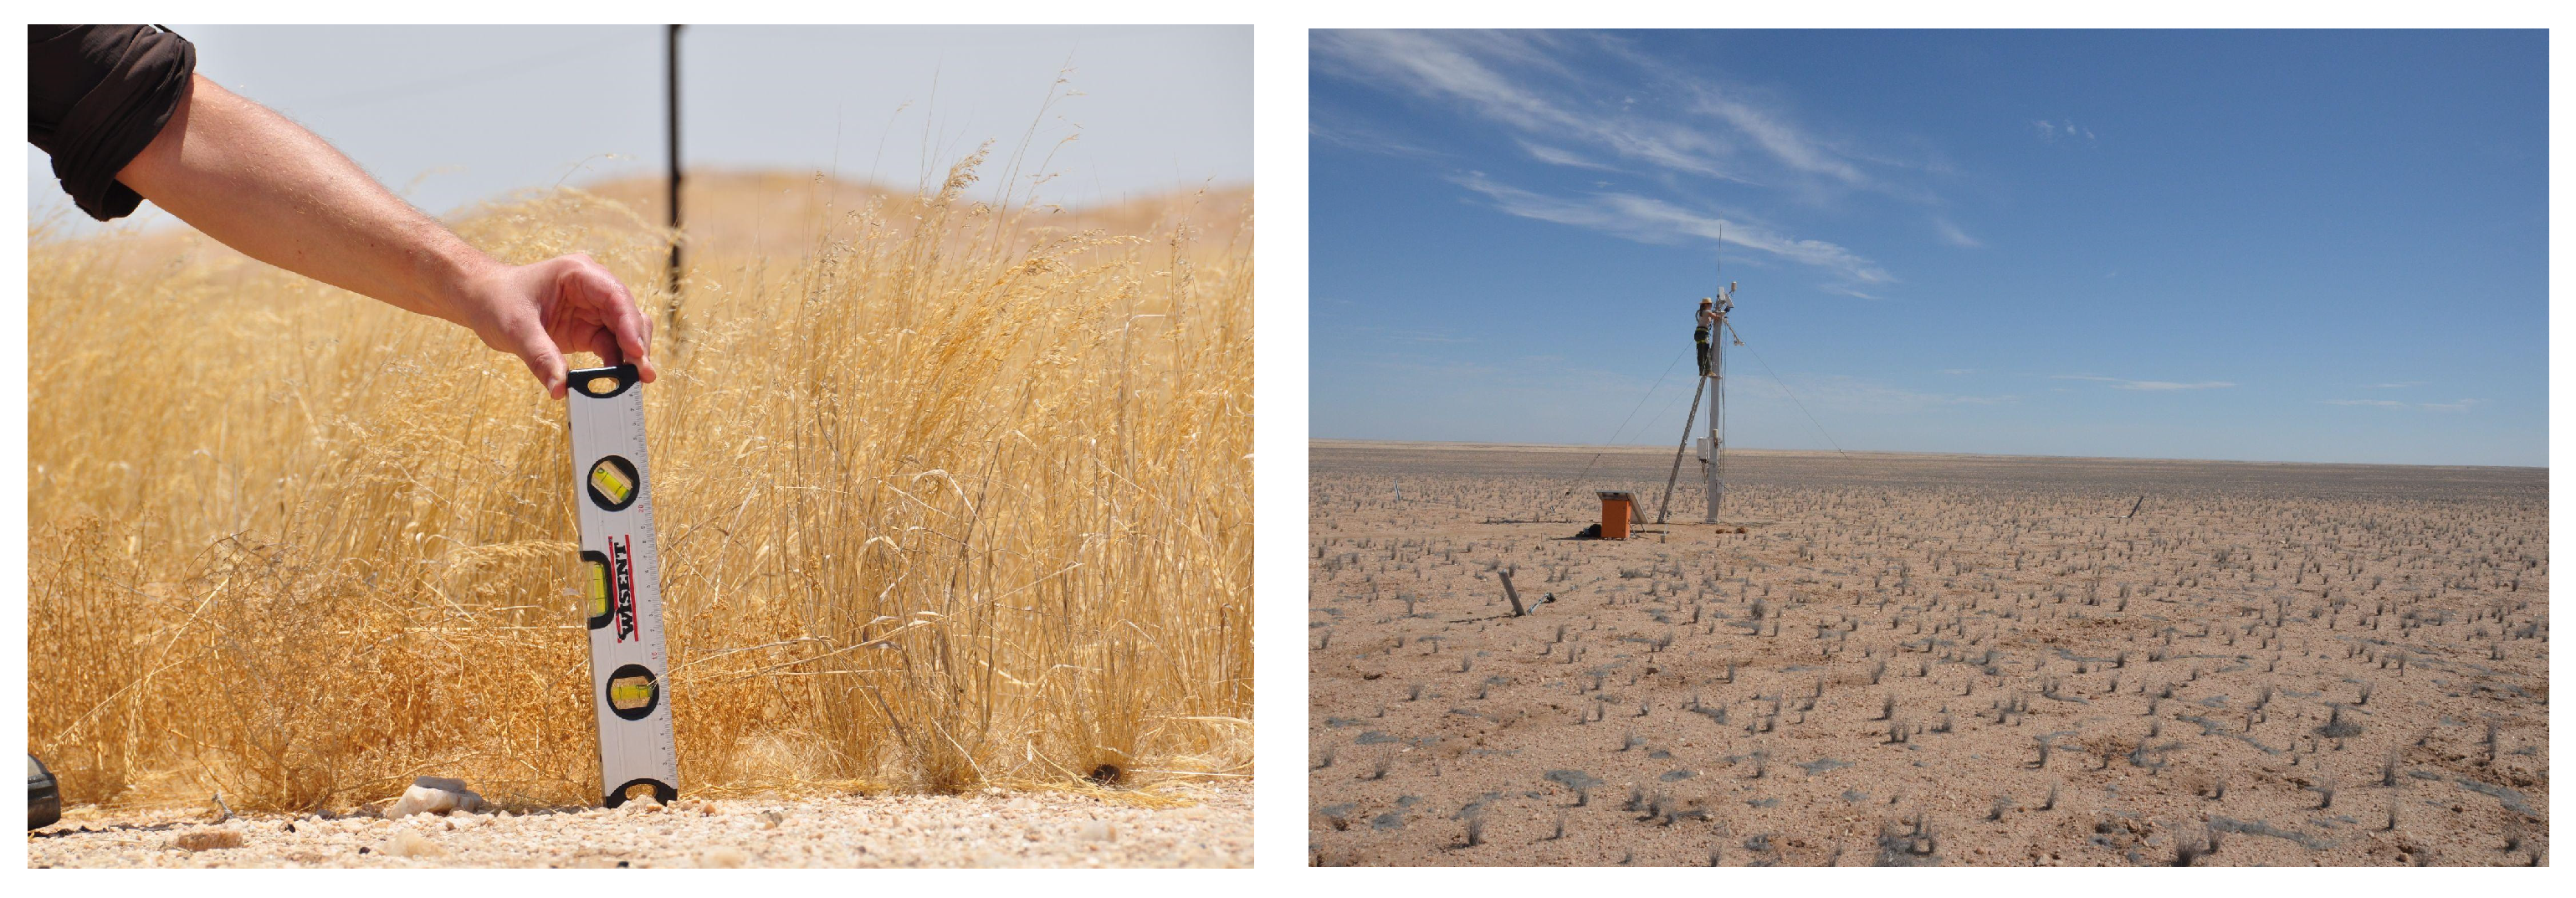
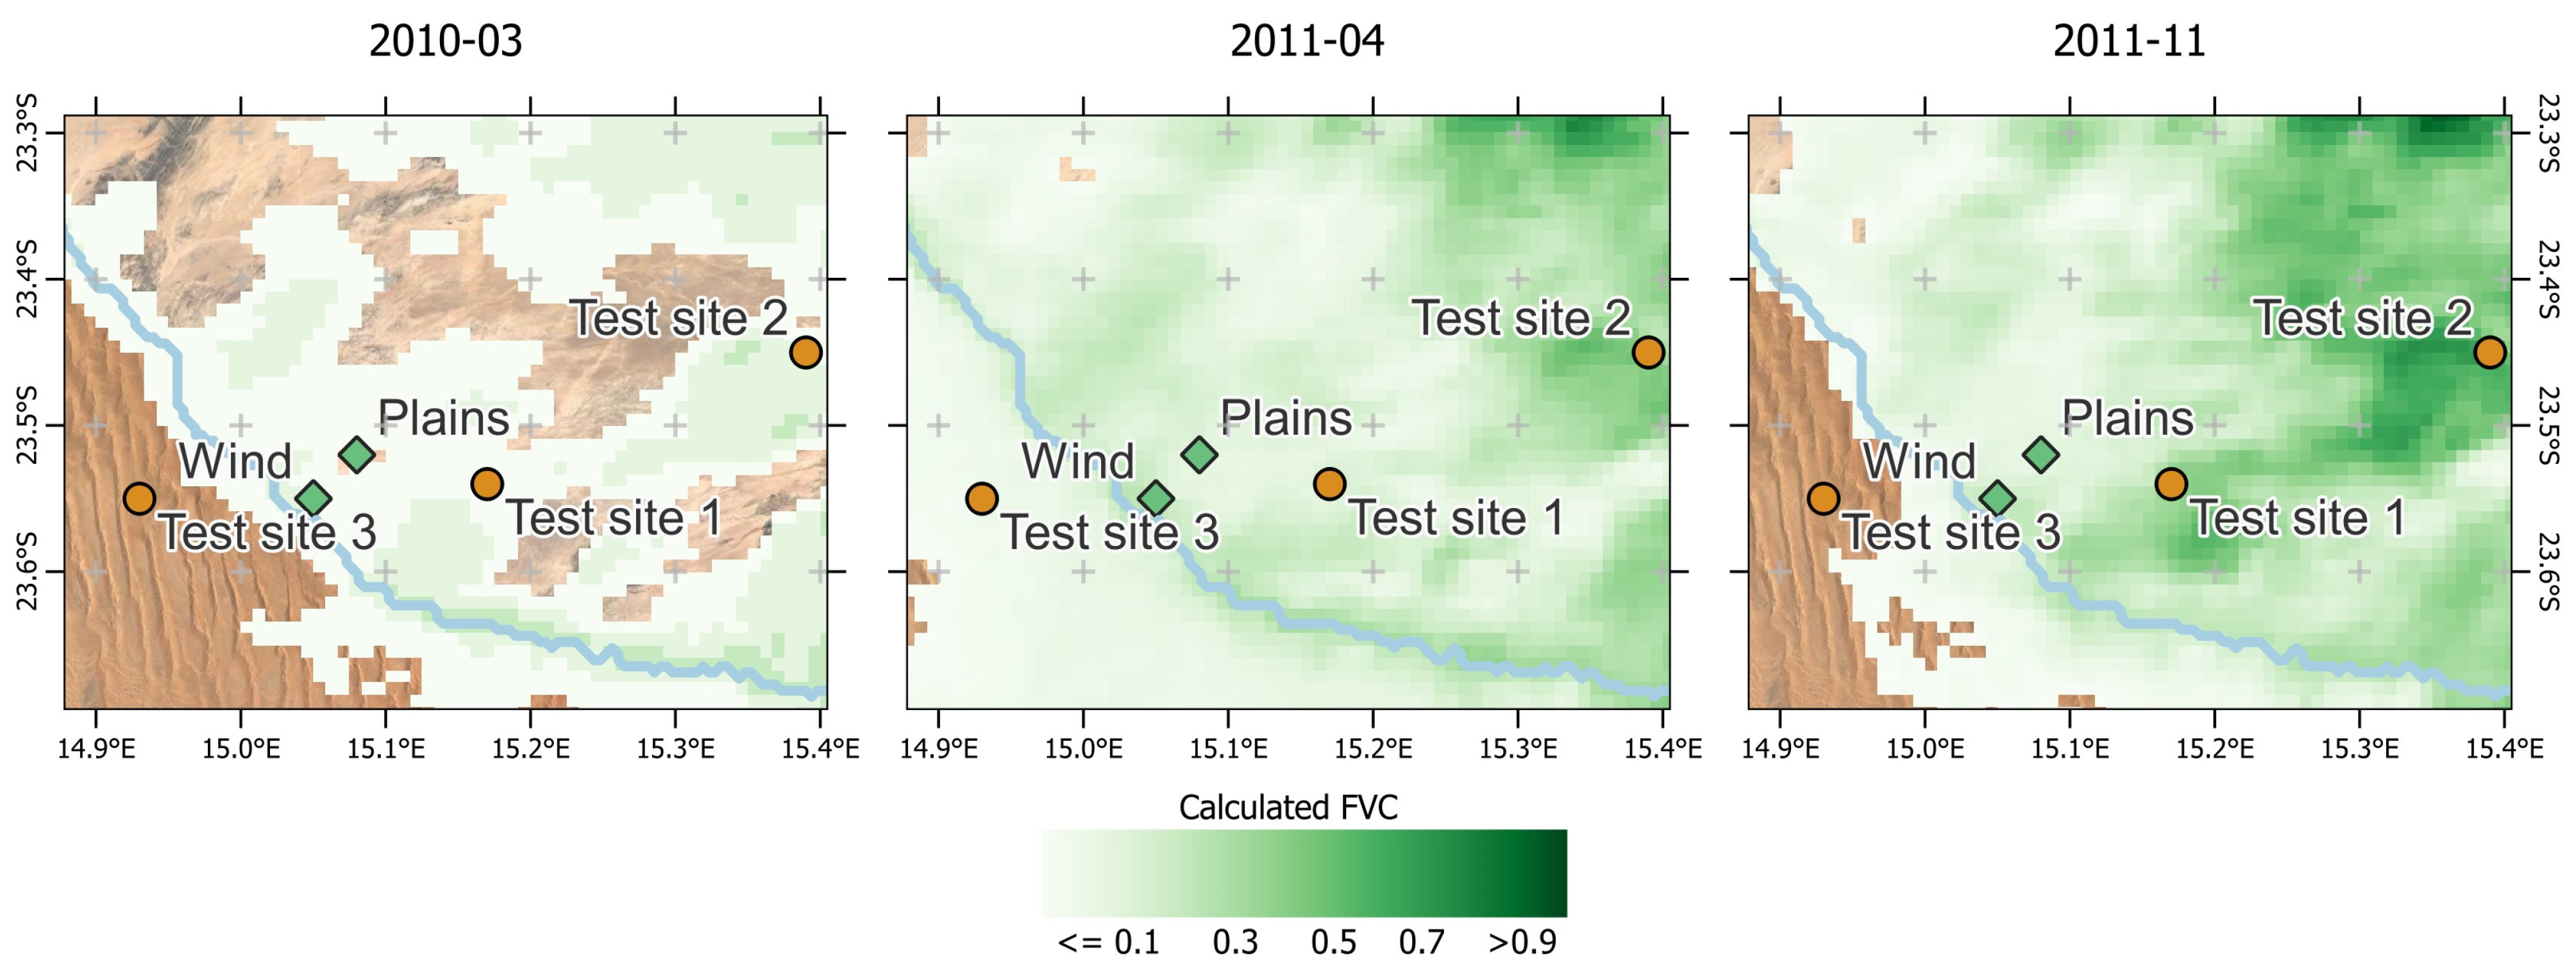
2.3.2. Field Photographs
2.3.3. Rainfall Record
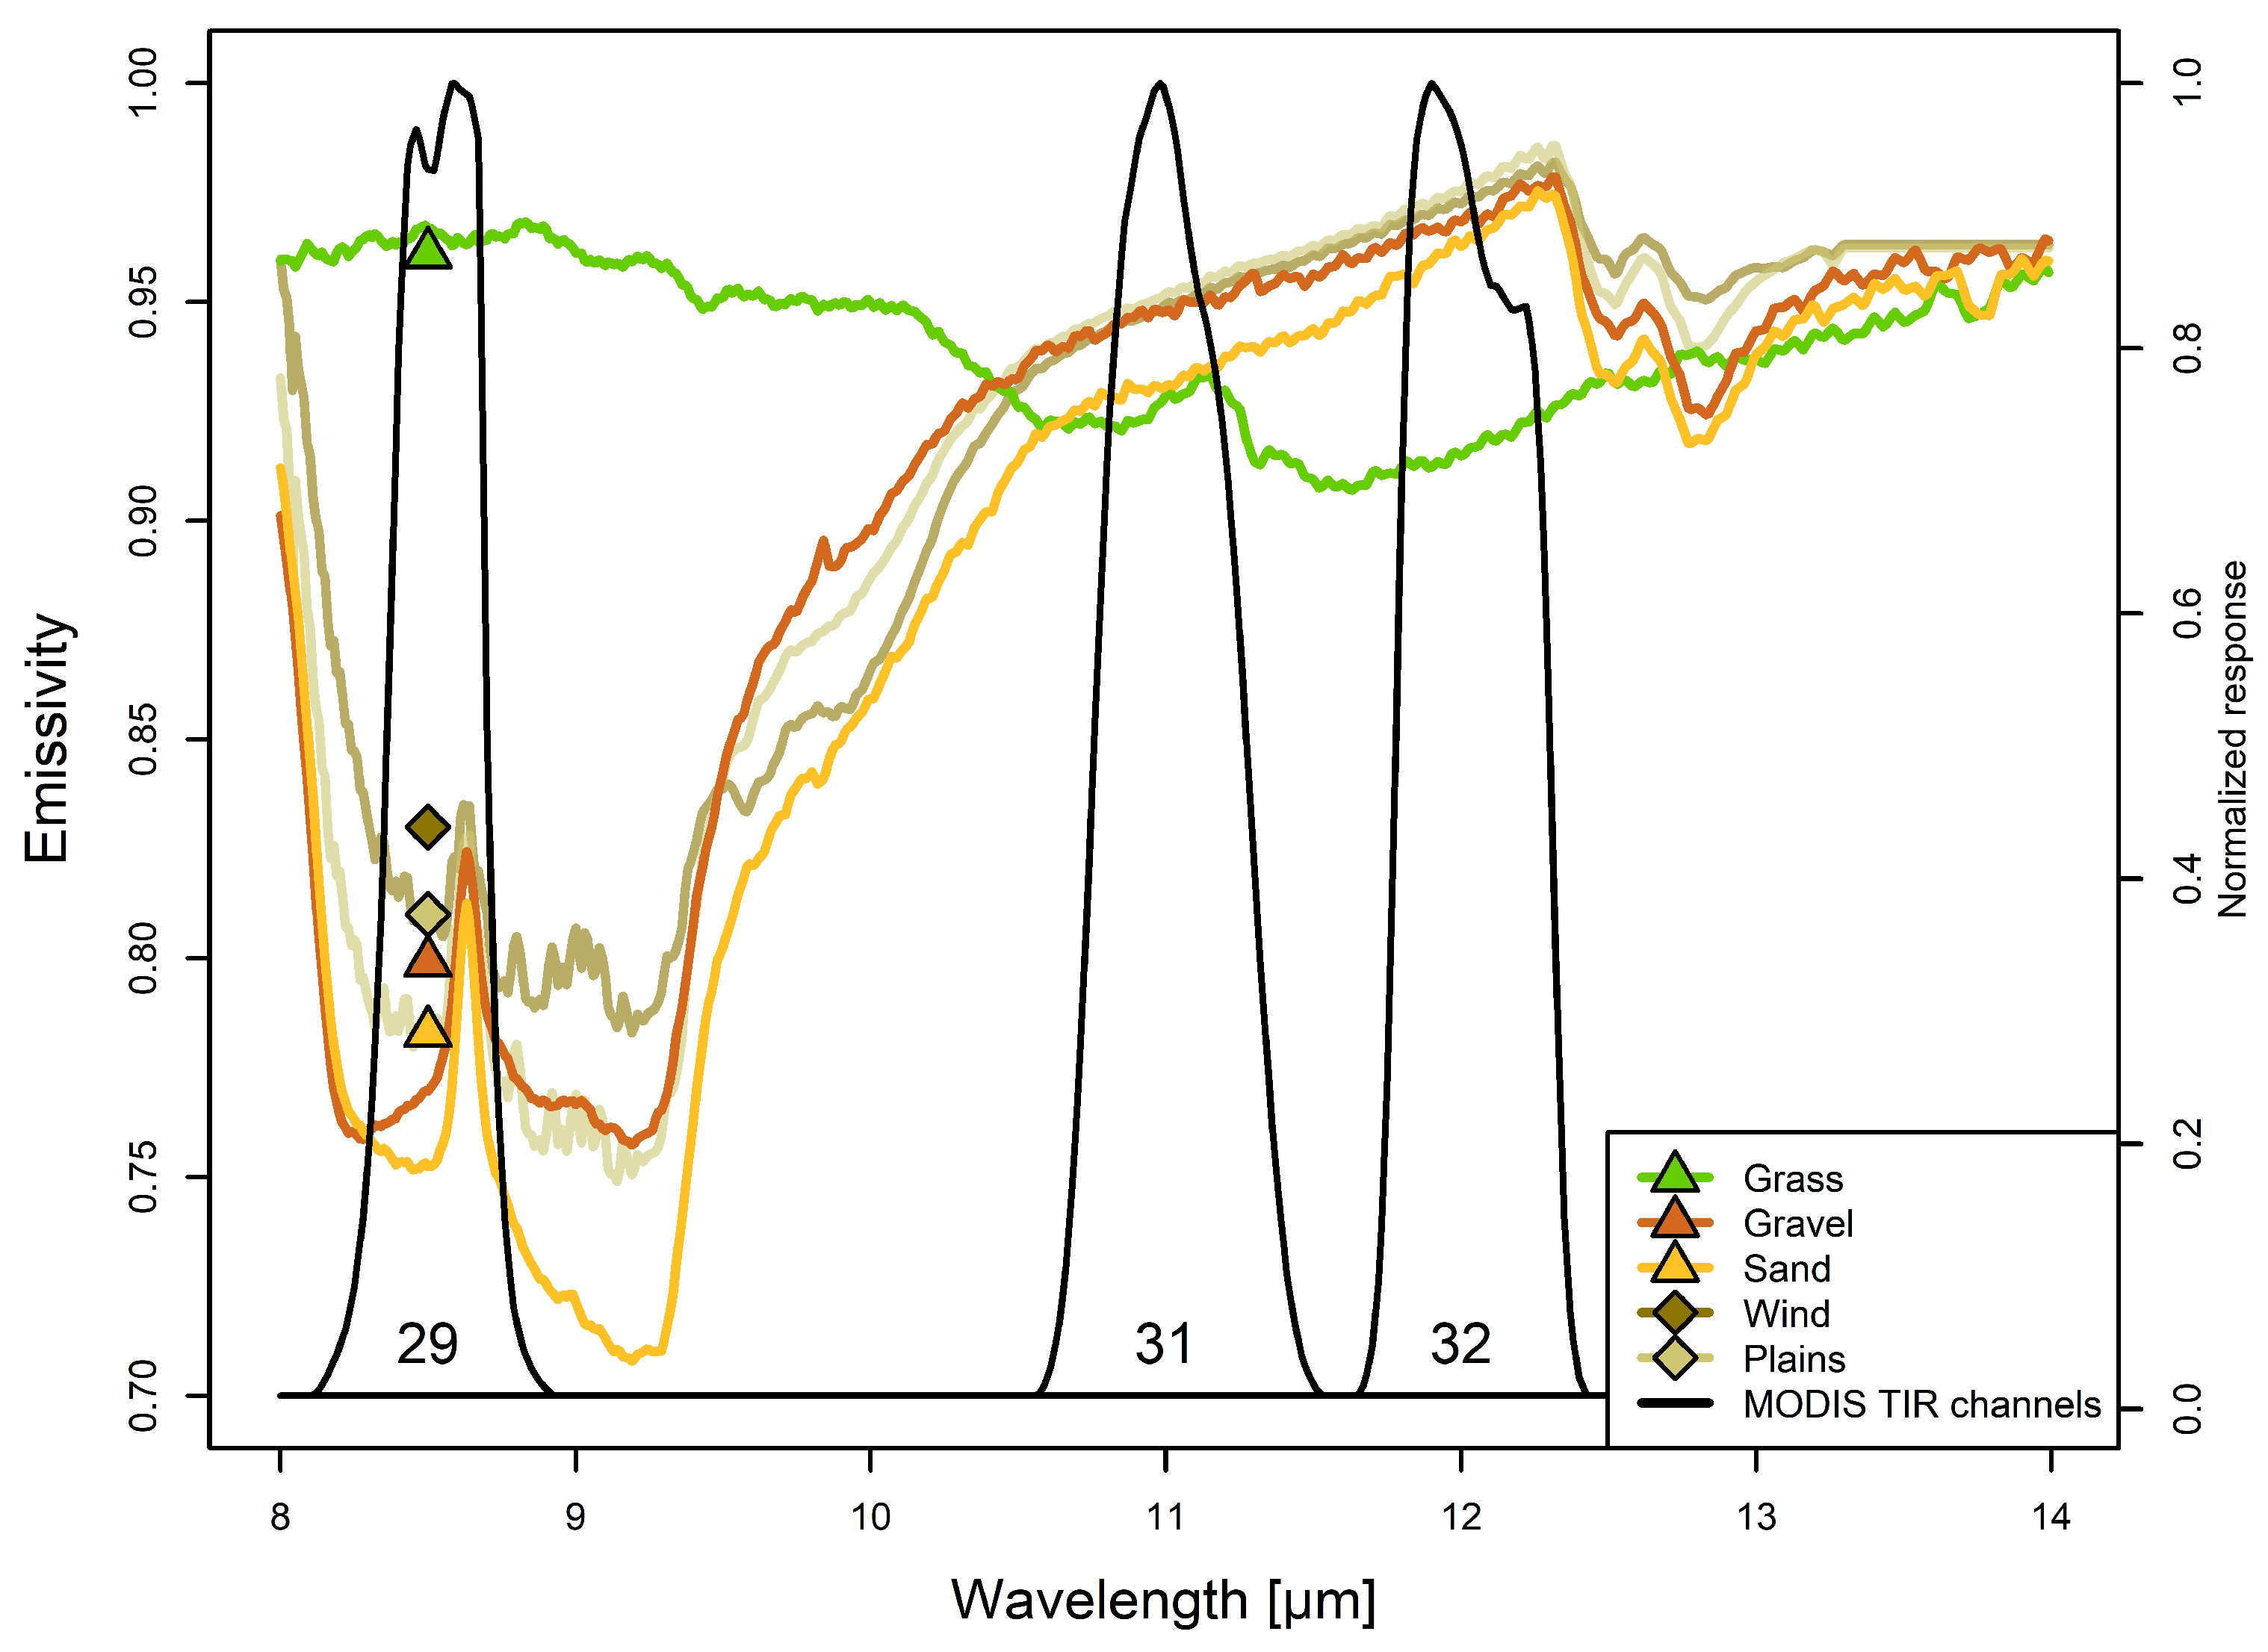
2.3.4. Lab- and In-Situ-Retrieved Emissivity Spectra
3. Results
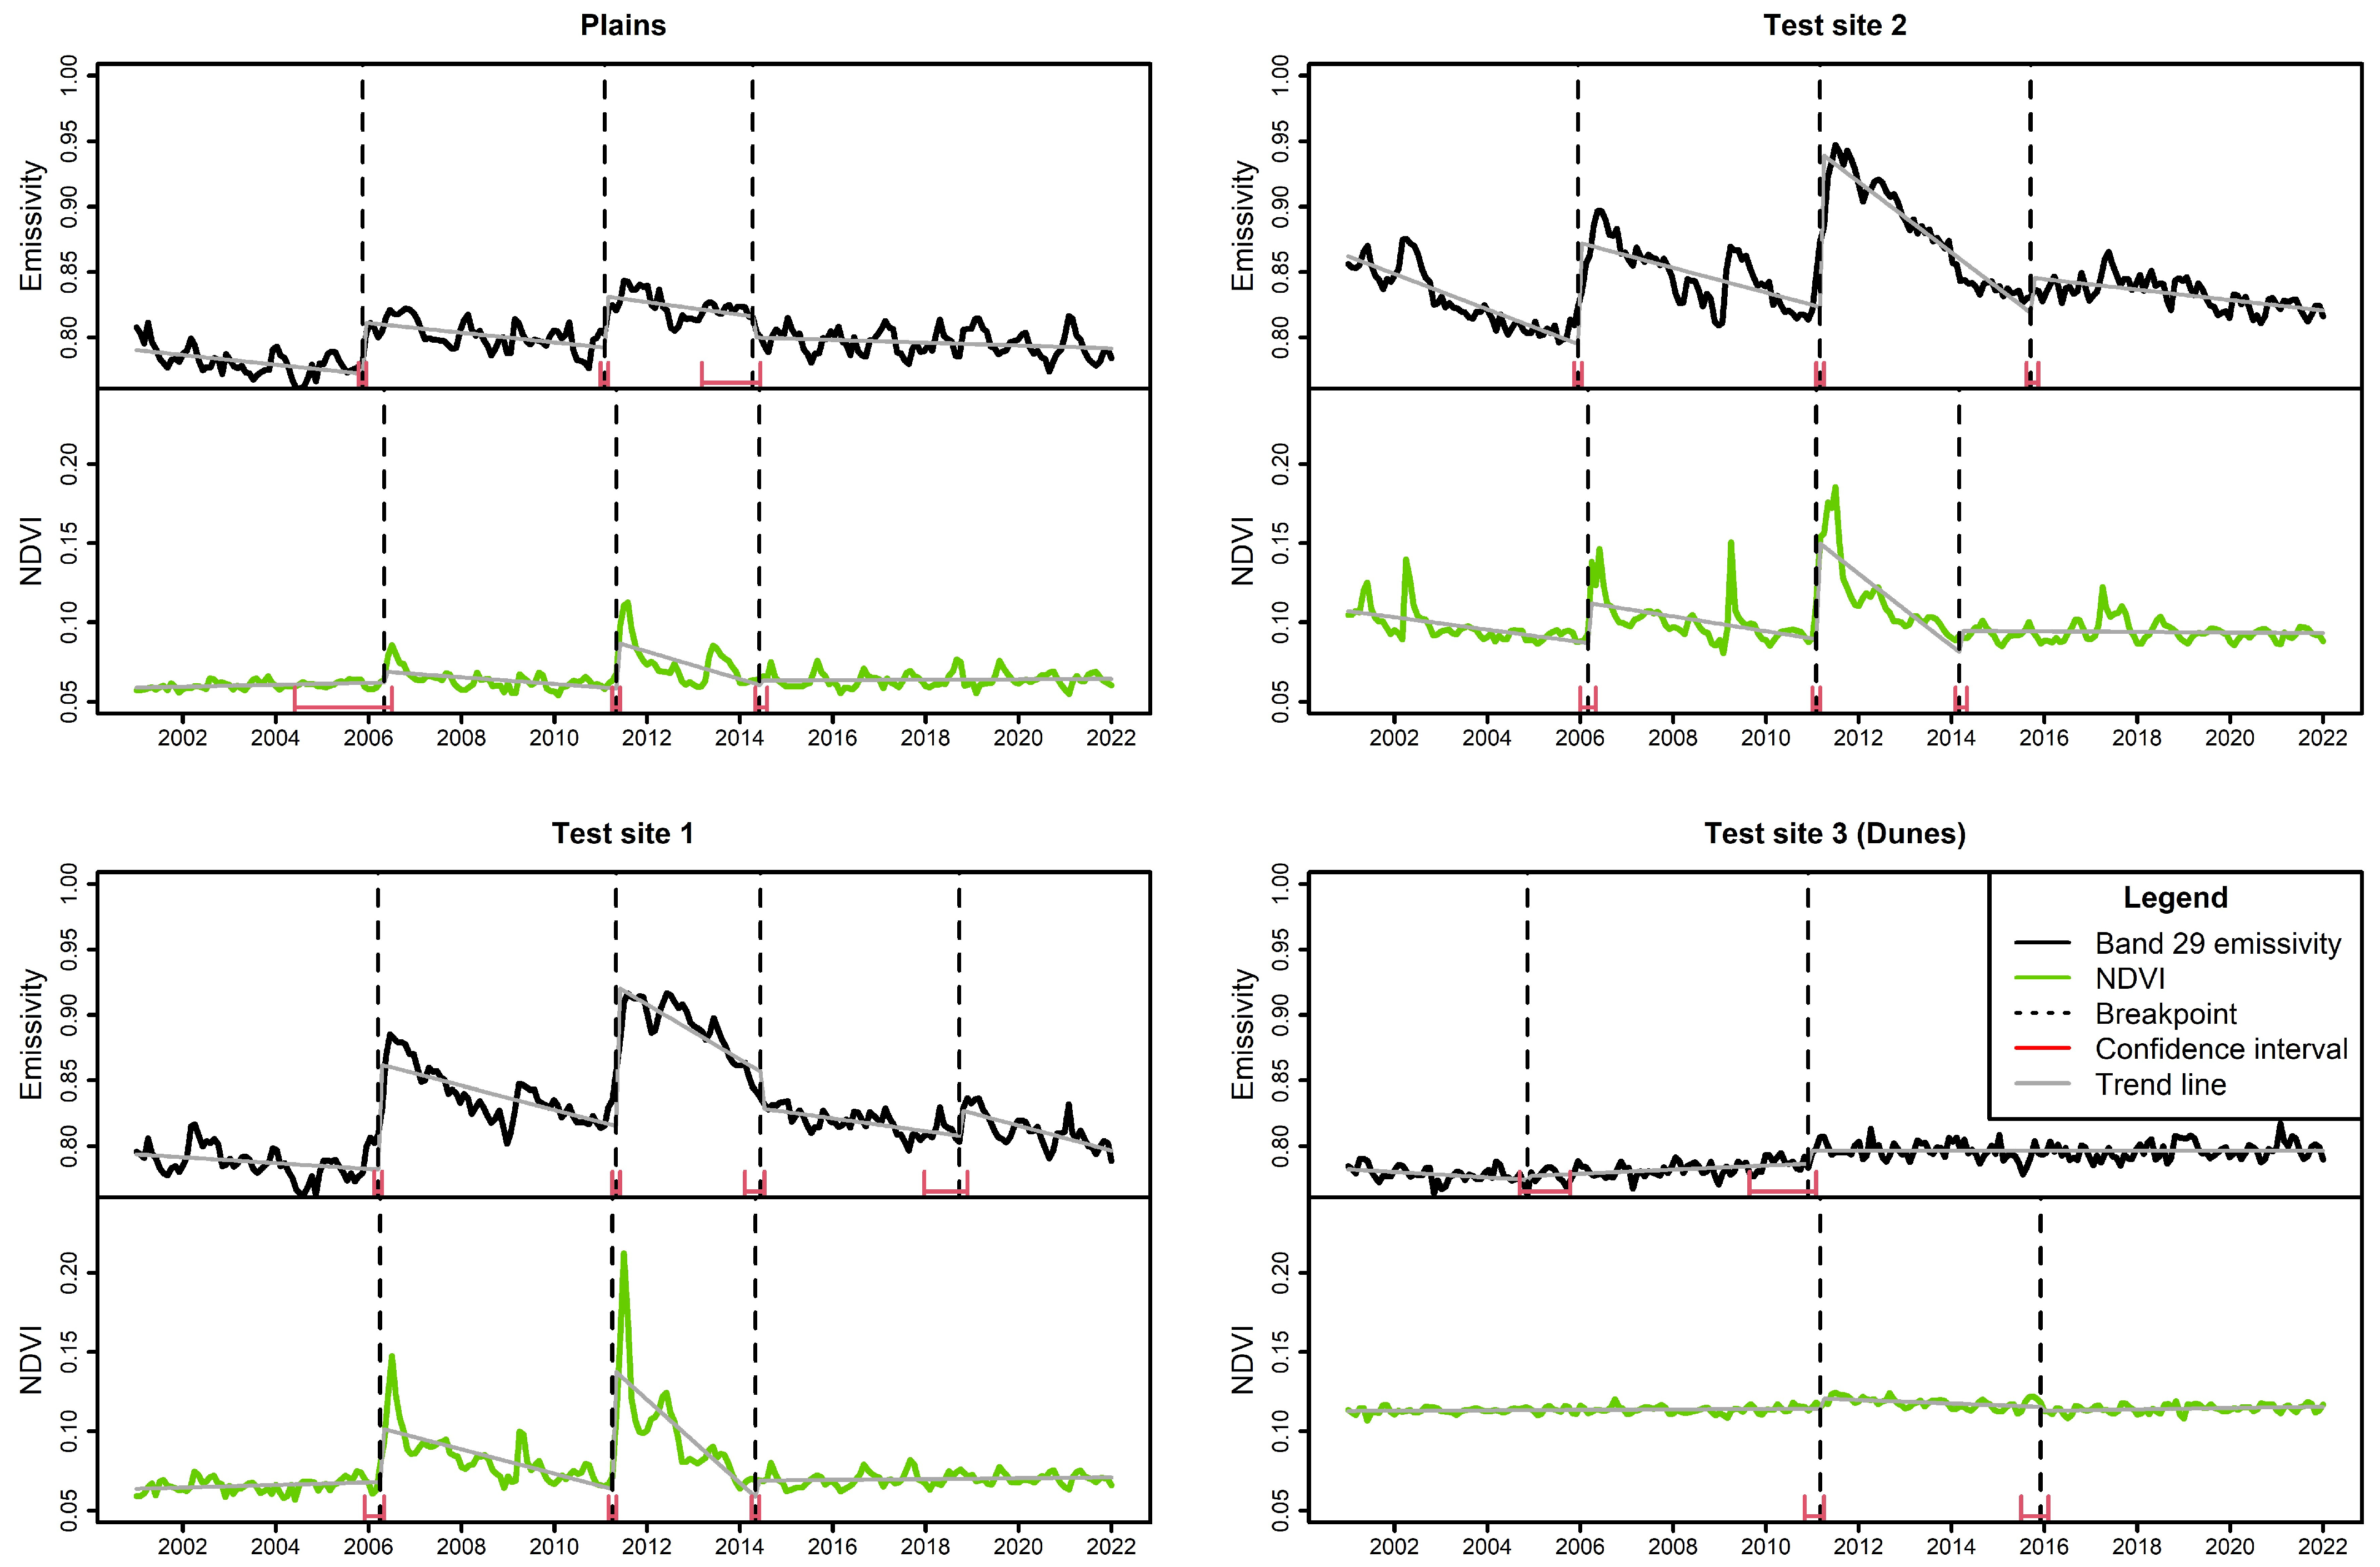
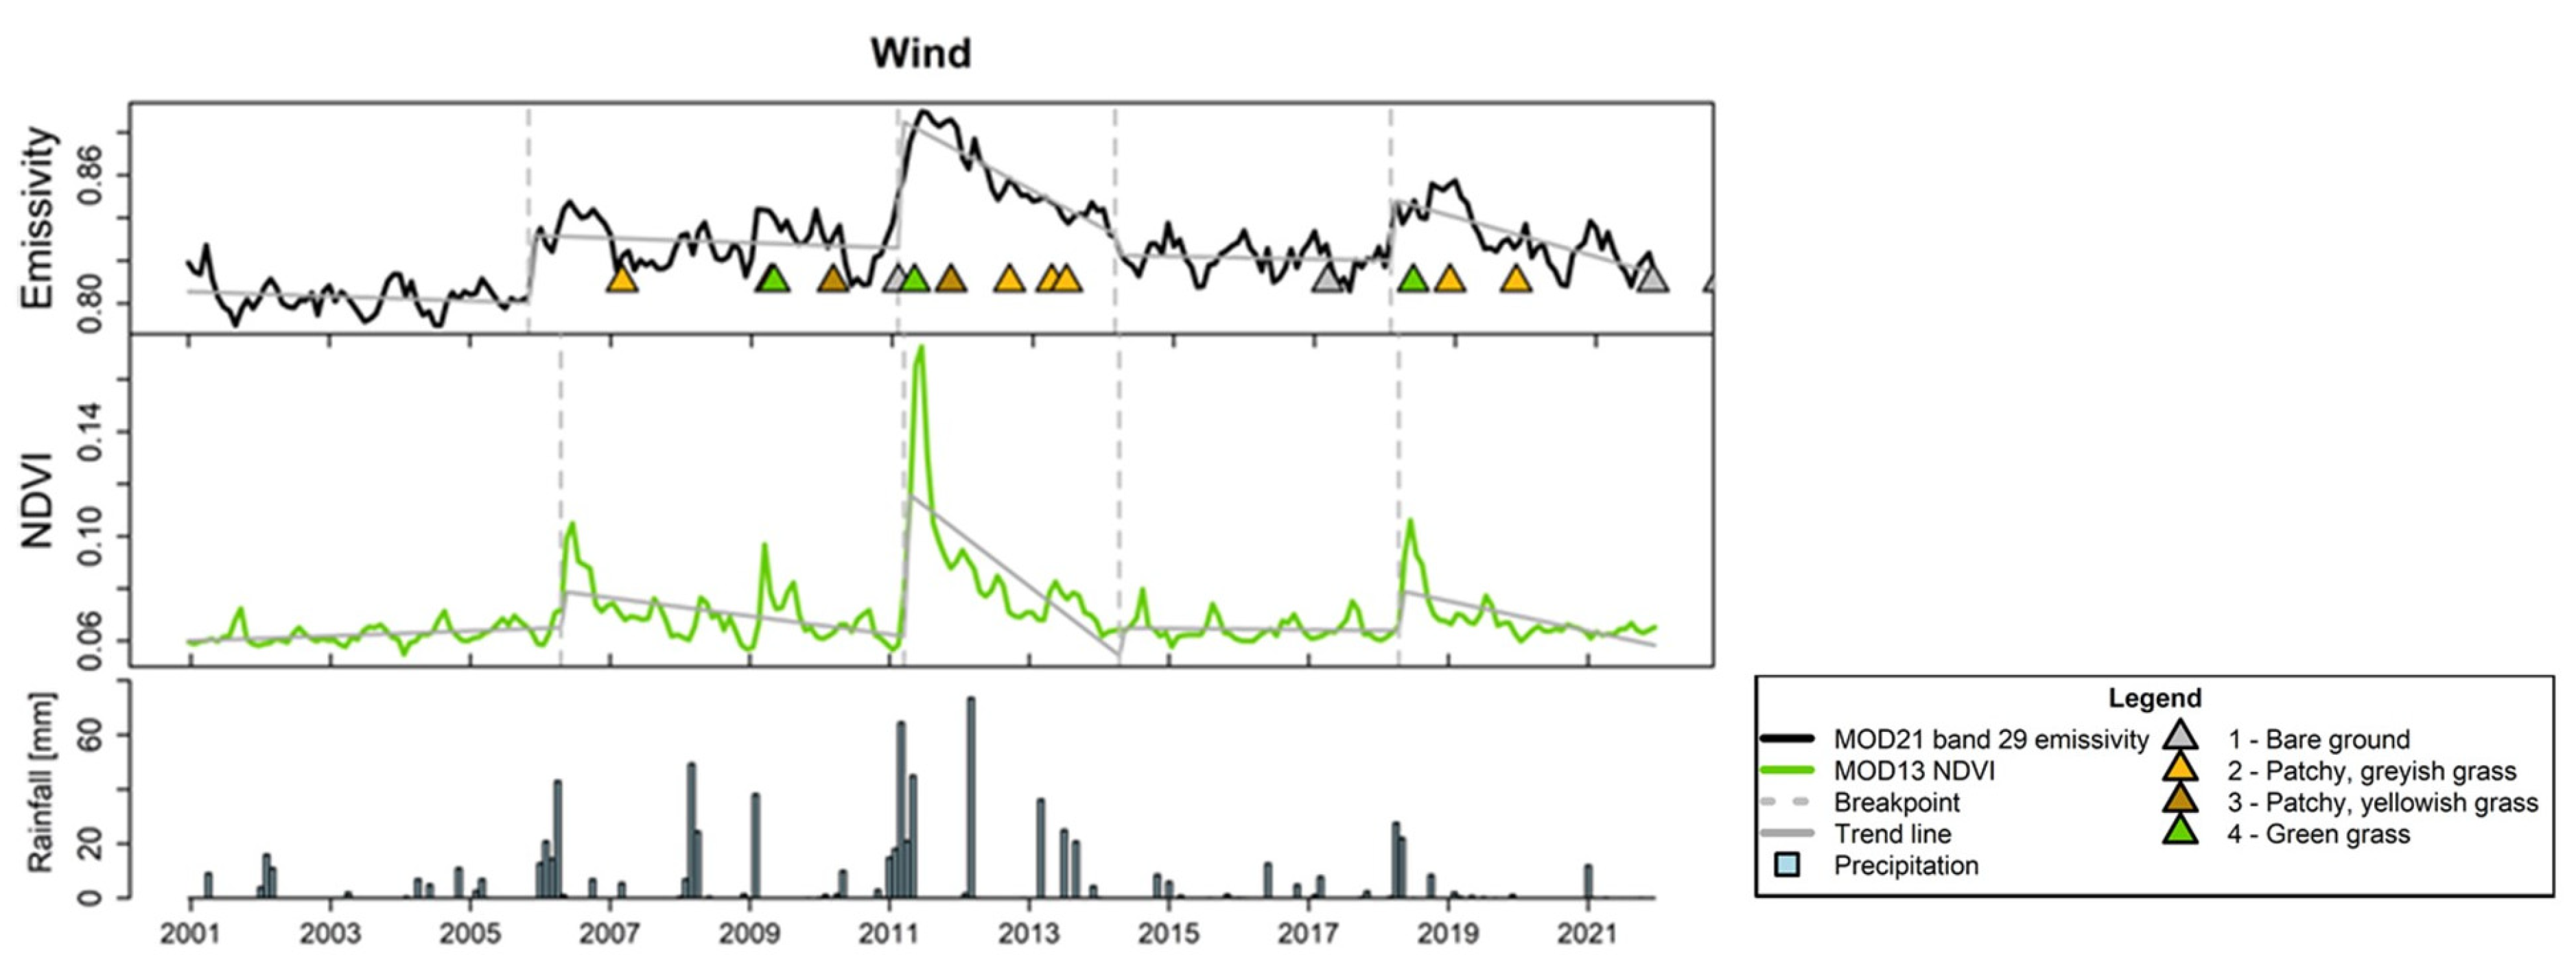
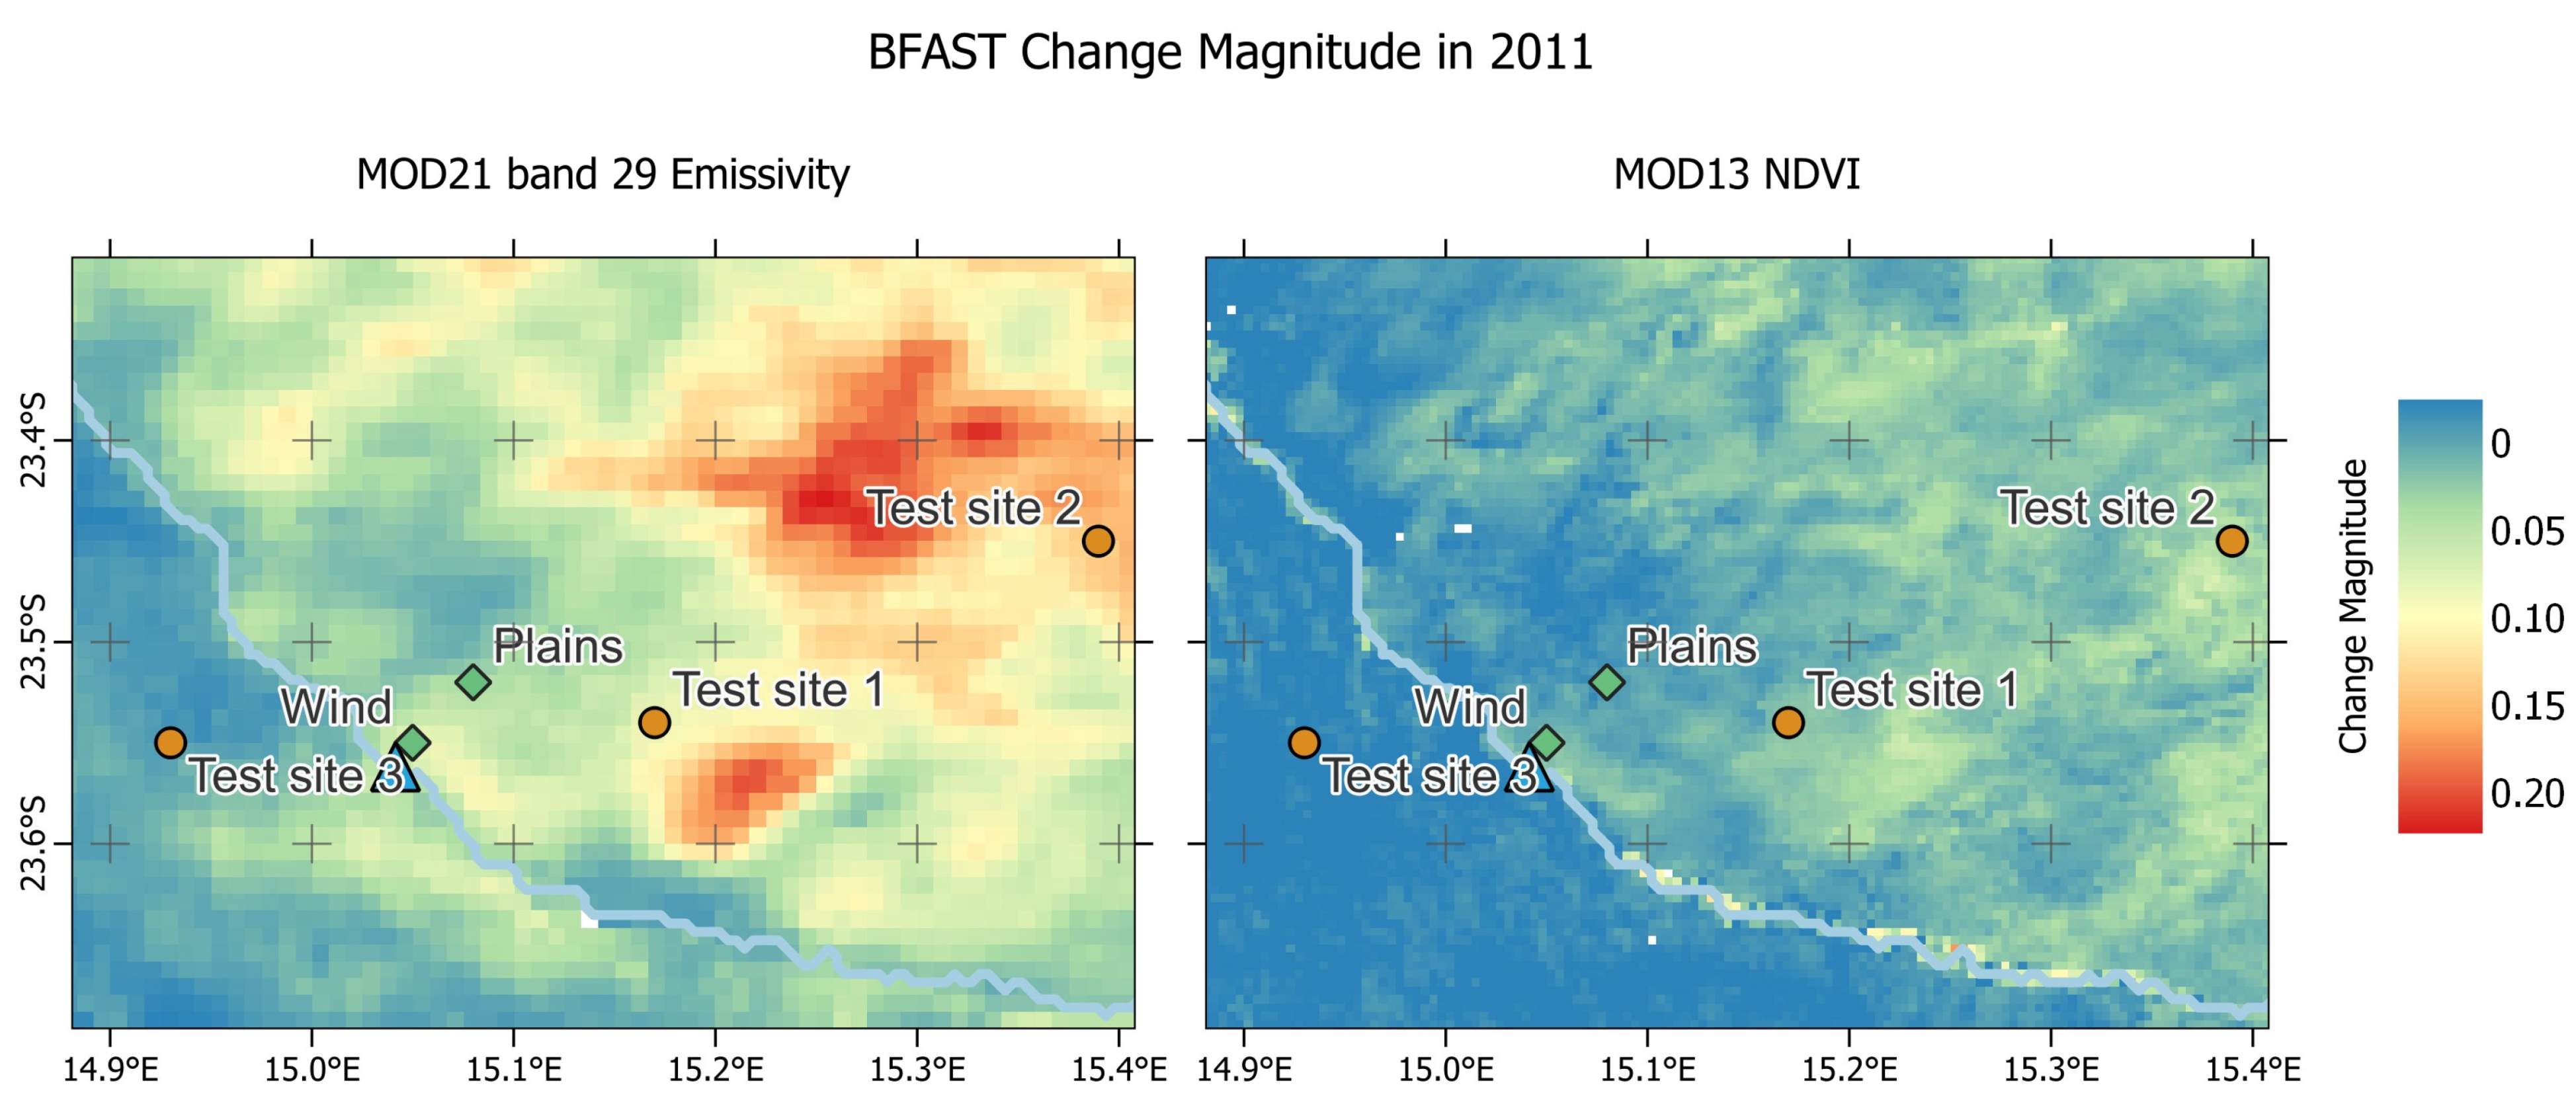
3.1. Change Detection with BFAST
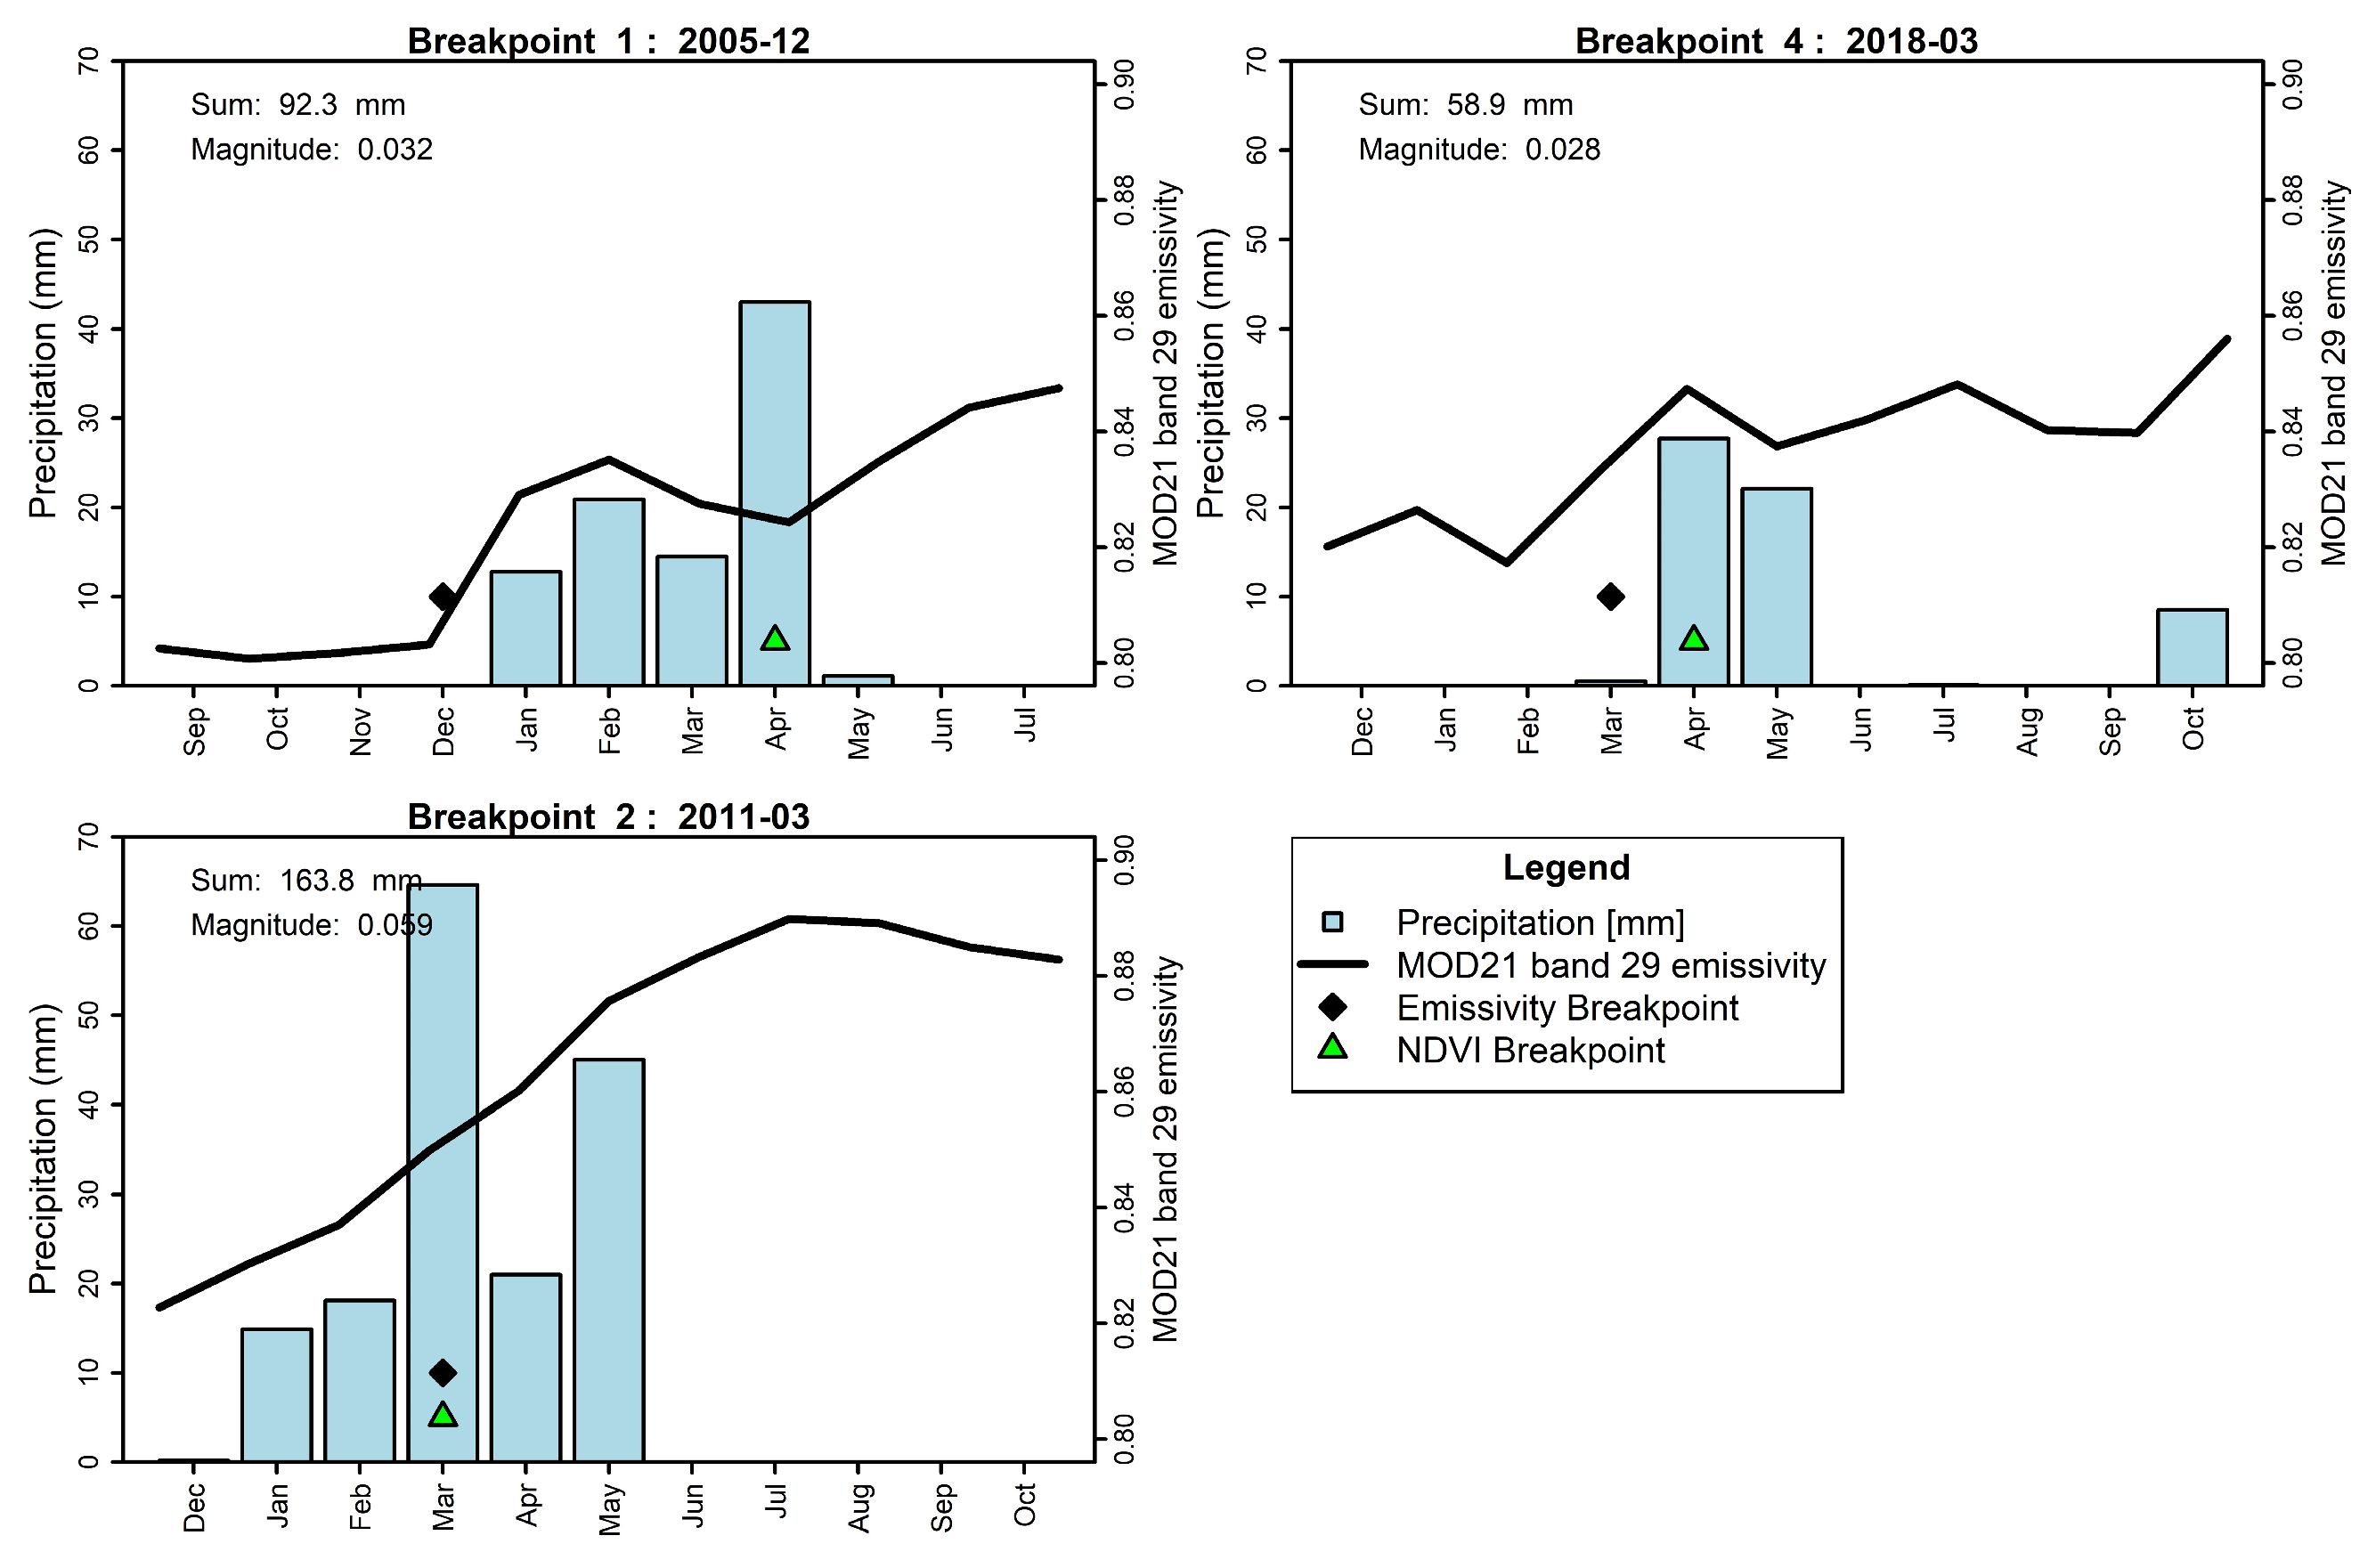
3.1.1. Breakpoint Analysis with GNRI Rainfall Record
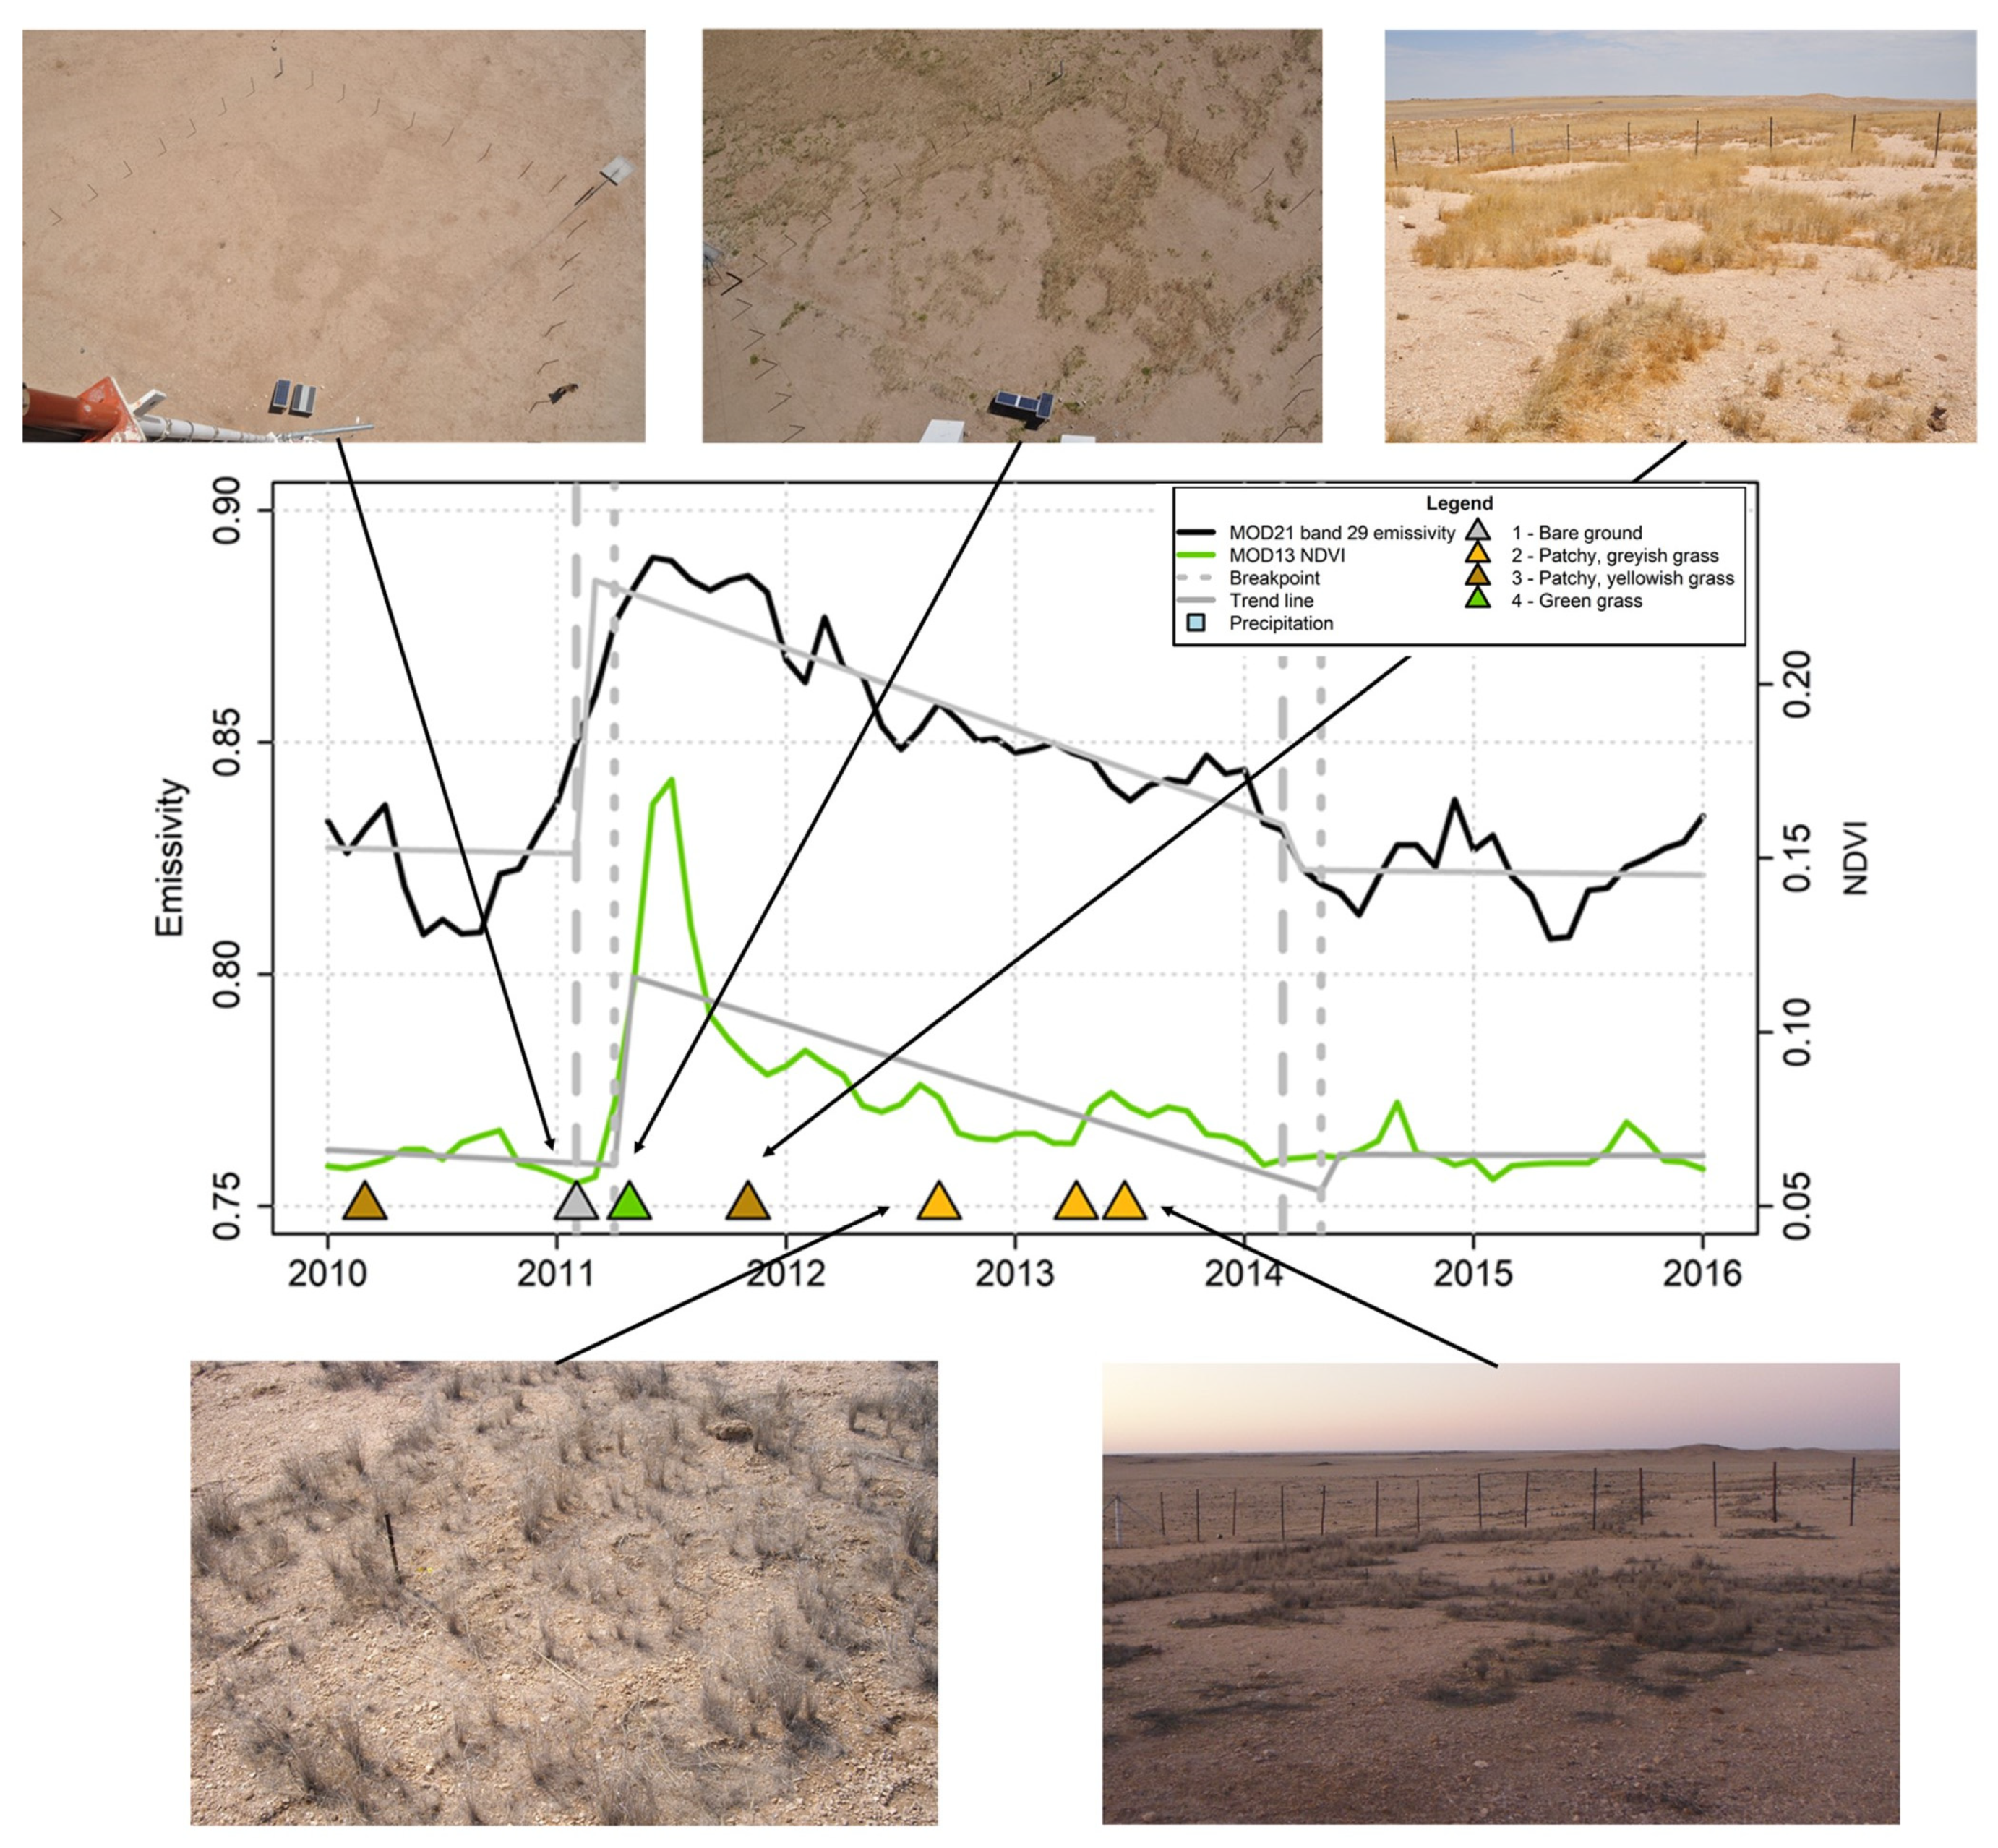
3.1.2. Breakpoint Analysis with Field Photographs
3.2. Change Detection with BFASTspatial
3.3. Potential for Estimating FVC
4. Discussion
4.1. Results in Context of FVC Change
4.2. Effects on LSE Other Than FVC Change
4.2.1. Directional View Angle Effects
4.2.2. Soils and Soil Moisture
4.3. Limitations
5. Conclusions and Outlook
Supplementary Materials
Author Contributions
Funding
Data Availability Statement
Acknowledgments
Conflicts of Interest
References
- Prince, S.D. Satellite Remote Sensing of Primary Production: Comparison of Results for Sahelian Grasslands 1981–1988. Int. J. Remote Sens. 1991, 12, 1301–1311. [Google Scholar] [CrossRef]
- Schimel, D.S.; House, J.I.; Hibbard, K.A.; Bousquet, P.; Ciais, P.; Peylin, P.; Braswell, B.H.; Apps, M.J.; Baker, D.; Bondeau, A.; et al. Recent Patterns and Mechanisms of Carbon Exchange by Terrestrial Ecosystems. Nature 2001, 414, 169–172. [Google Scholar] [CrossRef] [PubMed]
- Nemani, R.R.; Running, S.W.; Pielke, R.A.; Chase, T.N. Global Vegetation Cover Changes from Coarse Resolution Satellite Data. J. Geophys. Res. Atmos. 1996, 101, 7157–7162. [Google Scholar] [CrossRef]
- Wittich, K.-P. Some Simple Relationships between Land-Surface Emissivity, Greenness and the Plant Cover Fraction for Use in Satellite Remote Sensing. Int. J. Biometeorol. 1997, 41, 58–64. [Google Scholar] [CrossRef]
- Song, W.; Mu, X.; Ruan, G.; Gao, Z.; Li, L.; Yan, G. Estimating Fractional Vegetation Cover and the Vegetation Index of Bare Soil and Highly Dense Vegetation with a Physically Based Method. Int. J. Appl. Earth Obs. Geoinf. 2017, 58, 168–176. [Google Scholar] [CrossRef]
- Zhang, X.; Liao, C.; Li, J.; Sun, Q. Fractional Vegetation Cover Estimation in Arid and Semi-Arid Environments Using: HJ-1 Satellite Hyperspectral Data. Int. J. Appl. Earth Obs. Geoinf. 2013, 21, 506–512. [Google Scholar] [CrossRef]
- Huete, A.; Didan, K.; Miura, T.; Rodriguez, E.P.; Gao, X.; Ferreira, L.G. Overview of the Radiometric and Biophysical Performance of the MODIS Vegetation Indices. Remote Sens. Environ. 2002, 83, 195–213. [Google Scholar] [CrossRef]
- Jiapaer, G.; Chen, X.; Bao, A. A Comparison of Methods for Estimating Fractional Vegetation Cover in Arid Regions. Agric. For. Meteorol. 2011, 151, 1698–1710. [Google Scholar] [CrossRef]
- French, A.N.; Schmugge, T.J.; Ritchie, J.C.; Hsu, A.; Jacob, F.; Ogawa, K. Detecting Land Cover Change at the Jornada Experimental Range, New Mexico with ASTER Emissivities. Remote Sens. Environ. 2008, 112, 1730–1748. [Google Scholar] [CrossRef]
- Seely, M.K.; Louw, G.N. First Approximation of the Effects of Rainfall on the Ecology and Energetics of a Namib Desert Dune Ecosystem. J. Arid. Environ. 1980, 3, 25–54. [Google Scholar] [CrossRef]
- Henschel, J.R.; Burke, A.; Seely, M. Temporal and Spatial Variability of Grass Productivity in the Central Namib Desert. Afr. Study Monogr. 2005, 30, 43–56. [Google Scholar]
- Eckardt, F.D.; Soderberg, K.; Coop, L.J.; Muller, A.A.; Vickery, K.J.; Grandin, R.D.; Jack, C.; Kapalanga, T.S.; Henschel, J. The Nature of Moisture at Gobabeb, in the Central Namib Desert. J. Arid. Environ. 2013, 93, 7–19. [Google Scholar] [CrossRef]
- Juergens, N.; Oldeland, J.; Hachfeld, B.; Erb, E.; Schultz, C. Ecology and Spatial Patterns of Large-Scale Vegetation Units within the Central Namib Desert. J. Arid. Environ. 2013, 93, 59–79. [Google Scholar] [CrossRef]
- Seely, M.K. The Namib Dune Desert: An Unusual Ecosystem. J. Arid. Environ. 1978, 1, 117–128. [Google Scholar] [CrossRef]
- Westinga, E.; Beltran, A.P.R.; de Bie, C.A.J.M.; van Gils, H.A.M.J. A Novel Approach to Optimize Hierarchical Vegetation Mapping from Hyper-Temporal NDVI Imagery, Demonstrated at National Level for Namibia. Int. J. Appl. Earth Obs. Geoinf. 2020, 91, 102152. [Google Scholar] [CrossRef]
- Du Plessis, W.P. Linear Regression Relationships between NDVI, Vegetation and Rainfall in Etosha National Park, Namibia. J. Arid. Environ. 1999, 42, 235–260. [Google Scholar] [CrossRef]
- Eisfelder, C.; Kuenzer, C.; Dech, S. Derivation of Biomass Information for Semi-Arid Areas Using Remote-Sensing Data. Int. J. Remote Sens. 2012, 33, 2937–2984. [Google Scholar] [CrossRef]
- Geng, X.; Wang, X.; Fang, H.; Ye, J.; Han, L.; Gong, Y.; Cai, D. Vegetation Coverage of Desert Ecosystems in the Qinghai-Tibet Plateau Is Underestimated. Ecol. Indic. 2022, 137, 108780. [Google Scholar] [CrossRef]
- Hulley, G.; Veraverbeke, S.; Hook, S. Thermal-Based Techniques for Land Cover Change Detection Using a New Dynamic MODIS Multispectral Emissivity Product (MOD21). Remote Sens. Environ. 2014, 140, 755–765. [Google Scholar] [CrossRef]
- Wan, Z.; Dozier, J. A generalized split-window algorithm for retrieving land-surface temperature from space. IEEE Trans. Geosci. Remote Sens 1996, 34, 892–905. [Google Scholar]
- Hulley, G.C.; Malakar, N.K.; Islam, T.; Freepartner, R.J. NASA’s MODIS and VIIRS Land Surface Temperature and Emissivity Products: A Long-Term and Consistent Earth System Data Record. IEEE J. Sel. Top. Appl. Earth Obs. Remote Sens. 2018, 11, 522–535. [Google Scholar] [CrossRef]
- French, A.N.; Schmugge, T.J.; Kustas, W.P. Discrimination of Senescent Vegetation Using Thermal Emissivity Contrast. Remote Sens. Environ. 2000, 74, 249–254. [Google Scholar] [CrossRef]
- Hulley, G.; Hook, S. Intercomparison of Versions 4, 4.1 and 5 of the MODIS Land Surface Temperature and Emissivity Products and Validation with Laboratory Measurements of Sand Samples from the Namib Desert, Namibia. Remote Sens. Environ. 2009, 113, 1313–1318. [Google Scholar] [CrossRef]
- Bork-Unkelbach, A. Extrapolation von in-situ Landoberflächentemperaturen auf Satellitenpixel. Ph.D. Thesis, Karlsruher Institut für Technologie, Karlsruhe, Germany, 2012. [Google Scholar]
- White, F. The Vegetation of Africa. Nat. Resour. Res. 1983, 20, 356. [Google Scholar]
- Göttsche, F.; Hulley, G. Validation of Six Satellite-Retrieved Land Surface Emissivity Products over Two Land Cover Types in a Hyper-Arid Region. Remote Sens. Environ. 2012, 124, 149–158. [Google Scholar] [CrossRef]
- Göttsche, F.; Olesen, F.; Poutier, L.; Langlois, S.; Wimmer, W.; Santos, V.G.; Coll, C.; Niclos, R.; Arbelo, M.; Monchau, J.-P. Report from the Field Inter-Comparison Experiment (FICE) for Land Surface Temperature. Identity 2017, 9, 0929b3d2a06f1e6010. [Google Scholar]
- Morrison, J.; Higginbottom, T.P.; Symeonakis, E.; Jones, M.J.; Omengo, F.; Walker, S.L.; Cain, B. Detecting Vegetation Change in Response to Confining Elephants in Forests Using MODIS Time-Series and BFAST. Remote Sens. 2018, 10, 1075. [Google Scholar] [CrossRef]
- Verbesselt, J.; Hyndman, R.; Newnham, G.; Culvenor, D. Detecting Trend and Seasonal Changes in Satellite Image Time Series. Remote Sens. Environ. 2010, 114, 106–115. [Google Scholar] [CrossRef]
- Verbesselt, J.; Masiliunas, D.; Zeileis, A.; Appel, M. Bfast: Breaks for Additive Season and Trend. Available online: https://bfast2.github.io/ (accessed on 1 December 2022).
- Browning, D.M.; Maynard, J.J.; Karl, J.W.; Peters, D.C. Breaks in MODIS Time Series Portend Vegetation Change: Verification Using Long-Term Data in an Arid Grassland Ecosystem: Verification. Ecol. Appl. 2017, 27, 1677–1693. [Google Scholar] [CrossRef]
- Dutrieux, L.; DeVries, B.; Verbesselt, J. BfastSpatial: Utilities to Monitor for Change on Satellite Image Time-Series. 2016. Available online: https://github.com/loicdtx/bfastSpatial (accessed on 28 December 2023).
- Earthdata Search. Earth Science Data and Information System (ESDIS) Project, Earth Science Projects Division (ESPD); NASA: Washington, DC, USA, 2019. Available online: https://www.earthdata.nasa.gov/ (accessed on 5 March 2023).
- Hulley, G.; Hughes, C.G.; Hook, S.J. Quantifying Uncertainties in Land Surface Temperature and Emissivity Retrievals from ASTER and MODIS Thermal Infrared Data. J. Geophys. Res. Atmos. 2012, 117, D23113. [Google Scholar] [CrossRef]
- Rouse, J.W.; Haas, R.H.; Schell, J.A.; Deering, D.W.; Harlan, J.C. Monitoring the Vernal Advancement and Retrogradiation (Greenwave Effect) of Natural Vegetation; NASA’s Goddard Space Flight Center: Greenbelt, MD, USA, 1974.
- Huang, S.; Tang, L.; Hupy, J.P.; Wang, Y.; Shao, G. A Commentary Review on the Use of Normalized Difference Vegetation Index (NDVI) in the Era of Popular Remote Sensing. J. For. Res. 2021, 32, 1–6. [Google Scholar] [CrossRef]
- Ravibabu Mandla, V.; Vani, V. Comparative Study of NDVI and SAVI Vegetation Indices in Anantapur District Semi-Arid Areas. Int. J. Civ. Eng. Technol. 2017, 8, 559–566. [Google Scholar]
- Hu, T.; Hulley, G.C.; Mallick, K.; Szantoi, Z.; Hook, S. Comparison between the ASTER and ECOSTRESS Global Emissivity Datasets. Int. J. Appl. Earth Obs. Geoinf. 2023, 118, 103227. [Google Scholar] [CrossRef]
- Dybbroe, A.; Scheirer, R.; Raspaud, M.; Hoese, D.; Zhang, X.; Proud, S.R. Satellite Sensor Relative Spectral Response Data, Version v1.1.0 2022. Available online: https://zenodo.org/records/6557386 (accessed on 29 July 2022).
- Brunsell, N.A.; Glllies, R.R. Incorporating Surface Emissivity into a Thermal Atmospheric Correction. Photogramm. Eng. Remote Sens. 2002, 68, 1263–1270. [Google Scholar]
- Valor, E.; Caselles, V. Mapping Land Surface Emissivity from NDVI: Application to European, African, and South American Areas. Remote Sens. Environ. 1995, 57, 167–184. [Google Scholar] [CrossRef]
- Garcia-Santos, V. Determination of the Surface Temperature by Remote Sensing. Tethys J. Weather Clim. West. Mediterr. 2010, 7, 67–74. [Google Scholar] [CrossRef]
- Shen, Q.; Gao, G.; Han, F.; Xiao, F.; Ma, Y.; Wang, S.; Fu, B. Quantifying the Effects of Human Activities and Climate Variability on Vegetation Cover Change in a Hyper-Arid Endorheic Basin. Land. Degrad. Dev. 2018, 29, 3294–3304. [Google Scholar] [CrossRef]
- Schmidt, H.; Karnieli, A. Sensitivity of Vegetation Indices to Substrate Brightness in Hyper-Arid Environment: The Makhtesh Ramon Crater (Israel) Case Study. Int. J. Remote Sens. 2001, 22, 3503–3520. [Google Scholar] [CrossRef]
- Sobrino, J.A.; Jiménez-Muñoz, J.C.; Sòria, G.; Romaguera, M.; Guanter, L.; Moreno, J.; Plaza, A.; Martínez, P. Land Surface Emissivity Retrieval from Different VNIR and TIR Sensors. IEEE Trans. Geosci. Remote Sens. 2008, 46, 316–327. [Google Scholar] [CrossRef]
- Schmidt, H.; Karnieli, A. Remote Sensing of the Seasonal Variability of Vegetation in a Semi-Arid Environment. J. Arid. Environ. 2000, 45, 43–59. [Google Scholar] [CrossRef]
- Watts, L.M.; Laffan, S.W. Effectiveness of the BFAST Algorithm for Detecting Vegetation Response Patterns in a Semi-Arid Region. Remote Sens. Environ. 2014, 154, 234–245. [Google Scholar] [CrossRef]
- Hulley, G.; Malakar, N.; Freepartner, R. Moderate Resolution Imaging Spectroradiometer (MODIS) Land Surface Temperature and Emissivity Product (MxD21) Algorithm Theoretical Basis Document Collection 6.1; JPL Publication: Pasadena, CA, USA, 2016. [Google Scholar]
- García-Santos, V.; Coll, C.; Valor, E.; Niclòs, R.; Caselles, V. Analyzing the Anisotropy of Thermal Infrared Emissivity over Arid Regions Using a New MODIS Land Surface Temperature and Emissivity Product (MOD21). Remote Sens. Environ. 2015, 169, 212–221. [Google Scholar] [CrossRef]
- Mira, M.; Valor, E.; Caselles, V.; Rubio, E.; Coll, C.; Galve, J.M.; Niclòs, R.; Sánchez, J.M.; Boluda, R. Soil Moisture Effect on Thermal Infrared (813-Μm) Emissivity. IEEE Trans. Geosci. Remote Sens. 2010, 48, 2251–2260. [Google Scholar] [CrossRef]
- Krug, J. Site-Species Matching and Planting Techniques for Arid-Zone Forestry in Namibia; Cuvillier Verlag: Göttingen Germany, 2017. [Google Scholar]
- Mu, X.; Hu, M.; Song, W.; Ruan, G.; Ge, Y.; Wang, J.; Huang, S.; Yan, G. Evaluation of Sampling Methods for Validation of Remotely Sensed Fractional Vegetation Cover. Remote Sens. 2015, 7, 16164–16182. [Google Scholar] [CrossRef]
- Laliberte, A.S.; Rango, A.; Herrick, J.E.; Fredrickson, E.L.; Burkett, L. An Object-Based Image Analysis Approach for Determining Fractional Cover of Senescent and Green Vegetation with Digital Plot Photography. J. Arid. Environ. 2007, 69, 1–14. [Google Scholar] [CrossRef]


| Site Name | Geographic Location | Available Data |
|---|---|---|
| Study site 1 (Wind) | −23.55°S, 15.05°E | Rain record, field photographs, NDVI and emissivity time series |
| Study site 2 (Plains) | −23.52°S, 15.08°E | Field photographs, NDVI and emissivity time series |
| Test site 1 | −23.54°S, 15.17°E | NDVI and emissivity time series |
| Test site 2 | −23.45°S, 15.39°E | NDVI and emissivity time series |
| Test site 3 (Dunes) | −23.55°S, 14.93°E | NDVI and emissivity time series |
| Data Product | Spatial Resolution | Temporal Resolution |
|---|---|---|
| Terra MODIS LST&E (MOD21) | L3 Global 1 km | 1 day |
| Terra MODIS Vegetation Indices (MOD13) | L3 Global 500 m | 16 days |
| FVC Class | Vegetation State |
|---|---|
| 1 | Bare ground |
| 2 | Patchy, light-grey, dry grass |
| 3 | Patchy, yellow dry grass |
| 4 | Green grass cover |
| Sample | MODIS Band 29 Channel Effective Emissivity | Standard Deviation | |
|---|---|---|---|
| Lab Spectra | Grass | 0.961 | 0.001 |
| Gravel | 0.799 | 0.020 | |
| Sand | 0.783 | 0.020 | |
| In-situ Spectra | Wind | 0.830 | 0.009 |
| Plains | 0.810 | 0.015 |
| Radiometer | FVC | dε |
|---|---|---|
| Radiometer 1 | 17% | 0.059 |
| Radiometer 2 | 26% | 0.025 |
| Mean | 21.5% | 0.039 |
| Breakpoint | Plains | Wind | Test Site 1 | Test Site 2 | Test Site 3 (Dunes) | |||||
|---|---|---|---|---|---|---|---|---|---|---|
| Emissivity | NDVI | Emissivity | NDVI | Emissivity | NDVI | Emissivity | NDVI | Emissivity | NDVI | |
| I | 0.039 | 0.007 | 0.032 | 0.014 | 0.08 | 0.033 | 0.077 | 0.025 | 0.003 | - |
| II | 0.039 | 0.028 | 0.059 | 0.054 | 0.105 | 0.074 | 0.116 | 0.06 | 0.013 | 0.006 |
| III | −0.016 | 0.003 | −0.01 | 0.011 | −0.028 | 0.01 | 0.026 | 0.013 | - | - |
| IV | - | - | 0.028 | 0.015 | 0.019 | - | - | 0.006 | −0.003 | |
| Breakpoint I | Breakpoint II | Breakpoint III | Breakpoint IV | |||||
|---|---|---|---|---|---|---|---|---|
| Site | Month | Δ | Month | Δ | Month | Δ | Month | Δ |
| Wind | 2005-12 | 4 | 2011-03 | 0 | (2014-04) | 0 | 2018-03 | 1 |
| Plains | 2005-12 | 4 | 2011-02 | 2 | (2014-04) | 1 | - | - |
| Test site 1 | 2006-04 | −1 | 2011-05 | −2 | (2014-06) | −2 | 2018-09 | - |
| Test site 2 | 2006-01 | 1 | 2011-03 | −2 | 2015-09 | −19 | - | - |
| Test site 3 (Dunes) | (2004-12) | - | 2010-12 | 4 | - | - | (2017-11) | |
Disclaimer/Publisher’s Note: The statements, opinions and data contained in all publications are solely those of the individual author(s) and contributor(s) and not of MDPI and/or the editor(s). MDPI and/or the editor(s) disclaim responsibility for any injury to people or property resulting from any ideas, methods, instructions or products referred to in the content. |
© 2023 by the authors. Licensee MDPI, Basel, Switzerland. This article is an open access article distributed under the terms and conditions of the Creative Commons Attribution (CC BY) license (https://creativecommons.org/licenses/by/4.0/).
Share and Cite
Obrecht, L.; Göttsche, F.-M.; Senn, J.A.; Cermak, J. Mapping Changes in Fractional Vegetation Cover on the Namib Gravel Plains with Satellite-Retrieved Land Surface Emissivity Data. Remote Sens. 2024, 16, 159. https://doi.org/10.3390/rs16010159
Obrecht L, Göttsche F-M, Senn JA, Cermak J. Mapping Changes in Fractional Vegetation Cover on the Namib Gravel Plains with Satellite-Retrieved Land Surface Emissivity Data. Remote Sensing. 2024; 16(1):159. https://doi.org/10.3390/rs16010159
Chicago/Turabian StyleObrecht, Laura, Frank-Michael Göttsche, Johannes Antenor Senn, and Jan Cermak. 2024. "Mapping Changes in Fractional Vegetation Cover on the Namib Gravel Plains with Satellite-Retrieved Land Surface Emissivity Data" Remote Sensing 16, no. 1: 159. https://doi.org/10.3390/rs16010159
APA StyleObrecht, L., Göttsche, F.-M., Senn, J. A., & Cermak, J. (2024). Mapping Changes in Fractional Vegetation Cover on the Namib Gravel Plains with Satellite-Retrieved Land Surface Emissivity Data. Remote Sensing, 16(1), 159. https://doi.org/10.3390/rs16010159