Article

How Do Driving Factors Affect Vegetation Coverage Change in the Shaanxi Region of the Qinling Mountains?

1
College of Geological Engineering and Geomatics, Chang’an University, Xi’an 710054, China
2
Key Laboratory of Loess, Xi’an 710054, China
3
Big Data Center for Geosciences and Satellites, Xi’an 710054, China
4
Key Laboratory of Ecological Geology and Disaster Prevention, Ministry of Natural Resources, Xi’an 710054, China
5
Key Laboratory of Western China’s Mineral Resource and Geological Engineering, Ministry of Education, Xi’an 710054, China
*
Author to whom correspondence should be addressed.
Remote Sens. 2024, 16(1), 160; https://doi.org/10.3390/rs16010160
Submission received: 4 November 2023 / Revised: 27 December 2023 / Accepted: 28 December 2023 / Published: 30 December 2023
(This article belongs to the Special Issue Remote Sensing of Primary Production)

Abstract

:
Understanding the effects of natural and human disturbance factors on fractional vegetation coverage (FVC) is significant in the promotion of ecological and environmental protection. However, most of the relevant studies neglect to consider differences in the effect of driving factors on areas with different vegetation change characteristics. In this paper, we have combined Theil-Sen median trend analysis and Mann-Kendall testing to identify degraded and restored areas. Differences in the impact of various factors on FVC in terms of degradation, restoration, and the whole region were distinguished quantitatively using the geodetector model. Additionally, the constraint line approach was used to detect the influence thresholds of factors on FVC. The results are shown as below: (1) FVC showed an overall improving trend, and vegetation restoration and degradation areas accounted for 69.2% and 22.0%, respectively. (2) The two dominant factors affecting FVC were Digital Elevation Model (DEM) and temperature for both degraded and restored regions. However, the explanatory power of precipitation was noticeably different between regions. (3) Most natural factors had a “convex” constraint effect on FVC, which gradually weakened with an increase in the variable below the threshold and vice versa. Human disturbance factors negatively constrained FVC, and the constraint effect increased with increased human activity. This study can help decision-makers optimize specific implementation policies relating to ecological restoration and sustainable development.

1. Introduction

The Qinling Mountains—a climate boundary between north and south China—is an important ecological safety barrier and also plays an essential role in China’s natural ecological environment. However, human disturbance and climate change have inevitably led to fluctuations in vegetation coverage [1,2,3]. Recent studies show that vegetation coverage in the Qinling Mountains faces the dilemma of restoration accompanied by degradation [4,5,6]. Therefore, it is hugely important to monitor spatiotemporal changes in vegetation coverage in the Qinling Mountains, analyze the key factors causing degradation or restoration, and explore the influence mechanisms of various factors on vegetation coverage. This can provide references for the sustainable protection of the ecological environment in the Qinling Mountains.
Vegetation coverage change is a relatively complex process, and it has been reported that climate and topography conditions are vital factors affecting vegetation coverage patterns [7,8]. For example, temperature and precipitation regulate the organic carbon decomposition of soil [9] and plant photosynthesis by affecting the effective accumulated temperature and water content of soil, thus influencing vegetation growth [10,11]. Additionally, topography directly affects soil fertility and water retention [12]. Meanwhile, increasing human activity has also caused disturbances in the ecosystem [13]. Long-term research on vegetation change characteristics based on remote sensing is the focus of global and regional studies [14,15,16], among which the Fractional Vegetation Coverage (FVC) obtained by the Normalized Difference Vegetation Index (NDVI) is often used to explore the relationship between vegetation coverage change and driving factors such as climate and human activity [17,18,19,20,21].
To date, research on the driving factors of vegetation coverage change in the Qinling Mountains has focused on the impact of driving factors at the pixel level or on vegetation coverage change over specific whole regions [4,22]. Pixel-by-pixel analysis involves the correlation analysis of the paired data of each grid [23] but does not sufficiently utilize the spatial structure information shared by the pixel in its neighborhood [24,25,26]. Although the geodetector model conducts spatial analysis of the whole region, as opposed to pixel-by-pixel analysis, some researches ignores the spatial heterogeneity of the partial regions [27]. Moreover, few studies focus on the explanatory power of differences in driving factors between the degraded and restored areas of vegetation. Therefore, this paper will identify vegetation degradation and restoration areas and further explore the aforementioned differences.
The effect of drivers on vegetation coverage is nonlinear [18,28,29], characterized by the presence of threshold effects within the constraints of the drivers [30,31]. The threshold represents the key turning point at which the effect of drivers on the state of the ecosystem shifts from one pattern to another [32]. In recent years, studies have been conducted to detect the thresholds of driving factors on vegetation coverage or ecosystem services in specific regions. For example, He et al. identified the thresholds of multi-factors, including the Digital Elevation Model (DEM), precipitation, and slope, on vegetation coverage in Jingle County, Shanxi Province [28], and Li et al. identified the constraining effects of multi-factors on ecosystem services and thresholds for the Beijing-Tianjin-Hebei urban agglomeration [33]. However, the threshold characterization of the effect of various drivers on vegetation coverage in the Qinling Mountains remains unstudied. In terms of threshold detection methods, some statistical methods, such as regression analysis, have been widely used to clarify thresholds [28,33]. Compared with regression analysis, the constraint line method can explain the limiting effect of the driving factors on the response variable in terms of the ecological mechanism [34]. Therefore, this paper explores the constraint pattern of driving factors on vegetation coverage and identifies thresholds based on the constraint line method.
This study takes the Shaanxi region of the Qinling Mountains as the study area to analyze the spatio-temporal distribution pattern of FVC changes between 2000 and 2020 based on time-series NDVI data in order to identify areas of degradation and restoration. Seven natural and human disturbance driving factors were selected, and the study distinguished differences in the impacts of the factors on FVC in degraded and restored areas. Additionally, based on the constraint lines method, the study identified constraint patterns of the factors on FVC and threshold characteristics.

2. Materials and Methods
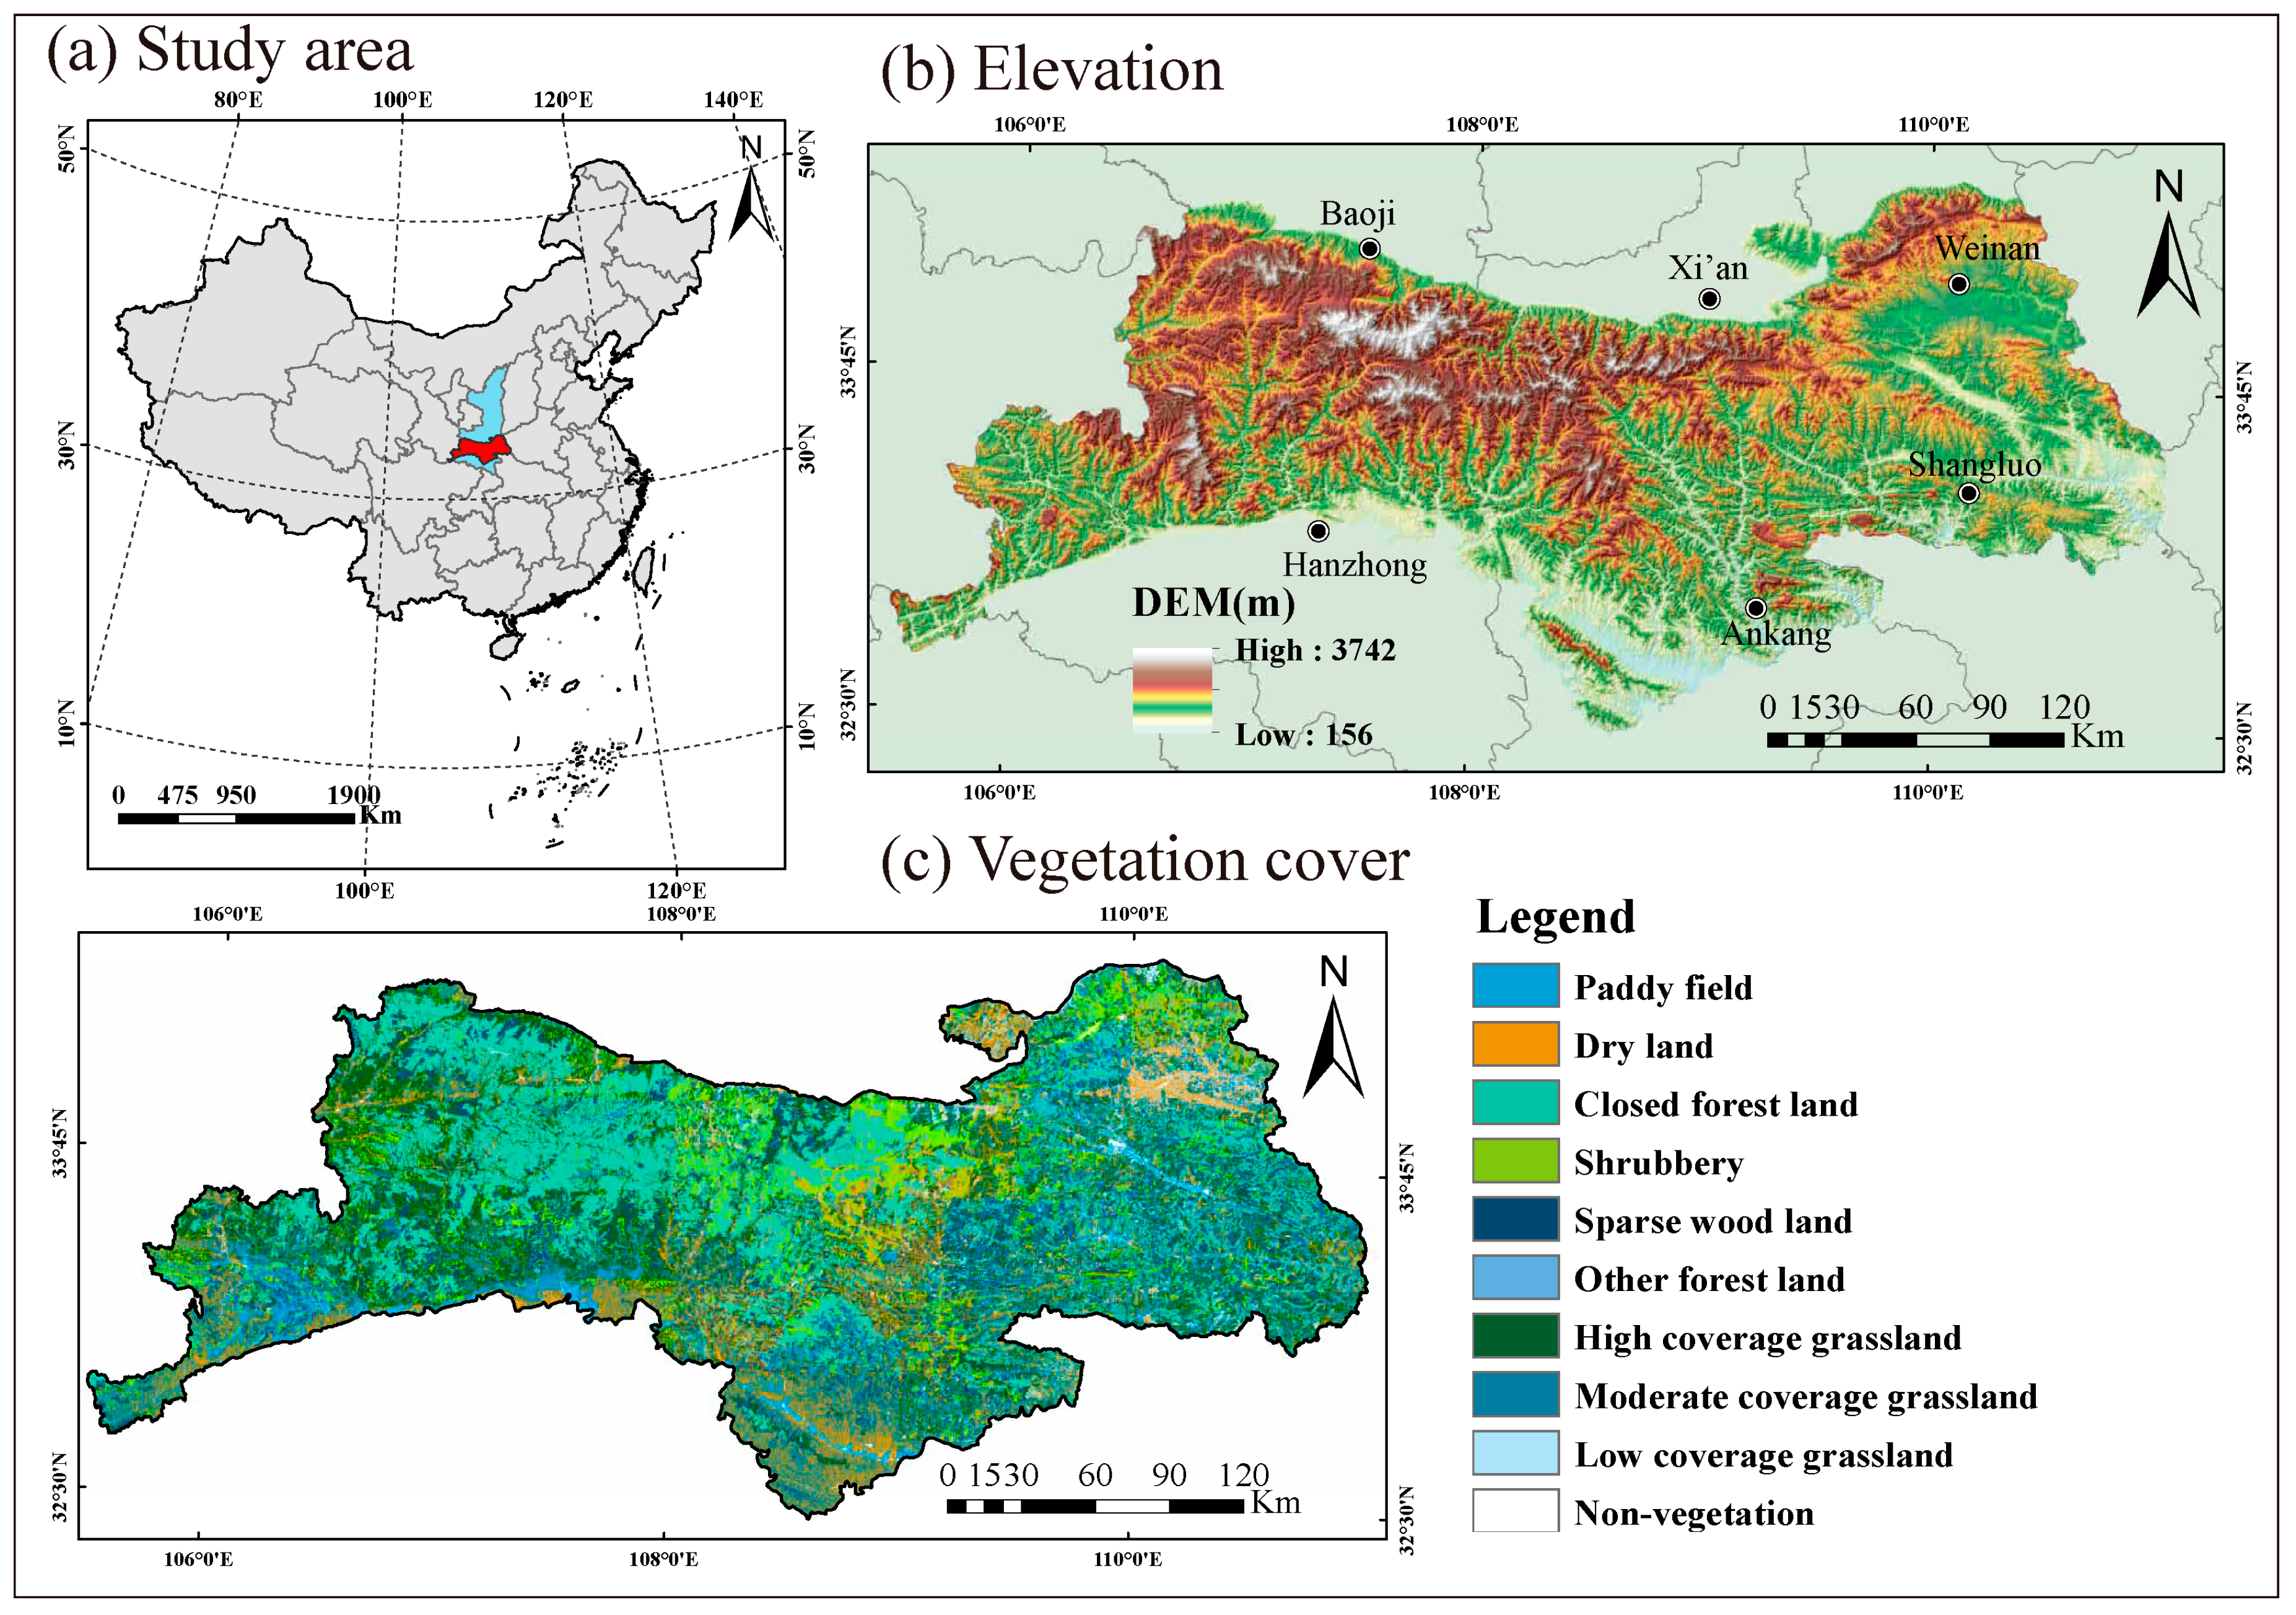
2.1. Study Area

The study area in the Qinling Mountains (the Shaanxi section, shown in Figure 1) is located in the south of Shaanxi Province. It has a length of approximately 500 km from east to west and a width of around 150 km from north to south, covering a total area of about 58,200 km2.
The north slope of the Qinling Mountains is steep, with high mountains and many gorges. It has a warm-temperate semi-humid monsoon climate, and warm-temperate deciduous broad-leaved forests are widely distributed. Meanwhile, the south slope is long and gentle, with a northern subtropical monsoon humid climate and a mixed distribution of north subtropical deciduous and evergreen broad-leaved forests.

2.2. Data Sources

In this study, FVC data was derived from NDVI data, which in turn was used to analyze vegetation coverage changes. Data on the two topography factors of DEM and slope, the three meteorological factors of precipitation, temperature, and radiation data, and the two human disturbance factors of population and nightlights were assembled, for the purpose of factor detection. All driving factors data were resampled to 250 m × 250 m grids using CUBIC method which execute cubic convolution interpolation algorithm in ArcGIS (Version 10.8) and the time series statistics for each grid were obtained. The data details are listed in Table 1.

2.3. Research Methods

2.3.1. Identification of Degraded and Restored Areas

Dimidiate Pixel Model

The Dimidiate Pixel Model can effectively reduce the uncertainty of vegetation coverage caused by the spectral characteristics of non-vegetated areas and improve the accuracy of vegetation coverage analysis [35]. Therefore, this model is used to calculate FVC in this study, and the formula is shown in Equation (1).
FVC = ( NDVI - NDVI soil ) NDVI veg - NDVI soil
where NDVI soil is the NDVI value for the non-vegetated area; NDVI veg is the NDVI value for the purely vegetated area; NDVI soil and NDVI veg are determined by the upper and lower NDVI thresholds according to the confidence level α = 0.05.

Theil-Sen Median Trend Analysis

Theil-Sen Median is a robust non-parametric statistical method for trend analysis that is widely used in the trend analysis of long-term series data due to its algorithmic efficiency and insensitivity to measurement errors and outlier data.
β = m e d i a n ( x j x i j i ) , j > i
where x j and x i are the time series data; and β is positive and negative for an upward and downward trend in the time series, respectively.

Mann-Kendall Test

As a non-parametric test, the Mann-Kendall test is a widely used method of trend testing. It does not require the data to follow a certain distribution and is not affected by extreme values and outliers [36].
For the FVC time series with sample size n = 21, the Z-statistic is obtained from the transformation of the S-statistic to test the significance of the trend, details of which are set out in Equations (3)–(7).
F V C i , i = 2000 , 2001 , , 2020
Z = S 1 V a r ( S ) , S > 0 0 , S = 0 S + 1 V a r ( S ) , S > 0
S = j = 1 n 1 i = j + 1 n sgn ( F V C j F V C i )
sgn ( F V C j F V C i ) = 1 , F V C j F V C i > 0 0 , F V C j F V C i = 0 1 , F V C j F V C i < 0
V a r ( S ) = n ( n 1 ) ( 2 n + 5 ) 18
where Var is the variance; sgn is the sign function; FVCj and FVCi represent the FVC values for years j and i; and Z and S are the test statistics. Mann [37] and Kendall [38] proved that the statistic S roughly follows a normal distribution when n ≥ 8, and Z is the standard normal distribution test statistic for S. And we determine whether Z reaches a level that rejects the null hypothesis at a given confidence level of α = 0.05. This study combines Theil-Sen median trend analysis and Mann-Kendall testing to detect the trend of vegetation cover change and test its significance.

2.3.2. Detection of Key Factors

Based on the spatial heterogeneity characteristic, the geodetector can reveal the explanatory power differences in driving factors for response variables [39]. In this study, we distinguish driving factors for differences in vegetation degradation, restoration, and global area in the Qinling region through factor detection. Factor detection uses the q value to quantify the explanatory power, whose range is [0, 1]. The higher the q value, the stronger the ability of the factors to explain the spatial differentiation of the dependent variable [40]. The mathematical expression for factor detection is shown in Equation (8).
q = 1 1 n σ 2 i = 1 M n i σ i 2 = 1 S S W S S T
S S W = i = 1 M n i σ i 2 , S S T = n σ 2
where q is the explanatory power of the factors on the dependent variable; i = 1, 2,⋯; M is the strata (i.e., the classification or partitioning of variable Y or X); n and ni are the sample sizes of the whole region and the i-th sub-strata, respectively; and σ2 and σi2 are the variance of Y overall and the i-th sub-strata, respectively. SSW and SST are the sum of the intra-stratum variance and the total variance, respectively.
A large number of studies have used the geodetector model to explore the roles of factors, but different treatments in constructing the models produce different results. Gao et al. [41] conducted a study on the Modifiable Areal Unit Problem (MAUP) and found that the effects of these factors on the response variables were inconsistent at different grid scales. Song et al. [42] considered the effects of different discretization methods on the model results and developed the Optimal Parameter-based Geodetector (OPGD) model, which improves the capability of spatially stratified heterogeneity analysis. Meanwhile, the GeoDetecter package [40,43] in R software (Version 4.2.2) provides several spatial discretization methods (equal breaks, natural breaks, quantile breaks, geometric breaks, and standard deviation breaks) and the optimal discretization parameter method.
Hence, in this study, the statistical grid size was determined based on the spatial resolution of the available data sources, and all the data characterized by continuous variables were input into the GeoDetecter package to classify the data using the optimal discretization method.

2.3.3. Extraction of Threshold from Constraint Lines

Constraint lines are constructed based on the scatterplot, and the changing turning points on the constraint lines are the threshold points. The value of the pairwise variable in each grid is counted to obtain the scatter plot, and the upper boundary of the scatter plot is the constraint line [44]. We adopted the quartile segment method to determine the constraint line. In this study, the data is split into m groups according to the value range of the variable on the x-axis. For the data that fall within each group, the n quartile is taken as the boundary point (m and n values are determined based on the distribution of the data), and all the boundary points obtained are fitted to obtain the constraint line. On the constraint line, the response variable is most strongly constrained by the driving variable [45,46], and this constraint effect changes as the driving variable alters. Therefore, the regression equation is derived to obtain the value that makes the first-order derivative equal to 0, which is the characteristic threshold of the influence of each driving factor on FVC.

3. Results

3.1. Spatio-Temporal Change Pattern of FVC

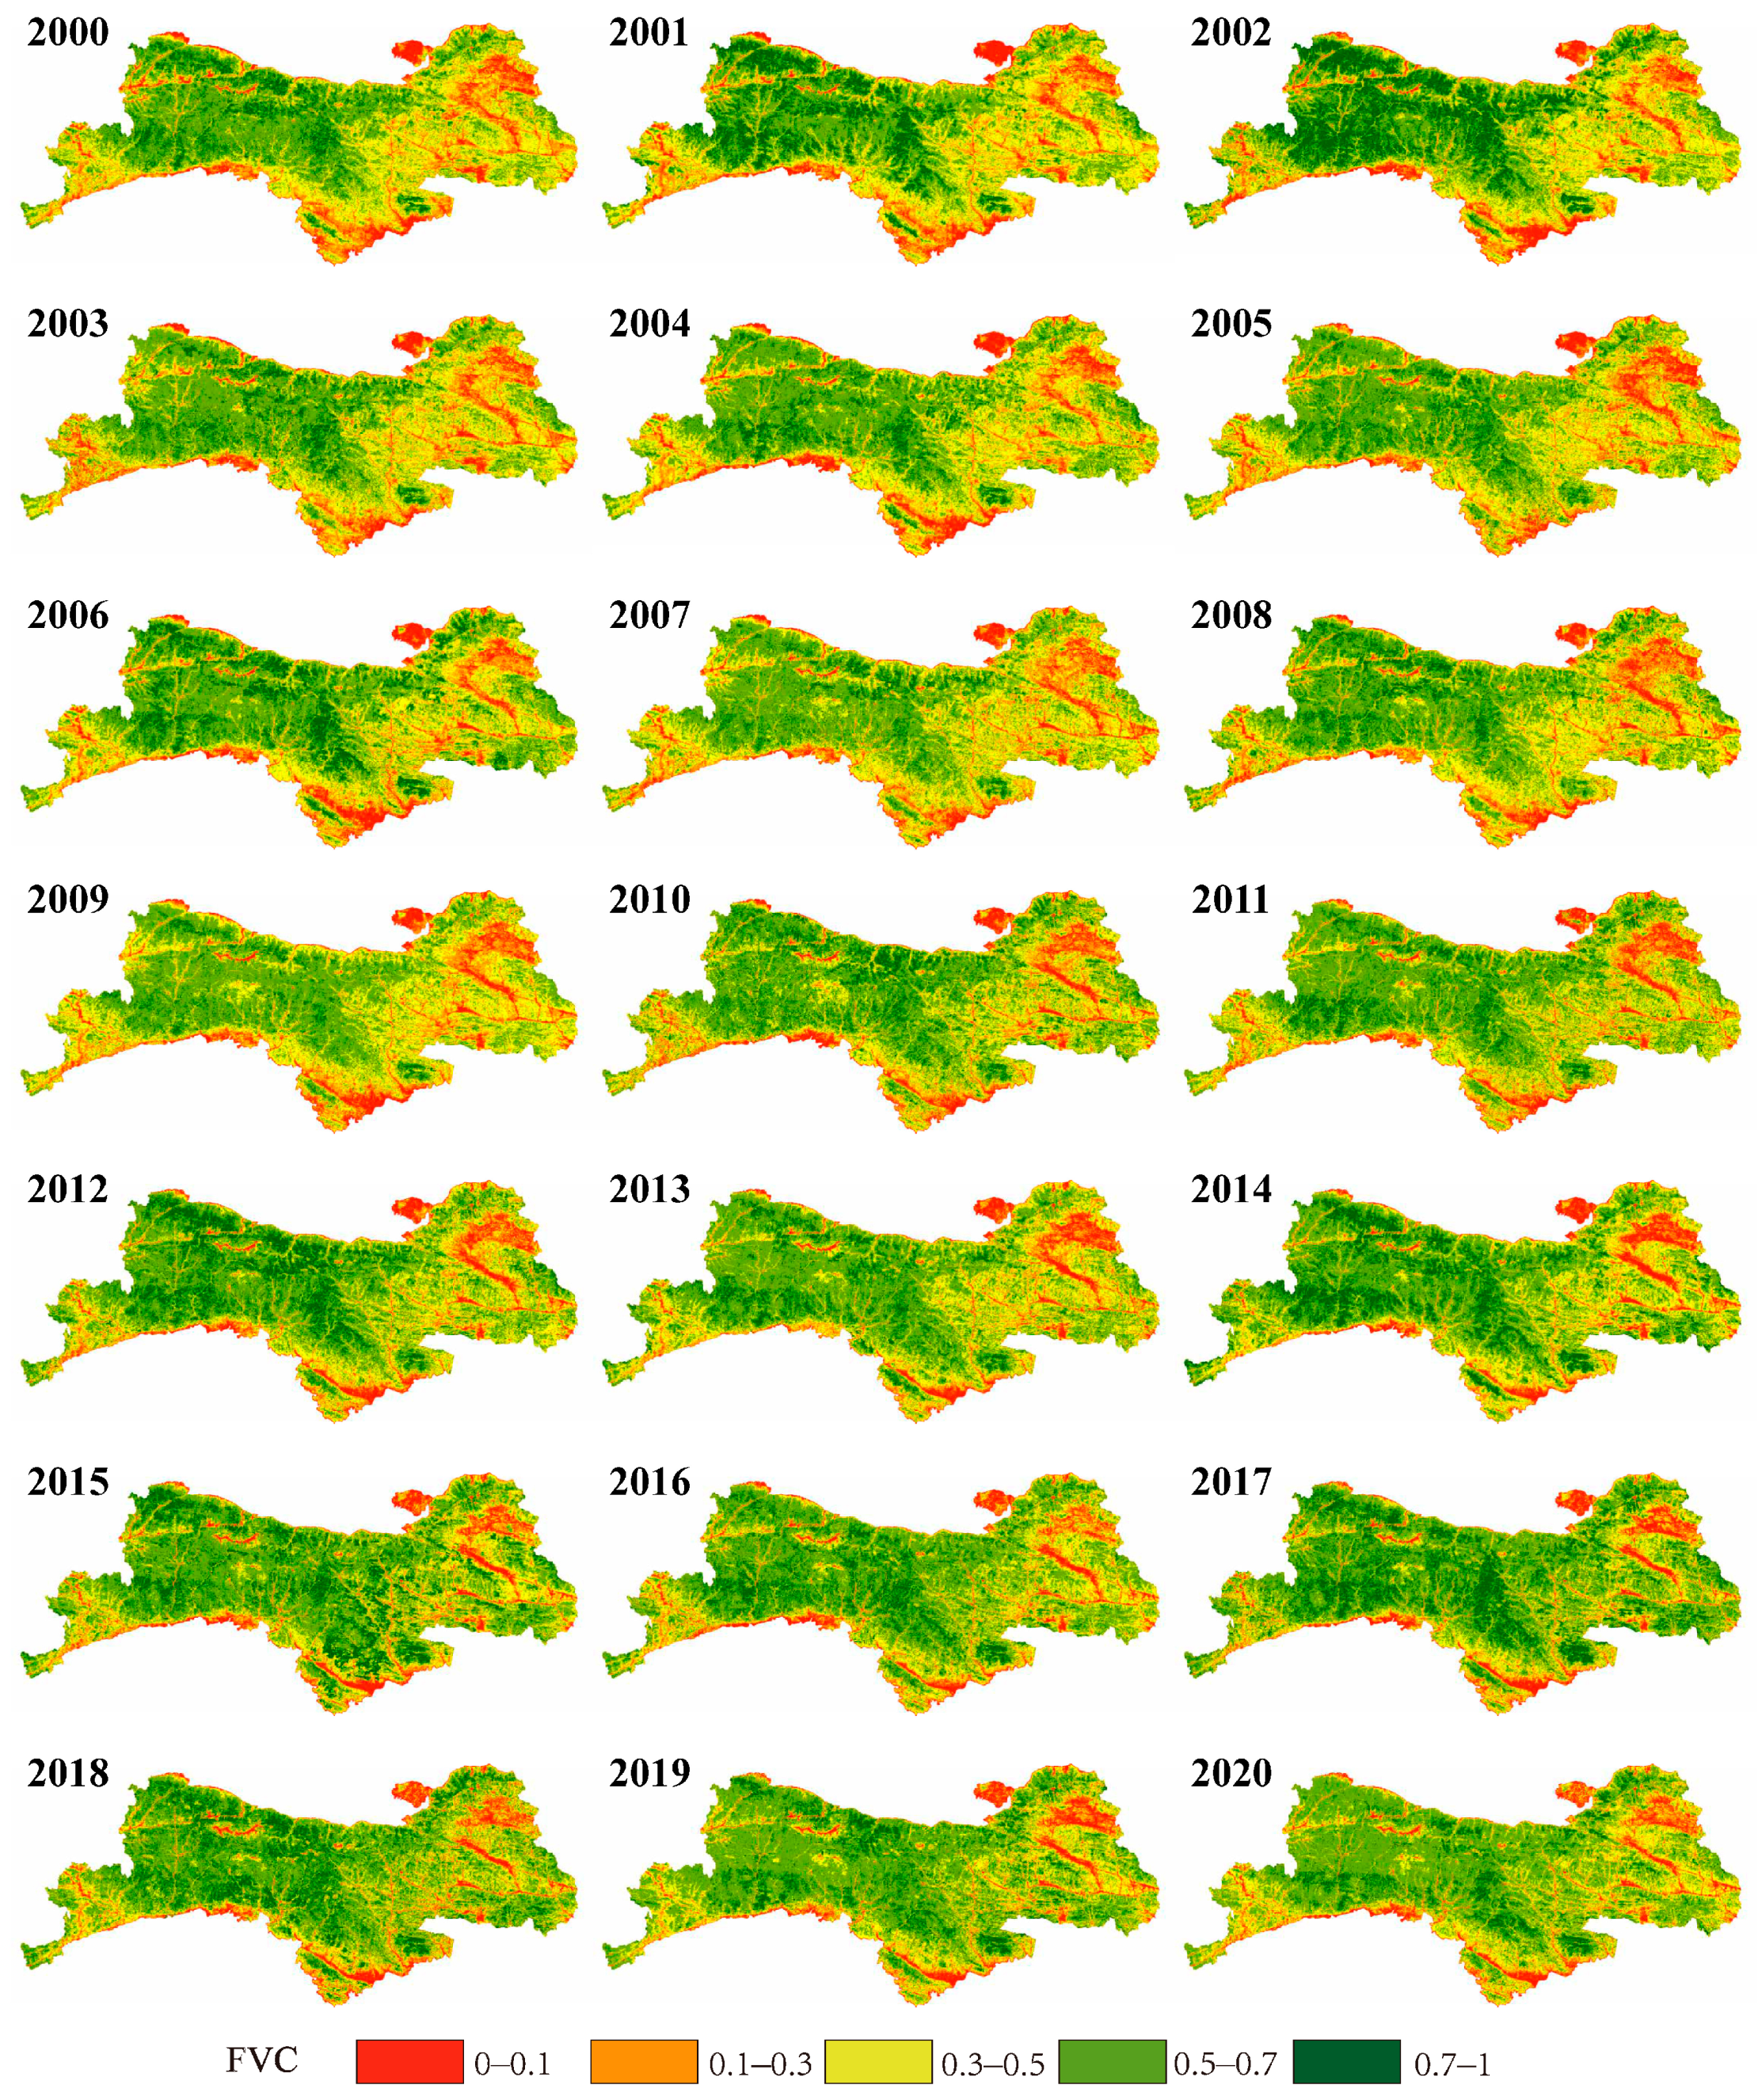
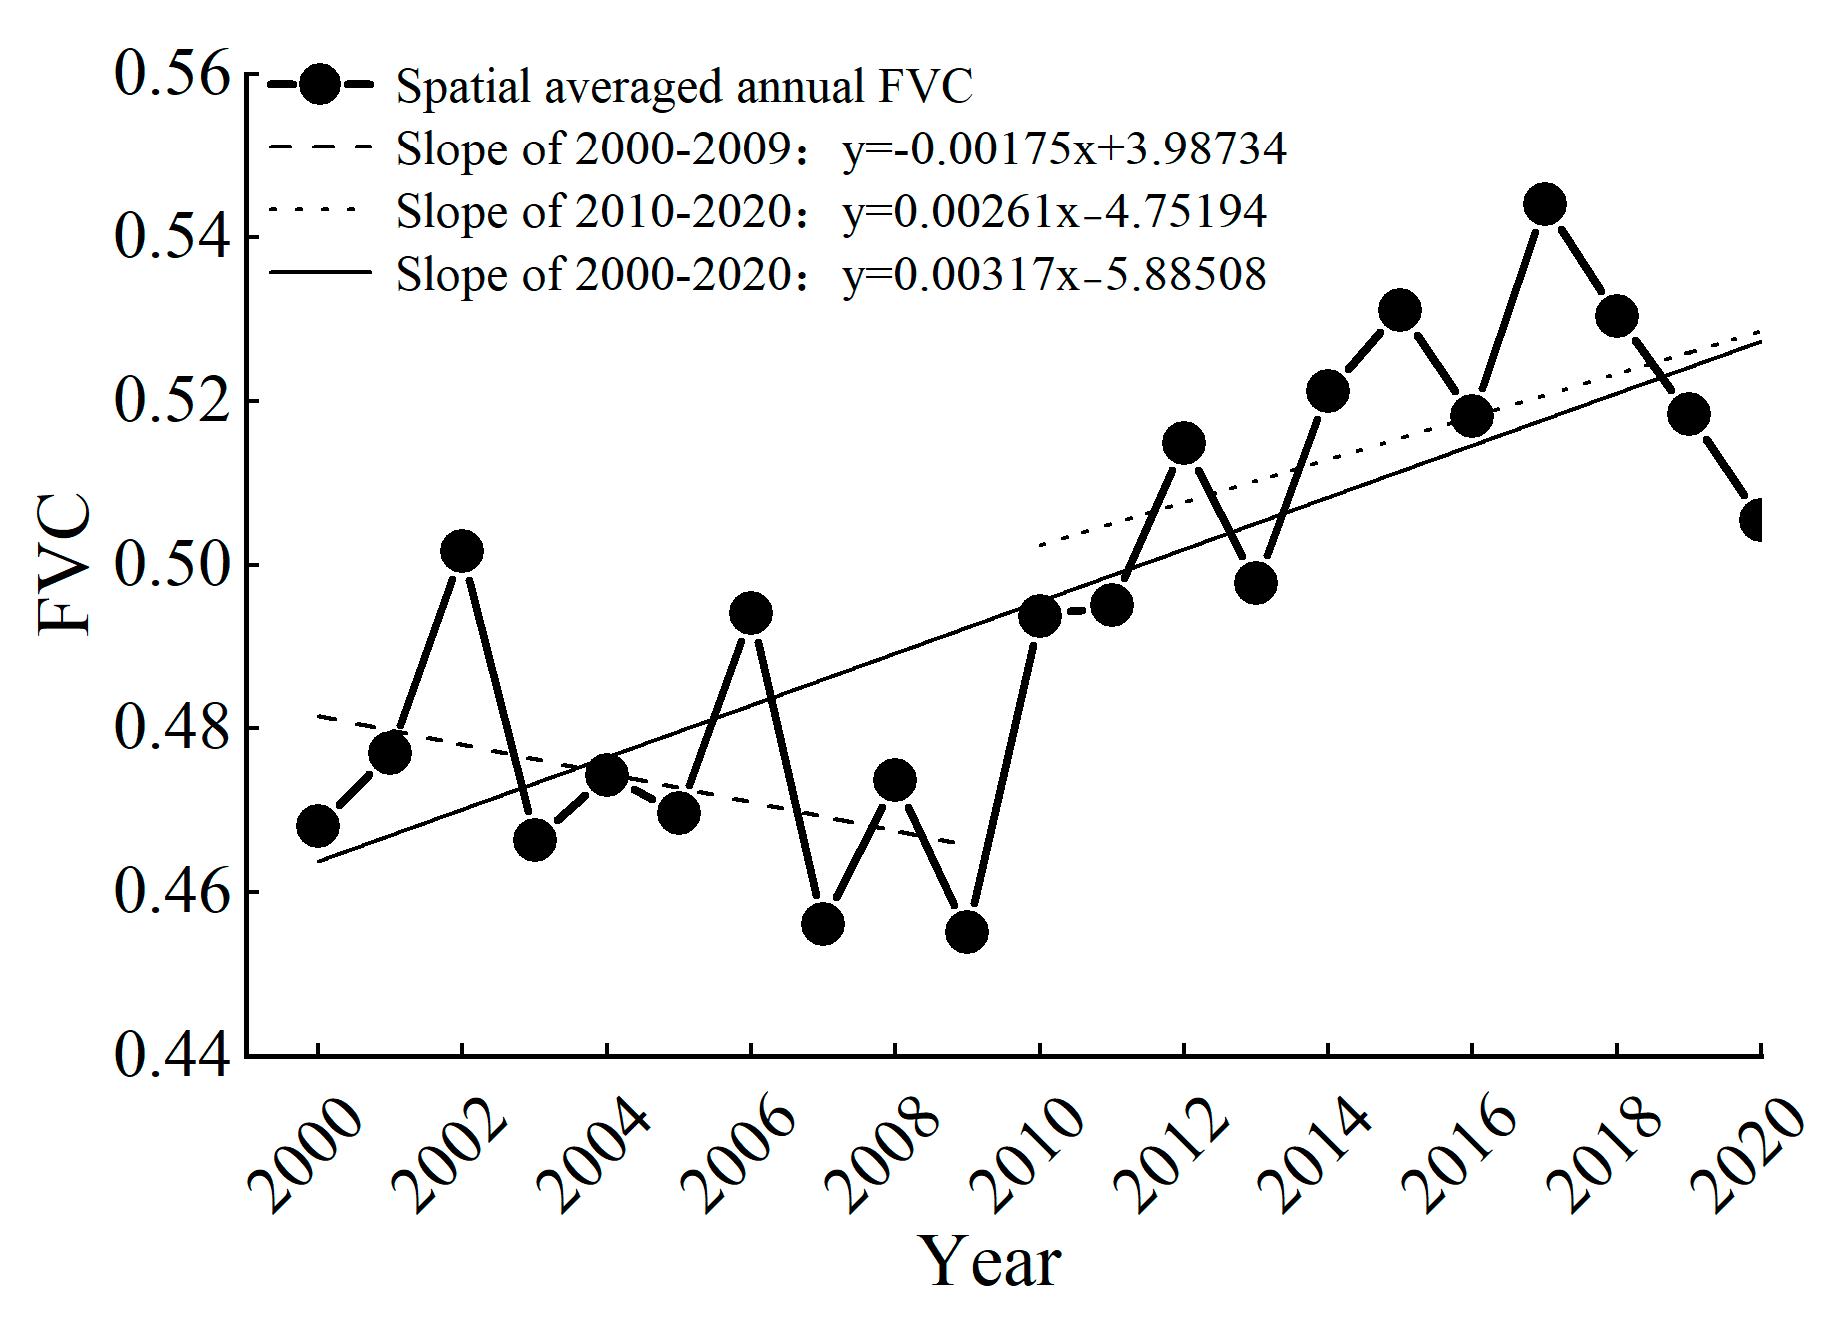
3.1.1. Spatio-Temporal Dynamic Changes of FVC

The spatial distribution variation of FVC in the Qinling region between 2000 and 2020 is shown in Figure 2. The overall distribution of FVC varies greatly in space, with high FVC values distributed in the central and western regions of the Qinling Mountains. Meanwhile, low FVC values are frequently distributed in the eastern and southern fringe regions, where there are densely distributed towns, villages, and roads and high-intensity human activity. The overall FVC distribution pattern is generally consistent with the findings of Deng et al., in that FVC values are high in the west and center and low in the east and periphery [4]. Before the promulgation of the “Ecological Environment Protection Master Plan of Qinling Mountains in Shaanxi Province” in 2020, the protection policy did not comprehensively consider the climate, topography, and population of the Qinling area to implement partition protection, and this absence of targeted protection programs may have led to the degradation of some areas to a certain extent.
The trend of spatially averaged annual FVC from 2000 to 2020 is presented in Figure 3. This demonstrates that FVC is an increasing trend on the whole, with a growth rate of 0.00317/a and an increase of 7.9% over 21 years. The existing literature has also shown that the spatial mean FVC fluctuated but increased in the Qinling region between 2000 and 2019 [47]. The trend of FVC was reversed over the 21-year period, with a downward rate of −0.00175/a from 2000 to 2009 and an upward rate of 0.00261/a from 2010 to 2020. Since 1998, the state has paid increasing attention to the ecological protection of the Qinling Mountains, and the implementation of “Regulations on Ecological Environmental Protection of Qinling Mountains in Shaanxi Province” in 2008 demanded strong legal compliance for the ecological protection of the area.

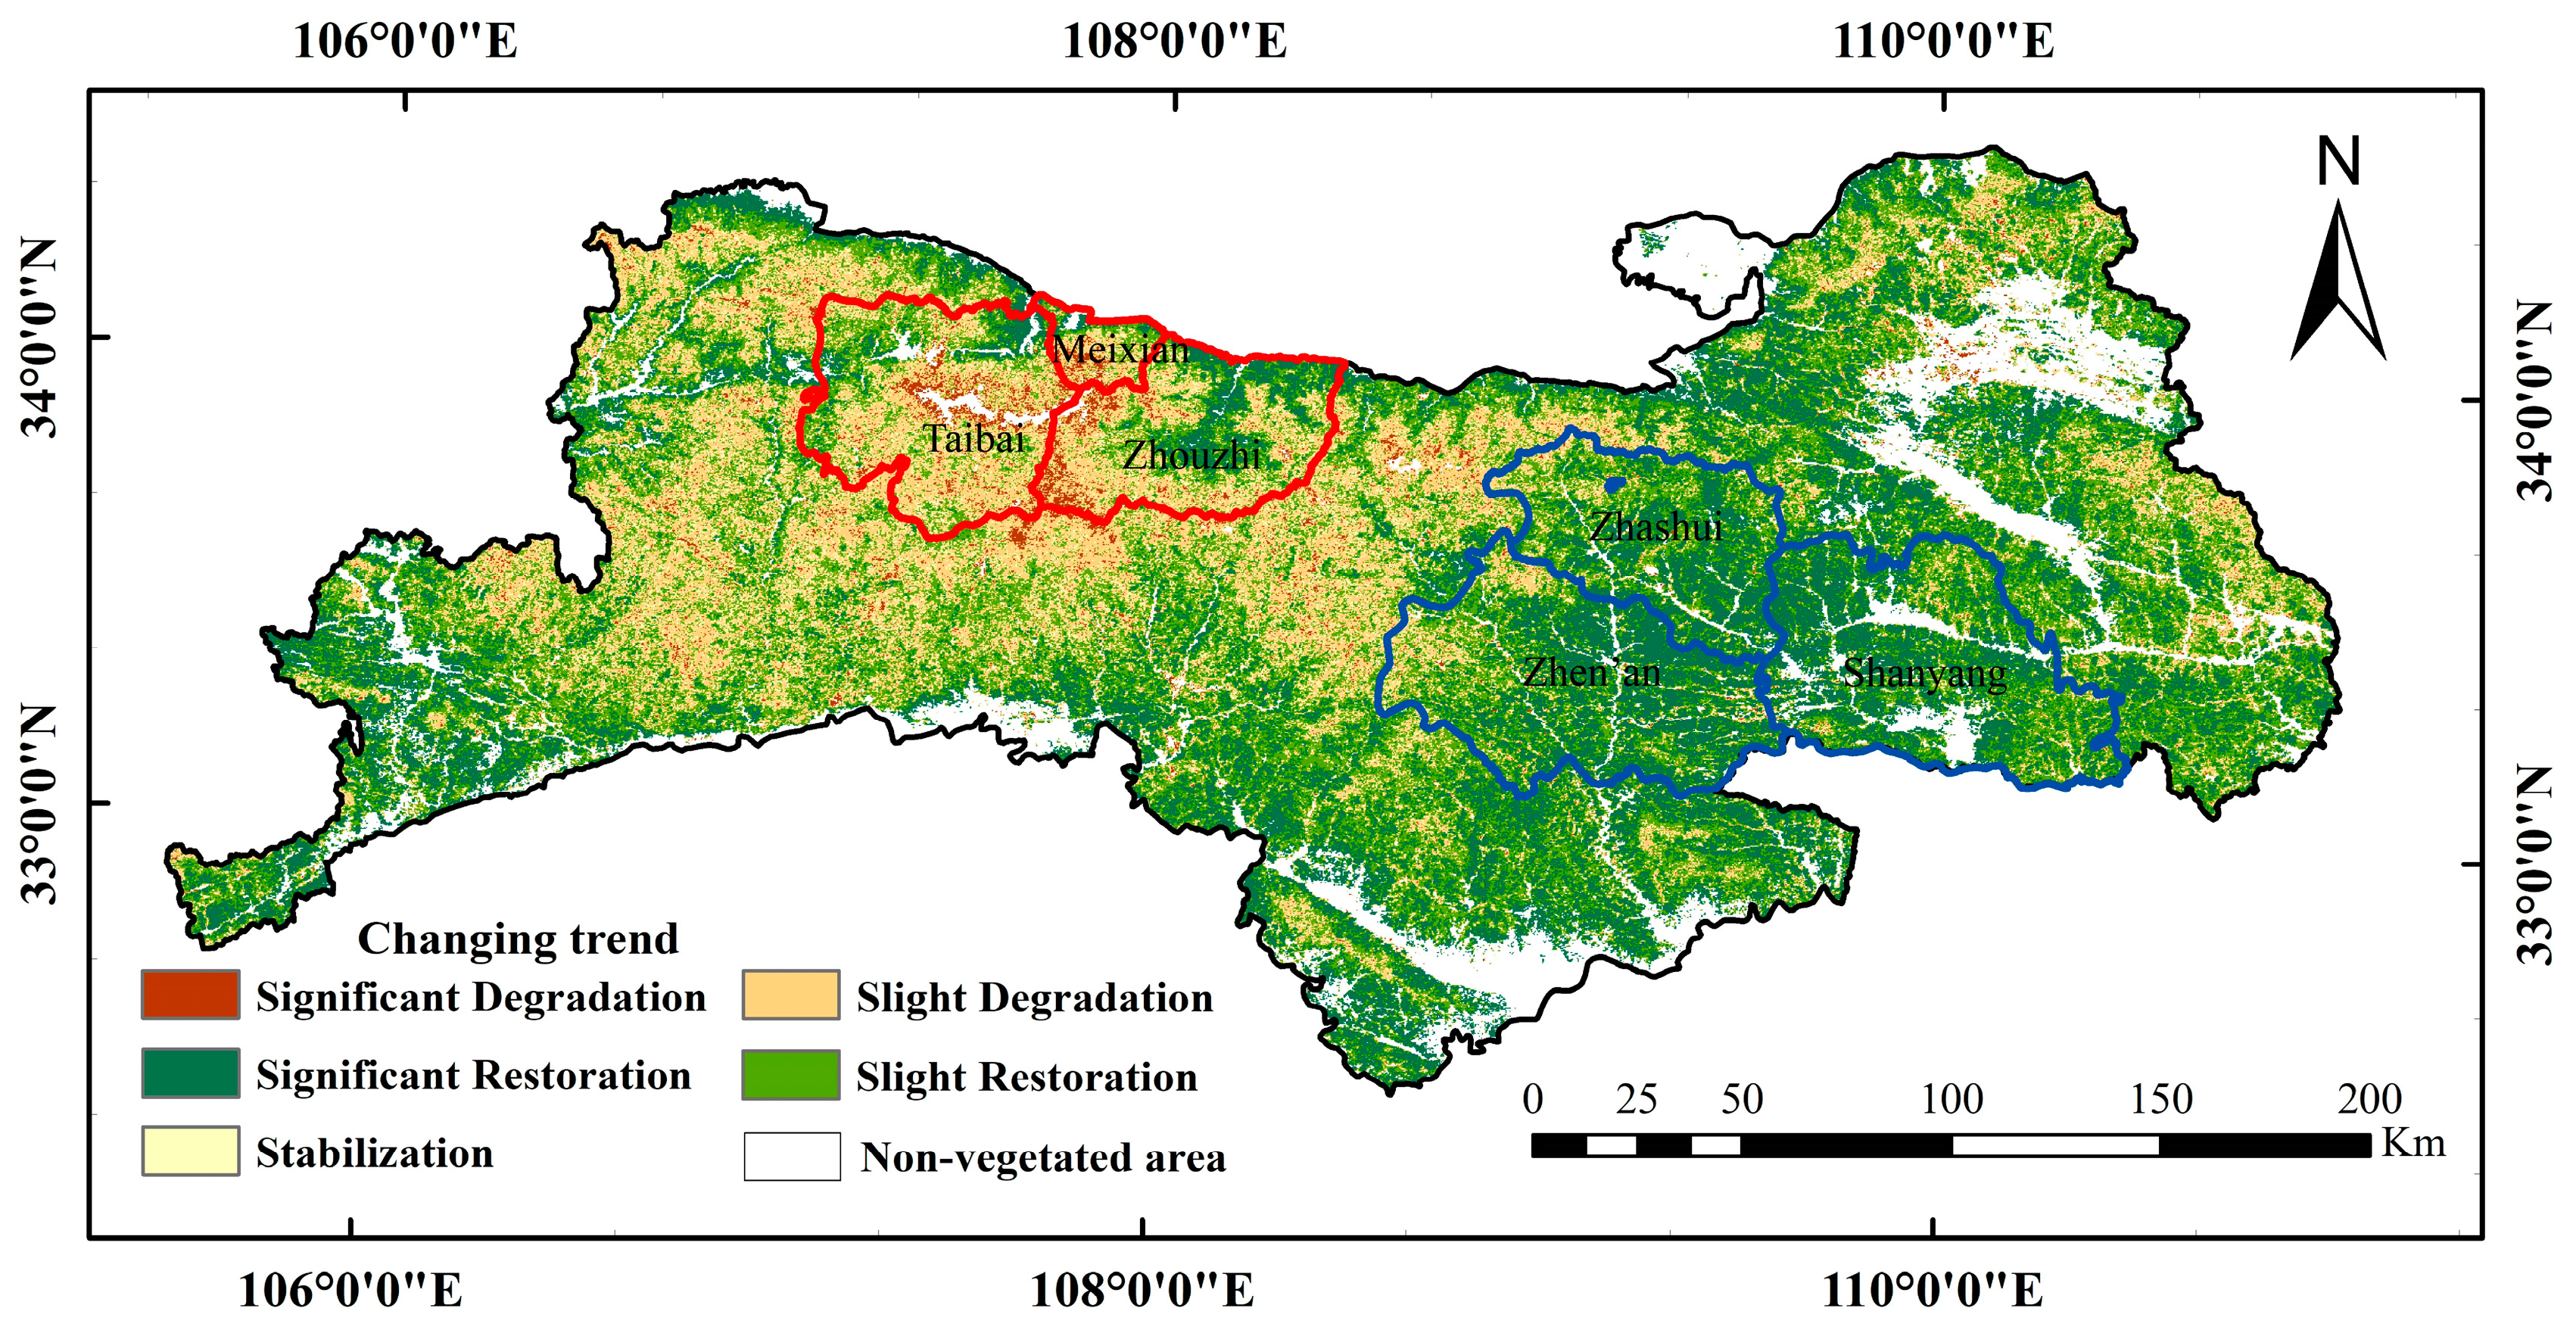
3.1.2. Spatial Distribution of Change Trends in FVC

Based on the Theil-Sen Median trend analysis and Mann-Kendall testing, Figure 4 shows the types and degrees of FVC change trends in the Qinling region from 2000 to 2020, and the specific area percentages are set out in Table 2. In general, the FVC shows an overall improving trend, and the area percentages showing restoring and degrading trends are 69.2% and 22.0%, respectively. Specifically, significant restoration and slight restoration accounted for 29% and 40.2%, respectively, while severely degraded areas accounted for only 2.3%. While the study by Ji et al. in the northern foot of the Qinling Mountains for the period 2000–2019 also showed more than 95% of the area have an increasing FVC trend [5], the method of trend analysis used was univariate linear regression; as such, the outliers of a certain year may significantly influence the fitting effect and are prone to overfitting [48], making the area with an increasing trend noticeably large.
According to Figure 4, it can be clearly seen that the most severely degraded areas during the 21-year period were concentrated in the central west (i.e., the regions of Taibai, Meixian, and Zhouzhi Counties—the areas within the red lines in Figure 4). Meanwhile, the significantly restored areas were mainly located in the eastern region of the Qinling Mountains, and the most obvious areas were concentrated in Zhashui, Shanyang, and Zhen’an counties (the areas within the blue lines in Figure 4). From an analysis of Figure 4 combined with Figure 2, it can be concluded that FVC is relatively low in areas with improving trends and high in areas with degrading trends. In addition to the reason for the original vegetation cover condition, this phenomenon may be caused by a variety of factors, such as climatic conditions and human activity. Therefore, the region within the red lines in Figure 4 was selected as representative of the degraded areas, and the region within the blue lines in Figure 4 was selected as representative of the restoration areas; these regions were employed to carry out the analysis of the attribution of the degradation and restoration of the vegetation cover.

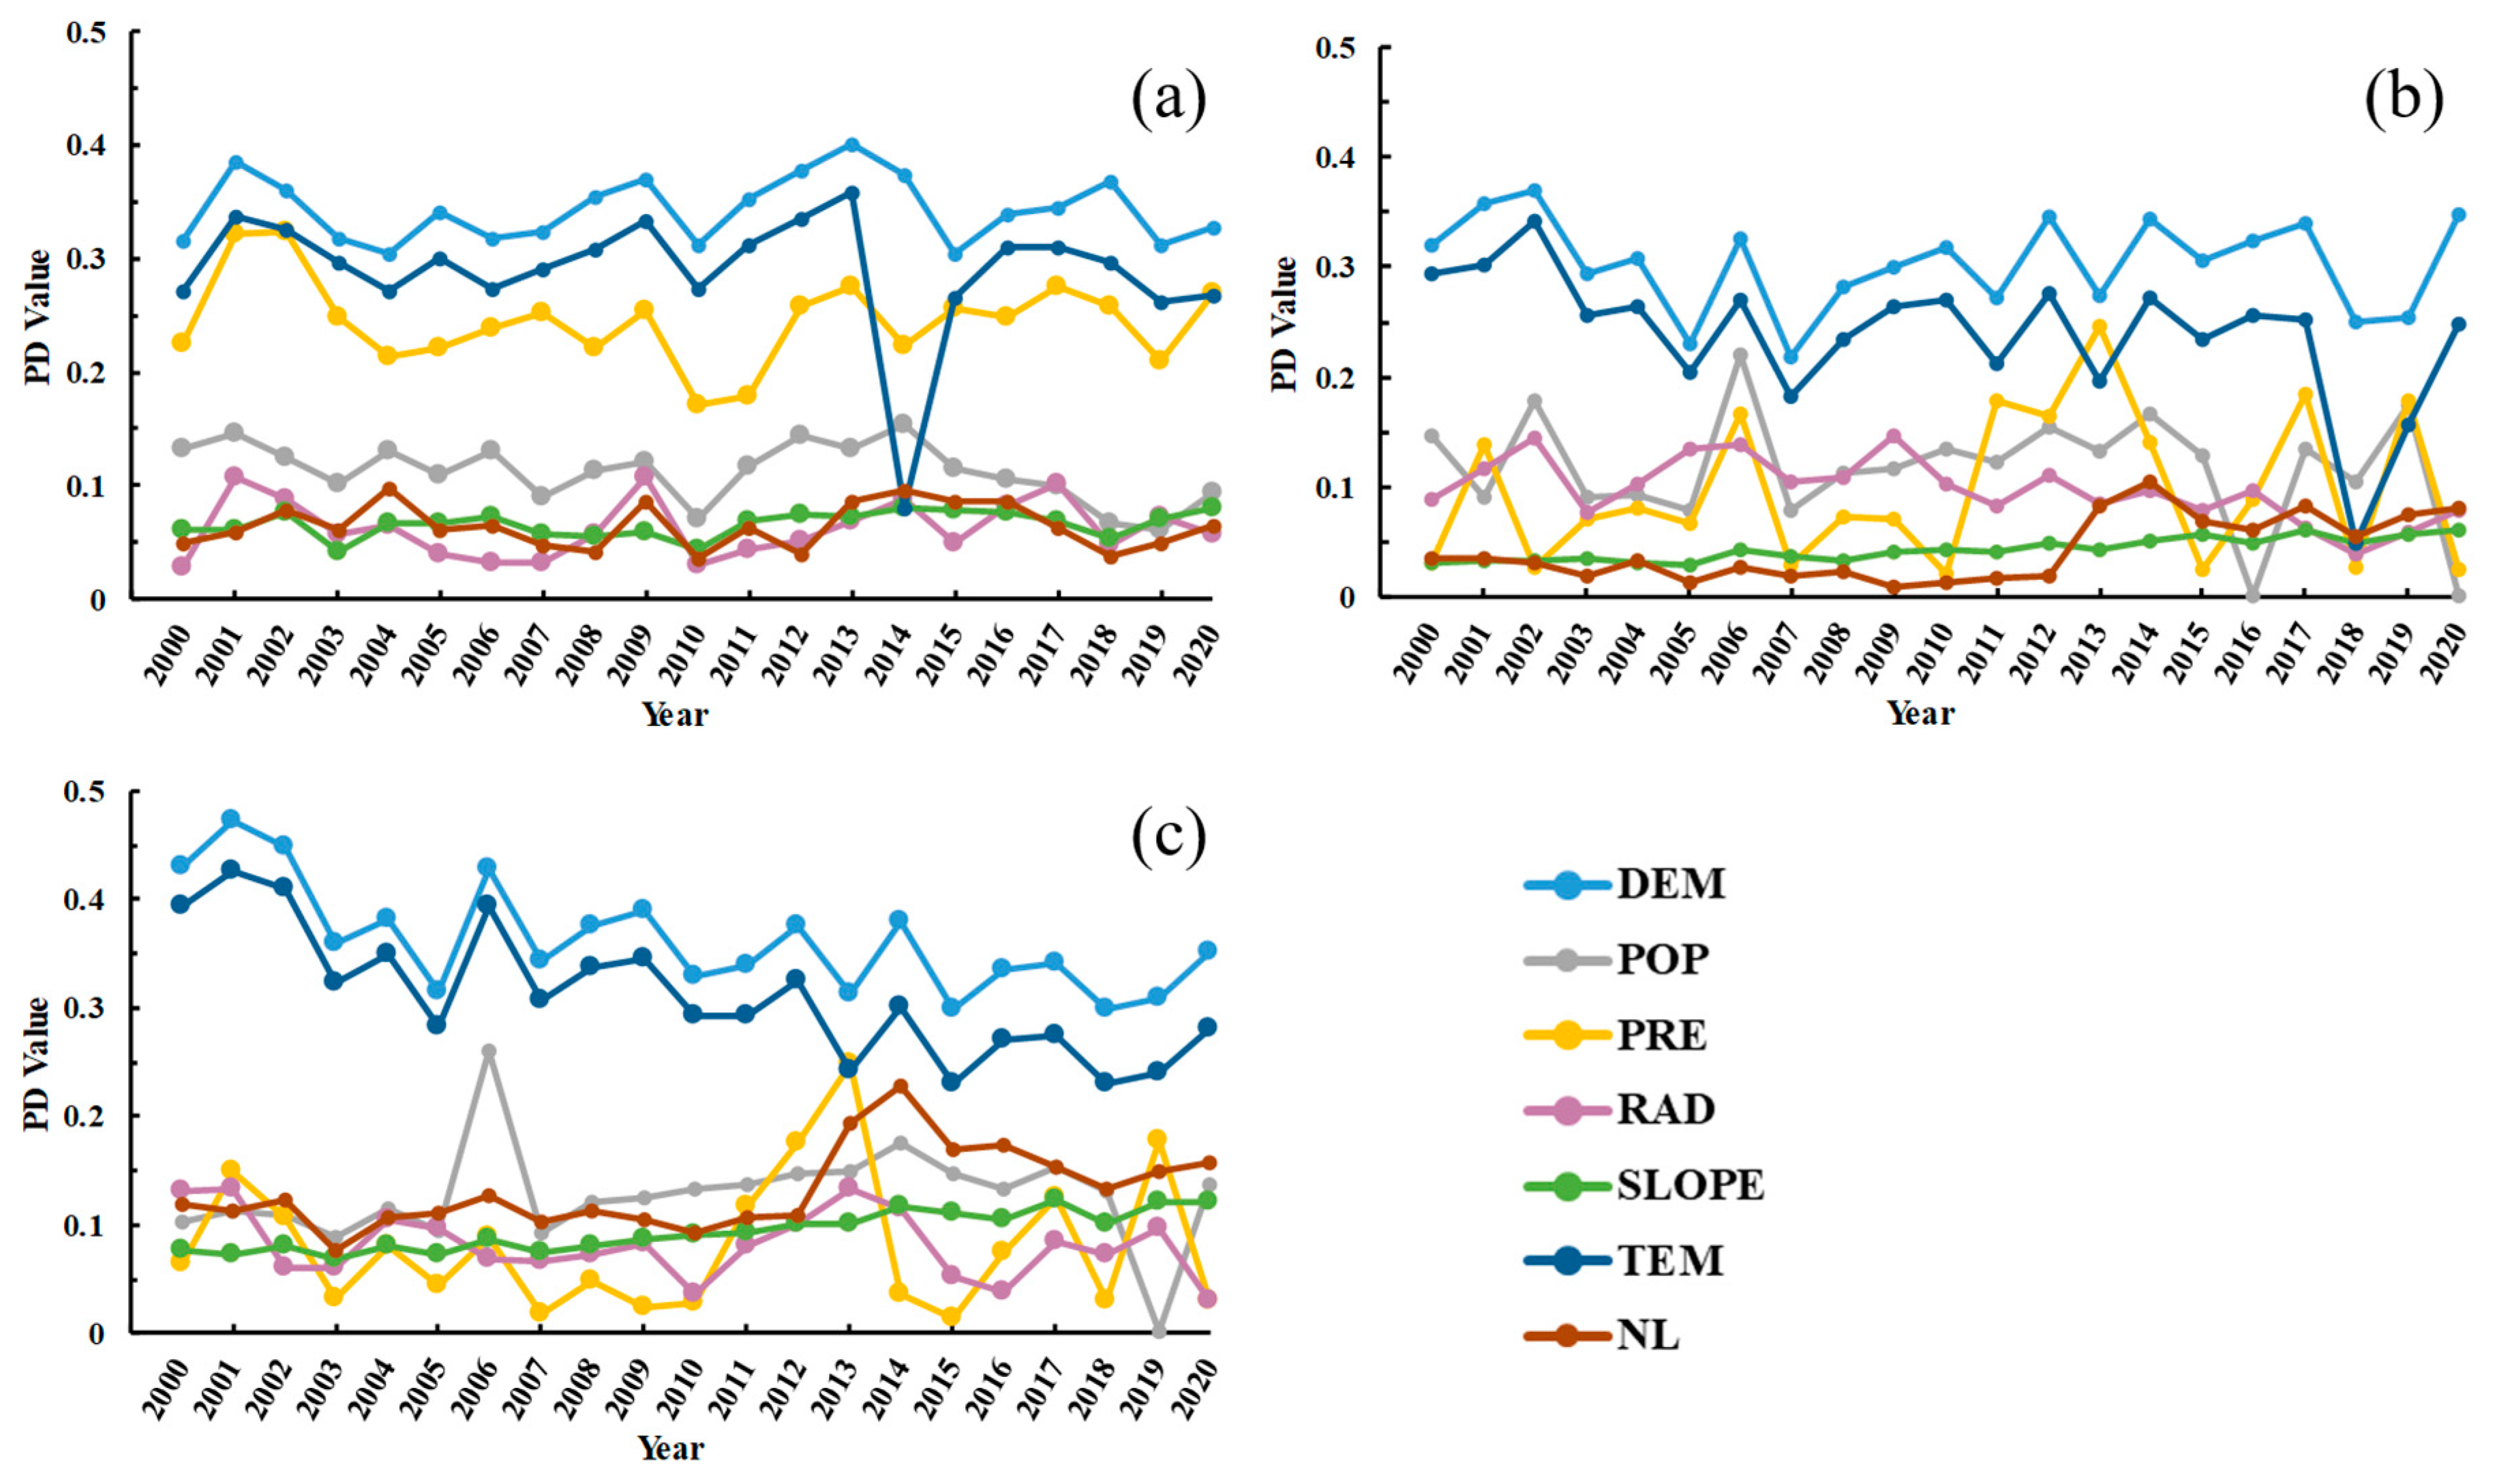
3.2. Attribution Analysis of Different Change Characteristics of Vegetation Cover

Figure 5a was selected from the red degraded area of Figure 4, with a total area of 6617 km2, Figure 5b was selected from the blue improved area of Figure 4, with a total area of 9354 km2, and Figure 5c was selected from the whole study area. The geodetector method was employed to quantify the influence of each factor on FVC in different regions, and all the factors in the three regions passed the test of significance at the 0.05 level. It can be seen that, although the q-values of DEM and temperature fluctuate and change abruptly occasionally, they remain the two most important factors in the three subgraphs of Figure 5. Precipitation showed larger fluctuations and smaller perennial q-values in Figure 5b, smaller perennial q-values with occasional abrupt changes in Figure 5c, but was steady relatively throughout the year in Figure 5a. Figure 5b,c were similar in pattern, verifying that most areas enjoy improved vegetation cover in the Qinling region. On the whole, the influencing degree of each factor fluctuated during 2000–2020 but was relatively stable overall in the three regions.
Taking the mean values of the q-value of each factor during the whole period, a comparison of each variable on FVC for the whole and local degraded/restored areas is shown in Table 3. Although differences are apparent in the ranking of each factor, it is clear that DEM and temperature factors consistently play a dominant role in both degradation and restoration areas, as well as in the overall area, which indicates that DEM and temperature have a greater influence on changes in vegetation cover. The study by He et al. [28] in the Qinba Mountains area also demonstrated DEM to be more sensitive to vegetation cover. Additionally, it is recognized that temperature affects metabolic processes, such as the transpiration and respiration of vegetation [49], and therefore influences vegetation cover changes to a greater degree.
Moreover, population density also exerts a substantial impact on vegetation cover in the three regions in question, but the degree of its influence alters abruptly during specific years. Meanwhile, slope and radiation both exhibit limited explanatory powers (a q-value below 0.1) on vegetation cover, showing only weak variations across different regions. In addition to the similarity in the importance of the factors aforementioned for different regions, nightlight intensity and precipitation exhibit significant variations in their impact on vegetation cover. In Figure 5 and Table 3, it is evident that the q-value of nightlight intensity is consistently greater than 0.1 during most years for the whole area (Figure 5c), with a mean value of 0.13134 over the 21-year period. Meanwhile, in the local area, the q-value of nightlight intensity largely remains below 0.1 (Figure 5a,b).
The natural geography of the Qinling Mountains has led to the gathering of human activity towards the flat areas [50], resulting in a higher degree of concentration of towns and villages and making the spatial differentiation of population obvious. However, the local area is smaller in scope, and spatial differentiation is less pronounced. In the degraded area, the q-value of precipitation remains consistently above 0.2 throughout the entire period, with a mean value of 0.24502. This value is significantly higher than that for the other two areas (0.08139 for the whole region and 0.09724 for the restored region), indicating that precipitation plays a more substantial role in influencing FVC in the degraded area compared to the restored area. This difference in climate distribution pattern may be responsible for the varying sensitivity of vegetation in different areas to precipitation.

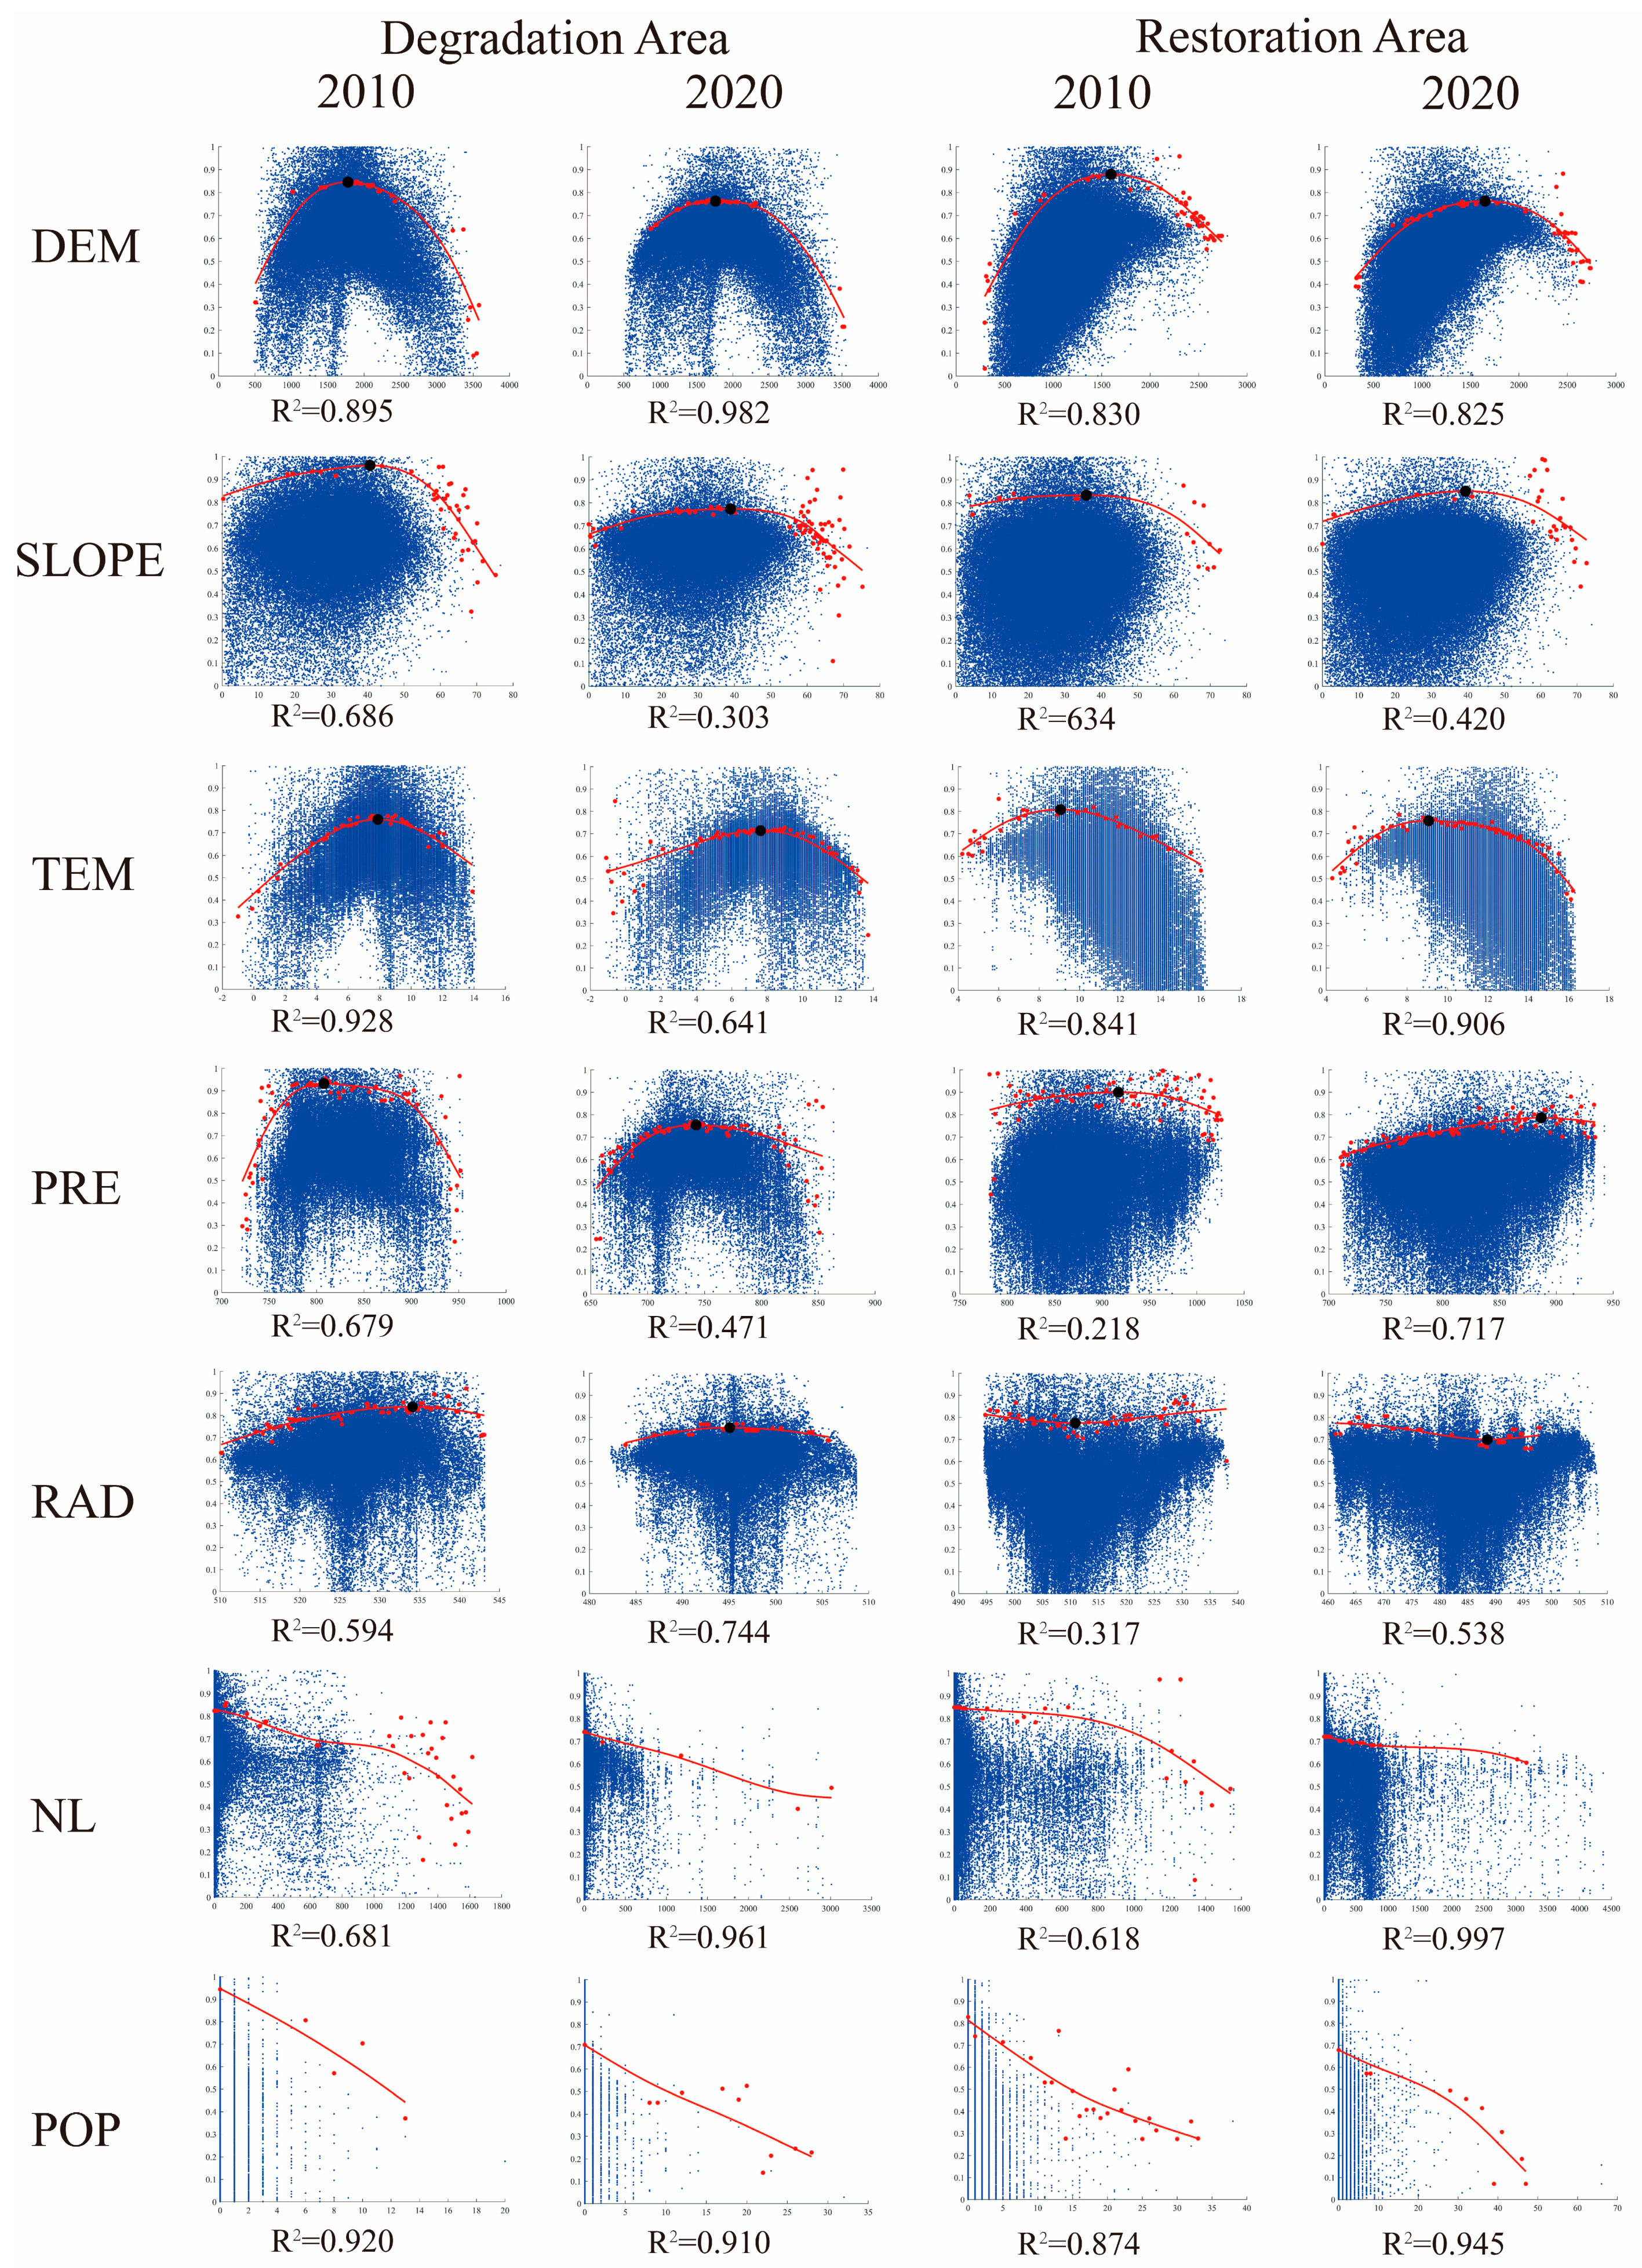
3.3. Detection of Constraint Effects and Thresholds

Thresholds are the change points of the constraint effects of key influencing factors on FVC and can be used to manage ecosystems quantitatively and limit the carrying capacity of resources and the environment. This study has adopted the constraint lines method and the quartile segment method for their potential in detecting constraint effects. It is possible to identify the turning point of the constraint effect change based on the constraint lines so as to clarify the threshold of each factor on FVC in different regions.
The relationship between FVC and the influencing factors is shown in Figure 6. In general, the shape of constraint lines for the same factor in different regions and different years is similar. All constraint lines present three types: DEM, slope, precipitation, temperature, and radiation (degraded area) showed a convex constraint on FVC, while nightlight intensity and population density exhibited decreasing negative constraints on FVC. Additionally, radiation (restored area) exerted a concave constraint on FVC. The vast majority of constraint lines exhibited a high degree of fitting. We have described the key characteristics of the constraint lines based on the slope of the regression coefficients. When the slope is greater than 0, the increasing slope trend shows that the constraint effect is weakening and the factors are enhancing the promotion of FVC. When the slope lies below 0, the decreasing slope trend indicates that the constraint effect is increasing [51] and the factors are enhancing the inhibition of FVC.
A first-order derivative of the constraint line was taken to detect the thresholds from the perspective of a single factor. As shown in Table 4, the same variable exhibited different thresholds in different regions. For example, the DEM threshold in the degraded area was about 1800 m, which is more than 100 m higher than that in the restored area. This difference could be due to the Taibai Mountains straddling the counties in the degraded area, resulting in a higher overall elevation of vegetation compared to the restored area. Furthermore, the scatter plot in Figure 7 reveals a higher and wider range of elevations for the degraded area’s vegetation cover. The temperature constraints on FVC were weakest when the annual average temperatures were 7.7 °C and 9 °C for the degraded and restored areas, respectively, indicating that suitable temperatures promote vegetation growth and maximize vegetation cover. The precipitation thresholds in the degraded areas were lower than those in the restored areas, while the thresholds for slope and radiation showed no significant difference in performance across the different areas.
Moreover, differences were apparent in the thresholds of the same variable on FVC in different years. For example, the DEM threshold in 2020 was larger than that in 2010, while the precipitation threshold in 2010 was larger than that in 2020, which may be related to the annual average precipitation in those years. The thresholds of temperature in different years remained almost unchanged. Since the thresholds study was conducted over just two years, the pattern of change in the thresholds of some variables in different years is not obvious. FVC was negatively correlated with the anthropogenic factors of nightlight intensity and population density, with no obvious thresholds, and the constraints on FVC were significantly stronger with increased anthropogenic activity. Below the threshold, FVC was relatively low, corresponding to the low values of precipitation, DEM, slope, temperature, and radiation. Vegetation cover increased with increases in these variables, and once the variables exceeded the threshold, decreased vegetation cover was apparent. It can be seen that the threshold pattern is correlated with differences in factors such as elevation, precipitation, and temperature in different regions in different years.

4. Discussion

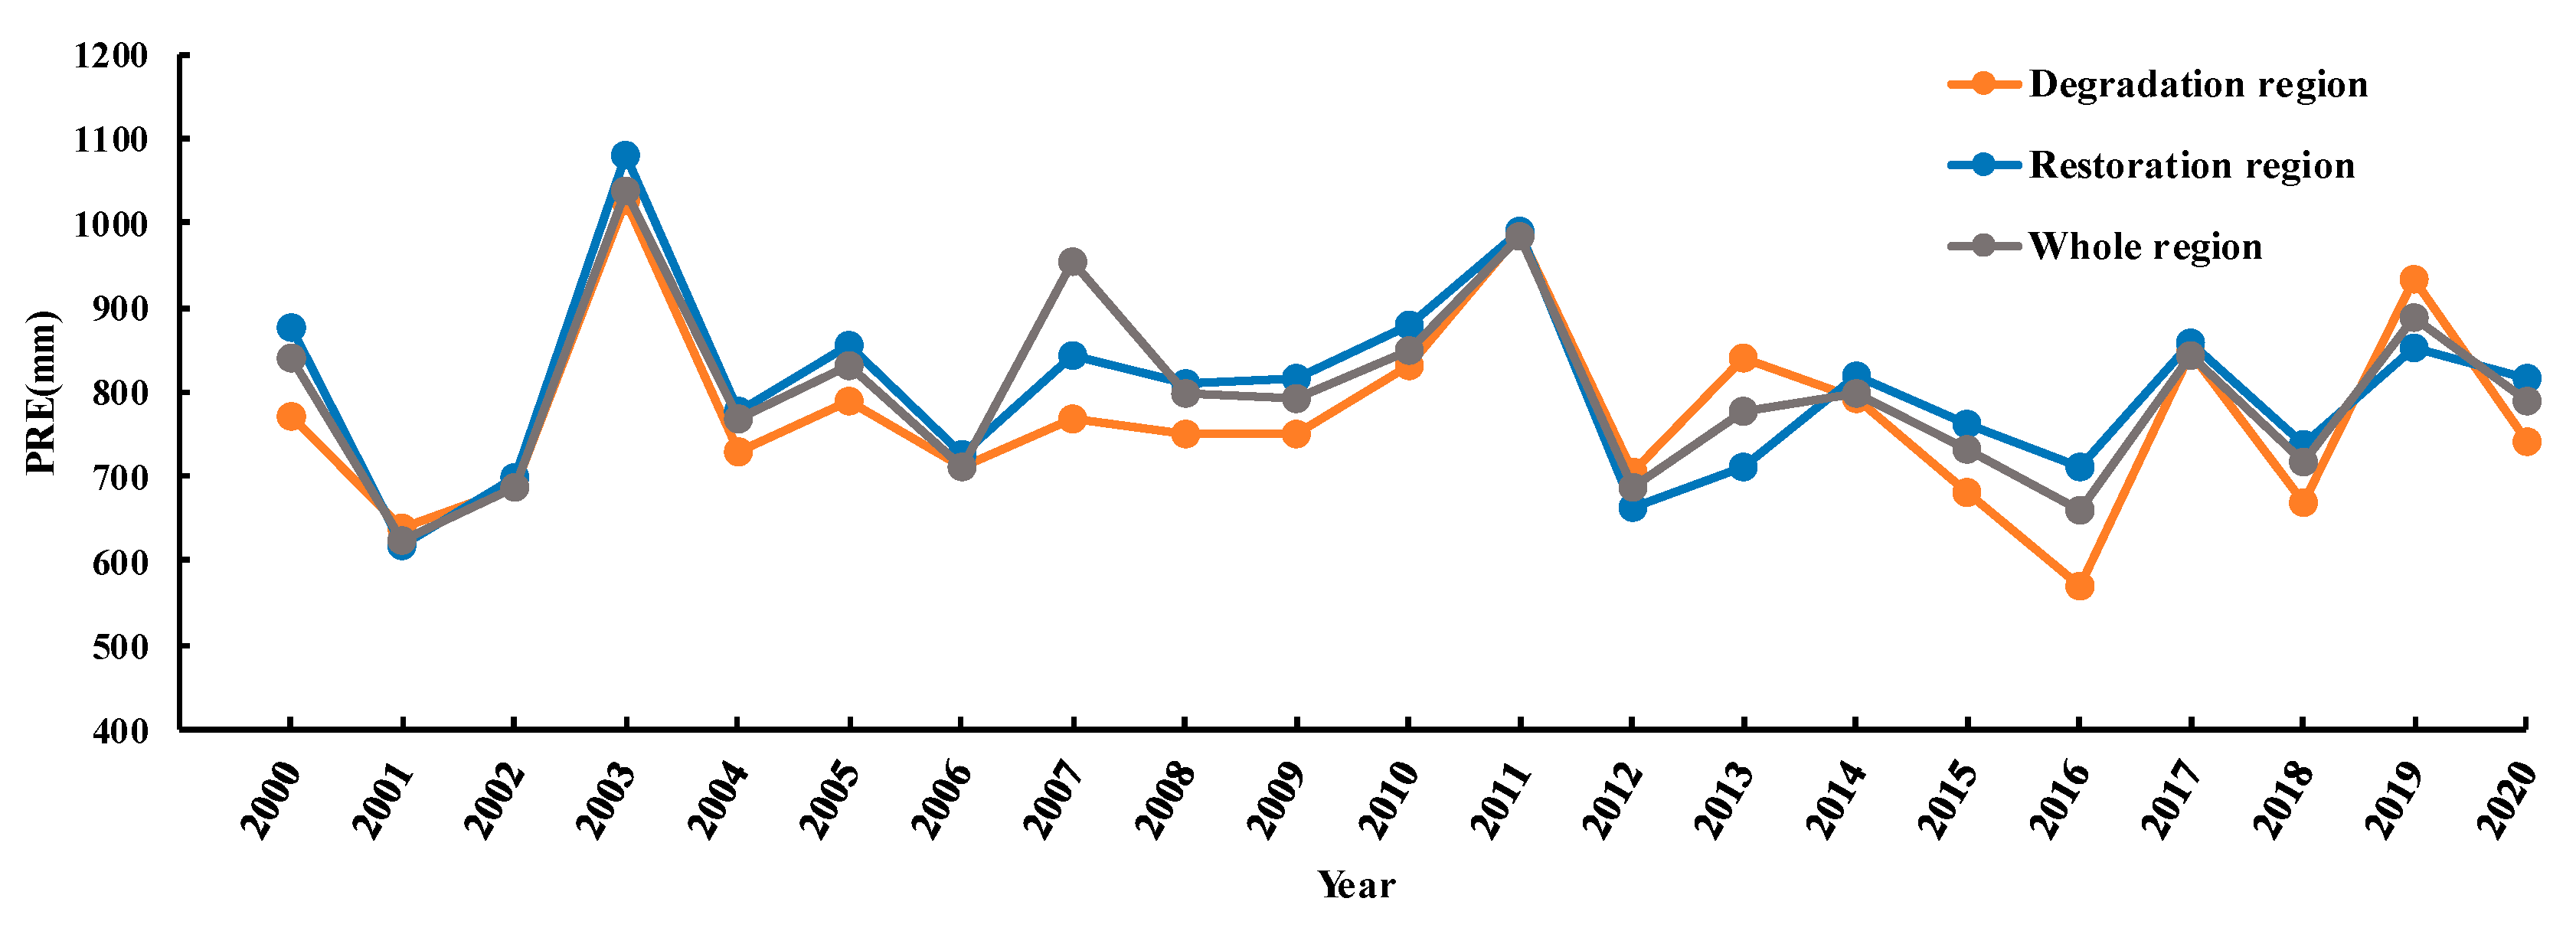
4.1. Effect of Precipitation on the Spatio-Temporal Characteristics of FVC

The ecological protection policy for the Qinling region has brought about dramatic changes in ecological land use. It has caused ecological degradation to varying degrees while restoring ecosystems on a large scale. Studying the role of drivers in ecosystem change helps us better determine the focus of ecological protection policy implementation and ensure its effectiveness [52,53]. Remote sensing technology is an important technical support for our research on the ecological environment [54]. It helps us obtain information and indicators for the evaluation of the ecological environment [55]. And in this paper, FVC obtained by remote sensing technology is used to monitor the spatial pattern, change characteristics of vegetation cover, and driving factors of spatial heterogeneity. The results of the factor detection indicate that topography and temperature have a strong influence on ecosystems, while other factors have less explanatory power for vegetation cover. This is consistent with the conclusion that spatial heterogeneity in ecosystem change is caused more by natural than socio-economic factors, as evidenced in the literature [56,57]. Many studies have shown that precipitation and temperature are the two main climatic variables affecting vegetation dynamics [58,59]. However, our results in this study indicate that precipitation affects vegetation cover to different degrees in different regions. For instance, the q-values of the restored region and the whole region were significantly smaller than those of the degraded region.
It can be seen from Figure 7 that precipitation in the whole region and the restored region is slightly higher than in the degraded region throughout the year. The fluctuation of precipitation in the three regions is almost identical, which is consistent with Shaanxi Province being characterized by more precipitation in the south and less in the north.
The increase in average precipitation will lead to an increase in the duration of wetness [60], and the response sensitivity of vegetation to dry and wet changes is different [61]. Moreover, the vegetation in regions with consistently decreasing moisture was affected by drought most strongly and experienced the greatest change in sensitivity to drought [62]. It can then be inferred that precipitation has a greater impact on vegetation in areas with relatively low perennial rainfall and a smaller impact on vegetation in relatively wet areas. Further, spatial differences are apparent in the impact of precipitation on vegetation cover with changes in the spatial distribution pattern of precipitation. Previous studies have also shown that precipitation is a decisive climatic driver of vegetation dynamics in arid regions [63], with an increase in rainfall generally inducing an increase in vegetation cover, while the opposite result occurs in humid regions [64,65].

4.2. Adaptive Management for Improving Sustainability

The shape of the constraint lines of the variables was stable for different regions in different years, but some constraint lines and scatter plots were not well fitted due to the effect of discrete points. The morphology of the constraint lines indicated that the pattern of the constraint effects of the variables on FVC changes with the variables. None of the factors consistently promote or inhibit FVC, and they positively affect FVC changes only when the independent variables reach a certain value. In this study, we found that the response of vegetation cover to climate and topography is related to their distribution pattern, and the thresholds also show differences according to the characteristics of the climatic and topographic conditions of the region. For example, in regions with high annual average values of temperature and precipitation, the thresholds of temperature and precipitation were also high, which reflected the fact that the geographic pattern of vegetation is a product of the climatic pattern to a certain extent [66].
It is worth noting that the threshold is dynamic and changes as variables vary. In their study of time-series changes in thresholds of paired variables [51], Hao et al. found that threshold values correlate significantly with the difference between the maximum, minimum, and maximum-minimum values of the variables. Therefore, policymakers should formulate and adjust conservation policies according to the geographic pattern and changing trends of climate and topography [25,26]. Thresholds represent the maximum efficiency of ecological restoration, providing a reference for ecosystem management. Decision-makers should consider the influence patterns of various factors on vegetation cover and threshold values in an integrated manner, formulating different ecological restoration strategies and objectives in different areas while avoiding environmental degradation that substantially alters the values of various drivers from the existing ecological threshold. Moreover, it is believed that policymakers should formulate and adjust various policies according to future climate conditions and land use change [67].

4.3. Limitations and Prospects

In this study, we found two typical regions (from the results of a trend analysis of vegetation cover changes) through which to analyze differences in the effects of driving factors on vegetation restoration and degradation. However, vegetation change is formed by multiple factors [68], and this study has only examined the influence patterns and change thresholds of factors on vegetation cover from a single-factor perspective without considering the interaction of multiple factors on vegetation change, which requires further research. The two typical regions were small in size, and thus the thresholds detected may differ from those of larger regions [69].
The constraint line represents the limiting effect between variables, but this method has its limitations, as the relationship represented by the constraint line may not solely reflect the direct effect of the driving variable on the response variables but may also be influenced by other factors [70]. Additionally, the constraint line method is spatially dependent, making it necessary to select statistical data with the appropriate grid size according to the actual situation from which to construct the constraint line so as to better understand the constraint relationships. Thus, future research should focus on more detailed and comparative information, like landcover classes at different scales, the influence of various factors on different landcover classes, and how other parameters change with different classes. And take them into consideration in the spatial layout of ecological management.

5. Conclusions

In this study, we analyzed the spatial and temporal variation characteristics of vegetation cover in the Qinling Mountains (Shaanxi section), detected the degree and pattern of the influence of natural and human disturbances on vegetation cover in regions with different change characteristics, and attempted to reveal influence thresholds.
Vegetation cover in the Qinling region has shown an overall trend of improvement (with a percentage of 69.2%), accompanied by a certain degree of degradation (with a percentage of 22%) from 2000 to 2020, with the degraded areas concentrated in the northwest and the improvement occurring mainly in the east. Precipitation has emerged as the main differentiating factor between degraded and restored regions. For instance, precipitation had a greater effect on vegetation cover in degraded areas than in improved areas and the whole region of the Qinling Mountains (Shaanxi section). DEM and temperature were the two dominant factors affecting vegetation cover changes in both the whole and local degraded/restored regions. Additionally, slope, radiation, and human disturbance factors had a smaller effect on vegetation cover in all three areas. The pattern of the constraint effect of natural factors on FVC changed after the variables reached the threshold; human disturbance factors had a decreasing negative constraint on FVC. The thresholds of each variable in different regions in different years were correlated with the distribution pattern or change pattern of climatic and topographic characteristics. The results of this study can help us better understand the situation of vegetation changes in the Qinling area and assist decision-makers in accurately formulating ecological restoration policies in the Qinling area in order to balance development and protection.

Author Contributions

Conceptualization, S.W., M.G. and Z.L.; formal analysis, S.W. and J.M.; funding acquisition, Z.L. and J.P.; investigation, S.W. and J.M.; methodology, S.W. and M.G.; project administration, M.G., Z.L. and J.P.; software, S.W.; supervision, M.G. and Z.L.; validation, S.W. and M.G.; visualization, S.W.; writing—original draft, S.W.; writing—review and editing, S.W., M.G. and Z.L. All authors have read and agreed to the published version of the manuscript.

Funding

This research was funded by the Shaanxi Province Science and Technology Innovation Team (Ref. 2021TD-51), the Shaanxi Province Geoscience Big Data and Geohazard Prevention Innovation Team (Ref. 2022), and the Fundamental Research Funds for the Central Universities, CHD (Refs. 300102260301 and 300102262902).

Data Availability Statement

The data presented in this study are available on request from the corresponding author.

Conflicts of Interest

The authors declare no conflicts of interest.

References

  1. Xin, Z.; Xu, J.; Zheng, W. Spatiotemporal variations of vegetation cover on the Chinese Loess Plateau (1981–2006): Impacts of climate changes and human activities. Sci. China Ser. D Earth Sci. 2008, 51, 67–78. [Google Scholar] [CrossRef]
  2. Zheng, K.; Wei, J.-Z.; Pei, J.-Y.; Cheng, H.; Zhang, X.-L.; Huang, F.-Q.; Li, F.-M.; Ye, J.-S. Impacts of climate change and human activities on grassland vegetation variation in the Chinese Loess Plateau. Sci. Total Environ. 2019, 660, 236–244. [Google Scholar] [CrossRef] [PubMed]
  3. Anderegg, W.R.L.; Trugman, A.T.; Badgley, G.; Anderson, C.M.; Bartuska, A.; Ciais, P.; Cullenward, D.; Field, C.B.; Freeman, J.; Goetz, S.J.; et al. Climate-driven risks to the climate mitigation potential of forests. Science 2020, 368, eaaz7005. [Google Scholar] [CrossRef] [PubMed]
  4. Deng, C.; Bai, H.; Gao, S.; Liu, R.; Ma, X.; Huang, X.; Meng, Q. Spatial-temporal Variation of the Vegetation Coverage in Qinling Mountains and Its Dual Response to Climate Change and Human Activities. J. Nat. Resour. 2018, 33, 425–438. [Google Scholar] [CrossRef]
  5. Ji, Y.; Zhou, G.; Wang, L.; Zhou, M.; Wang, S. Evolution characteristics and its driving forces analysis of vegetation ecological quality in Qinling Mountains region from 2000 to 2019. Chin. J. Plant Ecol. 2021, 45, 617–625. [Google Scholar] [CrossRef]
  6. Xu, G.; Cheng, Y.; Zhao, C.; Mao, J.; Li, Z.; Jia, L.; Zhang, Y.; Wang, B. Effects of driving factors at multi-spatial scales on seasonal runoff and sediment changes. CATENA 2023, 222, 106867. [Google Scholar] [CrossRef]
  7. Jiao, K.; Gao, J.; Wu, S.; Hou, W. Research progress on the response processes of vegetation activity to climate change. Acta Ecol. Sin. 2018, 38, 2229–2238. [Google Scholar]
  8. Goeking, S.A.; Tarboton, D.G. Forests and Water Yield: A Synthesis of Disturbance Effects on Streamflow and Snowpack in Western Coniferous Forests. J. For. 2020, 118, 172–192. [Google Scholar] [CrossRef]
  9. van der Putten, W.H.; Bradford, M.A.; Brinkman, E.P.; van de Voorde, T.F.J.; Veen, G.F. Where, when and how plant–soil feedback matters in a changing world. Funct. Ecol. 2016, 30, 1109–1121. [Google Scholar] [CrossRef]
  10. Liu, J.; Gao, J. Effects of climate and land use change on the changes of vegetation coverage in farming-pastoral ecotone of Northern China. J. Appl. Ecol. 2008, 19, 2016–2022. [Google Scholar]
  11. Moles, A.T.; Perkins, S.E.; Laffan, S.W.; Flores-Moreno, H.; Awasthy, M.; Tindall, M.L.; Sack, L.; Pitman, A.; Kattge, J.; Aarssen, L.W.; et al. Which is a better predictor of plant traits: Temperature or precipitation? J. Veg. Sci. 2014, 25, 1167–1180. [Google Scholar] [CrossRef]
  12. Stocker, B.D.; Tumber-Dávila, S.J.; Konings, A.G.; Anderson, M.C.; Hain, C.; Jackson, R.B. Global patterns of water storage in the rooting zones of vegetation. Nat. Geosci. 2023, 16, 250–256. [Google Scholar] [CrossRef] [PubMed]
  13. Shi, S.; Yu, J.; Wang, F.; Wang, P.; Zhang, Y.; Jin, K. Quantitative contributions of climate change and human activities to vegetation changes over multiple time scales on the Loess Plateau. Sci. Total Environ. 2021, 755, 142419. [Google Scholar] [CrossRef] [PubMed]
  14. Guo, J.; Hu, Y.; Xiong, Z.; Yan, X.; Ren, B.; Bu, R. Spatiotemporal Variations of Growing-Season NDVI Associated with Climate Change in Northeastern China’s Permafrost Zone. Pol. J. Environ. Stud. 2017, 26, 1521–1530. [Google Scholar] [CrossRef] [PubMed]
  15. Kattenborn, T.; Leitloff, J.; Schiefer, F.; Hinz, S. Review on Convolutional Neural Networks (CNN) in vegetation remote sensing. ISPRS J. Photogramm. Remote Sens. 2021, 173, 24–49. [Google Scholar] [CrossRef]
  16. Liu, C.; Zhang, X.; Wang, T.; Chen, G.; Zhu, K.; Wang, Q.; Wang, J. Detection of vegetation coverage changes in the Yellow River Basin from 2003 to 2020. Ecol. Indic. 2022, 138, 108818. [Google Scholar] [CrossRef]
  17. Mu, B.; Zhao, X.; Wu, D.; Wang, X.; Zhao, J.; Wang, H.; Zhou, Q.; Du, X.; Liu, N. Vegetation Cover Change and Its Attribution in China from 2001 to 2018. Remote Sens. 2021, 13, 496. [Google Scholar] [CrossRef]
  18. Mao, P.; Zhang, J.; Li, M.; Liu, Y.; Wang, X.; Yan, R.; Shen, B.; Zhang, X.; Shen, J.; Zhu, X.; et al. Spatial and temporal variations in fractional vegetation cover and its driving factors in the Hulun Lake region. Ecol. Indic. 2021, 135, 108490. [Google Scholar] [CrossRef]
  19. Jin, Y.; Zhang, H.; Yan, Y.; Cong, P. A Semi-Parametric Geographically Weighted Regression Approach to Exploring Driving Factors of Fractional Vegetation Cover: A Case Study of Guangdong. Sustainability 2020, 12, 7512. [Google Scholar] [CrossRef]
  20. Chen, Z.; Wang, W.; Fu, J. Vegetation response to precipitation anomalies under different climatic and biogeographical conditions in China. Sci. Rep. 2020, 10, 830. [Google Scholar] [CrossRef]
  21. Ren, Y.; Lü, Y.; Fu, B.; Comber, A.; Li, T.; Hu, J. Driving Factors of Land Change in China’s Loess Plateau: Quantification Using Geographically Weighted Regression and Management Implications. Remote Sens. 2020, 12, 453. [Google Scholar] [CrossRef]
  22. Zhang, S.; Zhou, Y.; Yu, Y.; Li, F.; Zhang, R.; Li, W. Using the Geodetector Method to Characterize the Spatiotemporal Dynamics of Vegetation and Its Interaction with Environmental Factors in the Qinba Mountains, China. Remote Sens. 2022, 14, 5794. [Google Scholar] [CrossRef]
  23. Mo, K.; Chen, Q.; Chen, C.; Zhang, J.; Wang, L.; Bao, Z. Spatiotemporal variation of correlation between vegetation cover and precipitation in an arid mountain-oasis river basin in northwest China. J. Hydrol. 2019, 574, 138–147. [Google Scholar] [CrossRef]
  24. Li, X. The First Law of Geography and Spatial-Temporal Proximity. Chin. J. Nat. 2007, 29, 69–71. [Google Scholar]
  25. Tobler, W.R. A Computer Movie Simulating Urban Growth in the Detroit Region. Econ. Geogr. 1970, 46, 234–240. [Google Scholar] [CrossRef]
  26. Tobler, W. On the First Law of Geography: A Reply. Ann. Assoc. Am. Geogr. 2004, 94, 304–310. [Google Scholar] [CrossRef]
  27. Xu, Z.; Peng, J.; Zhang, H.; Liu, Y.; Dong, J.; Qiu, S. Exploring spatial correlations between ecosystem services and sustainable development goals: A regional-scale study from China. Landsc. Ecol. 2022, 37, 3201–3221. [Google Scholar] [CrossRef]
  28. He, J.; Shi, X. Detection of social-ecological drivers and impact thresholds of ecological degradation and ecological restoration in the last three decades. J. Environ. Manag. 2022, 318, 115513. [Google Scholar] [CrossRef]
  29. Bennett, E.M.; Peterson, G.D.; Gordon, L.J. Understanding relationships among multiple ecosystem services. Ecol. Lett. 2009, 12, 1394–1404. [Google Scholar] [CrossRef]
  30. Qu, S.; Wang, L.; Lin, A.; Zhu, H.; Yuan, M. What drives the vegetation restoration in Yangtze River basin, China: Climate change or anthropogenic factors? Ecol. Indic. 2018, 90, 438–450. [Google Scholar] [CrossRef]
  31. Zhang, S.; Xiao, Z.; Huo, J.; Zhang, H. Key factors influencing on vegetation restoration in the gullies of the Mollisols. J. Environ. Manag. 2021, 299, 113704. [Google Scholar] [CrossRef] [PubMed]
  32. Peng, J.; Tian, L.; Liu, Y.; Zhao, M.; Hu, Y.n.; Wu, J. Ecosystem services response to urbanization in metropolitan areas: Thresholds identification. Sci. Total Environ. 2017, 607–608, 706–714. [Google Scholar] [CrossRef] [PubMed]
  33. Li, D.; Cao, W.; Dou, Y.; Wu, S.; Liu, J.; Li, S. Non-linear effects of natural and anthropogenic drivers on ecosystem services: Integrating thresholds into conservation planning. J. Environ. Manag. 2022, 321, 116047. [Google Scholar] [CrossRef] [PubMed]
  34. Guo, Q.; Brown, J.H.; Enquist, B.J. Using Constraint Lines to Characterize Plant Performance. Oikos 1998, 83, 237. [Google Scholar] [CrossRef]
  35. Liu, L.; Wang, Z.; Wang, Y.; Zhang, Y.; Shen, J.; Qin, D.; Li, S. Trade-off analyses of multiple mountain ecosystem services along elevation, vegetation cover and precipitation gradients: A case study in the Taihang Mountains. Ecol. Indic. 2019, 103, 94–104. [Google Scholar] [CrossRef]
  36. Zhang, Z.; Chang, J.; Xu, C.; Zhou, Y.; Wu, Y.; Chen, X.; Jiang, S.; Duan, Z. The response of lake area and vegetation cover variations to climate change over the Qinghai-Tibetan Plateau during the past 30years. Sci. Total Environ. 2018, 635, 443–451. [Google Scholar] [CrossRef] [PubMed]
  37. Mann, H.B. Nonparametric tests against trend. Econom. J. Econom. Soc. 1945, 13, 245–259. [Google Scholar] [CrossRef]
  38. Kendall, M.G. Rank Correlation Methods; Griffin: Oxford, UK, 1948. [Google Scholar]
  39. Wang, J.; Xu, C. Geodetector: Principle and prospective. Acta Geogr. Sin. 2017, 72, 116–134. [Google Scholar]
  40. Wang, J.; Li, X.; Christakos, G.; Liao, Y.; Zhang, T.; Gu, X.; Zheng, X. Geographical Detectors-Based Health Risk Assessment and its Application in the Neural Tube Defects Study of the Heshun Region, China. Int. J. Geogr. Inf. Sci. 2010, 24, 107–127. [Google Scholar] [CrossRef]
  41. Gao, F.; Li, S.; Tan, Z.; Wu, Z.; Zhang, X.; Huang, G.; Huang, Z. Understanding the modifiable areal unit problem in dockless bike sharing usage and exploring the interactive effects of built environment factors. Int. J. Geogr. Inf. Sci. 2021, 35, 1905–1925. [Google Scholar] [CrossRef]
  42. Song, Y.; Wang, J.; Ge, Y.; Xu, C. An optimal parameters-based geographical detector model enhances geographic characteristics of explanatory variables for spatial heterogeneity analysis: Cases with different types of spatial data. GIScience Remote Sens. 2020, 57, 593–610. [Google Scholar] [CrossRef]
  43. Wang, J.; Zhang, T.; Fu, B. A measure of spatial stratified heterogeneity. Ecol. Indic. 2016, 67, 250–256. [Google Scholar] [CrossRef]
  44. Blackburn, T.M.; Lawton, J.H.; Perry, J.N. A Method of Estimating the Slope of Upper Bounds of Plots of Body Size and Abundance in Natural Animal Assemblages. Oikos 1992, 65, 107. [Google Scholar] [CrossRef]
  45. Hao, R.; Yu, D.; Wu, J.; Guo, Q.; Liu, Y. Constraint line methods and the applications in ecology. Chin. J. Plant Ecol. 2016, 40, 1100–1109. [Google Scholar] [CrossRef]
  46. Thomson, J.D.; Weiblen, G.; Thomson, B.A.; Alfaro, S.; Legendre, P. Untangling Multiple Factors in Spatial Distributions: Lilies, Gophers, and Rocks. Ecology 1996, 77, 1698–1715. [Google Scholar] [CrossRef]
  47. Zhao, K.; Shi, Y.; Niu, M. Research on the temporal and spatial changes of vegetation coverage in Qinling mountains based on Google Earth Engine platform. Bull. Surv. Mapp. 2022, 05, 49–55. [Google Scholar] [CrossRef]
  48. Kang, X.; Cao, J.; Chen, C.; Yang, J.; Wang, J. Analysis of long-term vegetation change in Ningxia with different trend methods. Bull. Surv. Mapp. 2020, 11, 23–27. [Google Scholar] [CrossRef]
  49. Wang, Y.; Lv, W.; Xue, K.; Wang, S.; Zhang, L.; Hu, R.; Zeng, H.; Xu, X.; Li, Y.; Jiang, L.; et al. Grassland changes and adaptive management on the Qinghai–Tibetan Plateau. Nat. Rev. Earth Environ. 2022, 3, 668–683. [Google Scholar] [CrossRef]
  50. Deng, H.; Yu, H.; Lu, L.; Zhang, X.; Zhang, X. Research on the distribution characteristics and formation mechanisms of Chinese traditional villages. World Reg. Stud. 2023, 32, 132–143. [Google Scholar]
  51. Hao, R.; Yu, D.; Sun, Y.; Shi, M. The features and influential factors of interactions among ecosystem services. Ecol. Indic. 2019, 101, 770–779. [Google Scholar] [CrossRef]
  52. Wang, C.; Tang, C.; Fu, B.; Lü, Y.; Xiao, S.; Zhang, J. Determining critical thresholds of ecological restoration based on ecosystem service index: A case study in the Pingjiang catchment in southern China. J. Environ. Manag. 2022, 303, 114220. [Google Scholar] [CrossRef] [PubMed]
  53. Wang, J.; Dong, K. What drives environmental degradation? Evidence from 14 Sub-Saharan African countries. Sci. Total Environ. 2019, 656, 165–173. [Google Scholar] [CrossRef] [PubMed]
  54. Foody, G.M. Remote sensing in landscape ecology. Landsc. Ecol. 2023, 38, 2711–2716. [Google Scholar] [CrossRef]
  55. Lechner, A.M.; Foody, G.M.; Boyd, D.S. Applications in Remote Sensing to Forest Ecology and Management. One Earth 2020, 2, 405–412. [Google Scholar] [CrossRef]
  56. Li, H.; Song, W. Spatiotemporal Distribution and Influencing Factors of Ecosystem Vulnerability on Qinghai-Tibet Plateau. Int. J. Environ. Res. Public Health 2021, 18, 6508. [Google Scholar] [CrossRef] [PubMed]
  57. Fang, L.; Wang, L.; Chen, W.; Sun, J.; Cao, Q.; Wang, S.; Wang, L. Identifying the impacts of natural and human factors on ecosystem service in the Yangtze and Yellow River Basins. J. Clean. Prod. 2021, 314, 127995. [Google Scholar] [CrossRef]
  58. Wang, J.; Price, K.P.; Rich, P.M. Spatial patterns of NDVI in response to precipitation and temperature in the central Great Plains. Int. J. Remote Sens. 2010, 22, 3827–3844. [Google Scholar] [CrossRef]
  59. Tan, S.Y. The influence of temperature and precipitation climate regimes on vegetation dynamics in the US Great Plains: A satellite bioclimatology case study. Int. J. Remote Sens. 2007, 28, 4947–4966. [Google Scholar] [CrossRef]
  60. Wu, J.; Chen, X. Spatiotemporal trends of dryness/wetness duration and severity: The respective contribution of precipitation and temperature. Atmos. Res. 2019, 216, 176–185. [Google Scholar] [CrossRef]
  61. Qi, G.; Bai, H.; Zhao, T.; Meng, Q.; Zhang, S. Sensitivity and areal differentiation of vegetation responses to hydrothermal dynamics on the southern and northern slopes of the Qinling Mountains in Shaanxi province. Acta Geogr. Sin. 2021, 76, 44–56. [Google Scholar] [CrossRef]
  62. Wei, X.; He, W.; Zhou, Y.; Cheng, N.; Xiao, J.; Bi, W.; Liu, Y.; Sun, S.; Ju, W. Increased Sensitivity of Global Vegetation Productivity to Drought Over the Recent Three Decades. J. Geophys. Res. Atmos. 2023, 128, e2022JD037504. [Google Scholar] [CrossRef]
  63. Daham, A.; Han, D.; Rico-Ramirez, M.; Marsh, A. Analysis of NVDI variability in response to precipitation and air temperature in different regions of Iraq, using MODIS vegetation indices. Environ. Earth Sci. 2018, 77, 389. [Google Scholar] [CrossRef]
  64. Piao, S.; Fang, J.; Zhou, L.; Guo, Q.; Henderson, M.; Ji, W.; Li, Y.; Tao, S. Interannual variations of monthly and seasonal normalized difference vegetation index (NDVI) in China from 1982 to 1999. J. Geophys. Res. 2003, 108, 4401. [Google Scholar] [CrossRef]
  65. Jiao, W.; Chang, Q.; Wang, L. The Sensitivity of Satellite Solar-Induced Chlorophyll Fluorescence to Meteorological Drought. Earth’s Future 2019, 7, 558–573. [Google Scholar] [CrossRef]
  66. Xiong, X.; Li, C.; Chen, J. Topographic regulatory role of vegetation response to climate change. Acta Geogr. Sin. 2023, 78, 2256–2270. [Google Scholar] [CrossRef]
  67. Zhong, J.; Luo, M.; Hui, Y.; Chen, X.; Feng, C. Critical thresholds in ecological restoration to achieve optimal ecosystem services: An analysis based on forest ecosystem restoration projects in China. Land Use Policy 2018, 76, 675–678. [Google Scholar] [CrossRef]
  68. Wu, J.; Dai, Y.; Cheng, S. General trends in freshwater ecological restoration practice in China over the past two decades: The driving factors and the evaluation of restoration outcome. Environ. Sci. Eur. 2020, 32, 60. [Google Scholar] [CrossRef]
  69. Liu, Q.; Qiao, J.; Li, M.; Huang, M. Spatiotemporal heterogeneity of ecosystem service interactions and their drivers at different spatial scales in the Yellow River Basin. Sci. Total Environ. 2024, 908, 168486. [Google Scholar] [CrossRef]
  70. Mills, A.; Fey, M.; Donaldson, J.; Todd, S.; Theron, L. Soil infiltrability as a driver of plant cover and species richness in the semi-arid Karoo, South Africa. Plant Soil 2009, 320, 321–332. [Google Scholar] [CrossRef]
Figure 1. Geographical location (a), elevation (b), and vegetation types (c) of the study area.
Remotesensing 16 00160 g001
Figure 2. Spatial distribution of FVC for the period 2000–2020.
Remotesensing 16 00160 g002
Figure 3. Trend slope of spatially averaged FVC during 2000–2020.
Remotesensing 16 00160 g003
Figure 4. The spatial distribution of FVC change trends and significance is shown in the areas outlined in red, and typical degradation and restoration areas are shown in the areas outlined in blue.
Remotesensing 16 00160 g004
Figure 5. PD values of seven driving factors of degradation area (a), restoration area (b), and whole region (c) for 2000–2020.
Remotesensing 16 00160 g005
Figure 6. Scatter clouds (blue points), constraint lines (red lines), and thresholds (black points) between seven factors (DEM (m), SLOPE (°), TEM (°C), PRE (mm), RAD (rad·e7·W·m−2), NL and POP (pop·km−2)), and FVC of degradation and restoration areas in 2010 and 2020.
Remotesensing 16 00160 g006
Figure 7. Spatial averaged annual precipitation from 2000 to 2020.
Remotesensing 16 00160 g007
Table 1. Description of data used in this study.
DataDescriptionResolutionSources
Study area
boundaries
Qinling Ecological Environment Protection Committee/http://qinling.shaanxi.gov.cn (accessed on 20 December 2023)
NDVIMOD13Q1250 mhttps://ladsweb.modaps.eosdis.nasa.gov/ (accessed on 20 December 2023)
DEMNASA SRTM Digital Elevation30 mhttps://earthexplorer.usgs.gov/ (accessed on 20 December 2023)
Temperature
(TEM)
1 km monthly temperature and precipitation dataset for China from 1901 to 20171 kmhttp://loess.geodata.cn (accessed on 20 December 2023)
Precipitation
(PRE)
Radiation
(RAD)
ECMWF ERA5 Reanalysis Dataset11,132 mhttps://www.ecmwf.int/ (accessed on 20 December 2023)
Population (POP)Worldpop Dataset100 mhttps://data.humdata.org/dataset/worldpop-population-counts-for-china (accessed on 20 December 2023)
Nightlight
(NL)
Nightlight Dataset100 m–1 kmhttps://poles.tpdc.ac.cn/ (accessed on 20 December 2023)
Table 2. Area percentage of different trends in FVC.
SlopeZ-StatisticFVC TrendArea Percentage
≥0.0005≥1.96Significant Restoration29.0%
≥0.0005[−1.96, 1.96)Slight Restoration40.2%
[−0.0005, 0.0005)[−1.96, 1.96)Stabilization8.8%
<−0.0005[−1.96, 1.96)Slight Degradation19.7%
<−0.0005<−1.96Significant Degradation 2.3%
Table 3. Q-value and rank of whole and local factors detection.
FactorsWhole RegionDegradation AreaRestoration Area
q-ValueRankq-ValueRankq-ValueRank
DEM0.3623210.3432210.303781
TEM0.3116420.2896120.239992
POP0.1268740.1123540.117653
SLOPE0.0932750.0660150.043586
PRE0.0813960.2450230.097245
RAD0.0812370.0623370.098264
NL0.1313430.0645660.043537
Table 4. Thresholds based on constraint lines for degradation and restoration areas in 2010 and 2020.
Area_YearDEM
(m)
SLOPE
(°)
TEM
(°C)
PRE
(mm)
RAD
(W·m−2)
NL
POP
(pop·km−2)
De_20101779.040.667.89807.775.34 × 109--
De_20201825.5138.957.62742.594.95 × 109--
Re_20101596.6535.909.06917.255.12 × 109--
Re_20201650.7039.309.07886.694.89 × 109--
Disclaimer/Publisher’s Note: The statements, opinions and data contained in all publications are solely those of the individual author(s) and contributor(s) and not of MDPI and/or the editor(s). MDPI and/or the editor(s) disclaim responsibility for any injury to people or property resulting from any ideas, methods, instructions or products referred to in the content.

