Abstract
Radio frequency interference (RFI) poses major threats to synthetic aperture radar (SAR) systems. Due to the suppression of useful target signals via high-power RFI, the SAR imaging quality is severely degraded. Nevertheless, existing studies on RFI mitigation mainly focus on narrowband filtering, while wideband RFI mitigation methods are relatively lacking and perform non-robustly. In this paper, an RFI mitigation scheme is proposed based on instantaneous spectrum forward consecutive mean excision (FCME), which is suitable for both narrowband and wideband RFI mitigation. The SAR echo signal is first transformed into a time–frequency (TF) domain through a short-time Fourier transform (STFT). On this basis, the instantaneous spectra polluted via RFI are detected via a kurtosis-based statistical test and then filtered via FCME to achieve RFI mitigation. Finally, connected component analysis is applied as a safety measure so as to avoid the unnecessary loss of useful target signal. The combination of FCME and connected component analysis enables the proposed method to thoroughly filter out RFI while retaining more useful target signals compared with other competing methods. The experimental results on real SAR raw data validate the effectiveness of the proposed method.
1. Introduction
Synthetic aperture radar (SAR) is an active remote sensing radar system. With its unique synthetic aperture technology, SAR can provide high-resolution imaging under all-day and all-weather conditions, and it has broad applications in military and civilian fields [1,2,3,4,5,6]. With the expansion in application scope and the continuous improvement in detection capability, SAR is currently facing increasingly complicated electromagnetic environments. The available electromagnetic spectrum resources have been gradually occupied by communication devices, television networks, and military radars, making SAR vulnerable to the radio frequency interference (RFI) generated by these radiation sources [7]. In terms of action mechanism, RFI significantly reduces the signal-to-jamming ratio (SJR) of SAR echo signals through its high-power characteristics. As a result, the resulting SAR images have blurs and bright lines, which mask the targets of interest and invalidate subsequent image interpretations [8,9,10]. Evidently, the existence of RFI has posed serious threats to SAR functioning; thus, it is of paramount importance to study the signal characteristics, as well as mitigation schemes, of RFI.
According to the relative bandwidth of the interference signal, RFI can be generally classified into narrowband interference (NBI) and wideband interference (WBI). The energy distribution of NBI in the frequency domain is relatively concentrated, while WBI accounts for a considerable portion of the useful target signal’s bandwidth, with its instantaneous frequency constantly changing with time. Figure 1 shows a range–frequency azimuth-time representation of SAR echo data contaminated with NBI and WBI, respectively. In Figure 1a, some isolated bright spots or vertical bright lines appear in the data polluted by NBI, which corresponds to the narrowband characteristics of NBI in each single pulse, possessing only a few frequency bins. In contrast, WBI appears as multiple horizontal lines in Figure 1b, indicating a significantly larger bandwidth occupied by the interference signal. From an overall perspective, NBI and WBI markedly differ in signal characteristics and, therefore, are often treated distinctively.
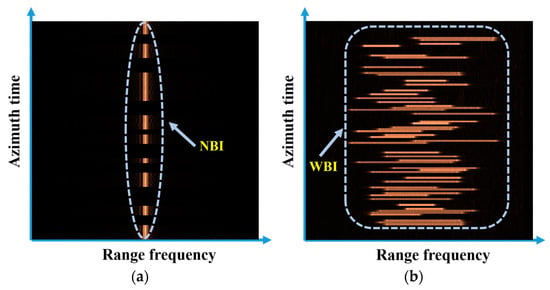
Figure 1.
Range–frequency azimuth-time representations of the RFI-polluted SAR echoes: (a) NBI-polluted SAR echoes; (b) WBI-polluted SAR echoes.
In recent years, studies on RFI have received increasing attention, and a variety of RFI mitigation methods have been proposed, which can be mainly divided into two categories: parametric and non-parametric.
Parametric methods characterize the specific interference form with a mathematical model, and RFI components can be reconstructed and subtracted from radar echoes by estimating the key parameters of the established mathematical model. Typical approaches, such as maximum likelihood (ML) [11], least squares (LS) [12], gradual relaxation [13], and Bayesian inference [14], model NBI as a summation of sinusoidal signals and estimate the interference parameters by minimizing the difference between the reconstructed signal and received signal. On this basis, Liu et al. realized the fast convergence of a time-varying model estimation by means of an iterative adaptive approach (IAA) [15,16]. Also, high-order ambiguity functions (HAFs) were utilized in [17,18] for polynomial phase approximation, which improves the phase estimation accuracy of the interference signal to some extent. Given complete modeling and precise parameter approximations, parametric methods are theoretically optimum for RFI mitigation. However, such methods are not robust enough since their performance heavily depends on complex modeling and accurate parameter estimation.
Non-parametric methods mainly include notch filtering methods [19,20,21,22,23], adaptive filtering methods [24,25,26,27], and other component decomposition methods [28,29,30,31,32,33,34,35,36]. The commonality these methods share is based on the feature difference between RFI and the useful target signal. The received radar echo signal is transformed into a certain transform domain; then, RFI filtering is performed with a specially designed filter. In contrast with parametric methods, non-parametric methods can carry out RFI suppression without any prior knowledge or parametric modeling. The range spectrum notch filtering method achieves RFI removal by zeroing the frequency bands that exceed the preset threshold [19]. This method is effective and simple to implement, but it will lead to spectral discontinuity and possible residual interference components. In order to resolve these problems, Xu et al. adopt linear prediction extrapolation for spectrum completion after two-step notch filtering, which eliminates the residual RFI components but cannot guarantee the recovery of the filtered useful signal [20]. The mitigation of WBI is usually conducted through mask [21] and instantaneous spectrum notch filtering [22] in the time–frequency (TF) domain so as to avoid the decrease in spatial resolution caused by excessive spectrum zeroing [23]. These TF notch filtering methods are essentially the same as the range spectrum notch filtering method, which may leave the edge part of the interference signal unsuppressed in the TF domain, and are partially invalid under mixed strong and weak interference situations. The adaptive filtering methods take the specific interference signal as the reference signal, and iteratively fit the RFI-free components through typical adaptive filters like the least mean square (LMS) filter [24,25,26] and Wiener filter [27] to realize the separation of useful target signals and RFI. Considering the computational efficiency and practical effect, the adaptive filtering methods are widely applied in NBI mitigation scenarios but suffer from unstable convergence performance, especially in the cases of time-varying signals. Furthermore, scholars at home and abroad also put forward some component decomposition methods. Based on the high intensity of NBI and the assumption that the useful target signal approximately obeys Gaussian distribution, the received SAR echo signal can be decomposed into a series of intrinsic mode functions via complex empirical mode decomposition (CEMD) [28] or divided into interference subspace and useful signal subspace via eigenvalue decomposition [29], as well as singular value decomposition [30]. The NBI components usually correspond to several intrinsic mode functions, eigenvalues, and singular values with the largest energy. On top of that, other component decomposition methods achieve the simultaneous extraction of NBI and WBI on account of the low-rank feature of RFI and the sparsity of useful target signals in the TF domain [31,32,33,34,35,36]. Methodologically, numerous optimization models are involved in decomposing the TF data matrix of the received echo signal, which efficaciously protects the useful target signal with the constraints of the optimization models, at the cost of computational complexity and performance robustness.
As can be concluded from the above literature review, the majority of anti-RFI schemes at present focus on dealing with NBI, while those restraining WBI are relatively insufficient or perform non-robustly. In order to develop an effective method for both NBI and WBI attenuation, an RFI mitigation method based on instantaneous spectrum forward consecutive mean excision (FCME) is proposed in this paper. Firstly, the received SAR echo signal is transformed into a TF domain via a short-time Fourier transform (STFT). For every spectrum corresponding to a single time unit in the obtained TF data, i.e., the instantaneous spectrum, a kurtosis-based statistical test is introduced to detect the presence of RFI components. The instantaneous spectra with RFI are then filtered by means of FCME, which screens out the RFI-corrupted instantaneous frequency points through iterative calculation. Compared with competing methods, the edge part of RFI components in the TF graph can be more finely removed. After the completion of instantaneous filtering, TF screening based on connected component analysis is employed as a safety measure, preventing unnecessary useful signal loss resulting from the false alarms of FCME. Lastly, a temporal signal without interference can be regained through inverse STFT (ISTFT). The proposed method achieves the detection and mitigation of both NBI and WBI by taking full advantage of the narrowband characteristic of RFI in the instantaneous spectrum, and its effectiveness is tested under various circumstances.
The remainder of this paper is arranged as follows: Section 2 presents the TF characteristics of the SAR received signal with and without RFI. Section 3 elaborates on the proposed RFI mitigation scheme, where the procedures of kurtosis-based statistical test, instantaneous spectrum FCME, and subsequent connected component analysis are introduced in detail. Section 4 conducts a series of simulated experiments on SAR raw data to verify the effectiveness of the proposed method, followed by comprehensive discussions on the proposed method, and future research directions are presented in Section 5. Finally, the main conclusions are drawn in Section 6.
2. SAR Signal Model with RFI
For SAR systems, the received complex-valued SAR echo signal consists of two dimensions of fast time and slow time , which correspond to the distance direction and azimuth direction of the resulting image, respectively. Therefore, the received SAR echo signal can be modeled as:
where , , and N denote the useful target signal, RFI, and addictive noise, respectively. Specifically, RFI can be further categorized into NBI and WBI according to the bandwidth of the interference signal.
NBI is highly concentrated in the frequency domain and generally occupies less than 1% of the transmitted signal’s bandwidth [9], which can be expressed as:
where , , , and represent the complex envelope, pulse width, frequency, and initial phase of NBI from the th interference source, respectively. is a rectangular window function with window width and starting point 0.
Compared with NBI, WBI possesses a much larger bandwidth and its instantaneous frequency keeps varying with time. In many application scenarios, WBI is linearly modulated and can be formulated as:
where , , , and are the complex envelope, pulse width, frequency, and chirp rate of the th WBI. This modeling reflects the time-varying characteristics of the interference signals in practical applications.
Figure 2 demonstrates the RFI-contaminated SAR single pulse-echo signals in different domains. It can be seen from Figure 2a,d that RFI differs from the useful target signal and noise signal, primarily in the aspect of signal amplitude in the time domain, and owing to the high intensity of the interference, the amplitude of the RFI-containing time units is notably larger than the adjacent time units. In the frequency domain, as illustrated in Figure 2b,e, the energy of NBI is extremely concentrated in merely a few frequency bins, while that of WBI is evenly distributed within a certain bandwidth, accounting for many more frequency bins. As for TF representation, NBI presents a straight line parallel to the time axis in Figure 2c, indicating a fixed frequency. By comparison, WBI appears as an oblique line in Figure 2f, with its instantaneous frequency changing in accordance with the linear function . Due to intensity differences, the useful target signal and noise signal appear as the darker background in TF images.
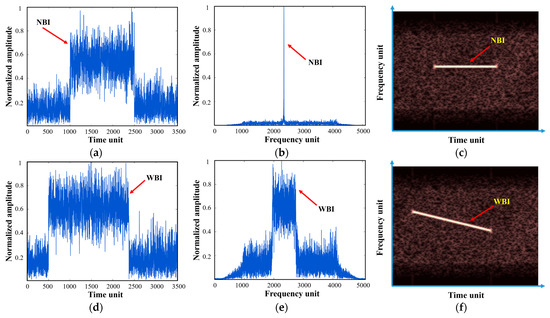
Figure 2.
Signal domains of typical RFI-polluted SAR single pulse-echo signals: (a–c) NBI-polluted SAR echo in the time domain, frequency domain, and TF domain, respectively; (d–f) WBI-polluted SAR echo in the time domain, frequency domain, and TF domain, respectively.
3. The Proposed RFI Mitigation Method
In this section, a detection and mitigation method against RFI is proposed, the detailed process of which is depicted in Figure 3a. Firstly, the received SAR single pulse-echo signal is converted into the TF domain through STFT, and a set of instantaneous spectra can be obtained. For each instantaneous spectrum, a kurtosis-based statistical test is implemented to detect the presence of RFI. If RFI exists, FCME will be applied to locate and filter out the RFI-corrupted frequency bins. After processing all the instantaneous spectra in parallel, connected component analysis is carried out on the TF graph to determine whether there are false alarms in the filtered TF area. This TF screening process manages to avoid unnecessary loss of useful target signals. In the end, the processed TF data are reverted to the time domain by means of ISTFT, where RFI-free signals can finally be acquired.
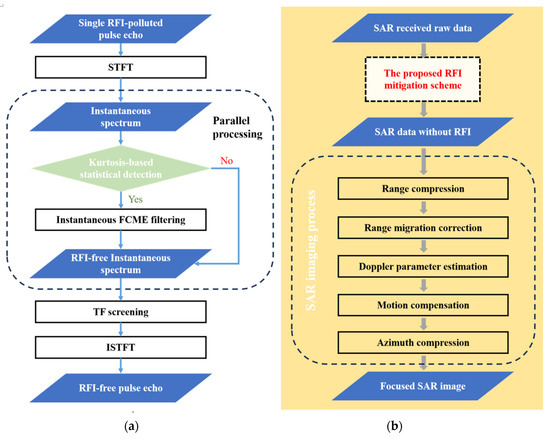
Figure 3.
Flowchart of (a) the proposed RFI mitigation scheme and (b) incorporation with the SAR imaging process.
The proposed method does not affect the parameter estimation and phase compensation in the imaging process and, thus, can be well incorporated with conventional SAR imaging algorithms. As shown in Figure 3b, after conducting the proposed RFI suppression scheme on all the azimuth echoes, SAR data without RFI can be obtained. The image formation process is first accomplished by range compression and range migration correction. Subsequently, in order to acquire a high-quality remote sensing image, doppler parameter estimation and motion compensation are required to correct the phase errors resulting from the inevitable air turbulence during a flight. Finally, a well-focused image can be yielded through azimuth compression.
3.1. Interference Detection
3.1.1. Short-Time Fourier Transform
An interference signal is usually highly coupled to useful target signals in the time or frequency domain; hence, one-dimensional analysis is not suitable for interference mitigation in many cases, especially in the interference scenario of WBI. TF analysis reflects the energy distribution of the signal into two dimensions and can explicitly display the instantaneous frequency variation in the input signal with time. As a representative realization of TF transform, STFT provides the time–local spectral information of the signal, making it suitable for the analysis of time-varying and non-stationary signal components. Suppose that the input signal is , given a certain sliding window with window length , the TF data acquired through STFT can be represented as:
3.1.2. Statistical Detection
In practice, not all instantaneous spectra contain interference components because of the time-varying characteristic of RFI. Consequently, in order to avoid useful signal loss and computing resource waste caused by excessive processing, it is necessary to first detect the instantaneous spectra polluted by RFI before taking interference suppression measures. Figure 4 displays typical instantaneous spectra with and without RFI and their corresponding approximate probability density functions. As shown in Figure 4a,b, since radar echo signal approximately follows complex Gaussian distribution and STFT is a linear transformation, the instantaneous spectra without interference still follow Gaussian-like distribution, with their amplitudes conforming to Rayleigh distribution. Nevertheless, as can be seen from Figure 4c–f, NBI and WBI introduce peaks to the instantaneous spectrum, endowing it with narrowband characteristics, which considerably increase the sharpness of the instantaneous spectrum. Accordingly, extreme values arise in the amplitude distribution, resulting in a tailing phenomenon in the right segment of the probability density function.
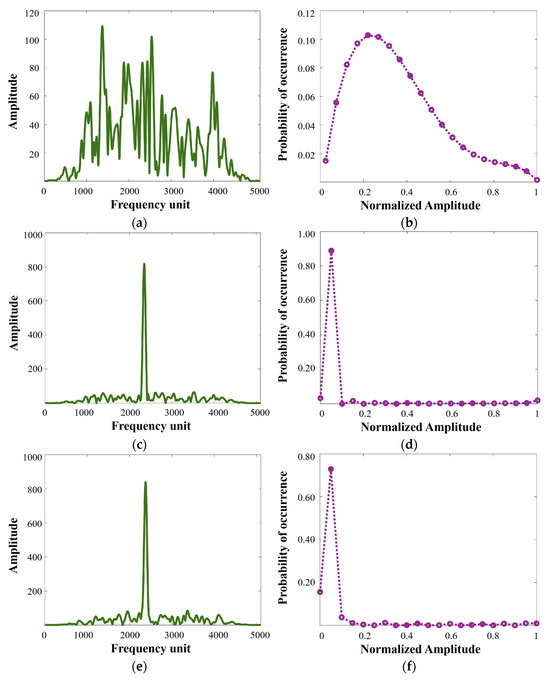
Figure 4.
Typical instantaneous spectra and corresponding approximate probability density functions: (a,b) typical RFI-free instantaneous spectrum and its approximate probability density function; (c,d) typical NBI-polluted instantaneous spectrum and its approximate probability density function; (e,f) typical WBI-polluted instantaneous spectrum and its approximate probability density function.
In view of the obvious statistical difference between the instantaneous spectra with and without RFI, the kurtosis feature is used for interference detection. According to the statistical theory, kurtosis measures the outlier degree of data, and a larger kurtosis indicates more extreme values in the data series, leading to more deviations from the Gaussian distribution. Therefore, when RFI exists in the instantaneous spectrum, the corresponding kurtosis value will be relatively larger. Given a set of instantaneous frequency points , and is the number of instantaneous frequency points, then instantaneous kurtosis can be calculated as:
where denotes the expectation operator, and and are the mean value and standard deviation of the instantaneous frequency amplitude, respectively.
By utilizing a kurtosis-based statistical test, the detection of RFI is converted to a binary hypothesis test problem, which can be modeled as:
where is the preset threshold. Under the null hypothesis , the tested instantaneous spectrum is interference-free and approximately obeys complex Gaussian distribution, while the instantaneous spectrum is tested with pollution by RFI and deviates notably from complex Gaussian distribution under the alternate hypothesis .
Providing an appropriate kurtosis threshold, the instantaneous spectra with and without interference can be well distinguished. On the ground of the Neyman–Pearson criterion, the selected threshold needs to serve as a trade-off between the detection rate and false alarm rate , which is to maximize the detection probability under the constraint of a certain false alarm rate. This can be described as:
where represents the optimal threshold, and is the tolerable false alarm level. As a result, the optimal threshold is data-driven rather than a fixed value and can be derived as a function of the false alarm rate, i.e.:
where is the inverse error function, and and separately represent the mean value and standard deviation of the instantaneous kurtosis values estimated from the RFI-free pulses.
3.2. Interference Mitigation
3.2.1. Instantaneous Spectrum Forward Consecutive Mean Excision
Taking full advantage of recursion and continuous iteration, FCME is a detection algorithm with a variable threshold. In the first step, the amplitudes of all the instantaneous frequency points are sorted, and the frequency points with smaller amplitudes are selected according to a preset proportion as the initially interference-free frequency point set. Based on the mean amplitude value of the interference-free set, the initial threshold of the iteration can be preliminarily obtained. In each subsequent iteration, the instantaneous frequency points with amplitudes higher than the threshold are considered to be polluted and categorized into interference set, while the set of frequency points that are otherwise RFI-free are used to update the threshold for the next iteration. Through continuous iterative calculation, an accurate and stable threshold can be acquired after reaching the balance, and the frequency points in the final interference set are then removed to achieve RFI mitigation.
Assume is the maximum number of iterations, and and are the interference-free set and interference set after the th iteration, respectively. Given a threshold factor , an initial spectrum selection ratio , and the RFI-polluted instantaneous spectrum (with data points), then the specific process of instantaneous spectrum FCME is presented in Algorithm 1.
| Algorithm 1 Instantaneous spectrum FCME |
| Input: The RFI-polluted instantaneous spectrum , the maximum iteration number , the threshold factor , the initial spectrum selection ratio , the data point number in instantaneous spectrum. Output: The interference-free set , the interference set . Initialization: . Procedure:
|
In this algorithm, the threshold factor is related to the false alarm rate of FCME filtering. A higher threshold factor value will result in a lower false alarm rate and, therefore, less useful target signal loss, but may cause interference to be filtered out less thoroughly. In addition, the initial spectrum selection ratio acts as a useful signal protection mechanism and considers the initially selected signal components as useful target signals. The interference-free set thus formed effectively prevents the loss of useful target signals, which is highly suitable for attenuating RFI with narrowband characteristics in the instantaneous spectrum.
3.2.2. TF Screening Based on Connected Component Analysis
Due to the inevitable false alarms in the filtering process, some useful target signal components are filtered out unexpectedly. In consideration of this phenomenon, the proposed method adopts connected component analysis to evaluate the filtered TF image . The input of connected component analysis is a binary graph , which can be expressed as:
For all the TF data points previously determined to be RFI-polluted (), the total number of connected areas is firstly counted, as shown in Figure 5. For the th independent connected area , if the maximum intensity of its corresponding TF dataset is higher than a data-based threshold, the area is still judged to be RFI-polluted and is denoted by . Otherwise, expressed by , the area is determined to be a useful target signal area, and the corresponding TF data that were previously filtered are recovered. Assume the original TF data before RFI mitigation are ; then, the whole TF screening process can be represented as:
where represents the Hadamard product operator, and the abovementioned data-based threshold is equal to the sum of the mean value and standard deviation of . Finally, the fully processed TF data can be obtained. The application of connected component analysis serves as a safety measure for instantaneous spectrum FCME, which effectively prevents the useful signal loss caused by FCME false alarms.
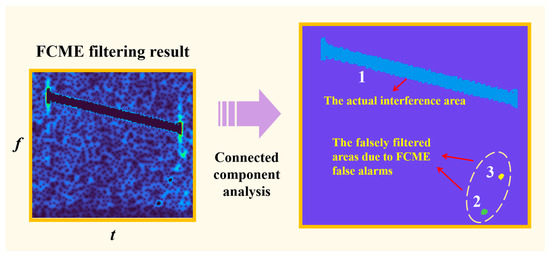
Figure 5.
Connected component analysis result of the FCME-filtered TF image.
3.2.3. Inverse Short-Time Fourier Transform
After the completion of TF data processing, the RFI-free temporal signal can be recovered via ISTFT, which can be expressed as:
By repeating the aforementioned process in a pulse-by-pulse manner, the radar echo data without interference can be obtained and are ready for subsequent imaging processing.
3.3. Evaluation Metric
In order to verify the superiority of the proposed method quantitatively, the interference suppression ratio (ISR), signal distortion ratio (SDR), and multiplicative noise ratio (MNR) [22] are introduced to evaluate the performance of the proposed method as well as other competing methods. In particular, the first two metrics are for a single pulse-echo signal, while MNR is utilized to assess the final imaging quality.
3.3.1. ISR
ISR indicates the degree of interference suppression, which can be defined as the ratio of signal power before and after interference mitigation. A larger ISR implies that there are more signal components removed from the original received signal. Suppose the RFI-corrupted SAR single pulse-echo signal is ; then, the expression of ISR can be written as:
3.3.2. SDR
It is worth noting that a larger ISR is not always better, and sometimes it means that more useful target signals are filtered out. Thus, SDR is employed to measure the distortion of useful target signals after interference mitigation, which can be defined as the normalized energy loss of the useful target signal caused by executing interference mitigation schemes, i.e.:
where is the original SAR single pulse-echo signal without interference.
3.3.3. MNR
As for the resulting SAR image, it suffers from multiplicative noise due to the inherent imaging mechanism. Moreover, the existence of RFI may degrade the integrated side-lobe ratio (ISLR), which is a key factor in increasing multiplicative noise. Therefore, MNR is suitable for evaluating the SAR imaging quality, representing the average energy ratio of the weak scattering area to that of the adjacent strong scattering area in the SAR images, and a smaller MNR indicates a better imaging quality. Assume that and denote the image pixel value of the weak scattering region and strong scattering region, and their corresponding pixel numbers are and , respectively; then, the MNR value can be calculated as:
4. Experimental Results
In this section, the validity of the proposed method is verified under various conditions. Specifically, from the perspectives of single pulse-echo signals as well as distributed target echo signals, quantitative evaluations and qualitative analyses are conducted based on different datasets, and a parameter setting analysis is also provided for the comprehensiveness of the study.
4.1. Results of the Single Pulse-Echo Signal
4.1.1. Single Interference Type Mitigation
In order to validate the effectiveness of the proposed method, the designed NBI and WBI signals are intentionally added to the real measured pulse echoes. The echoes were collected via an airborne SAR operating in the Ku-band, and its working parameters are shown in Table 1.

Table 1.
Airborne SAR dataset parameter.
For the initial kurtosis-based statistical RFI detection, the data-dependent parameters and in Equation (8) are required to be estimated from the RFI-free pulses, which are 3.1254 and 0.9780, respectively. On this basis, the variation trend of the kurtosis threshold with respect to the false alarm level is illustrated in Figure 6, in which the kurtosis threshold witnesses a downward trend with the increase in . In this experiment, the false alarm level is empirically set as .
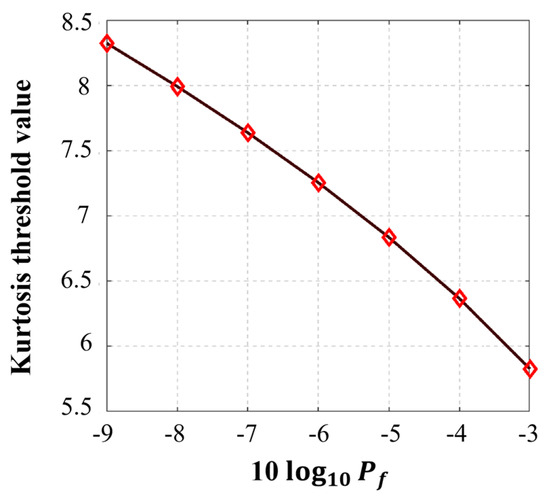
Figure 6.
Variation trend of the kurtosis threshold versus false alarm level.
Figure 7a displays the NBI-corrupted pulse-echo signal in the TF domain, with a jamming-to-signal ratio (JSR) of approximately 20 dB. As analyzed in Section 2, the NBI component appears as a straight bright line parallel to the time axis, indicating a concentrated frequency distribution. Correspondingly, the kurtosis-based statistical test result is shown in Figure 7b, which reveals that the instantaneous spectra containing NBI can be correctly identified for the subsequent mitigation scheme.
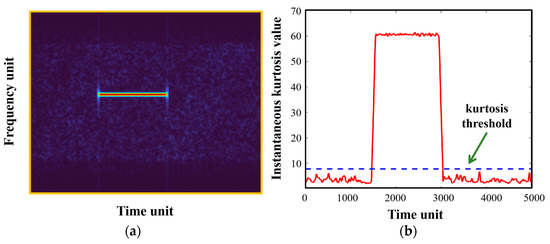
Figure 7.
NBI-corrupted pulse-echo signal and its corresponding interference detection result: (a) TF representation of the NBI-corrupted pulse-echo signal; (b) kurtosis-based statistical test result.
After the detection step, the mitigation measures are then performed. As for the parameter setting, the maximum iteration number , and the threshold factor and initial spectrum selection ratio are set as 5 and 90%, respectively. The RFI suppression performance of the proposed method is compared with the range spectrum notch filtering method [19], the linear prediction extrapolation method [20], the TF mask method [21], and the instantaneous spectrum notch filtering method [22].
The TF domains of the mitigation results are demonstrated in Figure 8, and the quantitative evaluation metrics ISR and SDR are accordingly provided in Table 2. According to Section 3.3.2, a larger ISR does not necessarily mean a greater degree of RFI removal, and sometimes, it implies more useful target signal loss. Therefore, the original TF data without interference are presented in Figure 8a for reference, with a reference ISR of 14.85 dB. In other words, the performance of interference mitigation needs to be evaluated by combining ISR and SDR, and the ISR value corresponding to an excellent mitigation effect is not always the highest but often closer to the reference ISR. Figure 8b exhibits the NBI mitigation result of applying the range spectrum notch filtering method; it can be seen that the main body of the interference has been eliminated, but there is still a considerable part of residual at both ends of NBI in the TF image. In contrast, as shown in Figure 8c, the two-step notch filtering of the linear prediction method further reduces the residue of NBI components and extrapolates the missing spectrum, hence exhibiting a higher ISR and a lower SDR. As demonstrated in Figure 8d,e, the TF filtering methods can better take care of both ends of the RFI components in the TF domain, resulting in higher ISRs, which is especially the case for the instantaneous spectrum notch filtering method. However, both methods preserve the edges of NBI, leaving bright outlines in TF images. Figure 8f displays the NBI processing result of the proposed method, where the edge part of the interference component is treated very finely. Owing to the TF screening process, the proposed method is able to remove RFI thoroughly while protecting useful target signals. Consequently, the proposed method reveals better performance in both interference suppression and useful signal preservation.
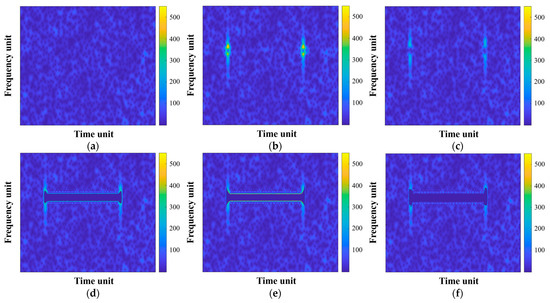
Figure 8.
TF representations of the NBI mitigation results: (a) the original NBI-free data for reference; (b–f) NBI mitigation results of the range spectrum notch filtering method, the linear prediction extrapolation method, the TF mask method, the instantaneous spectrum notch filtering method, and the proposed method, respectively.

Table 2.
Performance comparison of NBI mitigation for a single pulse echo.
As for WBI processing, Figure 9a shows the TF distribution of WBI-corrupted pulse-echo signal, with a JSR of about 20 dB. It can be seen that WBI presents a slanted linear distribution in TF images, occupying a large bandwidth. The statistical test result is accordingly demonstrated in Figure 9b; since both WBI and NBI are characterized with narrowband features in instantaneous spectra, the kurtosis-based statistical test is as equally effective for WBI detection as it is for NBI detection.
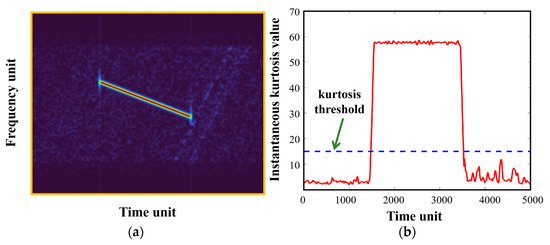
Figure 9.
WBI-corrupted pulse-echo signal and its corresponding interference detection result: (a) TF representation of the WBI-corrupted pulse-echo signal; (b) kurtosis-based statistical test result.
In terms of WBI mitigation, Figure 10 compares the mitigation results of different methods in the TF domain. Similarly, the TF distribution of the original interference-free echo signal is provided in Figure 10a as a reference, with a reference ISR of 16.04 dB. Figure 10b displays the WBI mitigation result of the range spectrum notch filtering method; it can be seen that the whole frequency band containing WBI is filtered out, leading to significant useful signal loss. Also, there remain residual interference components at both ends of WBI. On this basis, the linear prediction extrapolation method fills in the missing spectrum, decreasing useful signal loss to some extent, as shown in Figure 10c. Nevertheless, the two-step filtering process eliminates a considerable amount of signal components, resulting in the highest ISR with only a limited improvement in SDR. The obvious gap between the ISR of the linear prediction extrapolation method and the reference ISR also indicates this excessive signal filtering. Figure 10d,e exhibit the WBI mitigation results of the TF mask method and instantaneous spectrum notch filtering method, respectively. Both methods reveal decent comprehensive performance, but also leave the edges of WBI unsuppressed in TF images. As illustrated in Figure 10f, the proposed method effectively filters out the remaining WBI edges through iterative calculation, and no other signal components except interference are filtered after connected component analysis-based TF screening. The quantitative metrics of all the abovementioned methods are given in Table 3.


Figure 10.
TF representations of the WBI mitigation results: (a) the original WBI-free data for reference; (b–f) WBI mitigation results of the range spectrum notch filtering method, the linear prediction extrapolation method, the TF mask method, the instantaneous spectrum notch filtering method, and the proposed method, respectively.

Table 3.
Performance comparison of WBI mitigation for a single pulse echo.
4.1.2. Mixed Interference Type Mitigation
In practical applications, the interference scenarios faced by SAR are sometimes complex, and there may be multiple interference sources. Considering the mitigation of complex interference cases, a mixed interference scenario is set up in this section for performance comparison. Specifically, WBI and NBI are added to the SAR echo signal with a JSR of about 20 dB and 5 dB, respectively. For the purpose of exploring the influence of interference interaction on the suppression effect, the two RFI signals are arranged to be partly overlapped in the time dimension, as demonstrated in Figure 11a. The corresponding detection result shown in Figure 11b indicates that statistical detection based on kurtosis can simultaneously detect both strong and weak RFI signals, and the instantaneous kurtosis values corresponding to only weak interference are relatively more prone to fluctuation. It is worth mentioning that there is a sudden significant decline in the instantaneous kurtosis value at the endpoint of WBI (also at the end of the overlap period). Still, the instantaneous kurtosis value remains above the empirical false alarm level, which does not affect the final RFI locating result.
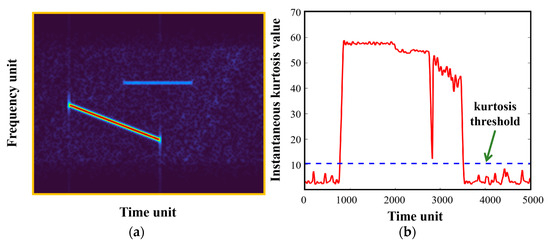
Figure 11.
RFI-corrupted pulse-echo signal and its corresponding interference detection result: (a) TF representation of the RFI-corrupted pulse-echo signal; (b) kurtosis-based statistical test result.
Figure 12 displays the mitigation results of this mixed RFI case. The original radar echo signal after the TF transform is demonstrated in Figure 12a for comparison, with a reference ISR of 16.16 dB. It can be seen from Figure 12b that the one-dimensional range spectrum notch filtering method can effectively remove both strong and weak interference, at the cost of considerable useful signal loss. As shown in Figure 12c, the remaining RFI components at the endpoints of interference signals are further mitigated via the second filtering in the linear prediction extrapolation method, and SDR is also improved compared with the former method as a result of spectrum extrapolation. As for the TF filtering method, Figure 12d shows that the TF mask method hollows out the middle part of the RFI components, leaving out bright edges of NBI and WBI. Figure 12e illustrates that the instantaneous spectrum notch filtering method is invalid when both strong and weak interferences exist in the instantaneous spectrum. Also, some isolated TF areas are falsely filtered out in this image due to the fixed filtering threshold. In contrast, with the FCME parameter setting remaining unchanged ( 100, 5, and 90%), the proposed method reveals excellent filtering performance, as displayed in Figure 12f, and the edges as well as both ends of the strong and weak RFI are greatly suppressed, without additional useful signal loss. The mitigation evaluation metrics in this mixed interference case are accordingly provided in Table 4.
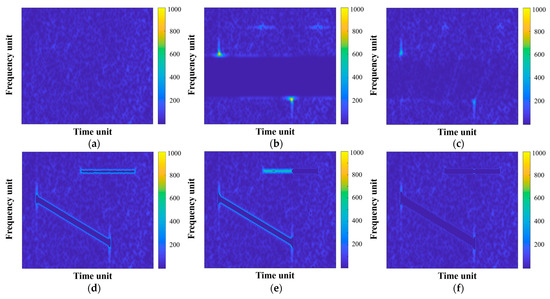
Figure 12.
TF representations of the mixed RFI mitigation results: (a) the original RFI-free data for reference; (b–f) mixed RFI mitigation results of the range spectrum notch filtering method, the linear prediction extrapolation method, the TF mask method, the instantaneous spectrum notch filtering method, and the proposed method, respectively.

Table 4.
Performance comparison of mixed interference mitigation for a single pulse echo.
4.2. Parameter Setting of FCME
In order to study the effect of parameter selection on the mitigation performance of the proposed method, a series of simulations are conducted in this section with different parameter combinations. In this experiment, WBI mitigation tests are performed with the threshold factor ranging from 2 to 7 and the initial spectrum selection ratio from 70% to 95%. Specifically, the bandwidth and temporal pulse width of the interference are set as 16 MHz and 20 µs, respectively, and JSR is approximately 20 dB. After conducting the WBI mitigation tests under the different FCME parameter settings, the resulting changing curves of ISR and SDR versus under different settings are demonstrated in Figure 13, from which some key conclusions can be drawn:
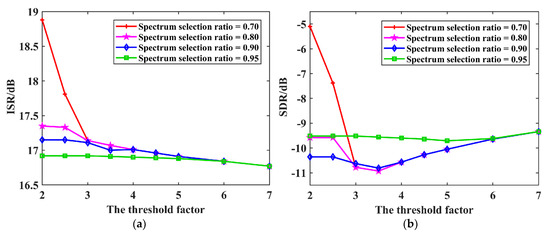
Figure 13.
Variation curves of ISR and SDR versus the threshold factor under different spectrum selection ratio settings: (a) ISR; (b) SDR.
- In the case of a fixed spectrum selection ratio , as the threshold factor gradually increases, the false alarm level decreases, and the signal components filtered via FCME become less, hence lowering the ISR;
- As a signal protection measure, a higher spectrum selection ratio means a smaller proportion of instantaneous frequency points are involved in the FCME iterative calculation. Thus, in the case of a fixed threshold factor , ISR shows a downward trend in general with the growth of the spectrum selection ratio, which is especially evident when is set below a certain level;
- With the spectrum selection ratio remaining fixed, the SDR value falls first and then rises with the increase in fixed threshold factors . This is because RFI is not fully suppressed under high conditions, and useful signal loss becomes larger under lower conditions;
- With a low threshold factor , SDR also first declines and then increases with the growth in the spectrum selection ratio . When the threshold factors are relatively high, SDR witnesses a drop at first and then remains unchanged as decreases. This shows that the interference cannot be removed completely when is too high, and there may be significant useful signal loss if is set at a lower value;
- Owing to the introduction of the subsequent connected component analysis, when the spectrum selection ratio is relatively large (higher than 0.7), ISR and SDR tend to converge with the decline in the threshold factor . Similarly, when is larger than 3, it can be seen that ISR and SDR eventually converge to certain values as decreases. Altogether, this designed TF screening process effectively inhibits the further loss of useful target signals.
In conclusion, the parameter setting should take both ISR and SDR into account to achieve decent performance. Considering the fact that RFI occupies only a fraction of frequency points in each instantaneous spectrum due to its narrowband properties, the spectrum selection ratio should be set higher than 70%. It is recommended that and take the intermediate values, at around 3.5 and 80%, respectively.
4.3. Results of the Distributed Target Echo Signal
In this section, the measured datasets of the Radarsat-1 satellite are used to further prove the validity of the proposed method. The SAR datasets were collected in C-band, with a range sampling frequency of 32.317 MHz and a pulse repetition frequency of 1257 Hz. As for the emitted radar signal, the pulse width and bandwidth are 41.75 µs and 30.116 MHz, respectively. The original RFI-free radar echoes are intentionally mixed with simulated RFI signals with varying jamming parameters so as to compare the RFI mitigation results of different methods.
For the evaluation of NBI mitigation performance, the selected imaging area is English Bay near the University of British Columbia, Vancouver, BC, Canada, and the corresponding NBI-contaminated SAR imaging result is provided in Figure 14a, with a JSR of 20 dB. It is clear that the resulting SAR image is obscured by the bright lines produced by NBI, which significantly affects the acquisition of target information. The NBI mitigation result of the range spectrum notch filtering method is shown in Figure 14b, where there are still some bright lines overlaying the image. This phenomenon results from the fact that the range spectrum notch filtering method leaves NBI residues in each NBI-polluted pulse echo. The linear prediction extrapolation method completes spectrum reconstruction after removing the remaining NBI components; thus, the bright lines as well as blurs in the imaging result are notably mitigated, as shown in Figure 14c. Figure 14d,e display the NBI processing results of the TF filtering method. It can be seen that all these three methods can effectively filter out NBI; yet, the instantaneous spectrum notch filtering method and the proposed method can inhibit the inherent SAR multiplicative noise to a greater extent in terms of imaging details. For quantitative evaluation, the pixels in the yellow dashed box are used to calculate the average energy ratio of the weak scattering area, and the pixels in the red solid box correspond to the surrounding strong scattering area. Under this setting, the MNR metrics corresponding to these SAR imaging results are listed in Table 5, which indicates better image contrast and better system image response recovery of the proposed method.
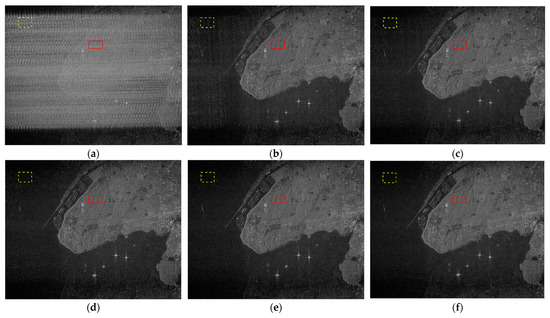
Figure 14.
SAR imaging results before and after NBI mitigation: (a) the SAR image without NBI mitigation; (b–f) the SAR imaging results after processing via the range spectrum notch filtering method, the linear prediction extrapolation method, the TF mask method, the instantaneous spectrum notch filtering method, and the proposed method, respectively.

Table 5.
SAR image quality evaluation after NBI mitigation.
As for WBI mitigation, the imaging area is selected as a ferry terminal area, where the sea acts as the dark background with weaker scattering intensity. Figure 15a exhibits the interference result of WBI. The main part of the resulting image is covered by a layer of white gauze, leading to a severe degradation in imaging quality. As shown in Figure 15b, the range spectrum notch filtering method cannot eradicate RFI, and the large signal distortion leads to a slightly blurred imaging result. This phenomenon will become more obvious with the increase in WBI bandwidth and the number of RFI-contaminated pulses. Due to the large spectrum notch width in the case of WBI suppression, the linear prediction extrapolation method cannot stably reduce the signal distortion degree after linear prediction. As a result, there are still some bright lines in the image caused by inaccurate spectral prediction, which is illustrated in Figure 15c. Technically speaking, the linear prediction extrapolation method is relatively not applicable to WBI suppression, as wideband spectrum reconstruction may bring about unstable performance. Figure 15d,e display the imaging results after applying the TF mask method, instantaneous spectrum filtering method, and the proposed method. It is noticeable that compared with processing only in the frequency domain, these TF filtering methods are more suitable for WBI mitigation and can produce clearer images. Assume that the pixels corresponding to the weak scattering area and strong scattering area are separate in the yellow dashed box and red solid box; the MNR metrics are calculated and given in Table 6, which reveals that better imaging quality can be obtained by applying the proposed method.
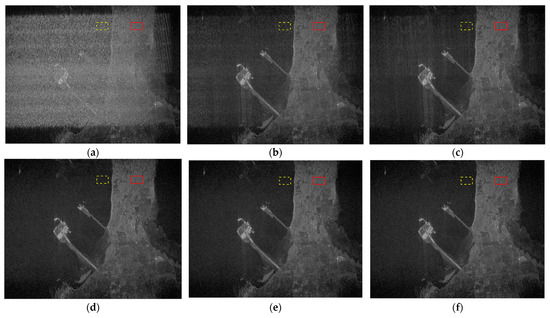
Figure 15.
SAR imaging results before and after WBI mitigation: (a) the SAR image without WBI mitigation; (b–f) the SAR imaging results after processing via the range spectrum notch filtering method, the linear prediction extrapolation method, the TF mask method, the instantaneous spectrum notch filtering method, and the proposed method, respectively.

Table 6.
SAR image quality evaluation after WBI mitigation.
In summary, according to the above experimental results, the proposed method is highly suitable for the mitigation of both NBI and WBI, which can suppress the interference signal thoroughly while keeping more useful signal components for the subsequent imaging process. Moreover, the combined application of FCME and TF screening also improves the robustness under complex interference scenarios.
5. Discussion
Due to the different TF distribution characteristics between NBI and WBI, many classic interference suppression approaches merely tend to target a certain interference signal type in the usual case. Nevertheless, NBI and WBI share the commonality of narrowband characteristics over the instantaneous spectrum, so there is no difference in the processing of NBI and WBI from the perspective of instantaneous spectrum. On this basis, a mitigation scheme for RFI is proposed in this paper based on instantaneous spectrum FCME, which can mitigate both NBI and WBI simultaneously.
The proposed method follows the order of detection and mitigation, and the initial detection process is of vital significance for it plays a role in avoiding useful signal loss and computational resources waste caused by excessive processing. As for the detection principle, the instantaneous spectra with RFI display obvious narrowband characteristics, while interference-free spectra approximately follow Gaussian distribution, with their amplitudes conforming to Rayleigh distribution. This significant statistical difference turns interference detection into a binary hypothesis test problem; thus, appropriate statistical features can be selected as judgment criteria. For a given instantaneous spectrum, the presence of RFI introduces sharp peaks (extreme values), resulting in more deviations from the Gaussian distribution. Therefore, the kurtosis feature is a clear choice in the matter of RFI detection as it serves as a measurement of data outlier degree, which also reflects spectrum sharpness as well as deviation from the Gaussian distribution according to the statistical theory. The experimental results shown in the previous section have thoroughly validated the effectiveness of the kurtosis-based statistical test and the subsequent mitigation schemes.
As for the RFI mitigation scheme, through iterative calculation, FCME can adaptively filter out interference components for each instantaneous spectrum, which allows more flexible filtering in contrast with fixed thresholds. Consequently, the proposed method manages to remove RFI components more thoroughly compared with competing methods, especially in dealing with the edge parts. Furthermore, the proposed method employs connected component analysis to screen the filtered TF areas. As a result, the RFI components remain filtered, while the TF data of the useful target signal that has been incorrectly filtered due to FCME false alarms can be recovered. This design acts as a safety measure, which reduces useful signal loss to the fullest extent while effectively suppressing RFI. For future research directions, instead of going through all instantaneous spectra in the process of interference detection, the robust localization of the RFI areas directly in TF images based on image processing means may be of research value, such that the calculation amount is further reduced.
6. Conclusions
For the purpose of suppressing RFI more thoroughly and robustly, a detection and mitigation method for RFI is proposed in this paper. By making full use of RFI’s narrowband characteristics in the instantaneous spectrum, the proposed method can be applied to the mitigation of both NBI and WBI. Specifically, a kurtosis-based statistical test is first adopted to determine the instantaneous spectra containing RFI, and the frequency points of these instantaneous spectra are then classified via FCME into an interference-free set and an interference set. In this process, the iterative calculation of FCME enables the proposed method to flexibly deal with the local details of RFI in TF images, and the effect of RFI mitigation can be achieved by zeroing the interference set. In the last step, connected component analysis is implemented to screen the filtered area in the TF domain, thereby preventing the useful signal loss caused by the false alarms of FCME.
The effectiveness of the proposed method is demonstrated on multiple datasets, where the processing results of single pulse-echo signals and distributed target echo signals are evaluated. Compared with other competing methods, the proposed method performs better in complex cases with mixed interference and can remove RFI components more thoroughly in the TF domain while retaining more useful target signals.
Author Contributions
Conceptualization, Z.W.; methodology, Z.W.; software, Z.W.; validation, Z.W. and W.Y.; formal analysis, Z.W. and J.L.; investigation, Z.W., W.Y., and J.L.; resources, Z.Y.; data curation, Y.Z. and Y.L.; writing—original draft preparation, Z.W.; writing—review and editing, Y.L.; visualization, J.L.; supervision, Y.L.; project administration, Z.Y.; funding acquisition, Z.Y. All authors have read and agreed to the published version of the manuscript.
Funding
This research was funded by National Natural Science Foundation of China (42327801).
Data Availability Statement
The data used to support the findings of this study are available from the corresponding author upon reasonable request. Due to privacy concerns, the data are not publicly available.
Acknowledgments
The authors would like to thank the relevant staff of the Aerospace Information Research Institute, Chinese Academy of Sciences, for the acquisition of airborne SAR data in this paper. Moreover, the authors would like to thank the editors and the anonymous reviewers for their valuable comments toward improving this paper.
Conflicts of Interest
The authors declare no conflicts of interest.
References
- Moreira, A.; Prats-Iraola, P.; Younis, M.; Krieger, G.; Hajnsek, I.; Papathanassiou, K.P. A tutorial on synthetic aperture radar. IEEE Geosci. Remote Sens. Mag. 2013, 1, 6–43. [Google Scholar] [CrossRef]
- Reigber, A.; Scheiber, R.; Jager, M.; Pau, P.; Hajnsek, I.; Jagdhuber, T. Very-high-resolution airborne synthetic aperture radar imaging: Signal processing and applications. Proc. IEEE 2013, 101, 759–783. [Google Scholar] [CrossRef]
- Dudczyk, J.; Kawalec, A. Optimizing the minimum cost flow algorithm for the phase unwrapping processing in SAR radar. Bull. Pol. Acad. Sci. Tech. Sci. 2014, 62, 511–516. [Google Scholar]
- Huang, Y.; Liao, G.; Xu, J.; Li, J. GMTI and parameter estimation via time-doppler chirp-varying approach for single-channel airborne SAR system. IEEE Trans. Geosci. Remote Sens. 2017, 55, 4367–4383. [Google Scholar] [CrossRef]
- Zhang, L.; Hu, M.; Wang, G.; Wang, H. Range-dependent map-drift algorithm for focusing UAV SAR imagery. IEEE Geosci. Remote Sens. Lett. 2016, 13, 1158–1162. [Google Scholar] [CrossRef]
- Chen, Z.; Zhou, Y.; Zhang, L.; Lin, C.; Tang, S. Ground moving target imaging and analysis for near-space hypersonic vehicle-borne synthetic aperture radar system with squint angle. Remote Sens. 2018, 10, 1966. [Google Scholar] [CrossRef]
- Shimada, M. L-band radio interference observed by the JERS-1 SAR and its global distribution. In Proceedings of the 2005 IEEE International Geoscience and Remote Sensing Symposium, Seoul, Republic of Korea, 25–29 July 2005; pp. 2752–2755. [Google Scholar]
- Meyer, F.; Nicoll, J.; Doulgeris, A. Characterization and extent of randomly-changing radio frequency interference in ALOS PALSAR data. In Proceedings of the 2011 IEEE International Geoscience and Remote Sensing Symposium, Vancouver, BC, Canada, 24–29 July 2011; pp. 2448–2451. [Google Scholar]
- Zhou, F.; Tao, M. Research on methods for narrow-band interference suppression in synthetic aperture radar data. IEEE J. Sel. Top. Appl. Earth Obs. Remote Sens. 2015, 8, 3476–3485. [Google Scholar] [CrossRef]
- Natsuaki, R.; Motohka, T.; Watanabe, M.; Shimada, M.; Suzuki, S. An autocorrelation-based radio frequency interference detection and removal method in azimuth-frequency domain for SAR image. IEEE J. Sel. Top. Appl. Earth Obs. Remote Sens. 2017, 10, 5736–5751. [Google Scholar] [CrossRef]
- Ulug, B. An Algorithm for Sinusoidal Interference Reduction Using Iterative Maximum Likehood Estimation Techniques. Master’s Thesis, Ohio State University, Columbus, OH, USA, 1992. [Google Scholar]
- Miller, T.; Potter, L. RFI suppression for ultra wideband radar. IEEE Trans. Aerosp. Electron. Syst. 1997, 33, 1142–1156. [Google Scholar] [CrossRef]
- Huang, X.; Liang, D. Gradual RELAX algorithm for RFI suppression. Electron. Lett. 1999, 35, 1916–1917. [Google Scholar] [CrossRef]
- Guo, Y.; Zhou, F.; Tao, M.; Sheng, M. A new method for SAR radio frequency interference mitigation based on maximum a posterior estimation. In Proceedings of the 2017 32nd General Assembly and Scientific Symposium of the International Union of Radio Science, Montreal, QC, Canada, 19–26 August 2017; pp. 1–4. [Google Scholar]
- Liu, Z.; Liao, G.; Yang, Z. Time variant RFI suppression for SAR using iterative adaptive approach. IEEE Geosci. Remote Sens. Lett. 2013, 10, 1424–1428. [Google Scholar] [CrossRef]
- Yang, Z.; Du, W.; Liu, Z. WBI suppression for SAR using iterative adaptive method. IEEE J. Sel. Top. Appl. Earth Obs. Remote Sens. 2016, 9, 1008–1014. [Google Scholar] [CrossRef]
- Djukanovic, S.; Dakovic, M.; Thayaparan, T.; Stankovic, L. Method for non-stationary jammer suppression in noise radar system. IET Signal Process. 2010, 4, 305–313. [Google Scholar] [CrossRef]
- Djukanovic, S.; Popovic, V. A parametric method for multicomponent interference suppression in noise radars. IEEE Trans. Aerosp. Electron. Syst. 2012, 48, 2730–2738. [Google Scholar] [CrossRef]
- Meyer, F.; Nicoll, J.; Doulgeris, A. Correction and characterization of radio frequency interference signatures in L-band synthetic aperture radar data. IEEE Trans. Geosci. Remote Sens. 2013, 51, 4961–4972. [Google Scholar] [CrossRef]
- Xu, W.; Xing, W.; Fang, C.; Huang, P.; Tan, W. RFI suppression based on linear prediction in synthetic aperture radar data. IEEE Geosci. Remote Sens. Lett. 2021, 18, 2127–2131. [Google Scholar] [CrossRef]
- Dakovic, M.; Thayaparan, T.; Djukanovic, S.; Stankovic, L. Time-frequency-based non-stationary interference suppression for noise radar systems. IET Radar Sonar Navig. 2008, 2, 306–314. [Google Scholar] [CrossRef]
- Tao, M.; Zhou, F.; Zhang, Z. Wideband interference mitigation in high-resolution airborne synthetic aperture radar data. IEEE Trans. Geosci. Remote Sens. 2016, 54, 74–87. [Google Scholar] [CrossRef]
- Davis, M. Frequency allocation challenges for ultra-wideband radars. IEEE Aerosp. Electron. Syst. Mag. 2013, 28, 12–18. [Google Scholar] [CrossRef]
- Le, C.; Hensley, S.; Chapin, E. Removal of radio frequency interference in wideband radars. In Proceedings of the 1998 IEEE International Geoscience and Remote Sensing Symposium, Seattle, WA, USA, 6–10 July 1998; pp. 2032–2034. [Google Scholar]
- Lord, R.; Inggs, M. Efficient RFI suppression in SAR using a LMS adaptive filter with sidelobe suppression integrated with the range-doppler algorithm. In Proceedings of the 1999 IEEE International Geoscience and Remote Sensing Symposium, Hamburg, Germany, 28 June–2 July 1999; pp. 574–576. [Google Scholar]
- Luo, X.; Ulander, L.; Askne, J.; Smith, G.; Frolind, P. RFI suppression in ultra-wideband SAR systems using LMS filters in frequency domain. Electron. Lett. 2001, 37, 241–243. [Google Scholar] [CrossRef]
- Lamont-Smith, T.; Hill, R.; Hayward, S.; Yates, G.; Blake, A. Filtering approaches for interference suppression in low-frequency SAR. IEE Proc.-Radar Sonar Navig. 2006, 153, 338–344. [Google Scholar] [CrossRef]
- Zhou, F.; Xing, M.; Bai, X.; Sun, G.; Bao, Z. Narrow-band interference suppression for SAR based on complex empirical mode decomposition. IEEE Geosci. Remote Sens. Lett. 2009, 6, 423–427. [Google Scholar] [CrossRef]
- Zhou, F.; Wu, R.; Xing, M.; Bao, Z. Eigensubspace-based filtering with application in narrow-band interference suppression for SAR. IEEE Geosci. Remote Sens. Lett. 2007, 4, 75–79. [Google Scholar] [CrossRef]
- Yu, C.; Zhang, Y.; Dong, Z.; Liang, D. SVD-based method for radio frequency interference suppression applied to SAR. Defence Sci. J. 2012, 62, 132–136. [Google Scholar][Green Version]
- Nguyen, L.; Tran, T.; Do, T. Sparse models and sparse recovery for ultra-wideband SAR applications. IEEE Trans. Aerosp. Electron. Syst. 2014, 50, 940–958. [Google Scholar] [CrossRef]
- Nguyen, L.; Tran, T. RFI-radar signal separation via simultaneous low-rank and sparse recovery. In Proceedings of the 2016 IEEE Radar Conference, Philadelphia, PA, USA, 2–6 May 2016; pp. 1–5. [Google Scholar]
- Su, J.; Tao, H.; Tao, M.; Wang, L.; Xie, J. Narrow-band interference suppression via RPCA-based signal separation in time-frequency domain. IEEE J. Sel. Top. Appl. Earth Obs. Remote Sens. 2017, 10, 5016–5025. [Google Scholar] [CrossRef]
- Huang, Y.; Liao, G.; Li, J.; Xu, J. Narrowband RFI suppression for SAR system via fast implementation of joint sparsity and low-rank property. IEEE Trans. Geosci. Remote Sens. 2018, 56, 2748–2761. [Google Scholar] [CrossRef]
- Su, J.; Tao, M.; Wang, L.; Xie, J.; Zhang, W. RPCA based time-frequency signal separation algorithm for narrow-band interference suppression. In Proceedings of the 2017 IEEE International Geoscience and Remote Sensing Symposium, Fort Worth, TX, USA, 23–28 July 2017; pp. 3086–3089. [Google Scholar]
- Lyu, Q.; Han, B.; Li, G.; Sun, W.; Pan, Z.; Hong, W.; Hu, Y. SAR interference suppression algorithm based on low-rank and sparse matrix decomposition in time-frequency domain. IEEE Geosci. Remote Sens. Lett. 2022, 19, 1–5. [Google Scholar] [CrossRef]
Disclaimer/Publisher’s Note: The statements, opinions and data contained in all publications are solely those of the individual author(s) and contributor(s) and not of MDPI and/or the editor(s). MDPI and/or the editor(s) disclaim responsibility for any injury to people or property resulting from any ideas, methods, instructions or products referred to in the content. |
© 2023 by the authors. Licensee MDPI, Basel, Switzerland. This article is an open access article distributed under the terms and conditions of the Creative Commons Attribution (CC BY) license (https://creativecommons.org/licenses/by/4.0/).