Abstract
Remote sensing image change detection (RS-CD) has made impressive progress with the help of deep learning techniques. Small object change detection (SoCD) still faces many challenges. On the one hand, when the scale of changing objects varies greatly, deep learning models with overall accuracy as the optimization goal tend to focus on large object changes and ignore small object changes to some extent. On the other hand, the RS-CD model based on deep convolutional networks needs to perform multiple spatial pooling operations on the feature map to obtain deep semantic features, which leads to the loss of small object feature-level information in the local space. Therefore, we propose a Siamese transformer change detection network with a multiscale window via an adaptive fusion strategy (SWaF-Trans). To solve the problem of ignoring small object changes, we compute self-attention in windows of different scales to model changing objects at the corresponding scales and establish semantic information links through a moving window mechanism to capture more comprehensive small object features in small-scale windows, thereby enhancing the feature representation of multiscale objects. To fuse multiscale features and alleviate the problem of small object feature information loss, we propose a channel-related fusion mechanism to model the global correlation between channels for display and adaptively adjust the fusion weights of channels to enable the network to capture more discriminative features of interest and reduce small object feature information loss. Experiments on the CDD and WHU-CD datasets show that SWaF-Trans exceeds eight advanced baseline methods, with absolute F1 scores as high as 97.10% and 93.90%, achieving maximum increases of 2% and 5.6%, respectively, compared to the baseline methods.
1. Introduction
Change detection (CD) is a fundamental task in the field of remote sensing, with the aim of extracting “semantic change regions” between multiple remote sensing images of the same area acquired at different times and generating binary maps of “changes” and “no changes” [,]. Small object change detection (SoCD) is an important topic that refers to the detection of changes occurring in small objects in a scene under certain external interference. Remote sensing image change detection (RS-CD) can be interfered with by many factors; determining the means by which to circumvent various interfering factors to accurately register small object changes has been a challenge of SoCD. As a fundamental image understanding approach, RS-CD plays an irreplaceable role in environmental and ecosystem monitoring [,], resource and land management [], natural disaster assessment [], and town planning [].
With the rapid development of remote sensing imaging technologies such as satellites and sensors, submeter high-resolution remote sensing imagery (HRRS) has become an easily accessible data resource that can provide rich spatial and surface detail information, and it can support the study of small object changes that were previously difficult to perceive based on low-resolution remote sensing imagery. However, increased resolution does not necessarily lead to better RS-CD results for the following reasons: (1) The high resolution and rich spectral features of HRRS images result in greater intraclass changes and smaller interclass changes in feature entities, which lead to less separability of similar features, especially for small objects with low pixel volume []. (2) HRRS images have a high pixel density and complex scenes, and features with small objects are often difficult to accurately understand. (3) In terms of technical difficulty, serious problems are encountered with respect to spectral information variability, limited spectral information, missing spatial and temporal information, and spatial shifts in HRRS images []. Therefore, HRRS is associated with serious challenges for SoCD; however, traditional CD methods are unreliable in the face of these problems due to their inherent defects. Therefore, determination of means by which to efficiently and accurately detect changes in HRRS has become an urgent issue.
In recent years, convolutional neural networks (CNNs) [] have spawned a number of excellent RS-CD algorithms [,,,,,]. The CNN-based RS-CD method encodes a dual-temporal image as a multilevel feature map. The change map can be obtained by fusing dual-temporal features in different ways and then decoding them. However, deep convolutional networks have to perform spatial pooling operations on the feature maps, which leads to the loss of a large amount of feature-level information for small objects; the deeper feature maps are, the less accessible small object information is. Moreover, when the scales of change samples vary greatly, the change samples of small objects are much smaller than those of large objects, and a neural network with overall accuracy as the optimization goal focuses too much on large object changes and ignores small object changes, so the scale imbalance in the change samples and the loss of small object features jointly increase the difficulty of SoCD. In addition, most small-scale objects have an aggregation effect, so neighboring small objects are reflected in the feature map as indistinguishable “point clusters” after multiple downsamplings. All the abovementioned problems hinder models from accurately obtaining contextual information about small objects, while there are many works that use atrous convolution [], dual attention mechanisms [,,] and multilevel feature layers [,,] to increase the receiving field of the models to better access the spatiotemporal context of interesting changes. However, theses approaches cannot address the hazards of scale differences in changes for feature extraction, and repeated use of spatial pooling operations also causes the loss of small object features, which hinders the identification of interesting changes to some extent. Some researchers have attempted to obtain multiscale features of changing objects through image pyramid [] and feature pyramid structures [,,], whereby the network captures localization information of small objects in shallow feature maps and large objects in deep feature maps; however, the semanticity of shallow features is low and contains considerable pepper noise, which contributes some interference to the recognition of small object changes after feature fusion. Some other researchers established tight information transmission between the encoder and decoder and between the decoder and decoder to capture more information about the deep localization of the neural network [], thereby enhancing the network’s ability to determine small object changes and edge pixels; however, they did not consider another difficult aspect of SoCD, namely the scale imbalance in the change samples. In summary, SoCD still faces a serious problem.
In order to solve the abovementioned problems, the design of convolutional networks must be deep and complex; however, their long-range spatiotemporal information correlation capability is still insufficient. Therefore, research [,,] has been proposed to design variant networks of transformers to model long-range contextual and spatiotemporal relationships and enhance the semantic concepts related to changes. Inspired by the use of a Swin transformer [,,] for image classification tasks, window design not only reduces computational effort; we also intuit that strong global information correlation capability and reasonable window design can facilitate the refinement of small object feature information. Therefore, we propose a Siamese transformer change detection network with a multiscale window via an adaptive fusion strategy (SWaF-Trans) for optimization of SoCD, the basic strategy of which involves computing self-attention [] inside a multiscale window to model changing objects at different scales, using a small-scale window to capture more comprehensive and detailed features, avoiding the loss of small object features. In addition, to fuse features of interest and retain more information about small objects, we use a channel-related fusion mechanism to adaptively fuse representative multiscale features on different channels, allowing the network to learn a more comprehensive form of changes representation.
The main contributions of this paper are as follows. (1) We propose a Siamese transformer change detection network with a multiscale window via an adaptive fusion strategy. The network computes self-attention inside multiscale shifted windows to model the spatiotemporal context of multiscale changes, allowing the network to capture a more comprehensive view of small object changes and changes of interest. (2) We propose a channel-related fusion mechanism that explicitly models the global dependencies between channels, adaptively fuses interesting multiscale features, and suppresses various sources of pepper noise. The method adaptively adjusts the fusion weights to obtain more discriminative detail information in order to improve the network’s ability to learn and characterize small object changes. (3) SWaF-Trans achieved a SOTA effect on both the CDD [] and WHU-CD [] datasets, with absolute F1 scores as high as 97.10% and 93.90% and maximum increases of 2% and 5.6%, respectively, compared to the baseline method.
2. Materials and Methods
2.1. Related Works
2.1.1. RS-CD Method Based on a Deep Convolutional Network
Deep learning techniques have become a mainstream approach for RS-CD tasks, with surprising results due to their powerful characterization capabilities. Among them, the fully convolutional neural network (FCN) [] is undoubtedly one of the most successful DL networks, and a large number of CD networks [,,,] with FCN structures have been proposed successively. For example, Daudt et al. [] designed a fully convolutional early fusion network (FC-EF), a fully convolutional Siam concatenation network (FC-Siam-conc), and a fully convolutional Siamese difference network (FC-Siam-diff) to discuss the effects of image input methods, as well as two-branch connection methods to evaluate the performance of CD networks. Zhan et al. [] were the first to introduce the use of Siamese convolutional networks (DSCNs) in CD tasks. DSCNs are effective for CD tasks due to their convenience in comparing the similarity of two samples and the advantage of shared weights. Liu et al. [] designed a symmetric deep convolutional network (SCCN) to solve the problem of heterogeneous image change detection between optical and radar images, which transforms different classes of images into the same feature space by convolutional and coupling layers and generates a change map via a thresholding algorithm. Guo et al. [] proposed an FCN-based change metric network to measure changes by learning the implicit distance between image features. Wang et al. [] proposed an FCN-based Siamese network, which encourages a reduction in intraclass variance an increase in interclass variance so that change maps can be obtained by simple threshold partitioning.
Due to the complexity of scenes in remote sensing imagery, modeling global contextual relationships is crucial for identifying changes of interest [,]; however, deep convolutional networks are limited by the range of perceptual fields to link long-range semantic concepts in space time. CNN-based CD networks have introduced improvements in two main areas to enhance the global modeling capability of the network: optimizing the network structure and adding attention mechanisms []. In terms of optimizing the network structure, many networks are designed with multiscale structures to increase the receptive field of the network. For example, Jiang et al. [] used multiple attention to fuse low-level and coattention-level features to establish long-range semantic information connections. Chen et al. [] introduced a self-attention mechanism within each subregion to adapt to multiscale changes by obtaining multiscale spatiotemporal dependencies. Liu et al. [] proposed a local–global pyramid network whereby local feature pyramids and global spatial pyramids work in parallel or in a complementary manner to obtain information about changes in buildings at multiple scales. In terms of adding attention mechanisms [,], Chen et al. [] introduced spatial attention and channel attention mechanisms to model long-range semantic information correlation, allowing the model to obtain more reliable discriminative information and thereby become resistant to the interference of pseudo changes. Shi et al. [] designed a deep supervised module using a dual-attention mechanism to better exploit the interdependence between spatial and channel information to obtain more discriminative change features. Wang et al. [] proposed a deep supervised network based on an attention mechanism to extract multilevel features of dual-temporal images in the coding stage and combined spatial and channel adaptive attention mechanisms to enhance the feature representation of multiscale changes; the change maps were reconstructed by fusing different levels of feature maps into the prediction results of different branches of the deeply supervised network according to the weight magnitude in the decoding stage.
Although the abovementioned approaches have improved the performance of the network, few works have focused on SoCD. Although DASNet [], FCL [], and STANet [] apply weighted double-margin contrastive loss, focal contrastive loss, and batch-balanced contrastive loss in an attempt to solve the problem of sample imbalance, they only address the problem of imbalance between changed and unchanged samples and do not consider the imbalance caused by scale differences in the changed samples. In addition, SNUNet-CD [] focuses on the problem of small object feature loss with the targeted design of tight information transmission in an attempt to reduce the loss of deep localization information, but it similarly fails to pay attention to the negative impact of large object changes overwhelming the network.
2.1.2. Transformer-Based RS-CD Method
Recently, transformers have shown great potential in the fields of semantic segmentation [,], object detection [,], scene classification [,], and image generation []. Moreover, a large body of work has explored the in-depth performance of transformers in RS-CD. These works fall into two main categories: networks based on a combination of transformers and CNNs and networks based on pure transformers. The former is associated with a large amount of representative work, such as that by Hao et al. [], who first introduced a transformer into CD networks to enhance the feature representation of ConvNet by modeling spatiotemporal contextual information through compact semantic tokens, which helps the network to identify changes of interest and exclude irrelevant changes. Li et al. [] first combined the advantages of transformers and U-Net in RS-CD and designed a hybrid network to learn local–global features, which solved the problems of information redundancy and difficulties in exchanging information in multilevel feature layers. Wang et al. [] designed a scene change detection network based on ViT, which makes the network more robust to noise and pseudo changes by virtue of the transformer’s powerful global context modeling capability.
However, Bandara et al. [] found that reliance on ConvNet for the CD task is not essential and that transformer networks with lightweight multilayer perceptions can perform RS-CD equally well. As a result, a large number of pure transformer-based CD networks have been proposed successively. For example, Zhang et al. [] designed a double-U-type RS-CD network based on the Swin transformer block, which both reduces the computational complexity of the model and improves the CD performance. To obtain regular change boundaries and complete change regions, Yan et al. [] used pyramidal structures to fuse multiscale features obtained by transformer blocks in an attempt to capture interesting changes with higher confidence. Ailimujiang et al. [] proposed a multiscale differential enhancement network based on a pure transformer that solves the problems of semantic object information loss and incomplete change regions.
Most of the methods referenced above enhance feature representation in the spatiotemporal context through the use of various structures and by exploiting the superior modeling capability of the transformer. However, they do not demonstrate whether enhancing the feature representation information is beneficial for SoCD because the feature information of small object changes is not easily captured due to the negative impact of large object changes.
2.2. Model Overview
The overall framework of SWaF-Trans is based on a Siamese network [], which can process dual-temporal images in parallel and encode and decode the feature vectors in the same spatial dimension, which helps to maintain the similarity of dual-temporal images []. As shown in Figure 1, the overall framework adopts an end-to-end architecture that consists of four main components: a CNN backbone, a window-based transformer, a channel-related fusion mechanism, and a decoder.
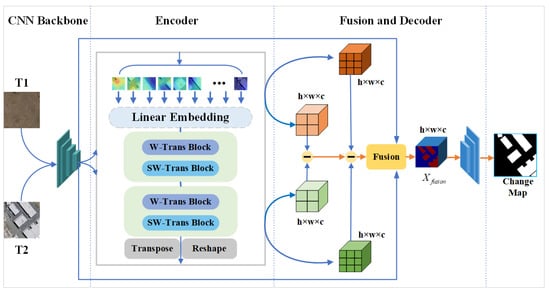
Figure 1.
Overview of the SWaF-Trans network: CNN backbone for feature projection, transformer encoder for encoding of contextual information, channel-related fusion mechanism for integration of interesting features, and decoder for generation of pixel-level change predictions.
The input to SWaF-Trans is the dual-temporal images (T1 and T2), and the output is a change map. The network starts with a set of consecutive convolutional layers, the purpose of which is to map the original image to a high-level feature space to facilitate the subsequent generation of embedded semantic tokens. The model then goes through a window-based transformer structure, the head of which uses patch partitioning and linear embedding [] to convert the dual-temporal features into rich semantic tokens, which are subsequently fed into a continuous transformer block for feature encoding. Then, the encoded features go through transposition and reshaping to obtain dual-temporal features at different scales. At this point, all the same-scale bitemporal features are sent to the channel-related fusion module after differential mapping to obtain more representative change information and generate the final feature map. Finally, the network only uses a light FCN to decode the feature map to obtain the pixel-level change map.
2.3. Window-Based Transformer
2.3.1. Patch Embedding
Similar to the standard ViT [] approach, the window-based transformer is set with a patch partition module and a linear embedding module before the transformer block. As shown in Figure 2, the former is responsible for converting bitemporal images into several image tokens (). If the CNN backbone is chosen to acquire the original image features, it converts the feature mapping () into rich semantic tokens. The latter is responsible for mapping image tokens from 3D data to specific 1D data to obtain , which is then fed into the transformer block to generate context-rich semantic tokens and reduced to change feature maps by transposition and reshaping. is the size of the patch, is the number of patches, denotes the dimensions of the feature map, D represents the specific dimensions, and 3 represents the three channels of the optical image.
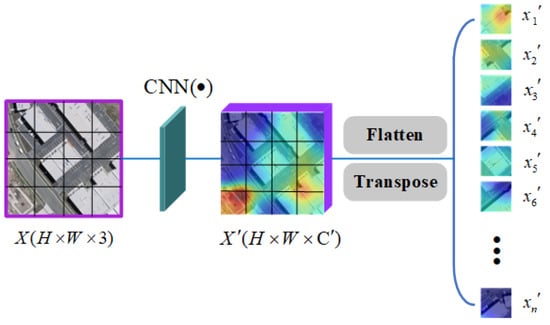
Figure 2.
Illustration of the patch embedding. The CNN backbone is optional. If it is not selected, the dual-time image is taken directly as input and transformed into semantic tokens by the flatten operation and the transpose operation. Then, a learnable position embedding is added to the semantic tokens to retain positional information.
In the experiment, if the image size is 512 × 512, the total number of patches is 32 × 32; for example, the resolution of each patch is 16 × 16, and the number of channels is 3. According to the above description, the initial dimension size of patches is 16 × 16 × 3, the 3D data are flattened to obtain one-dimensional data comprising 768 samples, and finally, the linear embedding module is mapped to a specific dimension (D). At this time, the feature of each spatial point in the graph can be called a token with dimensions of .
2.3.2. Window-Based Transformer Block
To obtain different scale features, we designed a transformer block based on a multiscale moving window []. As shown in Figure 3, the transformer block contains a W-Trans block (I) and a SW-Trans block (II), which are connected to each other to increase the perceptual field of the network. In both submodules, we replace the standard multihead self-attention module (MSA) in ViT with a window-based multihead self-attention module (W-MSA) and a moving window-based multihead self-attention module (SW-MSA), the details of which are presented below.
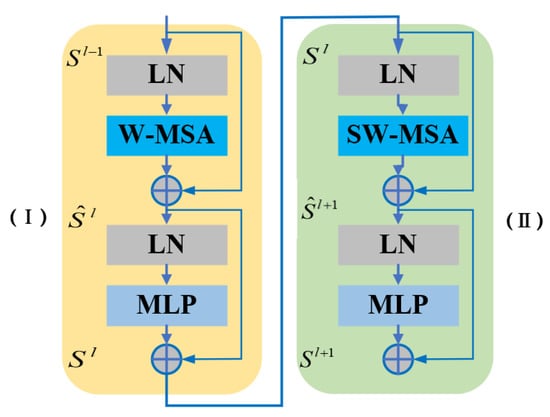
Figure 3.
Structure of the transformer block. (I) and (II) are the W-Trans block and the SW-Trans block, respectively.
- (a)
- W-Trans block: As shown in Figure 3I, the W-Trans block contains W-MSA, the layer norm (LN), the multilayer perceptron (MLP), and residual connections. To extract the multiscale features of interesting changes, the module calculates the self-attention inside the multiscale window, which is calculated in the same way as MSA []. In addition, W-MSA greatly reduces computational consumption because standard MSA calculates self-attention by computing global self-attention among all image tokens, which causes secondary computational complexity in the number of tokens []. On the contrary, W-MSA computes self-attention inside a local window, and its computational complexity is linear with respect to the input, so W-MSA is more suitable for intensive prediction tasks or tasks oriented toward high-resolution remote sensing images.
- (b)
- SW-Trans block: The lack of information interaction across windows is the most fatal problem of the W-Trans block because it severely restricts the feature modeling capability of the model. For this reason, we introduced the moving window mechanism proposed by Liu et al. [] to design the SW-Trans block, as shown in Figure 3II, the structure of which is similar to that of the W-Trans block, except that in the W-Trans block, W-MSA can be replaced by SW-MSA. The SW-Trans block divides the complete window at the distance (N/2, N/2) from the image vertex and solves the self-attention calculation problem of multiple nonstandard windows using a cyclic shift mechanism, where (N, N) represents the window size. In conclusion, the mathematical expression of the window-based transformer block is:where and represent the output of the W-Trans block and the SW-Trans block, respectively.
- (c)
- Self-attention in the local window: Both W-MSA and SW-MSA use the same method as MSA to compute multihead self-attention; the former computes multihead self-attention inside a local window, and the latter computes multihead self-attention on a global scale. The mathematical expressions of self-attention is as follows.where represents the self-attention input; , and represent the learnable parameters of the three projection matrices, respectively; denote the query, key, and value matrices, respectively; indicates the number of patches in a window; d indicates the dimension of the query or key; and B is the bias matrix.
2.3.3. Multiscale Window Design
The design of the multiscale window is inspired by a pyramid structure []. However, the feature pyramid structure obtains multiscale features by continuous downsampling, which leads to the problem of losing features for small objects [,]. In addition, the network obtains feature information of small objects by virtue of the shallow feature layer of the pyramid [], but the semantic complexity of the shallow features is low, with a large amount of pepper noise, which can seriously hinder SoCD. For this reason, we considered designing multiscale windows to obtain multiscale features and propose a transformer model based on multiscale windows to model feature objects at corresponding scales by computing self-attention inside different scale windows. As shown in Figure 4, the window division strategy enables uniform full coverage, so the image size is an integer multiple of the window size; the window size is an integer multiple of the patch size, generally set to 1/2, 1/4, 1/8, or 1/16 of the image size as appropriate; and the window moving distance is generally half of the window size. If the input image is 256 × 256, it can be divided into 16 × 16 patches with 16 × 16 resolution, and the window size can be 8 × 8, 4 × 4 and 2 × 2, which means that each window includes 8 × 8, 4 × 4, and 2 × 2 patches and that the moving distances of the corresponding windows are 4, 2, and 1, patches respectively.
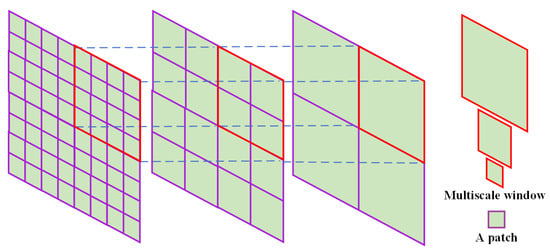
Figure 4.
Multiscale window schematic. This figure shows the relationship between the size of the multiscale window and patch and the way the window is distributed.
2.4. Channel-Related Fusion Mechanism
Linear aggregation usually consists of matrix addition [,], multiplication, and concatenation []. Extensive work [,] has shown that linear aggregation usually retains redundant information and irrelevant features, which interfere with the process of identifying small object changes. Linear aggregation is not applicable to the RS-CD task because the method does not highlight the features that are of interest to RS-CD. Conversely, encoding the correlation between channels can significantly improve the network’s ability to capture features of interest [], thereby allowing it to obtain more discriminative information about small object features. To emphasize the more important and representative channels in the feature layer, discover features of interest, and suppress noise and irrelevant information, we propose a channel-related fusion mechanism that adaptively adjusts the fusion weights to focus on features of interest by showing the superintendency in the modeled channel space, thereby reducing the interference of pepper noise on small object feature recognition. The specific structure of the module is shown in Figure 5. The model acquires the two information-rich temporal features ( and ) of the i-th scale after the encoder module, then calculates the difference mapping between multiple scale features to obtain the change information of the i-th scale (). The change information at different scales is then stitched together in the channel dimension to obtain . Then, the feature information is integrated using a 1 × 1 convolutional block to obtain the change features, which can be expressed as:
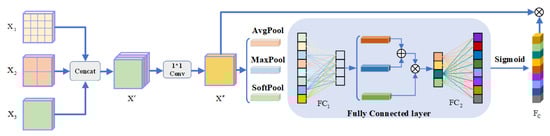
Figure 5.
Structure of the channel-related fusion mechanism. , and represent the feature maps of multiscale windows; represents feature fusion weights, and FC represents the fully connected layer.
On the other hand, each channel of the feature map can be considered a feature detection point, so the channel dependency is focused on the more “meaningful parts” of the image []. We consider three pooling strategies to obtain the dependency information () of the channel. We calculate the channel dependencies by obtaining the global statistics of the feature map. First, we use the average pooling layer and the maximum pooling layer to calculate the channel statistics of the feature map and input them into the fully connected layer (). Then, we add the two features to obtain . In addition, we introduce a SoftPool to calculate the global weights and input them into the fully connected layer () to obtain . The above process can be expressed by the following equation.
where represents the ReLU function, and represents the fully connected layer with a half-size reduction. Immediately after this process, we perform the element-level multiplication of and to optimize the feature description of each channel, followed by a fully connected layer () to reduce the channel dimensions to obtain channel-related information (). Finally, we matrix multiply the feature map () and the channel-related information () to obtain the refined feature map (. This process is represented as follows.
where represents the sigmoid function, is a fully connected layer with doubled size, and ⊗ represents matrix multiplication.
2.5. Decoder
Due to the rich semantic features obtained from the transformer structure, we can use a lightweight FCN decoder to map the high-level features of the semantic information back to the pixel space, thereby obtaining the change map (). The process can be expressed in the following form.
where denotes the binary change classifier, and denotes the sigmoid function. The setup of the binary change classifier contains a 3 × 3 convolutional layer with a batch norm and two 4 × 4 deconvolutional layers with batch norms. The number of output channels of the convolutional layer is double that of the previous layer, and the number of output channels of the deconvolution layer is half that of the previous layer. Finally the confidence values of the change features are mapped to the [0, 1] interval using a sigmoid function.
3. Results
To evaluate the performance of SWaF-Trans, we conducted experiments on two public datasets–CDD and WHU-CD–and compared them with the latest RS-CD method. In addition, we designed ablation experiments and effectiveness experiments and carefully reviewed the results.
3.1. Datasets
3.1.1. CDD
The CDD dataset contains 11 pairs of multisource remote sensing images collected during different seasons, including 7 pairs with an image size of 7425 × 2202 pixels and 4 pairs with an image size of 1900 × 1000 pixels and resolutions ranging from 0.3 m to 1 m. Seasonal changes in this dataset make it difficult to accurately detect the changes occurring in buildings, roads, farmland, and cars.
3.1.2. WHU-CD
The publicly available building change detection dataset from Wuhan University contains aerial images with a spatial resolution of 0.75 m; each image has dimensions of 32,507 × 15,354 pixels and covers an area of 20.5 km2. The dataset documents the urban reconstruction of Christchurch after the 2012 and 2016 earthquakes.
3.2. Metrics
3.2.1. Evaluation Criteria
To evaluate the performance of the RS-CD model, five evaluation metrics were chosen: precision (P), recall (R), F1 score (F1), intersection and union ratio (IoU), and overall accuracy (OA). In the RS-CD task, a higher precision indicates more correct detections, higher recall indicates fewer missing predictions, a high F1 score and IoU indicate superior CD performance of the model, and OA is the overall evaluation metric for prediction results. They are calculated as follows:
3.2.2. Implementation Details
- (a)
- Parameter: We use the Adam optimizer for algorithm optimization with an epoch of 150, a learning rate of 5 × 10⁻⁴, a weight decay of 5 × 10⁻⁴, a step size of 50, and momentum of 0.9. PyTorch is used as the deep learning framework, and the graphics card is an NVIDIA RTX A6000.
- (b)
- Data segmentation and data enhancement: We crop the original images of the CDD dataset into small blocks of 256 × 256 pixels and randomly perform simple data enhancement operations such as rotation, folding, and center cropping to obtain a training set, a validation set, and a test set of 10,000, 3000, and 3000 images, respectively. We cropped the original images of the WHU-CD dataset into 512 × 512 pixel blocks without overlap; randomly performed data enhancement operations, such as rotation, folding, and center cropping; and randomly divided them into a training set, validation set and, test set at a ratio of 7:1:2.
3.3. Experimental Results on the Dataset
3.3.1. Comparison with Other Methods
We selected eight representative baseline methods for comparison with our method, including three traditional RS-CD methods based on pure convolutional networks, i.e., the fully convolutional early fusion network(FC-EF), fully convolutional Siamese difference network(FC-Siam-Di), and fully convolutional-Siamese concatenation network (FC-Siam-Conc); one spatial-channel attention-based CD method, i.e., the dual-attentive fully convolutional Siamese network (DASNet); a CD method based on a deep feature fusion deeply supervised image fusion network (IFNet); and three transformer-based CD methods, i.e., the bitemporal image transformer (BiT), the pure transformer network (SwinSUNet), and the end-to-end encoding—decoding hybrid transformer network (TransUNetCD).
- (a)
- FC-EF []: The FC-EF is a U-shaped structured network that stitches dual-temporal images into a single image that is input into the FCN.
- (b)
- FC-Siam-Di []: FC-Siam-Di is a Siamese network with a double U-shaped structure; the dual time-phase features generate the change information by absolute difference operations.
- (c)
- FC-Siam-Conc []: FC-Siam-Conc uses a Siamese FCN to extract multilevel change features, establishes skip connection layers to share the same-level feature information, and finally, generates change maps by multidecoding layers.
- (d)
- DASNet []: DASNet uses VGG16 or ResNet50 as the backbone network to extract features, introduces spatial attention and channel attention modules to enhance the resistance of the network to pseudo changes, and finally, uses the distance metric module to generate change maps.
- (e)
- IFNet []: IFNet is an end-to-end multiscale feature fusion network that first extracts deep features of representative dual-temporal images through an FCN-based Siamese structure, then feeds them into a deep supervised discriminative network, which combines channel attention and spatial attention.
- (f)
- BiT []: BiT is a network that combines a CNN and a transformer to express a dual-temporal image as a number of image tokens, encodes the global contextual relationships in space time using the transformer, then maps the tokens containing rich change information back to the pixel space, and refines the original features using the transformer decoder.
- (g)
- SwinSUNet []: SwinSUNet is a Siamese pure transformer change detection network with a double U-shaped structure. It uses a Swin transformer block as an encoder to obtain dual temporal phase features, then uses a Swin transformer block combined with a skip connection to decode the change map after feature fusion.
- (h)
- TransUNetCD []: This is an end-to-end network that combines the advantages of UNet and transformers. First, the tokenized image patches in the feature map of the convolutional network are encoded to obtain rich global contextual information, based on which the differential enhancement module is introduced to generate a differential feature map containing rich change information to achieve precise object localization.
3.3.2. Experimental Results on the CDD Dataset
- (a)
- Table 1 shows the experimental results of various methods on the CDD test set. The results show that SWaF-Trans consistently outperforms the other methods and has obvious advantages; four of its accuracy indices significantly outperform those of the other methods, and the F1 score is as high as 97.1%, which is higher than that of the traditional BiT method by 2%.
 Table 1. Comparison results on the CDD test set.
 - (b)
- Figure 6 shows the change map and confusion matrix of SWaF-Trans inference; rows 1 and 2 correspond to changes in cars, roads, and houses, and rows 3 and 4 correspond to changes in farmland and houses, respectively. As shown in the figure, the changes in SWaF-Trans inference have accurate details, with complete changes in cars detected in the box in row 2 and detailed changes in small buildings detected in the box in row 4. This shows that our method can accurately detect changes of interest; can perceive small object changes in seasonal interference with few misses and false detections; and is not easily affected by light, color, and weather.
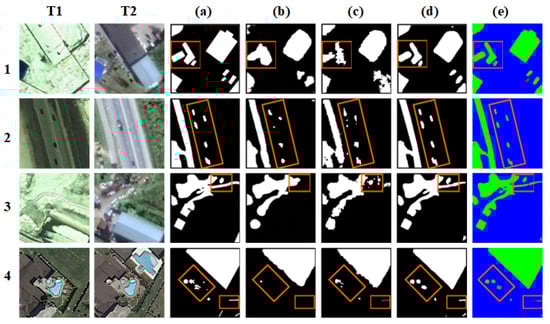 Figure 6. Visualization results of several CD methods on the CDD test set. (a) GT, (b) BiT, (c) SwinSUNet, (d) ours, (e) confusion matrix. Green, red, purple, and blue denote TP, TN, FP, and FN, respectively).
 - (c)
- For large object changes, SWaF-Trans can ensure the compactness and boundary integrity inside the changes, and for small object changes, it can ensure the accuracy of the location and the reasonableness of the morphology. When the scale difference of change samples is large, our method can obtain the feature information of small objects and model the contextual relationships, avoiding the negative effects of large object changes overwhelming the network. As shown in row 4 of Figure 6, only the small object change region inferred by SWaF-Trans conforms to the real situation, which shows that our method is more resistant to the variable scale of change samples. However, other methods do not detect small object changes, such as changes in cars and small buildings, and even large objects such as houses and farmland have “jagged” change edges, which does not correspond to the real situation. On the contrary, the change boundary of our method is softer and more rounded, and the change features are aggregated in high-dimensional space, which indicates that SWaF-Trans learns a clear semantic boundary between change and non-change; therefore, the inferred changes are more consistent with the real situation.
3.3.3. Experimental Results on the WHU-CD Dataset
- (a)
- As shown in Table 2, SWaF-Trans outperformed the other methods on the WHU-CD test set, with three indicators achieving the best results, including an absolute F1 score of 93.9%, which is 0.4% higher than that of the SOTA method TransUNetCD.
Table 2. Comparison results on the WHU-CD test set.
- (b)
- To visualize the results, we generated change maps and confusion matrix maps for the test set. As shown in Figure 7, SWaF-Trans predicts more accurate change boundaries and more compact change interiors, with higher confidence in the change map patches. The box in row 1 shows that our method detects small building changes that are omitted from labeling in the ground truth, which indicates that our network learns the representational form of small object changes and is not influenced by mislabeling. In addition, similar to the case of the CDD dataset, the boundaries of the change regions are rounded and not broken, which implies a strong feature aggregation of the buildings. In contrast, the results of other methods show that the edges of the change region are not clear, the interior is not compact, and the details are not comprehensive, and there are even cases in which the confidence level of the change region is too low to be detected.
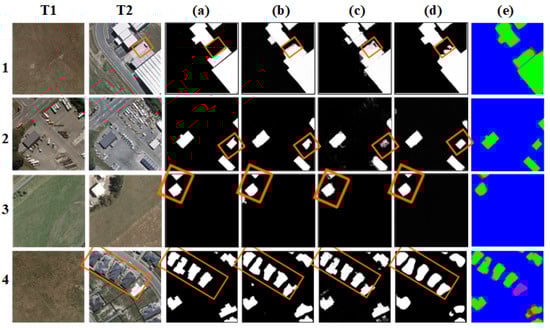 Figure 7. Visualization results of several CD methods on the WHU-CD test set. (a) GT, (b) BiT, (c) SwinSUNet, (d) ours, (e) confusion matrix. Green, red, purple, and blue denote TP, TN, FP, and FN, respectively).
 - (c)
- The WHU-CD dataset focuses on the detection of changes in buildings, so changes occurring in other features can be considered irrelevant. Rows 1 and 3 show that SWaF-Trans performs well in excluding irrelevant changes, and it is strongly resistant to changes occurring in roads and trees.
- (d)
- It is worth mentioning that SWaF-Trans does not require pretraining on large datasets, alleviating the transformer model’s over-reliance on data volume. In addition, our method in detecting interesting changes using only a simple network, which is attributed to the ability of SWaF-Trans to model the spatiotemporal contextual relationships of multiscale changes and to enhance the representational form of multiscale features.
3.3.4. Learning Curve Comparison
To evaluate the performance of SWaF-Trans, we visualized the F1 score line graph of the validation set and compared it with that of BiT. Figure 8I,II show the F1 score fold plots on the CDD and WHU-CD validation sets, respectively. According to the fold trend, our model has better training accuracy and a faster convergence speed compared with BiT, and the training process is more stable, with few large accuracy fluctuations, indicating that the SWaF-Trans model is more robust and stable. In contrast, BiT exhibits large accuracy fluctuations at multiple time periods with increasing epochs and is less robust, which is likely to lead to overfitting. In summary, the transformer model based on multiscale windows has powerful learning and migration capabilities for RS-CD.
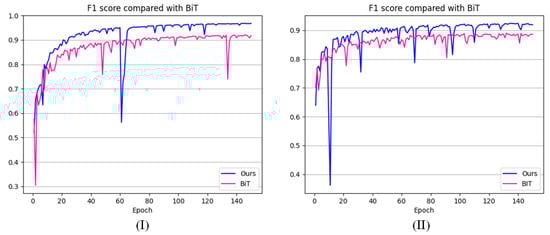
Figure 8.
F1 score comparison of SWaF-Trans and BiT on (I) the CDD validation set and (II) the WHU-CD validation set.
4. Discussion
4.1. Ablation Study
4.1.1. Comparison of the Multiscale Fusion Window Effect
To verify that multiscale window feature fusion does have a positive effect on the RS-CD task, we compared the experimental results of multiscale window combinations with those of single-scale windows. The data in Table 3 show that multiscale window feature fusion does benefit RS-CD; the best results were achieved for the [8, 2] window combination on the CDD dataset, with an F1 score of 97.10%, which is 0.3% higher than that of the [8, 4] window combinations. The phenomenon is more pronounced on the WHU-CD dataset, where the [16, 4] window combination achieves a 0.9% higher F1 score than the [16, 8] window combination. On the other hand, the vast majority of feature fusion methods outperform non-fusion methods on both the CDD and WHU-CD datasets, suggesting that multiscale window feature fusion is, indeed, highly beneficial for the RS-CD task, which is explained by the fact that the network models the contextual relationships of multiscale change objects inside the multiscale window to obtain a more comprehensive multiscale feature. To further explore whether this effectiveness is because SWaF-Trans is more applicable to SoCD, we performed an effectiveness analysis in subsection F.
Table 3.
Comparison results on the CDD and WHU-CD test sets.
4.1.2. Comparison of Different Fusion Methods
A large amount of CV work has demonstrated that linear fusion of multilevel features cannot be used to perform a specific vision task well because the interesting features contained in different channels often vary greatly, and linear fusion always maintains all features in the fused features, but not all feature information can be used to improve the RS-CD task. Linear fusion does not consider the degree of importance of features to the task but treats each feature element equally, which is detrimental to the discovery of interesting features. However, the channel-related fusion mechanism can focus on an interesting object, reduce the loss of interesting features, and retain more comprehensive information about small objects. To verify the effectiveness of the channel-related fusion mechanism, we compared it with linear fusion for experiments; the accuracy results are shown in Table 3, where NDF denotes linear fusion, and CRF denotes channel-related fusion. A comparison of the data in the table shows that almost all CRF methods outperform NDF on the CDD test set, and similar results are obtained on WHU-CD, so the channel-related fusion mechanism can, indeed, optimize the fusion process of interesting features, reduce the loss of small object features, and enable the model to capture more discriminative change information.
4.2. Parameter Verification Experiment
There are many important parameters and functions in our network, and to explore their effectiveness for RS-CD, we performed parameter validation experiments on two datasets.
4.2.1. Effect of the Patch Number
To explore the effect of the number of patches on model performance, we set up 16 × 16, 32 × 32, and 64 × 64 patches for comparison experiments. Table 4 shows that the 64 × 64 patch has the best RS-CD effect, and its accuracy is substantially higher than that of the other two patch numbers. The experiment shows that as the number of patches increases, the model is increasingly capable of sensing changes because the transformer model encodes more complex dependencies for longer input sequences to obtain richer image features, and the more forms of change representations are learned, the more beneficial it is to identify changes of interest. However, we find that the training efficiency decreases severely as the number of patches increases because the transformer encodes complex global relationships that consume more computational resources. To balance computational efficiency and accuracy, setting the patch number to 32 × 32 was found to be optimal in the experiments.
Table 4.
Comparison results with different parameters.
4.2.2. Effect of the Number of Block Layers
We used one, two, three, and four layers of transformer blocks to explore the most suitable number of encoder layers. As shown in Table 4, the model achieves the best RS-CD results on both datasets when the number of layers is two. This shows that the number of encoder layers is not as large as possible, as deeper layers result in more parameters and the need for more computation, and deeper networks may also cause overfitting problems, which hinders the robustness and stability of the model. To balance the computational efficiency and accuracy, we recommended the use of a two-layer transformer block.
4.3. Analysis of Effectiveness
4.3.1. Effectiveness Experiment
- (a)
- On a 512 × 512 pixel image, a small object is an entity smaller than 32 × 32 pixels, and a large object is an entity larger than 96 × 96 pixels. To more intuitively reflect the effectiveness of SWaF-Trans in detecting small object changes when the change sample scales differ greatly, we designed validity probing experiments. Specifically, we selected the images in the CDD test set with large differences in change scales and aggregated them into Test Set 1, then selected the images in the test set containing only small object changes and aggregated them into Test Set 2 and use multiple networks to predict the change maps of CDD, Test1, and Test2.
- (b)
- Figure 9 and Table 5 show the predicted changes and the accuracy statistics, respectively. As shown in Figure 9, SWaF-Trans accurately detects the shape and location of the car changes in the box, while BiT produces more misses and false detections. Comparison of the Test2 and CDD results shows that the accuracy of the model inference changes decreases as the large objects in CDD are eliminated to obtain Test2, but the F1 score of our method only decreases by 4.63%, while those of BiT and SwinSUNet decrease by 17.54% and 16.67%, respectively, which indicates that SWaF-Trans is much better at detecting small object changes than BiT and SwinSUNet.
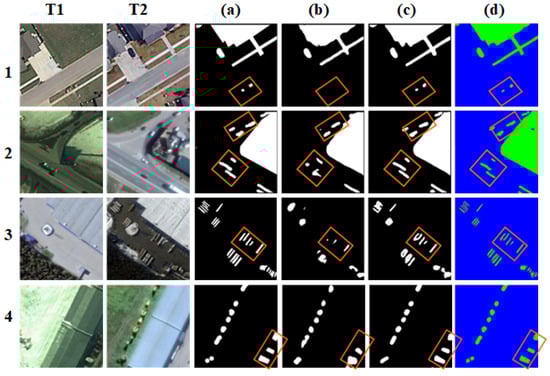 Figure 9. Visualization results of several CD methods on Test1 and Test2. (a) GT, (b) BiT, (c) ours, (d) confusion matrix. Green, red, purple, and blue denote TP, TN, FP, and FN, respectively).
Table 5. Comparison results on Test1, Test2, and the CDD test set.
Figure 9. Visualization results of several CD methods on Test1 and Test2. (a) GT, (b) BiT, (c) ours, (d) confusion matrix. Green, red, purple, and blue denote TP, TN, FP, and FN, respectively).
Table 5. Comparison results on Test1, Test2, and the CDD test set. - (c)
- As shown in the boxes in rows 1 and 2 of Figure 9, BiT has difficulty in accurately detecting small object changes around large objects due to the imbalance in the scale of the change samples, which causes the model to ignore small object samples. Experimentally, we find that false detection and missed detection occur more frequently when small objects are closer to large objects; we describe this phenomenon as the negative effect of the presence of large object change samples near the change samples in SoCD. For this reason, we model multiscale changes inside a multiscale window and use a small-scale window to capture more comprehensive information on small object changes, thereby mitigating the negative effects of scale differences in the change samples. In addition, the rich features of interest are captured by the channel-related fusion mechanism, which minimizes the loss of small object features and the interference of irrelevant information, so SWaF-Trans shows superior RS-CD performance, with an F1 score of 98.24% on Test1, which is much better than of BiT and SwinSUNet.
4.3.2. Visualization of Effectiveness
To more intuitively reflect the degree of separation between the changed and unchanged samples, we use t-SNE [] to visualize the distribution form of the samples in a reduced dimension. As shown in Figure 10, where green represents unchanged samples and blue represents changed samples, according to the distributions of (a) and (c), SWaF-Trans has a strong perception ability for both small object changes and large object changes, and both changed and unchanged samples are tightly clustered in the same area. There are clear semantic boundaries between them, so the changes we inferred have clearer boundaries and higher confidence levels. Comparison of the results shown in (d) and (b) indicate that as the proportion of small object change samples in the test set increases, the change samples and unchanged samples in the results of BiT inference become increasingly dispersed and deviate from the category center, and some change samples in the box are misclassified as unchanged samples. This is because some samples with low confidence at the edge of the change region are misclassified by the model, i.e., the “change boundary is blurred”; therefore, BiT does not learn a clear semantic “boundary” between change and no-change samples. In contrast, our method can overcome the abovementioned problem by highlighting the semantic concepts related to interesting changes and enhancing the representation of interesting features so as to obtain more comprehensive multiscale features, which can effectively distinguish between changes and non-changes, as well as perceive small object changes.
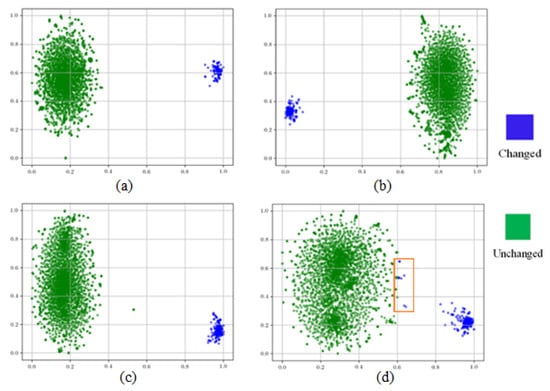
Figure 10.
t-SNE visual comparison: (a) the last feature layer of SWaF-Trans on the CDD test set. (b) The last feature layer of BiT on the CDD test set. (c) The last feature layer of SWaF-Trans on Test2. (d) The last feature layer of BiT on Test2.
5. Conclusions and Future Works
In this paper, we propose a Siamese transformer change detection network with a multiscale windows strategy that captures multiscale feature information through multiscale windows, mitigating the negative impact of the scale imbalance of change samples so that the network perceives more discriminative small object changes. In addition, we propose a channel-related fusion mechanism to adaptively fuse interest features, reducing the loss of small object features and the effect of irrelevant changes. SWaF-Trans has a strong ability to perceive small object changes with few missed and false detections and achieves the SOTA effect on the CDD and WHU-CD datasets, which can be used for disaster monitoring and other time-sensitive tasks.
However, the sample number and scale differences are widely considered challenged with respect to the model optimization approach, and some researchers [,,] have designed loss function optimization methods to mitigate the difficulties caused by sample number differences. It is foreseeable that there should also be a targeted optimization approach for scale differences, which is missing in this paper. In addition, SoCD is equally important in low-resolution remote sensing images, but it is not easy to analyze the SoCD effect in the case of low-accuracy large object change detection due to the limitation of the labeling method and the algorithm performance at the present stage. In the future, we will conduct more in-depth research in the areas of model optimization methods, low-resolution RS-CD, and interest object change detection so as to enhance the effectiveness of CD in practical projects.
Author Contributions
D.K.: conceptualization, methodology, software, and writing—original draft preparation. C.T. and Y.Z.: supervision. K.W.: software and validation. X.Z.: data curation. C.Z. and X.D.: writing—reviewing and editing. All authors have read and agreed to the published version of the manuscript.
Funding
This work was partially supported by National Natural Science Foundation of China under (grant No. 42171440, 42171376 and 41771458), scientific research projects supported by the Department of education of Hunan Province (grant No. 19K099); Science and Technology major projects of Changsha (grant No. kh2205030); The Natural Science Foundation of Hunan for Distinguished Young Scholars (grant No. 2022JJ10072); The Natural Science Foundation of Hunan (grant No. 2021JJ30815); Open Fund of Xiangjiang Laboratory (grant No. 22XJ03007); The Inner Mongolia Science Technology Plan (grant No. 2022YFSJ0014); The Fundamental Research Funds for the Central Universities of Central South University (grant No. 2023zzts0484) and The High Performance Computing Center of Central South University.
Data Availability Statement
Data associated with this research are available online. The CDD dataset is available at http://aistudio.baidu.com/aistudio/projectdetail/882508 (accessed on 23 March 2022). The WHU-CD dataset is available for download at https://study.rsgis.whu.edu.cn/pages/download/building_dataset.html (accessed on 23 March 2022).
Conflicts of Interest
The authors declare no conflict of interest.
References
- Khelifi, L.; Mignotte, M. Deep learning for change detection in remote sensing images: Comprehensive review and meta-analysis. IEEE Access 2020, 8, 126385–126400. [Google Scholar] [CrossRef]
- Shi, W.; Zhang, M.; Zhang, R.; Chen, S.; Zhan, Z. Change detection based on artificial intelligence: State-of-the-art and challenges. Remote Sens. 2020, 12, 1688. [Google Scholar] [CrossRef]
- Kennedy, R.E.; Townsend, P.A.; Gross, J.E.; Cohen, W.B.; Bolstad, P.; Wang, Y.; Adams, P. Remote sensing change detection tools for natural resource managers: Understanding concepts and tradeoffs in the design of landscape monitoring projects. Remote Sens. Environ. 2009, 113, 1382–1396. [Google Scholar] [CrossRef]
- Willis, K.S. Remote sensing change detection for ecological monitoring in United States protected areas. Biol. Conserv. 2015, 182, 233–242. [Google Scholar] [CrossRef]
- Todd, W.J. Urban and regional land use change detected by using Landsat data. J. Res. US Geol. Surv. 1977, 5, 529–534. [Google Scholar]
- Zheng, Z.; Zhong, Y.; Wang, J.; Ma, A.; Zhang, L. Building damage assessment for rapid disaster response with a deep object-based semantic change detection framework: From natural disasters to man-made disasters. Remote Sens. Environ. 2021, 265, 112636. [Google Scholar] [CrossRef]
- Daudt, R.C.; Le Saux, B.; Boulch, A.; Gousseau, Y. Urban change detection for multispectral earth observation using convolutional neural networks. In Proceedings of the IGARSS 2018—2018 IEEE International Geoscience and Remote Sensing Symposium, Valencia, Spain, 22–27 July 2018; pp. 2115–2118. [Google Scholar]
- Lv, Z.; Liu, T.; Benediktsson, J.A.; Falco, N. Land cover change detection techniques: Very-high-resolution optical images: A review. IEEE Geosci. Remote Sens. Mag. 2021, 10, 44–63. [Google Scholar] [CrossRef]
- Wen, D.; Huang, X.; Bovolo, F.; Li, J.; Ke, X.; Zhang, A.; Benediktsson, J.A. Change detection from very-high-spatial-resolution optical remote sensing images: Methods, applications, and future directions. IEEE Geosci. Remote Sens. Mag. 2021, 9, 68–101. [Google Scholar] [CrossRef]
- LeCun, Y.; Bottou, L.; Bengio, Y.; Haffner, P. Gradient-based learning applied to document recognition. Proc. IEEE 1998, 86, 2278–2324. [Google Scholar] [CrossRef]
- Chen, H.; Shi, Z. A spatial-temporal attention-based method and a new dataset for remote sensing image change detection. Remote Sens. 2020, 12, 1662. [Google Scholar] [CrossRef]
- Liu, T.; Gong, M.; Lu, D.; Zhang, Q.; Zheng, H.; Jiang, F.; Zhang, M. Building change detection for VHR remote sensing images via local–global pyramid network and cross-task transfer learning strategy. IEEE Trans. Geosci. Remote Sens. 2021, 60, 1–17. [Google Scholar] [CrossRef]
- Wang, D.; Chen, X.; Jiang, M.; Du, S.; Xu, B.; Wang, J. ADS-Net: An Attention-Based deeply supervised network for remote sensing image change detection. Int. J. Appl. Earth Obs. Geoinf. 2021, 101, 102348. [Google Scholar]
- Wang, Z.; Peng, C.; Zhang, Y.; Wang, N.; Luo, L. Fully convolutional siamese networks based change detection for optical aerial images with focal contrastive loss. Neurocomputing 2021, 457, 155–167. [Google Scholar] [CrossRef]
- Zhang, C.; Yue, P.; Tapete, D.; Jiang, L.; Shangguan, B.; Huang, L.; Liu, G. A deeply supervised image fusion network for change detection in high resolution bi-temporal remote sensing images. ISPRS J. Photogramm. Remote Sens. 2020, 166, 183–200. [Google Scholar] [CrossRef]
- Daudt, R.C.; Le Saux, B.; Boulch, A. Fully convolutional siamese networks for change detection. In Proceedings of the 2018 25th IEEE International Conference on Image Processing (ICIP), Athens, Greece, 7–10 October 2018; pp. 4063–4067. [Google Scholar]
- Zhang, M.; Xu, G.; Chen, K.; Yan, M.; Sun, X. Triplet-based semantic relation learning for aerial remote sensing image change detection. IEEE Geosci. Remote Sens. Lett. 2018, 16, 266–270. [Google Scholar] [CrossRef]
- Chen, J.; Yuan, Z.; Peng, J.; Chen, L.; Huang, H.; Zhu, J.; Liu, Y.; Li, H. DASNet: Dual attentive fully convolutional Siamese networks for change detection in high-resolution satellite images. IEEE J. Sel. Top. Appl. Earth Obs. Remote Sens. 2020, 14, 1194–1206. [Google Scholar] [CrossRef]
- Peng, X.; Zhong, R.; Li, Z.; Li, Q. Optical remote sensing image change detection based on attention mechanism and image difference. IEEE Trans. Geosci. Remote Sens. 2020, 59, 7296–7307. [Google Scholar] [CrossRef]
- Zhang, M.; Shi, W. A feature difference convolutional neural network-based change detection method. IEEE Trans. Geosci. Remote Sens. 2020, 58, 7232–7246. [Google Scholar] [CrossRef]
- Zhang, X.; Yue, Y.; Gao, W.; Yun, S.; Su, Q.; Yin, H.; Zhang, Y. DifUnet++: A satellite images change detection network based on UNet++ and differential pyramid. IEEE Geosci. Remote Sens. Lett. 2021, 19, 1–5. [Google Scholar] [CrossRef]
- Jiang, H.; Hu, X.; Li, K.; Zhang, J.; Gong, J.; Zhang, M. PGA-SiamNet: Pyramid feature-based attention-guided Siamese network for remote sensing orthoimagery building change detection. Remote Sens. 2020, 12, 484. [Google Scholar] [CrossRef]
- Yang, M.; Jiao, L.; Liu, F.; Hou, B.; Yang, S.; Jian, M. DPFL-Nets: Deep pyramid feature learning networks for multiscale change detection. IEEE Trans. Neural Netw. Learn. Syst. 2021, 33, 6402–6416. [Google Scholar] [CrossRef]
- Fang, S.; Li, K.; Shao, J.; Li, Z. SNUNet-CD: A densely connected Siamese network for change detection of VHR images. IEEE Geosci. Remote Sens. Lett. 2021, 19, 1–5. [Google Scholar] [CrossRef]
- Chen, H.; Qi, Z.; Shi, Z. Remote sensing image change detection with transformers. IEEE Trans. Geosci. Remote Sens. 2021, 60, 1–14. [Google Scholar] [CrossRef]
- Li, Q.; Zhong, R.; Du, X.; Du, Y. TransUNetCD: A hybrid transformer network for change detection in optical remote-sensing images. IEEE Trans. Geosci. Remote Sens. 2022, 60, 1–19. [Google Scholar] [CrossRef]
- Bandara, W.G.C.; Patel, V.M. A transformer-based siamese network for change detection. In Proceedings of the IGARSS 2022—2022 IEEE International Geoscience and Remote Sensing Symposium, Kuala Lumpur, Malaysia, 17–22 July 2022; pp. 207–210. [Google Scholar]
- Liu, Z.; Lin, Y.; Cao, Y.; Hu, H.; Wei, Y.; Zhang, Z.; Lin, S.; Guo, B. Swin transformer: Hierarchical vision transformer using shifted windows. In Proceedings of the IEEE/CVF International Conference on Computer Vision, Montreal, QC, Canada, 10–17 October 2021; pp. 10012–10022. [Google Scholar]
- Zhang, C.; Wang, L.; Cheng, S.; Li, Y. SwinSUNet: Pure transformer network for remote sensing image change detection. IEEE Trans. Geosci. Remote Sens. 2022, 60, 1–13. [Google Scholar] [CrossRef]
- Lin, A.; Chen, B.; Xu, J.; Zhang, Z.; Lu, G.; Zhang, D. Ds-transunet: Dual swin transformer u-net for medical image segmentation. IEEE Trans. Instrum. Meas. 2022, 71, 1–15. [Google Scholar] [CrossRef]
- Dosovitskiy, A.; Beyer, L.; Kolesnikov, A.; Weissenborn, D.; Zhai, X.; Unterthiner, T.; Dehghani, M.; Minderer, M.; Heigold, G.; Gelly, S.; et al. An image is worth 16 × 16 words: Transformers for image recognition at scale. arXiv 2020, arXiv:2010.11929. [Google Scholar]
- Lebedev, M.; Vizilter, Y.V.; Vygolov, O.; Knyaz, V.; Rubis, A.Y. Change detection in remote sensing images using conditional adversarial networks. In Proceedings of the The International Archives of the Photogrammetry, Remote Sensing and Spatial Information Sciences, 2018 ISPRS TC II Mid-term Symposium “Towards Photogrammetry 2020”, Riva del Garda, Italy, 4–7 June 2018; Volume 42. [Google Scholar]
- Ji, S.; Wei, S.; Lu, M. Fully convolutional networks for multisource building extraction from an open aerial and satellite imagery data set. IEEE Trans. Geosci. Remote Sens. 2018, 57, 574–586. [Google Scholar] [CrossRef]
- Long, J.; Shelhamer, E.; Darrell, T. Fully convolutional networks for semantic segmentation. In Proceedings of the IEEE Conference on Computer Vision and Pattern Recognition, Boston, MA, USA, 7–12 July 2015; pp. 3431–3440. [Google Scholar]
- Guo, E.; Fu, X.; Zhu, J.; Deng, M.; Liu, Y.; Zhu, Q.; Li, H. Learning to measure change: Fully convolutional siamese metric networks for scene change detection. arXiv 2018, arXiv:1810.09111. [Google Scholar]
- Lei, T.; Zhang, Q.; Xue, D.; Chen, T.; Meng, H.; Nandi, A.K. End-to-end change detection using a symmetric fully convolutional network for landslide mapping. In Proceedings of the ICASSP 2019—2019 IEEE International Conference on Acoustics, Speech and Signal Processing (ICASSP), Brighton, UK, 12–17 May 2019; pp. 3027–3031. [Google Scholar]
- Zhan, Y.; Fu, K.; Yan, M.; Sun, X.; Wang, H.; Qiu, X. Change detection based on deep siamese convolutional network for optical aerial images. IEEE Geosci. Remote Sens. Lett. 2017, 14, 1845–1849. [Google Scholar] [CrossRef]
- Liu, J.; Gong, M.; Qin, K.; Zhang, P. A deep convolutional coupling network for change detection based on heterogeneous optical and radar images. IEEE Trans. Neural Netw. Learn. Syst. 2016, 29, 545–559. [Google Scholar] [CrossRef] [PubMed]
- Vaswani, A.; Shazeer, N.; Parmar, N.; Uszkoreit, J.; Jones, L.; Gomez, A.N.; Kaiser, Ł.; Polosukhin, I. Attention is all you need. In Proceedings of the Advances in Neural Information Processing Systems, Long Beach, CA, USA, 4–9 December 2017; Volume 30. [Google Scholar]
- Fu, J.; Liu, J.; Tian, H.; Li, Y.; Bao, Y.; Fang, Z.; Lu, H. Dual attention network for scene segmentation. In Proceedings of the IEEE/CVF Conference on Computer Vision and Pattern Recognition, Long Beach, CA, USA, 16–17 June 2019; pp. 3146–3154. [Google Scholar]
- Zhang, D.; Zheng, Z.; Li, M.; Liu, R. CSART: Channel and spatial attention-guided residual learning for real-time object tracking. Neurocomputing 2021, 436, 260–272. [Google Scholar] [CrossRef]
- Shi, Q.; Liu, M.; Li, S.; Liu, X.; Wang, F.; Zhang, L. A deeply supervised attention metric-based network and an open aerial image dataset for remote sensing change detection. IEEE Trans. Geosci. Remote Sens. 2021, 60, 1–16. [Google Scholar] [CrossRef]
- Strudel, R.; Garcia, R.; Laptev, I.; Schmid, C. Segmenter: Transformer for semantic segmentation. In Proceedings of the IEEE/CVF International Conference on Computer Vision, Montreal, BC, Canada, 11–17 October 2021; pp. 7262–7272. [Google Scholar]
- Meng, X.; Yang, Y.; Wang, L.; Wang, T.; Li, R.; Zhang, C. Class-Guided Swin Transformer for Semantic Segmentation of Remote Sensing Imagery. IEEE Geosci. Remote Sens. Lett. 2022, 19, 1–5. [Google Scholar] [CrossRef]
- Carion, N.; Massa, F.; Synnaeve, G.; Usunier, N.; Kirillov, A.; Zagoruyko, S. End-to-end object detection with transformers. In Proceedings of the Computer Vision–ECCV 2020: 16th European Conference, Glasgow, UK, 23–28 August 2020; Proceedings, Part I 16. Springer: Berlin/Heidelberg, Germany, 2020; pp. 213–229. [Google Scholar]
- Ding, J.; Xue, N.; Long, Y.; Xia, G.S.; Lu, Q. Learning roi transformer for oriented object detection in aerial images. In Proceedings of the IEEE/CVF Conference on Computer Vision and Pattern Recognition, Long Beach, CA, USA, 15–20 June 2019; pp. 2849–2858. [Google Scholar]
- Jannat, F.E.; Willis, A.R. Improving Classification of Remotely Sensed Images with the Swin Transformer. In Proceedings of the SoutheastCon 2022, Mobile, AL, USA, 26 March–3 April 2022; pp. 611–618. [Google Scholar]
- Tong, S.; Qi, K.; Guan, Q.; Zhu, Q.; Yang, C.; Zheng, J. Remote Sensing Scene Classification Using Spatial Transformer Fusion Network. In Proceedings of the IGARSS 2020-2020 IEEE International Geoscience and Remote Sensing Symposium, Waikoloa, HI, USA, 26 September–2 October 2020; pp. 549–552. [Google Scholar]
- Zhang, B.; Gu, S.; Zhang, B.; Bao, J.; Chen, D.; Wen, F.; Wang, Y.; Guo, B. Styleswin: Transformer-based gan for high-resolution image generation. In Proceedings of the IEEE/CVF Conference on Computer Vision and Pattern Recognition, New Orleans, LA, USA, 18–24 June 2022; pp. 11304–11314. [Google Scholar]
- Wang, Z.; Zhang, Y.; Luo, L.; Wang, N. TransCD: Scene change detection via transformer-based architecture. Opt. Express 2021, 29, 41409–41427. [Google Scholar] [CrossRef]
- Yan, T.; Wan, Z.; Zhang, P. Fully Transformer Network for Change Detection of Remote Sensing Images. In Proceedings of the Asian Conference on Computer Vision, Macau SAR, China, 4–8 December 2022; pp. 1691–1708. [Google Scholar]
- Ailimujiang, G.; Jiaermuhamaiti, Y.; Jumahong, H.; Wang, H.; Zhu, S.; Nurmamaiti, P. A Transformer-Based Network for Change Detection in Remote Sensing Using Multiscale Difference-Enhancement. Comput. Intell. Neurosci. 2022, 2022. [Google Scholar] [CrossRef] [PubMed]
- Bertinetto, L.; Valmadre, J.; Henriques, J.F.; Vedaldi, A.; Torr, P.H. Fully-convolutional siamese networks for object tracking. In Proceedings of the Computer Vision—ECCV 2016 Workshops, Amsterdam, The Netherlands, 8–10 and 15–16 October 2016; Proceedings, Part II 14. Springer: Berlin/Heidelberg, Germany, 2016; pp. 850–865. [Google Scholar]
- Zhang, D.; Zheng, Z.; Wang, T.; He, Y. HROM: Learning high-resolution representation and object-aware masks for visual object tracking. Sensors 2020, 20, 4807. [Google Scholar] [CrossRef]
- Lin, T.Y.; Dollár, P.; Girshick, R.; He, K.; Hariharan, B.; Belongie, S. Feature pyramid networks for object detection. In Proceedings of the IEEE Conference on Computer Vision and Pattern Recognition, Honolulu, HI, USA, 21–26 July 2017; pp. 2117–2125. [Google Scholar]
- Li, Y.; Li, S.; Du, H.; Chen, L.; Zhang, D.; Li, Y. YOLO-ACN: Focusing on small target and occluded object detection. IEEE Access 2020, 8, 227288–227303. [Google Scholar] [CrossRef]
- Deng, C.; Wang, M.; Liu, L.; Liu, Y.; Jiang, Y. Extended feature pyramid network for small object detection. IEEE Trans. Multimed. 2021, 24, 1968–1979. [Google Scholar] [CrossRef]
- Hu, G.X.; Yang, Z.; Hu, L.; Huang, L.; Han, J.M. Small object detection with multiscale features. Int. J. Digit. Multimed. Broadcast. 2018, 2018. [Google Scholar] [CrossRef]
- Yang, J.; Yang, J.y. Generalized K–L transform based combined feature extraction. Pattern Recognit. 2002, 35, 295–297. [Google Scholar] [CrossRef]
- Yang, J.; Yang, J.y.; Zhang, D.; Lu, J.f. Feature fusion: Parallel strategy vs. serial strategy. Pattern Recognit. 2003, 36, 1369–1381. [Google Scholar] [CrossRef]
- Liu, C.; Wechsler, H. A shape-and texture-based enhanced fisher classifier for face recognition. IEEE Trans. Image Process. 2001, 10, 598–608. [Google Scholar] [PubMed]
- Huang, L.; Dai, S.; Huang, T.; Huang, X.; Wang, H. Infrared small target segmentation with multiscale feature representation. Infrared Phys. Technol. 2021, 116, 103755. [Google Scholar] [CrossRef]
- Chaib, S.; Liu, H.; Gu, Y.; Yao, H. Deep feature fusion for VHR remote sensing scene classification. IEEE Trans. Geosci. Remote Sens. 2017, 55, 4775–4784. [Google Scholar] [CrossRef]
- Hu, J.; Shen, L.; Sun, G. Squeeze-and-excitation networks. In Proceedings of the IEEE Conference on Computer Vision and Pattern Recognition, Salt Lake City, UT, USA, 18–23 June 2018; pp. 7132–7141. [Google Scholar]
- He, X.; Zhou, Y.; Zhao, J.; Zhang, D.; Yao, R.; Xue, Y. Swin transformer embedding UNet for remote sensing image semantic segmentation. IEEE Trans. Geosci. Remote Sens. 2022, 60, 1–15. [Google Scholar] [CrossRef]
- Van der Maaten, L.; Hinton, G. Visualizing data using t-SNE. J. Mach. Learn. Res. 2008, 9, 2579–2605. [Google Scholar]
Disclaimer/Publisher’s Note: The statements, opinions and data contained in all publications are solely those of the individual author(s) and contributor(s) and not of MDPI and/or the editor(s). MDPI and/or the editor(s) disclaim responsibility for any injury to people or property resulting from any ideas, methods, instructions or products referred to in the content. |
© 2023 by the authors. Licensee MDPI, Basel, Switzerland. This article is an open access article distributed under the terms and conditions of the Creative Commons Attribution (CC BY) license (https://creativecommons.org/licenses/by/4.0/).