Article

Land Subsidence in a Coastal City Based on SBAS-InSAR Monitoring: A Case Study of Zhuhai, China

1
School of Geography and Information Engineering, China University of Geosciences, Wuhan 430074, China
2
Wuhan Center, China Geological Survey, Wuhan 430205, China
3
College of Information Science and Engineering, Northeastern University, Shenyang 110004, China
4
College of Environmental Sciences and Engineering, Peking University, Beijing 100871, China
*
Author to whom correspondence should be addressed.
Remote Sens. 2023, 15(9), 2424; https://doi.org/10.3390/rs15092424
Submission received: 22 March 2023 / Revised: 28 April 2023 / Accepted: 29 April 2023 / Published: 5 May 2023

Abstract

:
The superimposed effects of sea level rise caused by global warming and land subsidence seriously threaten the sustainable development of coastal cities. In recent years, an important coastal city in China, Zhuhai, has been suffering from severe and widespread land subsidence; however, the characteristics, triggers, and vulnerability assessment of ground subsidence in Zhuhai are still unclear. Therefore, we used the SBAS-InSAR technique to process 51 Sentinel-1A images to monitor the land subsidence in Zhuhai during the period from August 2016 to June 2019. The results showed that there was extensive land subsidence in the study area, with a maximum rate of −109.75 mm/yr. The surface had sequentially undergone a process of minor uplift and decline fluctuation, sharp settlement, and stable subsidence. The distribution and evolution of land subsidence were controlled by tectonic fractures and triggered by the thickness of soft soil, the intensity of groundwater development, and the seasonal changes of atmospheric precipitation. The comprehensive index method and the analytic hierarchy process were applied to derive extremely high subsidence vulnerability in several village communities and some traffic arteries in Zhuhai. Our research provides a theoretical basis for urban disaster prevention in Zhuhai and the construction planning of coastal cities around the world.

1. Introduction

Land subsidence refers to the engineering geological phenomenon where the ground elevation in a certain area decreases due to the consolidation and compression of loose underground rock layers under the influence of natural or man-made factors. Land subsidence seriously endangers the safety of people’s lives and property, especially in coastal cities which are subject to natural disasters such as land loss, infrastructure collapse, floods, and storm surges under the combined effects of relative sea level rise (RSLR) caused by global warming and land subsidence [1,2]. For example, more than 100,000 people lost their lives and more than 1 million residents lost their homes in one year in the delta cities in India to the influence of flooding due to ground subsidence [3]. The Pearl River Delta in China, which is currently inhabited by millions of people, is highly vulnerable to typhoons due to its low elevation and limited coastal barrier protection. Here, RSLR is prone to inducing storm surges, thus causing direct economic losses to coastal cities in the Pearl River Delta (PRD). Fang et al. once pointed out that among all the predisposing factors that caused direct economic losses of US$838.1 million per year in Guangdong Province, the impact caused by storm surges accounted for more than 90% [4]. Therefore, it is important to actively carry out research on ground subsidence in coastal cities and scientifically prevent and control urban geohazards, which are dangerous to the sustainable and healthy development of coastal cities. In addition, the key to preventing and controlling land subsidence lies in sorting out the current situation of regional subsidence, capturing the triggering factors of subsidence, and assessing the development trend of subsidence.
Most of the traditional methods for land subsidence studies are the Global Navigation Satellite System (GNSS), which has high monitoring accuracy but low spatial coverage, making it difficult to describe land subsidence over large areas [5]. Differential Interferometric Synthetic Aperture Radar (D-InSAR) covers a larger area than GNSS, but it is susceptible to temporal decorrelation caused by surface changes, spatial decorrelation caused by long baselines, and atmospheric effects, making it difficult to obtain high accuracy terrain measurement results [6]. The Permanent Scatterers Interferometric Synthetic Aperture Radar (PS-InSAR) proposed by Ferretti et al. can effectively circumvent the effects of spatiotemporal de-correlation and can utilize high coherence points where the scattering characteristics remain stable to obtain reliable interferometric phase information, but it is more inclined to linear deformation in terms of the type of deformation measured [7]. The Short Baseline Subset Synthetic Aperture Radar (SBAS-InSAR) [8] interferometry technique proposed by Berardino et al. has more significant advantages over PS-InSAR in overcoming the de-correlation of high deformation rate regions, handling large deformation fields with less error, and reducing the number of SAR images required for data processing; thus it is widely used in urban land subsidence, landslide, and volcano monitoring [9,10,11,12]. Li et al. previously applied the SBAS-InSAR technique based on ALOS/PALSAR data to monitor the evolution of ground subsidence in the Pearl River Delta region of China from 2006 to 2011 and revealed the correlation between ground subsidence and natural and anthropogenic factors such as geological evolution, land reclamation, and urban construction [13]. It is worth noting that although SAR data exhibit significant advantages such as easy access to data and the ability to conduct large-scale surveys, they show drawbacks in pixel recognition ability due to environmental noise and other effects [14]. Currently, more and more researchers are combining InSAR technology with deep learning and artificial intelligence models, proposing convolutional neural networks for high-resolution identification of feature elements, fuzzy fusion techniques for linear feature detection of multi-temporal SAR images, and prediction models for the evolution of ground subsidence in different types of study areas [2,15,16].
Zhuhai, as the core city on the west bank of the Pearl River Estuary, the new special zone of ecological civilization and the demonstration city for scientific development in the PRD, has widespread soft soil on it, with a high water content, high compressibility, a high porosity ratio, and low bearing capacity of the soil layer, which is susceptible to urban construction compaction and has a higher possibility of land subsidence [17]. As early as 2003, Chen and other researchers conducted a study on the relationship between soft soils and land subsidence in Suzhou, a key city in the Yangtze River Delta, and concluded that compaction of soft mud layers, especially the third layer, which is thick and close to the main pumping aquifer, contributes to land subsidence [18]. The rapidly industrialized economy has led to the continuous gathering of the external population in the territory of Zhuhai, so the government has had to adopt land reclamation to expand urban space and alleviate the contradiction of land supply and demand [19]. The land reclamation area is mainly used for polder farming and port construction [20]. With economic development, the production way of the land reclamation area has been changed from agriculture-based to industrial construction-based, and the construction load has obviously increased, thus further aggravating the land subsidence trend in Zhuhai. Sengupta et al. extracted the land reclamation trajectories of nine major coastal cities in three major deltas in China and found that the cumulative area has exceeded 2800 km2 since 1984, and 82% occurred after 2000, with Shanghai showing the largest increase and Zhuhai ranking fifth [21]. Studies have shown that land subsidence in Zhuhai has significantly affected the safety of industrial and civil buildings, hindered the use of water conservancy projects and pipeline systems, and greatly damaged urban transportation facilities, such as the annual need for 40 million yuan of funding for road maintenance on Zhuhai Avenue [22]. However, there are few studies on land subsidence in Zhuhai, and the understanding of the triggers and vulnerability assessment of land subsidence is not comprehensive enough. Zhu et al. [23] and Hu et al. [24] focused on the effects of groundwater mining and soft soil consolidation on the causes of subsidence, but ignored the effects of fracture structures and atmospheric precipitation, and lacked the exploration of land subsidence characteristics and triggers in local key areas.
In this paper, we applied SBAS-InSAR technology to process 51 Sentinel-1A images from 20 August 2016 to 18 June 2019 to derive the spatial and temporal distribution characteristics of land subsidence in Zhuhai, comprehensively analyze its ground subsidence triggers, and assess the degree of economic vulnerability of the study area under the influence of ground subsidence. This study not only provides important support for the overall layout of urban construction and strategic layout of disaster prevention and control in Zhuhai, but also provides a scientific basis for the construction and development planning of global coastal cities.

2. Materials and Methods

2.1. Study Area

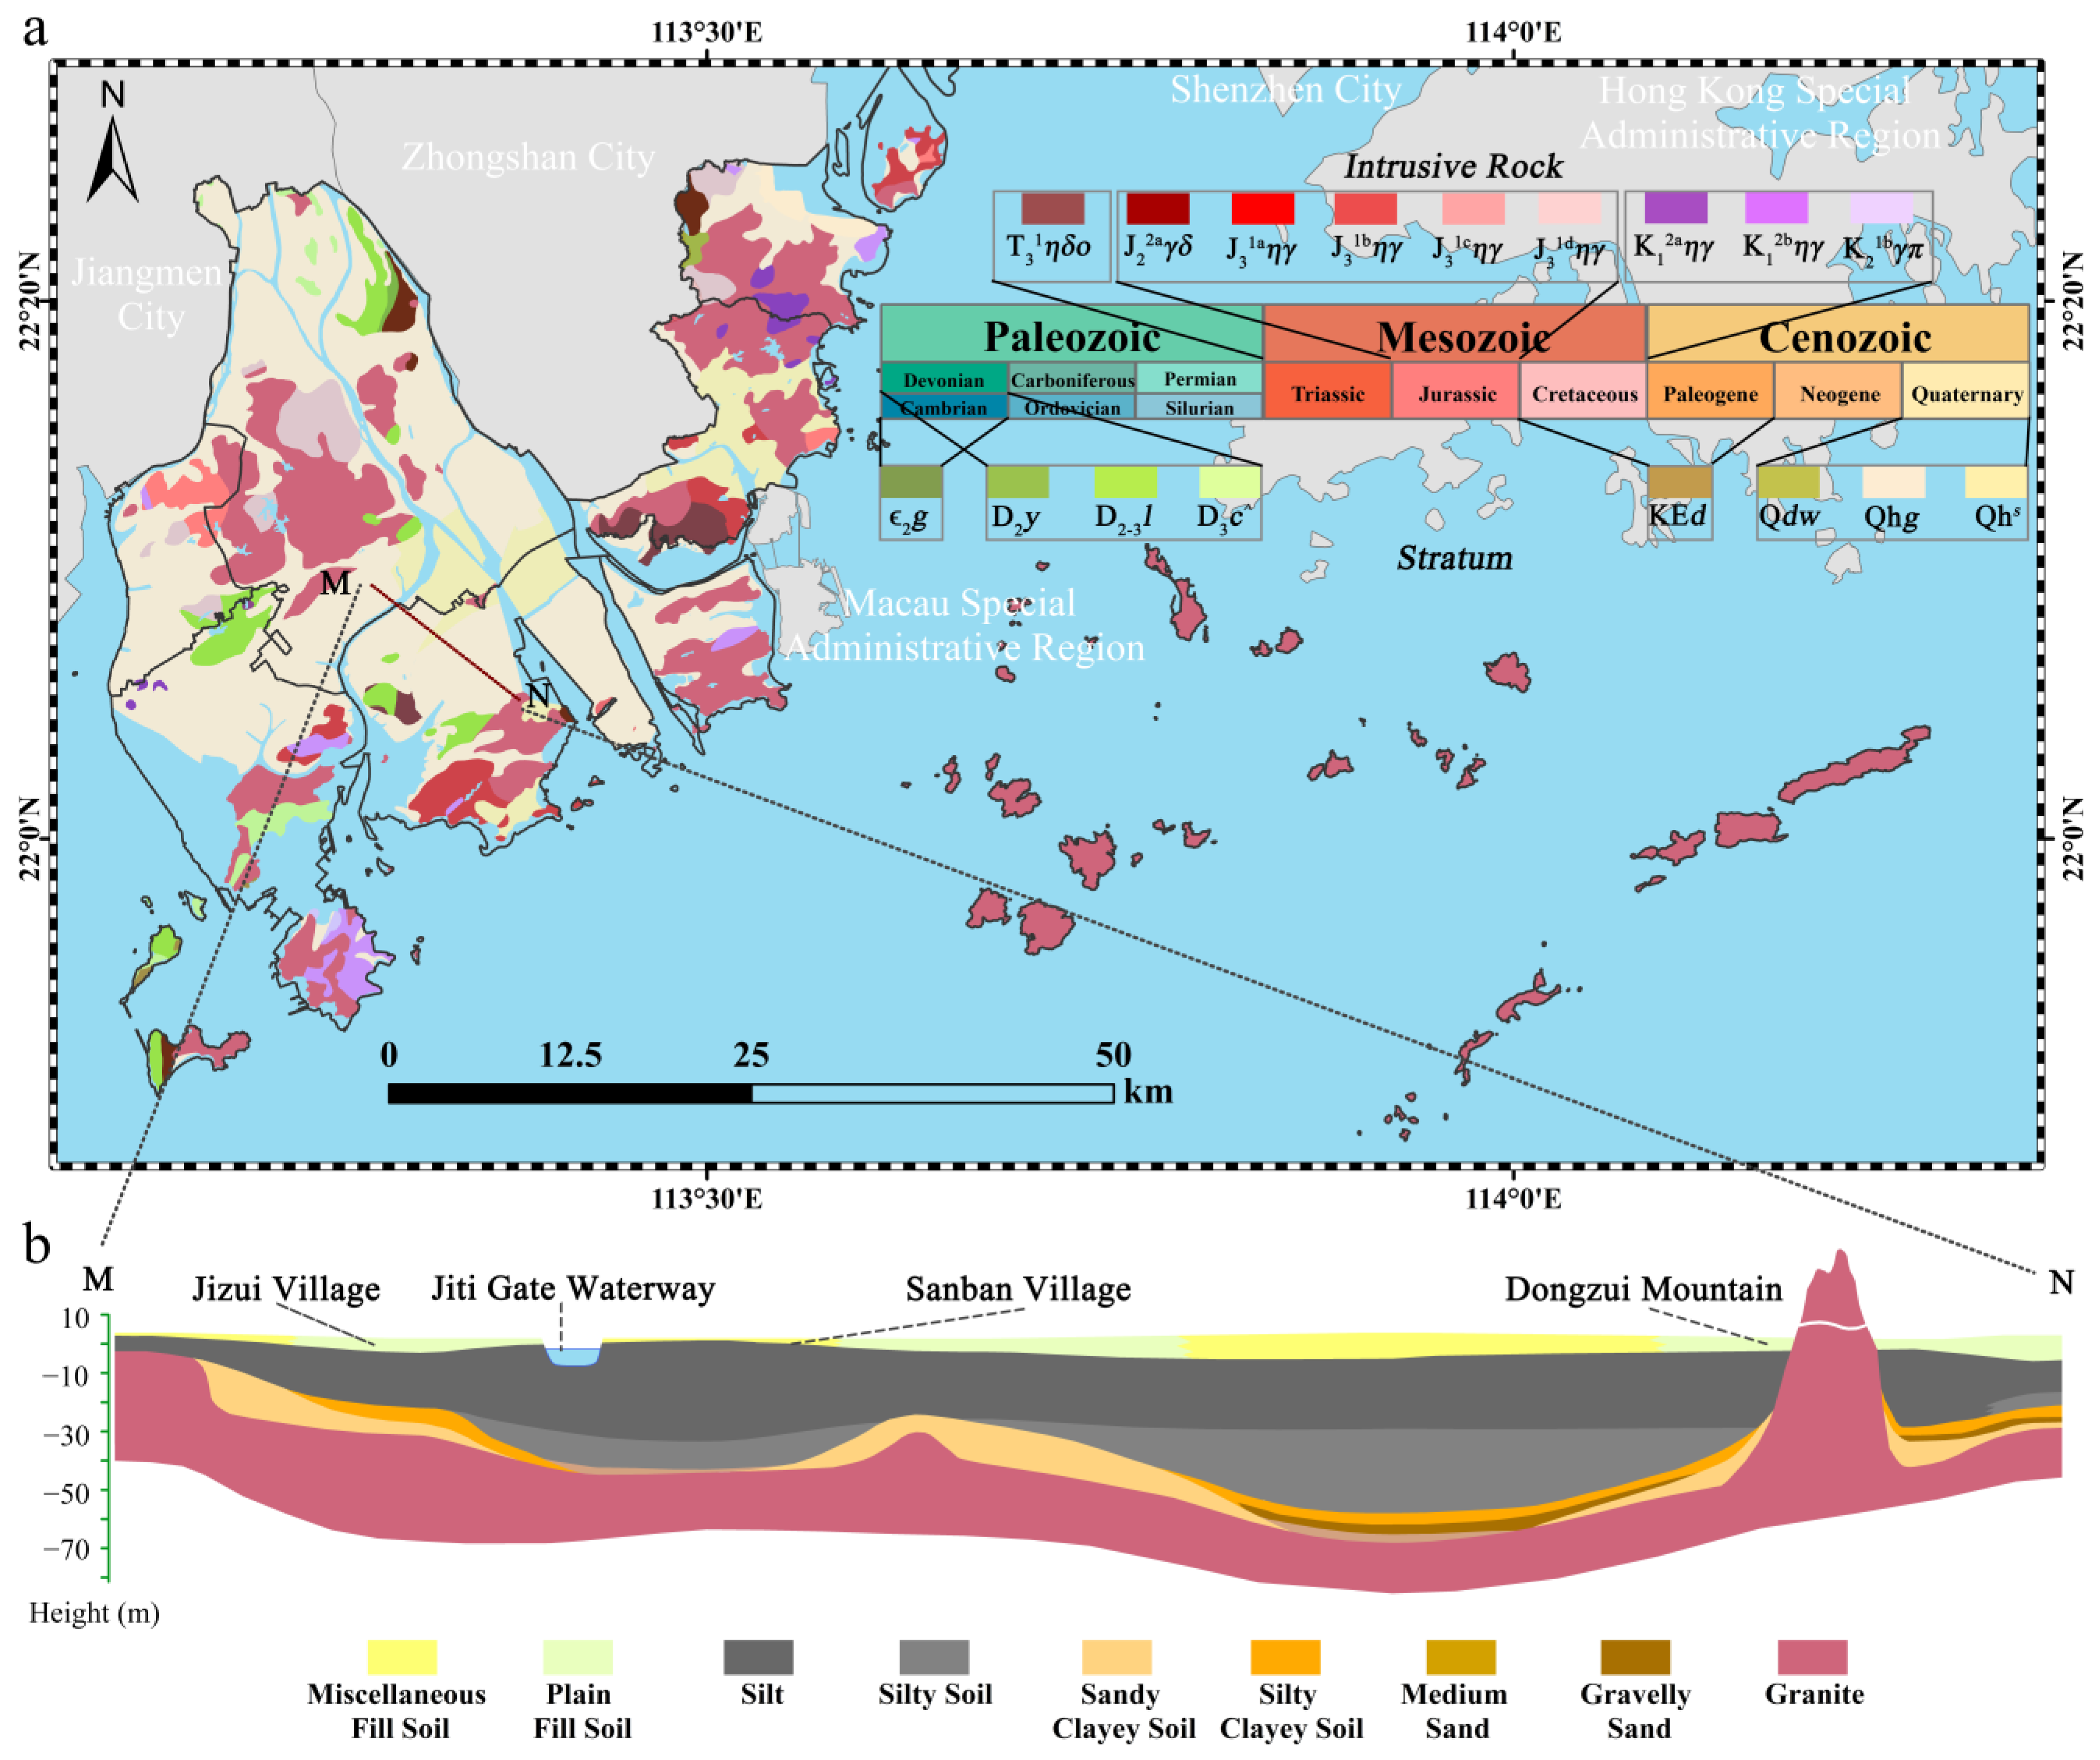
Zhuhai [25] (21°48′~22°27′N; 113°03′~114°19′E) is located in the south-central part of Guangdong Province on the shore of the South China Sea, bordered by the Macau Special Administrative Region to the east, Zhongshan City to the north, and Xinhui District of Jiangmen City to the northwest (Figure 1). Geologically, Zhuhai belongs to the southwest section of the secondary Purple Gold Boluo Fault Zone and the Lotus Fault Zone in the second uplift zone of the Neocathaysian Structural System, which lays the foundation for stratigraphic development [26]. On stratigraphic development, soft soil formed by sea-land interaction in the pre-mountain plain is controlled by basement fractures and distributed along the river channel, concentrated in the Holocene Lantern Sand Formation stratum [13,27]. The regional geological map of Zhuhai shows the geotechnical and stratigraphic conditions corresponding to different geological historical periods from a horizontal direction, among which the most widely distributed intrusive rocks are Late Jurassic era medium-grained porphyritic black mica diorite granite (J31bηγ) (Figure 2). It is worth noting that the stratum of Zhuhai is mainly Quaternary (Qhs, Qhg and Qdw), and the Qhg stratum is dominant, which covers about 36.92% of the total area of Zhuhai, amounting to 637.55 km2. The geotechnical properties of this stratum are main silt, silty clayey soil, and silty sand, and the physical and mechanical properties of these three soils are focused on the characteristics of large natural pore ratio, high water content, poor mechanical strength, and high compressibility. In addition, the engineering geological profile shows that the thickness of the silty soil and silt cover exceeds 30 m. All these characteristics create environmental conditions for the extensive development of ground subsidence in Zhuhai.
The soft soil covers a large area and accumulates deeply, while the compression index CC which evaluates the deformation characteristics of soft soil, has the best correlation with the natural water content Wn compared with other physical indicators [28]. Therefore, it is necessary to investigate the aquatic environment (such as groundwater and atmospheric precipitation) for the study area. Regarding the aquatic environment, Zhuhai has abundant atmospheric precipitation and large surface- and groundwater resources, while groundwater mining is mostly applied to aquaculture, which is mainly distributed in the southern groundwater overdraft area [29]. In addition, urban construction, land reclamation, and transportation network construction have enhanced the process of self-consolidation and compaction of soft soil. It can be inferred that the fragile primary geological environment, increasing urban infrastructure construction, and groundwater exploitation make the urban geological hazards of ground subsidence in Zhuhai particularly prominent.

2.2. SBAS-InSAR Technology

The SBAS-InSAR proposed by Berardino et al. is a method of achieving more accurate deformation monitoring than the D-InSAR technique by using the coherence of spatial distribution to restore the time–series deformation by connecting multiple interferogram pairs with short spatial–temporal baselines [30,31,32]. The basic principle is: assume that N + 1SAR images of the same region are acquired at (t0, ..., tN) time, and M differential interferograms are obtained according to the combination of interference conditions, where M satisfies:
N 2 M N ( N 1 2 )
Assuming that the ith differential interferogram is obtained by multiplying the two SAR images co-choked by the master and slave images at moments tA and tB, respectively, the interference phase of the image elements can be expressed as:
δ φ i ( x , r ) = φ A ( x , r ) φ B ( x , r ) δ φ d i s p i ( x , r ) + δ φ t o p o i ( x , r ) + δ φ a t m i ( x , r ) + δ φ n o i s e i ( x , r )
where x and r are the azimuthal and distance coordinates, respectively, i ( 1,2 , 3 , , M ) , δ φ d i s p i x , r is the deformation phase, δ φ t o p o i x , r is the residual topographic phase in the interferogram, δ φ a t m i x , r is the atmospheric delay phase, and δ φ n o i s e i x , r is the noise error phase. If the residual topographic phase, atmospheric delay phase, and noise phase are not considered, it can be simplified as:
δ φ i ( x , r ) 4 π λ [ d ( t B , x , r ) d ( t A , x , r ) ]
where λ is the radar wavelength, d t B , x , r and d t A , x , r are the surface deformation of the image element x , r with respect to the initial moment t0 in the radar line of sight direction at the moments tB and tA, respectively, and d t 0 , x , r = 0 .
Assuming that the deformation rate between different interferograms is Vk,k+1 and k is the serial number of SAR images, the accumulated deformation between moments tA and tB can be expressed as the integration of the deformation rate of each period over the time interval of master and slave images, which is expressed as:
δ φ d i s p i ( x , r ) = 4 π λ k = t A t B 1 v k , k + 1 ( t k + 1 t k )
The matrix A v = δ φ and A is a matrix of M × N . Each row of A corresponds to an interferogram and each column corresponds to a scene SAR image. If M N and the rank of A is N, the generalized inverse matrix of matrix A is obtained by the least squares method; otherwise the generalized inverse matrix of matrix A is obtained by the singular value decomposition (SVD) method. Subsequently, the minimum parametric solution of the velocity vector is deduced, and then the integration process of the velocity at each period is carried out to finally obtain the amount of sedimentation at each period.

2.3. Research Data

In this study, 51 views of Sentinel-1A image data with interferometric wide swath (IW) mode from 20 August 2016 to 18 June 2019 were collected as data sources. The parameters were set as follows: the band was C-band, the wavelength was 5.63 cm, the orbit direction was ascending, the spatial separation rate was 5 m × 20 m, and the polarization mode was vertical transmission vertical reception (VV) polarization [33]. The DEM data used for topographic phase removal and geocoding was the AW3D-DEM data released by JAXA/EORC and the Sentinel-1A satellite precision orbit ephemerides. In addition, we obtained data on fracture structure, soft soil thickness, groundwater extraction intensity, and land reclamation distribution in Zhuhai, and obtained the monthly minimum temperature and monthly precipitation values in Zhuhai from the China Surface Climate Information Daily Value Dataset V3.0 for land subsidence trigger factor analysis [34]. Finally, the data of five main economic indicators related to the potential hazards of ground subsidence were obtained from the “Main Economic Indicators of Zhuhai Administrative (Functional) Districts in 2019” published by the Statistics Bureau of Zhuhai for the evaluation of subsidence vulnerability.

2.4. Research Method

The SBAS-InSAR technique and ENVI SARScape software were used to process the image data to obtain the land subsidence information, and the primary image time was selected as 12 April 2018 based on SAR data. Then we obtained the temporal and spatial baseline distribution maps, after which image alignment, cropping, and combination were completed in combination with DEM data. After that, we calculated the interference phase and generated the interferogram. The flat earth phase derived from spatial baseline parameters and earth ellipsoid parameters and the terrain phase derived from the elevation phase were removed. Adaptive filtering, coherence coefficient generation, and phase decoupling were then performed in turn. After orbit refinement and re-deplatforming, and then using least squares and singular value decomposition to remove residual phases such as atmosphere and noise, the final geocoding was performed to obtain the variation of the average rate and amount of land subsidence overtime.
Combining the spatial and temporal characteristics of ground settlement and potential ground settlement triggers, four surface subsidence triggers (including fracture structure, soft soil thickness, groundwater extraction, and atmospheric precipitation) in Zhuhai were obtained by applying GIS spatial overlay analysis by ArcGIS software and linear fitting analysis by Origin software. Subsequently, the subsidence situation and subsidence triggering factors in the serious subsidence case area were systematically analyzed based on the GIS Geostatistical Analyst method. Finally, we combined five major regional economic indicators (including gross regional product, resident population, gross industrial output value above the scale, public budget expenditure and public budget revenue), applied the analytic hierarchy process and comprehensive index methods, and assessed the degree of subsidence susceptibility in Zhuhai based on GIS spatial analysis tools [35] (Figure 3).

3. Results

3.1. Characteristics of the Spatial and Temporal Distribution of Land Subsidence

3.1.1. Spatial Distribution Characteristics

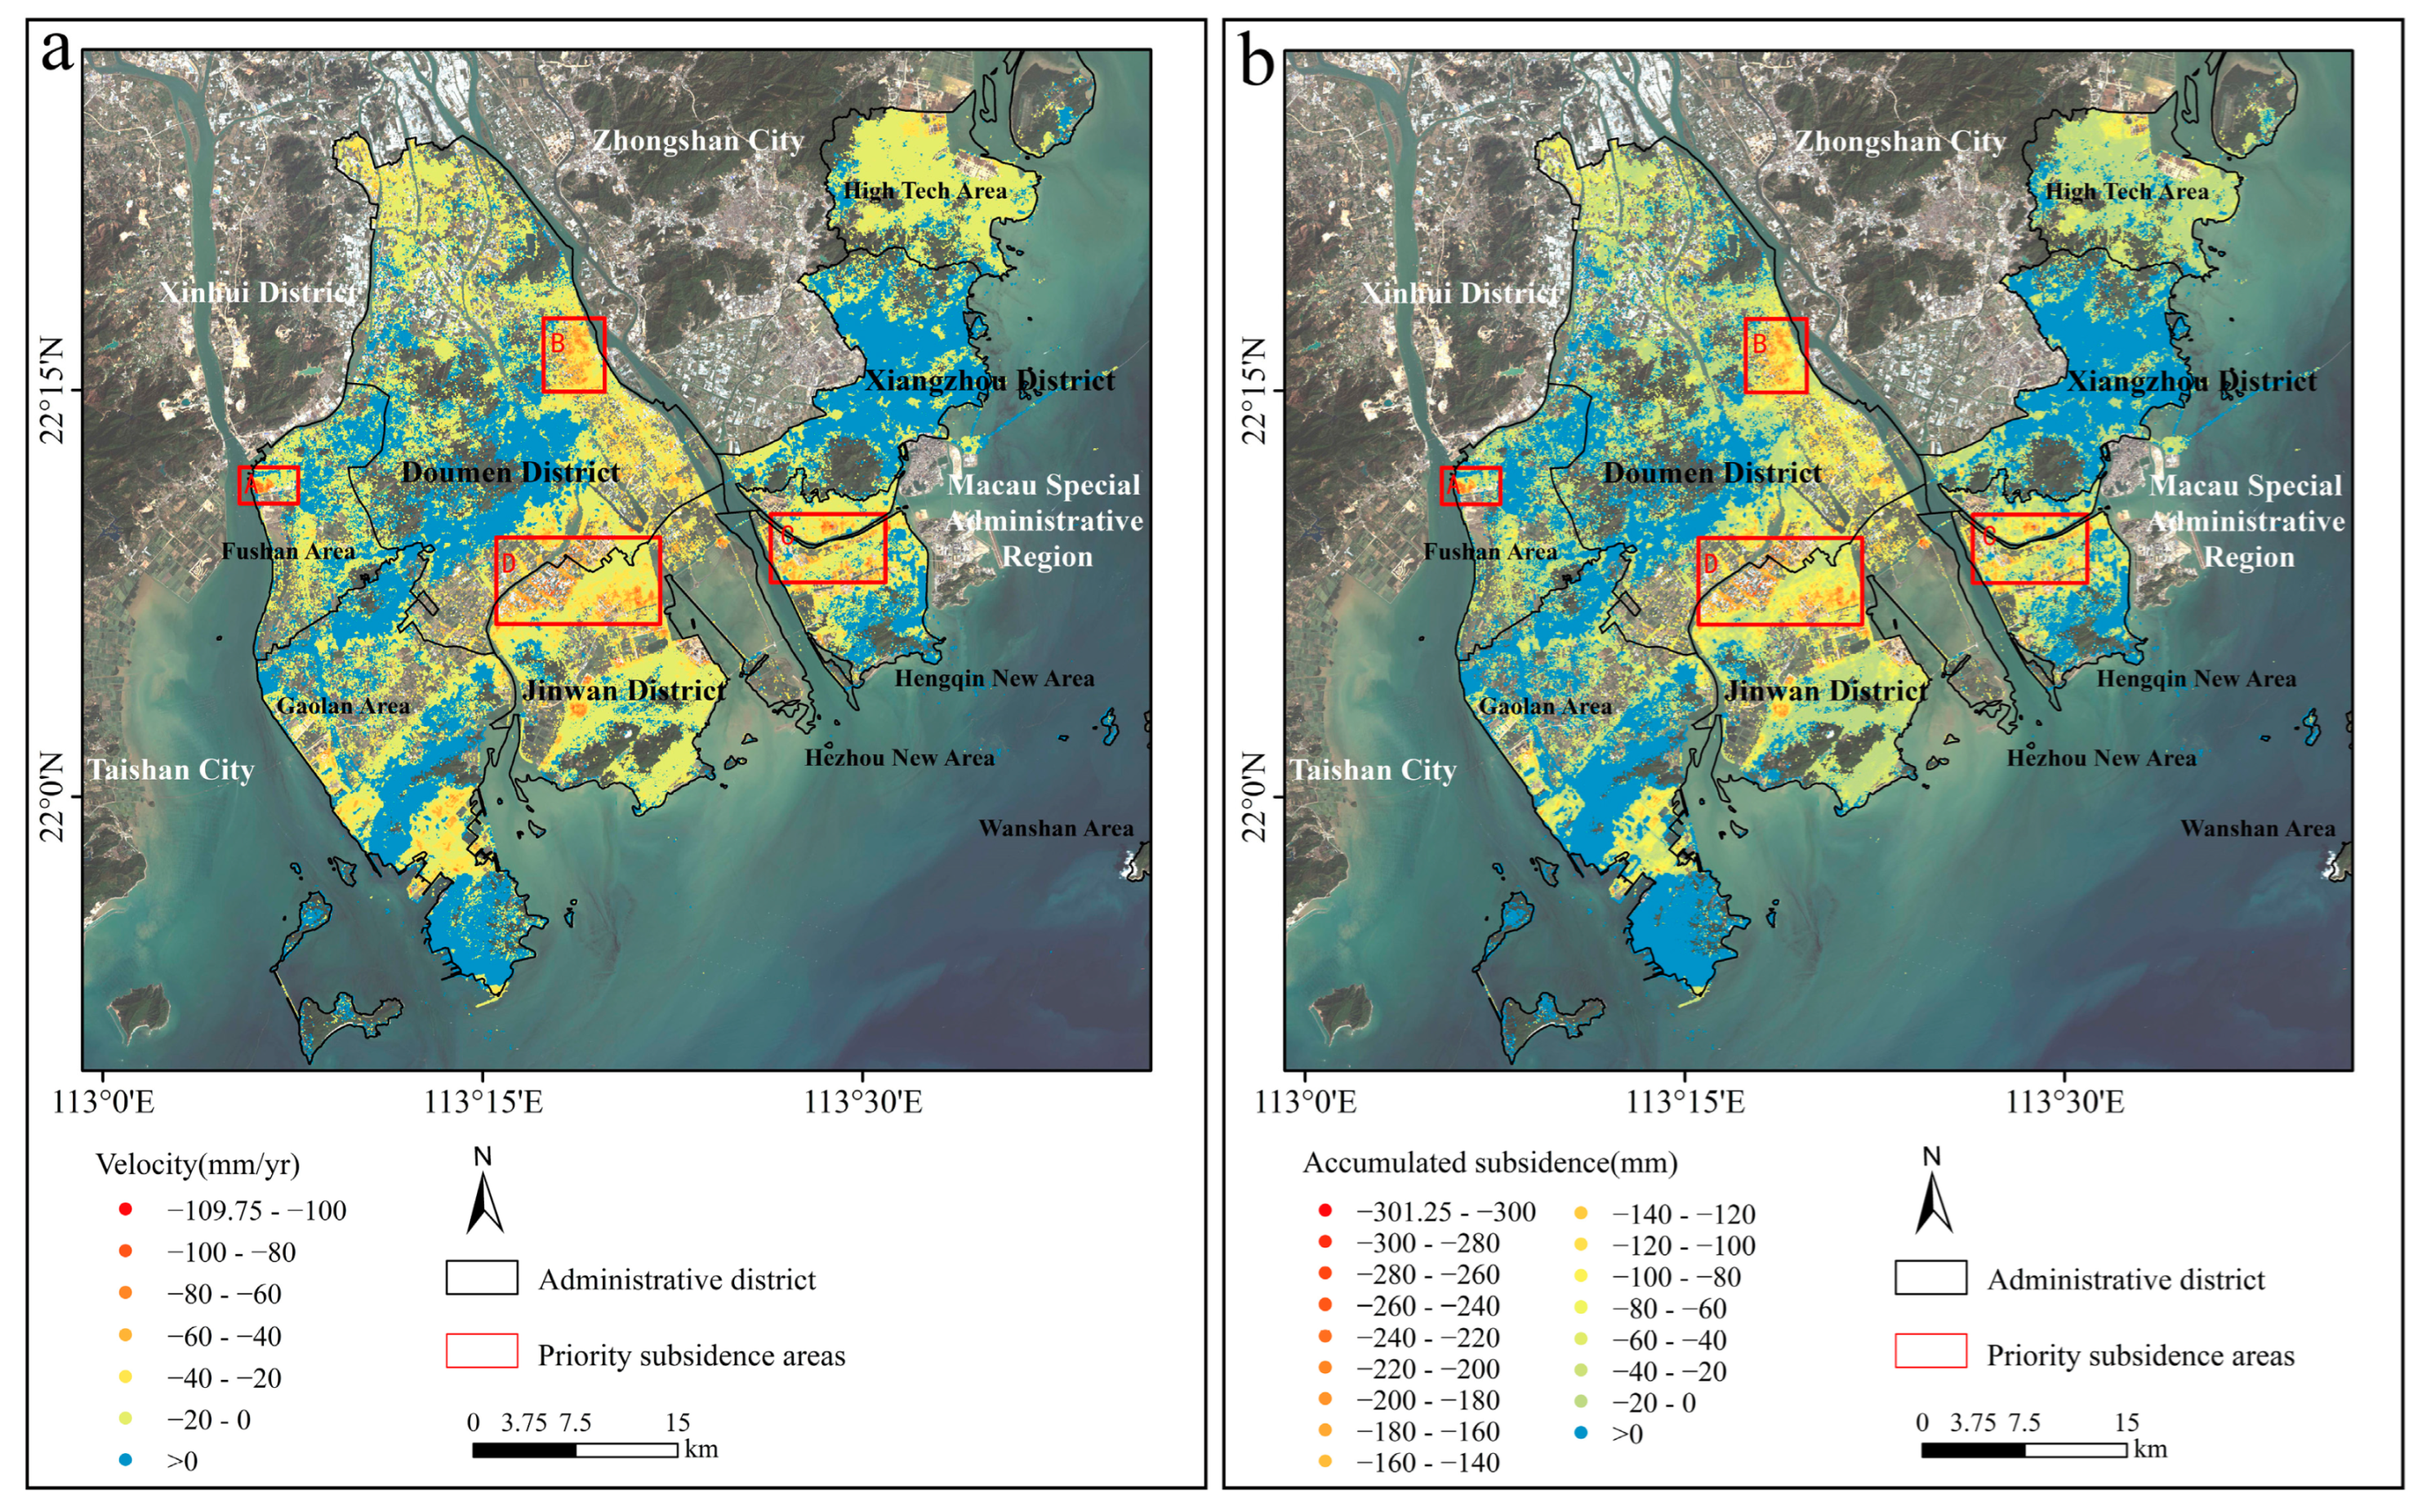
The average value of the subsidence rate in Zhuhai was −4.52 mm/yr (negative values indicate land subsidence, positive values indicate land uplift) between 20 August 2016 and 18 June 2019, and subsidence was widespread. The superimposed effect of sea level rise and land subsidence has gradually increased the potential threat of natural hazards such as flooding in the study area [36,37]. According to the Ground Settlement Interference Radar Data Processing Technical Regulations (No. DD2014-11) (Table 1), the subsidence rate registered at more than 90% of the monitoring sites is <30 mm/yr, indicating that the overall land subsidence severity was low in Zhuhai. However, the extent of subsidence in the northeast of Hezhou New District cannot be ignored, as revealed by the maximum land subsidence rate of −109.75 mm/yr (Figure 4a).
From 20 August 2016 to 18 June 2019, the mean value of cumulative subsidence is −11.41 mm and the maximum value is −301.25 mm (Figure 4b). The maximum cumulative subsidence happened in areas where the maximum subsidence rate was observed. The results indicate that land subsidence in Zhuhai was spatially uneven, with four subsidence centers located in Fushan City (indicated by A below), Baijiao Town (indicated by B below), Hengqin New Area and Free Trade Zone (indicated by C below), and Hongqi Town and Jingan Town (indicated by D below).

3.1.2. Time-Series Evolution Characteristics

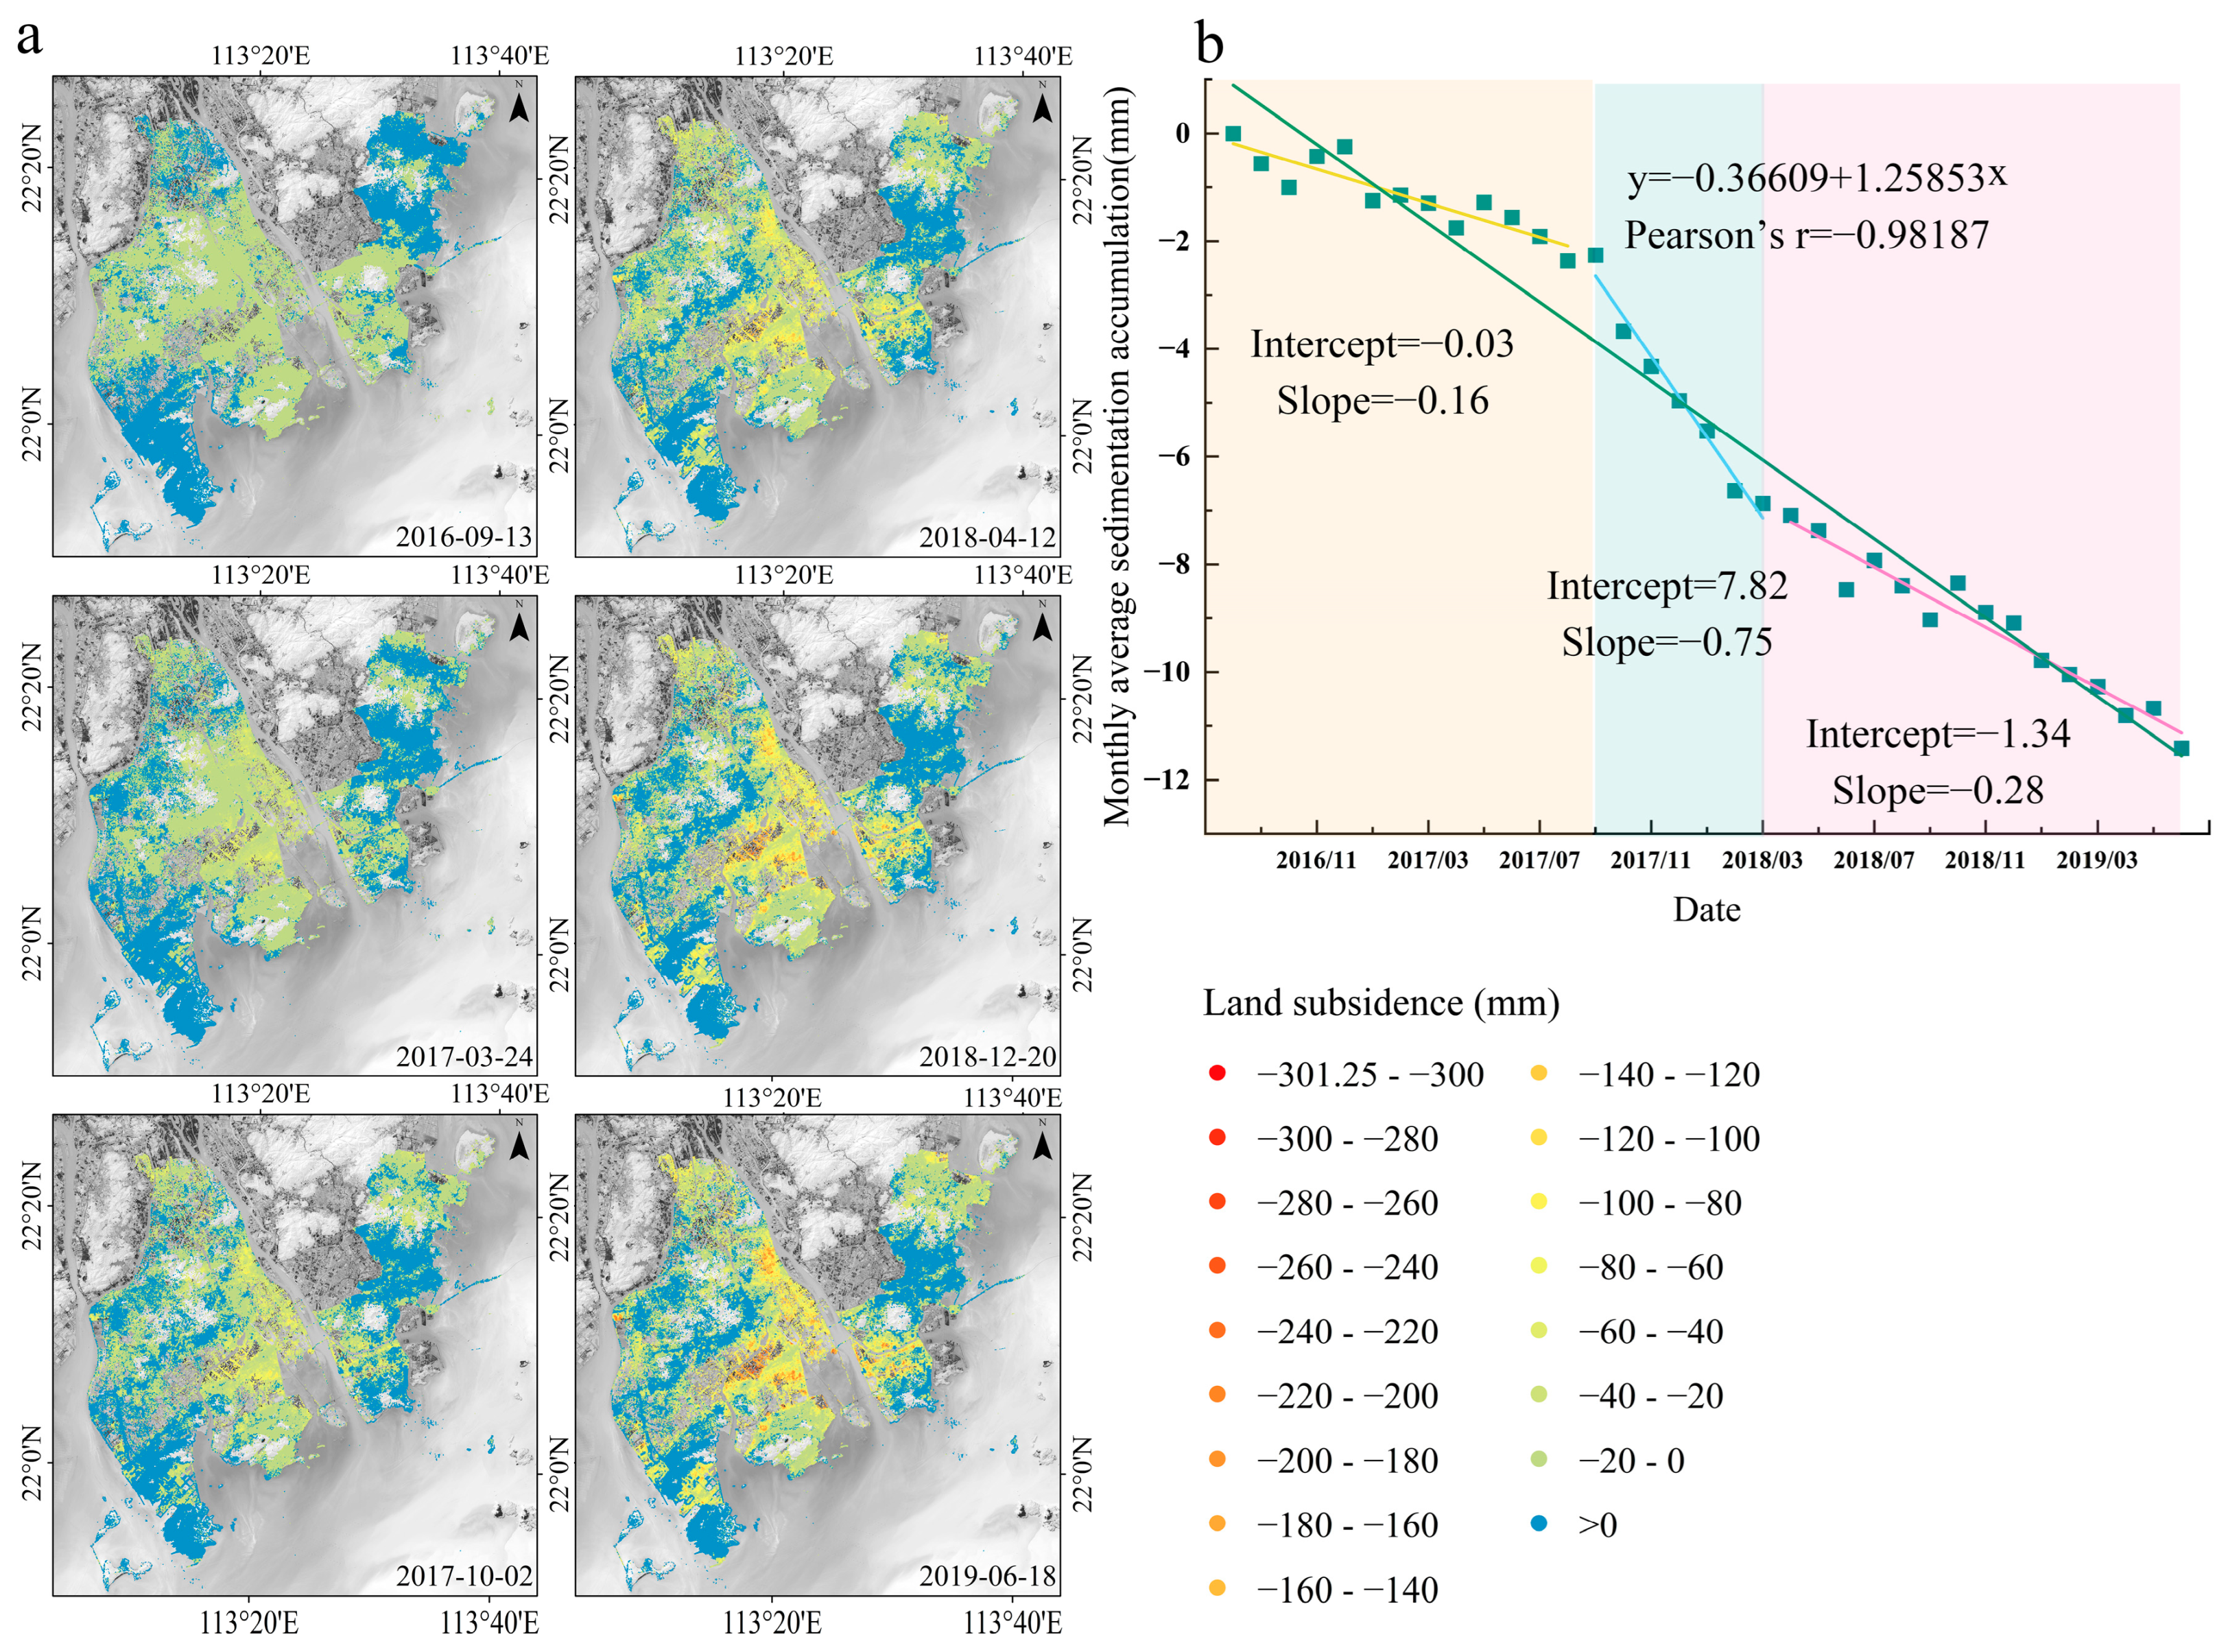
The monthly mean values of cumulative subsidence in Zhuhai were extracted and processed by linear fitting to obtain the time-series variation of subsidence in Zhuhai. The slope of the linear fitting result over the study period is about −0.37, and the Pearson correlation coefficient is about −0.98, which is a good fit (Figure 5b). Figure 5b shows that the land subsidence in the study area during the study period can be divided into three stages: the period before September 2017 belongs to the first subsidence stage, and the cumulative subsidence is within −2 mm and showed small ascending or descending changes in the ground; the period from September 2017 to March 2018 belongs to the second subsidence stage, and the subsidence rate increases sharply; the period after March 2018 belongs to the third settlement stage, the subsidence rate is faster than the first stage, and the average value of accumulated subsidence steadily increased to −11.41 mm. Setting 20 August 2016 as the 0 mm starting point, Figure 5a shows that four anomalous subsidence areas in Zhuhai developed and gradually formed subsidence centers from March to October 2017. Zhuhai City experienced a process of extremely slow to rapid to slow subsidence, which was due to its geographical location and geological structure. However, the impact of urban construction activities [38], land reclamation projects [39], and groundwater exploitation activities [40] at different stages of the study period was more significant and controllable in terms of subsidence prevention and control.
We found that the average subsidence rate of Zhuhai was smaller than the Ganges–Yarlung Tsangpo–Meghna Delta in South Asia (−7.5~−5.5 mm/yr) and much smaller than that of the Mekong Delta in Southeast Asia (−4~−1 cm/yr) [41,42], but similar to areas of severe coastal land subsidence in China, such as the Beijing–Tianjin–Hebei region represented by Beijing and Tianjin (maximum subsidence rate of about −120 mm/yr in 2012–2018) and the Yangtze River Delta region represented by Shanghai (average subsidence of about −2 mm/yr in 2013–2020) [43,44]. This indicates that, in terms of Asian coastal deltas, the current state of subsidence is most severe in Southeast Asia, followed by South Asia, and least in East Asia, while the trend of subsidence in East Asia is gradually coming to the fore. If the current intensity of human activities continues to be imposed, an average land subsidence of about 0.14 m is expected to occur in Zhuhai by 2050, which greatly exacerbates the possibility of inundation.

3.2. Exploration of Subsidence Trigger Factors

3.2.1. Fracture Structure and Land Subsidence

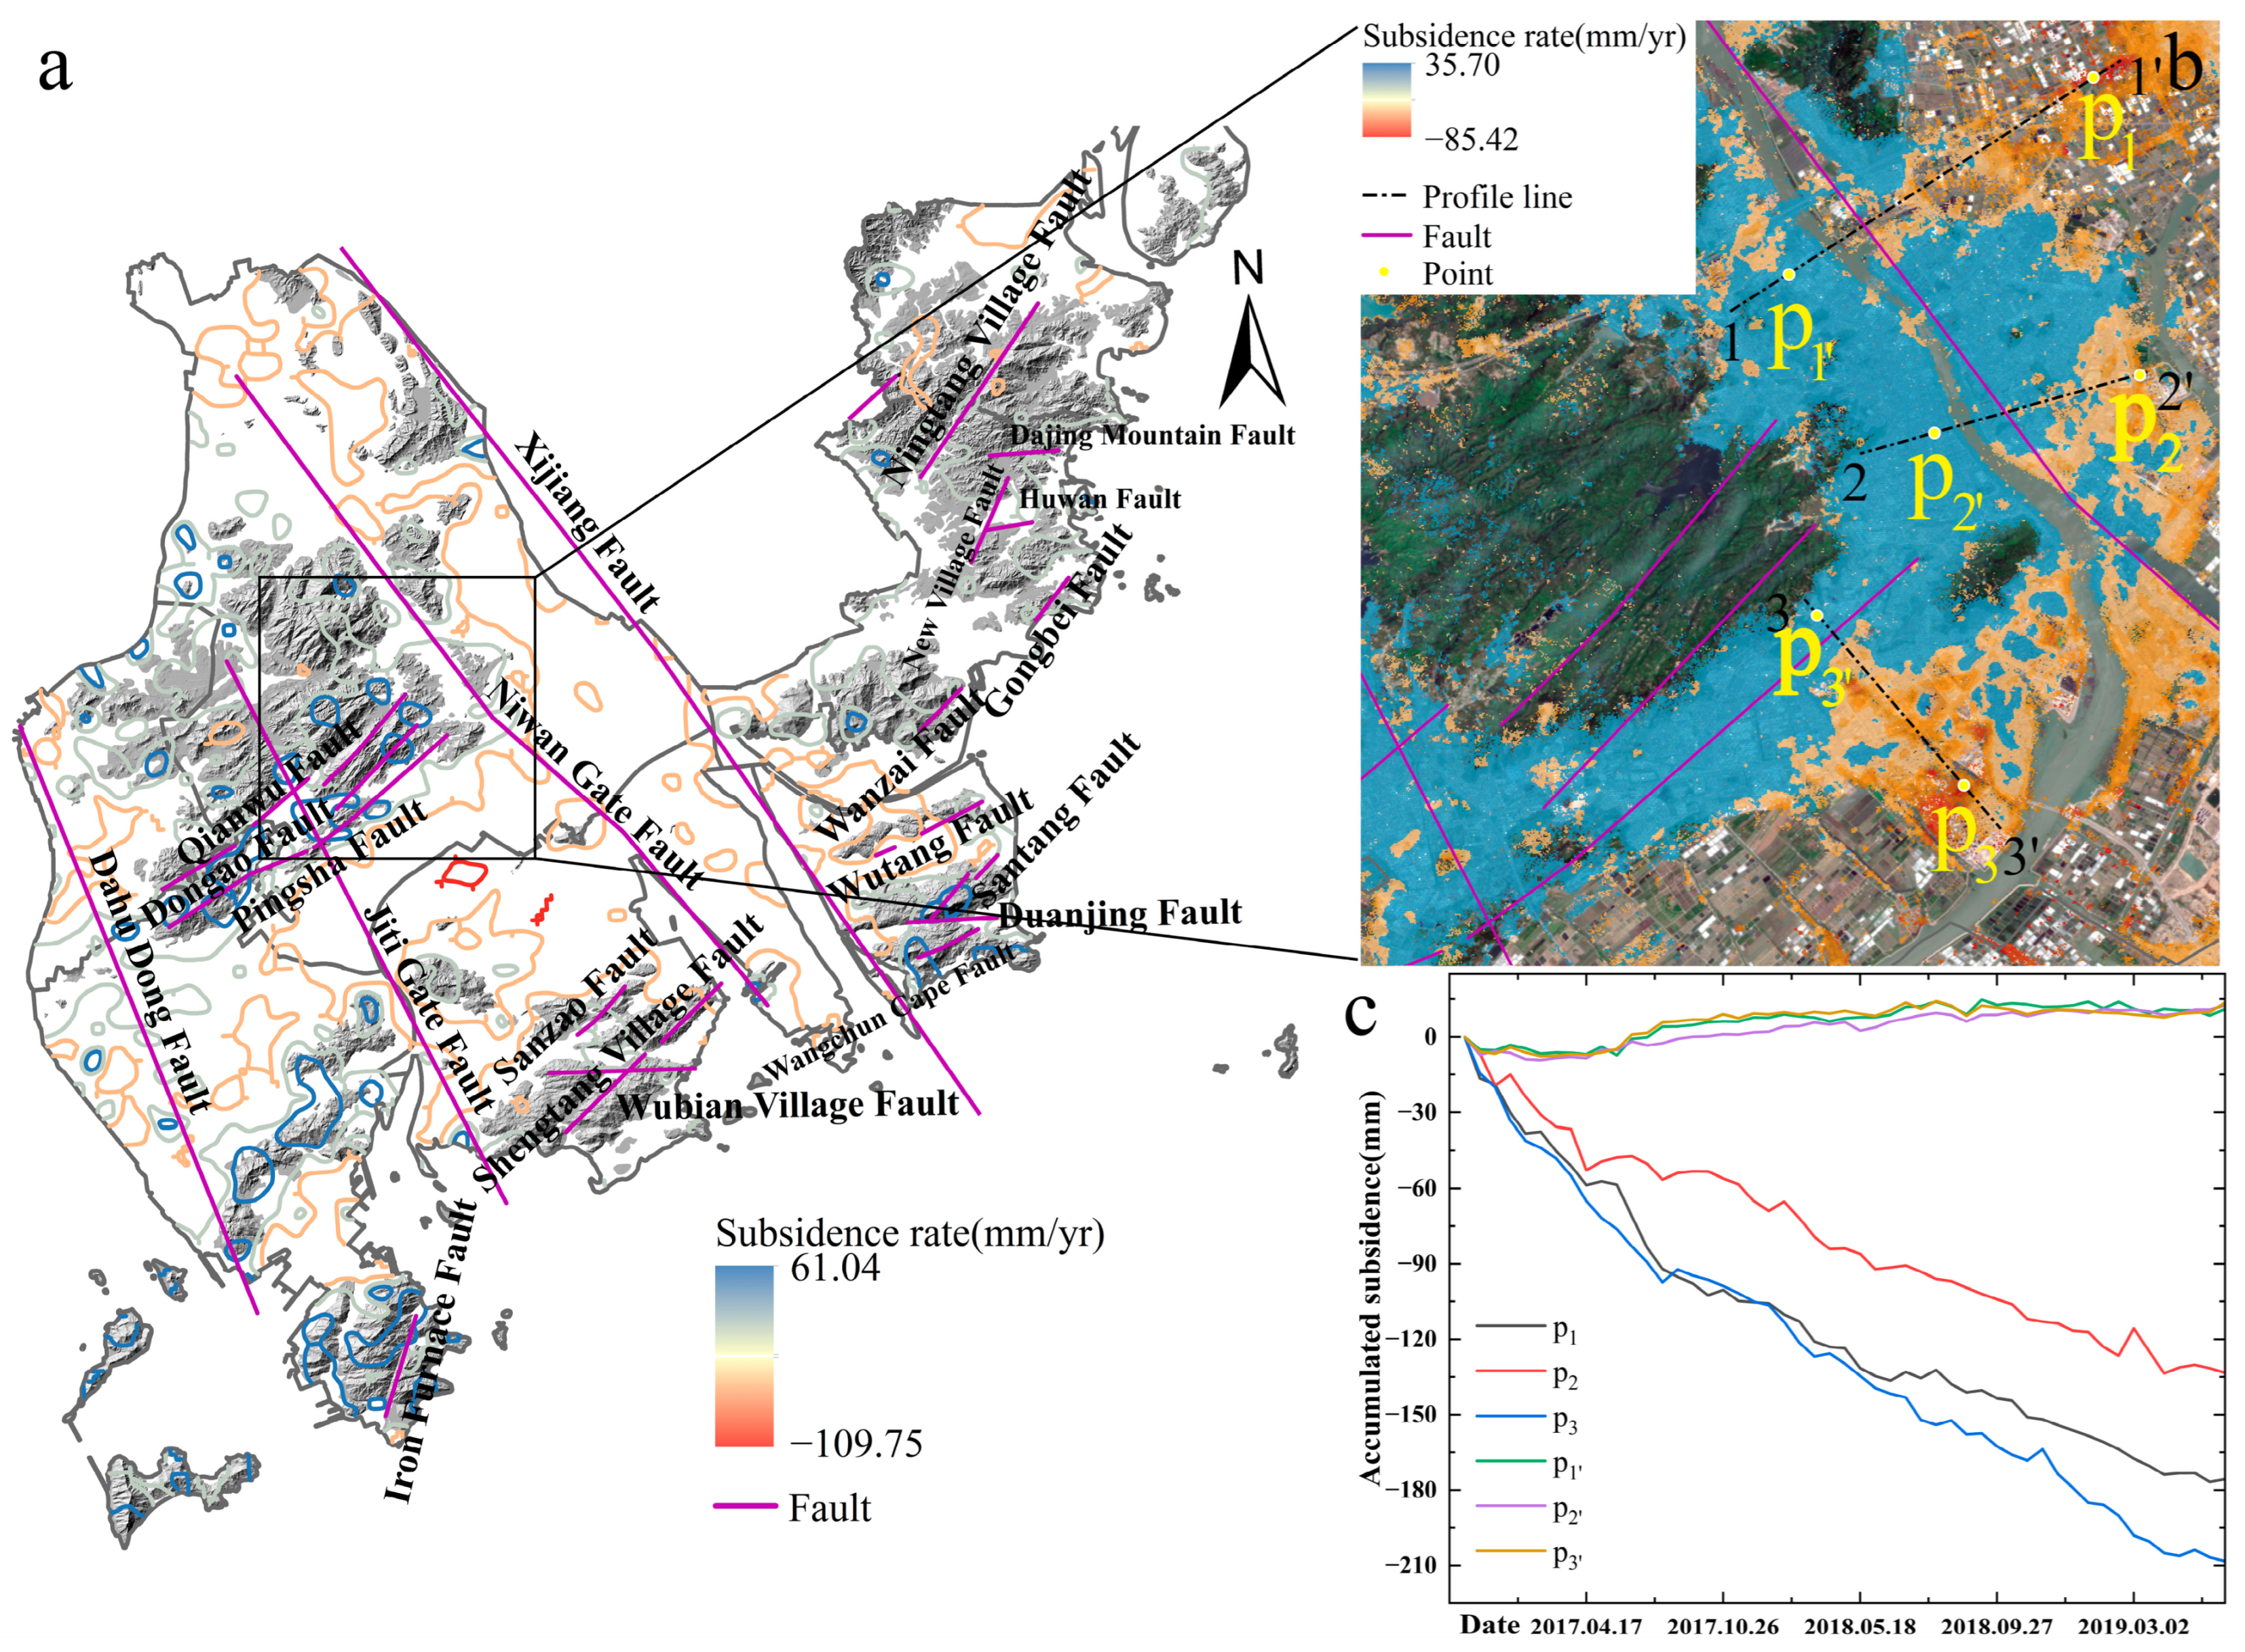
Zhuhai is at the intersection of the second uplift zone of the Chinese New Huaxia System, the South Ridge latitudinal tectonic zone, and the regional east-west tectonic zone of Hainan. Several north-east and north-west faults occur within the region. This geological background causes a complex geological environment and frequent geological hazards in Zhuhai (Figure 6a). To investigate the relationship between geological structures and land subsidence, the typical Niwan Gate Fault and Pingsha Fault, as well as SBAS-InSAR monitoring points on both sides of the faults, were selected for analysis in this study (Figure 6b). We made 1-1′ and 2-2′ profiles across the Niwan Gate Fault and 3-3′ profiles across the Pingsha Fault, and extracted the typical monitoring points p1, p1′, p2, p2′, p3, and p3′ on the three profiles, respectively, to investigate the time series variation (Figure 6c). We found that p1′, p2′, and p3′ were in the uplift zone, showing roughly 15 mm of uplift, and the ground fluctuation of these three points was consistent and small during the study period. However, p1, p2 and p3 were in the subsidence zone, and there were large differences in the cumulative ground settlement at these three points, with the largest settlement of 208.33 mm at point p3, which was located on the southeast side of the Pingsha Fault. It is difficult to avoid that the high vegetation cover of the mountainous areas makes it impossible to achieve full coverage of the area by InSAR monitoring points, and ground subsidence can only be monitored at the foot of the mountain or at the hillside with low vegetation cover. In addition, SBAS-InSAR monitoring results often show surface uplift at high elevations (such as the surface uplift area in the northeastern part of the Niwan Gate Fault and the southeastern part of the Pingsha Fault). We conclude that differences in surface deformation occur on both sides of the faults, and that the effect of ground subsidence is more significant compared to surface uplift, so we infer that the upward and downward plate lifting movements of geological faults may produce different degrees of ground uplift changes, especially amplifying effects on ground subsidence.
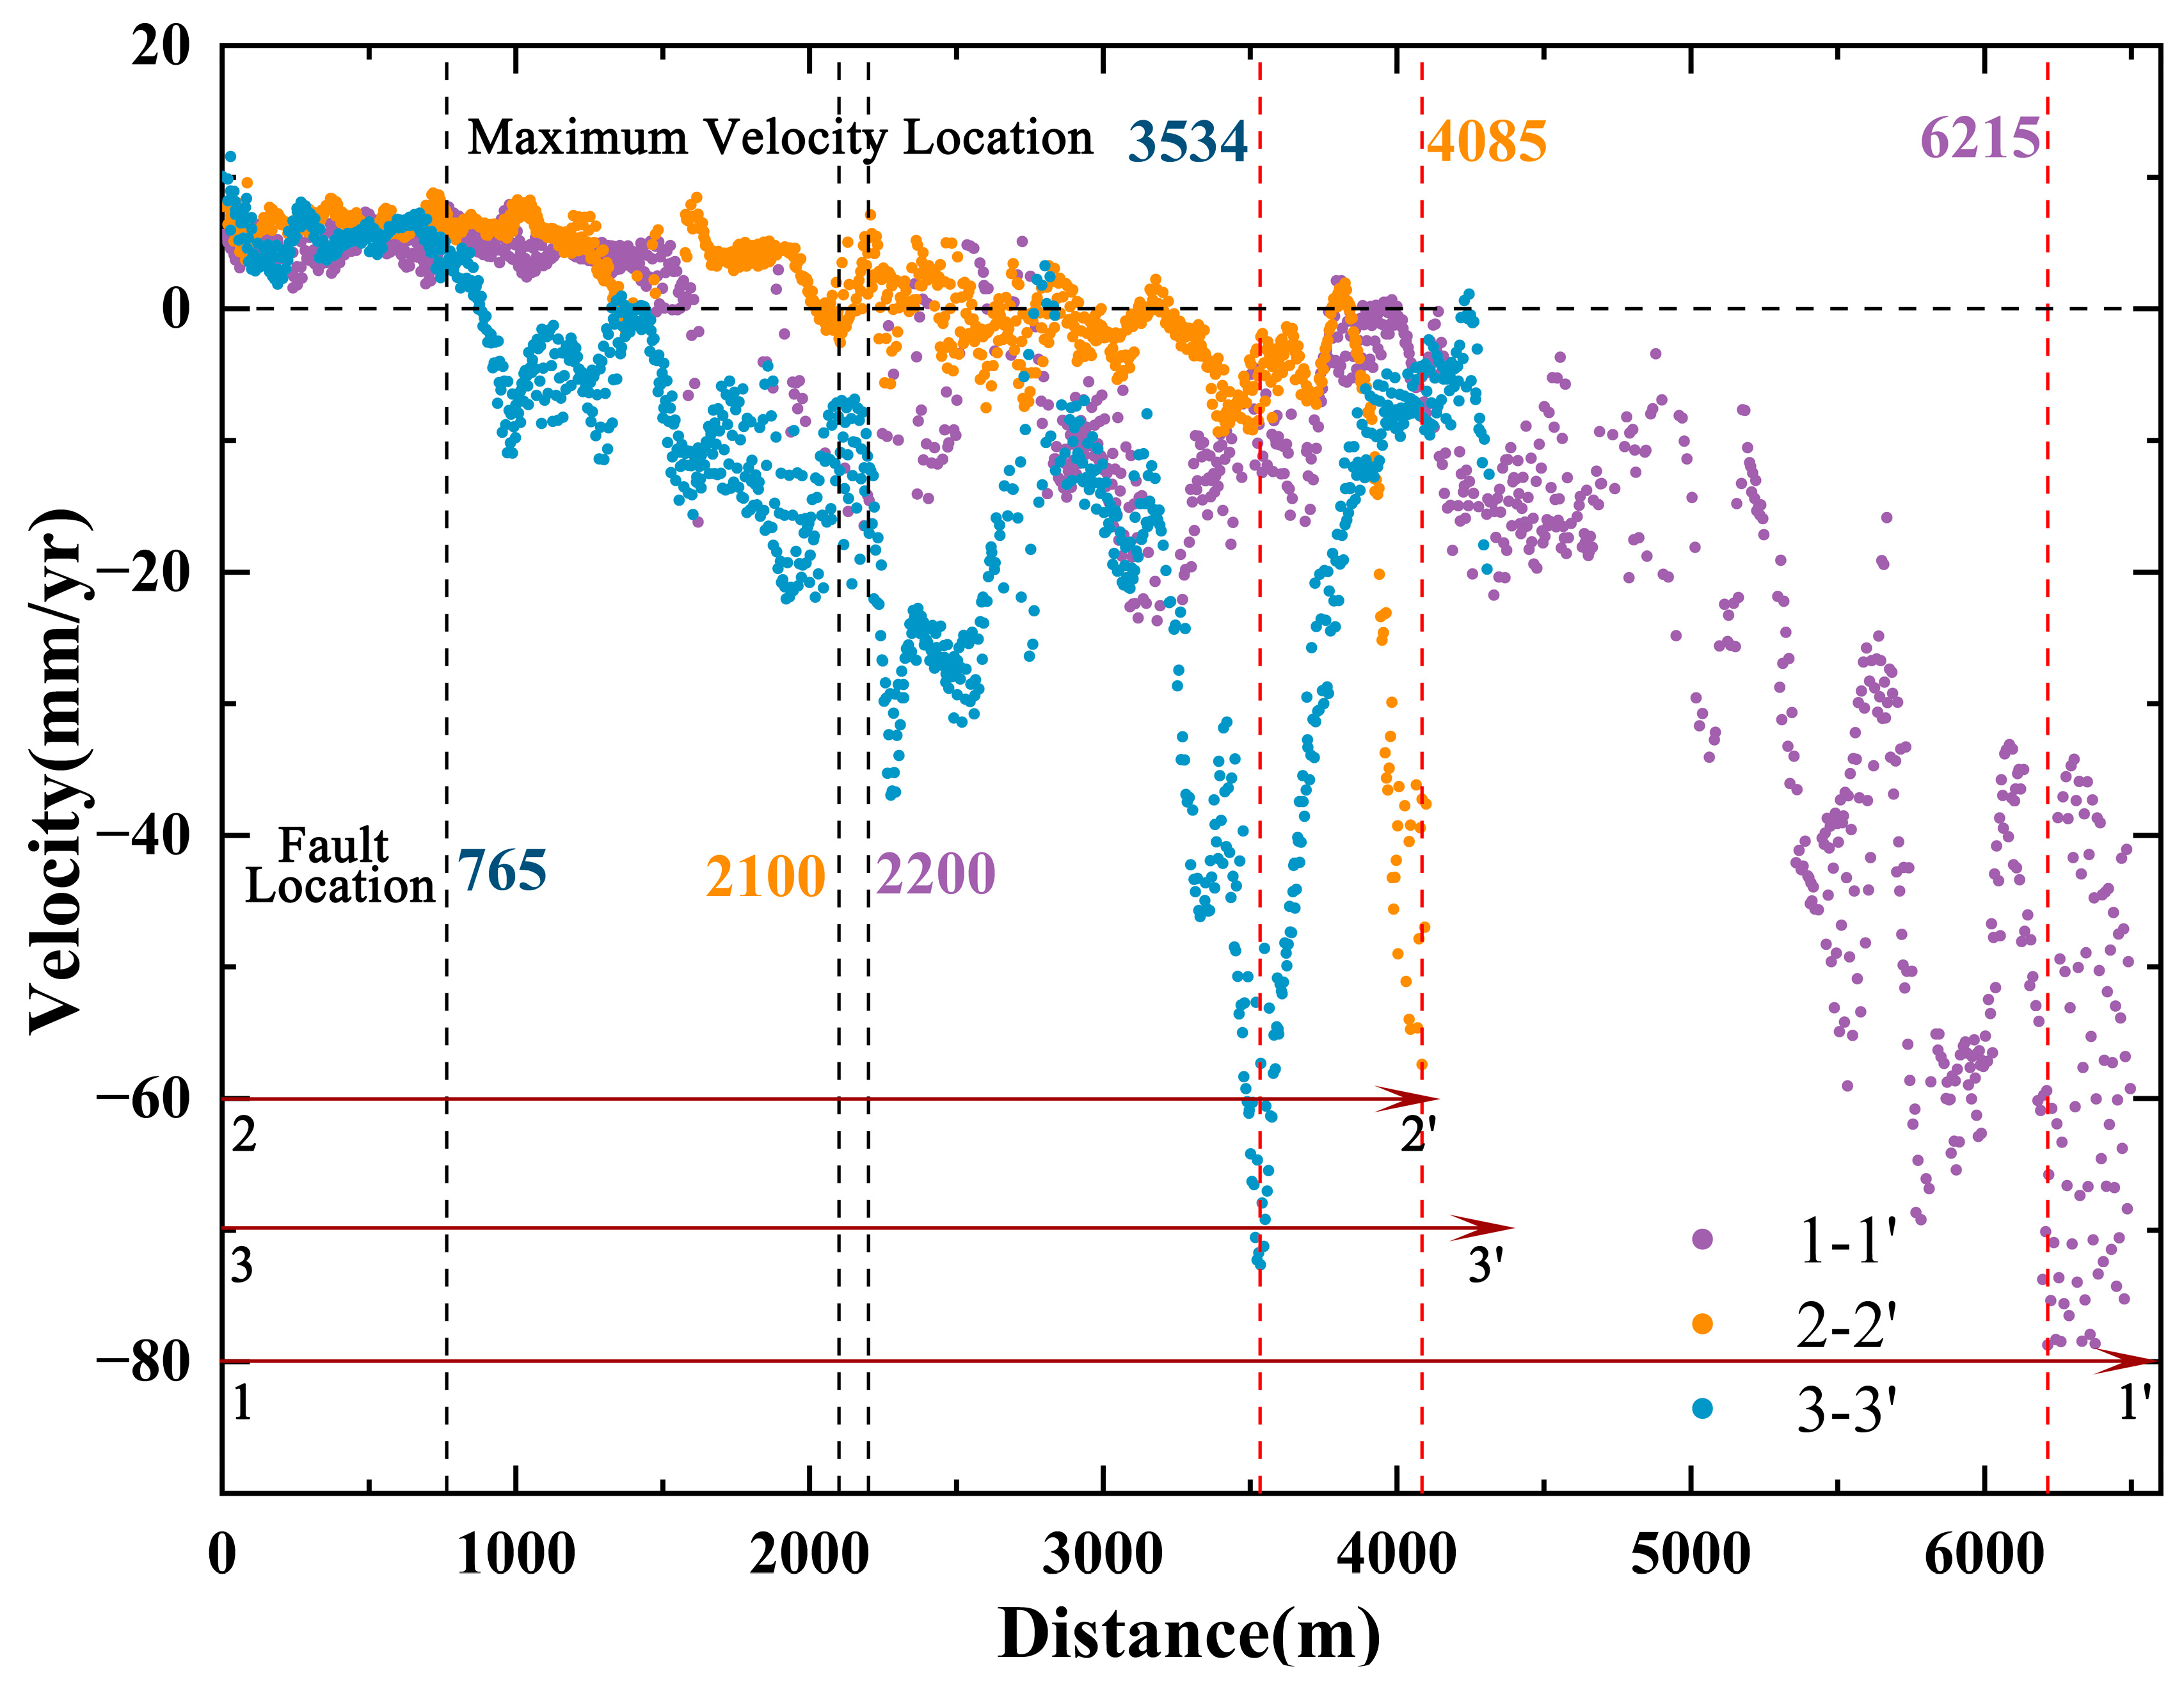
Profiles 1-1′, 2-2′ and 3-3′ reached the fault location at 2200 m, 2100 m and 765 m, respectively, and the settlement rate changed sharply before and after the fault location (Figure 7). Specifically, with the fault as the boundary, the surface deformation had small fluctuations and was mainly uplifted in the early stage; the settlement rate climbed significantly in the later stage, and reached the maximum settlement rate of −80~−60 mm/yr at 6125 m, 4085 m, and 3534 m, respectively. The results also confirm our previous inference that tectonic faults aggravate the variability of surface deformation and amplify the effect of ground subsidence. Burbey suggested that the possibility of ground fractures became larger when the fault was of low permeability, and the damage to the city increased accordingly [45]. Since Zhuhai is different from other coastal cities in China, the geological conditions are particularly complex, so special attention needs to be paid to the effects of faults in fracture zones when carrying out urban geological disaster prevention and control of ground subsidence [46,47,48].

3.2.2. Soft Soil Thickness and Land Subsidence

In Zhuhai, owing to the influence of sea retreats and sea intrusions in the historical period, there are Quaternary deposits mainly in marine and coastal phases distributed in a large area [49]. Coupled with the large scale of land reclamation, soft soils consisting of silt, silty soil, and soft clay are widely distributed in the area [50]. In this study, the soft soil of the Zhuhai stratum was analyzed, and six soft soil thickness levels of <5 m, 5~10 m, 10~20 m, 20~30 m, 30~40 m, and >40 m were set. The spatial distribution of soft soil thickness in Zhuhai was uneven, and the soft soil with a thickness >20 m was concentrated in Hezhou New Area, the alluvial plain area in the north (east) of Jinwan District, and the area along the eastern side of Doumen District near the Modao Gate Waterway (Figure 8a). The spatial superposition analysis showed that the above areas were highly coincident with the subsidence areas of B and D. In Hengqin New Area, the thickness of soft soil along the Maliuzhou Waterway changed sharply to the north and south, which causes great potential disturbance to the ground elevation’s rise and fall. It was found that the soft soil area in Jinwan District (including Hezhou New Area) and Doumen District (including Fushan Area) accounted for 79.03% and 74.93% of the area of the district, respectively, and the two districts covered a wide area of soft soil and had significant land subsidence compared to other areas (Figure 8c). Subsequently, we extracted the subsidence monitoring points in different soft soil thickness areas and calculated their average subsidence rate and average cumulative subsidence correspondingly, then carried out correlation analysis on the thickness of different grades of soft soil with the ground subsidence rate and cumulative ground subsidence respectively, and obtained an R2 of 0.96 and 0.92, indicating that there is a significant correlation between soft soil thickness and ground subsidence (Figure 8b). The study results confirm Tomas et al.’s conclusion that there was greater subsidence in areas with thicker soft soils [51]. In addition, soft soils are clayey soils with high natural water content, high compressibility, low bearing capacity, and very low shear strength, so it is essential to investigate the condition of groundwater extraction [52].

3.2.3. Groundwater Extraction and Land Subsidence

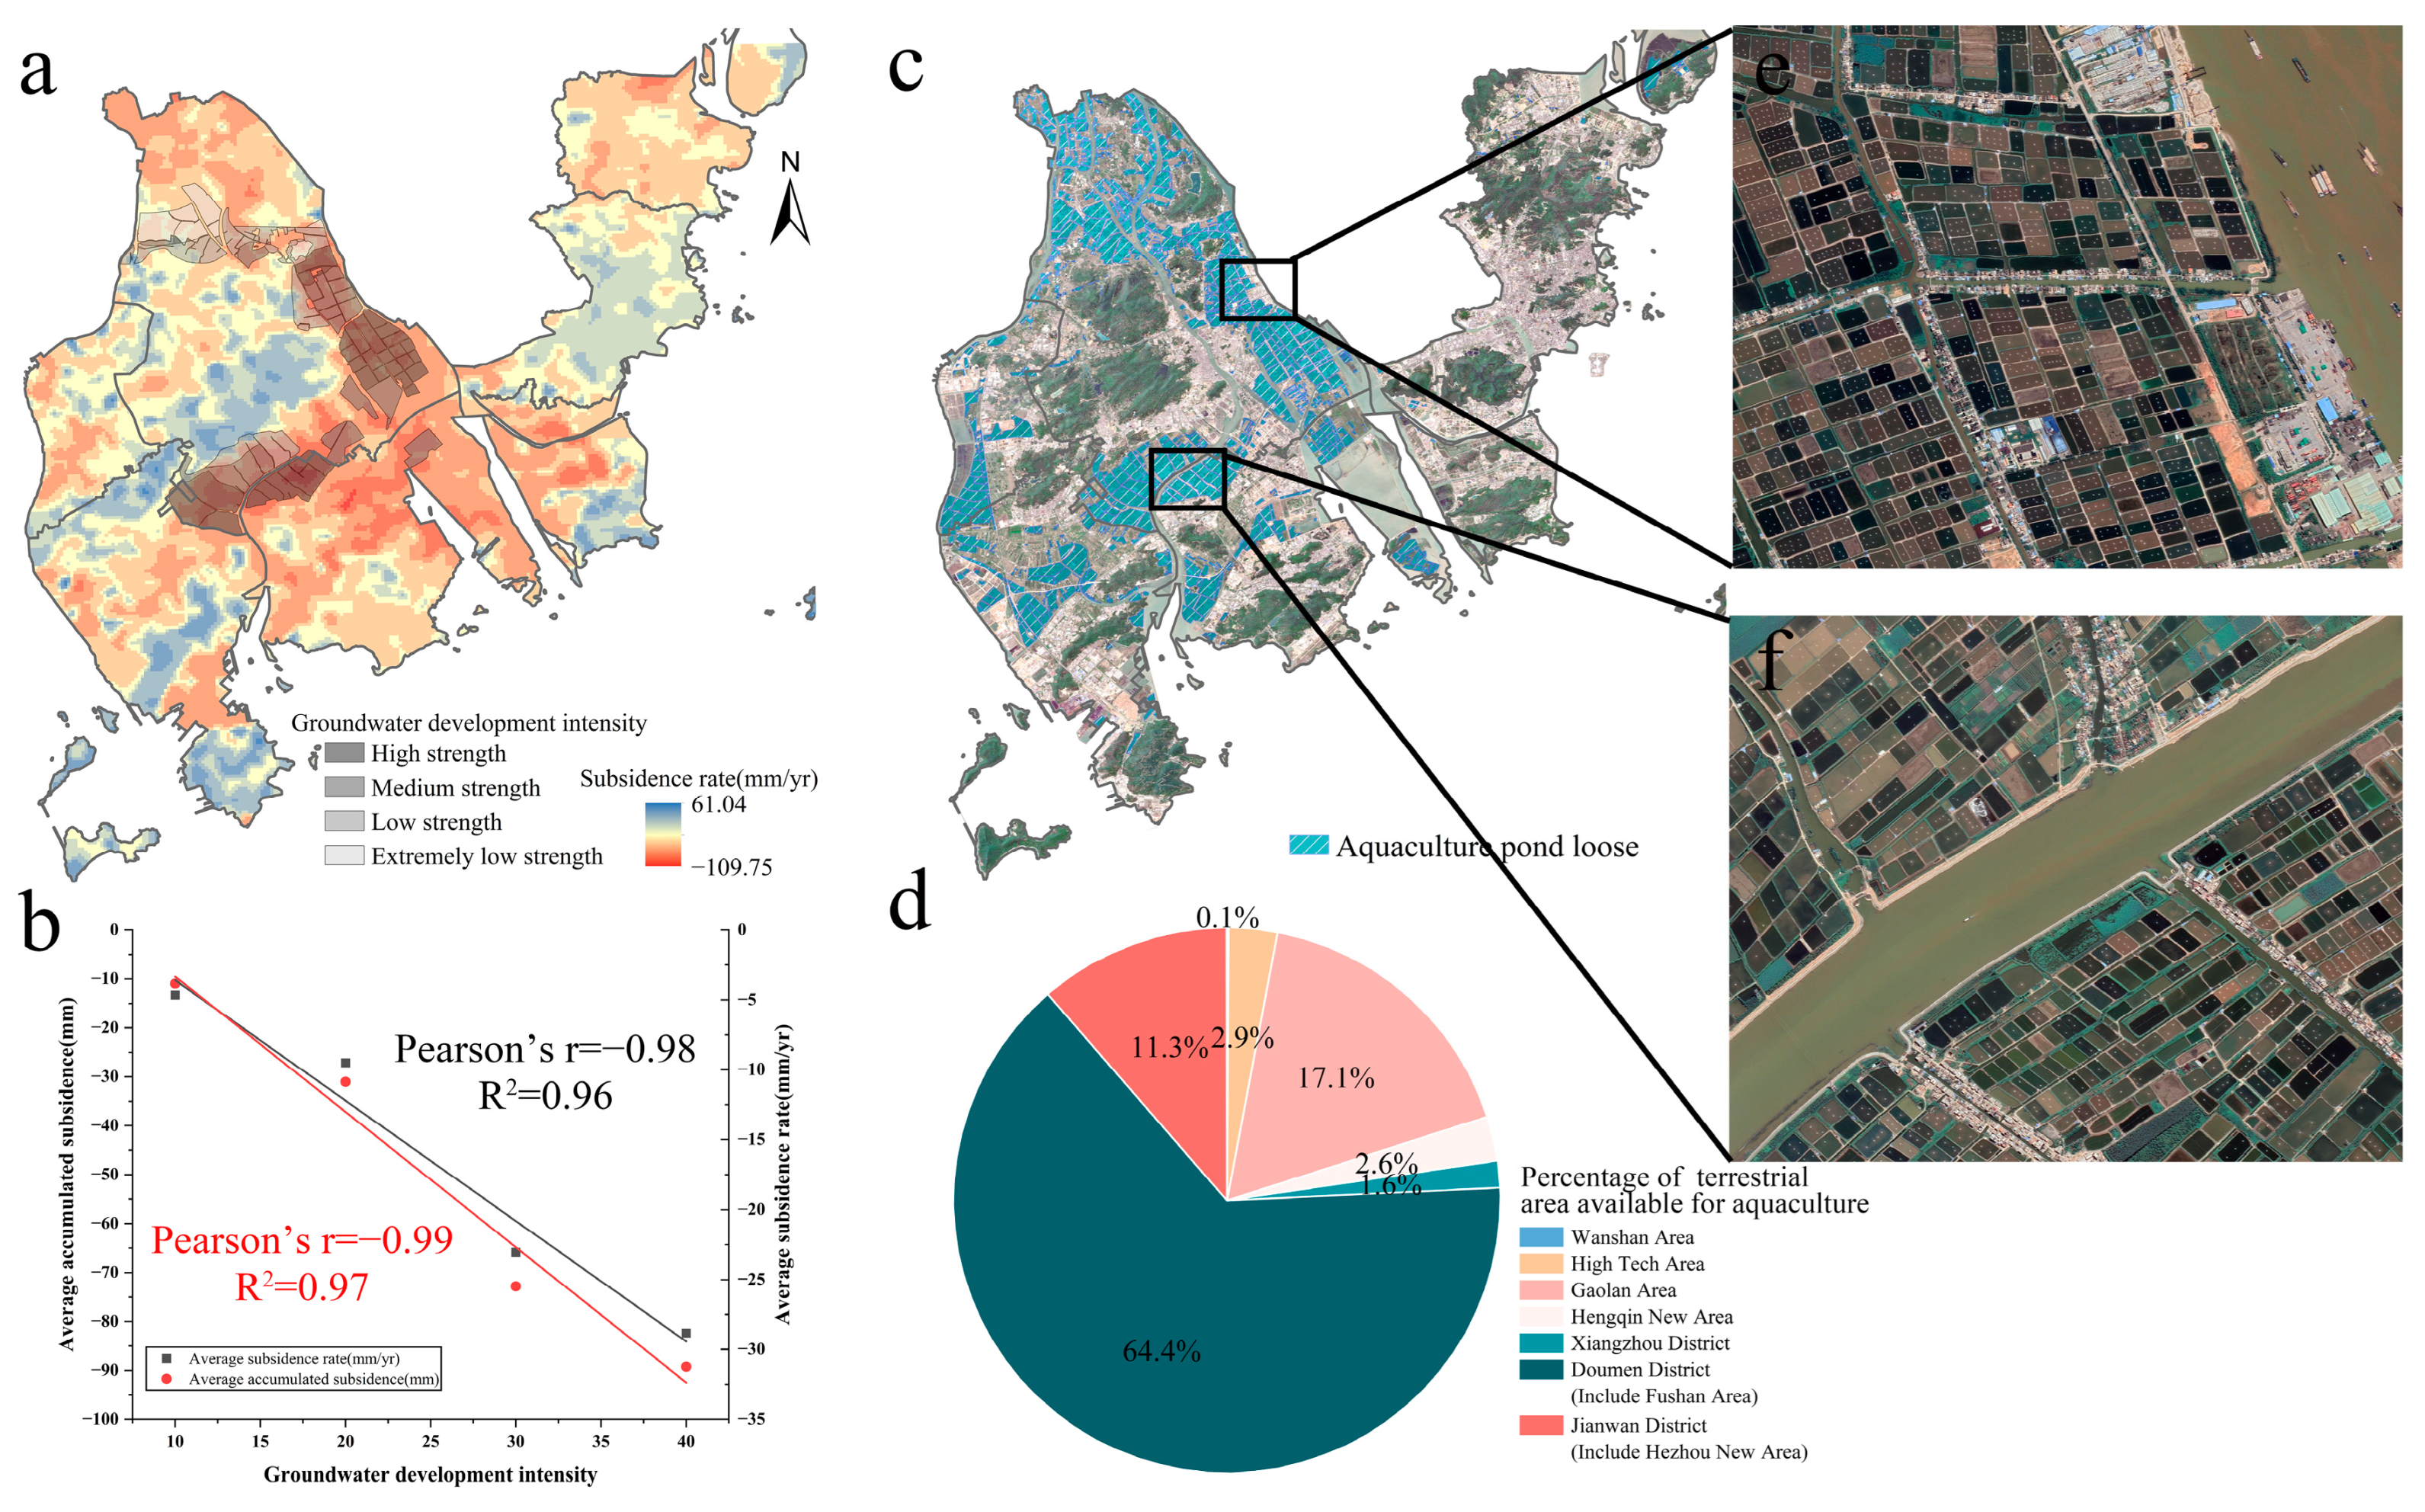
Based on its formation, endowment conditions, hydraulic characteristics, and hydrological properties, groundwater in Zhuhai can be divided into two major types: loose rock-like pore water and bedrock fracture water. The area with high strength of groundwater development intensity accounted for the largest proportion, 61.71 km2, which was mainly distributed along the Modao Gate Waterway and Jiti Gate Waterway, specifically in Hongqi Town, Jingan Town, and Baijiao Town, which coincided with the subsidence areas B and D of this study (Figure 9a). The area of groundwater development intensity from medium strength to low strength to extremely low strength was 44.14 km2, 34.08 km2, and 18.22 km2, in order. Groundwater development and utilization in Zhuhai shows a deficit overall, and a certain number of groundwater funnels are distributed. In this study, we extracted the subsidence monitoring points in areas with different groundwater development intensity and calculated their average subsidence rate and average cumulative subsidence correspondingly. We assigned weights ranging from 10 to 40 to different groundwater development intensities, and the higher the extraction intensity, the higher the weight, followed by correlation analysis with the subsidence rate and cumulative subsidence, respectively, which shows that the R2 is greater than 0.95, thus indicating that groundwater extraction intensity is significantly correlated with ground subsidence (Figure 9b). The results of Zhu et al. showed that the depth of groundwater level drop in Zhuhai City constituted a logarithmic function with the rate of land subsidence [23]. We investigated and learned that aquaculture was an important factor affecting the groundwater level in the study area. Groundwater levels can rise or fall in response to the type of organisms and culture patterns of local aquaculture [53]. Huang et al. [54] proposed that the net growth of aquaculture in Zhuhai was 5.2 km2 from 2015 to 2019 and still maintained the expansion trend. We deciphered the distribution of aquaculture areas from the high-resolution images (Figure 9c). The results of the spatial superposition analysis showed that there were large areas of aquaculture in the B and D subsidence areas (Figure 9d–f). Therefore, focusing on strengthening the regulation of the aquaculture industry and the reasonable protection and utilization of groundwater resources is of great importance to the prevention and control of land subsidence.

3.2.4. Atmospheric Precipitation and Land Subsidence

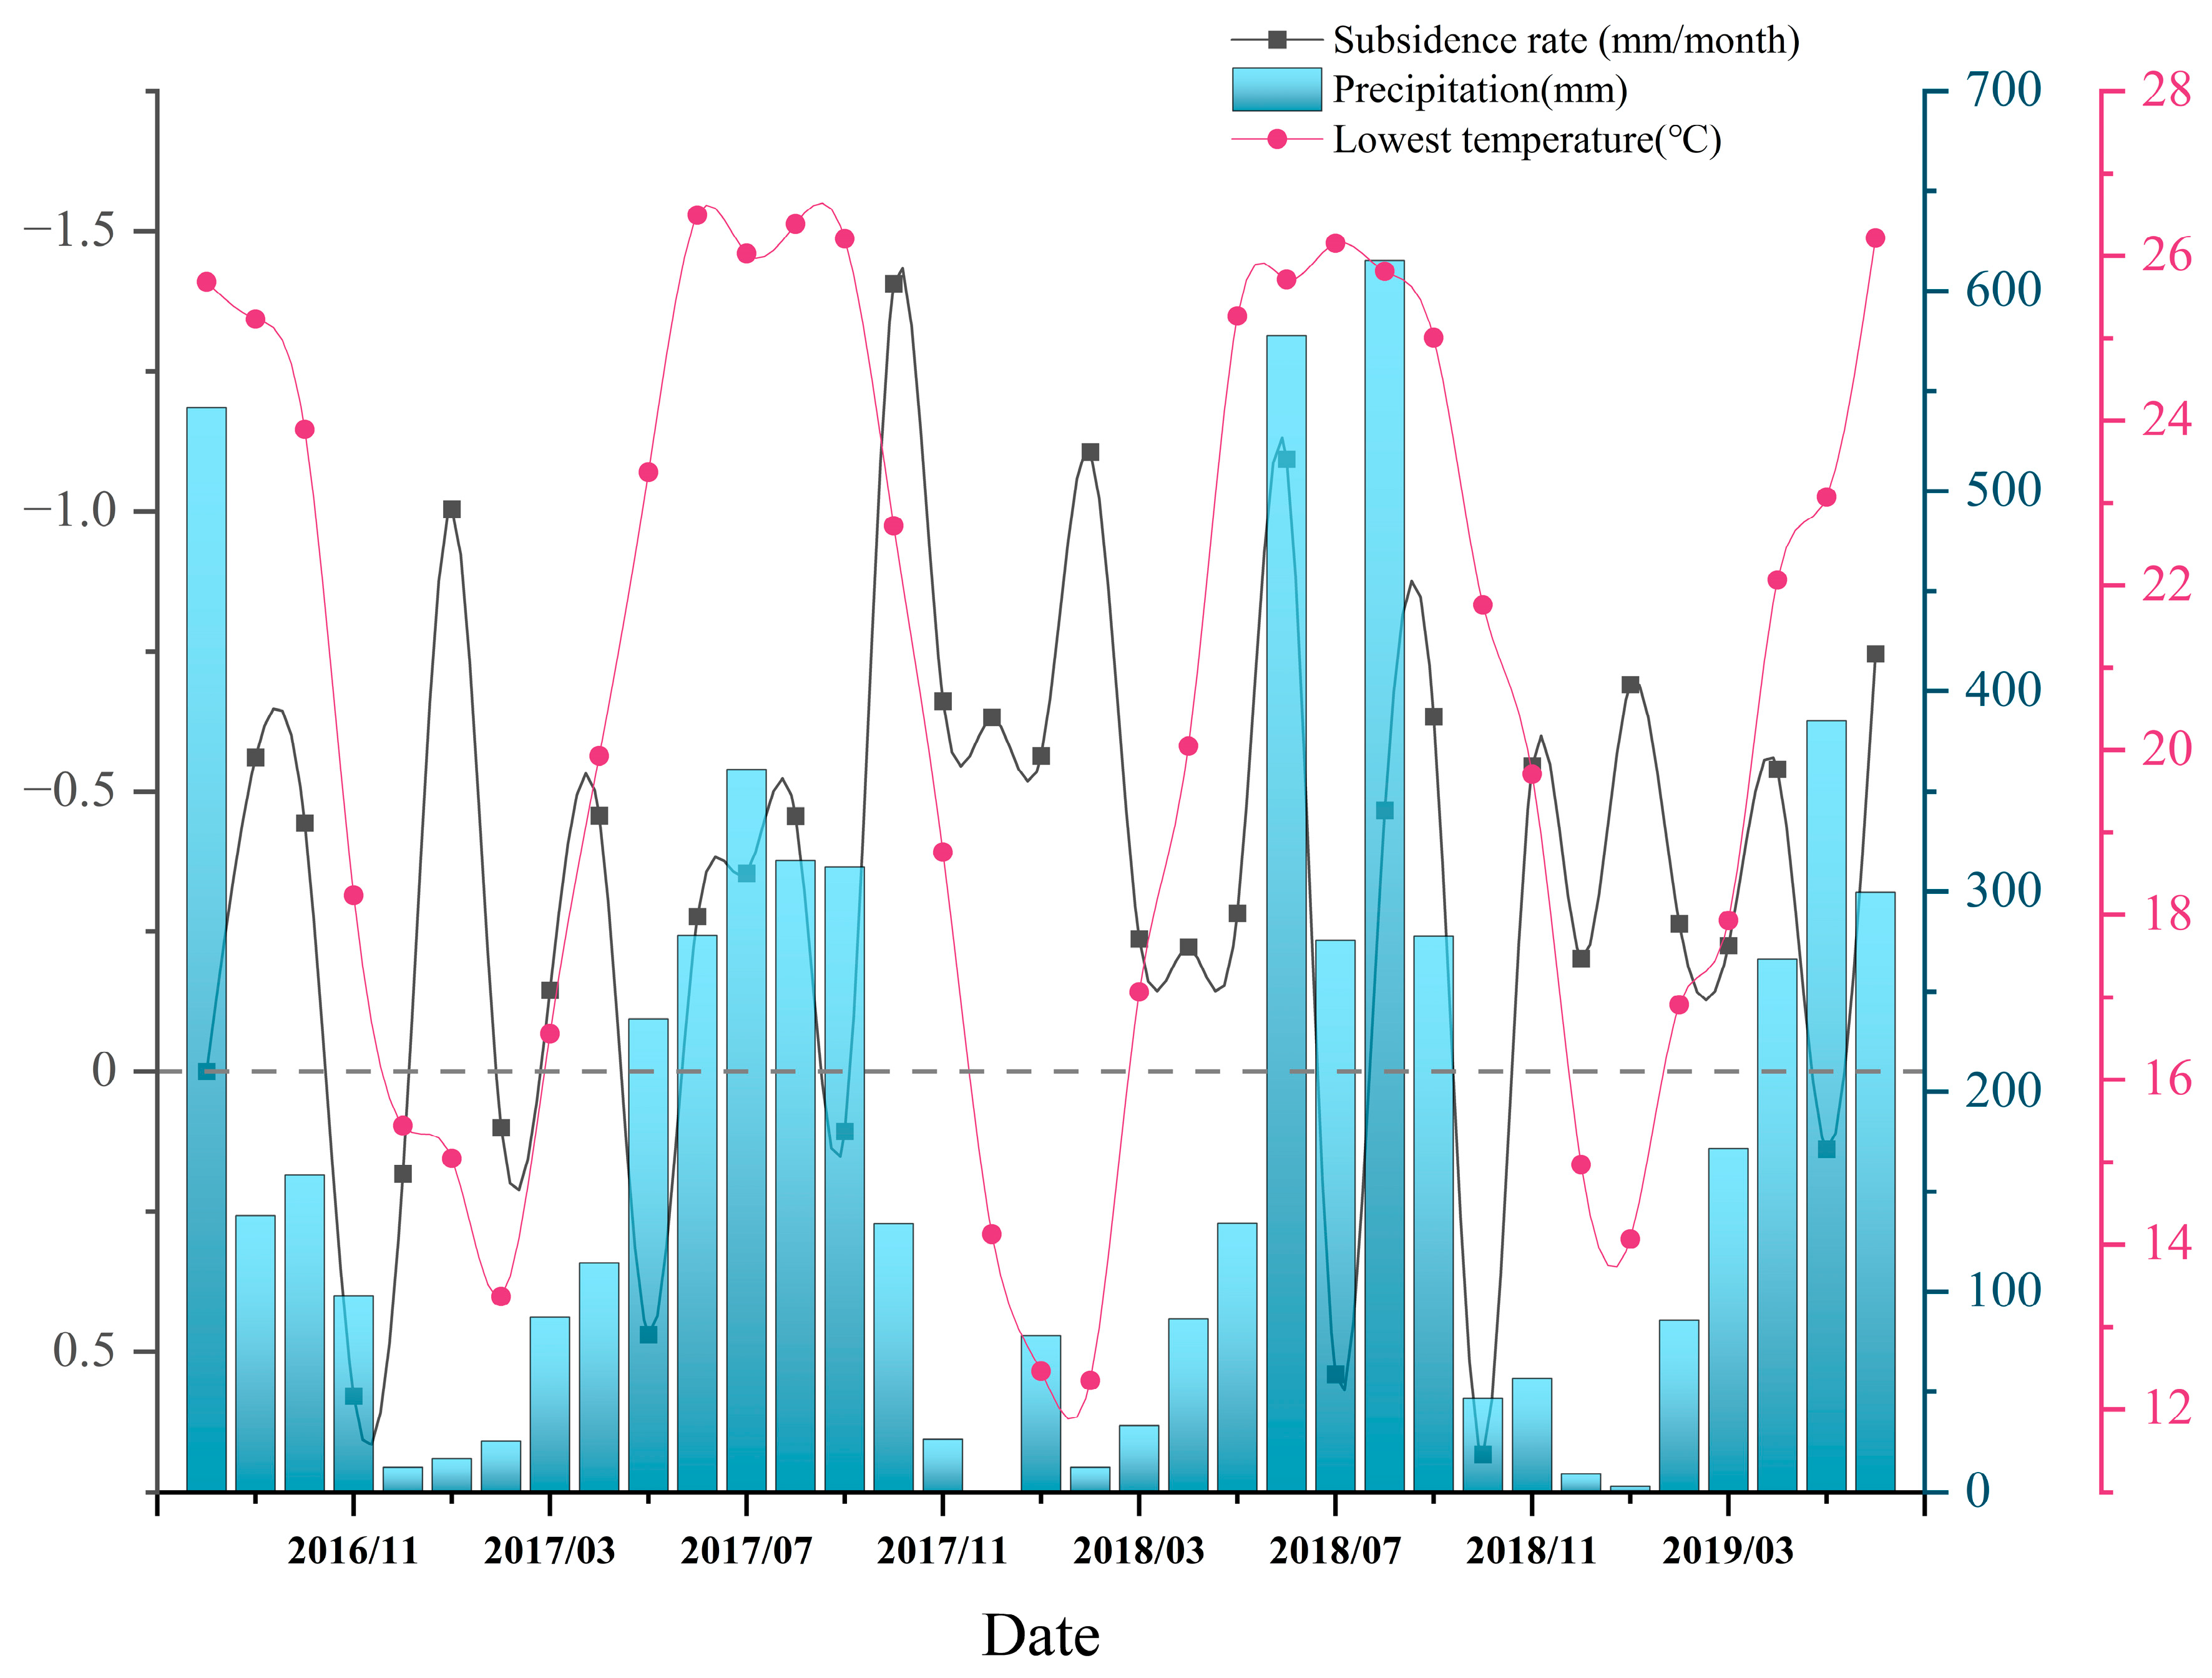
Zhuhai has a southern subtropical maritime monsoon climate, and there are two distinct rainy seasons throughout the year. From April to June, the pre-flood rainy season, rainfall is mainly affected by weather systems such as frontal troughs, low-level rapids, low vortices, or high-altitude shear lines. From July to September is the late-flood rainy season, when rainfall is mainly influenced by tropical weather systems such as tropical cyclones. The rainfall in the rainy season accounts for 85% of annual rainfall [55]. The annual average temperature is 22.4 °C with a monthly average between 15 °C and 28 °C [25]. Sentinel-1A images have a revisit period of 12 days, but since some of the images do not completely cover the study area, the average time interval of the images in this study is about 20 days. We extracted the data in the middle of the month as a representative value of the cumulative subsidence for each month, averaged the cumulative subsidence, and then subtracted it month by month to obtain the average monthly subsidence rate. Study results showed that sedimentation rate increases in months when precipitation decreases, and vice versa. For example, the precipitation value in January 2017 was 16.6 mm, while the subsidence rate was as high as −1.01 mm/month; the precipitation value in May 2019 was 385.2 mm, while the ground uplifted at a rate of 0.14 mm/month (Figure 10). This infers that the land subsidence rate increases significantly in the months with low precipitation, while the land subsidence rate decreases significantly in the opposite months, and the two are negatively correlated. We think that the possible reason is that atmospheric precipitation through soil infiltration and other functions causes the groundwater level to rise or fall, thus causing the weakening or strengthening of pore water pressure, which in turn affects the decrease or increase of land subsidence rate. The above results also confirm the seasonal variability of ground subsidence in Zhuhai, which echoed the elastic and inelastic characteristics of the water content of the groundwater system [40].On the other hand, in the context of global warming, land subsidence and sea level rise have increased the intensity and frequency of natural disasters such as storm surges, typhoons, heavy rains, and floods in coastal cities, and have posed serious threats to coastal countries and regions in China and even the world [56,57,58]. Therefore, existing or potential problems of land subsidence should be managed promptly to avoid negative impacts arising from damage to embankments and flood-control infrastructure due to uneven lowering of ground elevation.
The above results conclude that natural factors such as fracture structure and atmospheric precipitation have a significant impact on land subsidence in Zhuhai; among the anthropogenic factors, groundwater development intensity and engineering activities promote the occurrence of the urban geological hazards of land subsidence; the superimposed effect of natural and human factors is reflected in the thickness of soft soil, which plays an important role in the process of ground subsidence in coastal cities.

3.3. Study of Serious Subsidence Case Areas in Zhuhai

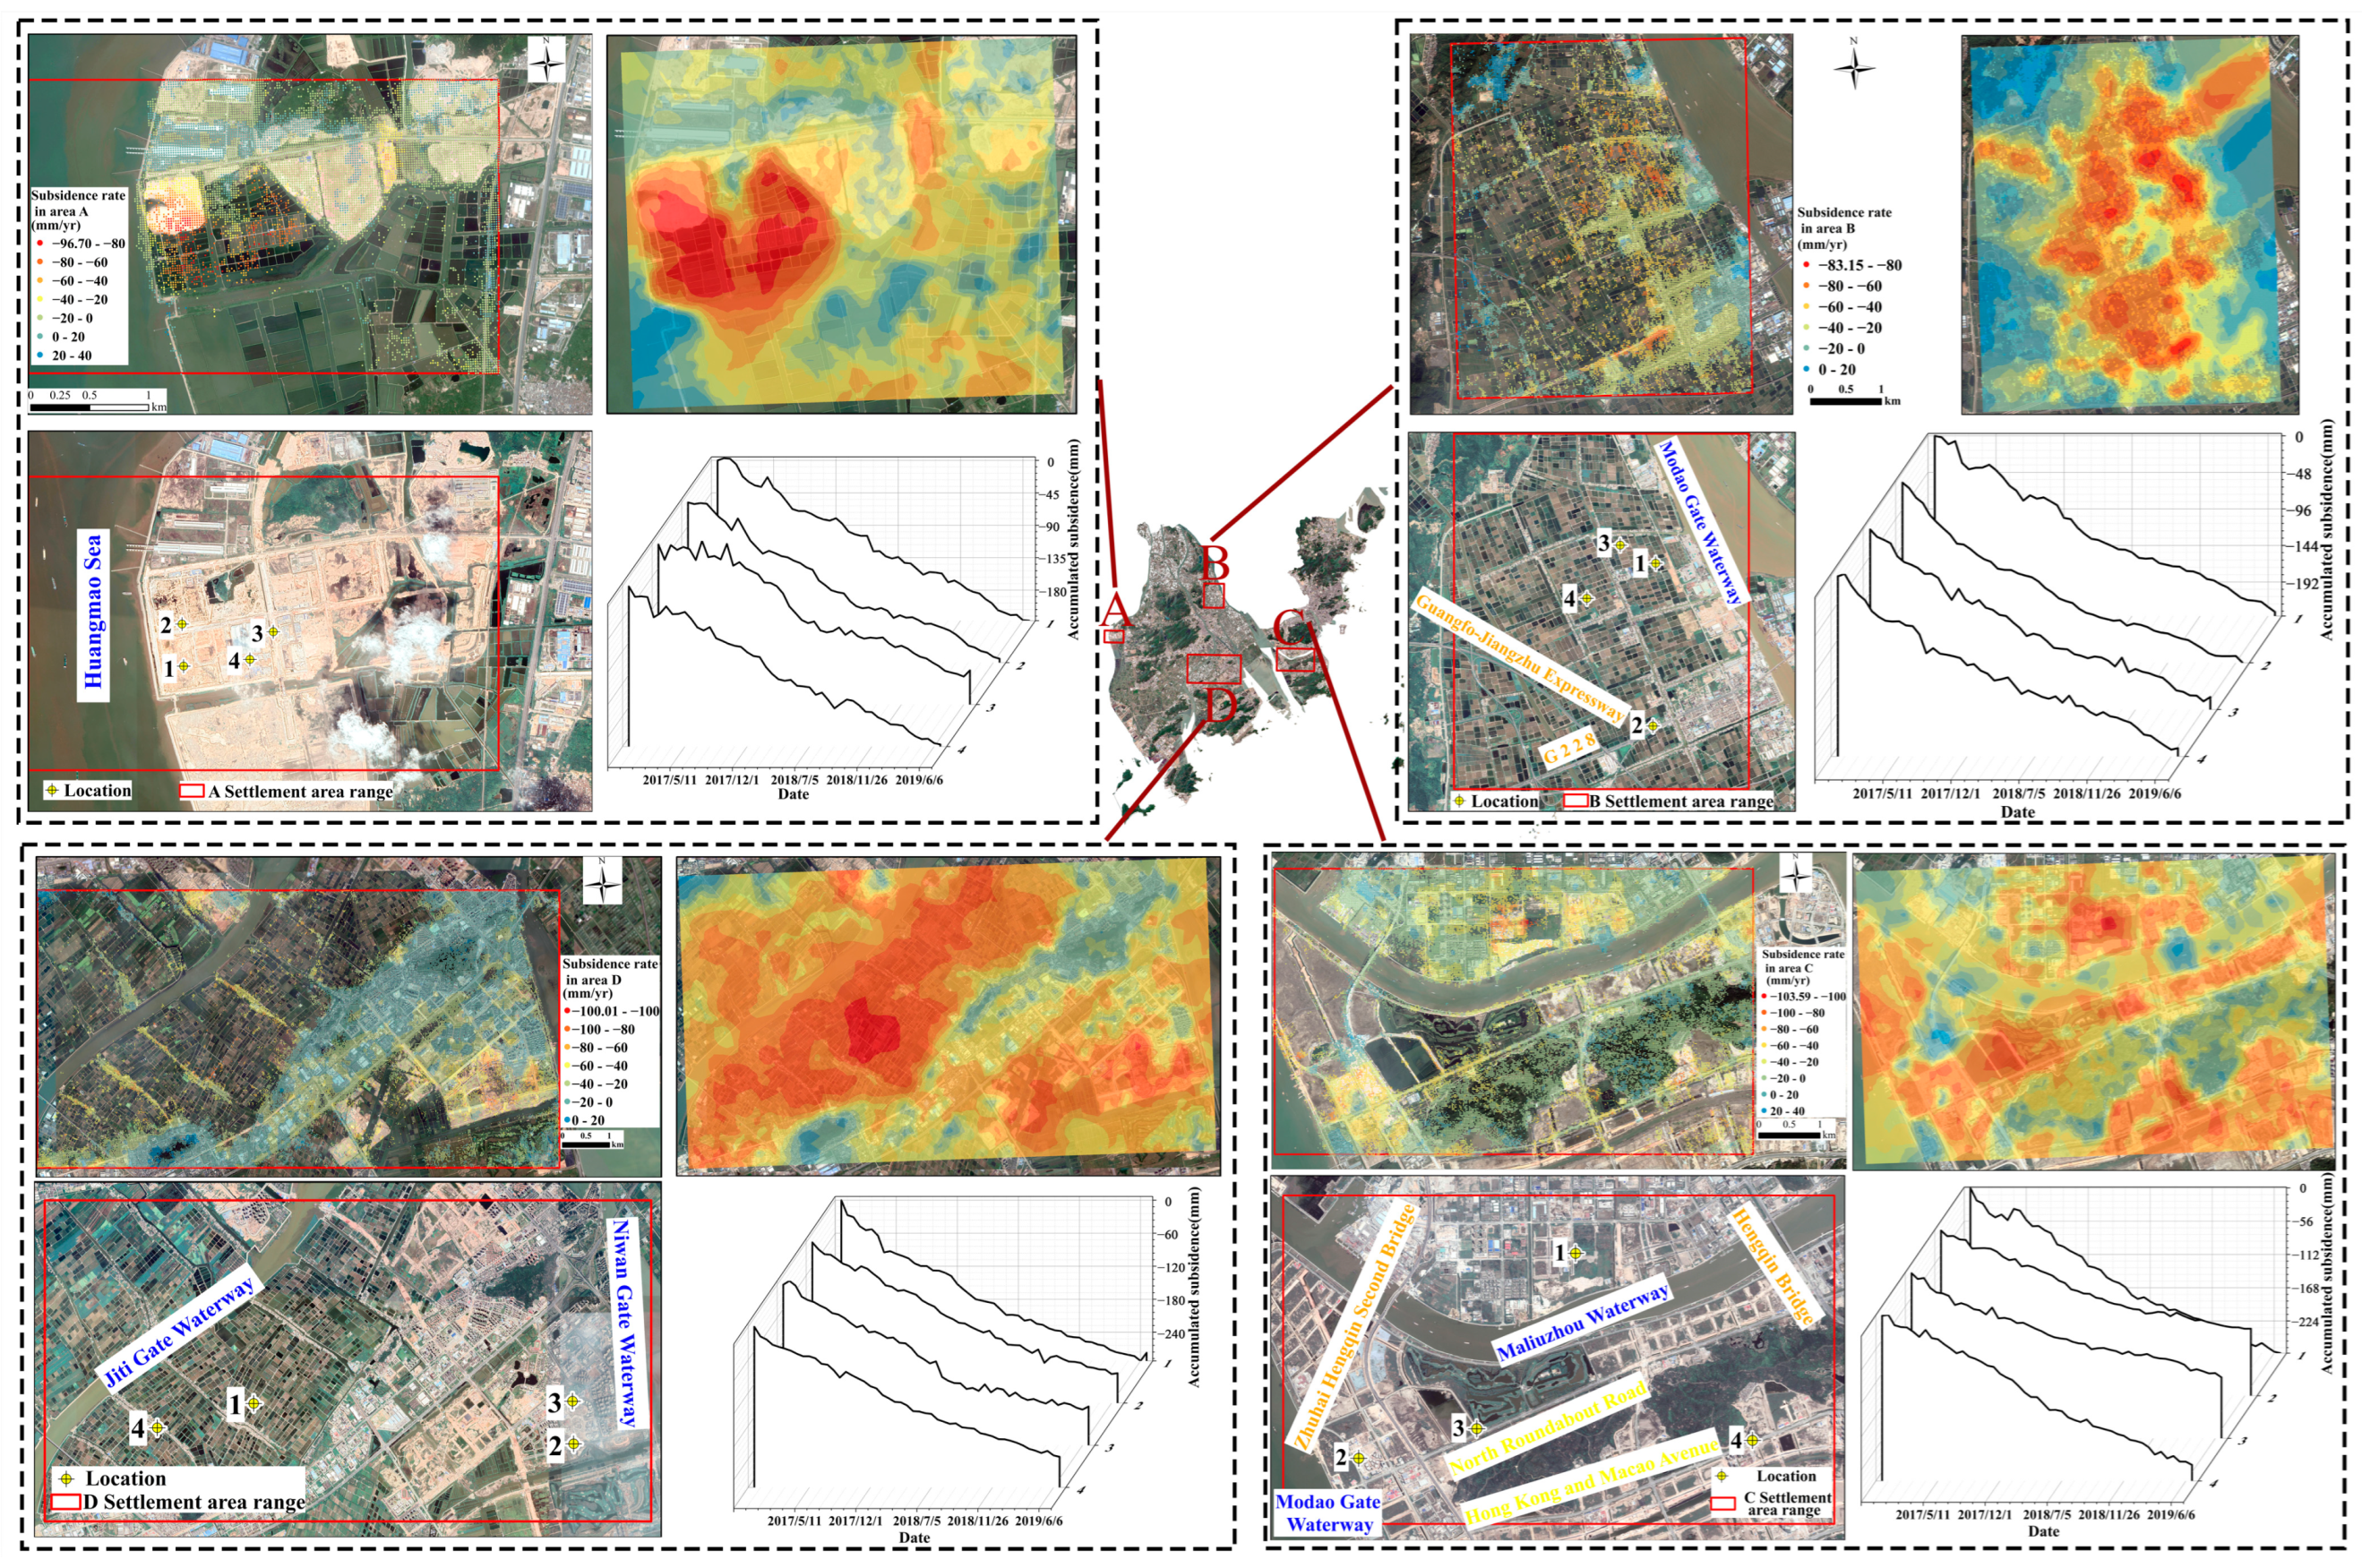
Four areas of severe subsidence occurred in Zhuhai. In this study, we processed the subsidence rate data by Kriging Interpolation and monitored the formation of subsidence funnels or subsidence zones in each subsidence area one by one (the upper right diagram in the four zones of A, B, C and D in Figure 11). The information on the temporal change of the subsidence anomaly location was also fed back to the waterfall map (the lower right diagram in the four zones of A, B, C and D in Figure 11). Finally, the remote sensing images at the beginning and end of the study period of the four subsidence areas (the upper and lower left of the bottom map in Figure 11 for the four areas of A, B, C and D at 0.6 m resolution) were compared in turn to assist in the analysis of the causes of accelerated subsidence.
Two obvious subsidence funnels appeared in the A subsidence area. A comparison of the initial and final ground cover revealed that the subsidence funnels were concentrated in the areas that had changed from paddy fields or aquaculture areas to project construction sites. Li et al. [59] pointed out that the engineering, geological and hydrogeological characteristics were changed by the construction activities, which caused land subsidence due to the drop of groundwater level by over-exploitation of groundwater during the early stage of construction, and the compression and settlement of the soil layer directly caused by the construction load compaction on the other hand. After investigation, it can be seen that the settlement at point 3 (cumulative subsidence: −174.77 mm), which is at the late stage of construction among the four subsidence anomaly locations, is significantly less than the remaining three points (cumulative subsidence greater than −210 mm). It is further derived that the rapid land subsidence phase corresponds to the construction process, while the slow or stable ground subsidence status corresponds to the construction completion phase [60].
The water system in the B subsidence area was distributed in a checkerboard pattern, and there was also the intersection of the Guangfo–Jiangzhu Expressway and the G228 National Road. Several subsidence funnels appeared in the area and showed the trend of subsidence from point to surface. The cumulative subsidence at the four abnormal settlement locations is concentrated in the range of −220 to −240 mm, and the degree of subsidence is more severe than that in the A subsidence area. The section of the G228 National Road in the district underwent substantial land subsidence and the profile analysis of the section showed that the ground subsidence along the road demonstrated phase changes. Its maximum settlement rate (−79.93 mm/yr) and maximum accumulated settlement (−243.49 mm) occur at 2100 m (Figure 12). The average subsidence rate along G228 in this area is −33.50 mm/yr, which is 17.63% higher than the B subsidence area. Notably, the settlement phenomenon along the G228 national highway section is more significant at low ground elevation than at high ground elevation. We think that there is no significant change in the ground cover of the area, and the consolidation and compaction effect generated by urban roads has a prominent impact on land subsidence.
The C subsidence zone formed a subsidence zone and was in transition to a surface state. The four anomalous settlement locations shows that the subsidence rates at point 1 (located in the Free Trade Zone) and point 4 (located along the Hong Kong–Macao Avenue) are similar, with the cumulative subsidence amount reaching about −170 mm; point 2 (located in the Guangdong–Macao Cooperation Chinese Medicine Science and Technology Industrial Park) and point 3 (located along North Huandao Road) have similar subsidence rates, with the cumulative subsidence amount reaching more than −250 mm. On the whole, the locations where the subsidence rate in the area was greater than −40 mm/yr were mostly found at the traffic arteries. It is believed that the area began to be constructed by sea reclamation in the 1980s and a great deal of soft-foundation treatment work was carried out accordingly [61]. Shanghai has the largest area of newly reclaimed land in the coastal area of China, and Li et al. showed that the average land subsidence rate in the newly formed area of Shanghai was −10.45 mm/yr at the beginning, and then gradually slowed down [62]. This is much less than the subsidence rate in the C subsidence area; thus, it is urgent to control the ground subsidence in the land reclamation area represented by the C subsidence area.
Two major subsidence funnel areas, northwest and southeast, appeared in the D subsidence area, and a trend of further connecting and merging was indicated. The maximum subsidence is at point 1, with a cumulative subsidence of −277.35 mm, and the remaining three points are all around −230 mm. The subsidence rate in the urban area was within −20 mm/yr, which was significantly lower than the subsidence rate along the sides of the river, thus indicating that the aquatic environment has a significant impact on ground subsidence, while groundwater mining and atmospheric precipitation change the hydrological processes of the aquatic environment. Mehdi Bagheri-Gavkosh et al. suggested that of all the anthropogenic causes of land subsidence, groundwater over-exploitation represents 59.75% of all anthropogenic causes, based on an analytical study of 290 case areas in 41 countries worldwide [63].
Both the average cumulative subsidence and the average subsidence rate are the highest in the B subsidence area, while the D, C, and A subsidence areas decrease in order (Table 2). The cumulative subsidence indicates the current status of subsidence and the subsidence rate indicates the future subsidence development trend. Thus, both the current status of ground subsidence and the future subsidence trend in Zhuhai are significantly higher in the west than in the east, which is highly consistent with the distribution of soft soil thickness in Zhuhai.

3.4. Subsidence Vulnerability Evaluation and Recommendations

As the transportation hub city of the Guangdong–Hong Kong–Macao Greater Bay Area, Zhuhai City’s economic development process touches the development and construction of the Greater Bay Area and even the whole economically developed region of the southeast coast of China. Land subsidence is a kind of slow-varying urban geohazard, and its development needs accumulate over a certain period of time, so it is vital to carry out the evaluation of subsidence vulnerability to prevent the possible loss of life and property in a timely manner. In this study, five major economic indicators were selected for each administrative region of Zhuhai in 2019 from the “Main Economic Indicators of Zhuhai Administrative (Functional) Districts in 2019”, published by the Statistics Bureau of Zhuhai, including gross regional product, resident population, total industrial output value above scale, public budget expenditure, and public budget revenue (Figure 13a–e), and combined with the results of this experiment, including the subsidence severity level delineated in the Technical Regulations for Ground Settlement Interference Radar Data Processing (No. DD2014-11) at the medium level and above (Table 1: subsidence rate over 5 cm/yr) and subsidence monitoring points with accumulated subsidence over 10 cm (Figure 13f,h), and finally applied the analytic hierarchy process and the comprehensive index method to derive the grading results of potential losses caused by ground subsidence in Zhuhai (Figure 13j) [35].
Based on the results of expert scoring and hierarchical analysis, the following weighting results were obtained: gross regional product (38.398%), resident population (19.124%), total industrial output value above scale (19.199%), public budget expenditure (11.640%) and public budget revenue (11.640%), with a CR value of 0.009 after consistency testing, which is much smaller than 0.1, and therefore the test was passed. In addition, we set the weight of cumulative subsidence, degree of economic importance, and subsidence rate as 20%, 60%, and 20% in turn, and the consistency test was passed. The results showed that the areas with an extremely high degree of vulnerability were highly consistent in spatial distribution with the key subsidence areas B, C, and D of this study. In addition, in terms of economic development level, Xiangzhou District suffered the most severe potential loss from ground subsidence, but the possibility of subsidence was less because of the more extensive distribution of hills within the administrative region (Figure 13g). While special attention needs to be paid to the subsidence vulnerability of Jinwan District, Gaolan Area, Hengqin New Area, and Hezhou New Area, the focus on subsidence prevention and control should be implemented especially in the areas on both sides of the river and in the land reclamation area. Specific fieldwork and comprehensive management of ground subsidence should be carried out in villages and communities such as Baijiao Town, Xiao Hengqin Community, and Yuyue Village (Figure 13i). At the same time, ground settlement can cause road cracking and even paralysis of the transportation system. Based on this, this study set up a 500 m buffer zone for important traffic arteries in Zhuhai and carried out vulnerability evaluation by combining the accumulated subsidence amount and subsidence rate, and concluded that transportation infrastructure such as Zhuhai Airport Expressway, Hegang Expressway, and G228 National Highway had extremely high vulnerability to subsidence, so it is important to carry out regular monitoring and maintenance of key road sections, especially the expressway (Figure 13k).

4. Discussion

Sentinel-1A remote sensing images have the significant advantage of free access. In this study, 51 scenes of Sentinel-1A images were processed by the SBAS-InSAR method using SARscape software to systematically analyze the spatial and temporal distribution characteristics of land subsidence, subsidence triggers, and the degree of subsidence vulnerability in Zhuhai, and then provide suggestions for ground settlement monitoring in specific administrative districts and road sections.
In terms of land subsidence triggers, land subsidence, as a typical manifestation of Quaternary neotectonic movement in urban areas, shows a diversity of triggers. Studies have been conducted to show the correlation between ground settlement and several aspects, such as underground resource extraction, urban construction compaction, geological formations, climatic conditions, land use changes, engineering project construction, and urbanization processes [23,47,48,51,56]. As one of the four earliest special economic zone cities in China, Zhuhai, whose large-scale urban construction was initially completed in the early 21st century, exhibited only small-scale ground settlement caused by land cover changes from 2016 to 2019. In this study, based on previous studies, we proposed that the upward and downward disk movements of the fracture zone have significant effects on ground subsidence, and pointed out that ground subsidence in Zhuhai shows seasonal changes along with climatic conditions, which fills the gaps in previous studies in this area. Meanwhile, we applied the spatial superposition method to further illustrate that groundwater development invested in aquaculture caused local ground subsidence in Zhuhai.
In terms of ground subsidence impact evaluation, the occurrence of ground subsidence is subject to a variety of natural and man-made factors, and ground subsidence can cause different degrees of disturbance and damage to urban economic development, so timely evaluation of the vulnerability characteristics of cities under the influence of ground subsidence is of great significance for urban geological disaster prevention and control. We compared the subsidence status of other river and sea deltas around the world and concluded that the Rio Grande Delta (in North America) and the Nile Delta (in Africa), which are located at the same latitude as the PRD, cover a larger area and are more densely populated than the PRD, while Alexandria on the Nile Delta has a subsidence rate about 1/3 that of Zhuhai between 2017 and 2020, and the Morelia in the Rio Grande Delta has already reached this rate between 2003 and 2010 [64,65,66].This study compared the results of ground subsidence studies in Asian coastal cities and concluded that the subsidence in East Asia is less than that in Southeast Asia and South Asia, but the development of subsidence is rapid and the potential for subsidence is considerable. Based on this, we combined several regional economic indicators to evaluate the vulnerability of ground subsidence in Zhuhai, which fills the gap in previous research in this direction and provides enlightenment for the urban planning and construction of global coastal cities similar to Zhuhai.
In terms of land subsidence prediction, ground subsidence as a slowly changing urban geohazard can be monitored in long time series, all-day, all-weather, and large areas by SBAS-InSAR technology, which is widely used in monitoring the current situation of ground subsidence in major cities, but the research of subsidence future prediction is of great significance to urban geohazard prevention and control. The current research on subsidence prediction models shows great attraction, and there are already prediction models such as artificial neural network, gray system method and genetic algorithm [16,17]. However, due to the complexity of ground subsidence generation, there are significant differences in the prediction models applicable to different backgrounds in different regions. Zhuhai is located in the developed economic zone of the eastern coast of Asia, with a complex geological environment and rapid urban construction renewal, so the study of ground settlement prediction models will be a research hotspot.
Because of the lack of actual measurement data of land subsidence field monitoring, the accuracy verification analysis cannot be performed, but the distribution of soft soil thickness and groundwater development intensity was spatially consistent with the subsidence leakage area, which can assist in verifying the high monitoring credibility of the study. Meanwhile, this study statistically analyzed the research results of different scholars for ground subsidence in Zhuhai (Table 3) and extracted the data of the monitoring points of this experiment corresponding to the key research areas of the above scholars and calculated the mean and the most value accordingly. We finally concluded that the experimental results had small differences from the results of other researchers, which further verified that the monitoring credibility of this study was high. This study proposes a new direction of thinking in the investigation of ground settlement triggers and evaluation of subsidence losses in Zhuhai, which provides reliable theoretical support for ground settlement prevention and control in Zhuhai and improves the theoretical system of ground settlement research in coastal cities worldwide.

5. Conclusions

This study analyzed the spatial and temporal distribution characteristics of land subsidence in Zhuhai, revealed the effects of fracture structure, soft soil thickness, groundwater extraction, and atmospheric precipitation on ground subsidence, and assessed the economic vulnerability of the study area under the influence of ground subsidence.
The study showed that the temporal evolution of ground subsidence in Zhuhai is characterized by phase changes, which means that Zhuhai experienced three processes in sequence, namely small-scale rise and fall, sharp subsidence, and stable subsidence; the spatial distribution is characterized by the uneven distribution of subsidence funnel areas, and they are mainly concentrated in the areas on both sides of the river. The coupling analysis of the spatial and temporal characteristics of the whole area and local areas and the triggering factors of subsidence, combined with spatial superposition analysis, indicates that the evolution of ground subsidence is controlled by tectonic fractures, and under the influence of seasonal changes of atmospheric precipitation, is maintaining spatial consistency with the area of high thickness concentration of soft soil and the area of high-intensity groundwater extraction.
Zhuhai produced four serious areas of subsidence during 2016–2019, among which subsidence area B was the most significant. Overall, in terms of ground settlement potential, the western part of the study area is more prominent than the eastern part. The ABCD settlement zones in turn produced different degrees of ground settlement mainly based on the effects of surface cover change, urban construction compaction, construction of land reclamation projects, and groundwater development. The settlement-triggering factors in each case area are more complicated on the basis of the settlement triggering factors in the whole area. Finally, the extremely high-vulnerability areas of land subsidence in Zhuhai are spatially consistent with the key subsidence areas of this study, so it is necessary to strengthen the monitoring and prevention of ground subsidence in relevant villages, towns, and highway sections.
Although we have verified the experimental results by comparing them with previous results of other researchers, it is necessary to carry out field operations to obtain actual data on surface deformation, and the combined use of traditional methods and InSAR technology will yield more accurate and reliable experimental results. In addition, the comparative analysis of input costs and potential benefits of ground subsidence monitoring can build a more comprehensive urban geohazard prevention and control system, which will be the entry point for subsequent studies.
Our study can strengthen the understanding of triggering factors of ground subsidence in coastal cities, which has important implications for urban geohazard mitigation and urban spatial design of similar important coastal port cities like Zhuhai.

Author Contributions

Methodology, M.Z. and P.P.; software, Z.X. and S.W.; data curation, F.L. and A.Z.; writing—original draft preparation, H.S.; writing—review and editing, H.P.; supervision, Y.P.; project administration, X.Z. All authors have read and agreed to the published version of the manuscript.

Funding

This work was supported by the Monitoring and Evaluation of Resource and Environmental Carrying Capacity of Guangdong–Hong Kong–Macao Greater Bay Area (funder: Xinwen Zhao; funding number: DD20221729), the Zhuhai Urban Geological Survey (Including Information Technology) (funders: Xinwen Zhao and Mingtao Long; funding number: MZCD-2201-008), and the National Natural Science Foundation of China (funder: Hongxia Peng; funding number: Grant No. 41877297).

Data Availability Statement

No new data were created or analyzed in this study. Data sharing is not applicable to this article.

Acknowledgments

We would like to thank JAXA/EORC for providing the AW3D-DEM data and ESA for providing the Sentinel-1 SAR images used in this study. We are very grateful for the editors and all anonymous reviewers for their constructive and excellent reviews that helped to improve the paper.

Conflicts of Interest

The authors declare no conflict of interest.

References

  1. Catalao, J.; Raju, D.; Nico, G. Insar Maps of Land Subsidence and Sea Level Scenarios to Quantify the Flood Inundation Risk in Coastal Cities: The Case of Singapore. Remote Sens. 2020, 12, 296. [Google Scholar] [CrossRef]
  2. Shirzaei, M.; Freymueller, J.; Törnqvist, T.E.; Galloway, D.L.; Dura, T.; Minderhoud, P.S.J. Measuring, modelling and projecting coastal land subsidence. Nat. Rev. Earth Environ. 2021, 2, 40–58. [Google Scholar] [CrossRef]
  3. Syvitski, J.P.M.; Kettner, A.J.; Overeem, I.; Hutton, E.W.H.; Hannon, M.T.; Brakenridge, G.R.; Day, J.; Vorosmarty, C.; Saito, Y.; Giosan, L.; et al. Sinking deltas due to human activities. Nat. Geosci. 2009, 2, 681–686. [Google Scholar] [CrossRef]
  4. Fang, J.Y.; Liu, W.; Yang, S.N.; Brown, S.; Nicholls, R.J.; Hinkel, J.; Shi, X.W.; Shi, P.J. Spatial-temporal changes of coastal and marine disasters risks and impacts in Mainland China. Ocean Coast. Manag. 2017, 139, 125–140. [Google Scholar] [CrossRef]
  5. Montenbruck, O.; Steigenberger, P.; Prange, L.; Deng, Z.G.; Zhao, Q.L.; Perosanz, F.; Romero, I.; Noll, C.; Sturze, A.; Weber, G.; et al. The Multi-GNSS Experiment (MGEX) of the International GNSS Service (IGS)—Achievements, prospects and challenges. Adv. Space Res. 2017, 59, 1671–1697. [Google Scholar] [CrossRef]
  6. Bayuaji, L.; Sumantyo, J.T.S.; Kuze, H. ALOS PALSAR D-InSAR for land subsidence mapping in Jakarta, Indonesia. Can. J. Remote Sens. 2010, 36, 1–8. [Google Scholar] [CrossRef]
  7. Ferretti, A.; Prati, C.; Rocca, F. Analysis of Permanent Scatterers in SAR interferometry. In Proceedings of the IGARSS 2000. IEEE 2000 International Geoscience and Remote Sensing Symposium. Taking the Pulse of the Planet: The Role of Remote Sensing in Managing the Environment. Proceedings (Cat. No.00CH37120), Honolulu, HI, USA, 24–28 July 2000; Volume 2, pp. 761–763. [Google Scholar]
  8. Berardino, P.; Fornaro, G.; Lanari, R.; Sansosti, E. A new algorithm for surface deformation monitoring based on small baseline differential SAR interferograms. IEEE Trans. Geosci. Electron. 2002, 40, 2375–2383. [Google Scholar] [CrossRef]
  9. Liu, Z.J.; Qiu, H.J.; Zhu, Y.R.; Liu, Y.; Yang, D.D.; Ma, S.Y.; Zhang, J.J.; Wang, Y.Y.; Wang, L.Y.; Tang, B.Z. Efficient Identification and Monitoring of Landslides by Time-Series InSAR Combining Single- and Multi-Look Phases. Remote Sens. 2022, 14, 1026. [Google Scholar] [CrossRef]
  10. Ma, S.Y.; Qiu, H.J.; Zhu, Y.R.; Yang, D.D.; Tang, B.Z.; Wang, D.Z.; Wang, L.Y.; Cao, M.M. Topographic Changes, Surface Deformation and Movement Process before, during and after a Rotational Landslide. Remote Sens. 2023, 15, 662. [Google Scholar] [CrossRef]
  11. Tizzani, P.; Berardino, P.; Casu, F.; Euillades, P.; Manzo, M.; Ricciardi, G.P.; Zeni, G.; Lanari, R. Surface deformation of Long Valley Caldera and Mono Basin, California, investigated with the SBAS-InSAR approach. Remote Sens. Environ. 2007, 108, 277–289. [Google Scholar] [CrossRef]
  12. Zhao, C.Y.; Lu, Z.; Zhang, Q.; de la Fuente, J. Large-area landslide detection and monitoring with ALOS/PALSAR imagery data over Northern California and Southern Oregon, USA. Remote Sens. Environ. 2012, 124, 348–359. [Google Scholar] [CrossRef]
  13. Li, G.; Feng, G.C.; Xiong, Z.Q.; Liu, Q.; Xie, R.G.; Zhu, X.L.; Luo, S.R.; Du, Y.A. Surface deformation evolution in the Pearl River Delta between 2006 and 2011 derived from the ALOS1/PALSAR images. Earth Planets Space 2020, 72, 179. [Google Scholar] [CrossRef]
  14. Hong, D.F.; Yokoya, N.; Xia, G.S.; Chanussot, J.; Zhu, X.X. X-ModalNet: A semi-supervised deep cross-modal network for classification of remote sensing data. ISPRS J. Photogramm. 2020, 167, 12–23. [Google Scholar] [CrossRef] [PubMed]
  15. Liu, S.J.; Zhou, Z.Z.; Ding, H.X.; Zhong, Y.J.; Shi, Q. Crop Mapping Using Sentinel Full-Year Dual-Polarized SAR Data and a CPU-Optimized Convolutional Neural Network with Two Sampling Strategies. IEEE J. Sel. Top. Appl. Earth Obs. Remote Sens. 2021, 14, 7017–7031. [Google Scholar] [CrossRef]
  16. Yu, H.R.; Arabameri, A.; Costache, R.; Craciun, A.; Arora, A. Land subsidence susceptibility assessment using advanced artificial intelligence models. Geocarto Int. 2022, 37, 18067–18093. [Google Scholar] [CrossRef]
  17. Song, X.G.; Wang, Z.Y.; Bai, W.W.; Wang, Z.; Xie, S.M.; Xia, K.Z. Study on engineering characteristics of large-scale deep soft soil in the central area of western Zhuhai. Chin. J. Rock. Mech. Eng. 2019, 38, 1434–1451. [Google Scholar]
  18. Chen, C.X.; Pei, S.P.; Jiao, J.J. Land subsidence caused by groundwater exploitation in Suzhou City, China. Hydrogeol. J. 2003, 11, 275–287. [Google Scholar] [CrossRef]
  19. Tian, B.; Wu, W.T.; Yang, Z.Q.; Zhou, Y.X. Drivers, trends, and potential impacts of long-term coastal reclamation in China from 1985 to 2010. Estuar. Coast. Shelf Sci. 2016, 170, 83–90. [Google Scholar] [CrossRef]
  20. Huang, G.Z.; Zhu, T.; Cao, Y. The Consideration and Prospect of the Ecological Land Reclamation in China. Future Dev. 2013, 36, 12–17. [Google Scholar]
  21. Sengupta, D.; Chen, R.S.; Meadows, M.E.; Choi, Y.R.; Banerjee, A.; Zilong, X. Mapping Trajectories of Coastal Land Reclamation in Nine Deltaic Megacities using Google Earth Engine. Remote Sens. 2019, 11, 2621. [Google Scholar] [CrossRef]
  22. Zhi, B.F.; Liang, J.H.; Lu, Y.D. Impact of Soft Soils on Urban Construction in Pearl River Delta Economic Zone. In Proceedings of the Seminar on Coastal Zone Geological Environment and Urban Development, Tianjin, China, 20 December 2004; pp. 382–391. [Google Scholar]
  23. Zhu, B.Y.; Tang, C.; Ren, Z.Z.; Ma, Z.; Zhang, Q.; Li, Y. Surface deformation monitoring and driving force analysis in Zhuhai city based on PS-InSAR technology. Bull. Surv. Mapp. 2022, 6, 108–113. [Google Scholar] [CrossRef]
  24. Hu, F.Y.; Deng, C.J. Analysis on the distribution law of soft soil and the status quo of settlement disasters in the west bank of the Pearl River Estuary. Ground Water 2021, 43, 189–193. [Google Scholar]
  25. Sheng, N.; Tang, U.W. Zhuhai. Cities 2013, 32, 70–79. [Google Scholar] [CrossRef]
  26. Lin, Y.X.; Ai, K.H.; Huang, L.J. Issues of engineering characteristics and engineering construction of soft clay in Zhuhai region. Chin. J. Rock. Mech. Eng. 2006, 25, 3372–3376. [Google Scholar]
  27. Zhou, H.; Fang, Y.G.; Gu, R.G.; Zeng, C. Microscopic analysis of saturated soft clay in Pearl River Delta. J. Cent. South Univ. Technol. 2011, 18, 504–510. [Google Scholar] [CrossRef]
  28. Gao, Y.B.; Zhang, S.B.; Ge, X.N. Comparisons of compression index of Chinese coastal soft clay and soils from foreign regions. Rock. Soil. Mech. 2017, 38, 2713–2720. [Google Scholar]
  29. Ai, B.; Huang, K.; Zhao, J.; Sun, S.; Jian, Z.; Liu, X. Comparison of Classification Algorithms for Detecting Typical Coastal Reclamation in Guangdong Province with Landsat 8 and Sentinel 2 Images. Remote Sens. 2022, 14, 385. [Google Scholar] [CrossRef]
  30. Du, Q.S.; Li, G.Y.; Chen, D.; Zhou, Y.; Qi, S.S.; Wu, G.; Chai, M.T.; Tang, L.Y.; Jia, H.L.; Peng, W.L. SBAS-InSAR-Based Analysis of Surface Deformation in the Eastern Tianshan Mountains, China. Front. Earth Sci. 2021, 9, 729454. [Google Scholar] [CrossRef]
  31. Yao, J.; Yao, X.; Liu, X. Landslide Detection and Mapping Based on SBAS-InSAR and PS-InSAR: A Case Study in Gongjue County, Tibet, China. Remote Sens. 2022, 14, 4728. [Google Scholar] [CrossRef]
  32. Yu, Q.; Wang, Q.; Yan, X.; Yang, T.; Song, S.; Yao, M.; Zhou, K.; Huang, X. Ground Deformation of the Chongming East Shoal Reclamation Area in Shanghai Based on SBAS-InSAR and Laboratory Tests. Remote Sens. 2020, 12, 1016. [Google Scholar] [CrossRef]
  33. Fan, H.D.; Wang, L.; Wen, B.F.; Du, S. A New Model for three-dimensional Deformation Extraction with Single-track InSAR Based on Mining Subsidence Characteristics. Int. J. Appl. Earth Obs. Geoinf. 2021, 94, 102223. [Google Scholar] [CrossRef]
  34. Lai, S.; Xie, Z.W.; Bueh, C.; Gong, Y.F. Fidelity of the APHRODITE Dataset in Representing Extreme Precipitation over Central Asia. Adv. Atmos. Sci. 2020, 37, 1405–1416. [Google Scholar] [CrossRef]
  35. Hu, B.B.; Jiang, Y.X.; Zhou, J.; Wang, J.; Xv, S.Y. Assessment and Zonation of Land Subsidence Disaster Risk of Tianjin Binhai Area. Sci. Geogr. Sin. 2008, 28, 693–697. [Google Scholar]
  36. Nicholls, R.J.; Lincke, D.; Hinkel, J.; Brown, S.; Vafeidis, A.T.; Meyssignac, B.; Hanson, S.E.; Merkens, J.L.; Fang, J.Y. A global analysis of subsidence, relative sea-level change and coastal flood exposure. Nat. Clim. Change 2021, 11, 338–342. [Google Scholar] [CrossRef]
  37. Wu, P.C.; Wei, M.; D’Hondt, S. Subsidence in Coastal Cities Throughout the World Observed by InSAR. Geophys. Res. Lett. 2022, 49, e2022GL098477. [Google Scholar] [CrossRef]
  38. Tang, Y.Q.; Ren, X.W.; Chen, B.; Song, S.P.; Wang, J.X.; Yang, P. Study on land subsidence under different plot ratios through centrifuge model test in soft-soil territory. Environ. Earth Sci. 2012, 66, 1809–1816. [Google Scholar] [CrossRef]
  39. Liu, Y.N.; Qiao, Y.L.; Zhong, Y. Dynamic Monitoring and Driving Force Analysis on Rivers and Lakes in Zhuhai City Using Remote Sensing Technologies. Procedia Environ. Sci. 2011, 10, 2677–2683. [Google Scholar]
  40. Ma, P.F.; Wang, W.X.; Zhang, B.W.; Wang, J.L.; Shi, G.Q.; Huang, G.Q.; Chen, F.L.; Jiang, L.M.; Lin, H. Remotely sensing large- and small-scale ground subsidence: A case study of the Guangdong-Hong Kong-Macao Greater Bay Area of China. Remote Sens. Environ. 2019, 232, 111282. [Google Scholar] [CrossRef]
  41. Erban, L.E.; Gorelick, S.M.; Zebker, H.A. Groundwater extraction, land subsidence, and sea-level rise in the Mekong Delta, Vietnam. Environ. Res. Lett. 2014, 9, 084010. [Google Scholar] [CrossRef]
  42. Rahman, M.M.; Haque, A.; Nicholls, R.J.; Darby, S.E.; Urmi, M.T.; Dustegir, M.M.; Dunn, F.E.; Tahsin, A.; Razzaque, S.; Horsburgh, K.; et al. Sustainability of the coastal zone of the Ganges-Brahmaputra-Meghna delta under climatic and anthropogenic stresses. Sci. Total Environ. 2022, 829, 154547. [Google Scholar] [CrossRef]
  43. Wang, R.; Yang, M.S.; Yang, T.L.; Lin, J.X.; Liao, M.S. Decomposing and mapping different scales of land subsidence over Shanghai with X- and C-Band SAR data stacks. Int. J. Digit. Earth 2022, 15, 478–502. [Google Scholar] [CrossRef]
  44. Zhou, C.; Gong, H.; Chen, B.; Gao, M.; Cao, Q.; Cao, J.; Duan, L.; Zuo, J.; Shi, M. Land Subsidence Response to Different Land Use Types and Water Resource Utilization in Beijing-Tianjin-Hebei, China. Remote Sens. 2020, 12, 457. [Google Scholar] [CrossRef]
  45. Burbey, T.J. The influence of faults in basin-fill deposits on land subsidence, Las Vegas Valley, Nevada, USA. Hydrogeol. J. 2002, 10, 525–538. [Google Scholar] [CrossRef]
  46. Gao, M.L.; Gong, H.L.; Li, X.J.; Chen, B.B.; Zhou, C.F.; Shi, M.; Guo, L.; Chen, Z.; Ni, Z.Y.; Duan, G.Y. Land Subsidence and Ground Fissures in Beijing Capital International Airport (BCIA): Evidence from Quasi-PS InSAR Analysis. Remote Sens. 2019, 11, 1466. [Google Scholar] [CrossRef]
  47. Li, S.Z.; Suo, Y.H.; Li, X.Y.; Zho, J.; Santosh, M.; Wang, P.C.; Wang, G.Z.; Guo, L.L.; Yu, S.Y.; Lan, H.Y.; et al. Mesozoic tectono-magmatic response in the East Asian ocean-continent connection zone to subduction of the Paleo-Pacific Plate. Earth-Sci. Rev. 2019, 192, 91–137. [Google Scholar] [CrossRef]
  48. Liu, Z.D.; Wu, H.; Qiu, J. Interpretation of Fault and Ground Stability Assessment Based on Remote Sensing of SPOT-5 & ETM+ in Zhuhai Area. J. Guilin Univ. Technol. 2008, 28, 20–24. [Google Scholar]
  49. Zhong, J.Q.; Zhan, W.H.; Gu, S.C.; Liu, H.L. Study on neotectonic movenent and crustal stability in pearl river delta. South China J. Seismol. 1996, 16, 57–63. [Google Scholar]
  50. Zhang, X.; Lin, J.R.; Huang, H.; Deng, J.; Chen, A. Analysis on the Dynamics of Coastline and Reclamation in Pearl River Estuary in China for Nearly Last Half Century. Water 2022, 14, 1228. [Google Scholar] [CrossRef]
  51. Tomas, R.; Herrera, G.; Lopez-Sanchez, J.M.; Vicente, F.; Cuenca, A.; Mallorquí, J.J. Study of the land subsidence in Orihuela City (SE Spain) using PSI data: Distribution, evolution and correlation with conditioning and triggering factors. Eng. Geol. 2010, 115, 105–121. [Google Scholar] [CrossRef]
  52. Gong, S.L.; Li, C.; Yang, S.L. The microscopic characteristics of Shanghai soft clay and its effect on soil body deformation and land subsidence. Environ. Geol. 2009, 56, 1051–1056. [Google Scholar] [CrossRef]
  53. Wang, S.; Yan, X.X.; Jie, J.; Yang, T.L.; Wu, J.Z.; Wang, H.S. Analysis on factors affecting ground settlement in plain area of Pearl River Delta. Chin. J. Geol. Hazard Control 2019, 30, 98–104. [Google Scholar]
  54. Huang, S.W.; Wei, C.Z. Spatial-Temporal Changes in Aquaculture Ponds in Coastal Cities of Guangdong Province: An Empirical Study Based on Sentinel-1 Data during 2015–2019. Trop. Geogr. 2021, 41, 622–634. [Google Scholar]
  55. Wen, M.; Chen, C.M. Characteristics and Estimation of Water Resources Variation in Resent 50-years in Zhuhai City. Acta Sci. Nat. Univ. Sunyatseni 2005, 44, 272–275. [Google Scholar]
  56. Zhang, S.; Zhang, Y.; Yu, J.; Fan, Q.; Si, J.; Zhu, W.; Song, M. Interpretation of the Spatiotemporal Evolution Characteristics of Land Deformation in Beijing during 2003–2020 Using Sentinel, ENVISAT, and Landsat Data. Remote Sens. 2022, 14, 2242. [Google Scholar] [CrossRef]
  57. Zhang, Y.J.; Ayyub, B.M.; Zhang, D.M.; Huang, H.W.; Saadat, Y. Impact of Water Level Rise on Urban Infrastructures: Washington, DC, and Shanghai as Case Studies. Risk Anal. 2019, 39, 2718–2731. [Google Scholar] [CrossRef]
  58. Pei, Y.Q.; Qiu, H.J.; Yang, D.D.; Liu, Z.J.; Ma, S.Y.; Li, J.Y.; Cao, M.M.; Wufuer, W. Increasing landslide activity in the Taxkorgan River Basin (eastern Pamirs Plateau, China) driven by climate change. Catena 2023, 223, 106911. [Google Scholar] [CrossRef]
  59. Li, M.; Zhang, X.; Bai, Z.; Xie, H.; Chen, B. Land Subsidence in Qingdao, China, from 2017 to 2020 Based on PS-InSAR. Int. J. Environ. Res. Public Health 2022, 19, 4913. [Google Scholar] [CrossRef]
  60. Yang, Y.B.; Li, H. Application of SBAS technology to the surface deformation based on Sentinel-1A radar image. Eng. Surv. Mapp. 2018, 27, 42–48. [Google Scholar]
  61. Zhang, Y.C.; Hu, H.Y.; Huzang, Z.M. The Strength Calculation Method of Foundation Treated with Sand Well. Adv. Mater. Res. 2014, 919, 805–808. [Google Scholar] [CrossRef]
  62. Li, D.; Li, B.; Zhang, Y.X.; Fan, C.; Xu, H.; Hou, X.Y. Spatial and temporal characteristics analysis for land subsidence in Shanghai coastal reclamation area using PS-InSAR method. Front. Mar. Sci. 2022, 9, 1000523. [Google Scholar] [CrossRef]
  63. Bagheri-Gavkosh, M.; Hosseini, S.M.; Ataie-Ashtiani, B.; Sohani, Y.; Ebrahimian, H.; Morovat, F.; Ashra, S. Land subsidence: A global challenge. Sci. Total Environ. 2021, 778, 146193. [Google Scholar] [CrossRef] [PubMed]
  64. Cigna, F.; Osmanoglu, B.; Cabral-Cano, E.; Dixon, T.H.; Avila-Olivera, J.A.; Garduno-Monroy, V.H.; DeMets, C.; Wdowinski, S. Monitoring land subsidence and its induced geological hazard with Synthetic Aperture Radar Interferometry: A case study in Morelia, Mexico. Remote Sens. Environ. 2012, 117, 146–161. [Google Scholar] [CrossRef]
  65. Darwish, N.; Kaiser, M.; Koch, M.; Gaber, A. Assessing the Accuracy of ALOS/PALSAR-2 and Sentinel-1 Radar Images in Estimating the Land Subsidence of Coastal Areas: A Case Study in Alexandria City, Egypt. Remote Sens. 2021, 13, 1838. [Google Scholar] [CrossRef]
  66. Higgins, S.A. Review: Advances in delta-subsidence research using satellite methods. Hydrogeol. J. 2016, 24, 587–600. [Google Scholar] [CrossRef]
  67. Huang, L.T. InSAR Time Series Deformation Monitoring and Analysis in the Peral River Delta. Geomat. Spat. Inf. Technol. 2022, 45, 132–135. [Google Scholar]
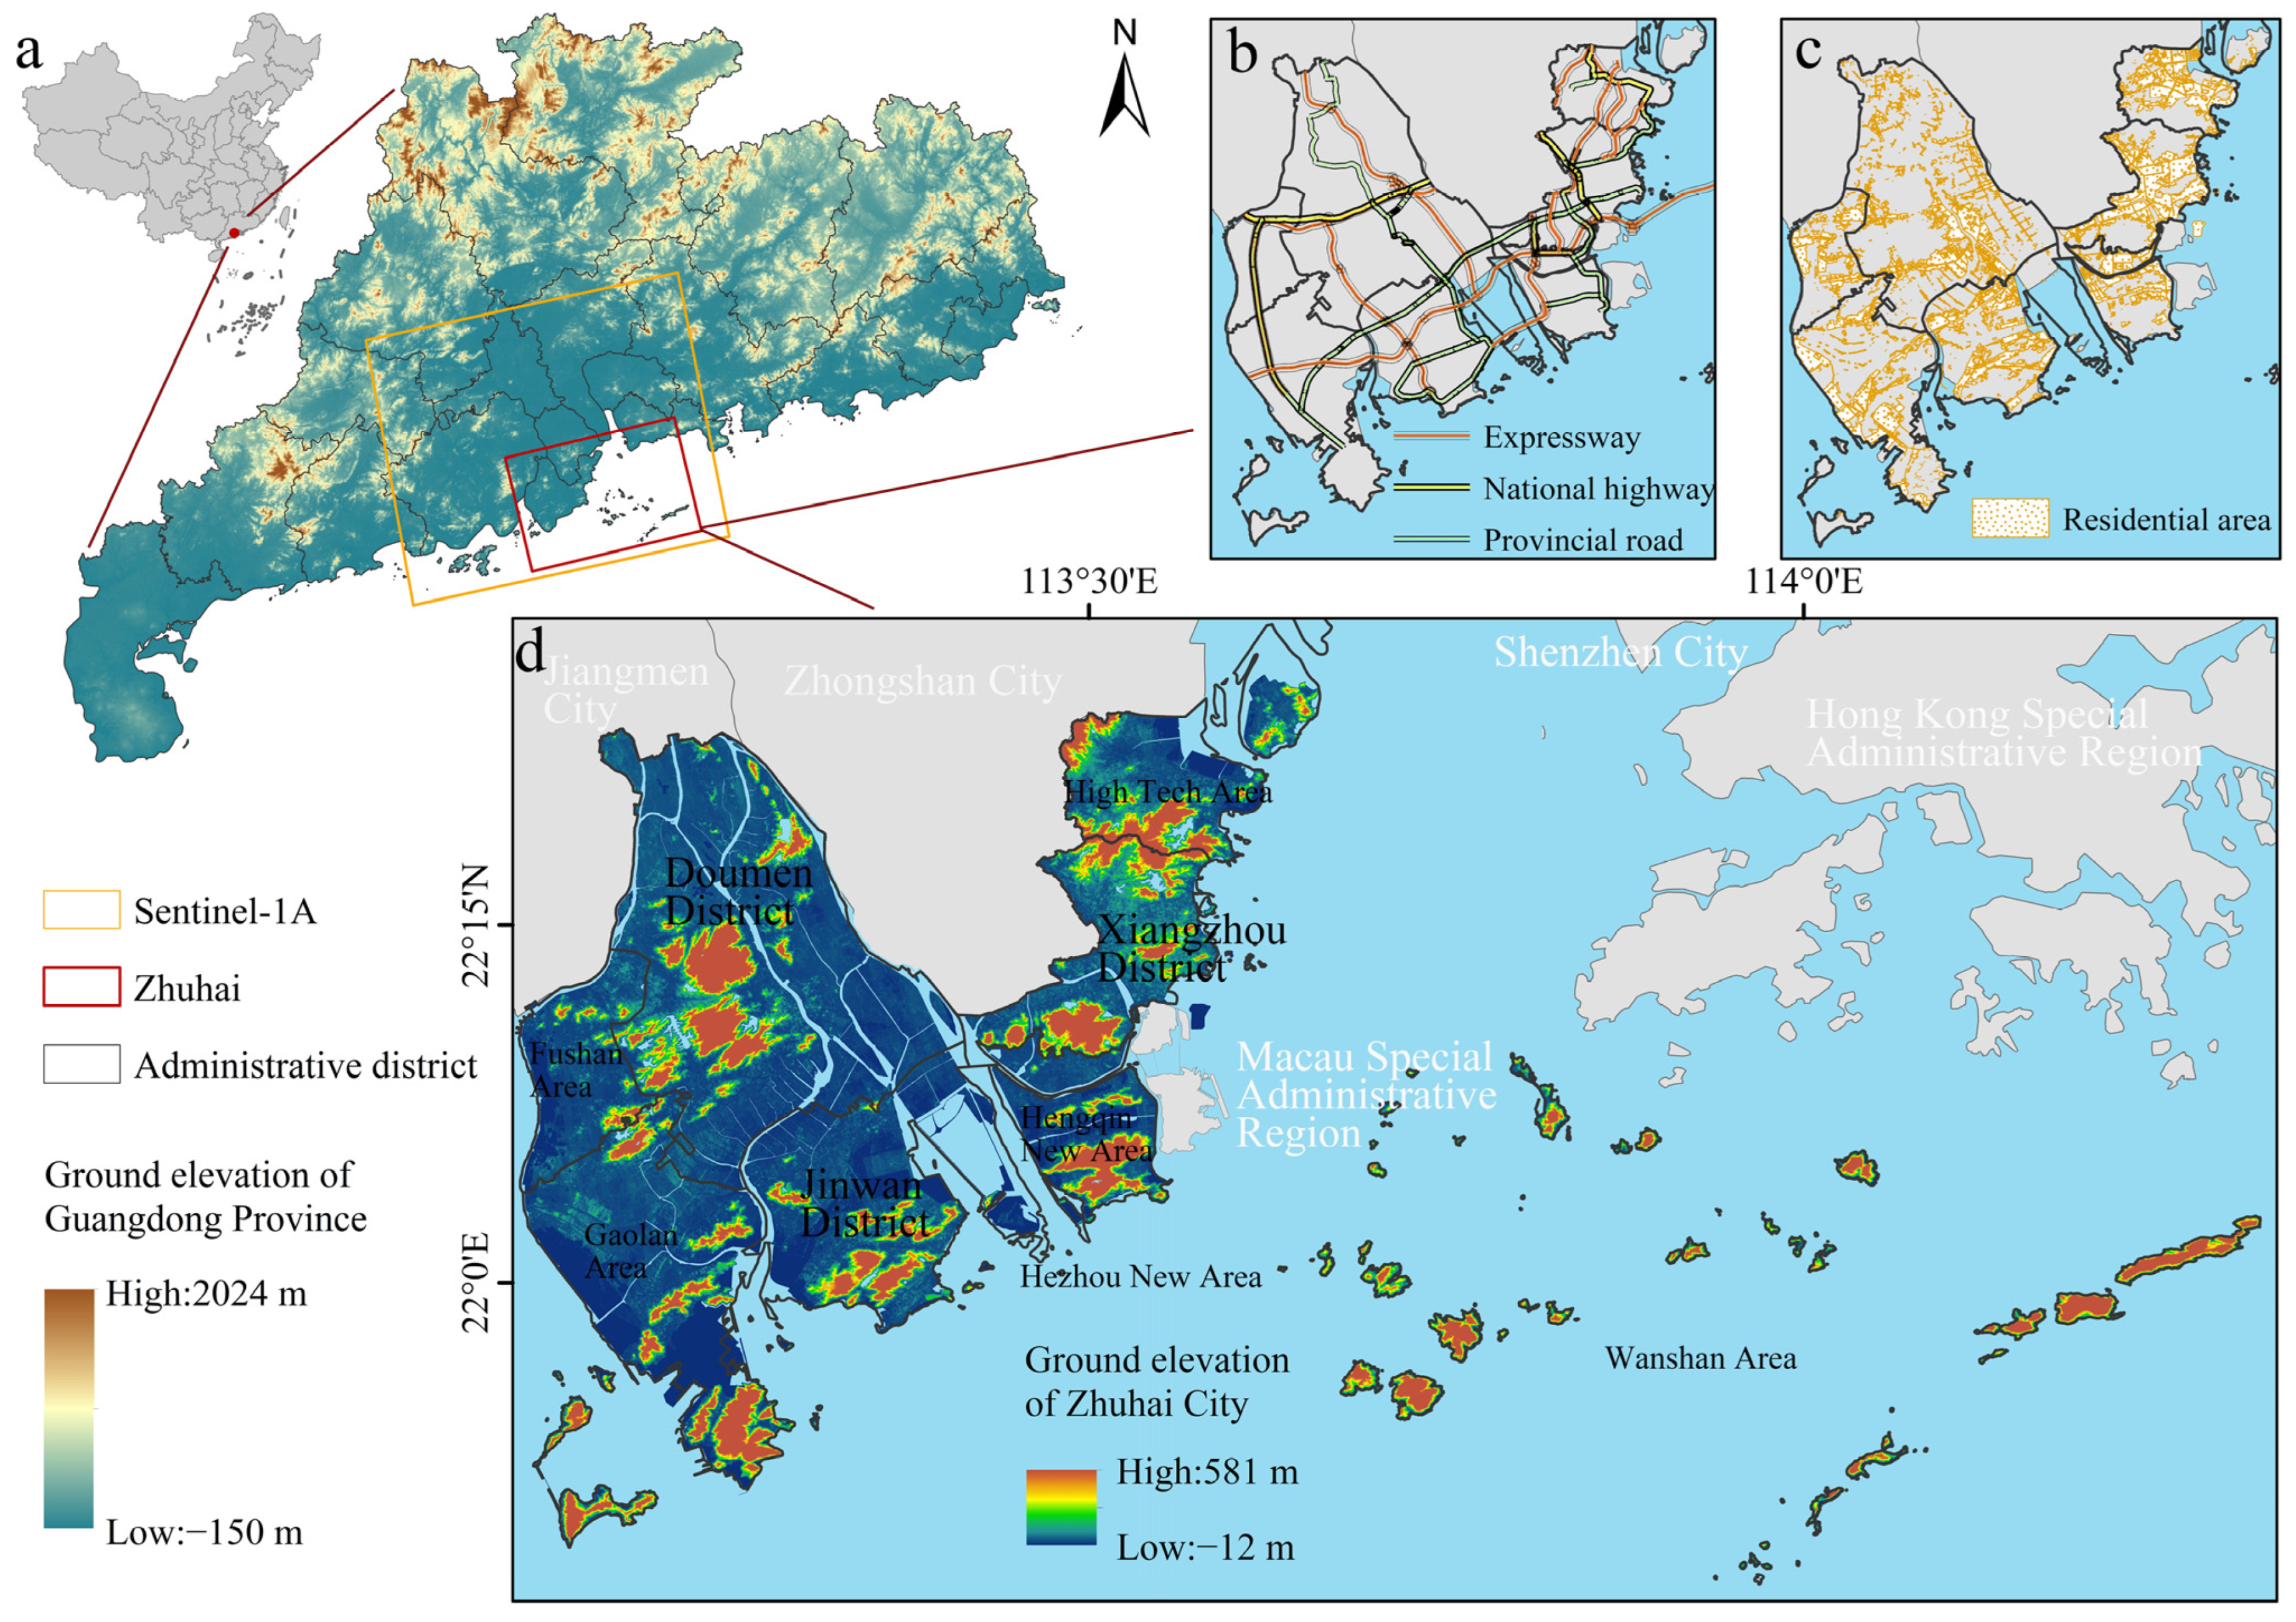
Figure 1. Location of the study area and ground elevation in Guangdong Province in (a); distribution of important city roads in the mainland region of Zhuhai in (b); distribution of residential land in the mainland region of Zhuhai in (c); ground elevation and administrative subdivision of Zhuhai City in (d).
Remotesensing 15 02424 g001
Figure 2. The regional geological map of Zhuhai is shown in (a). The table on the upper right indicates the Paleozoic, Mesozoic, and Cenozoic from left to right; the color patches on the top of the table correspond to the intrusive rock types in different geological history periods in Zhuhai; the color patches on the bottom of the table correspond to the stratigraphic codes. The geological section of MN (Jizui Village—Dongzui Mountain) is shown in (b), with different color patches indicating geotechnical types.
Remotesensing 15 02424 g002
Figure 3. The flow chart of processing.
Remotesensing 15 02424 g003
Figure 4. Land subsidence in Zhuhai. Subsidence rate in (a); accumulated subsidence in (b). The four areas boxed in red in (a,b) (labeled A, B, C and D in the upper left corner) are areas of severe subsidence.
Remotesensing 15 02424 g004
Figure 5. Time series change of cumulative subsidence in Zhuhai from 2016–2019 in (a); Linear fit of the monthly mean cumulative subsidence in (b), the green line indicates the three-year fit, the yellow line indicates the first-stage fit (July 2016 to September 2017), the blue line indicates the second-stage fit (September 2017 to March 2018), and the pink line indicates the third-stage fit (March 2018 to June 2019).
Remotesensing 15 02424 g005
Figure 6. Distribution of tectonic faults (indicated by solid purple lines), spatial variation of subsidence rates (indicated by gradual isoclines), and mountain locations (indicated by gray shading of mountains) are shown in (a); profile lines 1-1′, 2-2′ and 3-3′ (indicated by gray dashed lines) across the Niwan Gate Fault and the Pingsha Fault, typical InSAR monitoring points p1, p1′, p2, p2′, p3 and p3′ (indicated by yellow circles) on the three profile lines and ground subsidence on both sides of the two faults are shown in (b); changes in accumulative subsidence at six settlement sites over the study period is shown in (c).
Remotesensing 15 02424 g006
Figure 7. Subsidence rates of the InSAR monitoring points along 1-1′, 2-2′, and 3-3′ are indicated by purple, yellow, and blue dots, respectively. The gray dashed line indicates the locations of the faults, and the red dashed line indicates the locations of the maximum sedimentation rates. The numbers in different colors indicate the distance of each profile line at the fault or at the maximum settlement rate.
Remotesensing 15 02424 g007
Figure 8. The distribution of soft soils of different thicknesses in Zhuhai is shown in (a), the background of which is the result obtained by kriging interpolation of the subsidence rate; correlation analysis of soft soil thickness with ground subsidence rate (indicated by black solid line) and cumulative subsidence respectively (indicated by red solid line) are shown in (b); area and area percentage of soft soil thickness over 20m in different administrative divisions in (c).
Remotesensing 15 02424 g008
Figure 9. The intensity of different levels of groundwater development is shown in (a), the background of which is the result obtained by kriging interpolation of the subsidence rate; correlation analysis of groundwater development intensity with ground subsidence rate (indicated by black solid line) and cumulative subsidence respectively (indicated by red solid line) are shown in (b); distribution of aquaculture areas in 2019 obtained from visual interpretation in (c); the percentage of terrestrial aquaculture area in each administrative subdistrict (including terrestrial aquaculture areas and terrestrial restricted areas) obtained according to the Zhuhai Aquaculture Waters and Beaches Plan (2018–2030) is shown in (d); remote sensing images of aquaculture area (spatial resolution of 0.55 m) are shown in (df).
Remotesensing 15 02424 g009
Figure 10. Month-by-month subsidence rate versus month-by-month lowest temperature and precipitation in Zhuhai. Gray dashed line in the figure indicates no ground deformation, above the gray dashed line is surface uplift and below the gray dashed line is ground subsidence.
Remotesensing 15 02424 g010
Figure 11. Land subsidence in four severe subsidence case areas A, B, C and D in Zhuhai. Taking settlement area A as an example, the upper left graph indicates the subsidence rate with the 2016 remote sensing image in the background; the lower left graph indicates the distribution of typical settlement points (point 1~4) with the 2019 remote sensing image in the background; the upper right graph indicates the subsidence rate processed by kriging interpolation; the lower right graph indicates the change of accumulated subsidence at typical settlement points.
Remotesensing 15 02424 g011
Figure 12. Land subsidence along G228 National Road in B settlement area. Blue circles indicate the subsidence rate; pink circles indicate the cumulative sedimentation; gray background shows the ground elevation along national road, which has a resolution of 8.85 m.
Remotesensing 15 02424 g012
Figure 13. Zhuhai’s key regional economic indicators in 2019 are shown in (ae). The degree of the economic importance of Zhuhai obtained by the comprehensive index method in (g). The monitoring points with accumulated subsidence greater than 10 cm and the monitoring points with 5 cm/yr subsidence rate were selected for kernel density analysis, and the results are shown in (f,h), respectively. The results of subsidence vulnerability in Zhuhai obtained by the comprehensive index method are shown in (j). The administrative areas and road sections with high subsidence vulnerability extracted based on the above results are shown in (i,k), respectively.
Remotesensing 15 02424 g013
Table 1. Proportion of grading the severity of land subsidence.
Subsidence Severity (mm/yr)Low
>−10
Relatively Low
−30~−10
Medium
−50~−30
Relatively High
−80~−50
High
<−80
Total
Number of monitoring points553,219269,16768,55413,928499905,367
Percentage61.10%29.73%7.57%1.54%0.06%100%
Table 2. Severe subsidence area subsidence information.
Severe
Subsidence Area
Geographical LocationAverage
Subsidence Rate (mm/yr)
Maximum
Subsidence Rate (mm/yr)
Average
Cumulative Subsidence (mm)
A113°09′36″~113°13′24″E,
22°17′91″~22°20′19″N
−12.11−96.70−29.23
B113°29′48″~113°33′58″E,
22°24′58″~22°29′16″N
−28.48−83.15−89.15
C113°44′33″~113°51′96″E,
22°12′68″~22°16′97″N
−18.65−103.59−50.65
D113°26′21″~113°37′07″E,
22°10′27″~22°25′71″N
−22.35−100.01−70.17
Table 3. Comparative analysis with the results of ground subsidence studies in Zhuhai by other scholars.
Data and MethodSevere Subsidence AreaReferences
Study TimeDataQuantityMethodLocationVelocity
(mm/yr)
Accumulated
Subsidence (mm)
2006~
2011
ALOS1/
PALSAR
162SBASGaolan PortMAX: −87- [13]
2016~
2019
Sentinel-1A51SBASMost of Gaolan PortAVG: −3.15
MAX: −93.27
AVG: −4.94
MAX: −238.45
This study
2018~
2019
Sentinel-1A39SBAS + PSJinwan DistrictMAX:
Approx. −110
MAX:
Approx. −110
[67]
2016~
2019
Sentinel-1A51SBASJinwan District + Part of Gaolan AreaAVG: −7.14
MAX: −104.98
AVG: −12.98
MAX: −285.24
This study
2018~
2020
Sentinel-1A63PSHong Kong-Zhuhai-Macao Bridge Zhuhai LinkMAX: −23.89MAX:
Approx. −60
[23]
2016~
2019
Sentinel-1A51SBASHong Kong-Zhuhai-Macao Bridge Zhuhai LinkAVG: −0.96
MAX: −29.95
AVG: −4.98
MAX: −75.74
This study
2016~
2017
Sentinel-1A32SBASGaolan Area PartMAX: −75.04MAX:
Approx. −80
[60]
2016~
2019
Sentinel-1A51SBASGaolan Area PartAVG: −11.21
MAX: −69.97
AVG: −14.14
MAX: −189.62
This study
Disclaimer/Publisher’s Note: The statements, opinions and data contained in all publications are solely those of the individual author(s) and contributor(s) and not of MDPI and/or the editor(s). MDPI and/or the editor(s) disclaim responsibility for any injury to people or property resulting from any ideas, methods, instructions or products referred to in the content.