


Long-Term Change of Coastline Length along Selected Coastal Countries of Eurasia and African Continents

 ,
,  ,
,
Abstract
1. Introduction
2. Materials
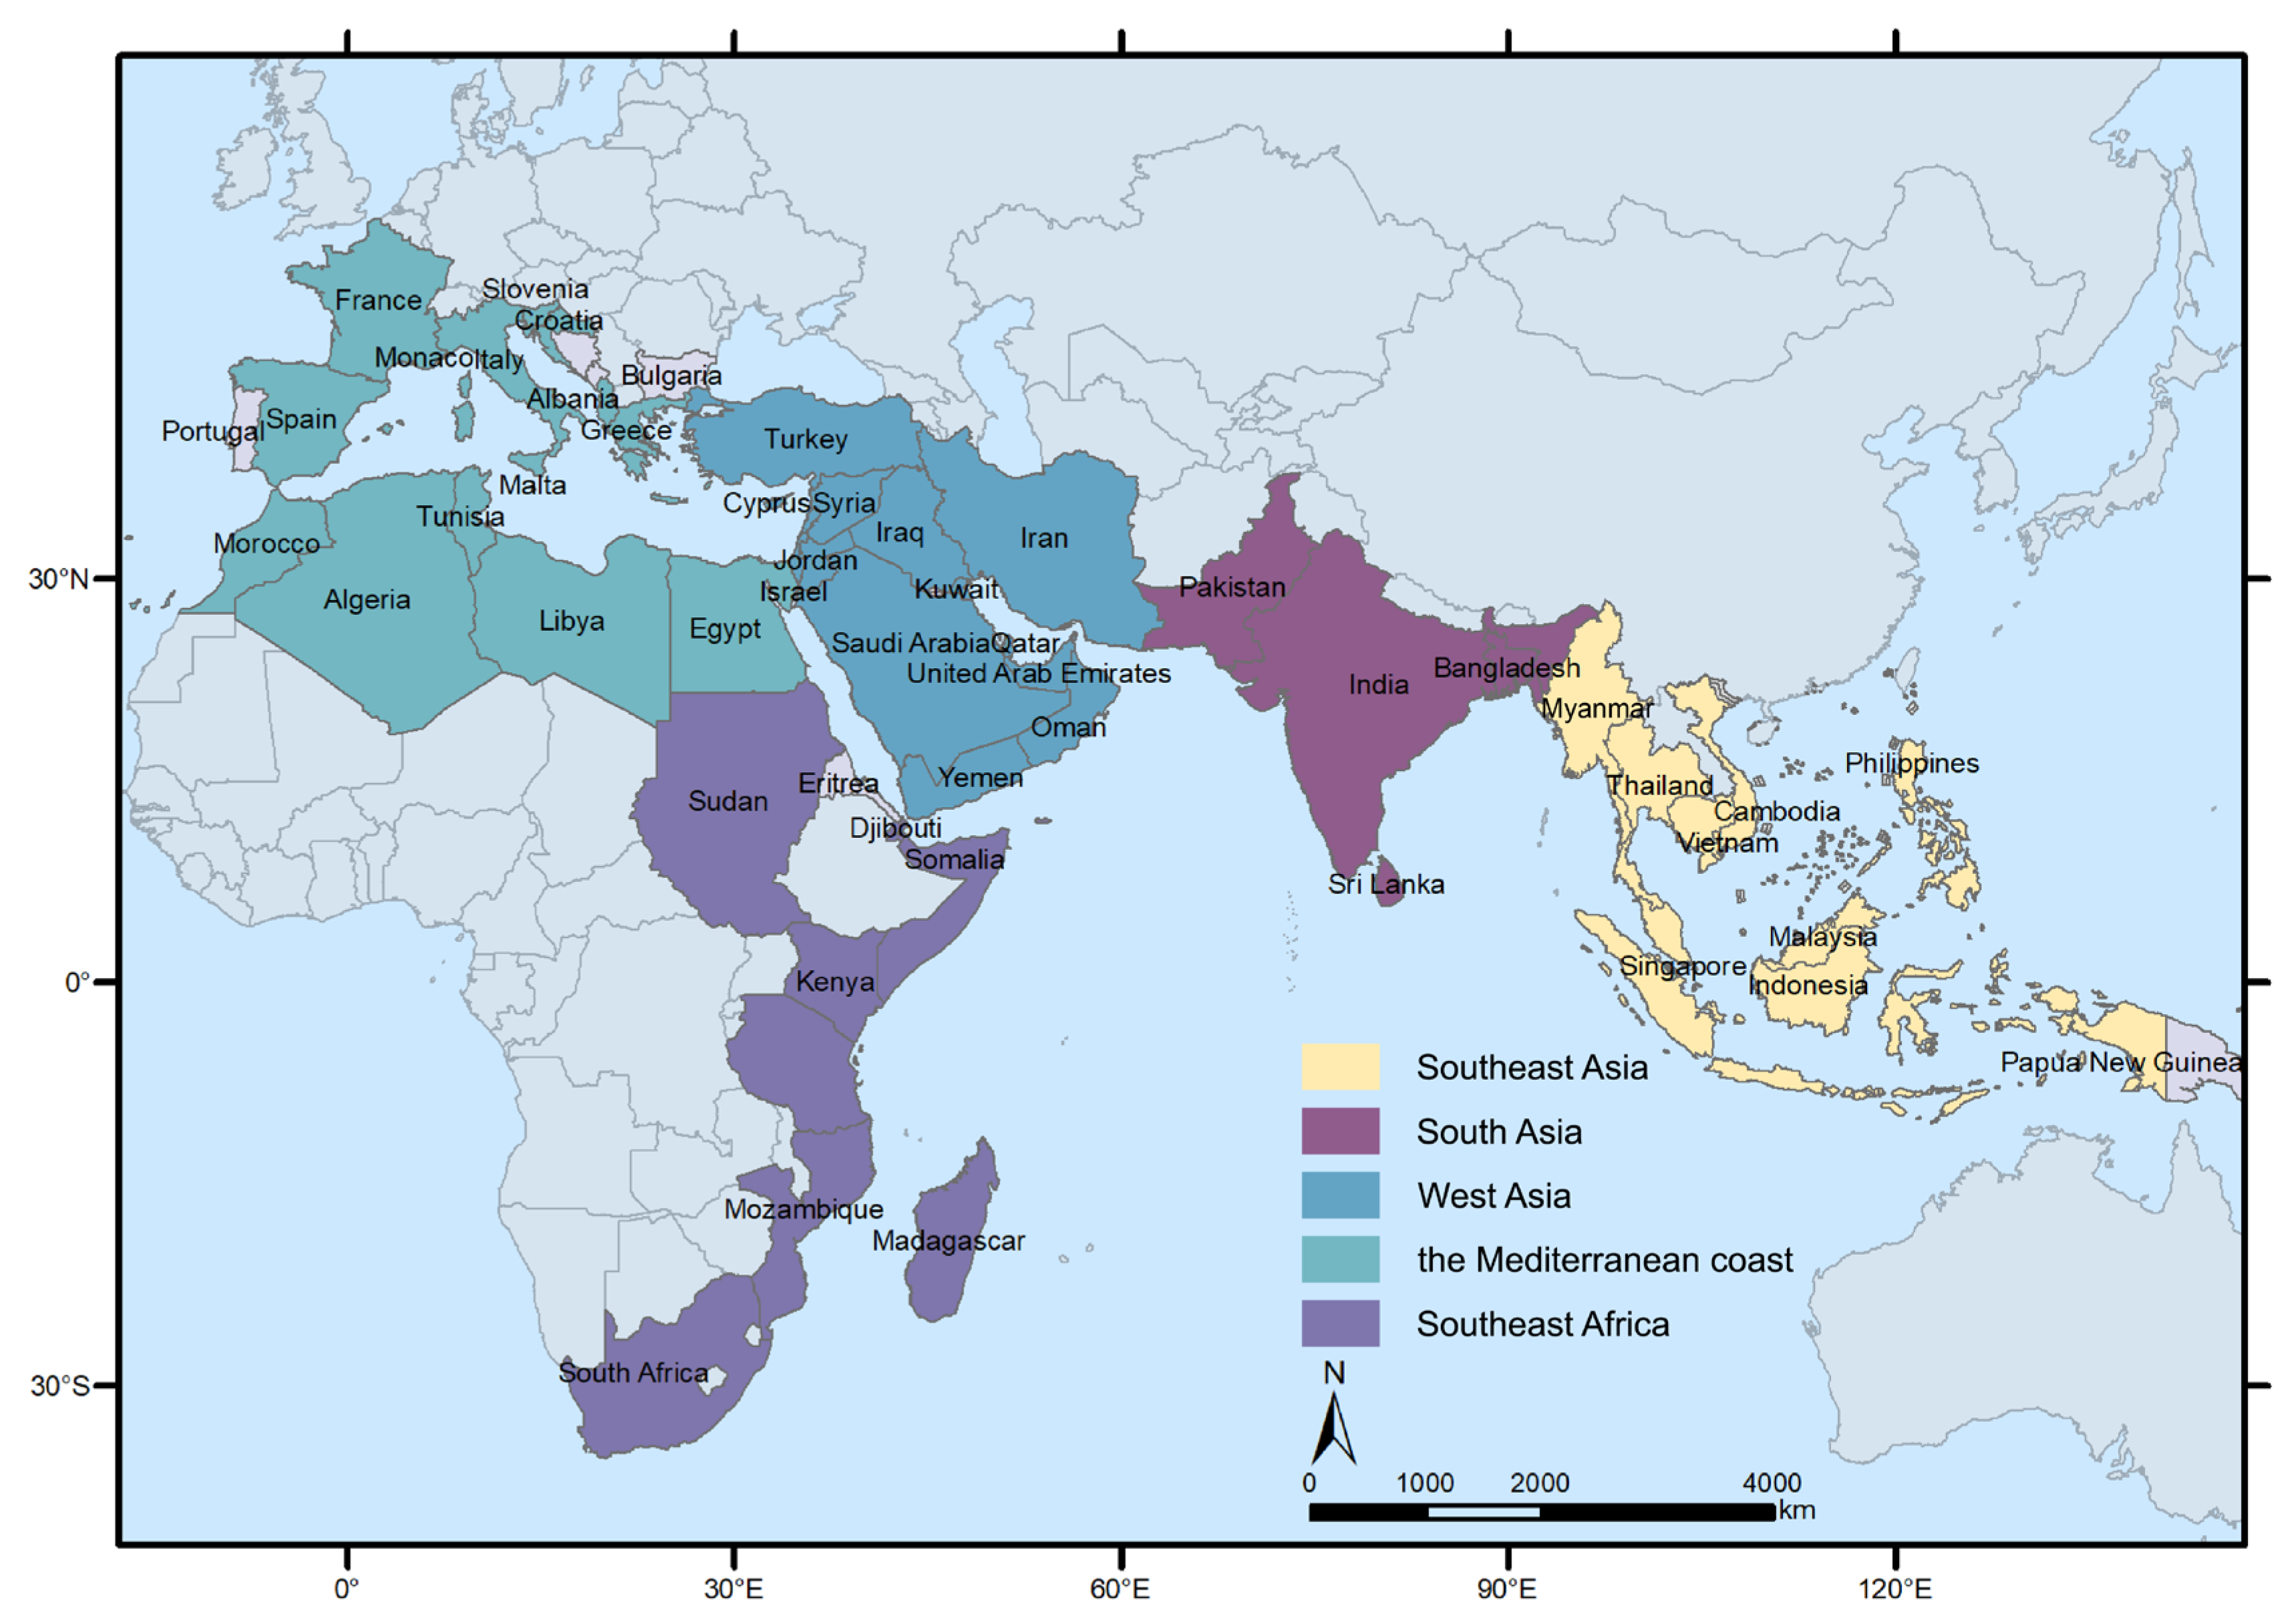
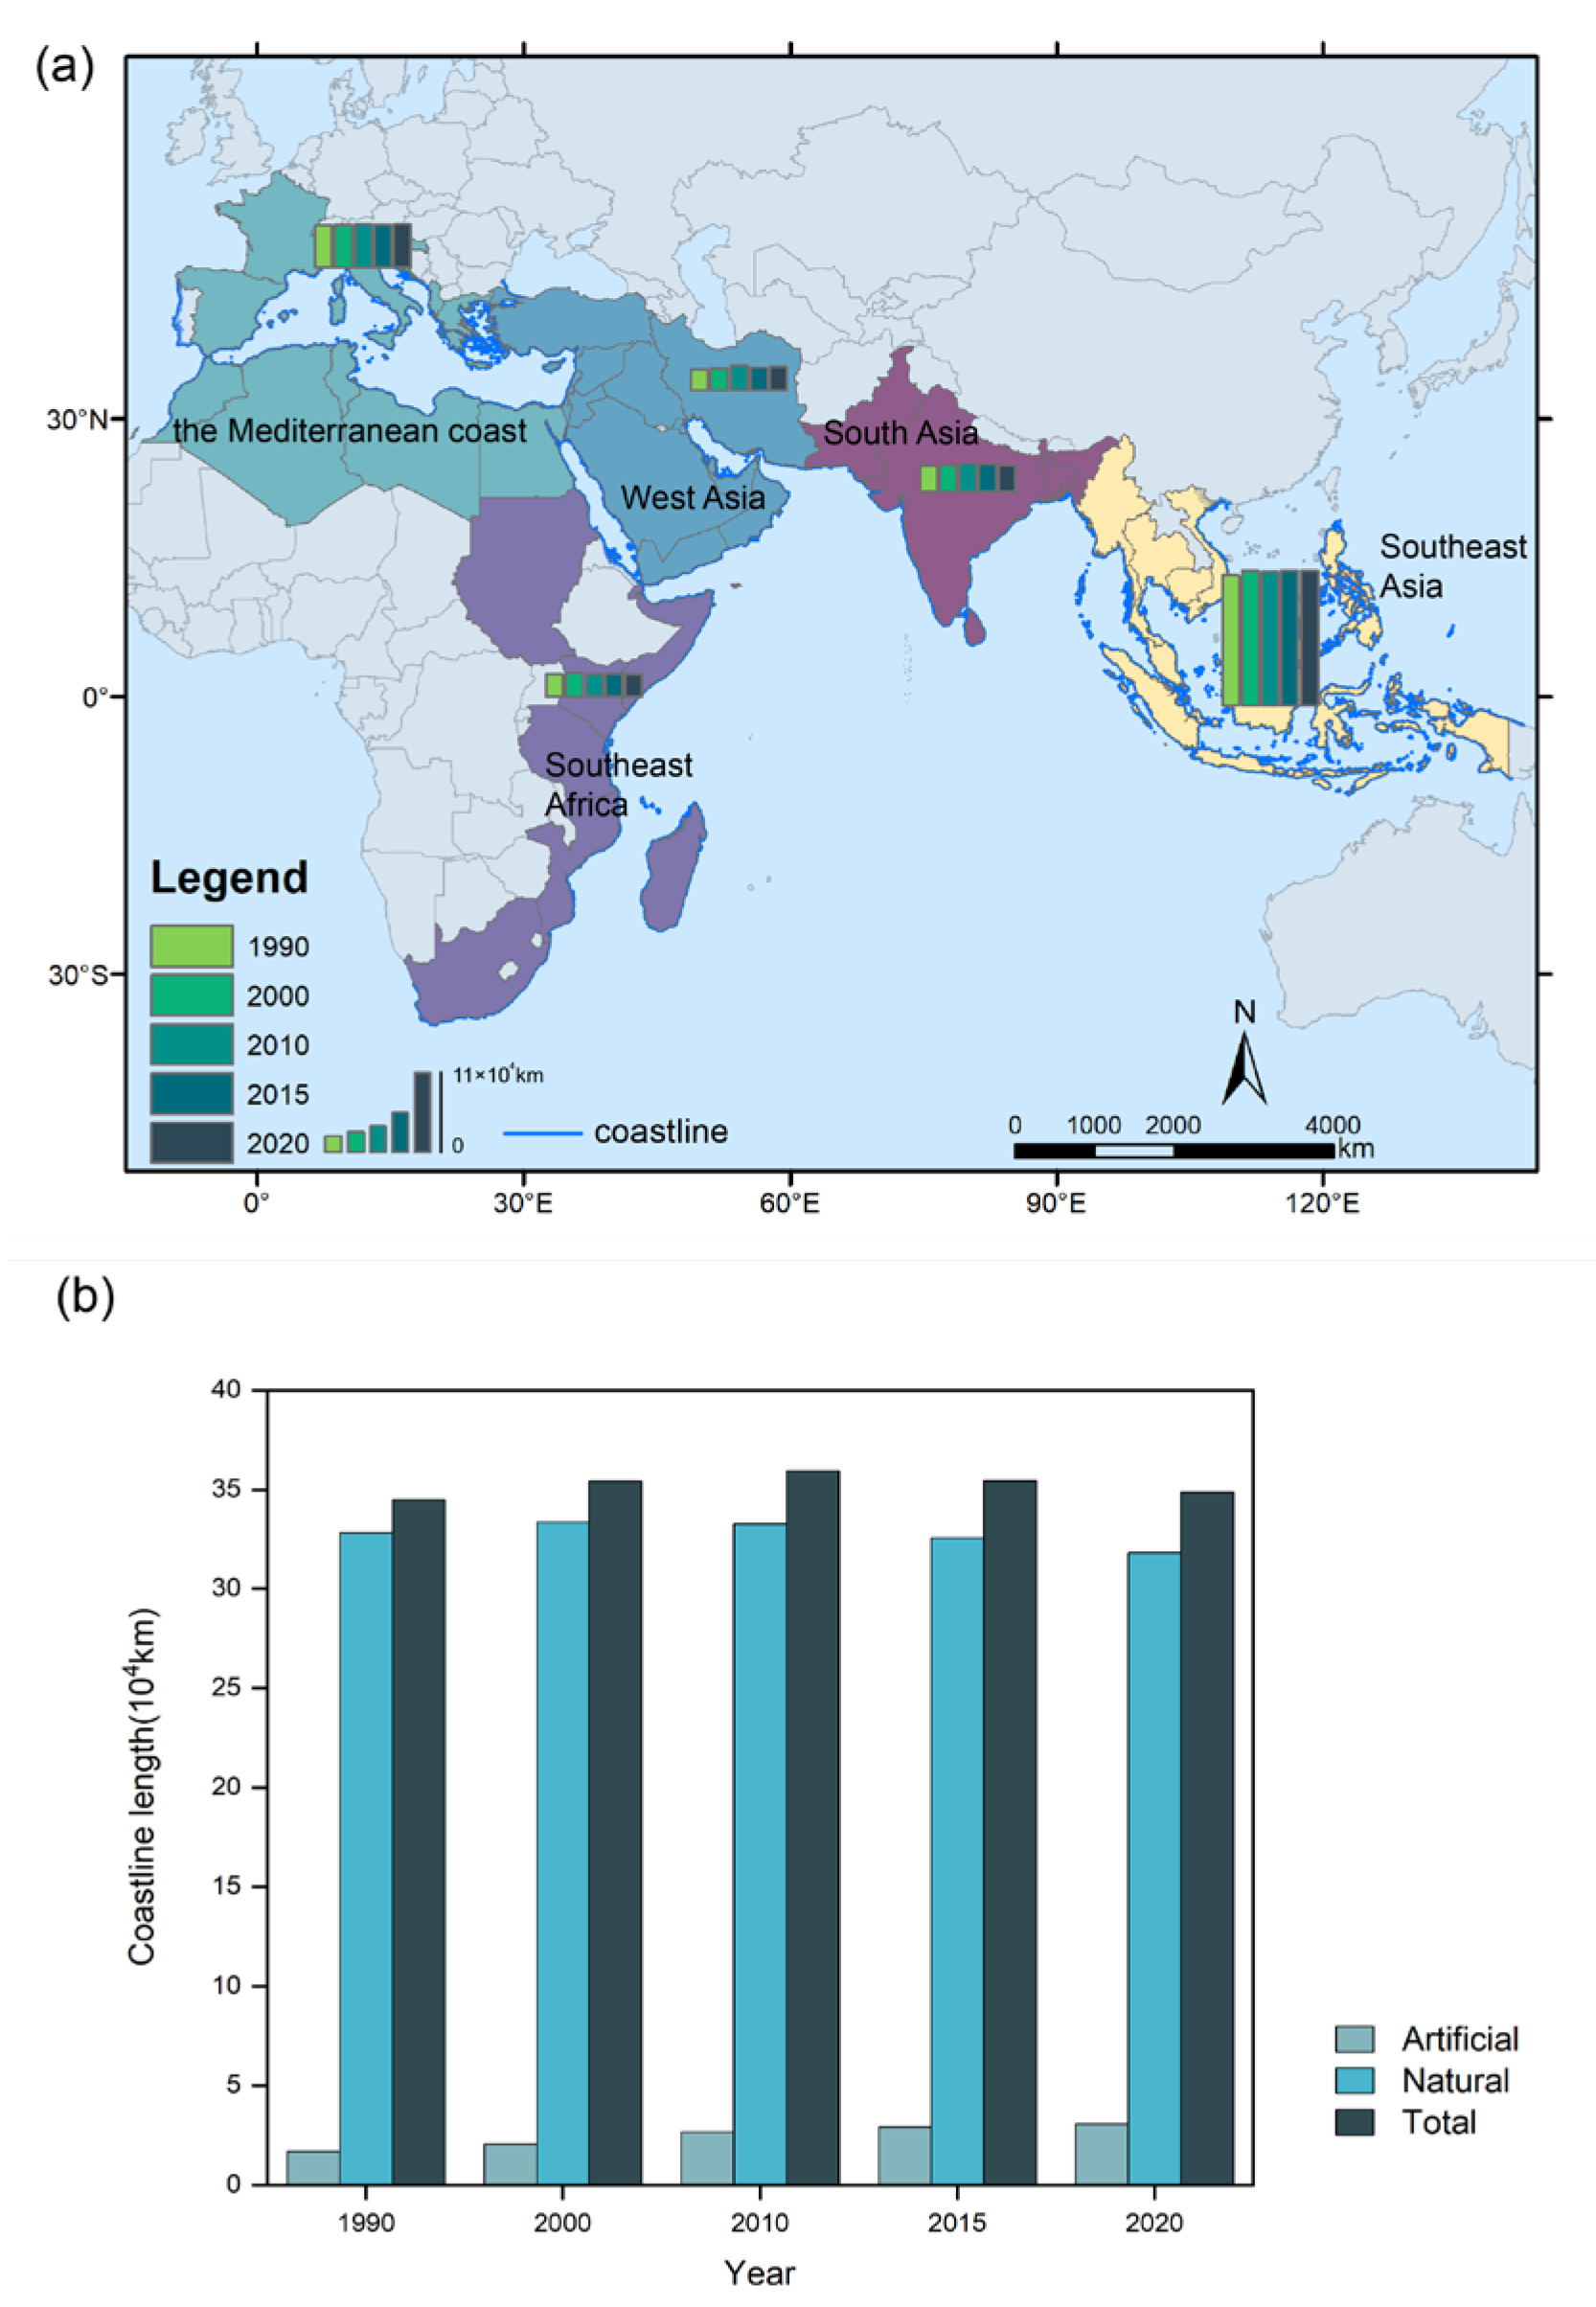
2.1. Study Area
2.2. Data Sources
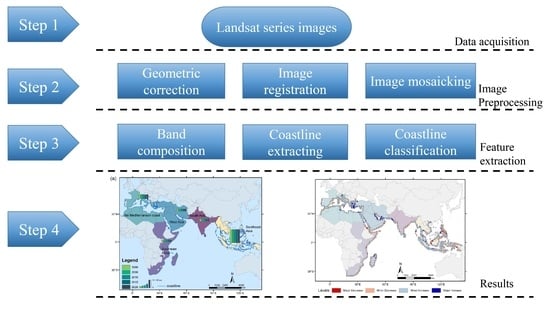
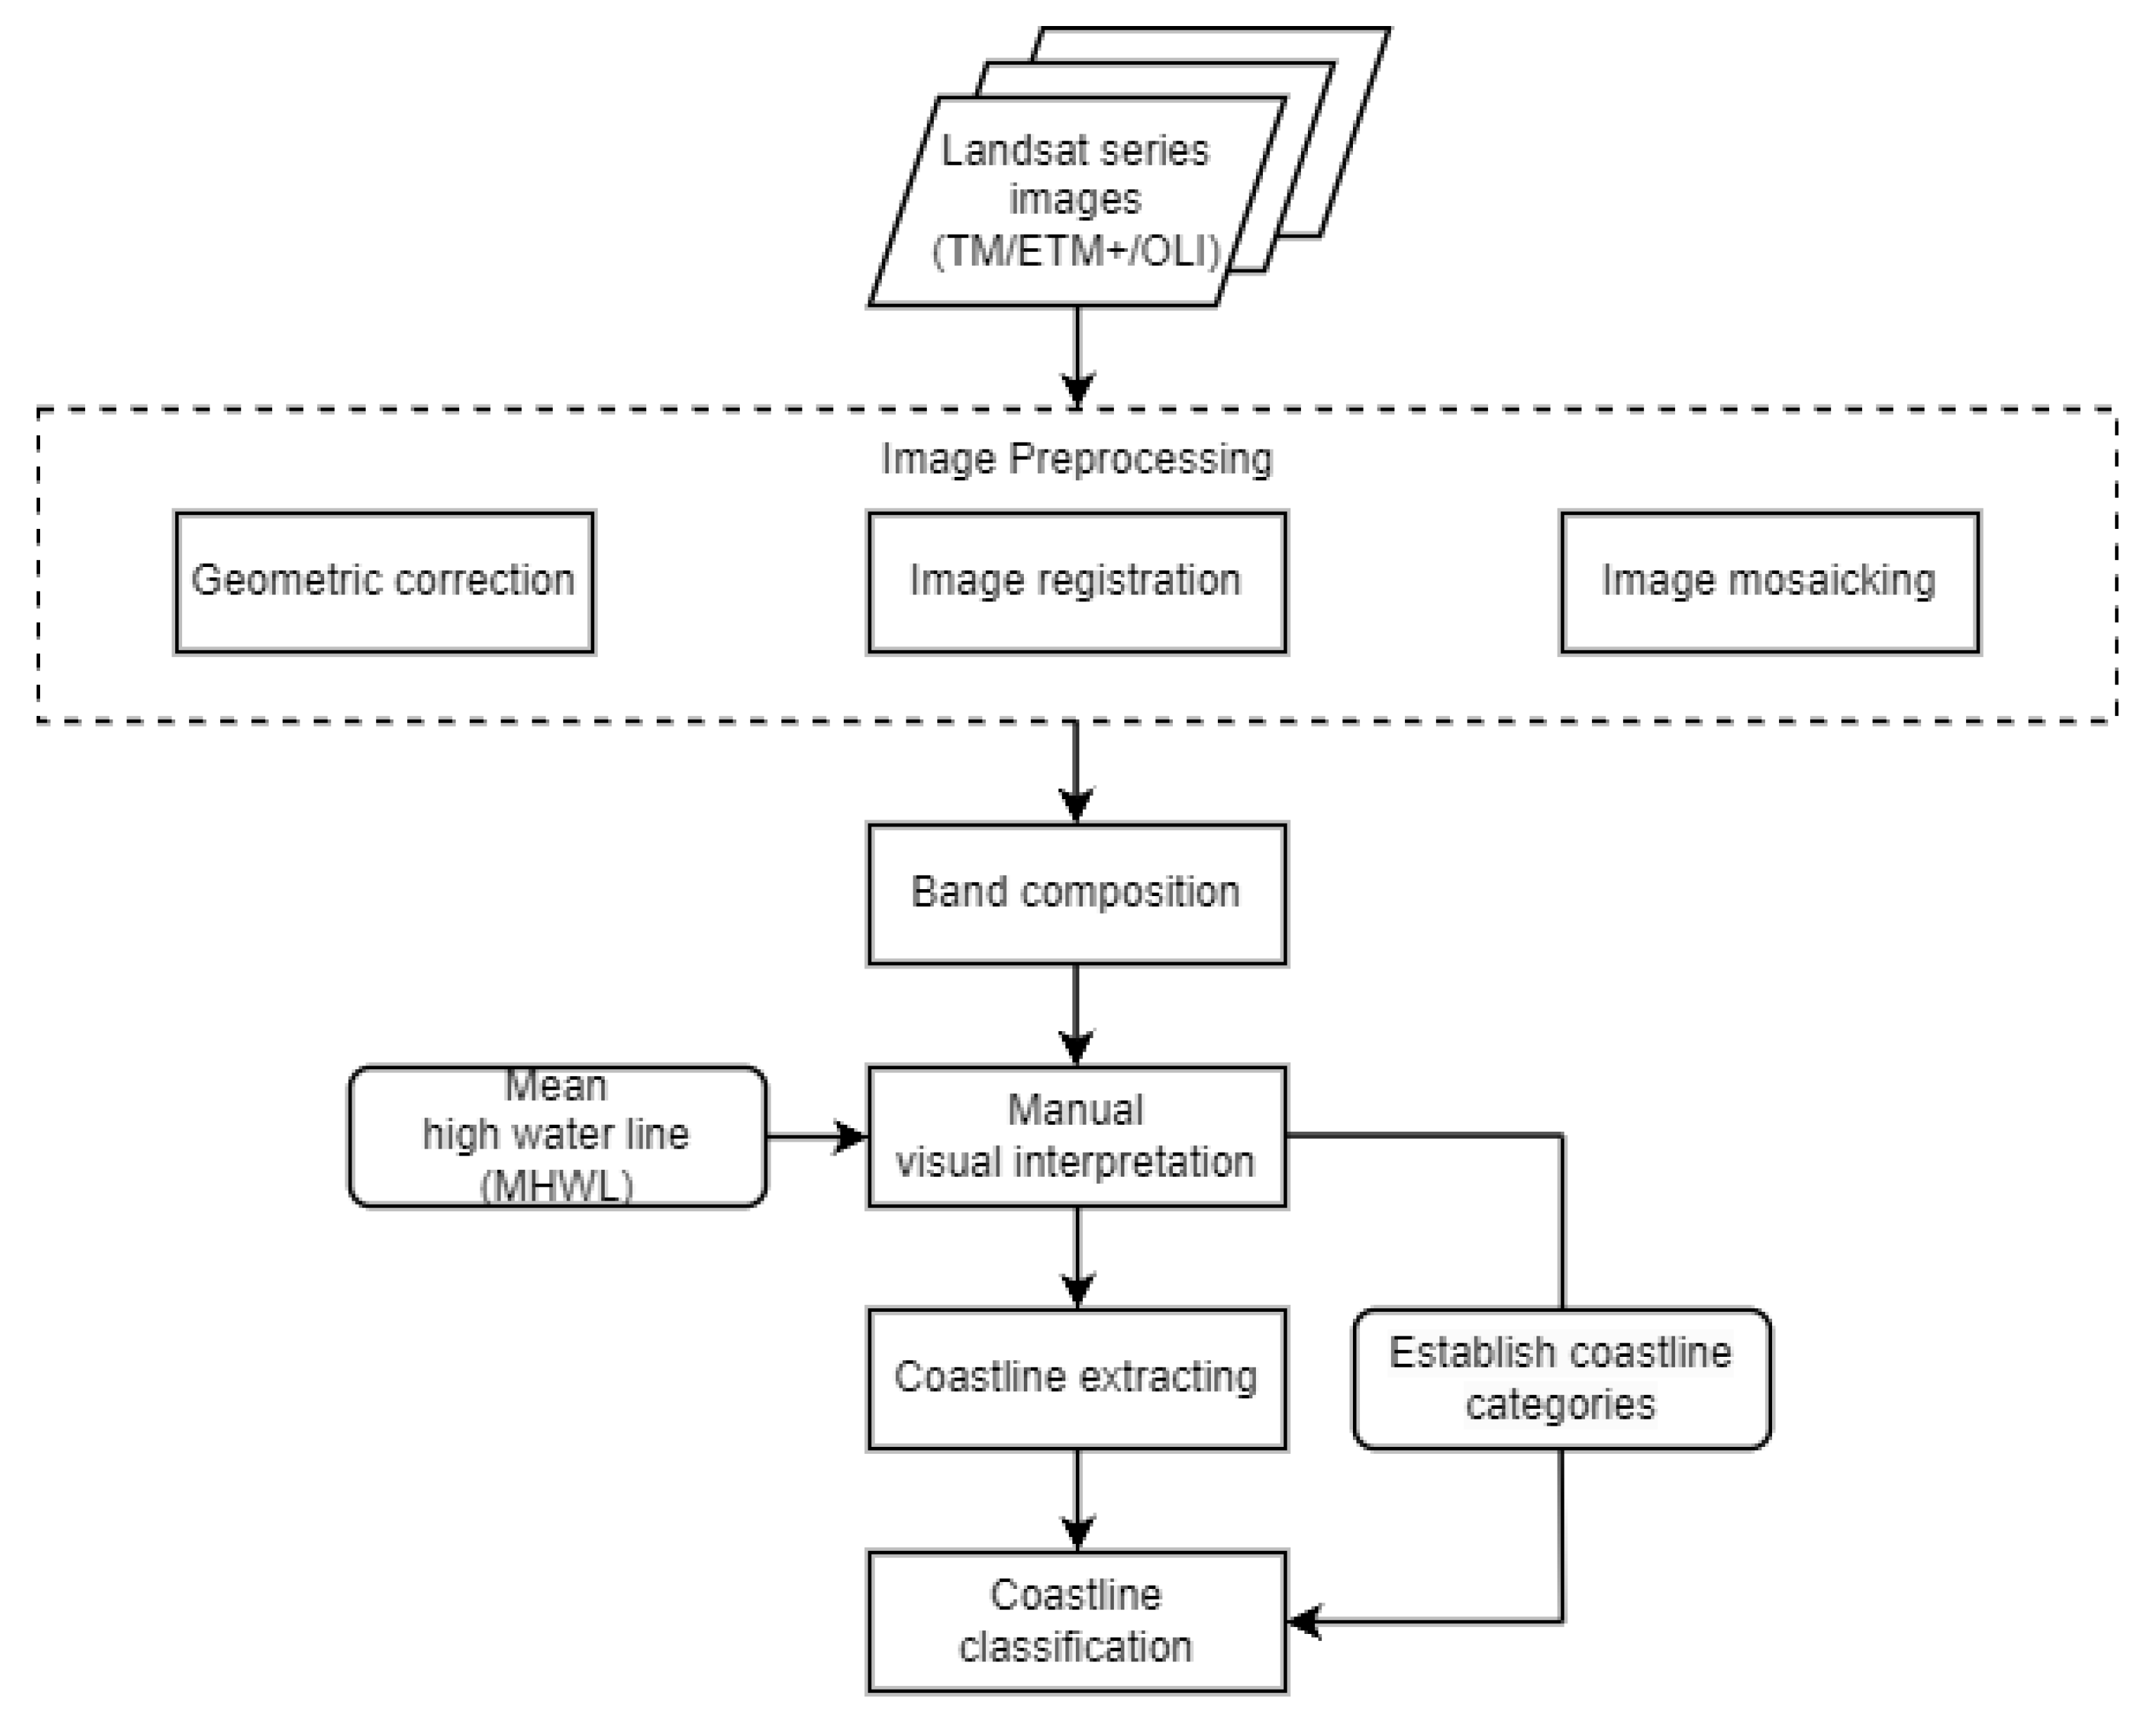
3. Methods
3.1. Coastline Definition and Classification
3.2. Indicators of Coastline Change
3.2.1. Coastline Change Rate (CCR)
3.2.2. Index of Coastline Utilization Degree (ICUD)
3.2.3. Fractal Dimension (FD)
4. Results
4.1. Coastline Length Change
4.2. Coastline Structure Change
4.3. Coastline Fractal Dimension Change
4.4. Changes of Land-Sea Pattern
5. Discussion
5.1. Driving Factors and Potential Impacts for Coastline Change
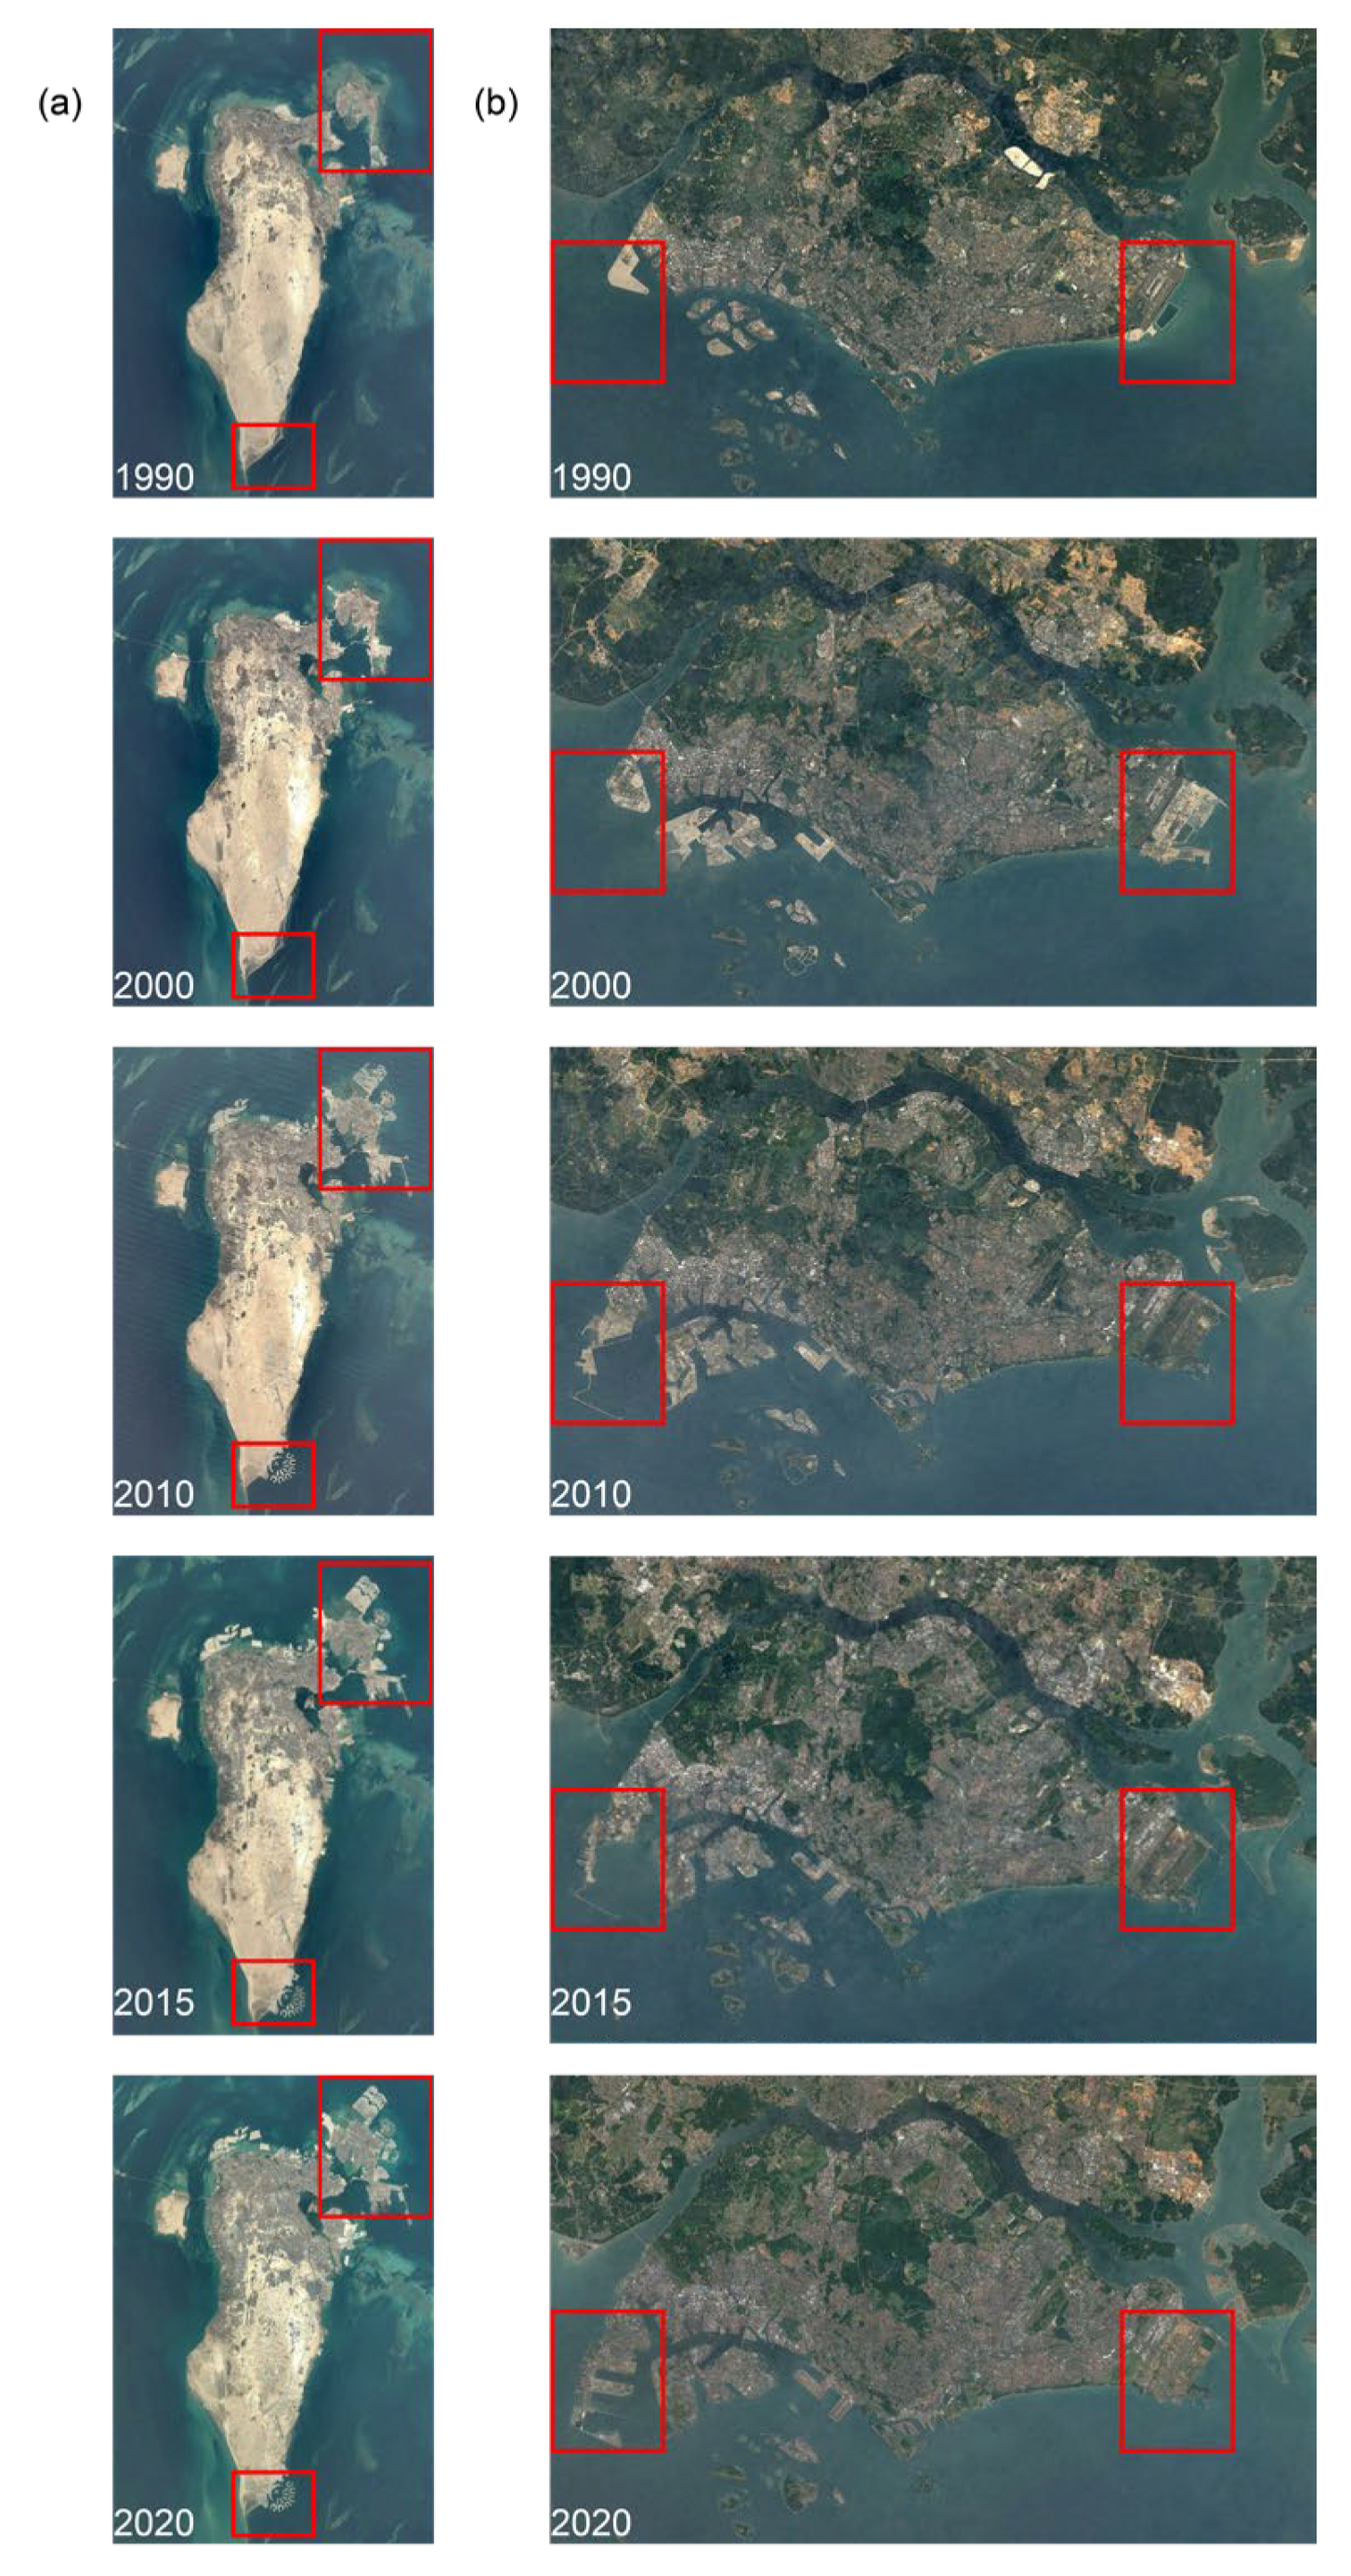
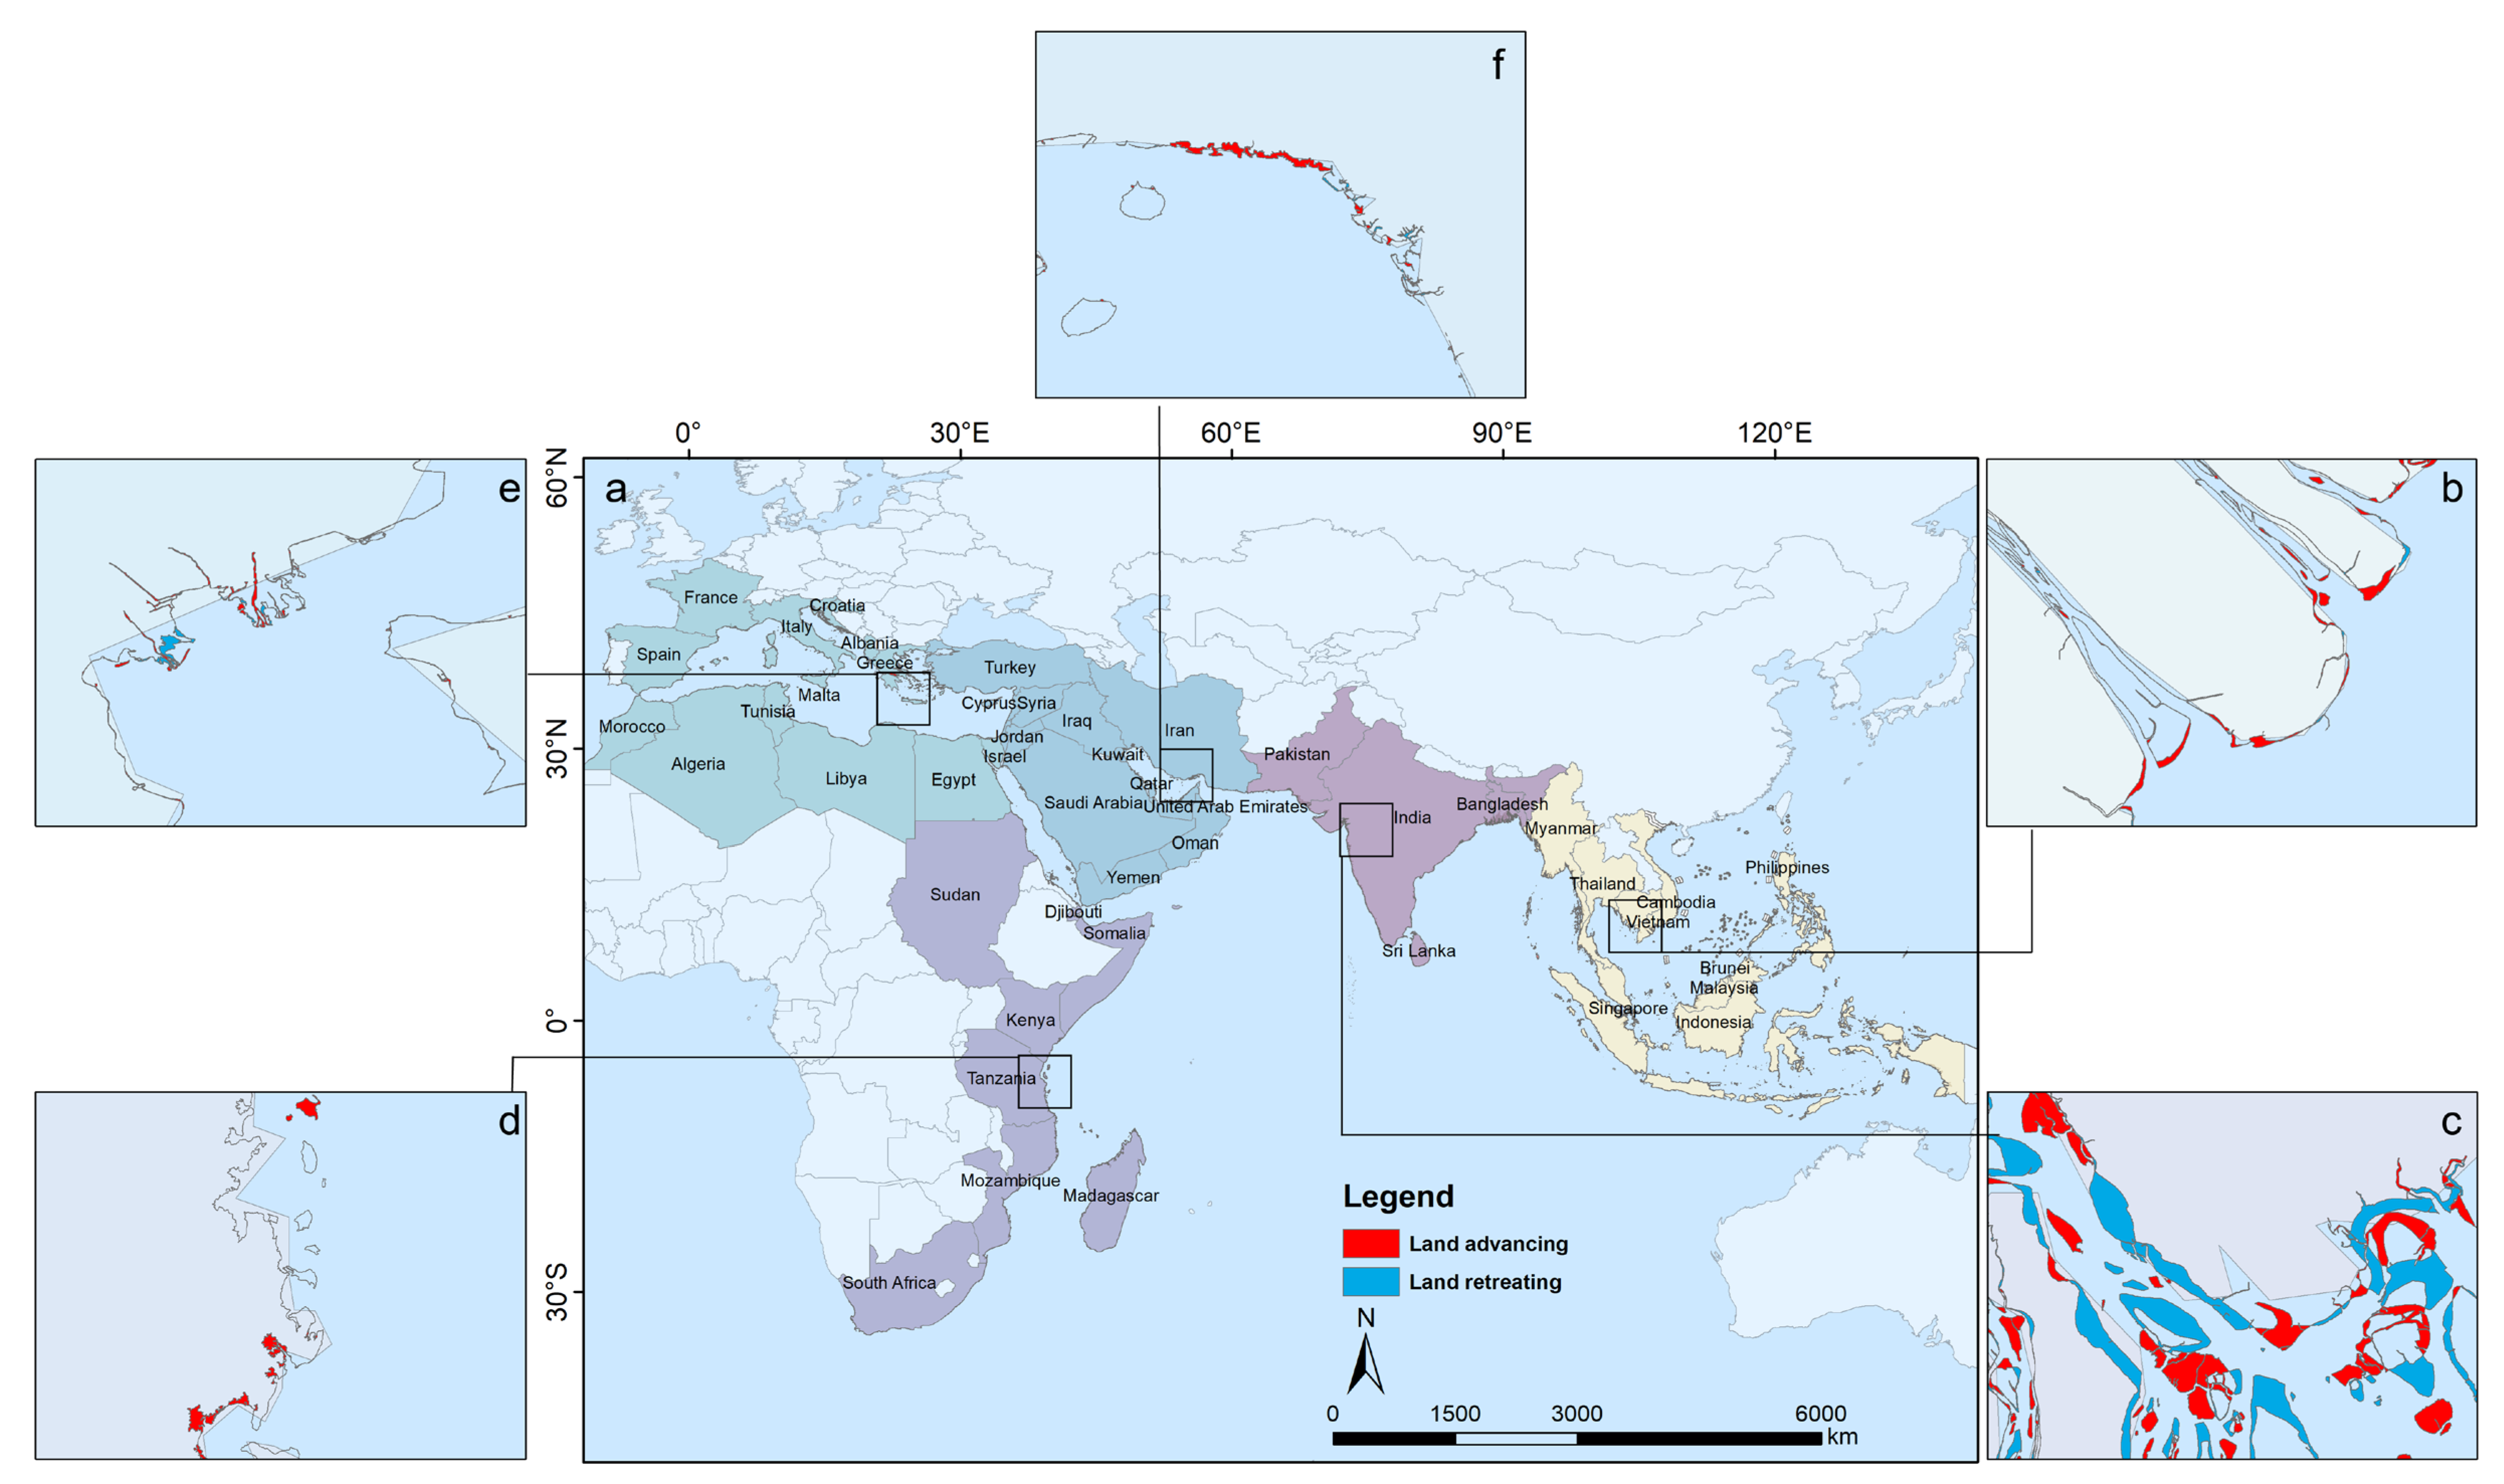
5.2. Selected Regions for Detailed Analysis
6. Conclusions
Author Contributions
Funding
Data Availability Statement
Acknowledgments
Conflicts of Interest
References
- Fabinyi, M.; Belton, B.; Dressler, W.H.; Knudsen, M.; Adhuri, D.S.; Abdul Aziz, A.; Akber, M.A.; Kittitornkool, J.; Kongkaew, C.; Marschke, M.; et al. Coastal Transitions: Small-Scale Fisheries, Livelihoods, and Maritime Zone Developments in Southeast Asia. J. Rural Stud. 2022, 91, 184–194. [Google Scholar] [CrossRef]
- Žilinskas, G.; Janušaitė, R.; Jarmalavičius, D.; Pupienis, D. The Impact of Klaipėda Port Entrance Channel Dredging on the Dynamics of Coastal Zone, Lithuania. Oceanologia 2020, 62, 489–500. [Google Scholar] [CrossRef]
- Romine, B.M.; Fletcher, C.H. A Summary of Historical Shoreline Changes on Beaches of Kauai, Oahu, and Maui, Hawaii. J. Coast. Res. 2013, 288, 605–614. [Google Scholar] [CrossRef]
- Krien, Y.; Dudon, B.; Roger, J.; Arnaud, G.; Zahibo, N. Assessing Storm Surge Hazard and Impact of Sea Level Rise in the Lesser Antilles Case Study of Martinique. Nat. Hazards Earth Syst. Sci. 2017, 17, 1559–1571. [Google Scholar] [CrossRef]
- Hou, J.; Li, X.; Wang, P.; Wang, J.; Ren, Z. Hazard Analysis of Tsunami Disaster on the Maritime Silk Road. Acta Oceanol. Sin. 2020, 39, 74–82. [Google Scholar] [CrossRef]
- Aiello, A.; Canora, F.; Pasquariello, G.; Spilotro, G. Shoreline Variations and Coastal Dynamics: A Space-Time Data Analysis of the Jonian Littoral, Italy. Estuar. Coast. Shelf Sci. 2013, 129, 124–135. [Google Scholar] [CrossRef]
- Thia-Eng, C. Essential Elements of Integrated Coastal Zone Management. Ocean Coast. Manag. 1993, 21, 81–108. [Google Scholar] [CrossRef]
- Small, C.; Nicholls, R.J. A Global Analysis of Human Settlement in Coastal Zones. J. Coast. Res. 2003, 19, 584–599. [Google Scholar]
- Kummu, M.; de Moel, H.; Salvucci, G.; Viviroli, D.; Ward, P.J.; Varis, O. Over the Hills and Further Away from Coast: Global Geospatial Patterns of Human and Environment over the 20th–21st Centuries. Environ. Res. Lett. 2016, 11, 034010. [Google Scholar] [CrossRef]
- Kannan, R.; Anand, K.V.; Sundar, V.; Sannasiraj, S.A.; Rangarao, V. Shoreline Changes along the Northern Coast of Chennai Port, from Field Measurements. ISH J. Hydraul. Eng. 2014, 20, 24–31. [Google Scholar] [CrossRef]
- Petrişor, A.-I.; Hamma, W.; Nguyen, H.D.; Randazzo, G.; Muzirafuti, A.; Stan, M.-I.; Tran, V.T.; Aştefănoaiei, R.; Bui, Q.-T.; Vintilă, D.-F.; et al. Degradation of Coastlines under the Pressure of Urbanization and Tourism: Evidence on the Change of Land Systems from Europe, Asia and Africa. Land 2020, 9, 275. [Google Scholar] [CrossRef]
- Nicholls, R.J.; Woodroffe, C.; Burkett, V. Chapter 20—Coastline Degradation as an Indicator of Global Change. In Climate Change, 2nd ed.; Letcher, T.M., Ed.; Elsevier: Boston, MA, USA, 2016; pp. 309–324. [Google Scholar]
- Hegazy, I.R. Towards Sustainable Urbanization of Coastal Cities: The Case of Al-Arish City, Egypt. Ain Shams Eng. J. 2021, 12, 2275–2284. [Google Scholar] [CrossRef]
- Luijendijk, A.; Hagenaars, G.; Ranasinghe, R.; Baart, F.; Donchyts, G.; Aarninkhof, S. The State of the World’s Beaches. Sci. Rep. 2018, 8, 6641. [Google Scholar] [CrossRef] [PubMed]
- Pajak, M.J.; Leatherman, S. The High Water Line as Shoreline Indicator. J. Coast. Res. 2002, 18, 329–337. [Google Scholar]
- Kabir, M.A.; Salauddin, M.; Hossain, K.T.; Tanim, I.A.; Saddam, M.M.H.; Ahmad, A.U. Assessing the Shoreline Dynamics of Hatiya Island of Meghna Estuary in Bangladesh Using Multiband Satellite Imageries and Hydro-Meteorological Data. Reg. Stud. Mar. Sci. 2020, 35, 101167. [Google Scholar] [CrossRef]
- Mills, J.P.; Buckley, S.J.; Mitchell, H.L.; Clarke, P.J.; Edwards, S.J. A Geomatics Data Integration Technique for Coastal Change Monitoring. Earth Surf. Process. Landf. 2005, 30, 651–664. [Google Scholar] [CrossRef]
- Xu, N. Detecting Coastline Change with All Available Landsat Data over 1986–2015: A Case Study for the State of Texas, USA. Atmosphere 2018, 9, 107. [Google Scholar] [CrossRef]
- Masselink, G.; Brooks, S.; Poate, T.; Stokes, C.; Scott, T. Coastal Dune Dynamics in Embayed Settings with Sea-Level Rise—Examples from the Exposed and Macrotidal North Coast of SW England. Mar. Geol. 2022, 450, 106853. [Google Scholar] [CrossRef]
- Murray, N.J.; Phinn, S.P.; Fuller, R.A.; DeWitt, M.; Ferrari, R.; Johnston, R.; Clinton, N.; Lyons, M.B. High-resolution global maps of tidal flat ecosystems from 1984 to 2019. Sci. Data 2022, 9, 542. [Google Scholar] [CrossRef]
- Jennings, S. Coastal Tourism and Shoreline Management. Ann. Tour. Res. 2004, 31, 899–922. [Google Scholar] [CrossRef]
- Peterson, C.H.; Bishop, M.J. Assessing the Environmental Impacts of Beach Nourishment. BioScience 2005, 55, 887. [Google Scholar] [CrossRef]
- Syvitski, J.P.M.; Kettner, A.J.; Overeem, I.; Hutton, E.W.H.; Hannon, M.T.; Brakenridge, G.R.; Day, J.; Vörösmarty, C.; Saito, Y.; Giosan, L.; et al. Sinking Deltas Due to Human Activities. Nat. Geosci. 2009, 2, 681–686. [Google Scholar] [CrossRef]
- Carugati, L.; Gatto, B.; Rastelli, E.; Lo Martire, M.; Coral, C.; Greco, S.; Danovaro, R. Impact of Mangrove Forests Degradation on Biodiversity and Ecosystem Functioning. Sci. Rep. 2018, 8, 13298. [Google Scholar] [CrossRef] [PubMed]
- Cao, T.; Han, D.; Song, X. Past, Present, and Future of Global Seawater Intrusion Research: A Bibliometric Analysis. J. Hydrol. 2021, 603, 126844. [Google Scholar] [CrossRef]
- Janušaitė, R.; Jarmalavičius, D.; Pupienis, D.; Žilinskas, G.; Jukna, L. Nearshore Sandbar Switching Episodes and Their Relationship with Coastal Erosion at the Curonian Spit, Baltic Sea. Oceanologia 2021, 65, S007832342100097X. [Google Scholar] [CrossRef]
- Phan, M.H.; Stive, M.J.F. Managing Mangroves and Coastal Land Cover in the Mekong Delta. Ocean Coast. Manag. 2022, 219, 106013. [Google Scholar] [CrossRef]
- Dar, I.A.; Dar, M.A. Prediction of Shoreline Recession Using Geospatial Technology: A Case Study of Chennai Coast, Tamil Nadu, India. J. Coast. Res. 2009, 256, 1276–1286. [Google Scholar] [CrossRef]
- Ng, L.S.; Campos-Arceiz, A.; Sloan, S.; Hughes, A.C.; Tiang, D.C.F.; Li, B.V.; Lechner, A.M. The Scale of Biodiversity Impacts of the Belt and Road Initiative in Southeast Asia. Biol. Conserv. 2020, 248, 108691. [Google Scholar] [CrossRef]
- Hughes, A.C.; Lechner, A.M.; Chitov, A.; Horstmann, A.; Hinsley, A.; Tritto, A.; Chariton, A.; Li, B.V.; Ganapin, D.; Simonov, E.; et al. Horizon Scan of the Belt and Road Initiative. Trends Ecol. Evol. 2020, 35, 583–593. [Google Scholar] [CrossRef]
- Li, S.; Liu, Y.; Yang, H.; Yu, X.; Zhang, Y.; Wang, C. Integrating Ecosystem Services Modeling into Effectiveness Assessment of National Protected Areas in a Typical Arid Region in China. J. Environ. Manag. 2021, 297, 113408. [Google Scholar] [CrossRef]
- Liu, Q.; Trinder, J.; Turner, I.L. Automatic Super-Resolution Shoreline Change Monitoring Using Landsat Archival Data: A Case Study at Narrabeen-Collaroy Beach, Australia. J. Appl. Remote Sens. 2017, 11, 016036. [Google Scholar] [CrossRef]
- Muttitanon, W.; Tripathi, N.K. Land Use/Land Cover Changes in the Coastal Zone of Ban Don Bay, Thailand Using Landsat 5 TM Data. Int. J. Remote Sens. 2005, 26, 2311–2323. [Google Scholar] [CrossRef]
- Shalaby, A.; Tateishi, R. Remote Sensing and GIS for Mapping and Monitoring Land Cover and Land-Use Changes in the Northwestern Coastal Zone of Egypt. Appl. Geogr. 2007, 27, 28–41. [Google Scholar] [CrossRef]
- Zheng, C.W.; Pan, J.; Li, C.Y. Global Oceanic Wind Speed Trends. Ocean Coast. Manag. 2016, 129, 15–24. [Google Scholar] [CrossRef]
- Boak, E.H.; Turner, I.L. Shoreline definition and detection: A review. J. Coast. Res. 2005, 21, 688–703. [Google Scholar] [CrossRef]
- McAllister, E.; Payo, A.; Novellino, A.; Dolphin, T.; Medina–Lopez, E. Multispectral satellite imagery and machine learning for the extraction of shoreline indicators. Coast. Eng. 2022, 174, 104102. [Google Scholar] [CrossRef]
- Cadier, C.; Bayraktarov, E.; Piccolo, R.; Adame, M.F. Indicators of Coastal Wetlands Restoration Success: A Systematic Review. Front. Mar. Sci. 2020, 7, 600220. [Google Scholar] [CrossRef]
- Yasir, M.; Sheng, H.; Fan, H.; Nazir, S.; Niang, A.J.; Salauddin, M.; Khan, S. Automatic Coastline Extraction and Changes Analysis Using Remote Sensing and GIS Technology. IEEE Access 2020, 8, 180156–180170. [Google Scholar] [CrossRef]
- Iqbal, M.A.; Anghel, A.; Datcu, M. Coastline Extraction From SAR Data Using Doppler Centroid Images. IEEE Geosci. Remote Sensing Lett. 2022, 19, 1506205. [Google Scholar] [CrossRef]
- Gens, R. Remote Sensing of Coastlines: Detection, Extraction and Monitoring. Int. J. Remote Sens. 2010, 31, 1819–1836. [Google Scholar] [CrossRef]
- Suo, A.N.; Cao, K.; Ma, H.W.; Wang, Q.M.; Yu, Y.H. Discussion on Classification System of Coastline. Sci. Geogr. Sin. 2015, 35, 933–937. (In Chinese) [Google Scholar]
- Kuleli, T.; Guneroglu, A.; Karsli, F.; Dihkan, M. Automatic Detection of Shoreline Change on Coastal Ramsar Wetlands of Turkey. Ocean Eng. 2011, 38, 1141–1149. [Google Scholar] [CrossRef]
- Wu, T. Analysis of Spatio-Temporal Characteristics of Mainland Coastline Changes in China in Nearly 70 Years; Yantai Institute of Coastal Zone Research, Chinese Academy of Sciences: Yantai, China, 2016. (In Chinese) [Google Scholar]
- Zhuang, D.F.; Liu, J.Y. Study on the Model of Regional Differentiation of Land Use Degree in China. J. Nat. Resour. 1997, 12, 10–16. (In Chinese) [Google Scholar]
- Husain, A.; Reddy, J.; Bisht, D.; Sajid, M. Fractal Dimension of India Using Multicore Parallel Processing. Comput. Geosci. 2022, 159, 104989. [Google Scholar] [CrossRef]
- Bowers, D.G.; McKee, D.; Jago, C.F.; Nimmo–Smith, W.A.M. The Area–to–Mass Ratio and Fractal Dimension of Marine Flocs. Estuar. Coast. Shelf Sci. 2017, 189, 224–234. [Google Scholar] [CrossRef]
- Liebovitch, L.S.; Toth, T. A Fast Algorithm to Determine Fractal Dimensions by Box Counting. Phys. Lett. A 1989, 141, 386–390. [Google Scholar] [CrossRef]
- Kirwan, M.L.; Megonigal, J.P. Tidal Wetland Stability in the Face of Human Impacts and Sea-Level Rise. Nature 2013, 504, 53–60. [Google Scholar] [CrossRef]
- Fisheries, F.A.O. The State of World Fisheries and Aquaculture; Food and Agriculture Organization of the United Nations: Rome, Italy, 2019. [Google Scholar]
- Rimmer, M.A.; Sugama, K.; Rakhmawati, D.; Rofiq, R.; Habgood, R.H. A Review and SWOT Analysis of Aquaculture Development in Indonesia. Rev. Aquac. 2013, 5, 255–279. [Google Scholar] [CrossRef]
- Jacobs, Z.L.; Yool, A.; Jebri, F.; Srokosz, M.; van Gennip, S.; Kelly, S.J.; Roberts, M.; Sauer, W.; Queirós, A.M.; Osuka, K.E.; et al. Key Climate Change Stressors of Marine Ecosystems along the Path of the East African Coastal Current. Ocean Coast. Manag. 2021, 208, 105627. [Google Scholar] [CrossRef]
- Dastgheib, A.; Reyns, J.; Thammasittirong, S.; Weesakul, S.; Thatcher, M.; Ranasinghe, R. Variations in the Wave Climate and Sediment Transport Due to Climate Change along the Coast of Vietnam. J. Mar. Sci. Eng. 2016, 4, 86. [Google Scholar] [CrossRef]
- Awad, M.; El–Sayed, H.M. The Analysis of Shoreline Change Dynamics and Future Predictions Using Automated Spatial Techniques: Case of El-Omayed on the Mediterranean Coast of Egypt. Ocean Coast. Manag. 2021, 205, 105568. [Google Scholar] [CrossRef]
- Wang, J.; Chen, J.; Wen, Y.; Fan, W.; Liu, Q.; Tarolli, P. Monitoring the Coastal Wetlands Dynamics in Northeast Italy from 1984 to 2016. Ecol. Indic. 2021, 129, 107906. [Google Scholar] [CrossRef]
- Chamberland-Fontaine, S.; Thomas Estrada, G.; Heckadon-Moreno, S.; Hickey, G.M. Enhancing the Sustainable Management of Mangrove Forests: The Case of Punta Galeta, Panama. Trees For. People 2022, 8, 100274. [Google Scholar] [CrossRef]
- Kozhikkodan Veettil, B.; Quang, N.X. Mangrove Forests of Cambodia: Recent Changes and Future Threats. Ocean Coast. Manag. 2019, 181, 104895. [Google Scholar] [CrossRef]
- Guo, Y.; Liao, J.; Shen, G. Mapping Large-Scale Mangroves along the Maritime Silk Road from 1990 to 2015 Using a Novel Deep Learning Model and Landsat Data. Remote Sens. 2021, 13, 245. [Google Scholar] [CrossRef]
- Gai, M.; Zhan, Y. Spatial Evolution of Marine Ecological Efficiency and Its Influential Factors in China Coastal Regions. Sci. Geogr. Sin. 2019, 39, 616–625. [Google Scholar]
- Kong, H.; Shen, L.; Zhong, S. Dynamic Relations among Oil Production and Trade and Economic Growth in Oil Producing Countries in the Belt and Road. Resour. Sci. 2017, 39, 1071–1083. [Google Scholar]
- Sui, L.; Wang, J.; Yang, X.; Wang, Z. Spatial–Temporal Characteristics of Coastline Changes in Indonesia from 1990 to 2018. Sustainability 2020, 12, 3242. [Google Scholar] [CrossRef]
- Monirul Qader Mirza, M. Global Warming and Changes in the Probability of Occurrence of Floods in Bangladesh and Implications. Glob. Environ. Change 2002, 12, 127–138. [Google Scholar] [CrossRef]
- Mayaux, P.; Holmgren, P.; Achard, F.; Eva, H.; Stibig, H.-J.; Branthomme, A. Tropical Forest Cover Change in the 1990s and Options for Future Monitoring. Philos. Trans. R. Soc. B Biol. Sci. 2005, 360, 373–384. [Google Scholar] [CrossRef]
- Giri, C.; Zhu, Z.; Tieszen, L.L.; Singh, A.; Gillette, S.; Kelmelis, J.A. Mangrove Forest Distributions and Dynamics (1975–2005) of the Tsunami-Affected Region of Asia. J. Biogeogr. 2008, 35, 519–528. [Google Scholar] [CrossRef]
- Trung Thanh, H.; Tschakert, P.; Hipsey, M.R. Moving up or Going under? Differential Livelihood Trajectories in Coastal Communities in Vietnam. World Dev. 2021, 138, 105219. [Google Scholar] [CrossRef]
- Mohamed-Chérif, F.; Ducruet, C. Regional Integration and Maritime Connectivity across the Maghreb Seaport System. J. Transp. Geogr. 2016, 51, 280–293. [Google Scholar] [CrossRef]
- Rezaie, A.M.; Ferreira, C.M.; Rahman, M.R. Storm Surge and Sea Level Rise: Threat to the Coastal Areas of Bangladesh. In Extreme Hydroclimatic Events and Multivariate Hazards in a Changing Environment; Elsevier: Amsterdam, The Netherlands, 2019; pp. 317–342. ISBN 978-0-12-814899-0. [Google Scholar]


| Category | Description | Image Sample | |
|---|---|---|---|
| Natural coastline | Bedrock coastline | The coastline distributed on bedrock with a distinct state of undulation, and is relatively tortuous and remains largely unchanged. Bare, steep, and hard rocks cover the surface of this coastline. |  |
| Biotic coastline | Biotic coastline is usually developed by the role of mangroves and reef-building coral. The seaward side is mostly consisted of mangrove forests, showing some green shore in remote sensing images (no silt, sandy, landward side is not an artificial coastline). |  | |
| Estuary coastline | Estuary coastline is generally located at the entrance of the rivers into the sea. Its boundary is between estuary and ocean, which remains largely unchanged. |  | |
| Sandy coastline | Sandy coastline is mostly located in the open bay. The beach is yellow or off-white, generally smooth and wide. The coastline is long and largely in a state of erosion. |  | |
| Silty coastline | Silty coastline grows in hidden bays, and the shore form is mostly smooth silty beach. The coastline is obviously dark in color, with sediment accumulation and weak hydrodynamic conditions. |  | |
| Artificial coastline | Harbors, dikes, jetties, etc. | Artificial coastline is a coastline that has been changed by human action that has altered the original form of its natural state. Obvious artificial coastline includes ports, wharfs, and docks for human activities. |  |
| Year | 1990 | 2000 | 2010 | 2015 | 2020 | ||
|---|---|---|---|---|---|---|---|
| Type of Coastline | |||||||
| Natural coastline | Bedrock | Length ratio (%) | 21.9% | 20.7% | 19.6% | 19.5% | 19.9% |
| Change rate (km/year) | −238.9 | −291.2 | −227.3 | 21.8 | |||
| Biotic | Length ratio (%) | 11.4% | 12.3% | 12.6% | 12.9% | 14.5% | |
| Change rate (km/year) | 424.6 | 191.5 | 50.2 | 968.5 | |||
| Estuary | Length ratio (%) | 32.8% | 33.6% | 33.3% | 33.0% | 31.4% | |
| Change rate (km/year) | 577.7 | 54.5 | −513.1 | −1470.6 | |||
| Sandy | Length ratio (%) | 17.9% | 17.0% | 17.2% | 16.8% | 17.4% | |
| Change rate (km/year) | −124.1 | 160.0 | −442.2 | 186.2 | |||
| Silty | Length ratio (%) | 11.1% | 10.6% | 9.9% | 9.5% | 8.0% | |
| Change rate (km/year) | −79.1 | −202.9 | −338.5 | −1166.0 | |||
| Subtotal | Length ratio (%) | 95.1% | 94.2% | 92.6% | 91.8% | 91.2% | |
| Change rate (km/year) | 560.2 | −88.0 | −1471.0 | −1459.9 | |||
| Artificial coastline | Length ratio (%) | 4.9% | 5.8% | 7.4% | 8.2% | 8.8% | |
| Change rate (km/year) | 358.4 | 625.1 | 472.6 | 327.4 | |||
Disclaimer/Publisher’s Note: The statements, opinions and data contained in all publications are solely those of the individual author(s) and contributor(s) and not of MDPI and/or the editor(s). MDPI and/or the editor(s) disclaim responsibility for any injury to people or property resulting from any ideas, methods, instructions or products referred to in the content. |
© 2023 by the authors. Licensee MDPI, Basel, Switzerland. This article is an open access article distributed under the terms and conditions of the Creative Commons Attribution (CC BY) license (https://creativecommons.org/licenses/by/4.0/).
Share and Cite
Yang, F.; Zhang, L.; Chen, B.; Li, K.; Liao, J.; Mahmood, R.; Hasan, M.E.; Mamun, M.M.A.A.; Raza, S.A.; Sutrisno, D. Long-Term Change of Coastline Length along Selected Coastal Countries of Eurasia and African Continents. Remote Sens. 2023, 15, 2344. https://doi.org/10.3390/rs15092344
Yang F, Zhang L, Chen B, Li K, Liao J, Mahmood R, Hasan ME, Mamun MMAA, Raza SA, Sutrisno D. Long-Term Change of Coastline Length along Selected Coastal Countries of Eurasia and African Continents. Remote Sensing. 2023; 15(9):2344. https://doi.org/10.3390/rs15092344
Chicago/Turabian StyleYang, Fan, Li Zhang, Bowei Chen, Kaixin Li, Jingjuan Liao, Riffat Mahmood, Mohammad Emran Hasan, M. M. Abdullah Al Mamun, Syed Ahmed Raza, and Dewayany Sutrisno. 2023. "Long-Term Change of Coastline Length along Selected Coastal Countries of Eurasia and African Continents" Remote Sensing 15, no. 9: 2344. https://doi.org/10.3390/rs15092344
APA StyleYang, F., Zhang, L., Chen, B., Li, K., Liao, J., Mahmood, R., Hasan, M. E., Mamun, M. M. A. A., Raza, S. A., & Sutrisno, D. (2023). Long-Term Change of Coastline Length along Selected Coastal Countries of Eurasia and African Continents. Remote Sensing, 15(9), 2344. https://doi.org/10.3390/rs15092344