Abstract
The present work examines the spatial and temporal distribution of positive and negative TEC anomalies on the global and regional scale. To study the local response of the ionosphere, foF2 data from ground ionosonde stations and TEC data from Madrigal and CODE databases have been used. The relative deviation, which also determines the type of TEC response during geomagnetic storms on 3 and 4 February 2022, is considered. In the present study, the regions of positive and negative TEC anomalies and their evolution during storms are examined in detail. As a result of the study, estimates of the following were obtained: (i) the location of the sectors of the polar regions, in where the particle precipitation from the solar wind is observed, (ii) the mid-latitude regions, in which the mechanism of influence of the O/N2 ratio dominates, and (iii) the region around the equator, in which the influence of the electric field dominates. An attempt was made to determine which mechanism of influence of geomagnetic storms on the ionospheric electron density is dominant in different regions. The following main mechanisms are considered: (a) the additional ionization from the particles’ precipitation, (b) the change of the ratio of atomic oxygen (O) to molecular nitrogen (N2) due to the heating of the neutral air, and (c) the influence on the equatorial ionospheric anomaly.
1. Introduction
The concept of the ionosphere has been well known to scientists interested in geophysics since the beginning of the 20th century, when the first transatlantic radio communication was made by Guglielmo Marconi. This suggests that somewhere in the Earth’s atmosphere (between 250–400 km), there is an ionized layer through which the propagation of radio waves by repeated reflection over long distances is possible. Since the ionosphere is the uppermost part of the atmosphere, it is directly controlled by the Sun. The main processes as a result of the solar heating and photoionization of the ionosphere lead to an upward movement of the ionospheric plasma by the vertical E × B drift at the equator, and a descent of the plasma diffuses down along the geomagnetic lines to both sides of the equator. Here, it is important to note the existing region of increased ionospheric density in regions around the equator, namely the so-called the equatorial ionization anomaly (EIA) [1]. EIA is an important phenomenon occurring at low latitudes that results in the highest plasma densities in the ionosphere. Plasma is moved from the region of the magnetic equator to either side in a range of latitudes of ±10° to ±20° north and south of the magnetic equator [2]. This overall process of plasma uplift and the formation of the EIAs away from the equator are called the “fountain effect”.
The influence of geomagnetic storms on the electron density and response of the ionosphere (positive or negative) is well known. Geomagnetic storms generally represent an interaction between streams of charged particles carried by the solar wind and the Earth’s magnetic field. The most common causes of geomagnetic storms are coronal mass ejections (CMEs), which are large expulsions of plasma and magnetic field from the Sun’s corona or a corotating interaction in a region dominated by solar wind, originating from a region of weak magnetic field on the Sun’s surface [3]. The result of disturbances in the Sun is a stream of charged particles carried by the solar wind. The exact speed of the solar wind and the southern orientation of the interplanetary magnetic field (IMF) determine the strength of the interaction between the Earth’s magnetosphere and the anomalies of the Sun [4]. It is well known that the larger the variation observed in the Bz component of the IMF and the solar wind speed, the stronger the interaction. Reversals of the zonal equatorial electric field component are sometimes observed when the IMF turns northward from a steady southward direction. In their study, the authors hypothesize that this effect is related to a sudden change in the convection electric field in the magnetosphere [5]. The extension and arrival to the equator without delay of electric fields, well known as the prompt penetration electric fields (PPEFs), is considered based on results from the Jicamarca incoherent scatter radar [6,7]. Under conditions of strong geomagnetic storms, PPEFs are significantly larger than those associated with the normal fountain effect, and they allow the diurnal equatorial plasma to be elevated to much greater heights and latitudes than normal. The result is the lifting and transport of the plasma to places where recombination is much slower, i.e., EIA extends to poleward higher latitudes. The combination of photoionization of the Sun and plasma transport will enhance EIA plasma densities to values above quiet time levels, creating a positive ionospheric storm [8]. The disturbed thermospheric wind and electric fields are the causes of the observed positive ionospheric anomalies at low and low-middle latitudes [9,10,11]. The positive ionospheric storms, known as SED (storm enhanced density) and observed at sub-auroral and middle latitudes predominantly in the afternoon-evening sector [12], have been interpreted in terms of the equatorward expansion of the convection electric fields, with no plasma transfer from low latitudes [13,14,15]. In their study [16] the authors offer a quantitative explanation of the SED. The explanation for this is that the plasma’s root origin lies in the fully sunlit equatorial ionosphere, in which a penetrating zonal electric field drives plasma upward so fast that it cannot recombine. This observed anomaly is driven poleward by a penetrating zonal electric field, but due to the high conductivity and the flow stagnates, plasma builds up in a narrow channel along the dusk terminator and flows into the convection pattern. In the hours around noon, the SED anomaly can also reach higher latitudes at which the so-called TOI (tongue of ionization) is formed. The definition of TOI is related to anomalies in plasma density during a storm-time, spreading anti-sunward across the polar cap and reaching the nightside auroral zone [17,18,19]. The seasonal dependence in the type of response of the ionosphere is well known, as the positive one is more typical for the winter hemisphere, and the negative one for the summer one [20,21].
During daytime, one of the main parameters describing the electron density is thermospheric composition (O/N2) [22]. It is accepted that the O/N2 ratio in winter is greater at high latitudes and decreases with distance from it, which is the reason for ionospheric winter anomaly (electron density peaks in winter) and semiannual variation (electron density peaks in equinoxes) [22,23,24]. Changes in O/N2 are due to longitudinal variations of thermospheric downwelling locations due to Joule heating over the auroral region [25].
The purpose of the present study is to analyze both the local and global spatial and temporal distribution of the positive and negative ionospheric response. For this purpose, two geomagnetic storms on 3 and 4 February 2022 were selected. Both vertical sounding ionospheric station data and two types of total electron content (TEC) data were used in the analysis. The advantage of using several types of data is that they allow for a more detailed analysis and show the distribution of the ionospheric response, not only in a given region but for the entire Earth. The results of the obtained negative and positive anomalies are explained by the main mechanisms, the additional ionization from the particle precipitation, the change of the O/N2 ratio and the influence on the EIA. The importance of the ionosphere is mainly related to radio communications and the positioning accuracy of GPS receivers. Therefore, the ionosphere appears to be essential for solar-terrestrial relations and their practical significance for humanity.
2. Data and Methods
2.1. Parameters Describing the Geomagnetic Storm
Everything described above shows the importance of studying the response of the ionosphere to geomagnetic storms. According to data from the Space Weather Prediction Center—National Oceanic and Atmospheric Administration, it was reported that a “G2 (Moderate) geomagnetic storm watch is in effect for the 2 February 2022, UTC-day due to anticipated arrival of CME. NOAA/SWPC Region 2936 produced an M1 flare (R1-Minor Radio Blackout) on 29 January at 6:32 pm at 23:32 UTC. This flare was associated with an asymmetric, full halo coronal mass ejection (CME), as observed in NASA/SOHO LASCO coronagraph imagery. Any geomagnetic storm conditions are likely to persist into 3 Feb at weakening levels; therefore, a G1 (Minor) geomagnetic storm watch is in effect for 3 February“ (https://www.swpc.noaa.gov/news/geomagnetic-storm-conditions-likely-2-3-february-2022 (accessed on 2 February 2023). According to the British Geological Survey website, CMEs have a major impact on the solar wind from the 29 January 2023, associated with an M1.1-class solar flare, and appear to have arrived the Earth at around 21:30 UTC on the 1 February 2023 “Following the shock, the vertical magnetic field of the solar wind stayed predominantly northward for around 24 h, so the geomagnetic activity was not significantly enhanced as a result. Shortly after 23:00 UTC on 2 February 2023, the magnetic field of the solar wind switched southward and was sustained for nine hours. Detailed information can be found at the following internet address: http://www.geomag.bgs.ac.uk/data_service/space_weather/alerts/update_2022-02-03.html (accessed on 3 February 2023).
In the present study, the following parameters characterizing the geomagnetic disturbance were selected: solar wind speed, the Bz component of the interplanetary magnetic field (IMF), and the geomagnetic activity, which is described by the Dst-index and planetary Kp-index. All described data were received from Goddard Space Flight Center (https://omniweb.gsfc.nasa.gov/) (accessed on 2 March 2023).
Solar wind speed is a widely used feature for estimating geomagnetic disturbances [26,27]. From Figure 1a, it can be seen that the solar wind speed decreases to 360 km/s around 00 UTC on 3 February, then starts to increase smoothly to about 570 km/s between 13UTC and 14UTC on the same day. At 00UTC on 4 February, a second maximum in speed is seen again around 570 km/s, after which the speed gradually decreases throughout the day. All this suggests that we have two weak geomagnetic disturbances of solar origin with a gradual onset.
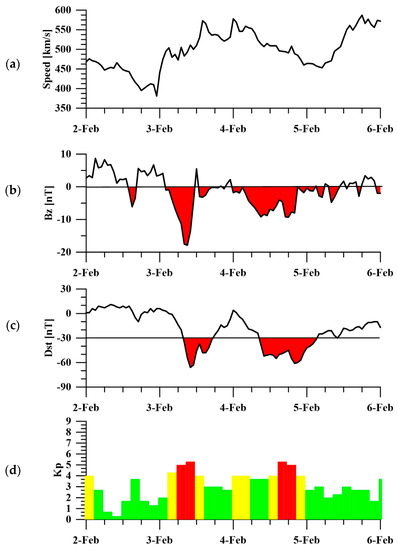
Figure 1.
Parameters characterizing the geomagnetic storms on 3 and 4 February 2022: (a) speed of solar wind, (b) Bz component of IMF, (c) Dst index, and (d) Kp index. Green color indicates quiet conditions, yellow color indicates active conditions, and red color indicates storm conditions.
The next quantity illustrated in Figure 1b is the Bz component of the IMF. The use of this index is important due to the fact that in cases of southern orientation of Bz (Bz < 0), there are conditions for a more significant transfer of energy from the solar wind to the Earth’s magnetosphere, which causes strong disturbances in the Earth’s magnetic field, or so-called magnetic storms [28,29,30]. Figure 1b clearly shows the negative values of Bz, as the strongest negative value around −20 nT is obtained around 9UTC. In the hours between 00UTC and 11UTC, negative values are registered; with only around 12 UTC, we have slightly positive values just above 5 nT, followed again by negative ones. At 00UTC on 4 February, positive values of a few nT are illustrated, followed by completely negative values in the Bz component for the entire day. Predominantly negative Bz values indicate that there were conditions for disturbances in the Earth’s magnetic field throughout the day on 3 and 4 February.
The next two parameters, namely the Dst and Kp-index, are widely used quantities to describe disturbances of the Earth’s magnetic field from high-energy fluxes from the Sun, known as geomagnetic storms. The Dst index is an index of magnetic activity derived from a network of near-equatorial geomagnetic observatories, which measures the intensity of the globally symmetrical equatorial electrojet (so called “ring current”). The Dst index shows the effect of the globally symmetrical westward-flowing high-altitude equatorial ring current, which causes the “main phase” depression worldwide in the H-component of the Earth′s magnetic field during large magnetic storms. The presented behavior of the Dst index in Figure 1c shows that on 3 February, the values start to fall below the defined quiet conditions, at which time Dst reaches −30 nT. In the hours between 09 UTC and 17 UTC on 3 February, a decrease in values was observed below quiet conditions, with the minimum being around −70 nT. According to the classification mentioned above, this disturbance is of moderate type. The variability of the Dst index on 4 February shows that in the hours after 9 UTC until the end of the day (and even the next day), there is again a decrease in values below the accepted for quiet conditions. The Dst index has a minimum value (between −60 and −70 nT) around 19:00 on 4 February, after which the recovery phase begins. Values above quiet conditions are observed only on 5 February. Again, according to the classification, we have moderate geomagnetic disturbance.
The last quantity, namely the Kp-index, is used to characterize the magnitude of geomagnetic storms. The NOAA Geomagnetic Storm Scale indicates the severity of geomagnetic storms. It is denoted by a G followed by a number from 1 to 5, with 1 being a minor event, and 5 being an extreme event. The scale uses the planetary K-Index characterizing the strength of the geomagnetic storm: (i) G1 (Minor) Kp = 5; (ii) G2 (Moderate) Kp = 6; (iii) G3 (Strong) Kp = 7; (iv) G4 (Severe) Kp = 8 and (v) G5 (Extreme) Kp = 9.
Figure 1d demonstrates a steady increase in the Kp index to a value of 5 between 6UTC and 9UTC on 3 February. A maximum value of 5.33 Kp index is reached during the time interval between 09UTC and 12UTC. For comparison, the minima in the Dst-index (see Figure 1c and the Bz component of the IMF (see Figure 1d) are observed during the same time interval. According to the classification, this storm is of type G1 (Minor), which is an analogous result of the classification of the Dst index. An increase in the Kp index was observed between 00UTC and 06UTC on 4 February, but the values did not reach 5, so it is not classified as a geomagnetic storm. A storm was registered later that day. In this case, again the Kp steadily increased to a maximum value of 5.33 during the time interval from 15UTC to 18UTC, after which it started to decrease. Similar to the previous storm, this storm is also of type G1 (Minor). According to the parameters described above, and their behavior, it can be concluded that the present study is focused on two weak geomagnetic storms that manifested in a similar way and occurred in approximately the same conditions during the day. In Figure 1, in the panels showing Bz, Dst and Kp, the moments at which the corresponding quantity reaches the disturbed condition are marked in red color.
2.2. Types of Ionospheric Data Used in This Study
In this section, the response of the ionosphere is successively described, starting from the local (by specific coordinates) and reaching the global distribution of the response. In the present investigation, the ionosphere is represented by two types of data. One type is the vertical total electron concentration (TEC) data, and the other represents the ionospheric response to ground measurements from various ionospheric stations. Each analysis was performed by comparing the results obtained for the different data types.
2.2.1. Ionosonde Data
Data from the vertical sounding of the ionosphere used in the present study are taken from the Global Ionosphere Radio Observatory (GIRO), freely available to users at the following link: https://giro.uml.edu/index.html. On the site, it is possible to obtain the Digital Ionogram Data Base (DIDBase) by entering input parameters such as station code, time interval and quantity, obtained by the vertical sounding of the ionosphere and interpreted from the ionograms [31]. One of the main ionospheric characteristics, on the basis of which the ionospheric response will be presented, is the critical frequency of the F2 region (foF2). It is well known that this quantity gives the highest frequency at which radio waves propagating vertically upward can be reflected back to Earth by the F2 layer, which is essential for radio communications. On the basis of the data for foF2, the optimal frequencies of radio communications at different distances of the radio paths are also determined. All this provides the justification, in addition to global studies based on satellite data, to carry out an analogous investigation of the spatial distribution of ionospheric response represented by the parameter foF2. For this purpose, a chain of ionospheric stations with close latitude coordinates but different longitudes was selected to investigate the longitudinal behavior of foF2 during weak geomagnetic storms in February 2022.
In the present study, a procedure will be applied to filter out the diurnal, seasonal behavior as well as the long-period variations in solar activity which affect the foF2 values, according to the following formula [32,33]:
where foF2(t) corresponds to the measured value of the critical frequency of the ionospheric F2 layer, while foF2med(UTC) is the median value of the same value.
2.2.2. TEC Data from Madrigal Database
The global scientific database Coupling, Energetics, and Dynamics of Atmospheric Regions (CEDAR) Madrigal database enables users to obtain information and maps of TEC, which is extremely important for ionospheric space weather monitoring and studies. Based on a large number of GPS stations, global TEC maps with a spatial resolution of 1° × 1° in geographic latitude (GLAT) and GLON are provided every 5 min. The Madrigal database is freely available at http://cedar.openmadrigal.org/ [34,35,36] (accessed on 21 March 2023).
In the present study, a step unification procedure for the data from CODE and Madrigal is carried out, since the data offered have different resolutions of the TEC data. The Madrigal data presented in Figure 2 are averaged hourly, as well as 3° latitude and 5° longitude.
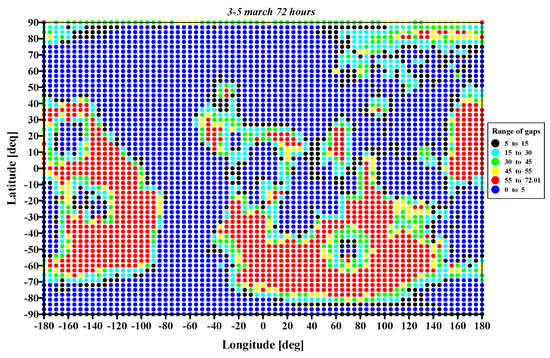
Figure 2.
Global distribution of the number of gaps in the Madrigal data.
Figure 2 shows the global distribution of number of gaps in each point in the coordinate system in the Madrigal data for the period 3–5 February 2022 (72 h). From the classes made according to the number of gaps, it can be seen that the greatest number of gaps between 55 and 72 (marked with red symbols) are found in large regions, mainly located in the seas or oceans. From the maps shown, it can be seen that the data are not suitable for a global investigation due to the lack of data not only in the equatorial region and some parts of the Northern Hemisphere, but also in the predominant part of the Southern Hemisphere. As can be seen from the global distribution of number of gaps from the Madrigal database, the proposed TEC values can be used for studying the spatial distribution of the ionospheric response, but in cases in which the analysis is focused on the entire Earth, this type of data is unsuitable.
2.2.3. TEC Data from CODE
This part of the present work will describe how the anomalies in the TEC caused by the geomagnetic storms on 3 and 4 February 2022 will be investigated.
The vertical TEC maps generated by the Center for Orbit Determination in Europe (CODE) are the first quantity that is used in this study, and are provided by ftp://ftp.unibe.ch/aiub/CODE/ (accessed on 21 March 2023). The global TEC data used in this investigation have a time resolution of 1 h and a grid spacing of 5° × 2.5° in longitude and latitude [37,38,39]. Various regional [40,41,42,43,44,45] and global empirical TEC models [46,47,48] have been developed based on the data described above. These models allow for tracing of the most probable spatial distribution and temporal variability of the ionospheric anomalies through the relative deviation of TEC. In this work, the main idea is to examine the ionospheric anomalies in two selected cases of geomagnetic storms in February 2022.
The study of the spatial distribution of the TEC response in the present work is based on the TEC values in TECU = 1016 el/m2, as well as the relative deviation (denoted as rTEC) of its values from the hourly medians (marked as TECmed), calculated over a period of time 27 days centered on the current day.
Unlike the traditional relative deviation [49,50]:
In the present work, a modified relative TEC obtained by the following formula was used:
The proposed modifications are applied in cases in which the median values become small, even zero, which is observed in night conditions at high latitudes during the winter season. During geomagnetic disturbances at these latitudes and in nighttime conditions, additional ionization from the particle precipitation is often observed, leading to a sharp increase in TEC at rest-state values that are zero or close to zero. These modifications of the relative deviation are applied in the present study in order to make the global maps look more perspicuous. From the point of view of physical processes in the ionosphere, the presence of additional ionization from particle precipitation in the polar regions in night conditions causes an additional electron density that is added to the existing one, which justifies the use of Formula (3), applied when the quite conditions are characterized by low TEC values. The relative values according to Formulas (1)–(3) show whether the response of the ionosphere is positive (an increase compared to the quiet conditions), negative (a decrease) or absent. The zero value (the value corresponding to the quiet conditions) is the same in all three formulas.
2.2.4. Comparison between CODE and Madrigal Data
In order to compare the two types of TEC data (Madrigal and CODE), time series have been compiled for the period 2–5 February 2022 for four characteristic points. Latitudes 70°N and 84°S and longitudes 0°E and 180°E were chosen, respectively. Apart from data availability considerations, these points are located near the auroral oval and coincide with the night side and dayside of the Earth during the storm maximum on 3 February 2022. The results of this comparison are presented in Figure 3.
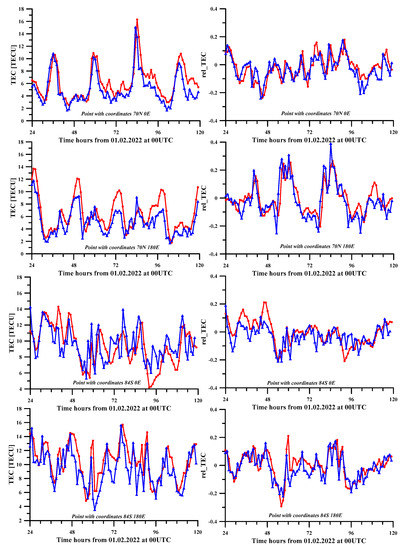
Figure 3.
Comparison of TEC point data obtained by CODE (marked in red) and that received by Madrigal (denoted in blue) at fixed latitudes and longitudes.
Data from CODE database are shown in red of all panels in Figure 3, while data from the Madrigal database are shown in blue. In the left part of the panels in Figure 3, the measured TEC values are illustrated. The right part panels illustrate the deviations of TEC from its quiet condition by the relative deviation, described and defined in Formula (3).
The left part panels in Figure 3 clearly show good coincidence of the two types of TEC data for the considered time interval. In order to more clearly determine the response of the ionosphere in the conditions of geomagnetic disturbances during February 2022, in Figure 3, the right part of the panels presents the relative deviations of TEC, obtained by Formula (3), according to CODE and Madrigal database for four selected points. In the analysis of Figure 3 (top right panel), it can be seen that during the first geomagnetic storm on 3 February 2022, when Kp has a maximum at hours around 12 UTC (see Figure 1), a slightly negative response is observed at the point with coordinates 70°N and 0°E. At the same universal time at the point with coordinates 70°N 180°E, the relative deviation of TEC has a positive response to about 0.3. Analysis of the other two points shows that during the maximum of the storm, at the point with coordinates 84°S and 0°E, the relative TEC shows a negative response of the ionosphere, while at the point with coordinates 84°S and 180°E, the response is positive and reaches about 0.2.
One possible explanation for the obtained differences in the ionospheric response is its dependence on the season and local time. The reason for the different response in the selected points is related to the fact that (a) for the northern hemisphere, the storm occurs during the winter period, while for the southern hemisphere, at that time it is summer, and (b) the hours in which the geomagnetic storm develops are, respectively around local noon at 0°E, and around midnight at 180°E. In both hemispheres, at 0°E (local noon), the response is negative. In the winter hemisphere, the response at 180°E (midnight) is positive. In the southern hemisphere, at the same longitude, the response is principally negative with short-term inversion into a positive response. The second geomagnetic storm proceeds in an analogous way to the first. The observed differences in response are related to the fact that the evolution of the second storm begins at a different universal (and therefore local) time around 18 UTC. In the region of the polar oval for both hemispheres, two main mechanisms of electron density change under the influence of the geomagnetic storm have a significant role. It is well known that the increase in the electron density is related to the particles’ precipitation, while the decrease in electron density is due to the heating of the neutral atmosphere. In the polar oval, both mechanisms operate simultaneously.
2.3. Data for O/N2
Data on the ratio of concentrations of atomic oxygen O and molecular nitrogen N2 in the thermosphere were used from instrument Global Ultraviolet Imager (GUVI), working on TIMED spacecraft (http://guvitimed.jhuapl.edu/data_products) (accessed on 21 March 2023). The region of the atmosphere to be studied by TIMED is located between 60 and 180 km above the Earth’s surface. The thermospheric column number density ratio of O and N2 referenced at N2 column number density level of 1017 cm−2. The present work uses the relative deviations (see Formula (2)) of the O/N2 ratio from the medians calculated for the period from 29 January 2022 to 16 February 2022. Data for each day refer to fixed local time.
The described data and methods for their processing are the basis of the results presented in the next chapter regarding the ionospheric anomalies during two weak geomagnetic storms in February 2022.
3. Results and Discussion
3.1. Zonal Mean Response
A general idea of the latitudinal distribution of the ionospheric TEC response is suggested by the zonally averaged values of rTEC, as shown in Figure 4. Due to the averaging along all longitudes (and therefore according to local time), the mean zonal values have the meaning of a prevailing response for the corresponding latitude. For the two considered storms on 3 and 4 February, a similar latitudinal distribution of the ionospheric response is characteristic, which confirms the similar behavior of the two storms. It can be seen from Figure 4 that at mid-latitudes in the Northern Hemisphere up to about 12 UT, the zonal mean response is positive, after which, with a visible delay, it turns negative. In the southern hemisphere, the area of positive response is limited to about 50°S, while in the south, the response is negative during both considered storms. This difference between the behavior of TEC in the two hemispheres is obviously due to the seasonal differences in them. The behavior of the ionospheric response in different latitude areas is related to the predominance of different mechanisms of impact of geomagnetic activity on the ionospheric electron density [51]. Seasonal differences are the most significant in the polar regions. There is a hypothesis that the predominance of one of the two known impact mechanisms in the polar regions—direct ionization [52] and the change in the composition of the neutral atmosphere under the action of Joule heating [53,54]—depends on the electron density under calm conditions. The zonal averages illustrated in Figure 4 also show the distribution of the region of negative response toward mid-latitudes in both hemispheres. It can be seen from the figure that the slope of the zero line (which for a given latitude shows the moment of change of the sign of the reaction) indicates approximately the rate at which warmed air is carried from high to low latitudes. The zonal mean relative TEC values shown in Figure 4 become negative for all latitudes on 5 February, after the storms have ended, when there is no solar wind influence and the reduced O/N2 mechanism remains in effect. This mechanism is related to thermal processes, possesses considerable inertness and is described in detail in [55]. The zonal mean values shown in Figure 4 illustrate that at the equator, the positive response weakens; this is due to the fact that the vertical drift causes a plasma transfer from the equator to the north and south, due to which even a decrease in the electron density occurs at the equator.
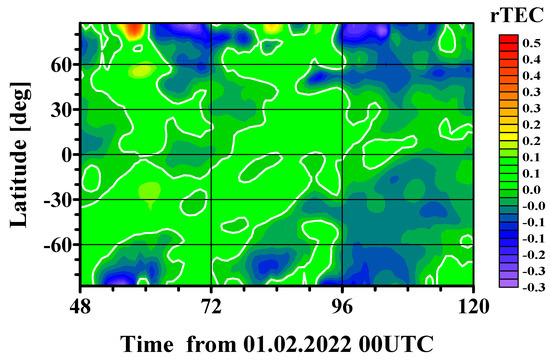
Figure 4.
Zonal mean relative TEC by CODE from 3 March to 5 March.
3.2. Regional Ionospheric Effects in foF2
To analyze the response of the ionosphere at individual points, a group of stations were selected, whose data on the critical frequency of the F2 layer were taken from GIRO (see Table 1). On the basis of data for the entire month of February 2022, the medians were determined, and through them, according to Formula (1), the relative deviations of the foF2 value were determined from its quiet conditions and denoted by rel_foF2. Figure 5 illustrates the changes in rel_foF2 for 3 and 4 February 2022, which clearly show the typical mid-northern response to geomagnetic storms in winter conditions. If the behavior in the selected stations is examined in detail, it can be seen that at the beginning of the geomagnetic storm around 00UTC on 3 February 2022, in the relative deviation of foF2, the response is positive for all considered ionospheric stations. Values of rel_foF2 range from 0.2 to above 0.4. At the maximum of the storm on 3 February, described by the Bz, Dst, and Kp parameters (see Figure 1), between 6UTC and 12UTC, the ionosphere changes its sign to negative and then back to positive. The most significant negative response at all ionospheric stations is observed at 18 UTC on 3 February 2022. This is due to the reconnection of the Earth’s magnetic field and the charged particles of the solar wind, seen by the zero values of the Bz component in the time interval between 18 UTC and 19 UTC. At the same time, Dst is above the disturbed condition limit of −30 nT (for reference see Figure 1). The response of the ionosphere from individual stations during the next event on 4 February 2022 is initially negative, and in all stations except the northernmost station JULIUSRUH, it turns positive after 20–21 UTC.

Table 1.
Selected ionospheric stations, part of digital ionogram database—GIRO.
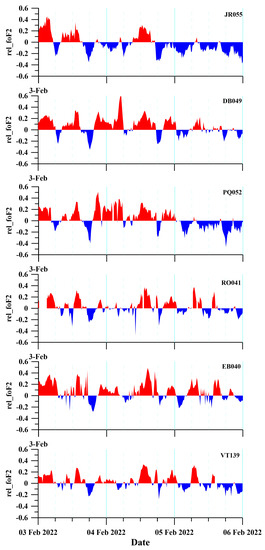
Figure 5.
Ionospheric response to storms on 3–5 February 2022, represented by individual ionospheric stations.
Examining individual point measurements aims to compare the results in the response between the relative deviation of foF2 and TEC. The latitude range of the considered stations is between 40°N and 54°N. Figure 6 shows the behavior of the relative TEC at the points closest to the coordinates of the ionospheric stations from the network of the CODE and Madrigal databases. The comparison of the two types of TEC data with the variability of the relative foF2 illustrated in Figure 5 again shows that the studied region is characterized by positive responses in the hours close to local noon and negative in the hours around sunset. At night, the response becomes close to zero due to the subsidence of the storms.
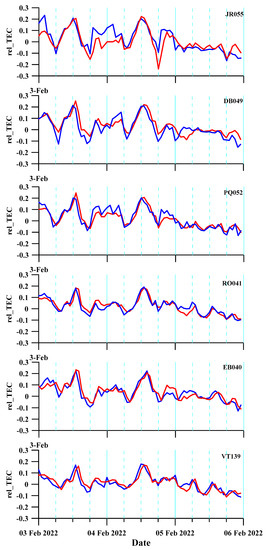
Figure 6.
Comparison of relative TEC by CODE (marked with red) and Madrigal (marked with blue) at points with the coordinates closest to the ionosonde stations.
3.3. Variability of the Spatial Distribution of the TEC Response for the Period 3–4 February as Shown by CODE Data
In comparison, for the ionospheric response on 3 February 2022, the maps shown in Figure 7a illustrate a positive response in the TEC for the same latitudes at which the stations are located for the hours between 00UTC and 18UTC. At 18 UTC, the is analogous to foF2 and the TEC response (see Figure 5 and Figure 6) becomes negative. There is a similar behavior between TEC and rel_foF2 in the second considered storm on 4 February 2022 (see Figure 8a). A positive response is again observed in TEC between 12 UTC and 18 UTC, when the response changes to negative. From Figure 8a, it is clearly seen that the selected ionospheric stations are located in a narrow region of negative response around 18 UTC on 3 February, located between two areas of positive ionospheric response. The above description clearly shows the similarity between two ionospheric parameters during the two geomagnetic storms.
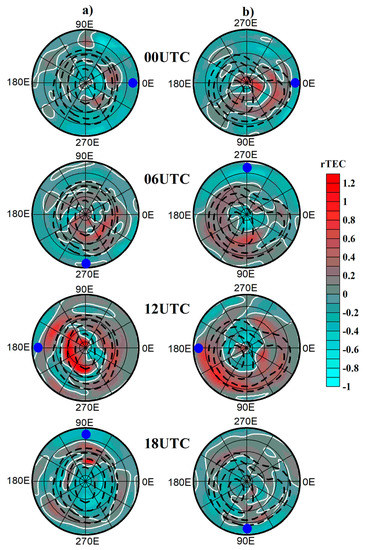
Figure 7.
Latitudinal distribution of relative TEC in polar coordinates for 2 March 2022 for the northern hemisphere (a) and the southern hemisphere (b). Lines of equal inclination of the Earth’s magnetic field from 50° to 80° in 10° are indicated by dotted lines. The blue dots indicate the midnight meridian.
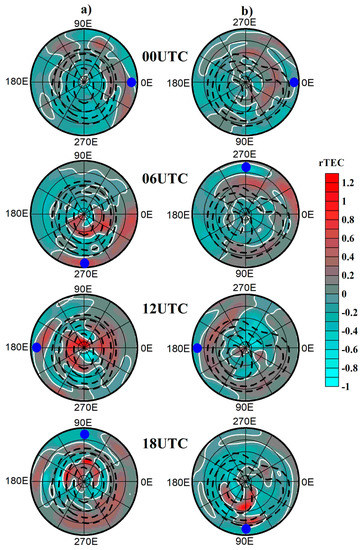
Figure 8.
Latitudinal distribution of relative TEC in polar coordinates for 2 April 2022 for the northern hemisphere (a) and the southern hemisphere (b). Lines of equal inclination of the Earth’s magnetic field from 50° to 80° in 10°are indicated by dotted lines. The blue dots indicate the midnight meridian.
The maps presented in Figure 7 and Figure 8 in polar coordinates allow us to assess the character of the longitudinal inhomogeneity of the ionospheric TEC response. Geographical coordinates are used, and lines of equal inclination show the differences between the Earth’s magnetic field in the northern and southern hemispheres, in particular the location of the auroral oval. The presented maps at 12 UTC on 3 February (see Figure 7) and the analogous map for February 4 at the same universal time (see Figure 8) show the longitudinal distribution of the response in conditions near the maximum of the two geomagnetic storms considered in the present work. Over the two consecutive days, the positive response in the northern hemisphere is concentrated at longitudes close to the midnight point (local time around 0 LT) and at latitudes with magnetic inclinations between 70° and 80°. In the southern hemisphere, the response is predominantly negative at all longitudes. This result coincides with the average response distribution obtained in [56] for winter conditions by latitude and local time, based on a statistical study. The maps shown in Figure 7 and Figure 8 show the appearance of a latitudinal region with a negative response at latitudes lower than the polar oval. It has a complex longitudinal structure. For reference, the zonal mean values shown in Figure 4 illustrate the propagation of the response, which is associated with the transport of warmed air from polar to mid-latitudes. In the northern hemisphere at high latitudes above 60°N, the prevailing positive response sharply turns negative after 12 UTC on 3 February, i.e., after the storm’s maximum has passed. The map relating to 18 UTC in Figure 7 shows an area of weakening positive response around the midnight point, i.e., where the particle precipitation takes place, and at other latitudes, the response is already negative. This should be interpreted as a change in the predominant mechanism. After the weakening of the direct ionization from particle precipitation, the negative influence of neutral air heating dominates. For the considered time period and the entire Earth, the strongest negative response (respectively relative deviation −1) is such that the measured TEC drops practically to 0. The maximum positive response of the relative TEC is 1.2. According to Formula (3), measured TEC has increased compared to the quiet conditions by 10.65 times. The maximum positive response is observed in the polar regions of the northern hemisphere (winter conditions).
The maps in Figure 7 and Figure 8 show the limits of the predominance of the negative response induced by the O/N2 change, and the predominance of the positive response from the vertical drift.
Figure 9 shows the averaged distribution of the TEC response in both hemispheres and for the two considered storms. For this reason, the longitude shown in the previous two figures is replaced by magnetic local time in this figure. Averaging was performed for the hours from 6UTC to 18UTC on 3 February 2022 and from 8 UTC to 23 UTC on 4 February 2022. Data for each grid point are grouped at fixed magnetic latitude (MLAT) and fixed magnetic local time (MLT). In the northern hemisphere (winter conditions), the positive response is concentrated in the night sector at a magnetic latitude of about 70°N. This confirms the assumption made above that this response is due to the ionization induced by the particle precipitation in the night sector. In the daytime sector at the same latitudes, a negative response is observed, caused by the influence of the warming of the neutral air in the absence of the additional ionization from the particle precipitation in the night sector.
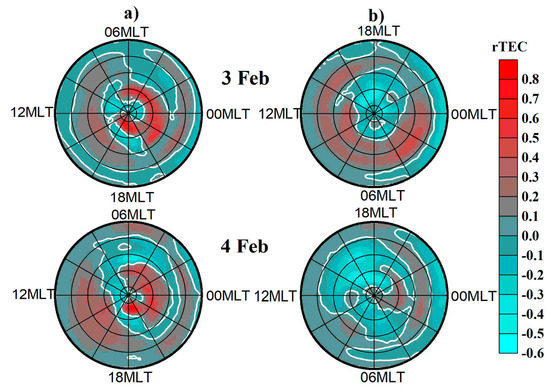
Figure 9.
Mean relative TEC in magnetic latitude and magnetic local time coordinates. For 3 February 2022, the averaging is for the hours from 6 UTC to 18 UTC, and for 4 February 2022, from 8 UTC to 23 UTC. The color scale shows the rTEC values (a,b).
In the southern hemisphere (summer conditions), the positive response in the night sector is weak, but the night sector is approximately at the same magnetic latitude. High southern latitudes are covered by an extensive area of negative response due to the dominance of the O/N2 ratio influencing mechanism. It is well known that in the southern hemisphere, the south magnetic pole is shifted in comparison to the northern hemisphere more significantly than both the geographic pole and the dipole magnetic pole. All this complicates the character of the southern hemisphere ionospheric response to geomagnetic storms.
The comparison made in this section of the ionospheric response according to the presented polar maps in Figure 7, Figure 8 and Figure 9, with the data from the ionospheric stations illustrated in Figure 5, and their corresponding data on the relative deviation of TEC from the CODE and Madrigal databases (see Figure 6), shows that this part of the mid-latitude region is described by all these data (between 40°N and 54°N) is largely borderline between the regions of the predominant mechanisms of the ionospheric response. During daytime (at which time the maximum of the storm is reached on 3 February) the response is positive, but it cannot be explained by additional ionization in the polar oval. Figure 6 and Figure 7 illustrated that during daytime at latitudes greater than 60°N, the response is negative, while at lower latitudes, the response is positive. The negative response is explained by the thermal influence of the storm on the neutral air, while the positive response in the south is more likely related to the dynamical influence on the EIA.
3.4. Effects in Low Latitudes
The maps in Figure 7, Figure 8 and Figure 9 show the formation of regions of relatively weak positive response at low and mid-latitudes in both hemispheres, predominantly during daytime. To investigate this phenomenon, Figure 10 and Figure 11 show maps in cartesian coordinates of median TEC and measured TEC for the same hours as in Figure 7 and Figure 8. They are intended to illustrate the impact of storms on EIA. During the storm, there was an increase in TEC in the EIA area especially during the maximum of the storms. At around 12 UTC, TEC increases are observed up to latitudes around 60° in both hemispheres. This effect should be explained by the penetration into low latitudes of the additional wind component caused by the heating of the polar oval. The wind at high and mid-latitudes is meridional, but at low latitudes, due to Coriolis acceleration, it approaches a zonal direction and causes a forcing of the “fountain effect”, which even in quiet conditions causes the EIA [57]. The enhancement of the vertical drift of the ionospheric plasma leads to the appearance of a positive response [58].
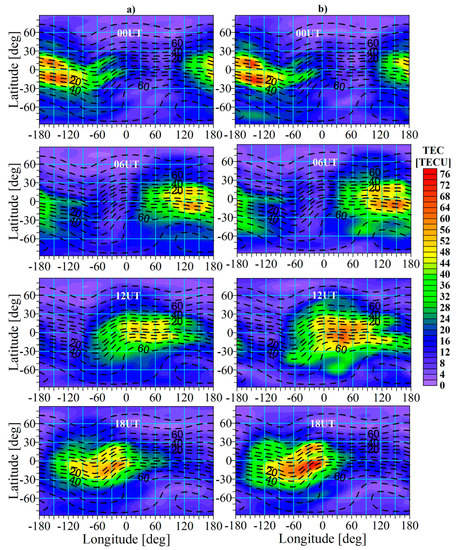
Figure 10.
(a) Latitudinal and longitudinal distribution of median TEC and (b) measured TEC on 3 February 2022. Lines of equal inclination of the Earth’s magnetic field are shown with a black dashed line.
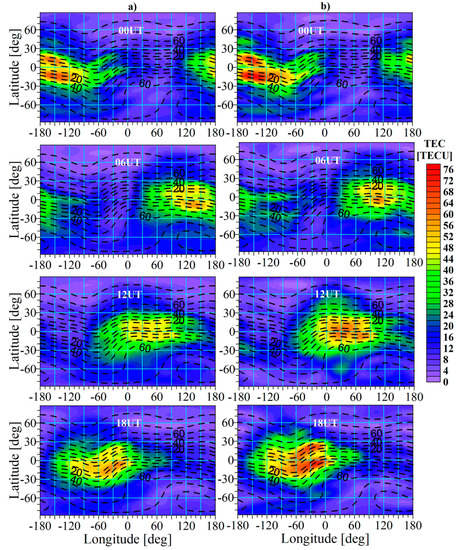
Figure 11.
(a) Latitudinal and longitudinal distribution of median TEC and (b) measured TEC on 4 February 2022. Lines of equal inclination of the Earth’s magnetic field are shown with a black dashed line.
Figure 12 shows the rTEC distribution on 3 February 2022 at 16 UTC. Positive anomalies are symmetrically located around the equator, while a negative anomaly predominates at the equator. The negative response is especially strong at longitudes east of the meridian 30°E (local time later than 18, meaning nighttime conditions), but is also negative at longitudes of about 90°W at local time around 10, close to local noon. In daytime conditions (longitudes between 0° and 150°W), the positive anomaly extends in the northern hemisphere to about 50°N, and in the southern hemisphere to 80°S. It turns out that the positive response caused by the influence of the storm on the vertical drift in low latitudes can spread throughout the mid-latitude region and at certain times be stronger than the negative response associated with the decrease in O/N2.
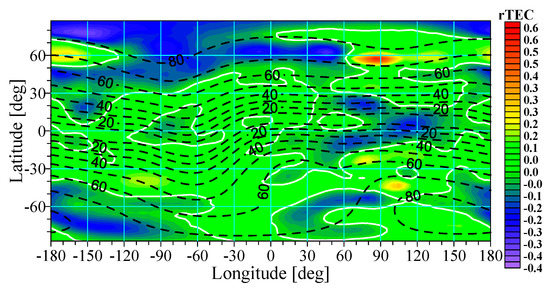
Figure 12.
Relative TEC on 3 February 2022 at 16 UTC.
3.5. Effects in O/N2 Ratio
The availability of data on the O/N2 ratio from the GUVI instrument operating on the TIMED satellite allows the response of the neutral composition of the atmosphere to be investigated and compared with the TEC response. For this purpose, the medians of O/N2 were calculated for the period 29 January 2022–16 February 2022. Data before 29 January 2022 were not used due to gaps. During this period, the local time to which the data correspond varies from about 17:00LT to 13:30LT, while during both storms, the local time is about 16:00LT; therefore, the medians obtained are interpolated. The comparison of a geomagnetically quiet day—31 January 2022 and the medians (see Figure 13) shows that in the considered period, there are significant latitudinal and longitudinal variations in O/N2 which are obviously not due to geomagnetic activity. To compare the O/N2 data with the ionospheric response to geomagnetic storms, the relative deviations of O/N2 from the medians were calculated using Formula (2).
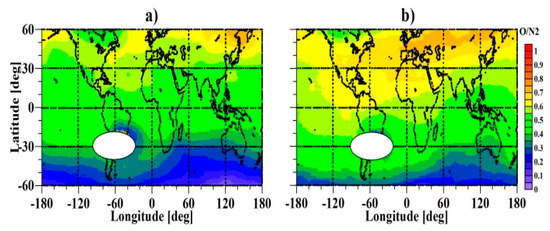
Figure 13.
(a) Distribution of O/N2 ratio on 31 January 2022 and (b) medians calculated for the period 29 January 2022−16 February 2022.
The spatial distribution of the two relative deviations shown in Figure 14 confirms their correspondence in the areas of negativeresponse. It can be seen from the figure that on 3 and 4 February, the negative response at 60°N around 60°W and at 60°S around 90°E coincide. On 5 February 2022, during the recovery phase, both negative responses in the southern hemisphere around 90°E propagate equatorward simultaneously. In these cases, which refer to the mid-latitude region of the ionosphere, the influence of O/N2 as a factor influencing recombination is unquestionable [59].
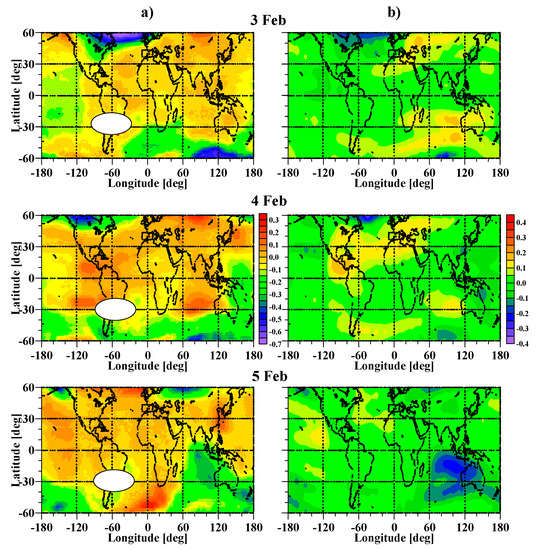
Figure 14.
(a) Relative deviations of O/N2 from medians and (b) relative TEC for fixed local time 16 LT on 3, 4, and 5 February 2022.
It is more complicated to assess the influence of variations in O/N2 at low latitudes, at which vertical drift also has an effect. On 3 and 4 February 2022, a positive response of relative TEC was observed between 60°E and 120°E in the southern hemisphere, located north of the negative anomaly. In the relative O/N2, such a phenomenon is also observed, but it is less pronounced. There is also an analogy in the positive anomalies observed in the northern hemisphere between 120°W and 120°E on both diurnal days. This is not sufficient to conclude that the positive anomalies in the relative TEC are necessarily due to influence through recombination. The spatial distribution of relative TEC at a fixed universal time of 16 UTC on 3 February 2022 shown in Figure 12 further suggests an influence through the vertical drift within the EIA. Comparing the area around the zero meridian of the charts in Figure 14, which are at local time 16LT, with the same area in Figure 12 (the two areas coincide in longitude, universal time, and local time) shows a coincidence of the equatorially separated positive anomaly.
Analogous results to those presented in the present study were obtained in [60]. The article shows the positive response of the electron density in the area of the “fountain effect” caused by recurrent geomagnetic activity. Another investigation [61] concluded that in low-latitude diurnal conditions, the mechanism of vertical plasma drift enhancement due to storm-induced equatorward thermospheric winds dominates. The analogies obtained in the present work between the anomalies in the relative TEC and the relative O/N2 ratio allow us to hypothesize that there is a possible influence of the disturbed dynamics in the thermosphere in O/N2. In the study [62], data from GUVI are presented, from which it follows that during the geomagnetic storm of 17 March 2015 in the equatorial region, the N-149.3 nm intensity decreases, which means a decrease in N2 density in contrast to the region above Australia, where N2 density increases concurrently with the decrease in O/N2.
4. Conclusions
Investigating the spatial and temporal distribution of the ionospheric electron density response represented by TEC allows us to assess the contribution of the main mechanisms of influence of geomagnetic activity on the ionosphere. Two geomagnetic storms of the same type with low intensity are presented, both of which cause ionospheric response comparable in behavior, thereby providing an opportunity to evaluate their characteristic manifestation for the considered season (beginning of February 2022) in both hemispheres.
In the present study, a comparison of the ionospheric response was carried out based on six ionospheric stations and the TEC data at the closest by coordinate point from the CODE and Madrigal databases. The results of the analysis show that the studied region between 40°N and 54°N is characterized by positive responses in the hours close to local noon and negative in the hours around sunset. At night, the response becomes close to zero due to the subsidence of the storms.
The additional ionization caused by the particle precipitation of the solar wind is clearly manifested in the polar region of the Northern Hemisphere, wherein the winter season is characterized by a negligible electron density at night. The results show that the particle precipitation zone is at inclinations of the Earth’s magnetic field between 70° and 80°. In night conditions, when the intensity of particle precipitation is maximal, the additional ionization causes a positive TEC response. In daytime conditions, on the one hand, due to a decrease in the intensity of the particle precipitation, and on the other hand, due to an increase in the electron density under the influence of solar radiation, the following mechanism begins to dominate. Warmed overnight neutral air draws the O/N2 ratio, which increases recombination and causes a negative TEC response. The areas with positive and negative response during the presented storms rotate in the east–west direction, following the movement of the midnight meridian.
In the southern hemisphere in the polar regions, under conditions close to summer, the electron density is relatively high, even at night (see Figure 4), which causes a predominance of the negative response in the whole polar area. It can be concluded that in the polar regions, the predominance of the positive or negative response depends on the season. In the southern hemisphere, there is an area that is illuminated by the Sun throughout the whole day [56].
In the northern hemisphere south of the polar region, a zone of negative response is formed, which is due to the penetration of warmed air from the polar latitudes with a correspondingly reduced O/N2 ratio. The corresponding area in the southern hemisphere is significantly wider, which can be explained by the fact that the prevailing meridional transmission in the winter northern hemisphere is poleward, and in the summer, south-equatorward. The shift of the zero line in time between the positive and negative response areas indicates that the transfer of warm air from polar to mid-latitudes is delayed [60].
At low latitudes in both hemispheres, an area with a positive response is formed, which is due to the dominance of the influence mechanism of storm-induced thermospheric winds on the vertical drift of the plasma. The increase in vertical drift causes a negative response around the equator and a positive response on both sides of the equator. The change in the sign of the response in tropical latitudes marks the change in the dominant mechanism of influence on the electron density for mid-latitudes. The two mechanisms—the influence of the “fountain effect” and the change in the composition of the neutral atmosphere—operate in opposite directions.
As follows from the averaged maps (see Figure 9) in magnetic coordinates, the boundaries of the areas of dominance of the discussed mechanisms are asymmetric towards the poles and are different for the two considered storms. The 4 February storm occurs before the recovery phase of the 3 February storm has ended. It is well known that one cannot expect a complete coincidence of the dynamics of the thermosphere on two consecutive days. The area of direct impact of particle precipitation can be assumed to be located between inclinations of 70° and 80°. It can be concluded that the negative response penetrates up to about 20° MLAT. The region of strong positive response, caused by the vertical drift, is about 10° MLAT. These limits are conditional because during storms they change depending on the intensity of the impact of the solar wind and the different inertness of the individual impact mechanisms.
Detailed examination of the spatial distribution of O/N2 from GUVI data shows some very weak, positive O/N2 variations in low-latitude diurnal conditions during storms that coincide with variations in TEC. There is no reason to conclude that variations in TEC are a consequence of variations in O/N2, but it is possible that both are a consequence of changes in equatorial neutral dynamics; this is expected to be the subject of future studies. The obtained results are interesting and significant for all fields of atmospheric physics and its forecasting on both a global and regional scale [63,64,65].
Author Contributions
Conceptualization, P.M. and R.B.; methodology, P.M.; software, P.M. and R.B.; validation, P.M.; formal analysis, R.B.; investigation, P.M. and R.B.; resources, P.M.; data curation, P.M. and R.B.; writing—original draft preparation, P.M. and R.B.; writing—review and editing, R.B.; visualization, P.M. and R.B.; supervision, R.B. All authors have read and agreed to the published version of the manuscript.
Funding
This work was supported by Contract No. DO1-404/18.12.2020 - Project “National Geoinformation Center (NGIC)” financed by the National Roadmap for Scientific Infrastructure 2017–2023. This work has been accomplished with the financial support by the Grant No BG05M2OP001-1.001-0003, financed by the Science and Education for Smart Growth Operational Program (2014–2020) and co-financed by the European Union through the European structural and Investment funds. This work was partially supported by the Bulgarian Ministry of Education and Science under the National Research Program “Young scientists and postdoctoral students-2”, approved by DCM No. 206 /07.04.2022.
Data Availability Statement
The TEC data provided by CODE are available at the FTP directory: ftp://ftp.unibe.ch/aiub/CODE/ (accessed on 21 March 2023). The second type of TEC data that are freely available to users from the CEDAR Madrigal Database are available at: http://cedar.openmadrigal.org/register?redirect=/ftp/ (accessed on 21 March 2023). The parameters used to describe the storms are from The Goddard Space Flight Center, and the data are located at the following address: https://omniweb.gsfc.nasa.gov/ (accessed on 21 March 2023). The data for individual ionospheric stations by the GLOBAL IONOSPHERE RADIO OBSERVATORY (GIRO) can be found at the following address: https://giro.uml.edu/index.html.can (accessed on 21 March 2023).
Acknowledgments
We are grateful to CODE for the access to the TEC data and to Goddard Space Flight Center for freely available data for the Bz-component, Dst-index and Kp-index. The authors express special thanks to the ionospheric data kindly provided by the Global Ionosphere Radio Observatory. Special thanks also to the upper atmospheric science Madrigal database for the TEC data.
Conflicts of Interest
The authors declare no conflict of interest.
References
- Saakian, A. Radio Wave Propagation Fundamentals; Artech House: Norwood, MA, USA, 2020. [Google Scholar]
- Shankar, J. Analysis of the Day Side Equatorial Anomaly; Utah State University: Logan, UT, USA, 2007; pp. 1–105. [Google Scholar]
- Gonzalez, W.D.; Joselyn, J.A.; Kamide, Y.; Kroehl, H.W.; Rostoker, G.; Tsurutani, B.T.; Vasyliunas, V.M. What is a geomagnetic storm. J. Geophys. Res. Space Phys. 1994, 99, 5771–5792. [Google Scholar] [CrossRef]
- Kamide, Y.; Chian, A. Handbook of the Solar-Terrestrial Environment; Springer: Berlin/Heidelberg, Germany, 2007; pp. 55–93. [Google Scholar]
- Kelley, M.C.; Fejer, B.G.; Gonzales, C.A. An explanation for anomalous ionospheric electric fields associated with a northward turning of the interplanetary magnetic field. Geophys. Res. Lett. 1979, 6, 301–304. [Google Scholar] [CrossRef]
- Fejer, B.G.; Scherliess, L. Mid- and low-latitude prompt penetration ionospheric plasma drifts. Geophys. Res. Lett. 1998, 25, 3071–3074. [Google Scholar] [CrossRef]
- Kelley, M.C.; Makela, J.J.; Chau, J.L.; Nicolls, M.J. Penetration of the solar wind electric field into the magnetosphere/ionosphere system. Geophys. Res. Lett. 2003, 30, 1158. [Google Scholar] [CrossRef]
- Tsurutani, B.T.; Verkhoglyadova, O.P.; Mannucci, A.J.; Saito, A.; Araki, T.; Yumoto, K.; Tsuda, T.; Abdu, M.A.; Sobral, J.H.A.; Gonzalez, W.D.; et al. Prompt penetration electric fields (PPEFs) and their ionospheric effects during the great magnetic storm of 30–31 October 2003. J. Geophys. Res. Space Phys. 2008, 113, A05311. [Google Scholar] [CrossRef]
- Werner, S.; Bauske, R.; Prolss, G.W. On the origin of positive ionospheric storms. Adv. Space. Res. 1999, 24, 1485–1489. [Google Scholar] [CrossRef]
- Kelley, M.C.; Vlasov, M.N.; Foster, J.C.; Coster, A.J. A quantitative explanation for the phenomenon known as storm-enhanced density. Geophys. Res. Lett. 2004, 31, LI9809. [Google Scholar] [CrossRef]
- Balan, N.; Shiokawa, K.; Otsuka, Y.; Kikuchi, T.; Vijaya Lekshmi, D.; Kawamura, S.; Yamamoto, M.; Bailey, G.J. A physical mechanism of positive ionospheric storms at low latitudes and midlatitudes. J. Geophys. Res. 2010, 115, A2304. [Google Scholar] [CrossRef]
- Mendillo, M.; Klobuchar, J. Investigations of the ionospheric F region using multistation total electron content observations. J. Geophys. Res. 1975, 80, 643–650. [Google Scholar] [CrossRef]
- Foster, J.C. Storm-time plasma transport at middle and high latitudes. J. Geophys. Res. 1993, 98, 1675–1689. [Google Scholar] [CrossRef]
- Foster, J.C.; Erickson, P.J.; Coster, A.J.; Goldstein, J.; Rich, F.J. Ionospheric signatures of plasmaspheric tails. Geophys. Res. Lett. 2002, 29, 1623–1626. [Google Scholar] [CrossRef]
- Foster, J.C.; Rideout, W. Storm enhanced density: Magnetic conjugacy effects. Ann. Geophys. 2007, 25, 1791–1799. [Google Scholar] [CrossRef]
- Liu, J.; Wang, W.; Burns, A.; Yue, X.; Zhang, S.; Zhang, Y.; Huang, C. Profiles of ionospheric storm-enhanced density during the 17 March 2015 great storm. J. Geophys. Res. Space Phys. 2016, 121, 727–744. [Google Scholar] [CrossRef]
- Knudsen, W.C. Magnetospheric convection and the high-latitude F2 ionosphere. J. Geophys. Res. 1974, 79, 1046–1055. [Google Scholar] [CrossRef]
- Foster, J.C.; Coster, A.J.; Erickson, P.J.; Holt, J.M.; Lind, F.D.; Rideout, W.; McCready, M.; van Eyken, A.; Barnes, R.J.; Greenwald, R.A.; et al. Multiradar observations of the polar tongue of ionization. J. Geophys. Res. 2005, 110, A09S31. [Google Scholar] [CrossRef]
- Pokhotelov, D.; Fernandez-Gomez, I.; Borries, C. Polar tongue of ionisation during geomagnetic superstorm. Ann. Geophys. 2021, 39, 833–847. [Google Scholar] [CrossRef]
- Prölss, G.W. Ionospheric F-region storms. In Handbook of Atmospheric Electrodynamics, 1st ed.; Volland, H., Ed.; CRC Press: Boca Raton, FL, USA, 1995; Volume 2, pp. 195–248. [Google Scholar]
- Goncharenko, L.P.; Foster, J.C.; Coster, A.J.; Huang, C.; Aponte, N.; Paxton, L.J. Observations of a positive storm phase on September 10, 2005. J. Atmos. Sol. Terr. Phys. 2007, 69, 1253–1272. [Google Scholar] [CrossRef]
- Rishbeth, H. How the thermospheric circulation affects the ionospheric F2-layer. J. Atmos. Sol. Terr. Phys. 1998, 60, 1385–1402. [Google Scholar] [CrossRef]
- Torr, M.R.; Torr, D.G. The seasonal behavior of the F2-layer of the ionosphere. J. Atmos. Terr. Phys. 1973, 35, 2237–2251. [Google Scholar] [CrossRef]
- Millward, G.H.; Rishbeth, H.; Fuller-Rowell, T.J.; Aylward, A.D.; Quegan, S.; Moffett, R.J. Ionospheric F2 layer seasonal and semiannual variations. J. Geophys. Res. 1996, 101, 5149–5156. [Google Scholar] [CrossRef]
- Luan, X.; Wang, W.; Burns, A.; Dou, X. Solar cycle variations of thermospheric O/N2 longitudinal pattern from TIMED/GUVI. J. Geophys. Res. Space Phys. 2017, 122, 2605–2618. [Google Scholar] [CrossRef]
- Snyder, C.W.; Neugebauer, M.; Rao, U. The solar wind velocity and its corelation with cosmic ray variations and with solar and geomagnetic activity. J. Geophys. Res. 1963, 68, 6361–6370. [Google Scholar] [CrossRef]
- Wilcox, J.M.; Shatten, H.; Ness, N. Influence of interplanetary magnetic field plasma on geomagnetic activity during quiet—Sun conditions. J. Geophys. Res. 1967, 72, 19–26. [Google Scholar] [CrossRef]
- Gold, T. Magnetic storms. Space Sci. Rev. 1962, 1, 100–114. [Google Scholar] [CrossRef]
- Tsurutani, B.T.; Gonzalez, W.D.; Kamide, Y. Magnetic storms. Surv. Geophys. 1997, 18, 363–383. [Google Scholar] [CrossRef]
- Loewe, C.A.; Prölss, G.W. Classification and mean behavior of magnetic storms. J. Geophys. Res. Space Phys. 1997, 102, 14209–14213. [Google Scholar] [CrossRef]
- Reinisch, B.W.; Galkin, I.A. Global ionospheric radio observatory (GIRO). Earth Planets Space 2011, 63, 377–381. [Google Scholar] [CrossRef]
- Danilov, A.D.; Lastovicka, J. Effects of geomagnetic storms on the ionosphere and atmosphere. Int. J. Geomagn. Aeron. 2001, 2, 209–224. [Google Scholar]
- Kutiev, I.; Muhtarov, P. Modeling of midlatitude F region response to geomagnetic activity. J. Geophys. Res. Space Phys. 2001, 106, 15501–15509. [Google Scholar] [CrossRef]
- Peng, Y.; Scales, W.A. Satellite Formation Flight Simulation Using Multi-Constellation GNSS and Applications to Ionospheric Remote Sensing. Remote Sens. 2019, 11, 2851. [Google Scholar] [CrossRef]
- Park, J.; Huang, C.S.; Eastes, R.W.; Coster, A.J. Temporal evolution of low-latitude plasma blobs identified from multiple measurements: ICON, GOLD, and Madrigal TEC. J. Geophys. Res. Space Phys. 2022, 127, e2021JA029992. [Google Scholar] [CrossRef]
- Rideout, W.; Coster, A. Automated GPS processing for global total electron content data. GPS Solut. 2006, 10, 219–228. [Google Scholar] [CrossRef]
- Ciraolo, L.; Azpilicueta, F.; Brunini, C.; Meza, A.; Radicella, S.M. Calibration errors on experimental slant total electron content (TEC) determined with GPS. J. Geod. 2007, 81, 111–120. [Google Scholar] [CrossRef]
- Schaer, S. Mapping and Predicting the Earths Ionosphere Using the Global Positioning System. Ph.D. Thesis, University of Bern, Bern, Switzerland, 1999; 205p. [Google Scholar]
- Astafyeva, E.; Yasyukevich, Y.V.; Maletckii, B.; Oinats, A.; Vesnin, A.; Yasyukevich, A.S.; Syrovatskii, S.; Guendouz, N. Ionospheric Disturbances and Irregularities during the 25–26 August 2018 Geomagnetic Storm. J. Geophys. Res. Space Phys. 2022, 127, e2021JA029843. [Google Scholar] [CrossRef]
- Andonov, B.; Mukhtarov, P.; Pancheva, D. Empirical model of the TEC response to the geomagnetic activity over the North American region. Adv. Space Res. 2011, 48, 1041–1048. [Google Scholar] [CrossRef]
- Mukhtarov, P.; Andonov, B.; Pancheva, D. Empirical model of TEC response to geomagnetic and solar forcing over Balkan Peninsula. J. Atmos. Sol. Terr. Phys. 2018, 167, 80–95. [Google Scholar] [CrossRef]
- Huang, Z.; Yuan, H. Research on regional ionospheric TEC modeling using RBF neural network. Sci. China Technol. Sci. 2014, 57, 1198–1205. [Google Scholar] [CrossRef]
- Feng, J.; Wang, Z.; Jiang, W.; Zhao, Z.; Zhang, B. A new regional total electron content empirical model in northeast China. Adv. Space Res. 2016, 58, 1155–1167. [Google Scholar] [CrossRef]
- Feng, J.; Jiang, W.; Wang, Z.; Zhao, Z.; Nie, L. Regional TEC model under quiet geomagnetic conditions and low-to-moderate solar activity based on CODE GIMs. J. Atmos. Sol.-Terr. Phys. 2017, 161, 88–97. [Google Scholar] [CrossRef]
- Badeke, R.; Borries, C.; Hoque, M.M.; Minkwitz, D. Empirical forecast of quiet time ionospheric Total Electron Content maps over Europe. Adv. Space Res. 2018, 61, 2881–2890. [Google Scholar] [CrossRef]
- Jakowski, N.; Hoque, M.M.; Mayer, C. A new global TEC model for estimating transionospheric radio wave propagation errors. J. Geod. 2011, 85, 965–974. [Google Scholar] [CrossRef]
- Liu, L.; Zou, S.; Yao, Y.; Wang, Z. Forecasting global ionospheric TEC using deep learning approach. Space Weather. 2020, 18, e2020SW002501. [Google Scholar] [CrossRef]
- Pancheva, D.; Mukhtarov, P.; Andonov, B. Global structure of ionospheric TEC anomalies driven by geomagnetic storms. J. Atmos. Sol. Terr. Phys. 2016, 145, 170–182. [Google Scholar] [CrossRef]
- Guerrero, A.; Palacios, J.; Rodríguez-Bouza, M.; Rodríguez-Bilbao, I.; Aran, A.; Cid, C.; Herraiz, M.; Saiz, E.; Rodríguez-Caderot, G.; Cerrato, Y. Storm and substorm causes and effects at midlatitude location for the St. Patrick’s 2013 and 2015 events. J. Geophys. Res. Space Phys. 2017, 122, 9994–10011. [Google Scholar] [CrossRef]
- Mukhtarov, P.; Andonov, B.; Pancheva, D. Global empirical model of TEC response to geomagnetic activity. J. Geophys. Res. Space Phys. 2013, 118, 6666–6685. [Google Scholar] [CrossRef]
- Stolle, C.; Schlüter, S.; Heise, S.; Jacobi, C.; Jakowski, N.; Friedel, S.; Kürschner, D.; Lühr, H. GPS ionospheric imaging of the north polar ionosphere on 30 October 2003. Adv. Space Res. 2005, 36, 2201–2206. [Google Scholar] [CrossRef]
- Foster, J.C.; St.-Maurice, J.P.; Abreu, V.J. Joule heating at high latitudes. J. Geophys. Res. Space Phys. 1983, 88, 4885–4897. [Google Scholar] [CrossRef]
- Danilov, A.D. Ionospheric F-region response to geomagnetic disturbances. Adv. Space Res. 2013, 52, 343–366. [Google Scholar] [CrossRef]
- Kutiev, I.; Muhtarov, P. Empirical modeling of global ionospheric foF2 response to geomagnetic activity. J. Geophys. Res. Space Phys. 2003, 108, SIA-5. [Google Scholar] [CrossRef]
- Andonov, B.; Bojilova, R.; Mukhtarov, P. Global Distribution of Total Electron Content Response to Weak Geomagnetic Activity. CR Acad. Bulg. Sci. 2021, 74, 1032–1042. [Google Scholar]
- Rishbeth, H. F-region storms and thermospheric dynamics. J. Geomagn. Geoelectr. 1991, 43, 513–524. [Google Scholar] [CrossRef]
- Edemskiy, I.K. Localized total electron content enhancements in the Southern Hemisphere. Ann. Geophys. 2020, 38, 591–601. [Google Scholar] [CrossRef]
- Prölss, G.W.; Von Zahn, U. Esro 4 Gas Analyzer results 2. Direct measurements of changes in the neutral composition during an ionospheric storm. J. Geophys. Res. 1974, 79, 2535–2539. [Google Scholar] [CrossRef]
- Mukhtarov, P.; Pancheva, D. Thermosphere–ionosphere coupling in response to recurrent geomagnetic activity. J. Atmos. Sol. Terr. Phys. 2012, 90, 132–145. [Google Scholar] [CrossRef]
- Mikhailov, A.V.; Skoblin, M.G.; Forster, M. Daytime F2-layer positive storm effect at middle and lower latitudes. Ann. Geophys. 1995, 13, 532–540. [Google Scholar] [CrossRef]
- Zhang, Y.; Paxton, L.J.; Morrison, D.; Schaefer, B. Storm-time variations of atomic nitrogen 149.3 nm emission. J. Atmos. Sol. Terr. Phys. 2018, 169, 78–82. [Google Scholar] [CrossRef]
- Ramsingh; Sripathi, S.; Sreekumar, S.; Banola, S.; Emperumal, K.; Tiwari, P.; Kumar, B.S. Low-latitude ionosphere response to super geomagnetic storm of 17/18 March 2015: Results from a chain of ground-based observations over Indian sector. J. Geophys. Res. Space Phys. 2015, 120, 10–864. [Google Scholar]
- Gadzhev, G.; Syrakov, D.; Ganev, K.; Brandiyska, A.; Miloshev, N.; Georgiev, G.; Prodanova, M. Atmospheric composition of the Balkan region and Bulgaria. Study of the contribution of biogenic emissions. AIP Conf. Proc. 2011, 1404, 200–209. [Google Scholar]
- Zhu, M.; Xu, T.; Sun, S.; Zhou, C.; Hu, Y.; Ge, S.; Li, N.; Deng, Z.; Zhang, Y.; Liu, X. Physical Model of D-Region Ionosphere and Preliminary Comparison with IRI and Data of MF Radar at Kunming. Atmosphere 2023, 14, 235. [Google Scholar] [CrossRef]
- Gadzhev, G.; Kostadin, G.; Miloshev, N. Numerical study of the atmospheric composition climate of Bulgaria-Validation of the computer simulation results. Int. J. Environ. Pollut. 2015, 57, 189–201. [Google Scholar] [CrossRef]
Disclaimer/Publisher’s Note: The statements, opinions and data contained in all publications are solely those of the individual author(s) and contributor(s) and not of MDPI and/or the editor(s). MDPI and/or the editor(s) disclaim responsibility for any injury to people or property resulting from any ideas, methods, instructions or products referred to in the content. |
© 2023 by the authors. Licensee MDPI, Basel, Switzerland. This article is an open access article distributed under the terms and conditions of the Creative Commons Attribution (CC BY) license (https://creativecommons.org/licenses/by/4.0/).