Technical Note

InSARTrac Field Tests—Combining Computer Vision and Terrestrial InSAR for 3D Displacement Monitoring

by
Christoph Zambanini
*,
Volker Reinprecht
and
Daniel Scott Kieffer
Institute of Applied Geosciences, Graz University of Technology, Rechbauerstraße 12, 8010 Graz, Austria
*
Author to whom correspondence should be addressed.
Remote Sens. 2023, 15(8), 2031; https://doi.org/10.3390/rs15082031
Submission received: 22 March 2023 / Revised: 6 April 2023 / Accepted: 10 April 2023 / Published: 12 April 2023
(This article belongs to the Section Remote Sensing in Geology, Geomorphology and Hydrology)

Abstract

:
InSARTrac is an innovative method for 3D displacement monitoring that combines terrestrial interferometric synthetic aperture radar (InSAR) and computer vision-based feature tracking. The 3D measurements obtained are considered far superior to 1D or 2D data and facilitate evaluations concerning the mechanisms controlling kinematics. This study presents the results of InSARTrac measurements at the Mölltal Glacier in Carinthia, Austria. The duration of glacier monitoring was four weeks and involved two instrument setup positions to obtain comparative measurements of supraglacial rock debris from different angles without utilizing retroreflectors. The mean displacement rate of the resultant vector is 22 mm/day and includes ~11 mm/day in the downgradient ice surface direction and 6 to 18 mm/day vertically downward. Additionally, the entire glacier surface was measured three times using a LIDAR-equipped UAV, revealing mean vertical displacements of 16 mm/day. The measurements indicate an InSARTrac accuracy of 4.2 ppm, which is 27% lower than in the initial controlled tests utilizing retroreflectors. The field test demonstrates the capability of InSARTrac to provide meaningful 3D displacement measurements of supraglacial rock debris. The material monitored has texture and reflectivity similar to certain classes of landslides, rock glaciers, and other alpine processes, indicating that InSARTrac has promising applications for monitoring a variety of geologic phenomena.

1. Introduction

Terrestrial interferometric synthetic aperture radar (InSAR) monitoring can cover a large field of view (FoV) with high temporal resolution and attain almost range-independent sub-millimeter displacement accuracy in the line of sight (LoS) direction [1]. While the LoS displacement component is useful for quantifying displacement rates and trends, the full 3D displacement vector is considered far superior for assessing the mechanics controlling surficial geologic processes. As an example: (a) landslides failing in a wedge mode will displace in the direction of the intersection line formed by the two bounding discontinuity planes; and (b) landslides failing in a rotational slump mode will exhibit a systematic displacement field that reflects the curved sliding surface (Figure 1). Knowledge concerning the landslide failure mode is highly pertinent for slope stability calculations and for the design of slope remediation measures.
For terrestrial and satellite-based InSAR, 2D or 3D displacements can be obtained by simultaneously monitoring an object from multiple viewpoints with multiple instruments or by combining the results of ascending and descending satellite passes [2,3,4], respectively. The use of offset tracking or multi aperture InSAR to obtain 2D InSAR measurements has also been investigated [4]. The first technique has achieved an accuracy of 13–26 cm using European Remote Sensing Satellites (ERS) ERS-1 and ERS-2, and the second an accuracy of about 10 cm from satellites [4,5].
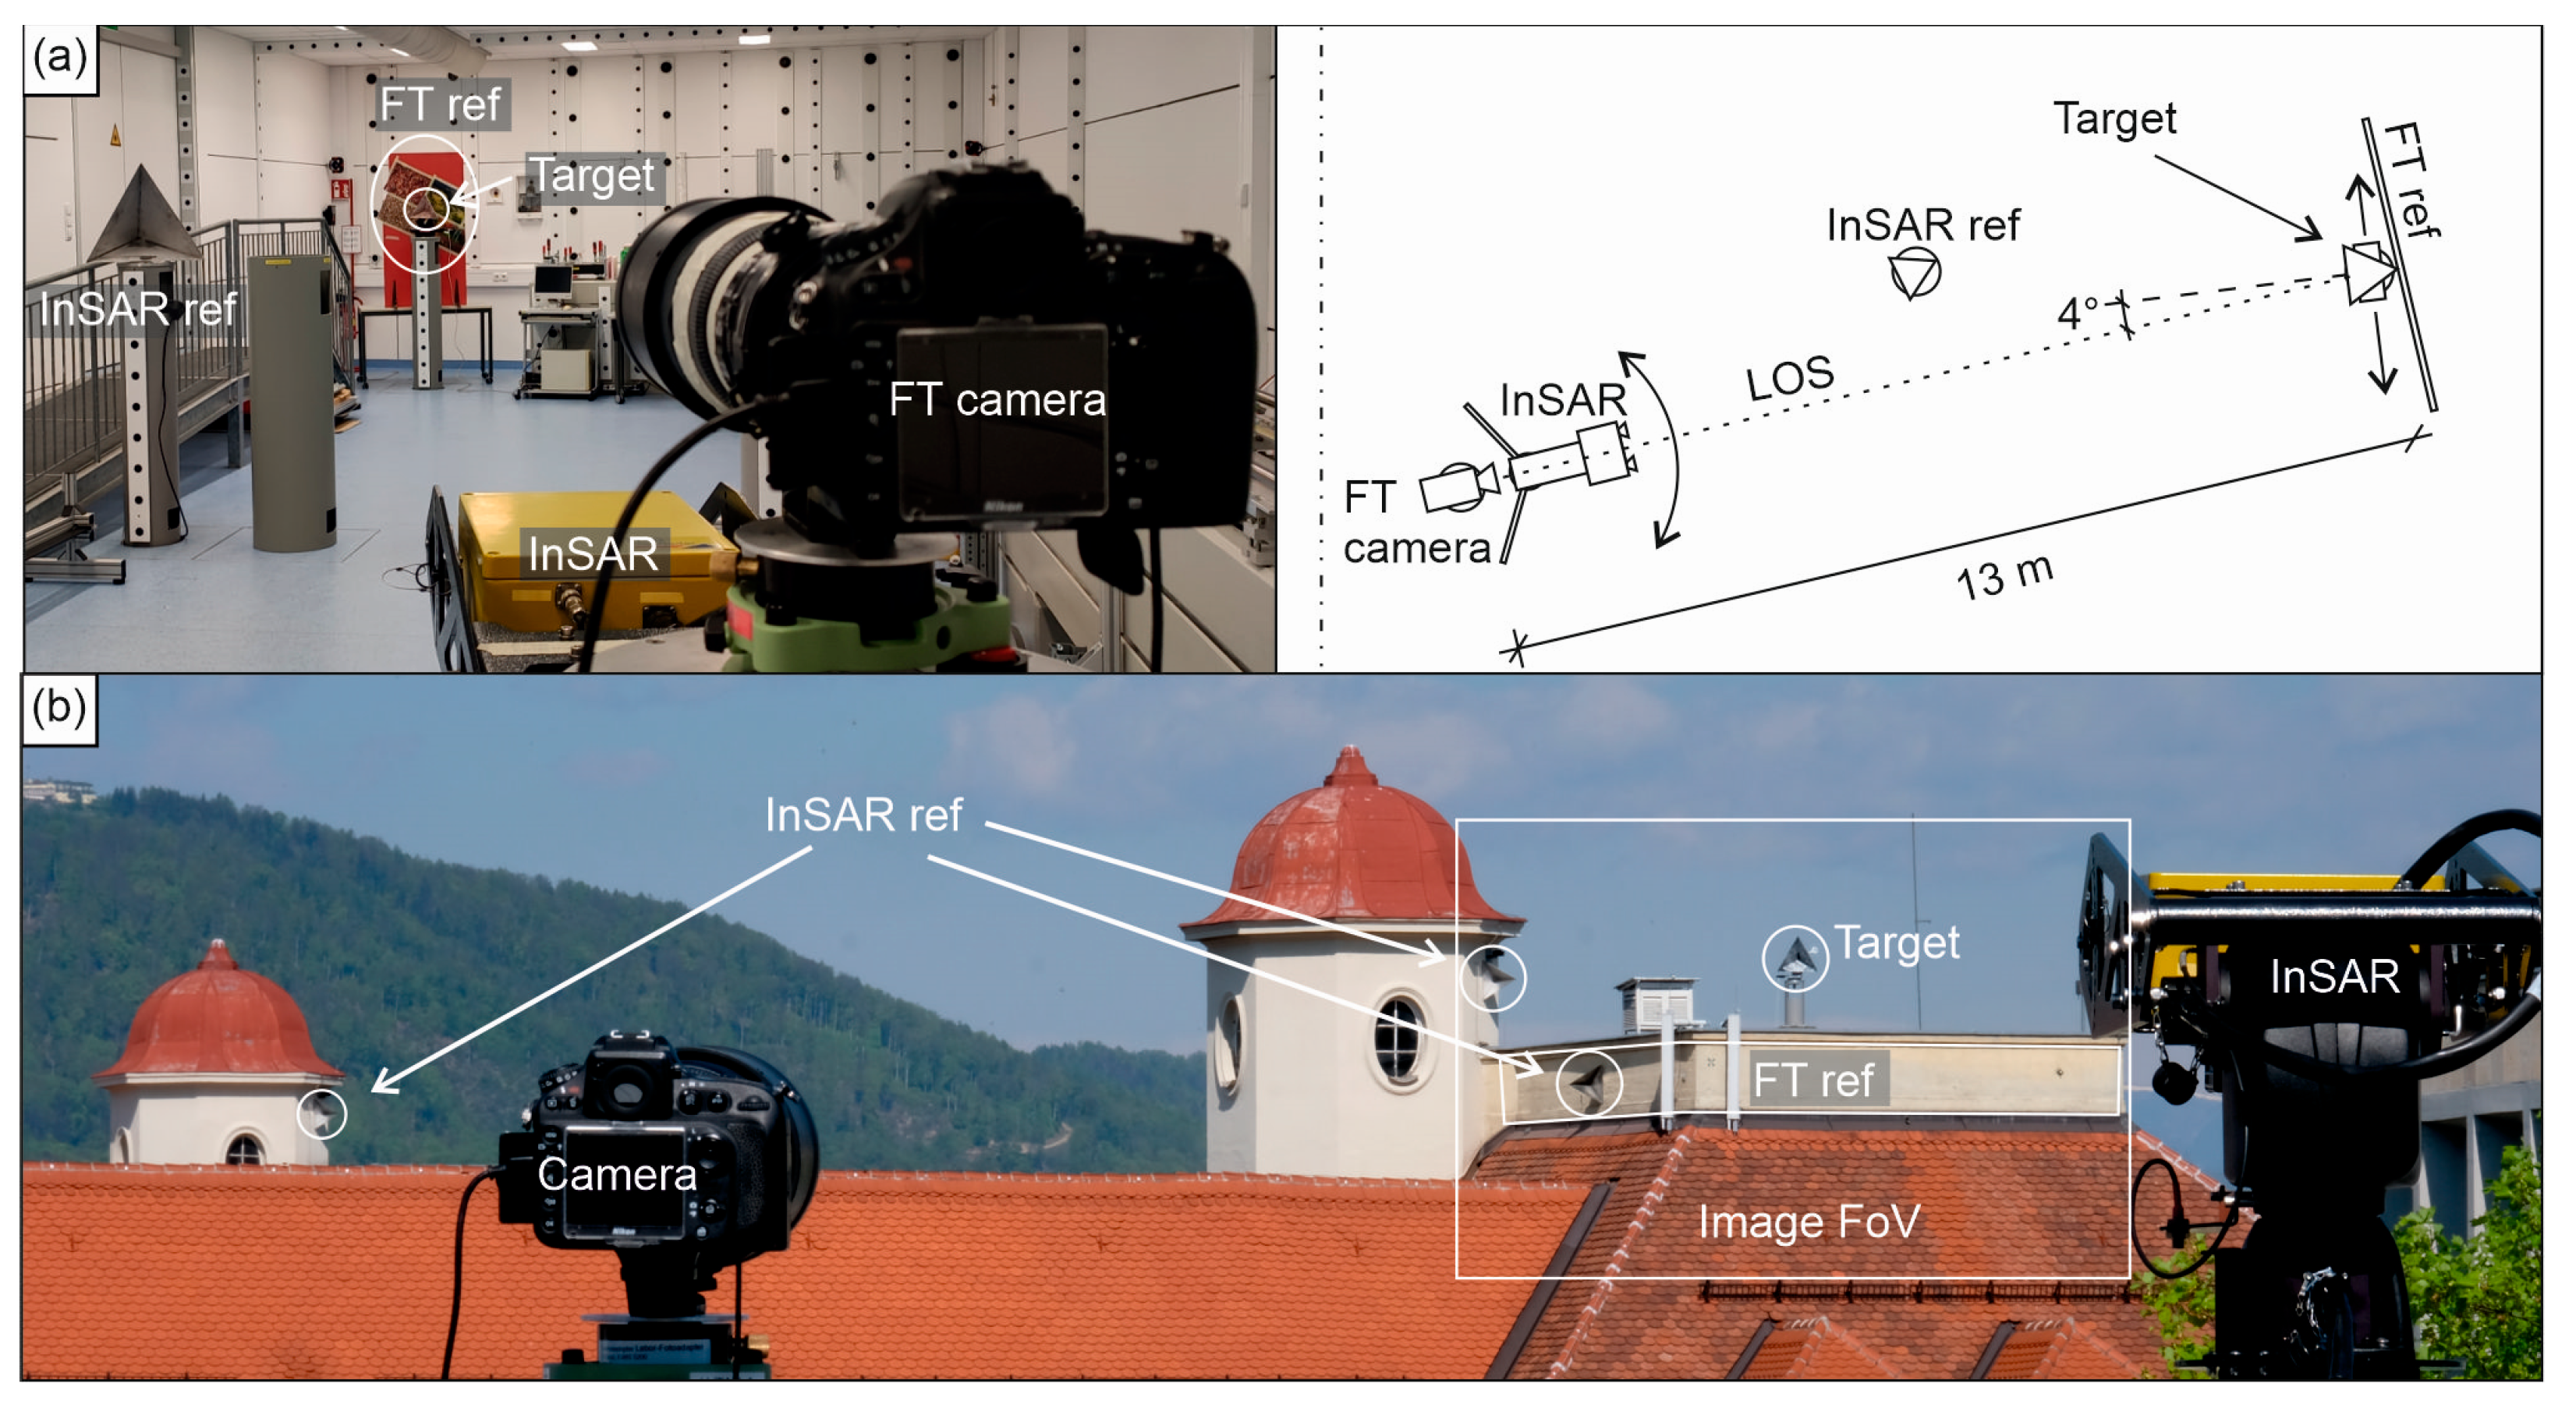
InSARTrac is a 3D displacement monitoring method that combines terrestrial InSAR and computer vision-based feature tracking (FT). Specifically, InSARTrac combines the InSAR LoS displacement component with 2D displacement measurements obtained from time-lapse optical images acquired parallel to the LoS. The results are then combined to obtain 3D displacement vectors. Although FT algorithms are widely used in remote sensing, e.g., [6,7,8], combining the results with InSAR data has been sparse [9,10,11]. The accuracy of InSARTrac has been verified under controlled laboratory and field conditions involving known target (retroreflector) displacements (Figure 2) [12,13]. With the Hydra-G terrestrial InSAR [14] and a 300 mm objective combined with a 2× teleconverter mounted on a Nikon D800 DLSR camera, intrinsic accuracies of 2.6 ppm and 3.3 ppm were obtained under laboratory and field conditions, respectively.
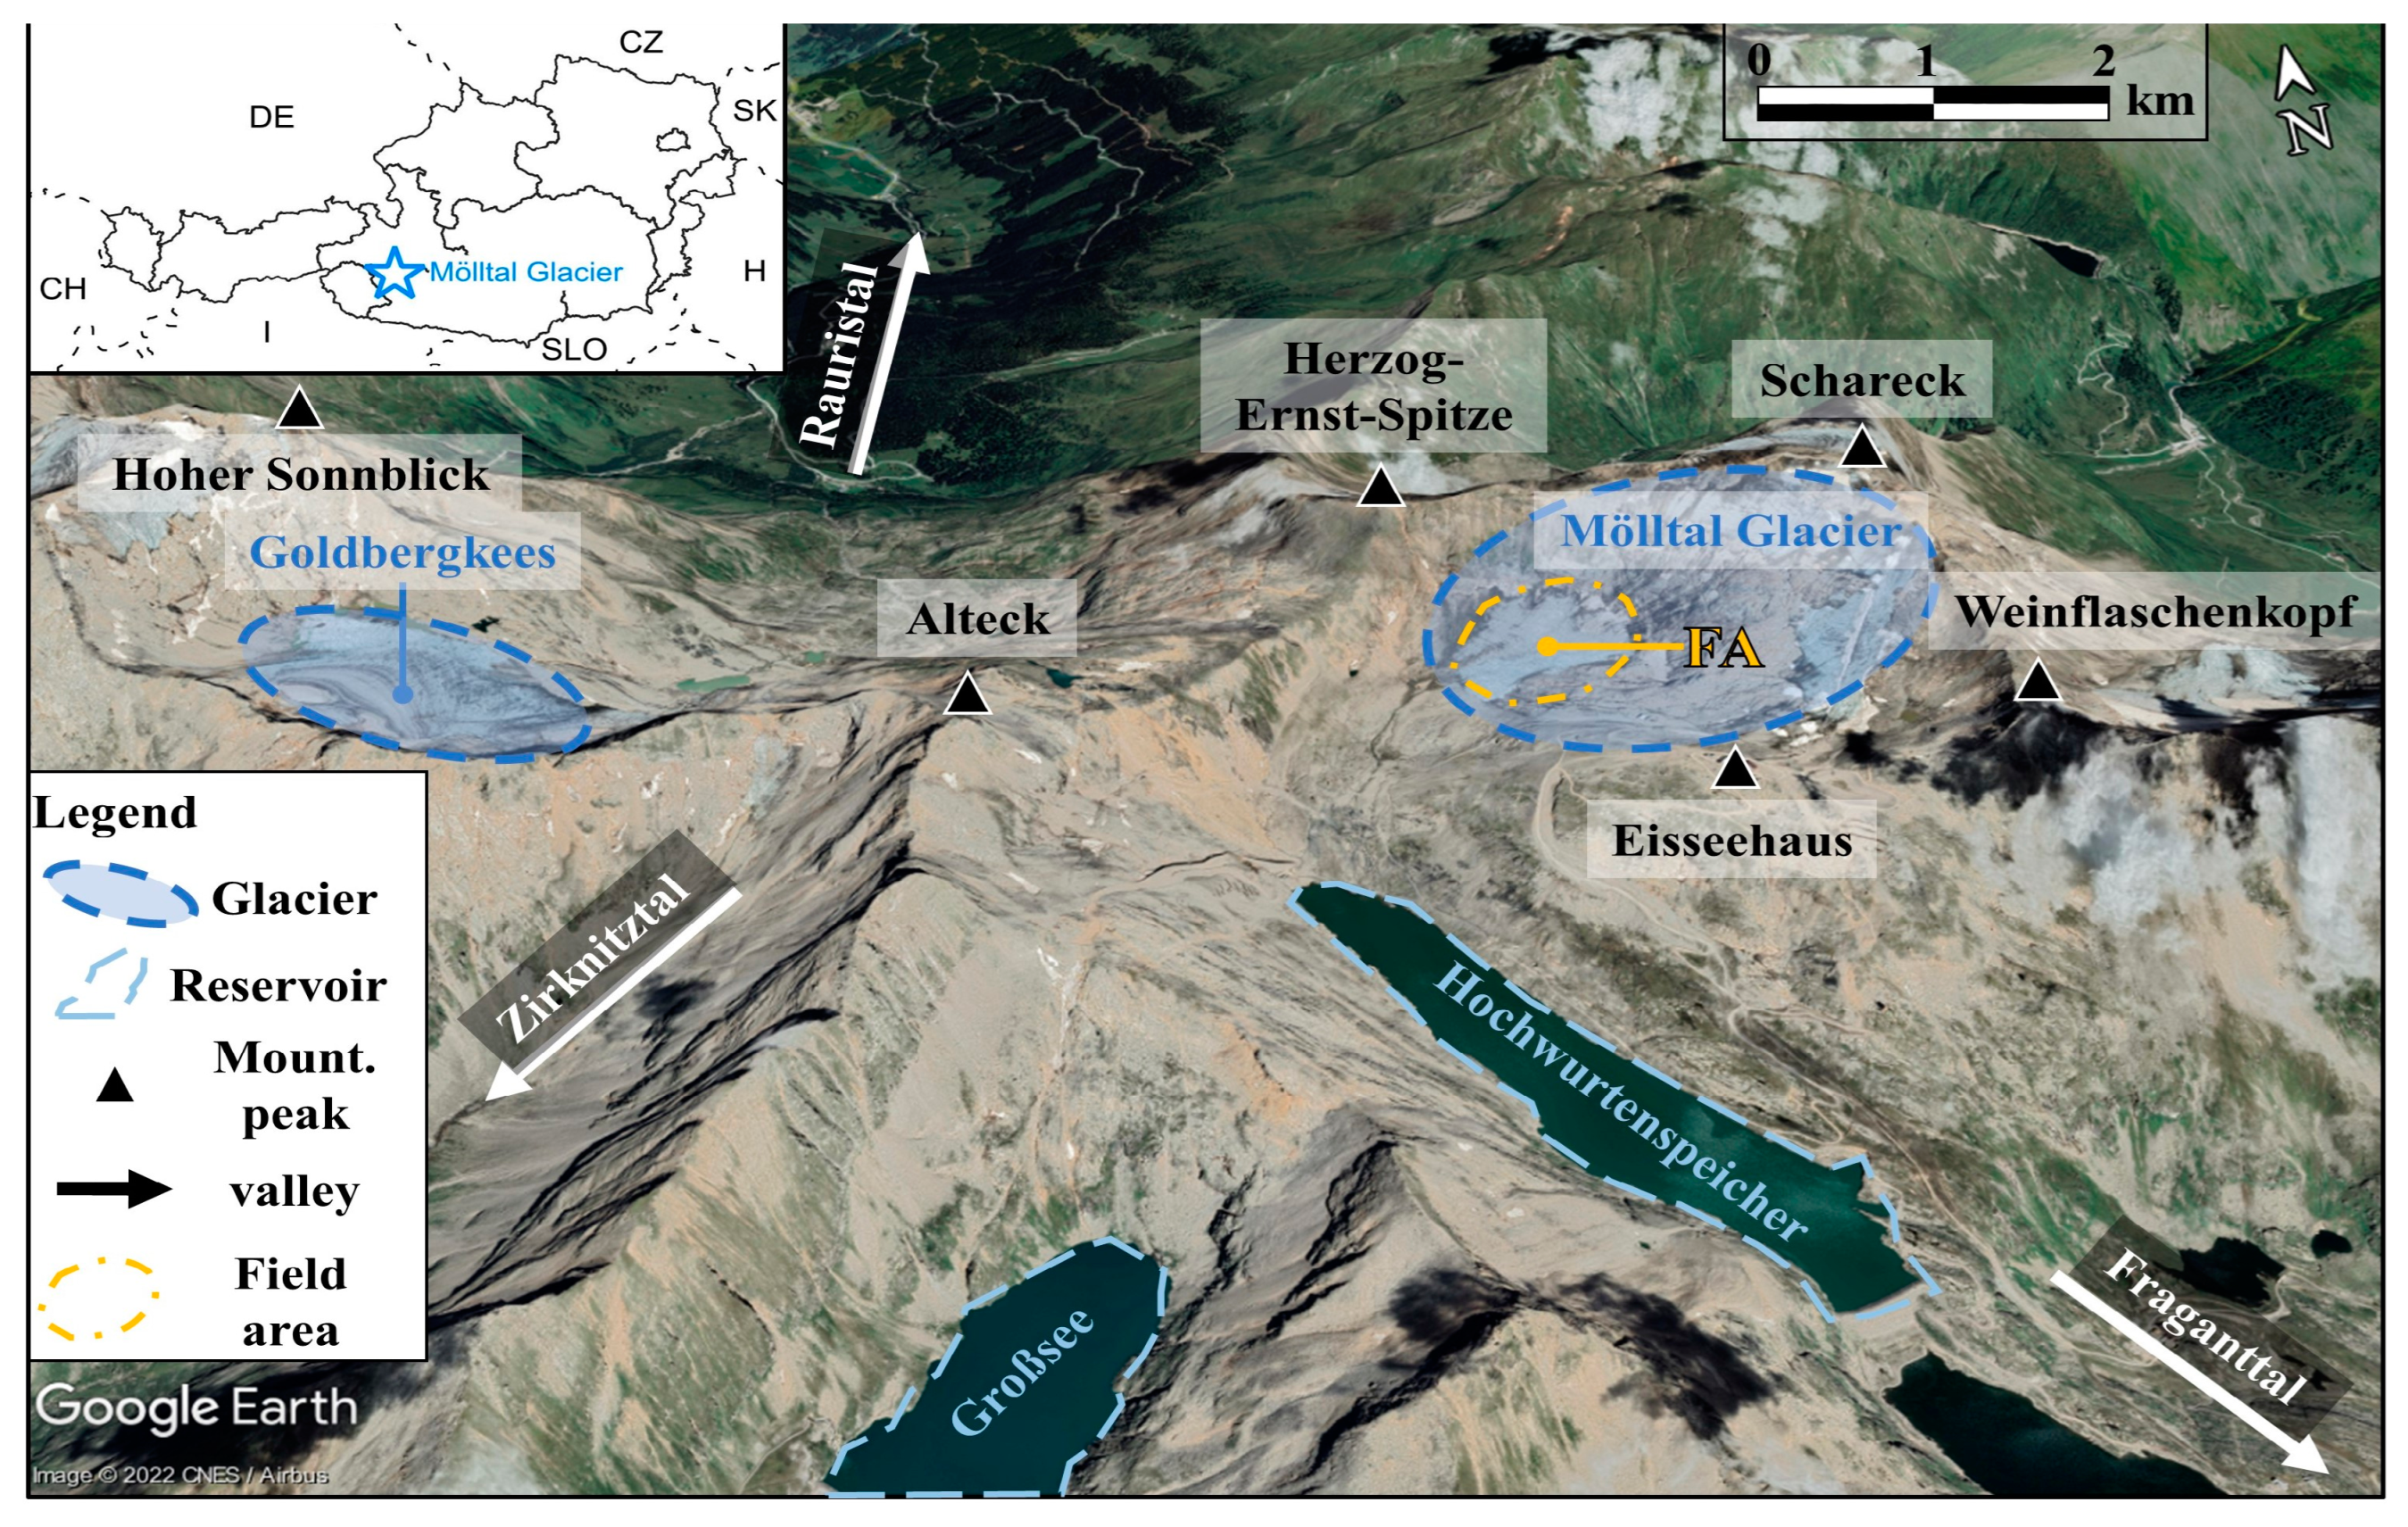
Initial InSARTrac tests under uncontrolled field conditions and a single instrument position were performed at the Pasterze Glacier in Austria [15]. Glaciers provide an ideal test environment, as their displacements are slow and continuous and their surface is unvegetated. Results from the Pasterze Glacier quantified daily movement attributes and could discern differential movement components, including ice flow, melting, and sliding of supraglacial moraine material (rock debris overlying the ice). Extrapolated short-term InSARTrac results are well correlated to annual measurements of the Pasterze Glacier by the Austrian Alpine Club (Österreichischer Alpenverein). This paper summarizes the results of subsequent InSARTrac measurements of the Mölltal Glacier in Carinthia, Austria, which utilized multiple instrument positions and were supplemented with light detection and ranging (LIDAR) surveys (Figure 3).

2. Monitoring and Analysis Methods

2.1. Study Site and Monitoring Concept

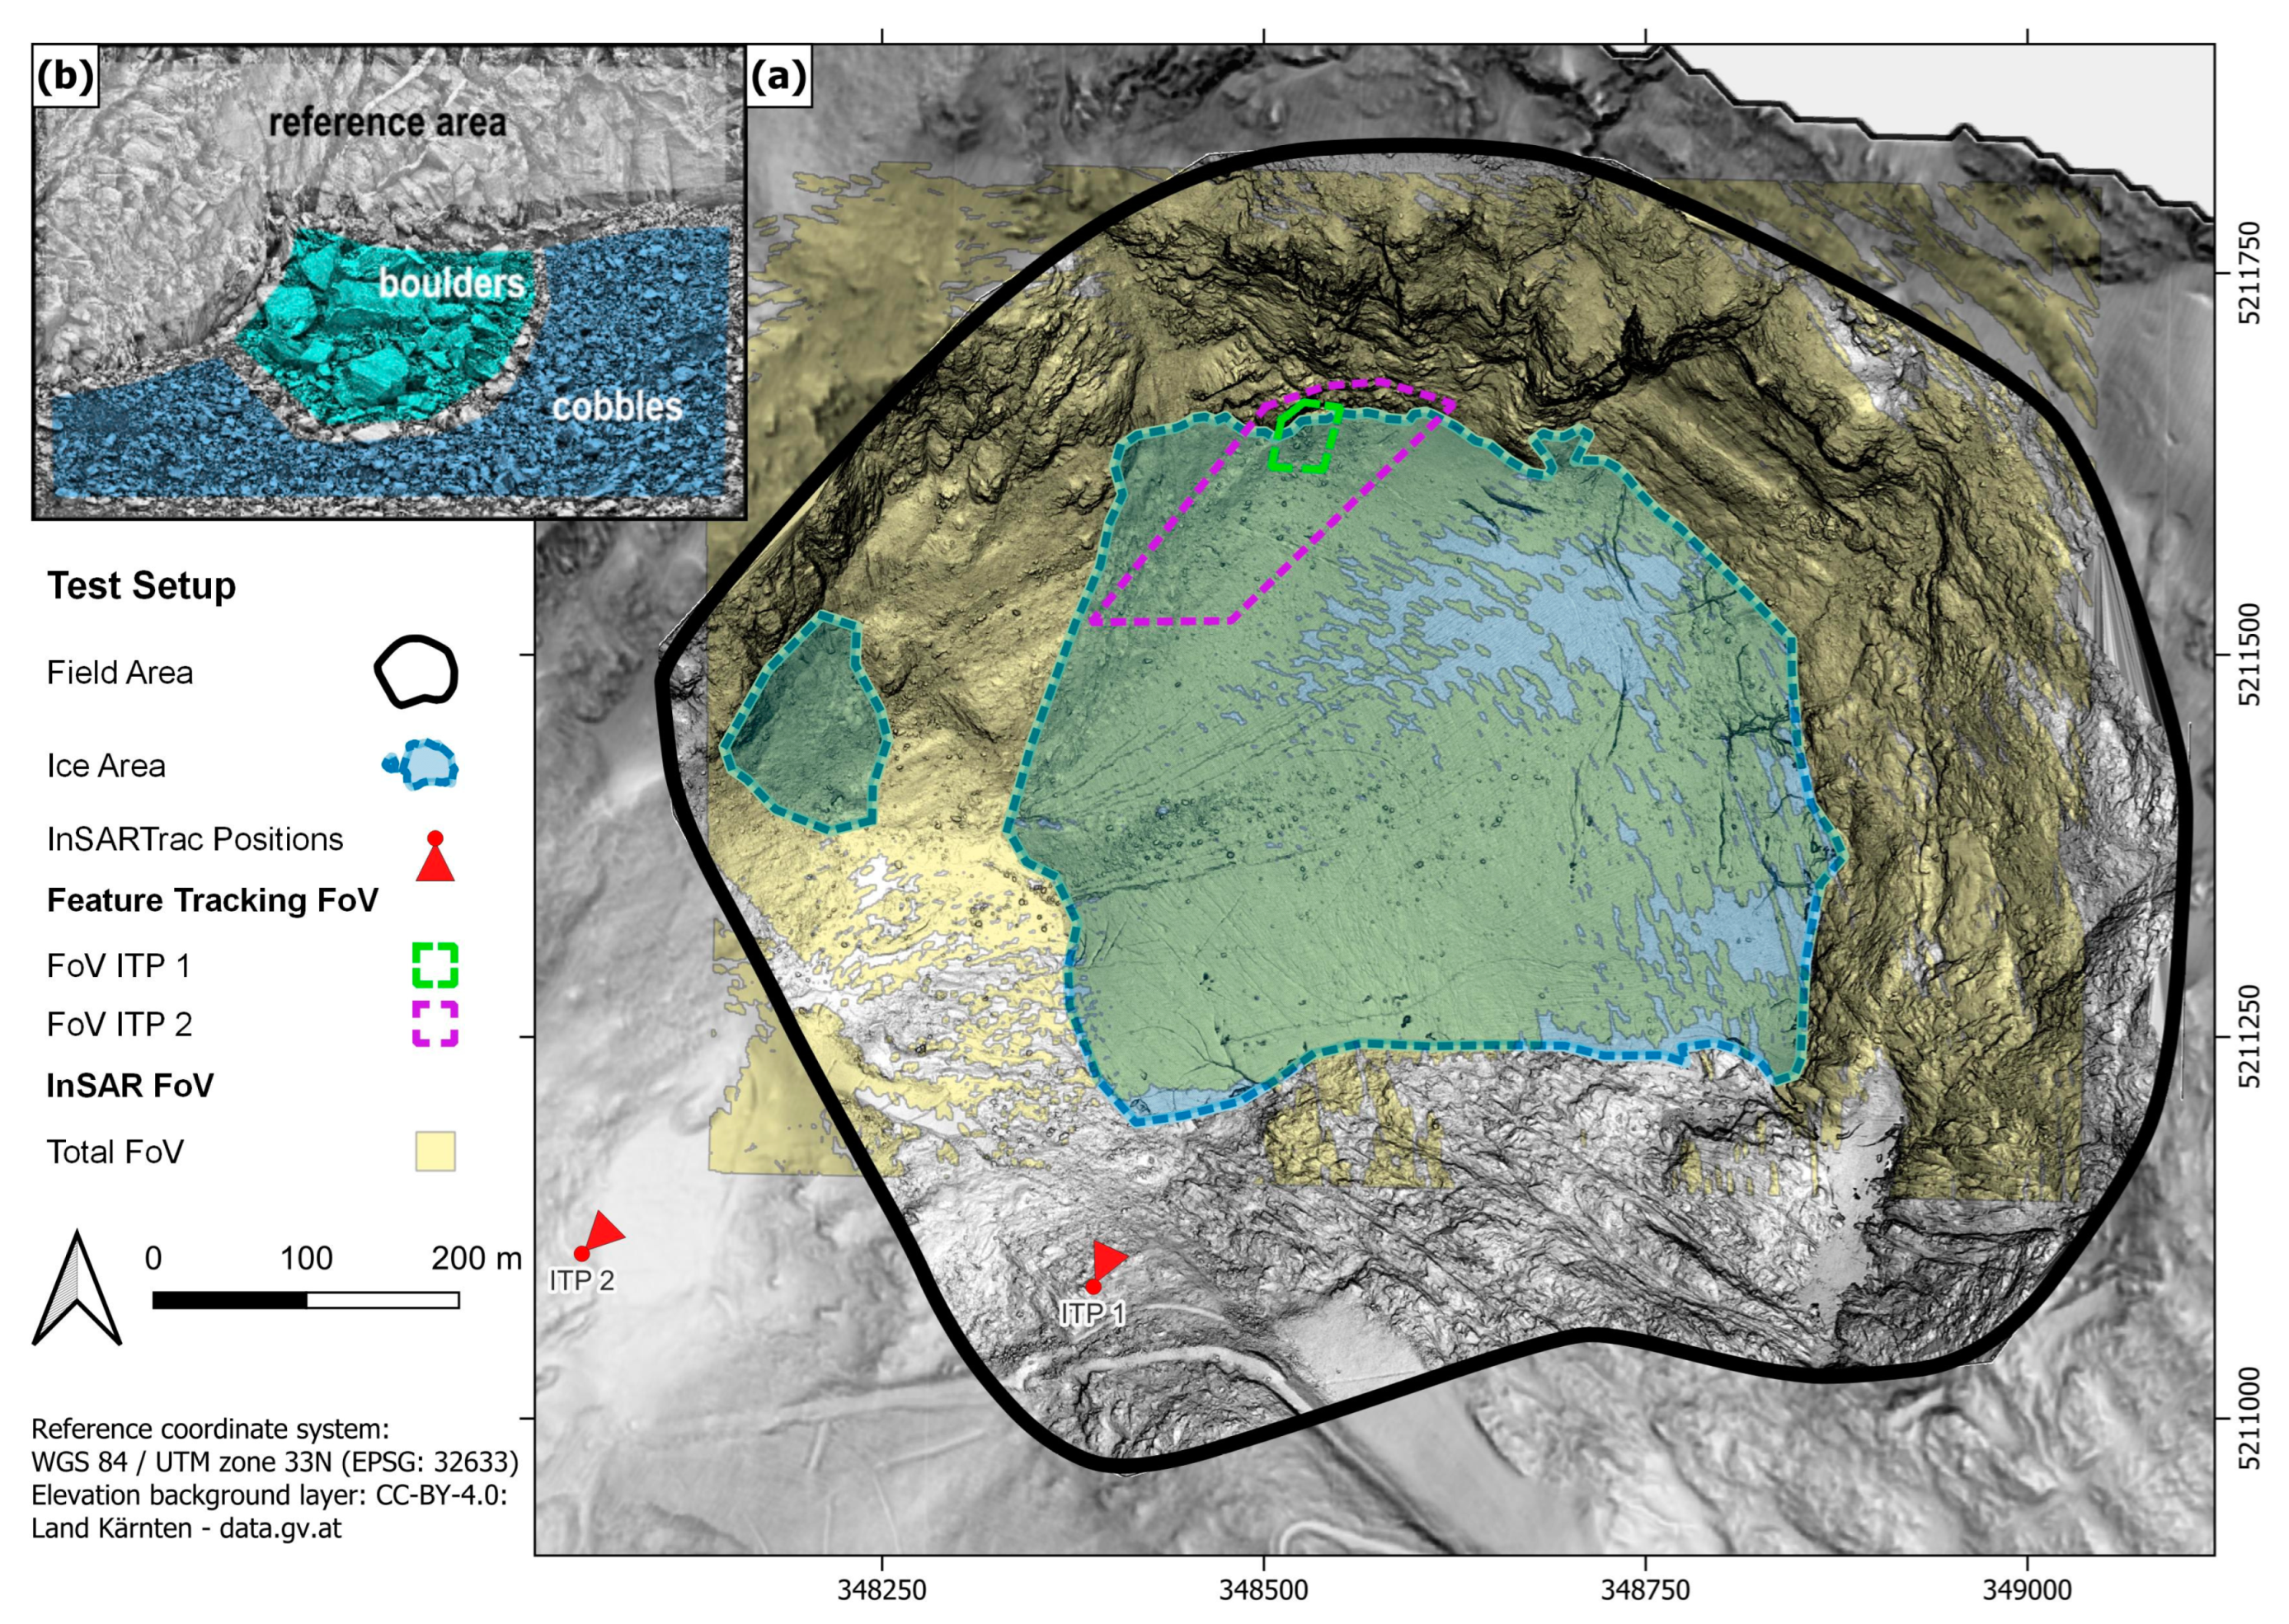
The Mölltal Glacier underwent a median annual retreat rate of about 7.1 m between 2018 and 2021 [16,17]. The four-week monitoring campaign included two InSARTrac instrument positions and three consecutive unmanned aerial vehicle (UAV) LIDAR surveys (Figure 4a). The InSARTrac target comprised a stable reference area and two areas of supraglacial moraine movement (Figure 4b). Results obtained from InSARTrac positions one (ITP 1) and two (ITP 2) were compared, with the assumption that the horizontal component of displacement remained constant during the monitoring intervals. Additionally, differential digital elevation models (DEMs) were compared to the vertical component of InSARTrac measurements.
Environmental conditions were obtained to investigate correlations between glacier and weather dynamics. Weather data were provided from the Integrated Nowcasting through Comprehensive Analysis (INCA) database of GeoSphere Austria [18]. INCA uses weather models in combination with DEMs and a large set of weather stations, such as the four-kilometer-distant Sonnblick weather observatory, to calculate weather data in a one-kilometer raster.

2.2. InSARTrac Setup and Analysis

A similar setup as in the controlled conditions tests was used, with the only difference being that no teleconverter was utilized at ITP 2. The equivalent pixel size at the target area (FoV ITP 1) was 4.6 mm and 11.4 mm monitoring from ITP 1 and ITP 2, respectively. The camera was programmed to capture ten images in rapid succession at hourly intervals.
The FT component of InSARTrac calculations was carried out using a Python (v. 3.8.10) script, which utilizes the Open-Source Computer Vision Library (OpenCV v. 4.3.0). The FT methodology includes: (i) image capturing; (ii) preprocessing; (iii) image registration; and (iv) 2D displacement calculation. The preprocessing involves the removal of low-quality images using the variation of the Laplacian and the minimization of illumination variation effects using contrast-limited adaptive histogram equalization (CLAHE) [19,20]. The image registration and displacement calculation utilized the scale-invariant feature transform (SIFT) algorithm for feature extraction and description, which were used for the affine transformation matrix calculation, by which the images were registered and the displacements calculated. This calculation was combined with random sample consensus (RANSAC) outlier filtering [21]. The InSAR component of the measurements involved raw data analysis, filtering, and displacement calculations that were carried out with the IDS Georadar software Guardian (v. 3.7.0) [22,23]. Guardian allows real-time analysis of displacement data and accounts for atmospheric measurement influences by utilizing the persistent scatter method [24]. Residual InSAR measurement drifts were corrected using the stable reference area.

2.3. UAV Mapping and Analysis

LIDAR-based differential DEMs were generated to provide supplementary information concerning the glacier surface morphology (steepness, orientation), which provides a framework for interpreting the InSARTrac measurements. For DEM generation, a DJI Matrice 300 RTK UAV equipped with a DJI Zenmuse L1 LIDAR having a systematic accuracy of 10 cm/50 m in the horizontal direction and 5 cm/50 m in the vertical direction was utilized [25]. A three-pulse echo was specified with a sampling rate of 160 kHz and an overlap of about 70% between each flight track. The range was kept constant at 100 m above ground. Eight ground control points (GCP) were deployed around the glacier boundary for model registration.
The LIDAR datasets were georeferenced in DJI Terra, and all further preprocessing was performed in CloudCompare (v. 2.12.4) [26,27]. Systematic offsets were removed using the ground control points, followed by an ICP-based fine registration using slopes exceeding an inclination of 50 degrees in order to exclude snow fields. The aligned datasets were filtered from inconsistent points, resampled to a spatial density of 0.05 m, rasterized to a DEM, and evaluated using QGIS (v. 3.24).

3. Results

3.1. Measurement System

The InSARTrac prototype was exposed to freezing temperatures, rain, snowfall, and high humidity. This resulted in continuous lens fogging after 15 September 2022. Occasional power interruptions necessitated InSAR displacement interpolations. The 2D STDs obtained at ITP 1 were 4.1 mm and 18.1 mm for the boulders and the cobbles, respectively. At ITP 2, the equivalent values were 2.8 mm and 2.4 mm. The corresponding precision is represented by the 95% confidence interval, which rarely exceeds two millimeters (Figure 5). The horizontal displacement directions of the boulders are 189.2 and 189.1 degrees, and for the cobbles, 180.7 to 185.3 degrees, measured from ITP 1 and ITP 2, respectively. The InSAR showed for all measurement areas an amplitude between −100 and −105 dB and, over the entire period, a data quality above 97% (software-specific parameter).

3.2. Total Displacements

The FT revealed total displacements of the cobbles to be significantly higher than the boulders (280% in the x-direction and 85% in the y-direction), but the InSAR results of both areas were similar (Table 1). After the second day from ITP 1, the total daily displacements decreased by 19% in the boulders area and 23% in the cobbles area (Figure 5a,b). From ITP 2, a general decrease after the third day (boulders: 59%; cobbles: 57%) and an increase on 13 September (boulders: 189%; cobbles: 123%) occurred (Figure 5c,d). The total daily displacements were in a similar range for both areas.

3.3. Daily Displacement Patterns

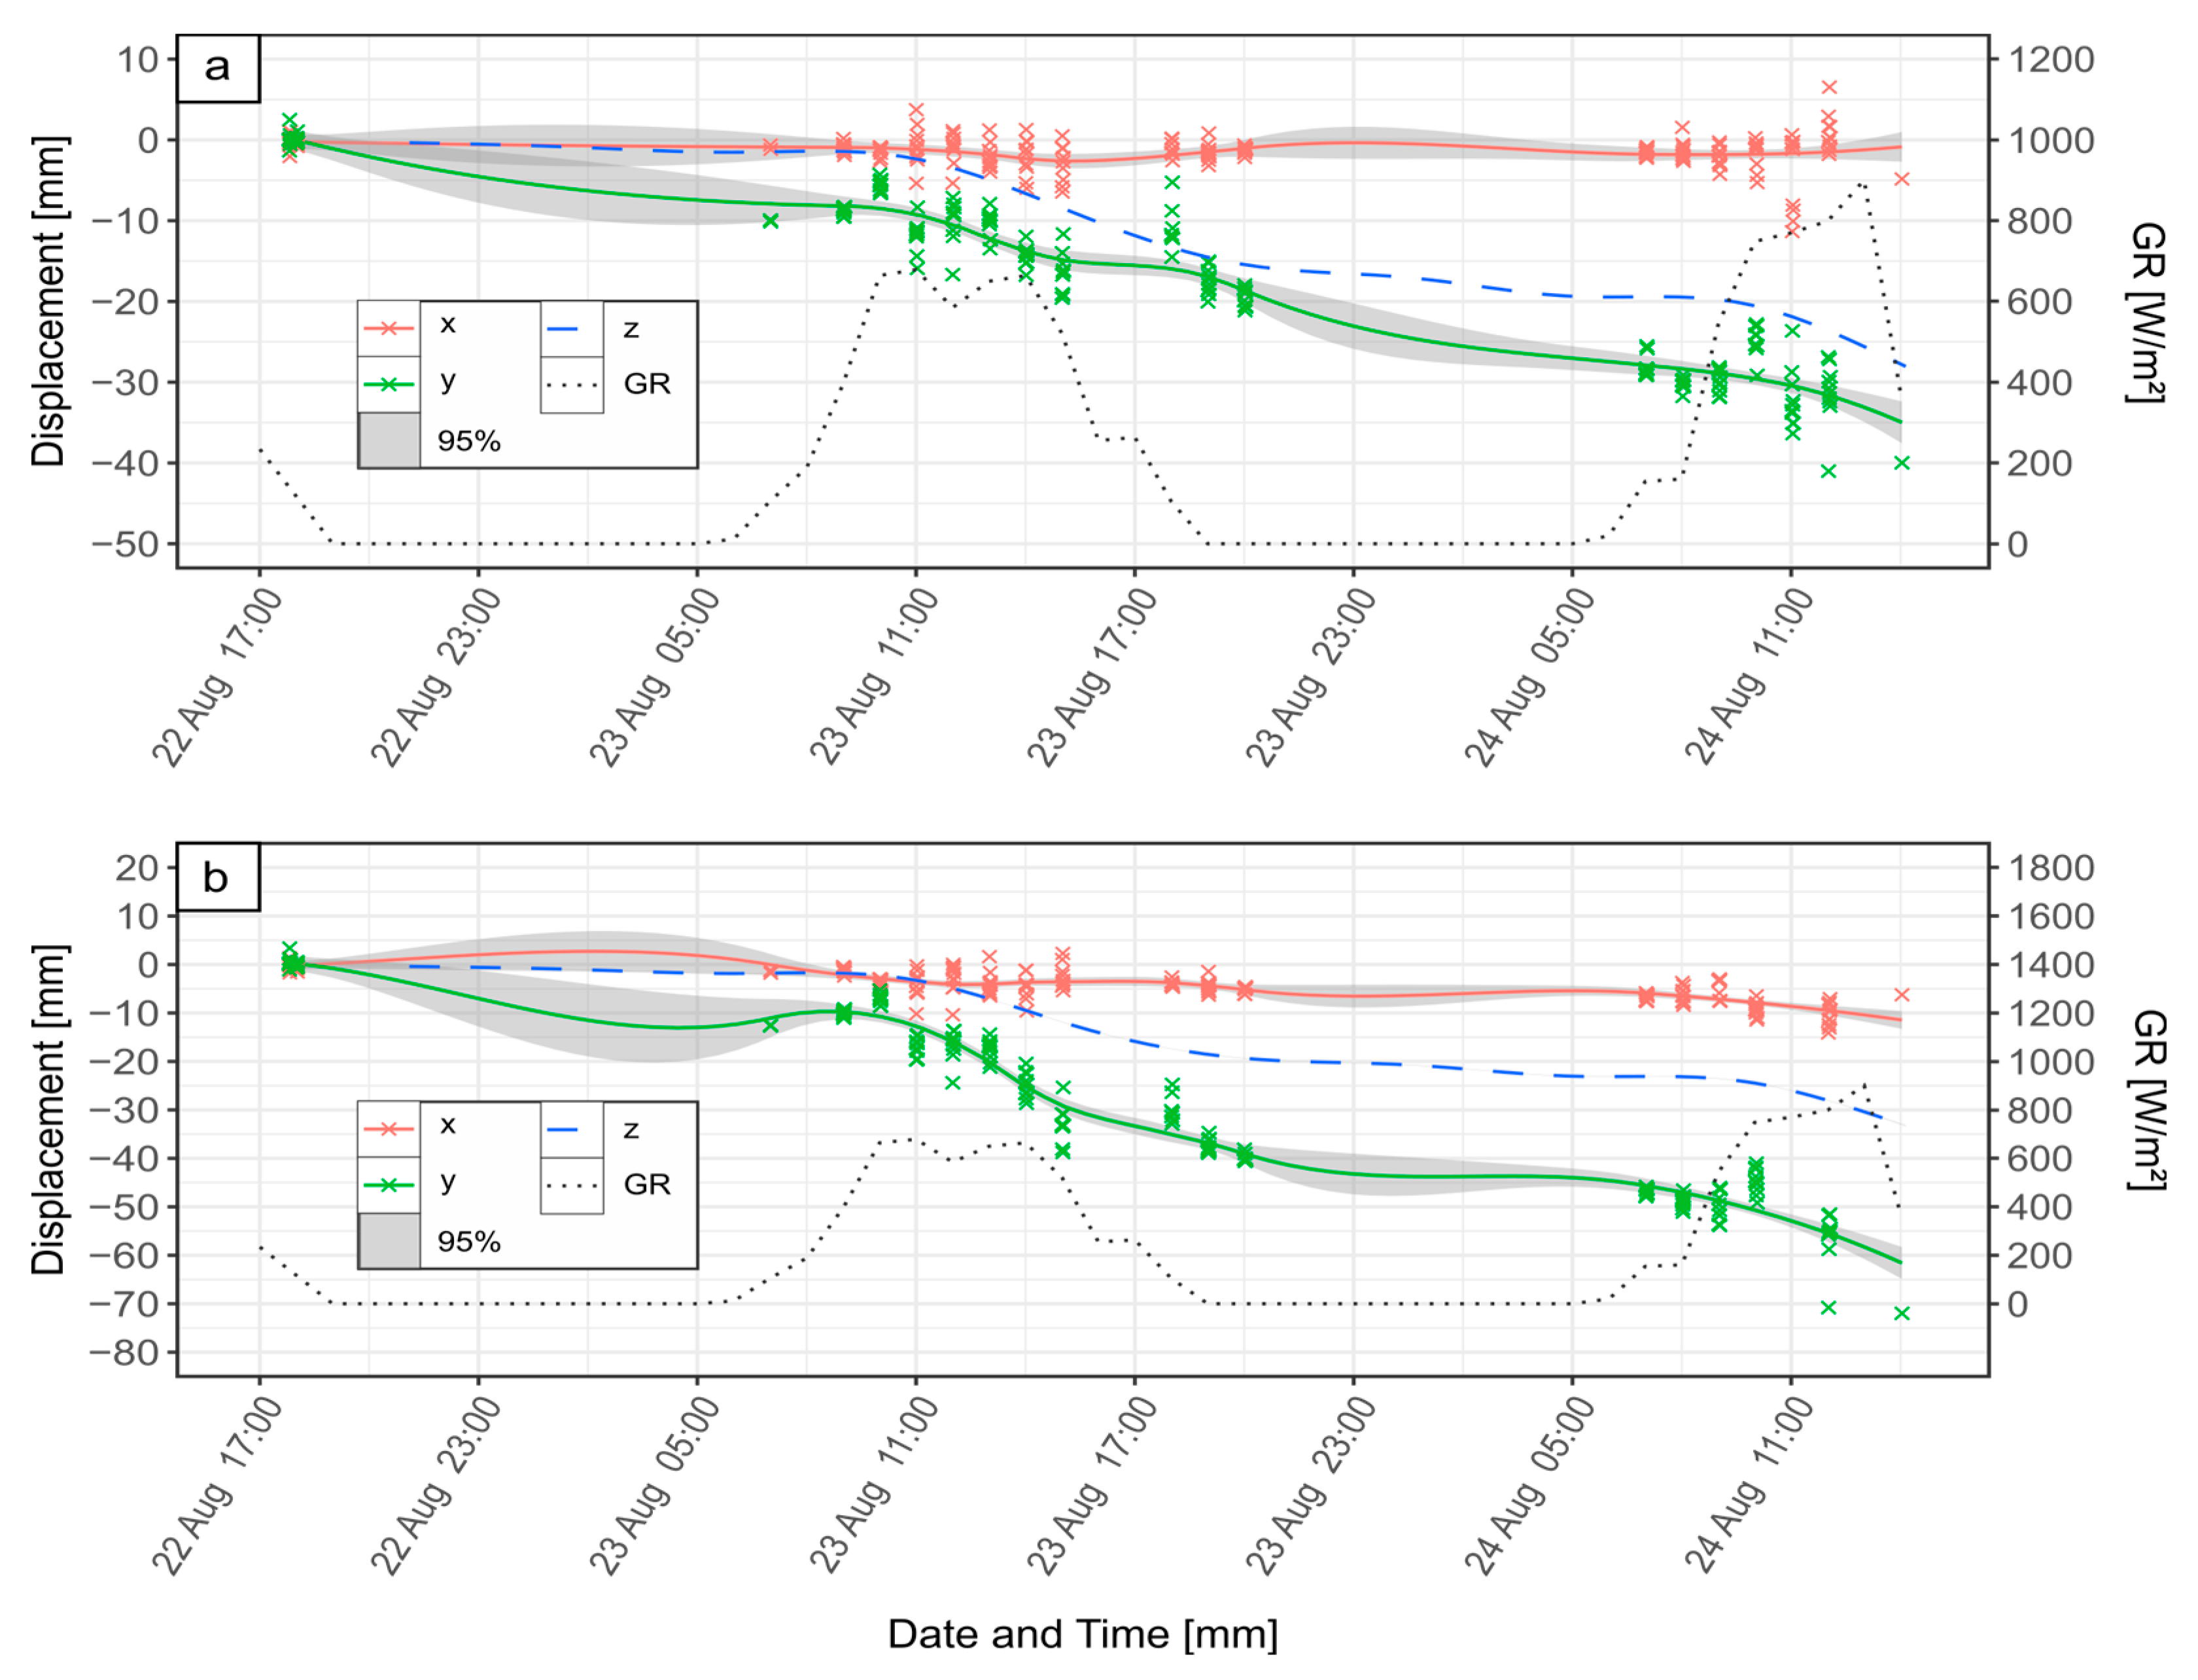
The daily patterns are most distinct in the InSAR measurements and the initial two FT monitoring days from ITP 1 and ITP 2 (Figure 6). Generally, an acceleration occurred around 11:00, shortly after a major increase in global radiation (GR), and a deceleration started at around 18:00, after a strong decrease in GR. The velocity between 11:00 and 18:00 was about twice that measured between 18:00 and 11:00.
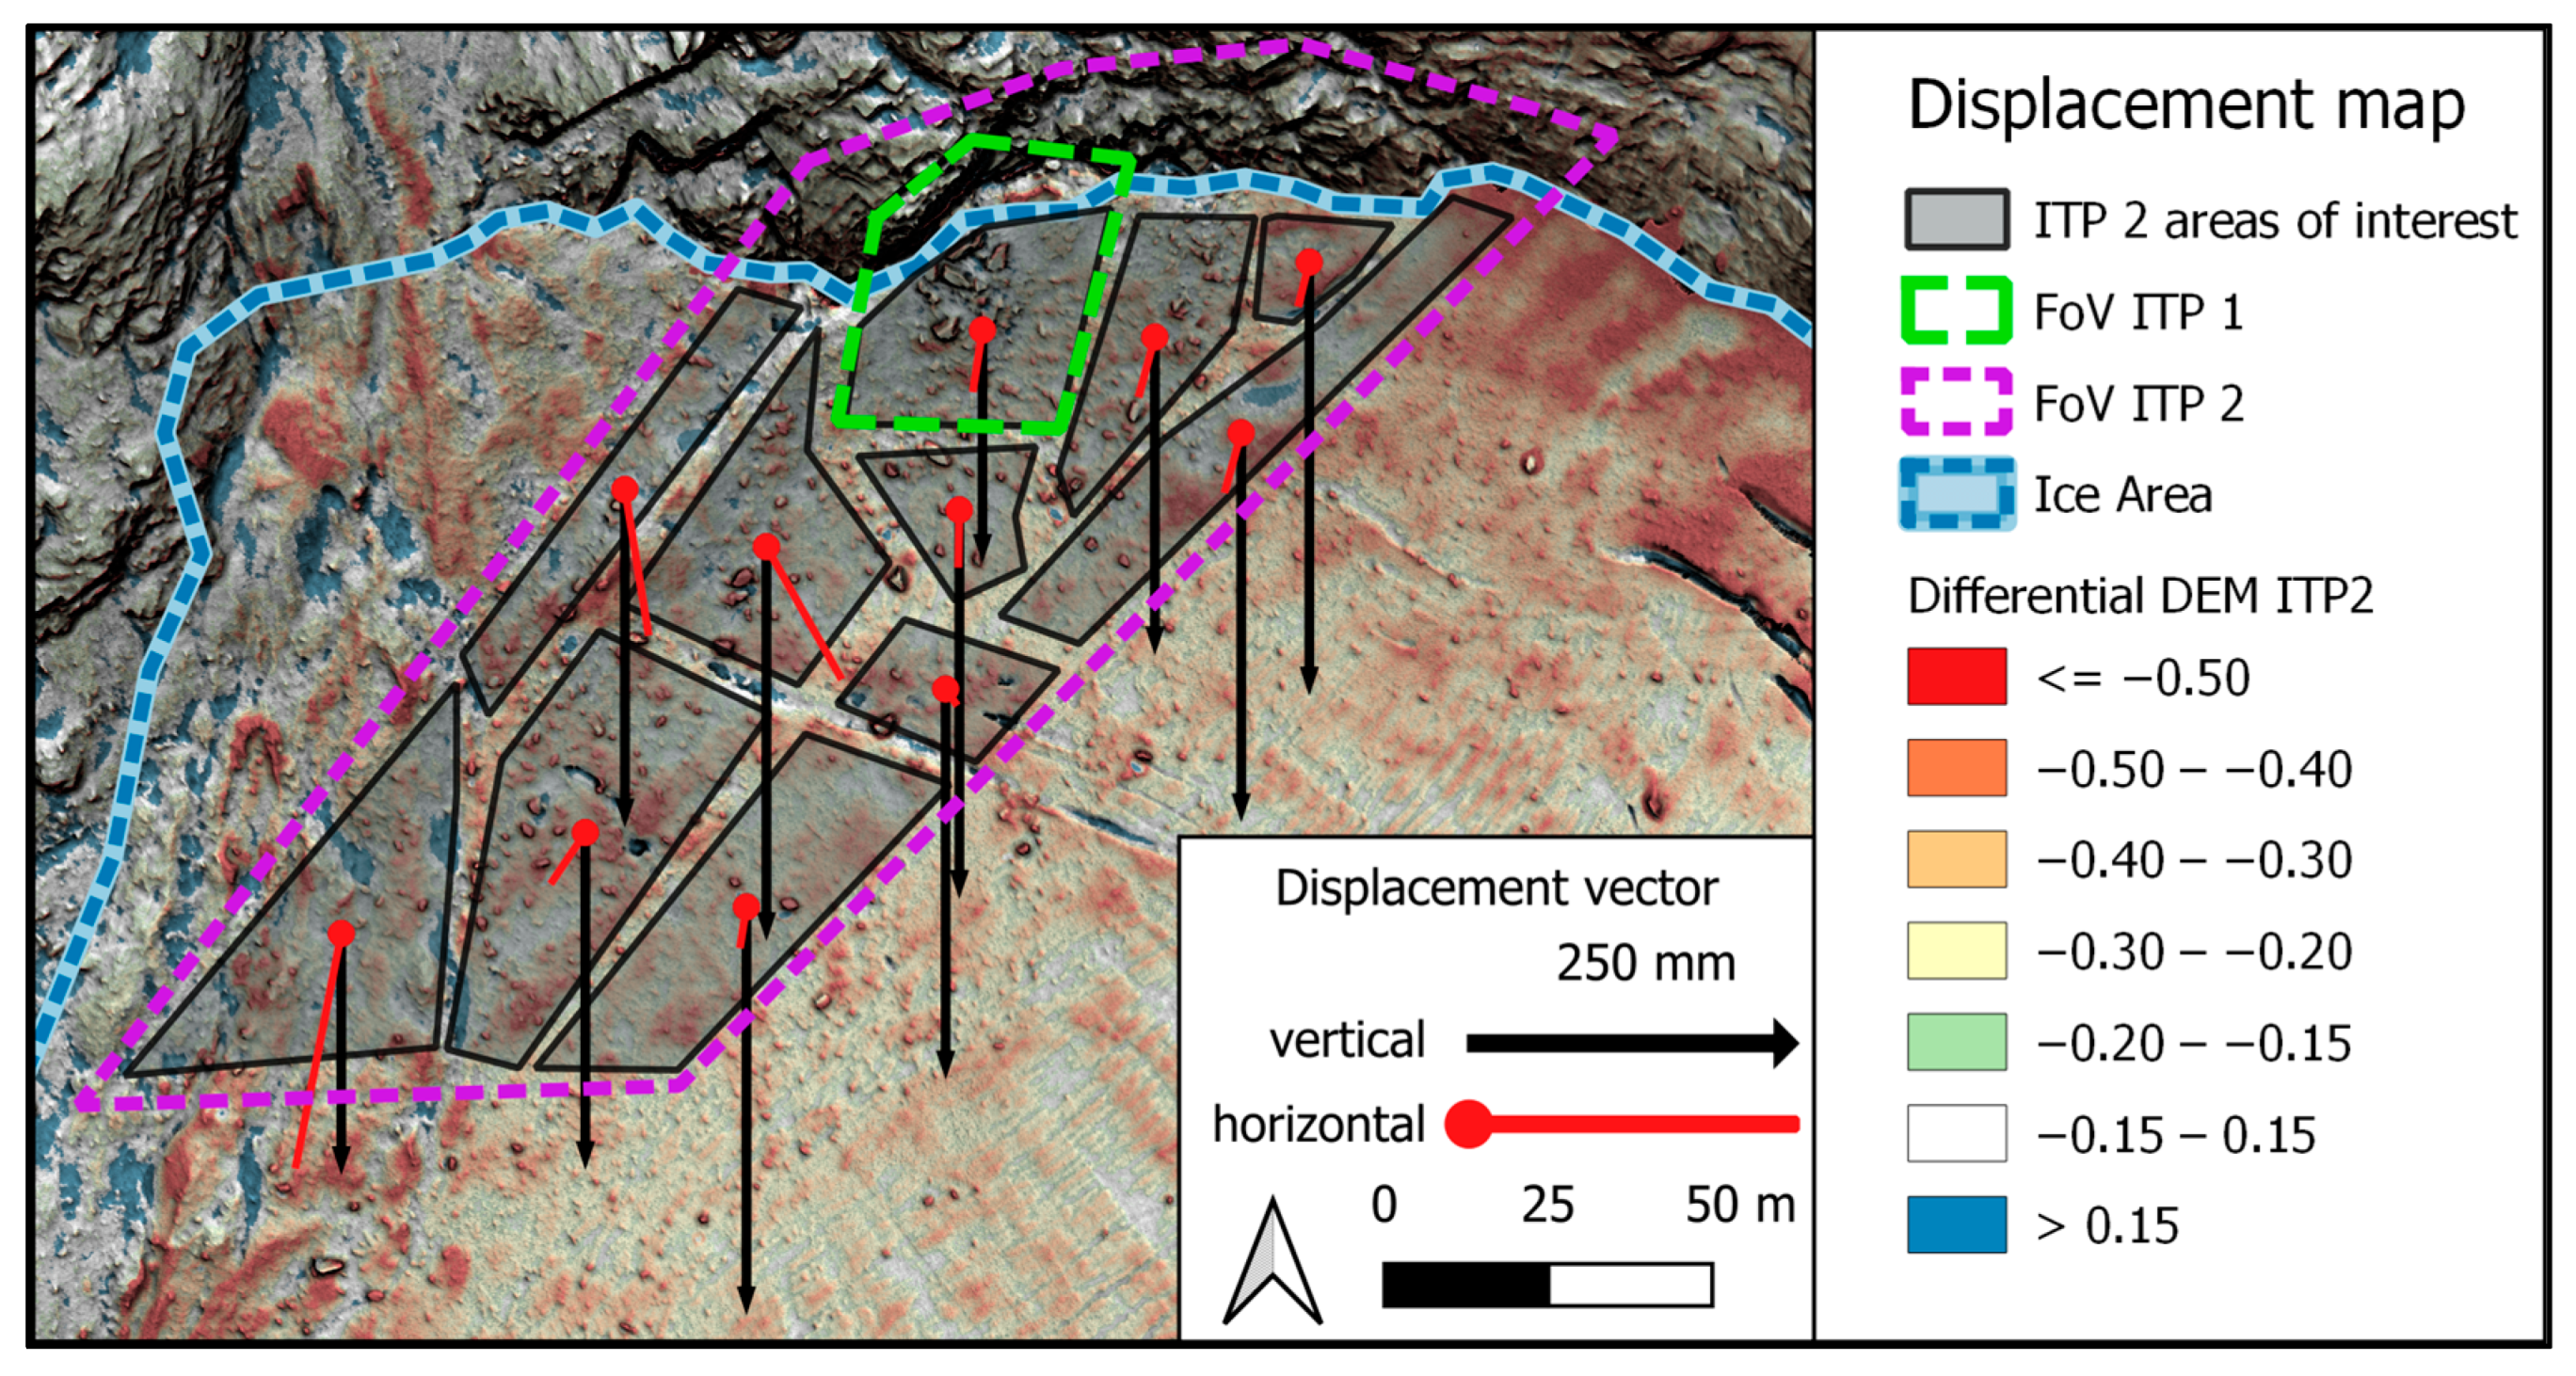
Measurements from ITP 2 focused on ten additional movement areas (Figure 7). The displacements were generally parallel to the downgradient ice surface direction, with increased horizontal displacement magnitudes near the glacier border, where the supraglacial moraine cover is thicker. Increased horizontal displacements also occurred in the areas of the NW gravel fan. The vertical displacements were all similar but slightly increased with distance from the glacier border.

3.4. Differential Elevation Models

According to evaluations of 1500 randomly distributed sampling points, the DEMs have an accuracy of 0.068 m and a precision of 0.13 m. From 2009 to 2022, the glacier surface elevation decreased by an average of about 35 m, with a range of 15 m at the uppermost edges to 57 m at the glacier gate (Figure 8a). Significant elevation decreases also occurred along the south to south-eastern border. During ITP 1, mean surface displacements of about 600 mm (46 mm/day) were recorded, showing higher rates within areas having steep surface gradients and where surface water was observed (Table 2, Figure 8). This pattern was less pronounced and partly obscured by snowfall and snowdrift during the ITP 2 measurements, where mean displacements of only 280 mm (16 mm/day) were measured.

4. Discussion

4.1. Measurement System

The InSAR provided measurements having high temporal resolution. It was not feasible to obtain measurements in some areas of ice located outside of the target due to an oblique angle of the ice surface with respect to the radar waves. The InSAR discriminated displacement details that were not revealed with FT. This is ascribed to the comparatively sparse FT measurement intervals and smoothing algorithm.
The FT algorithm for boulder displacement measurements had a 1D STD of 0.61 and 0.18 pixels during ITP 1 and ITP 2, respectively. Decreasing the timespan of ITP 1 to that of ITP 2 decreases the STD only to 0.46 pixels. This indicates better precision when no teleconverter was used. The 0.18 pixel STD is sufficient for attaining a change detection error of less than 10% [29]. The high STD of mean 2.7 pixels when measuring the cobbles from IPT 1 is likely due to FT limitations related to nonuniform displacements of individual cobbles.
The good correlation between the ITP 1 and ITP 2 horizontal displacement vectors heuristically indicates high InSARTrac accuracy. The 4.8-degree difference in the vector orientation corresponds to 2D and 3D accuracies of 2.1 mm and 3.0 mm (4.2 ppm), respectively. These results are consistent with those obtained under controlled test conditions [12,13].
During ITP 1, the DEM analysis correlated 57% better with the InSARTrac results than anticipated by the DEMs accuracy. The reduced temperatures, the lower GR, and the onset of snowfall during ITP 2 likely caused the reduction of the vertical displacements after 15 September. Their increased STD is presumably caused by strong local height changes as a result of boulder movements.

4.2. Measurement Results

The resultant displacements can be resolved into the downgradient ice surface direction and residual vertical component (Table 3). For comparison, the differential DEM evaluation for the time period between 2009 and 2022 indicates total vertical displacements of 14 m and 18 m for the cobbles and boulders, respectively.
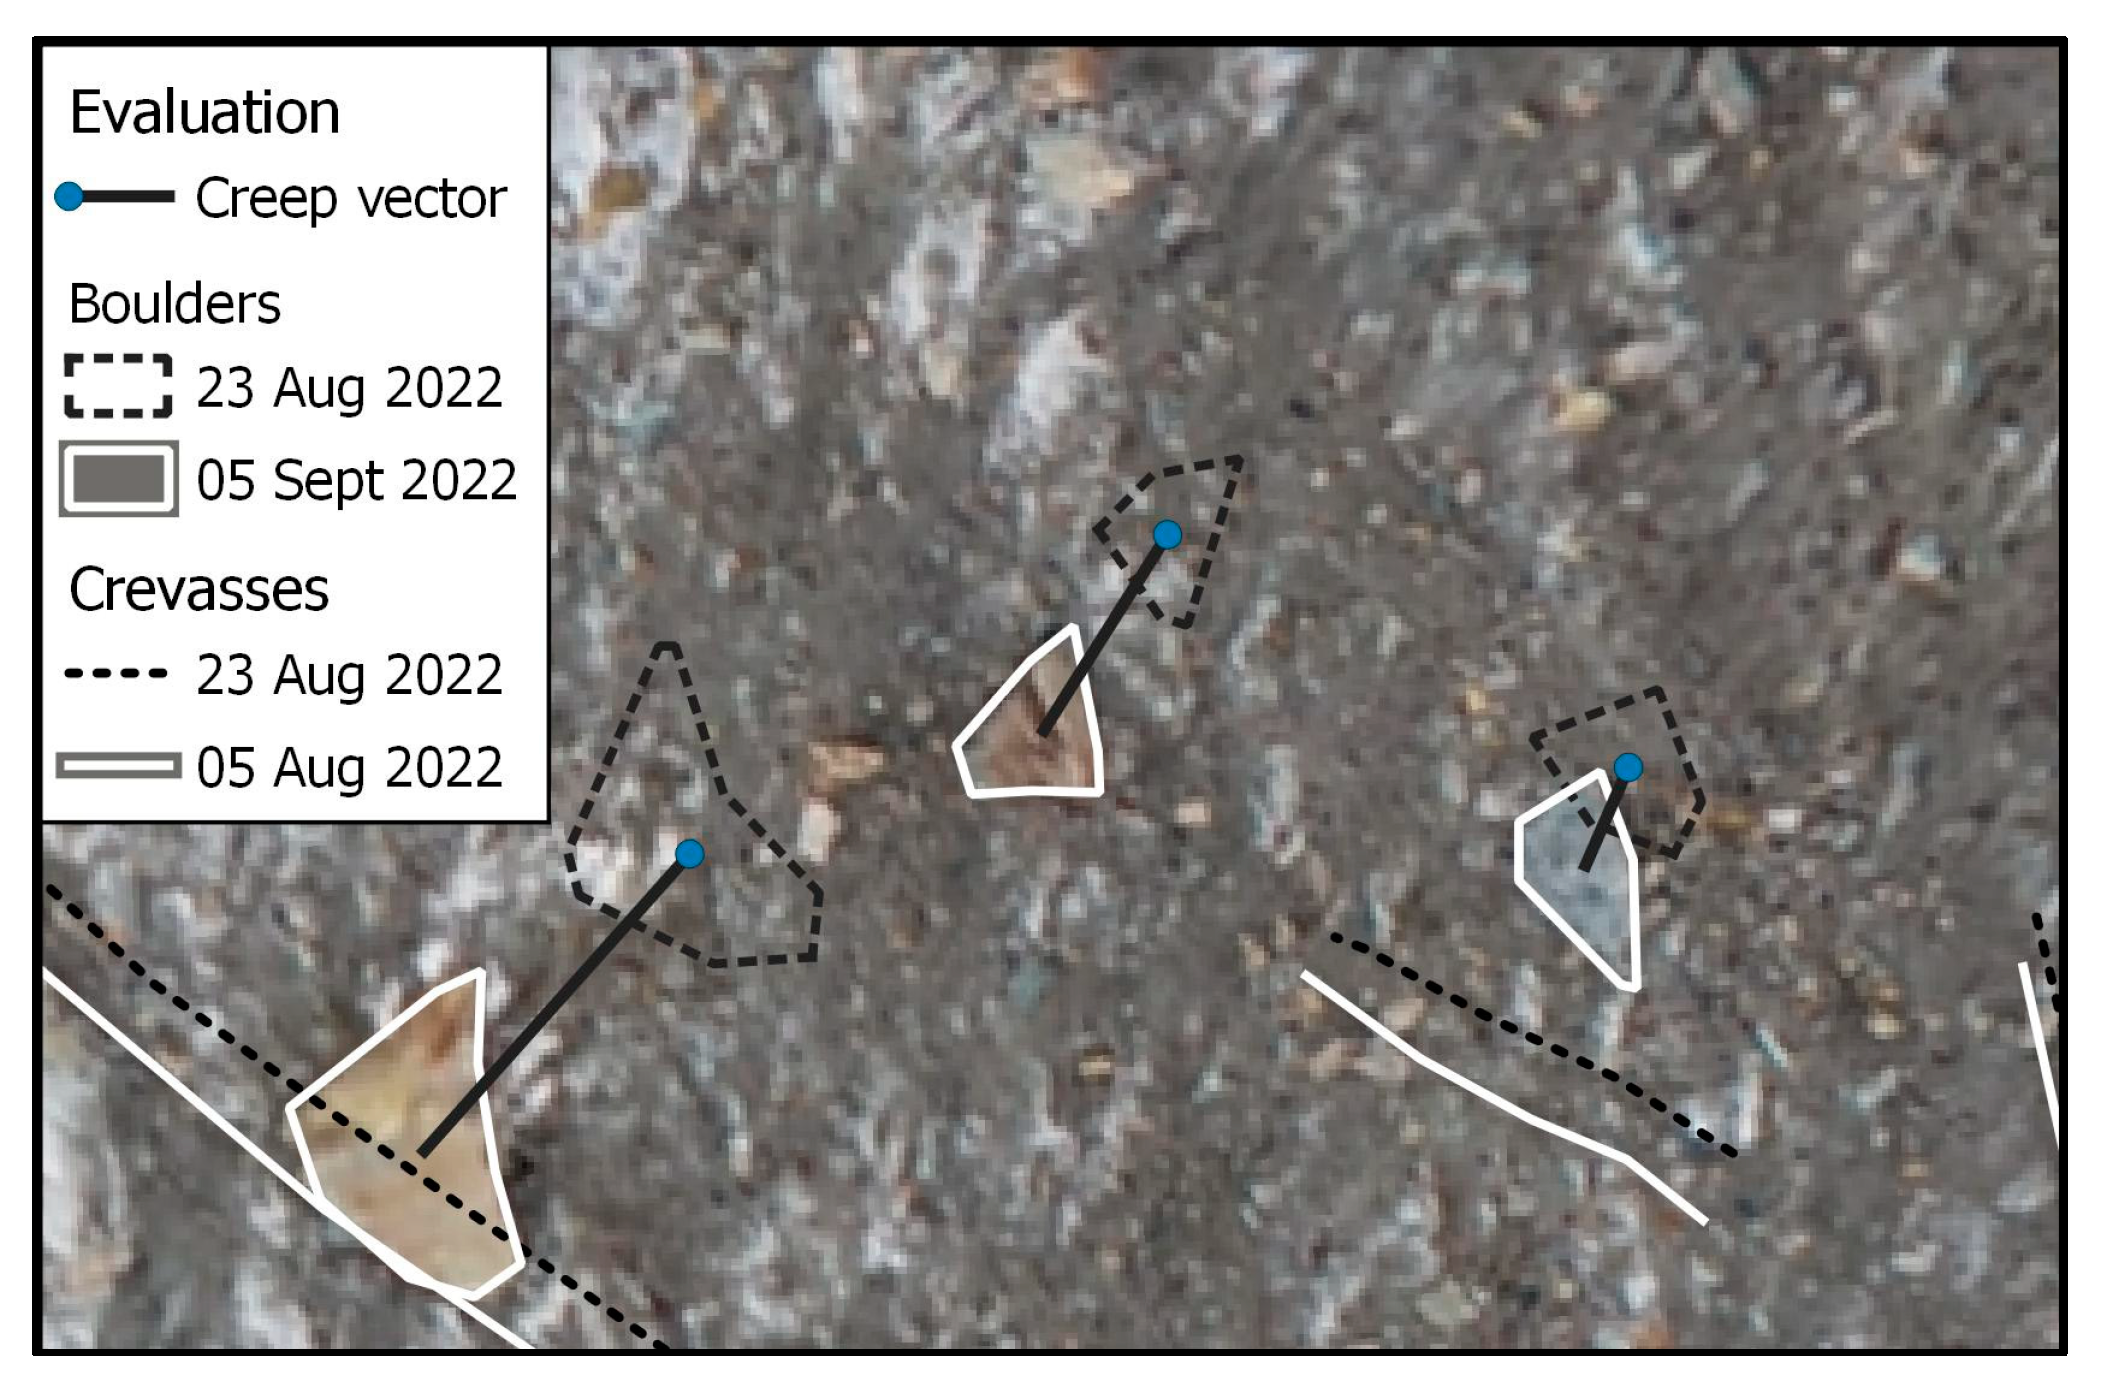
Based on interpretive geologic cross-sections, the glacier basal shear stress is in the range of about 65 kPa to 110 kPa and is thus considered sufficient for ice flow [29]. Glacial crevices also indicate displacement of the entire ice mass. Based on orthophoto comparison, boulder displacements on the ice surface (outside of the measurement areas) were observed to exceed crevice offsets, indicating differential movements between the rock debris and ice surface via mechanisms of sliding or supraglacial moraine creep (Figure 9) [30]. Displacements in the downgradient ice surface direction could also potentially include a component of basal sliding.
The difference between the melting rates of boulder and cobble-covered areas may be related to differences in particle size-dependent ablation rates and shadowing by the nearby rockwall [30]. Moreover, the DEM surface gradient at the boulders might not be representative of the ice surface gradient. If a similar surface gradient as at the cobbles is presumed, the melting amounts converge.
The differential DEM vertical displacements are very uniform in the central area of the glacier, and the vertical displacements decrease near the glacier boundaries. Comparatively large vertical displacements were measured in areas of concentrated surface water flow. Additionally, there is an inverse relationship between the magnitude of vertical displacement and elevation, indicating higher melting rates at lower elevations.
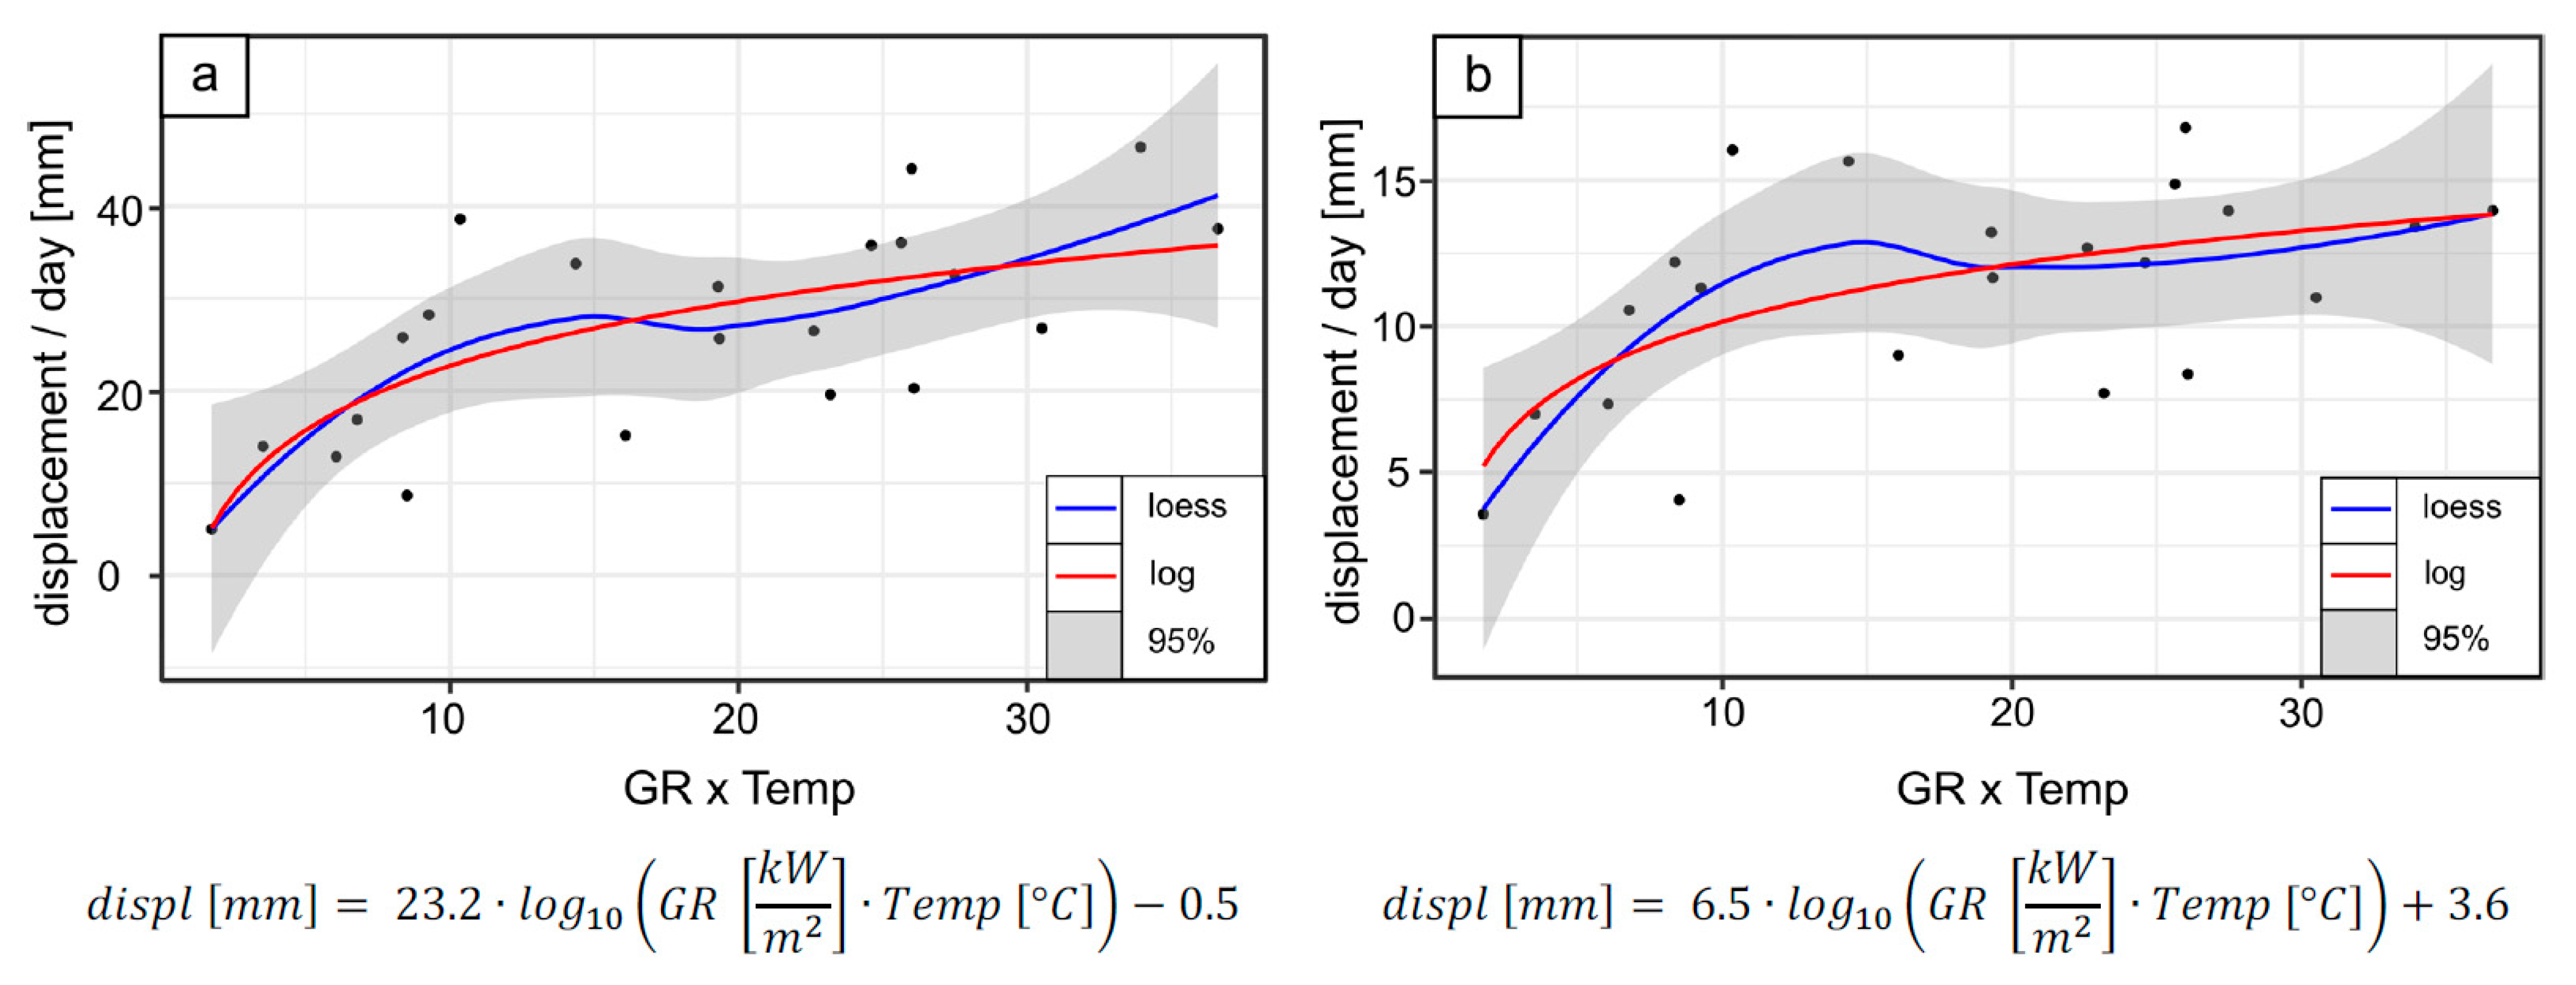
The daily movement pattern is well correlated with the results of previous glacier monitoring studies [15,31]. A logarithmic relationship between the daily displacements of the target areas and the product of GR and the concurrent 24-hour mean air temperature (Temp) was found (Figure 10a). A similar model was generated for the entire glacier, neglecting the surface water influence (Figure 10b). The model approximations have a Pearson coefficient of 0.70 and 0.61 for the target area and the entire glacier, respectively, indicating that higher energy input into the system increases the velocity, which is similar to the results described by Hock (2005) [32].

4.3. Beneficial Effects of 3D Surface Monitoring

Using solely the InSAR LoS measurements, the displacements can be correlated to weather conditions. However, the 3D InSARTrac measurements allow the differentiation of displacement mechanisms that are consistent with components of ice melting and the combined effect of ice flow, block sliding/supraglacial moraine creep, and possibly basal slip. As eluded to, 3D InSARTrac displacement vectors are considered valuable for discriminating the causative mechanisms of other geologic processes involving ground surface displacements.

5. Conclusions

InSARTrac is capable of monitoring surface displacements in 3D without the need for retroreflectors. The system operates within an accuracy of 4.2 ppm, which is in the range of modern total stations having 1″ angular accuracy. This accuracy was determined by a vector comparison of two setup positions, previous accuracy tests, and general displacement mechanism considerations. InSARTrac’s 3D vector, combined with its high temporal resolution in the LoS, allowed measurements of diurnal surface movement trends and their correlation to meteorological data. This research demonstrates the innovative capabilities of InSARTrac for discerning 3D measurements as a basis for interpreting the underlying displacement mechanisms. InSARTrac is considered a novel method not only for glacier monitoring but also for a variety of slow-moving geological phenomena.

Author Contributions

Conceptualization, C.Z.; writing—original draft preparation, C.Z.; writing—review and editing, V.R.; supervision, writing and review, D.S.K. All authors have read and agreed to the published version of the manuscript.

Funding

This research received no external funding.

Data Availability Statement

The data are available on request from the corresponding author.

Acknowledgments

The Mölltaler Gletscherbahnen GesmbH & Co., KG and especially Adolf Gugganig and Bernhard Aschbacher for their great support in the field. KELAG-Kärntner Elektrizitäts Aktiengesellschaft for giving permission to use their road network. Gerhard Paar and Maria del Pilar Caballo Perucha from the Joanneum Research Center in Graz, Austria are acknowledged for their support in the high accuracy camera calibration. Markus Kaspar, Gerhard Lauk and Peter Schreiber from Graz University of Technology for assistance during the measurements. The authors gratefully acknowledge support from NAWI Graz. Open Access Funding by the Graz University of Technology.

Conflicts of Interest

The authors declare no conflict of interest.

References

  1. Pieraccini, M.; Miccinesi, L. Ground-Based Radar Interferometry: A Bibliographic Review. Remote Sens. 2019, 11, 1029. [Google Scholar] [CrossRef] [Green Version]
  2. Fuhrmann, T.; Garthwaite, M.C. Resolving Three-Dimensional Surface Motion with InSAR: Constraints from Multi-Geometry Data Fusion. Remote Sens. 2019, 11, 241. [Google Scholar] [CrossRef] [Green Version]
  3. Eriksen, H.Ø.; Bergh, S.G.; Larsen, Y.; Skrede, I.; Kristensen, L.; Lauknes, T.R.; Blikra, L.H.; Kierulf, H.P. Relating 3D surface displacement from satellite- and ground-based InSAR to structures and geomorphology of the Jettan rockslide, northern Norway. NJG 2017, 97, 283–303. [Google Scholar] [CrossRef] [Green Version]
  4. Hu, J.; Li, Z.W.; Ding, X.L.; Zhu, J.J.; Zhang, L.; Sun, Q. Resolving three-dimensional surface displacements from InSAR measurements: A review. Earth-Sci. Rev. 2014, 133, 1–17. [Google Scholar] [CrossRef]
  5. Tong, X.; Liu, S.; Li, R.; Xie, H.; Liu, S.; Qiao, G.; Feng, T.; Tian, Y.; Ye, Z. Multi-track extraction of two-dimensional surface velocity by the combined use of differential and multiple-aperture InSAR in the Amery Ice Shelf, East Antarctica. Remote Sens. Environ. 2018, 204, 122–137. [Google Scholar] [CrossRef]
  6. Delacourt, C.; Allemand, P.; Berthier, E.; Raucoules, D.; Casson, B.; Grandjean, P.; Pambrun, C.; Varel, E. Remote-sensing techniques for analysing landslide kinematics: A review. Bull. De La Société Géologique De Fr. 2007, 178, 89–100. [Google Scholar] [CrossRef]
  7. Casson, B.; Delacourt, C.; Allemand, P. Contribution of multi-temporal remote sensing images to characterize landslide slip surface — Application to the La Clapière landslide (France). Nat. Hazards Earth Syst. Sci. 2005, 5, 425–437. [Google Scholar] [CrossRef]
  8. Lacroix, P.; Berthier, E.; Maquerhua, E.T. Earthquake-driven acceleration of slow-moving landslides in the Colca valley, Peru, detected from Pléiades images. Remote Sens. Environ. 2015, 165, 148–158. [Google Scholar] [CrossRef]
  9. Travelletti, J.; Delacourt, C.; Allemand, P.; Malet, J.-P.; Schmittbuhl, J.; Toussaint, R.; Bastard, M. Correlation of multi-temporal ground-based optical images for landslide monitoring: Application, potential and limitations. ISPRS J. Photogramm. Remote Sens. 2012, 70, 39–55. [Google Scholar] [CrossRef] [Green Version]
  10. Bickel, V.; Manconi, A.; Amann, F. Quantitative Assessment of Digital Image Correlation Methods to Detect and Monitor Surface Displacements of Large Slope Instabilities. Remote Sens. 2018, 10, 865. [Google Scholar] [CrossRef] [Green Version]
  11. Kuang, J.; Ng, A.H.-M.; Ge, L.; Metternicht, G.I.; Clark, S.R. Joint Use of Optical and Radar Remote Sensing Data for Characterizing the 2020 Aniangzhai Landslide Post-Failure Displacement. Remote Sens. 2023, 15, 369. [Google Scholar] [CrossRef]
  12. Zambanini, C.; Kieffer, D.S.; Lienhart, W.; Woschitz, H. InSARTrac: A novel approach for remote acquisition of 3D slope displacement vectors. IOP Conf. Ser. Earth Environ. Sci. 2021, 833, 12148. [Google Scholar] [CrossRef]
  13. Zambanini, C.; Kieffer, D.S.; Woschitz, H.; Lienhart, W. Hybrid InSARTrac for Remote Geostructure Monitoring; American Society of Civil Engineers: Reston, VA, USA, 2022; Available online: https://ascelibrary.org/doi/book/10.1061/9780784484067 (accessed on 12 December 2022).
  14. IDS GeoRadar. Available online: https://idsgeoradar.com/products/interferometric-radar/hydra-g (accessed on 12 December 2022).
  15. Zambanini, C.; Kieffer, D.S. Hybrid InSARTrac for monitoring interglacial movement patterns. IOP Conf. Ser. Earth Environ. Sci. 2023, 1124, 12028. [Google Scholar] [CrossRef]
  16. Lieb, G.K.; Kellerer-Pirklbauer, A. Gletscherbericht 2019/20 Sammelbericht über die Gletschermessungen des Österreichischen Alpenvereins im Jahr 2020. Letzter Bericht: Bergauf 2/2020. 2020. Available online: https://www.alpenverein.at/portal_wAssets/docs/service/presse/2021/gletscherbericht/Alpenverein_Bergauf-2-21_Gletscherbericht.pdf (accessed on 9 January 2023).
  17. Lieb, G.K.; Kellerer-Pirklbauer, A. Gletscherbericht 2020/21 Sammelbericht über die Gletschermessungen des Österreichischen Alpenvereins im Jahre 2021. 2022. Available online: https://www.alpenverein.at/portal_wAssets/docs/service/presse/2022/gletscherbericht/Bergauf_Gletscherbericht-2020_21.pdf (accessed on 7 January 2023).
  18. Haiden, T.; Kann, A.; Wittmann, C.; Pistotnik, G.; Bica, B.; Gruber, C. The Integrated Nowcasting through Comprehensive Analysis (INCA) System and Its Validation over the Eastern Alpine Region. Weather Forecast. 2011, 26, 166–183. [Google Scholar] [CrossRef]
  19. Pech-Pacheco, J.L.; Cristobal, G.; Chamorro-Martinez, J.; Fernandez-Valdivia, J. Diatom autofocusing in brightfield microscopy: A comparative study. In Proceedings of the 15th International Conference on Pattern Recognition, ICPR-2000, Barcelona, Spain, 3–7 September 2000; Volume 3, pp. 314–317, ISBN 1051-4651. [Google Scholar]
  20. Zuiderveld, K. Contrast Limited Adaptive Histogram Equalization. Graph. Gems 1990, 1, 474–485. [Google Scholar] [CrossRef]
  21. Fischler, A.M.; Bolles, C.R. Random sample consensus: A paradigm for model fitting with applications to image analysis and automated cartography. Commun. ACM 1981, 24, 381–395. [Google Scholar] [CrossRef]
  22. Ferretti, A.; Prati, C.; Rocca, F. Permanent scatterers in SAR interferometry. IEEE Trans. Geosci. Remote Sens. 2001, 39, 8–20. [Google Scholar] [CrossRef]
  23. IDS GeoRadar. IBIS Guardian. Available online: https://idsgeoradar.com/products/software/guardian (accessed on 5 May 2022).
  24. Crosetto, M.; Monserrat, O.; Cuevas-González, M.; Devanthéry, N.; Crippa, B. Persistent Scatterer Interferometry: A review. ISPRS J. Photogramm. Remote Sens. 2016, 115, 78–89. [Google Scholar] [CrossRef] [Green Version]
  25. Da-Jiang Innovations Science and Technology Co., Ltd. L1 Operation Guidebook; Da-Jiang Innovations Science and Technology Co., Ltd.: Shenzhen, China, 2022. [Google Scholar]
  26. Da-Jiang Innovations Science and Technology Co., Ltd. DJI Terra. Da-Jiang Innovations Science and Technology Co., Ltd.: Shenzhen, China, 2022. [Google Scholar]
  27. CloudCompare. 2022. Available online: https://en.wikipedia.org/wiki/CloudCompare (accessed on 7 January 2023).
  28. Cleveland, W.S. Robust Locally Weighted Regression and Smoothing Scatterplots. J. Am. Stat. Assoc. 1979, 74, 829–836. [Google Scholar] [CrossRef]
  29. Dai, X.; Khorram, S. The effects of image misregistration on the accuracy of remotely sensed change detection. IEEE Trans. Geosci. Remote Sens. 1998, 36, 1566–1577. [Google Scholar] [CrossRef] [Green Version]
  30. Kellerer-pirklbauer, A.; Lieb, G.K.; Avian, M.; Gspurning, J. The response of partially debris-covered valley glaciers to climate change: The example of the pasterze glacier (austria) in the period 1964 to 2006. Geogr. Ann. Ser. A Phys. Geogr. 2008, 90, 269–285. [Google Scholar] [CrossRef]
  31. Liu, L.; Jiang, L.; Sun, Y.; Wang, H.; Sun, Y.; Xu, H. Diurnal fluctuations of glacier surface velocity observed with terrestrial radar interferometry at Laohugou No. 12 Glacier, western Qilian mountains, China. J. Glaciol. 2019, 65, 239–248. [Google Scholar] [CrossRef] [Green Version]
  32. Hock, R. Glacier melt: A review of processes and their modelling. Prog. Phys. Geogr. Earth Environ. 2005, 29, 362–391. [Google Scholar] [CrossRef]
Figure 1. Surface displacements associated with different modes of landsliding: (a) movement of a wedge slide is in the direction of the intersection line of bounding discontinuity planes; (b) movement of rotational slump reflecting attributes of the curved sliding surface.
Remotesensing 15 02031 g001
Figure 2. InSARTrac testing under: (a) controlled laboratory environment [12]; (b) controlled field conditions [13].
Remotesensing 15 02031 g002
Figure 3. Location map of the field area (FA) (Basemap: Google Earth Image © CNES/Airbus).
Remotesensing 15 02031 g003
Figure 4. (a) Overview map of the study area. The ice area marks the glacier extent. The InSARTrac positions, including their orientations of 18.4° and 52.0° to geographic north, are shown for ITP 1 and ITP 2, respectively. Base map: within field area: hillshade of UAV DEM; outside field area: hillshade of 2009 DEM, KAGIS-Geoinformation Land Kärnten. (b) FoV ITP 1 FT image, including reference area and supraglacial moraine areas.
Remotesensing 15 02031 g004
Figure 5. Displacements of (a) boulders and (b) cobbles from ITP 1 and (c) boulders and (d) cobbles from ITP 2. X and y represent displacements measured by FT (x horizontal, positive to the left; y vertical, positive upward) and z displacements measured by InSAR (positive with increasing distance). The x-shaped data points indicate the measurement values, and their corresponding line is their LOESS regression (span = 0.45) [28]. The 95% area represents the confidence interval, and the grey shaded area denotes measurement interruptions with interpolated InSAR data. The global radiation (GR) data and the temperature are plotted using the INCA dataset (Temp) [18].
Remotesensing 15 02031 g005
Figure 6. Displacements of the initial two days from ITP 1 (17:00 22 August 2022 to 14:00 24 August 2022) for the (a) boulders and the (b) cobbles. X and y represent FT (x horizontal, positive to the left; y vertical, positive upward) and z InSAR displacement measurements (positive with increasing distance). The x-shaped data points indicate each single measurement and the corresponding line represents their locally estimated scatterplot smoothing (LOESS) regression (span = 0.45) [28]. The 95% line represents the confidence interval. The GR data from the INCA database are plotted for correlation analysis [18].
Remotesensing 15 02031 g006
Figure 7. Displacement map of ITP 2.
Remotesensing 15 02031 g007
Figure 8. Differential DEM maps. The 2017 DEM was provided by KAGIS-Geoinformation Land Kärnten (CC-BY-4.0: Land Kärnten—data.gv.at, accessed on 2 September 2022).
Remotesensing 15 02031 g008
Figure 9. Indications of differential movement between boulders and ice surface.
Remotesensing 15 02031 g009
Figure 10. Correlation between the product of GR and Temp with the daily displacement for (a) the target area and (b) the entire glacier. The blue line denotes the LOESS regression for these points (span = 0.9) [30]. The grey area represents the 95% confidence interval. The red line denotes the best-fitting logarithmic model.
Remotesensing 15 02031 g010
Table 1. Monitoring results of InSARTrac from ITP 1 and ITP 2 and their conversion to east, north, and height changes. X positive to the left, y positive upward, and z positive with increasing distance.
PositionArea of
Interest
x [mm]
(mm/Day)
y [mm]
(mm/Day)
z [mm]
(mm/Day)
1Boulders−15 (−1.1)−185 (−13.2)−202 (−14.4)
1Cobbles−42 (−3.0)−341 (−24.4)−207 (−14.8)
2Boulders−14 (−1.75)−123 (−15.4)−44 (−5.5)
2Cobbles−27 (−3.4)−172 (−21.5)−67 (−8.4)
PositionArea of
interest
East [mm]
(mm/day)
North [mm]
(mm/day)
Height [mm]
(mm/day)
1Boulders−29 (−2.1)−179 (−12.8)−205 (−14.6)
1Cobbles−2 (−0.1)−174 (−12.4)−362 (−25.9)
2Boulders−4 (−0.5)−25 (−3.1)−129 (−16.1)
2Cobbles−4 (−0.5)−43 (−5.4)−181 (−22.6)
Table 2. DEM analysis.
AreaITP 1ITP 2Total
23 August 2022–5 September 20225 September 2022–22 September 202223 August 2022–22 September 2022
z [mm]
(mm/Day)
σ [mm]z [mm]
(mm/Day)
σ [mm]z [mm]
(mm/Day)
σ [mm]
Global−600 (−46)210−276 (−16)280−880 (−29)370
FoV ITP 1−352 (−27)510−51 (−3)143−550 (−18)628
FoV ITP 2−480 (−37)300−253 (−15)504−753 (−25)398
Boulders−176 (−14)323−165 (−10)230−341 (−11)362
Cobbles−365 (−28)190−197 (−12)143−562 (−19)226
Table 3. Monitoring results from 22 August to 14 September 2022. Ice surface gradient extracted from 5 September 2022 DEM. Boulders [2] assumes a similar ice surface gradient as at the cobbles.
Ice Surface GradientResultant Vector GradientTotal Displ [mm] (mm/Day)Melting [mm]
(mm/Day)
Displacement Parallel to Ice Surface Gradientl [mm] (mm/Day)
Boulders42°58°393 (17.1)148 (6.4)278 (12.1)
Cobbles33°68°585 (25.4)402 (17.5)259 (11.3)
Boulders [2]33°58°393 (17.1)200 (8.7)246 (10.7)
Disclaimer/Publisher’s Note: The statements, opinions and data contained in all publications are solely those of the individual author(s) and contributor(s) and not of MDPI and/or the editor(s). MDPI and/or the editor(s) disclaim responsibility for any injury to people or property resulting from any ideas, methods, instructions or products referred to in the content.