


Forest Structure Characterization in Germany: Novel Products and Analysis Based on GEDI, Sentinel-1 and Sentinel-2 Data

Abstract
1. Introduction
2. Materials and Methods
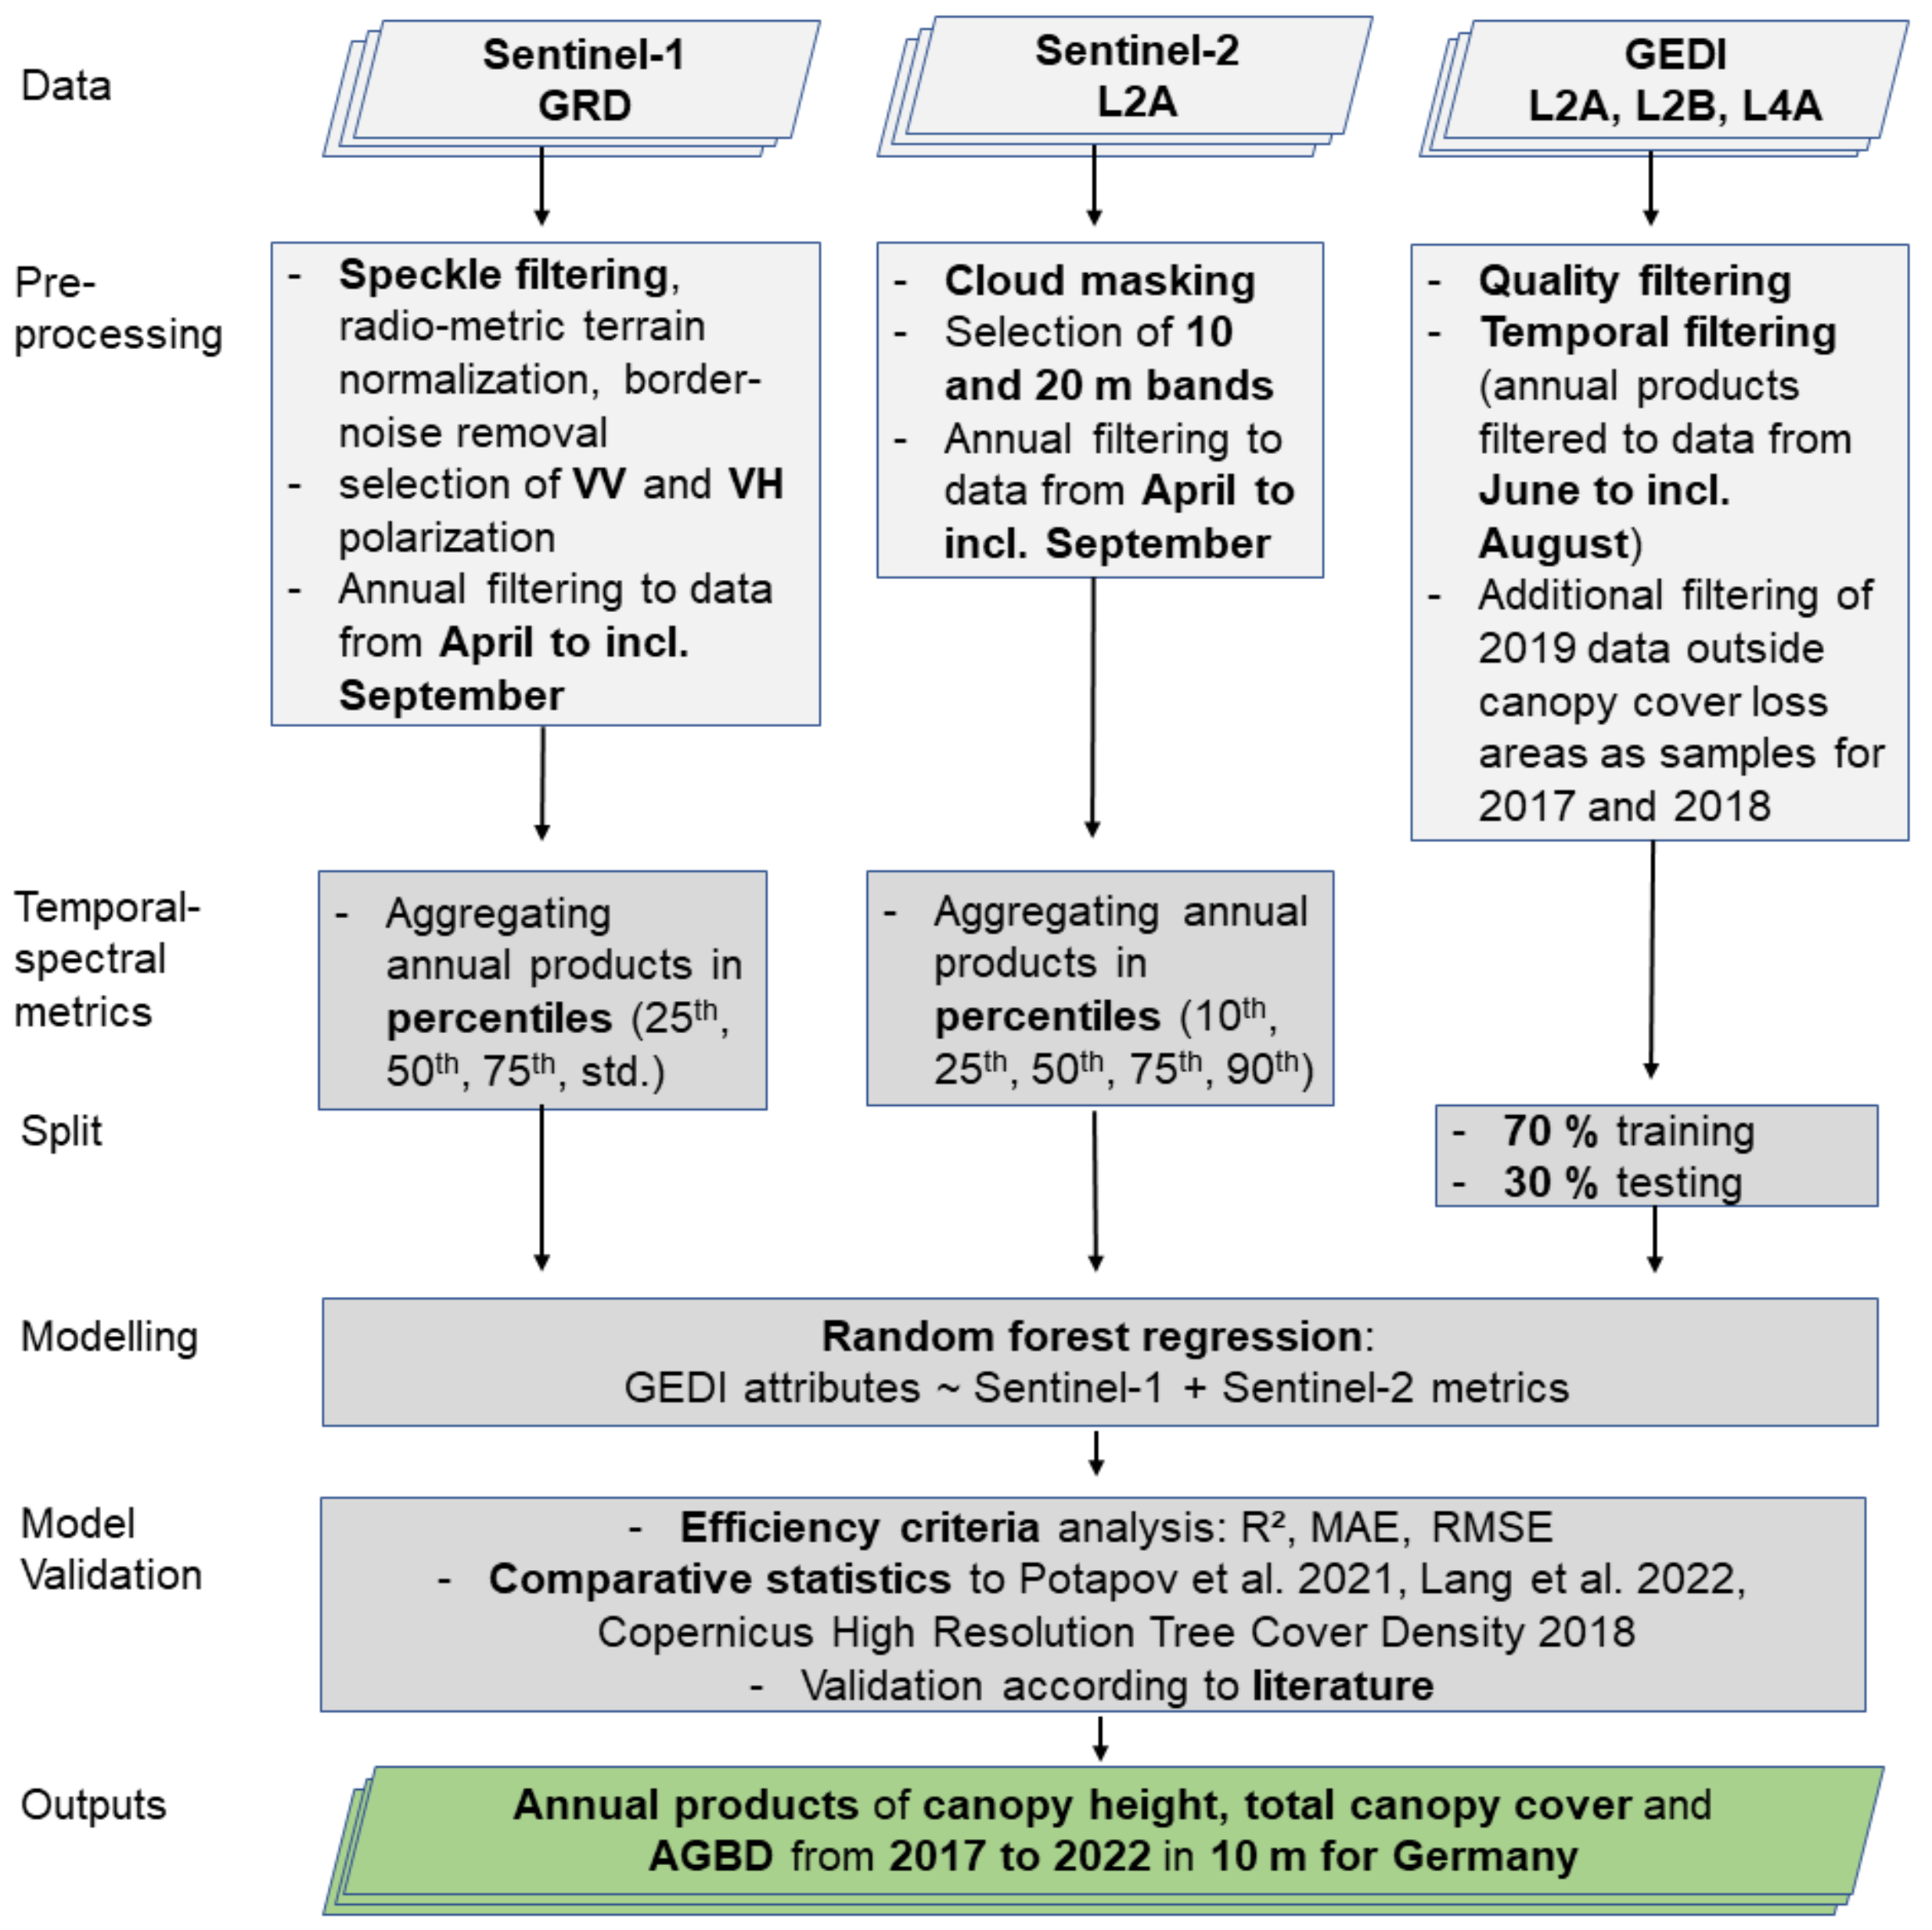
2.1. Data and Pre-Processing
2.2. Forest Structure Modeling Workflow
3. Results
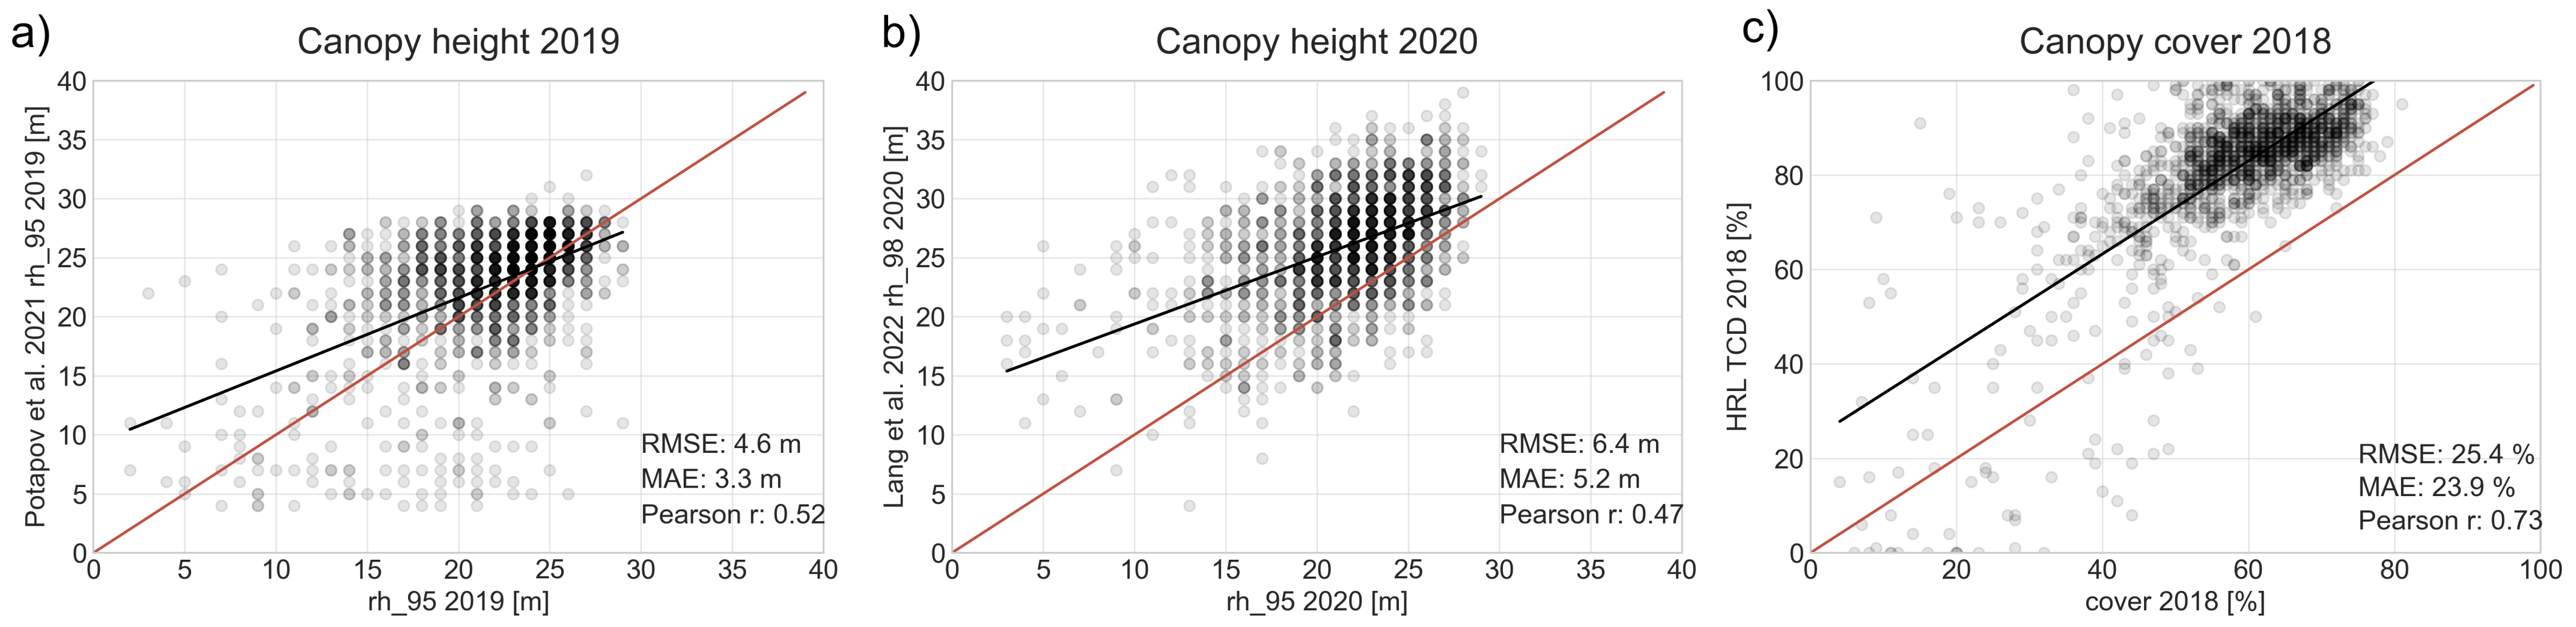
3.1. Model Accuracy
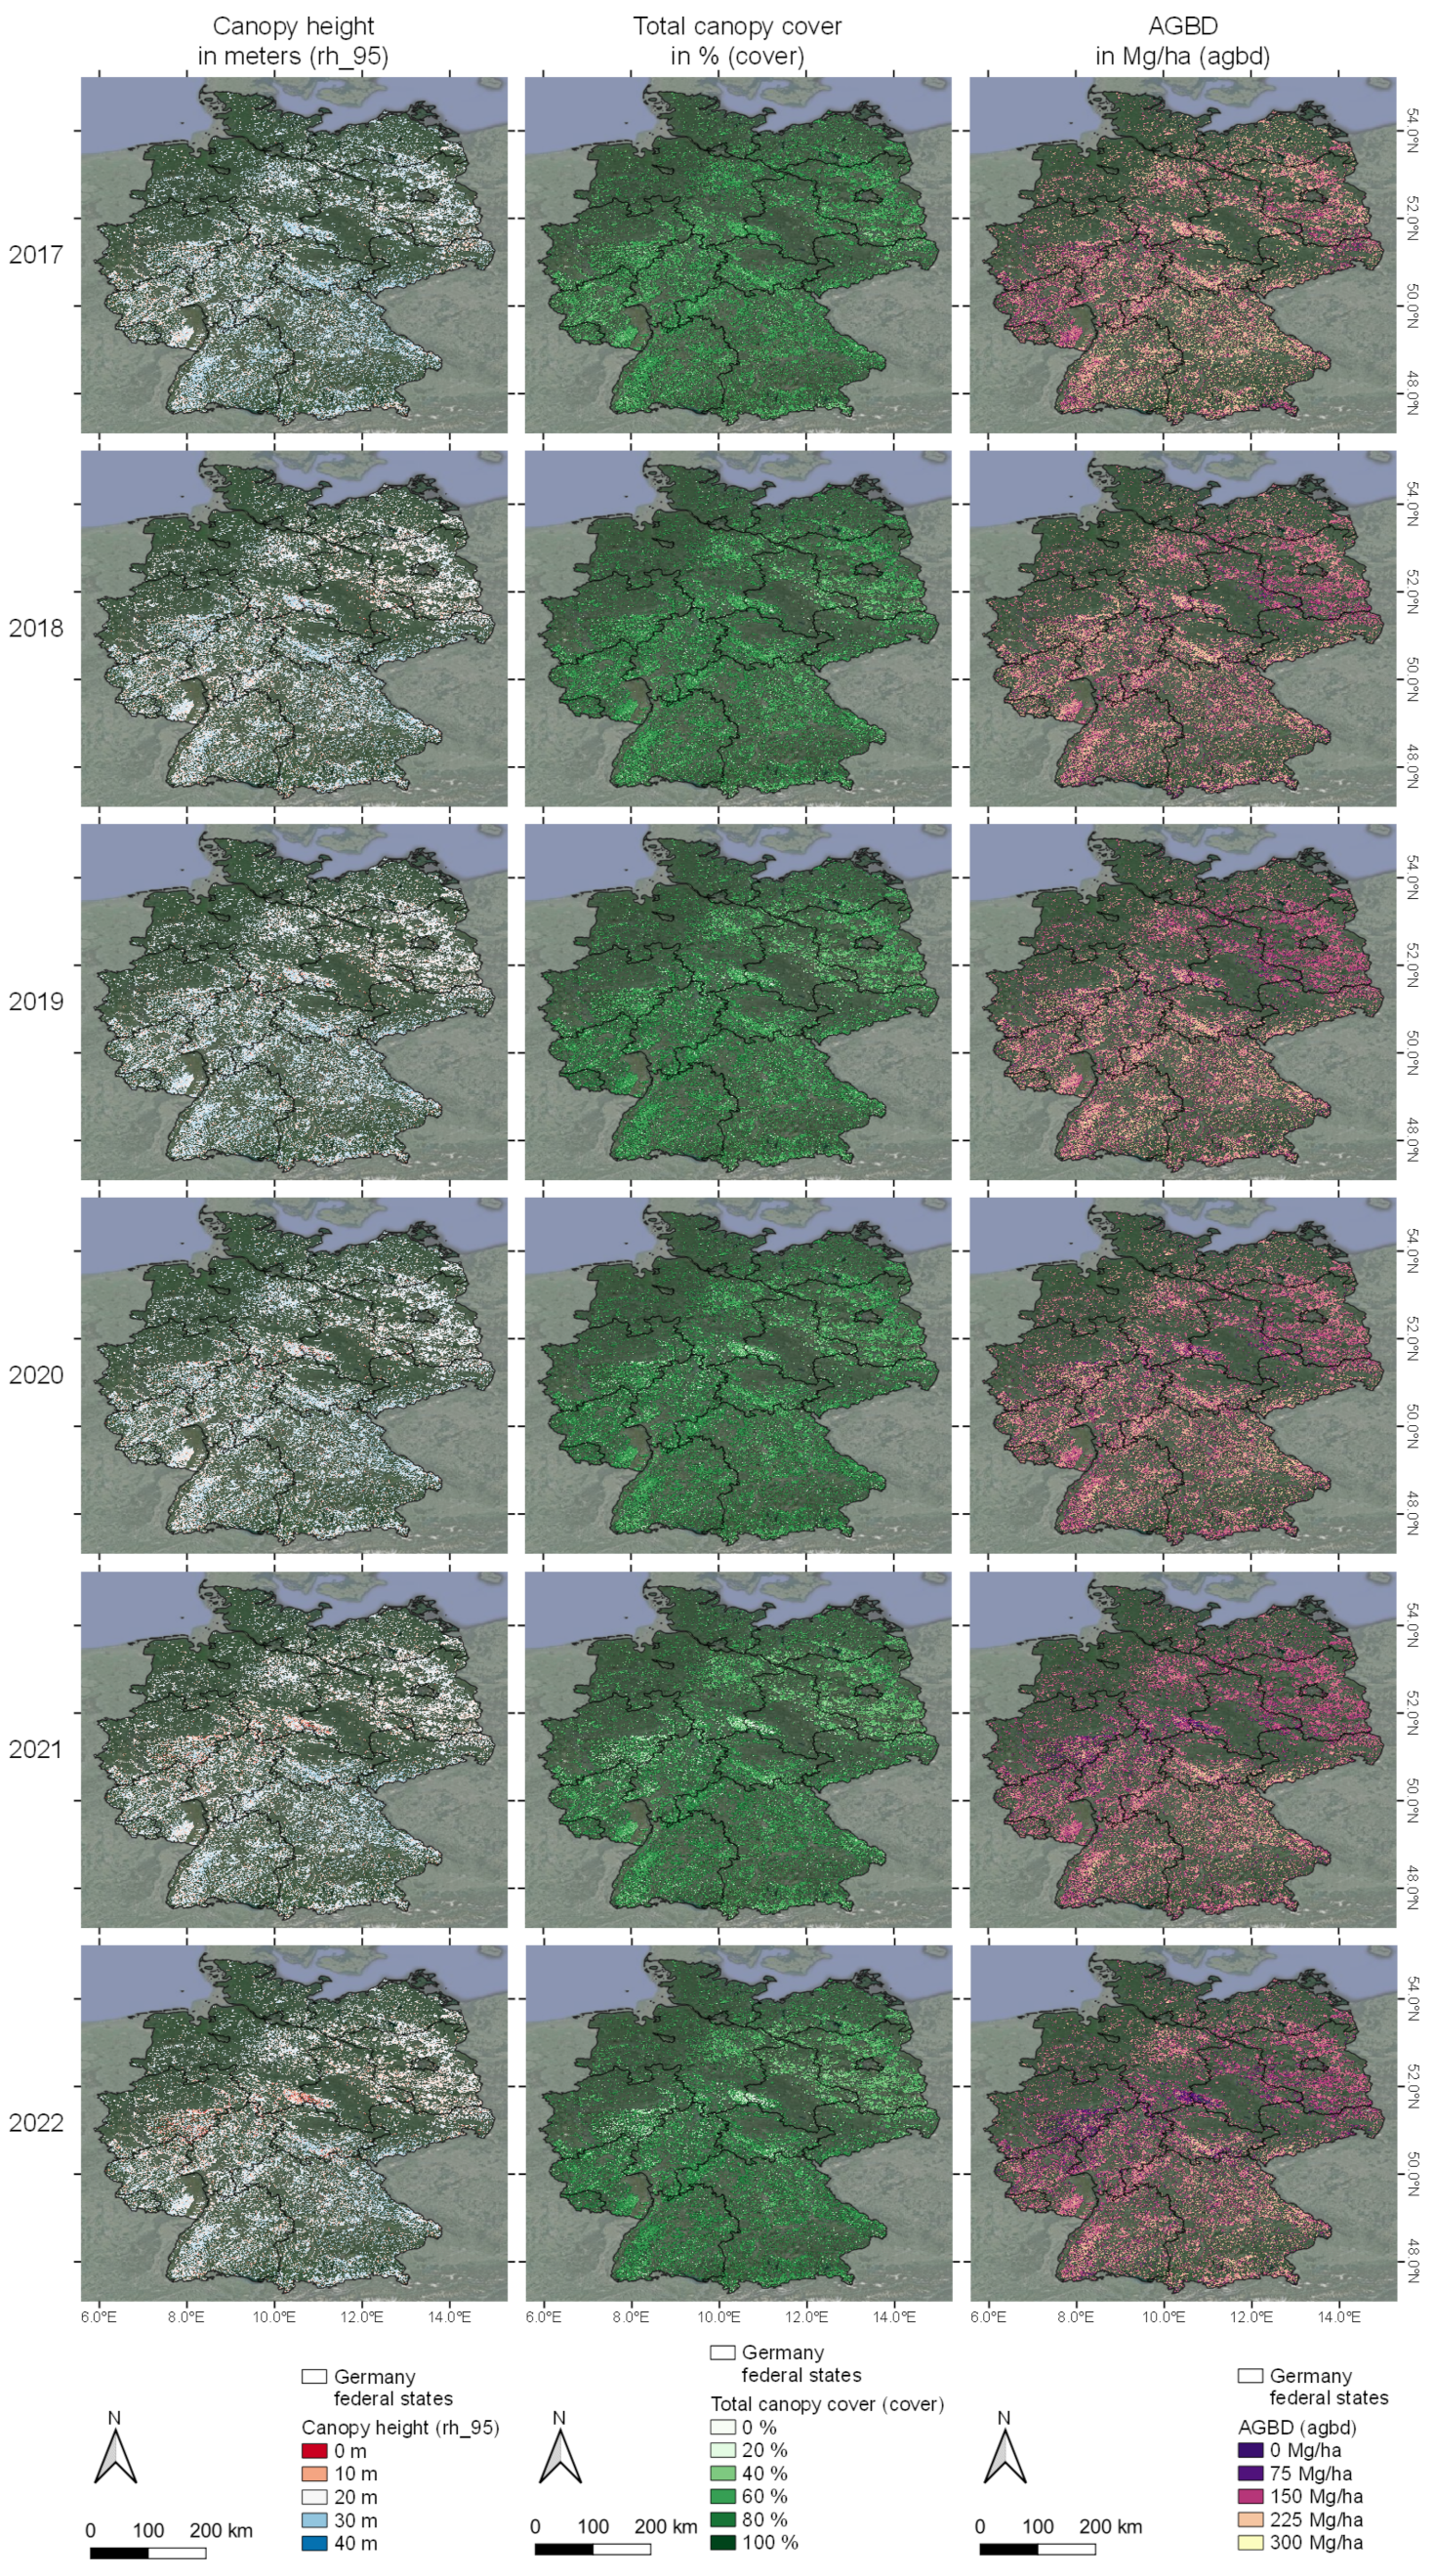
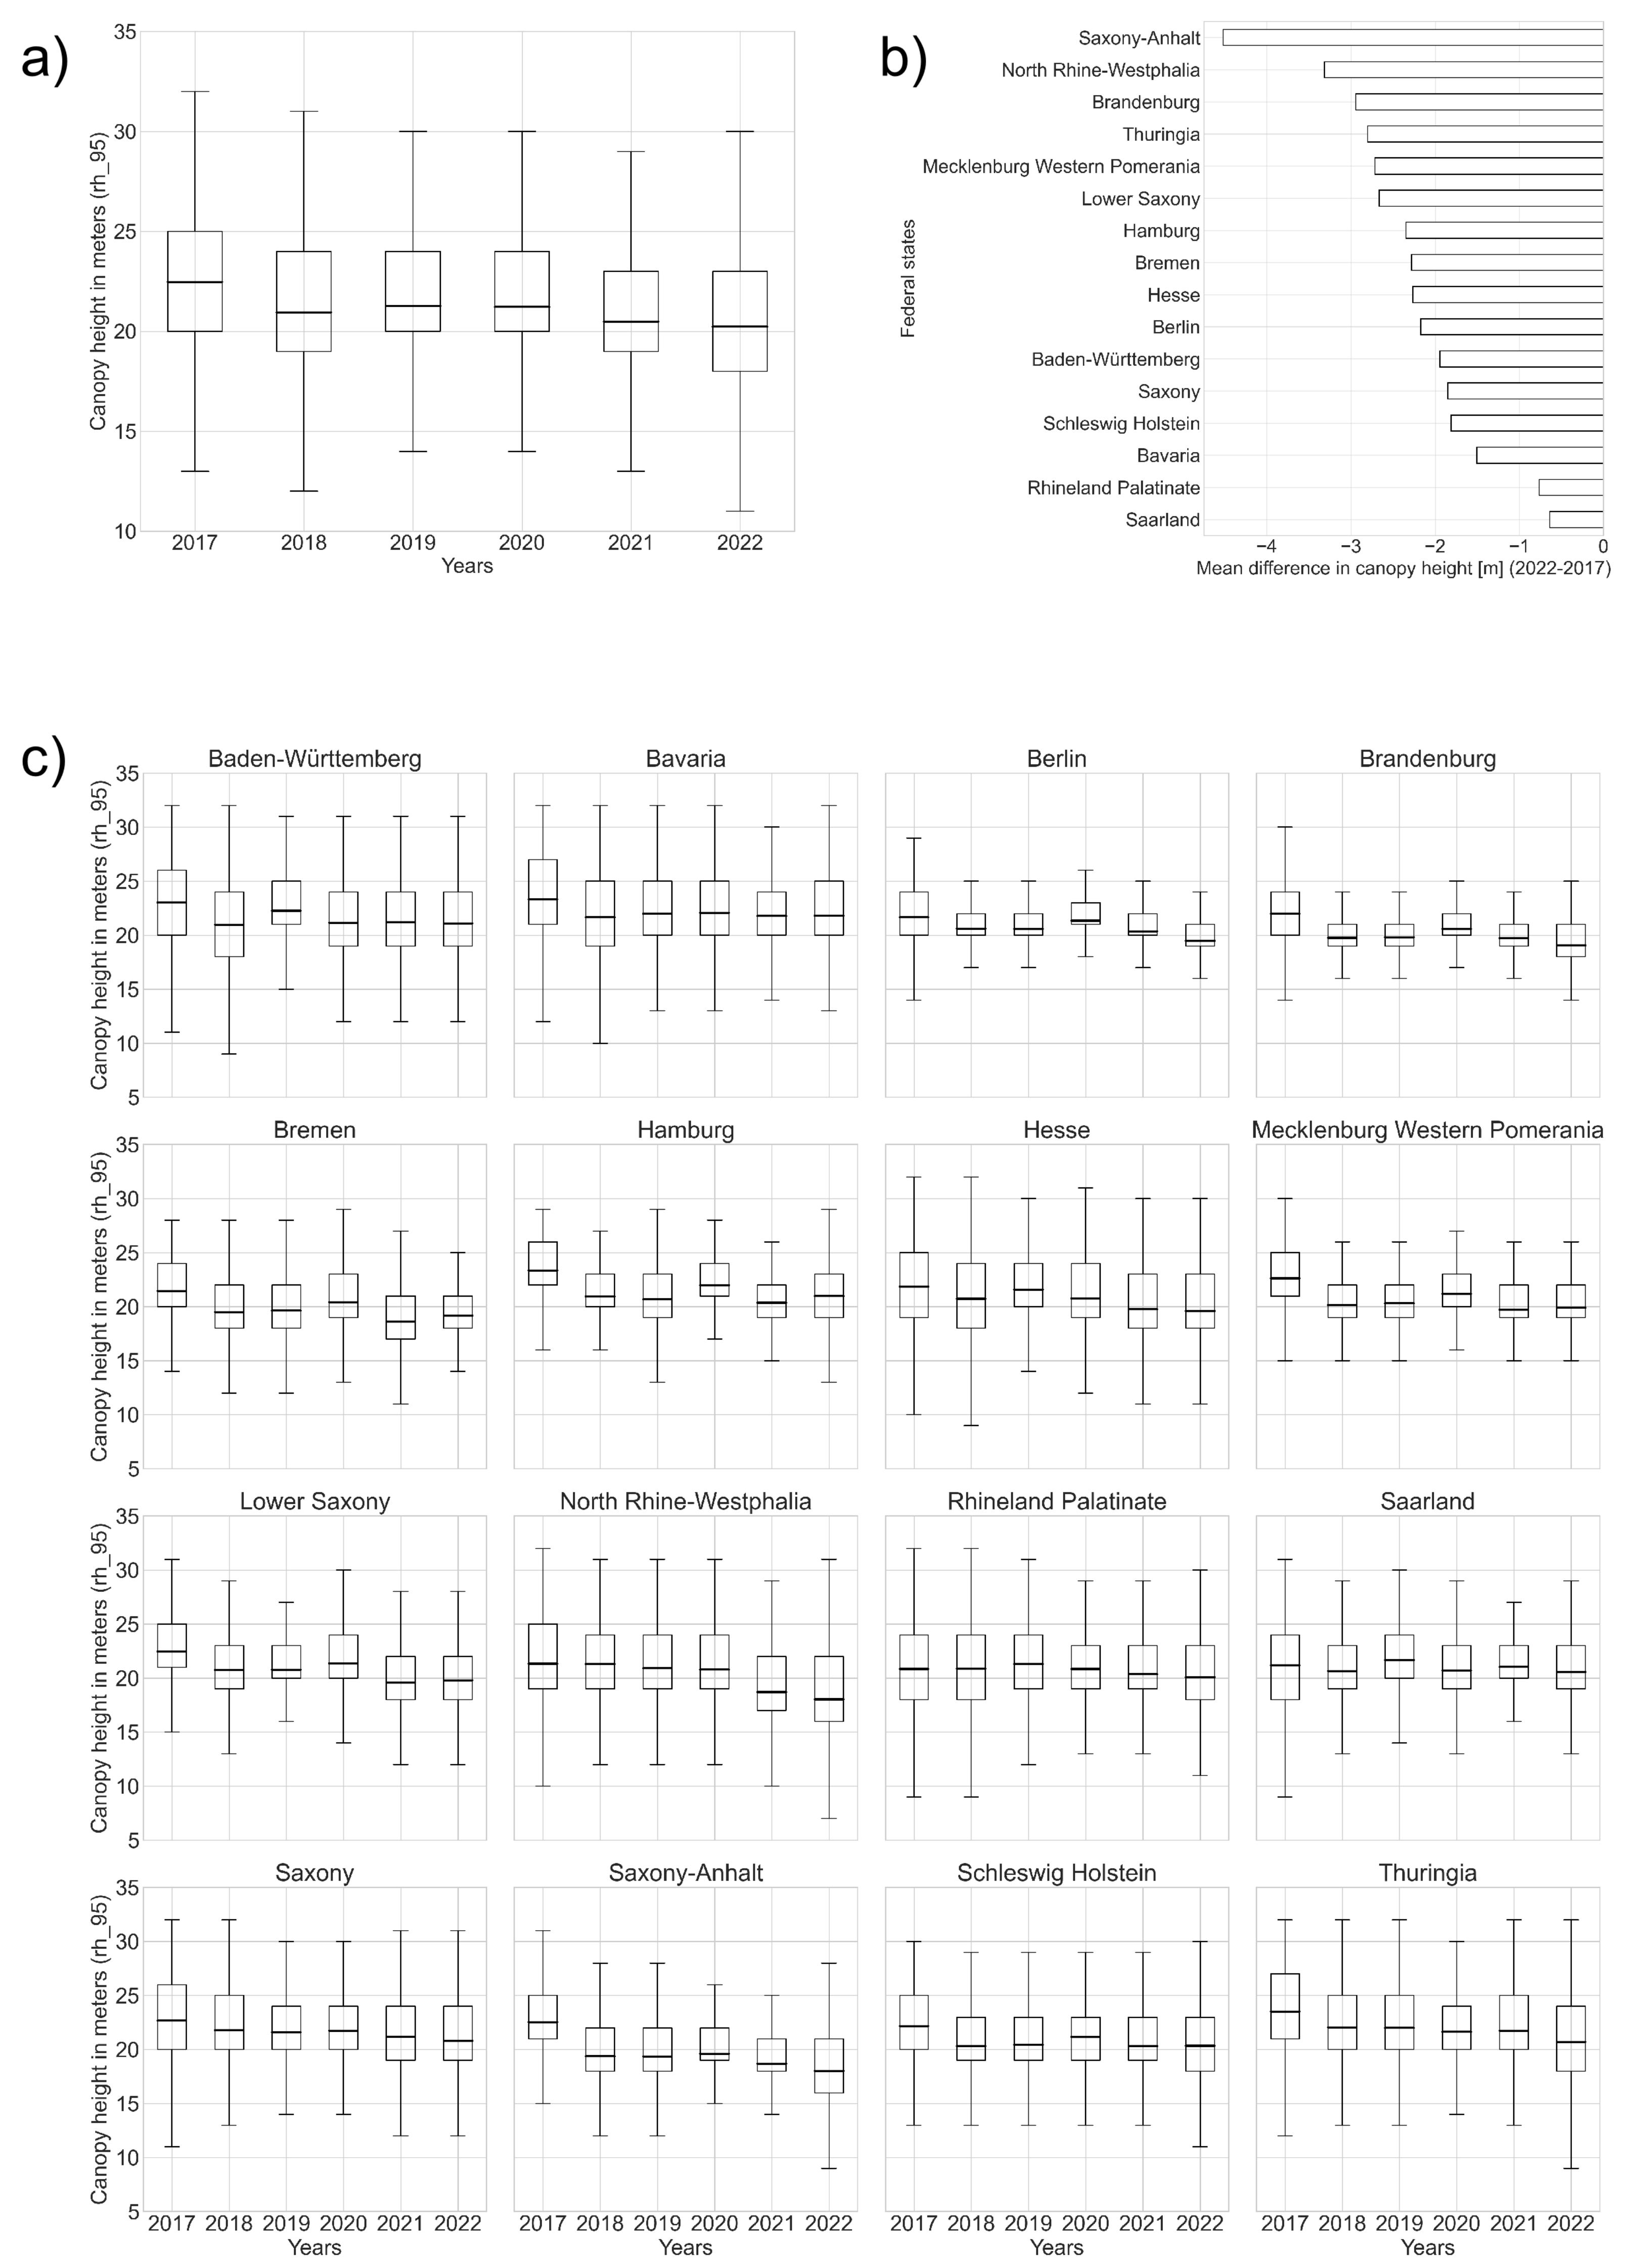
3.2. General Forest Structure Conditions in Germany
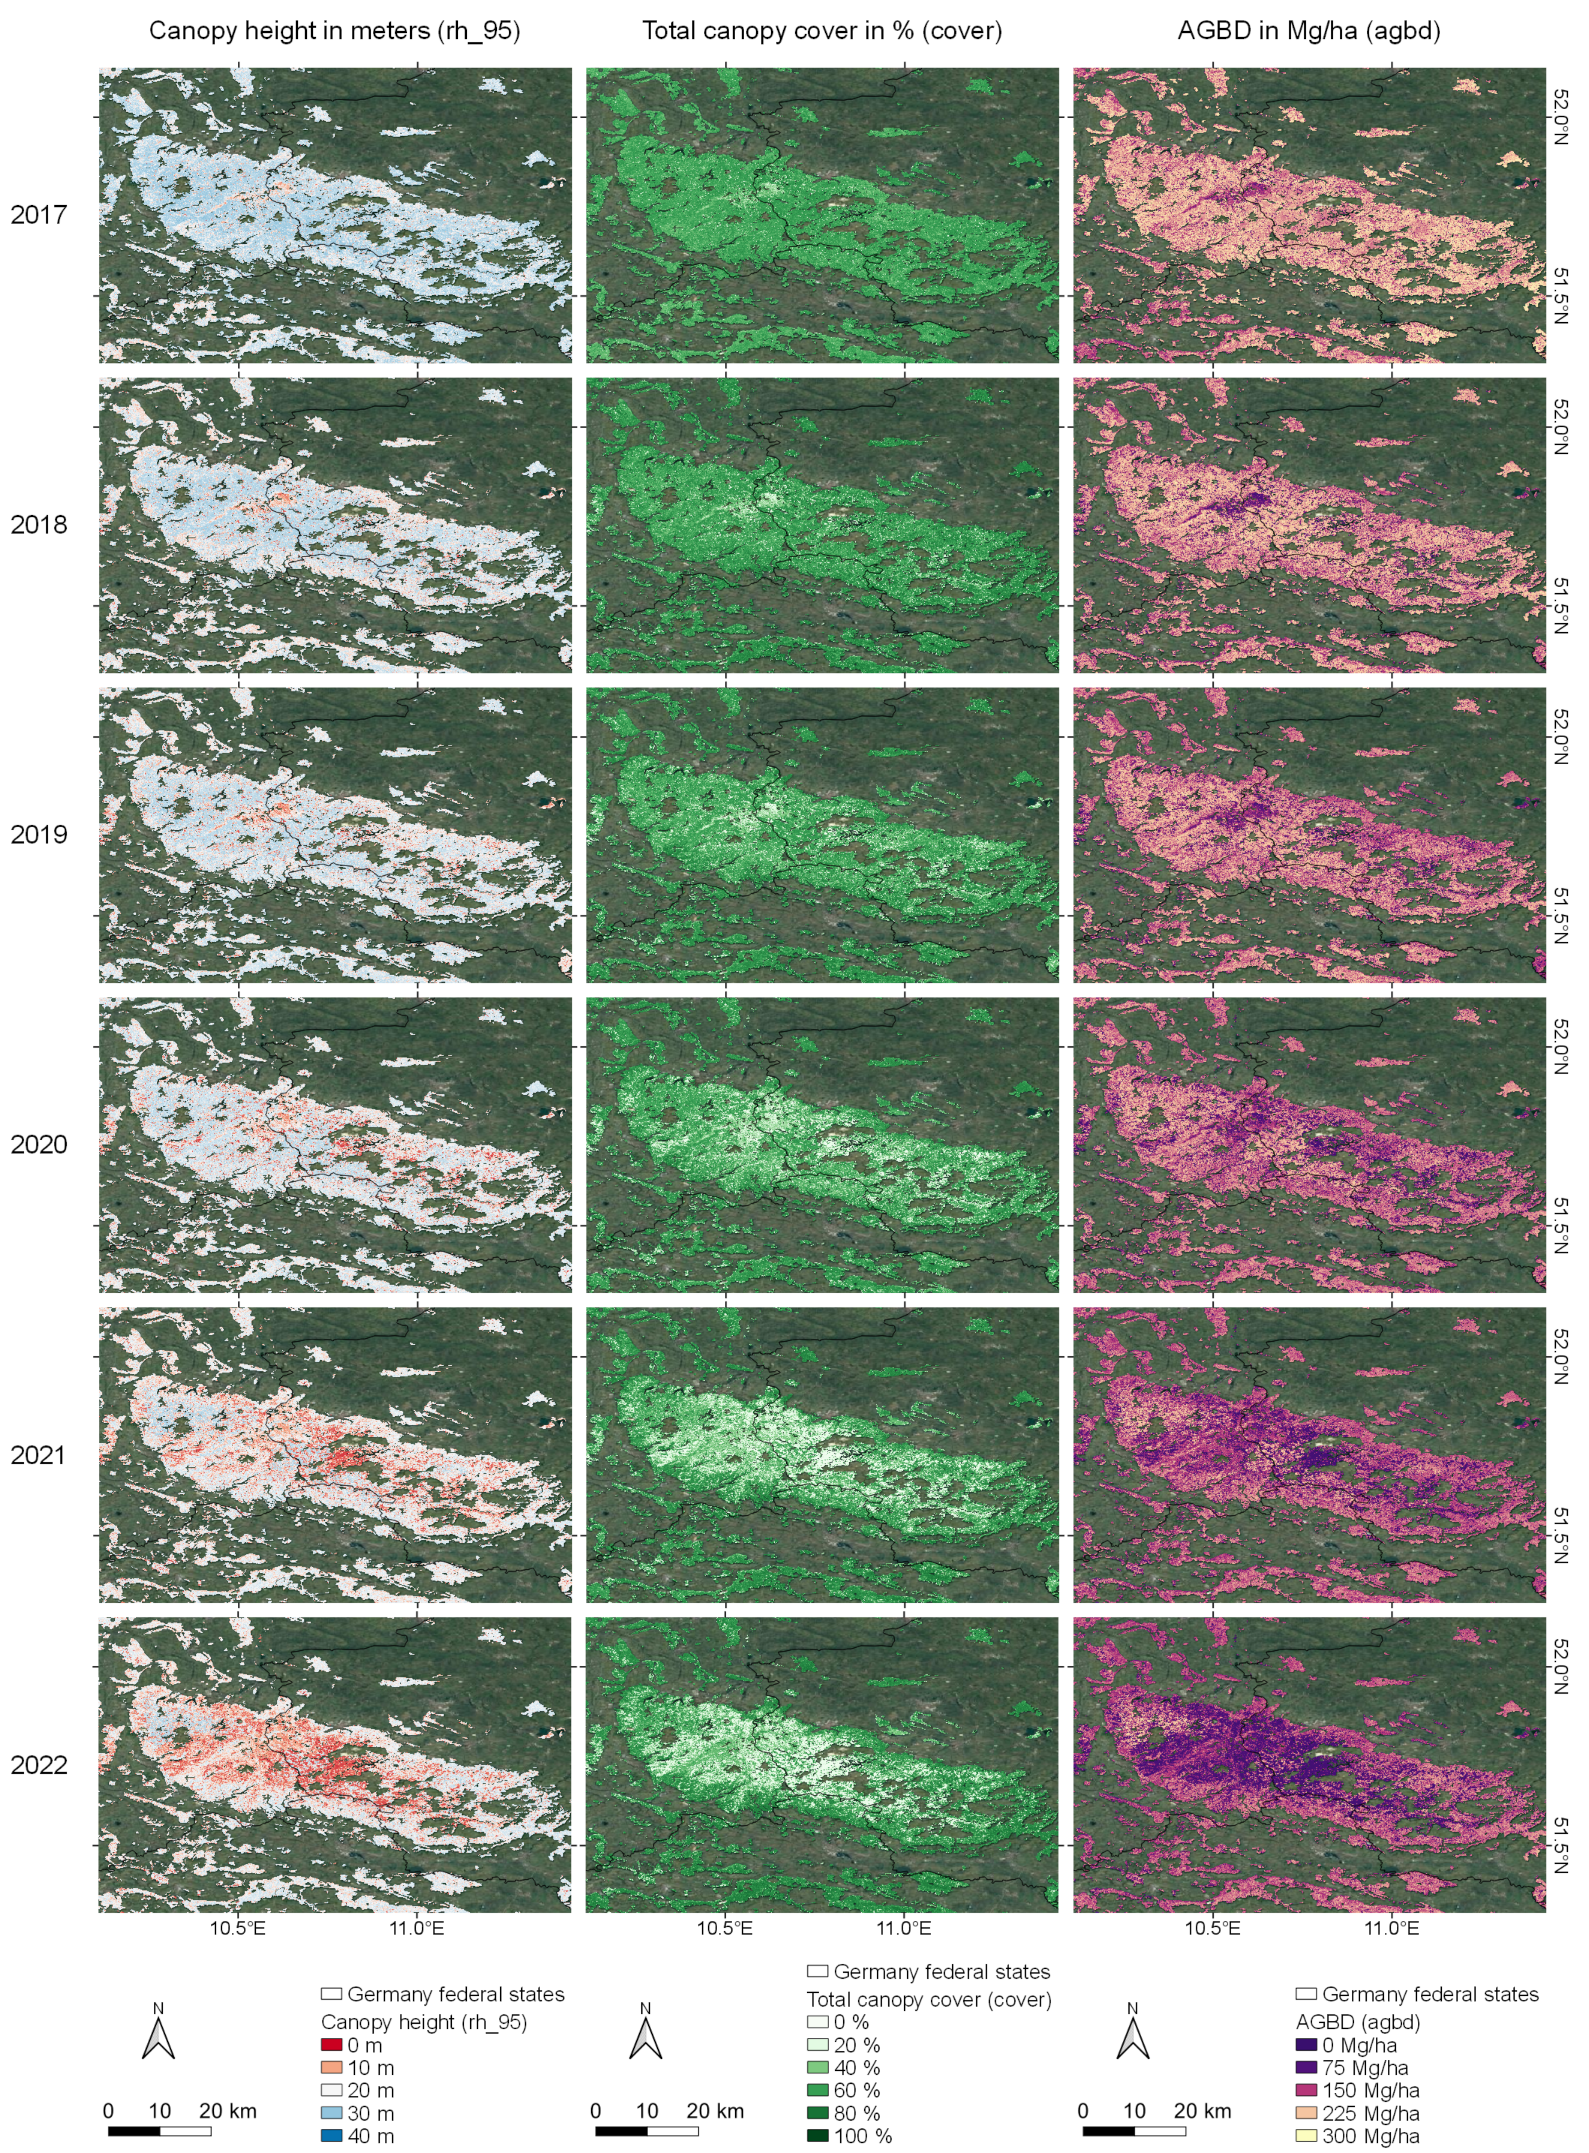
3.3. Exemplary Forest Structure Dynamics
4. Discussion
5. Conclusions
- There is a decline in mean canopy height in Germany from 2017 (about 22.5 m) to 2022 (about 20 m). A growing proportion of low canopy height areas is indicated by the multi-temporal modeling approach: In recent years about 25% of German forest canopy heights are in a range from 11 to 18 m (2022) opposing to a range of 13 to 20 m in 2017. The highest losses in canopy height are occurring in Saxony-Anhalt (mean difference in canopy height comparing 2022 to 2017: −4.8 m) and North Rhine-Westphalia (−3.2 m).
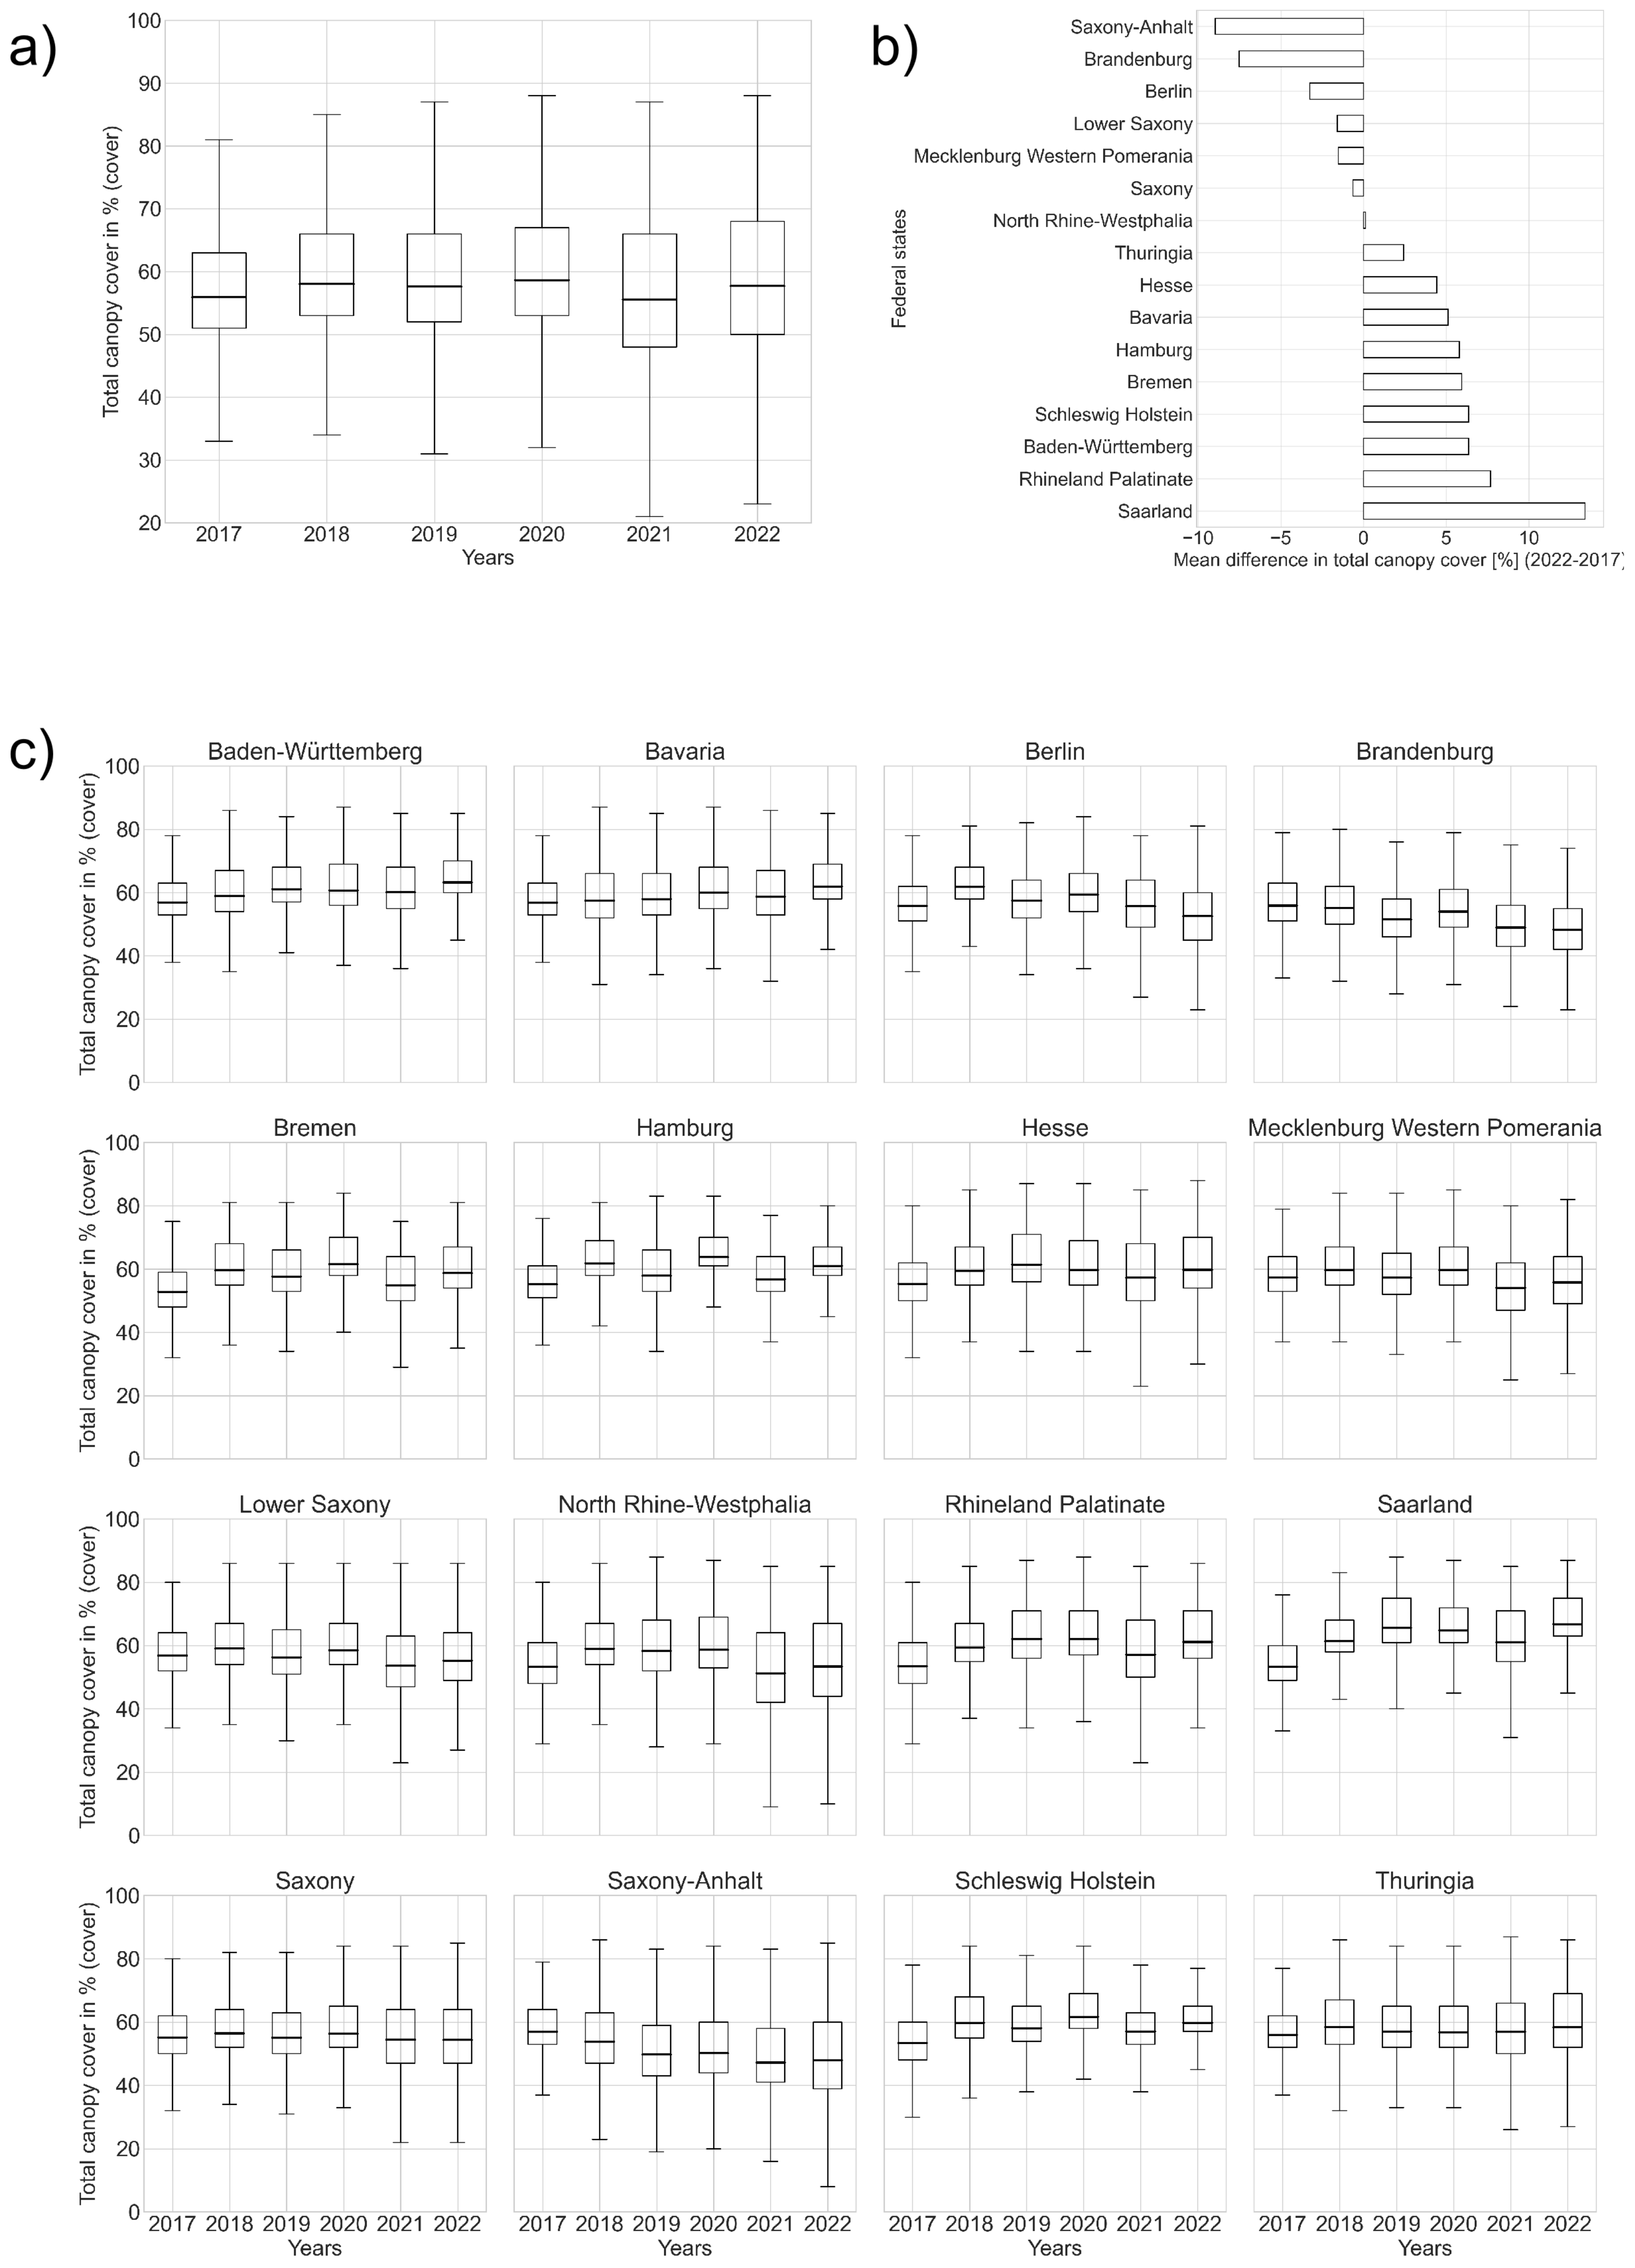
- Mean total canopy cover values at the country level from 2017 to 2022 present rather stable values within a range from 55 to 60%. Nevertheless, a growing number of areas with open canopy covers is quantified by an increased quartile group one spanning from the minimum to the first quartile (about 20 to 50%) in 2021 and 2022 compared to 2017 (about 35 to 50%). Mean difference statistics of total canopy cover highlight strong losses (lower than −5%) in Saxony-Anhalt and Brandenburg opposing to gains in cover density in Rhineland-Palatinate and Saarland (greater than 7%).
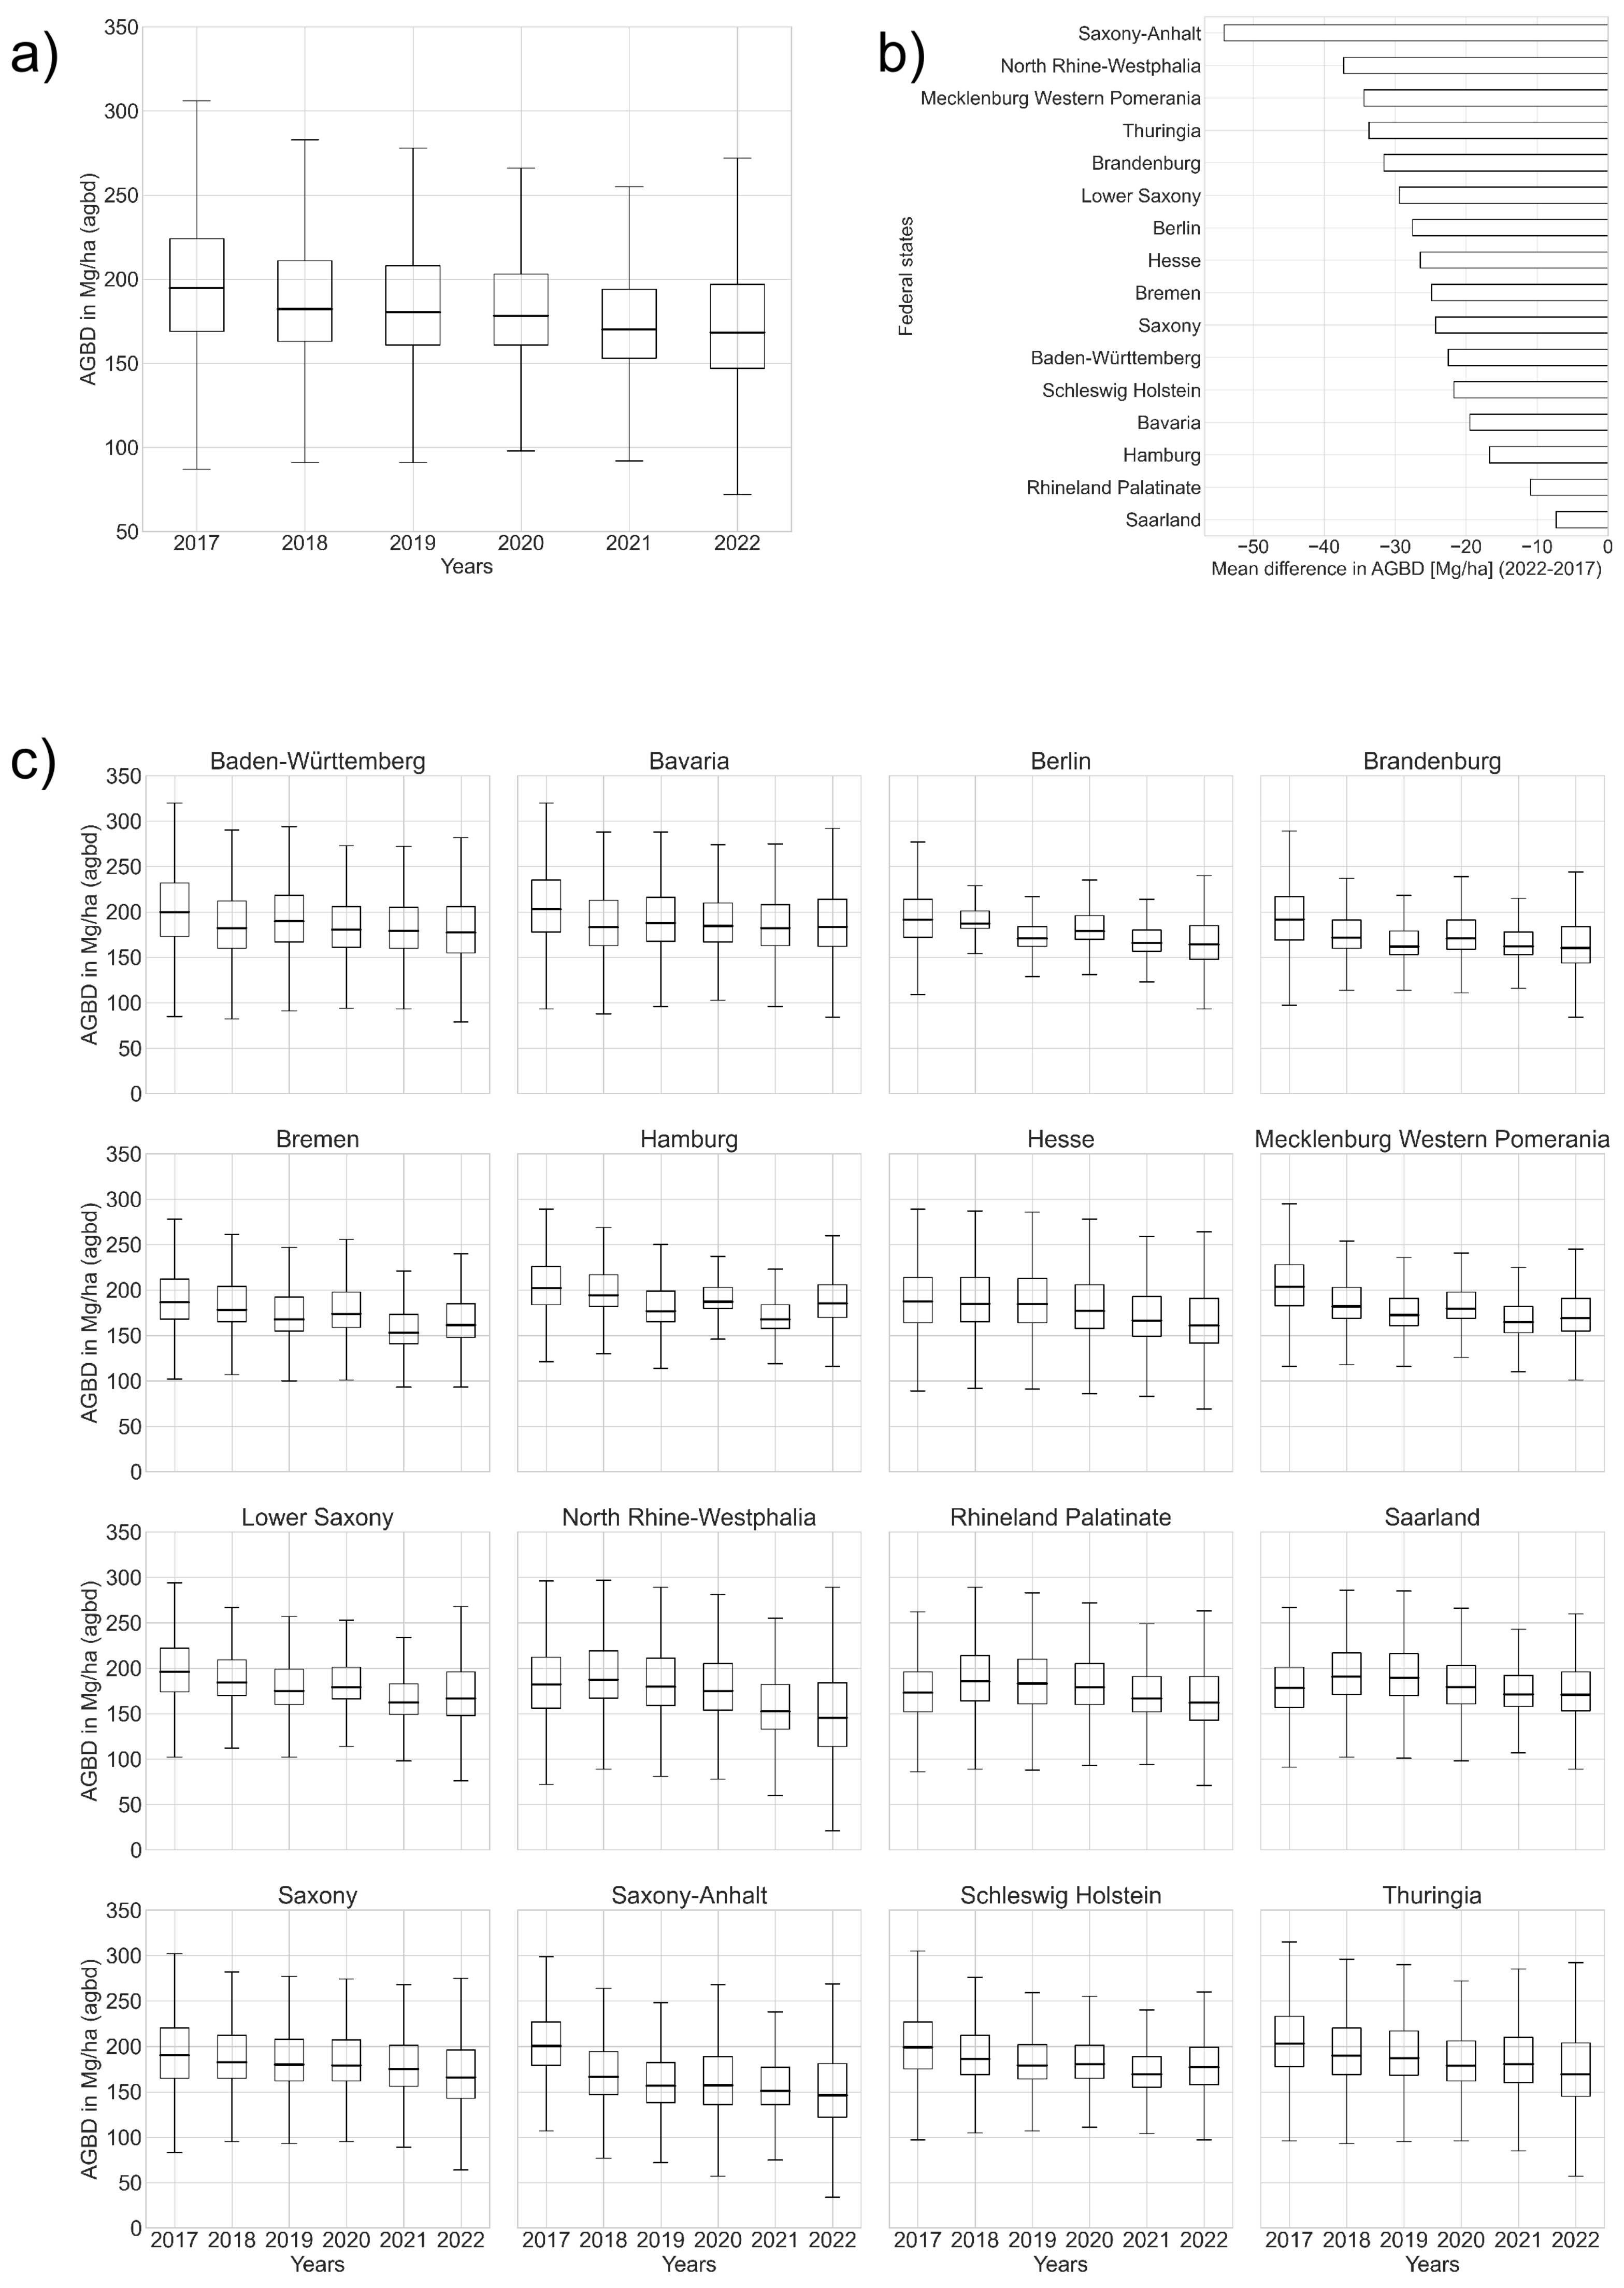
- The quantitative analysis of AGBD presents a steady decline in mean AGBD in Germany from 2017 (about 200 Mg/ha) to 2022 (about 165 Mg/ha). Saxony-Anhalt, North Rhine-Westphalia, Mecklenburg Western Pomerania, Thuringia and Brandenburg are the federal states with strongest losses indicated by a mean difference in AGBD between 2022 and 2017 of lower than −30 Mg/ha.
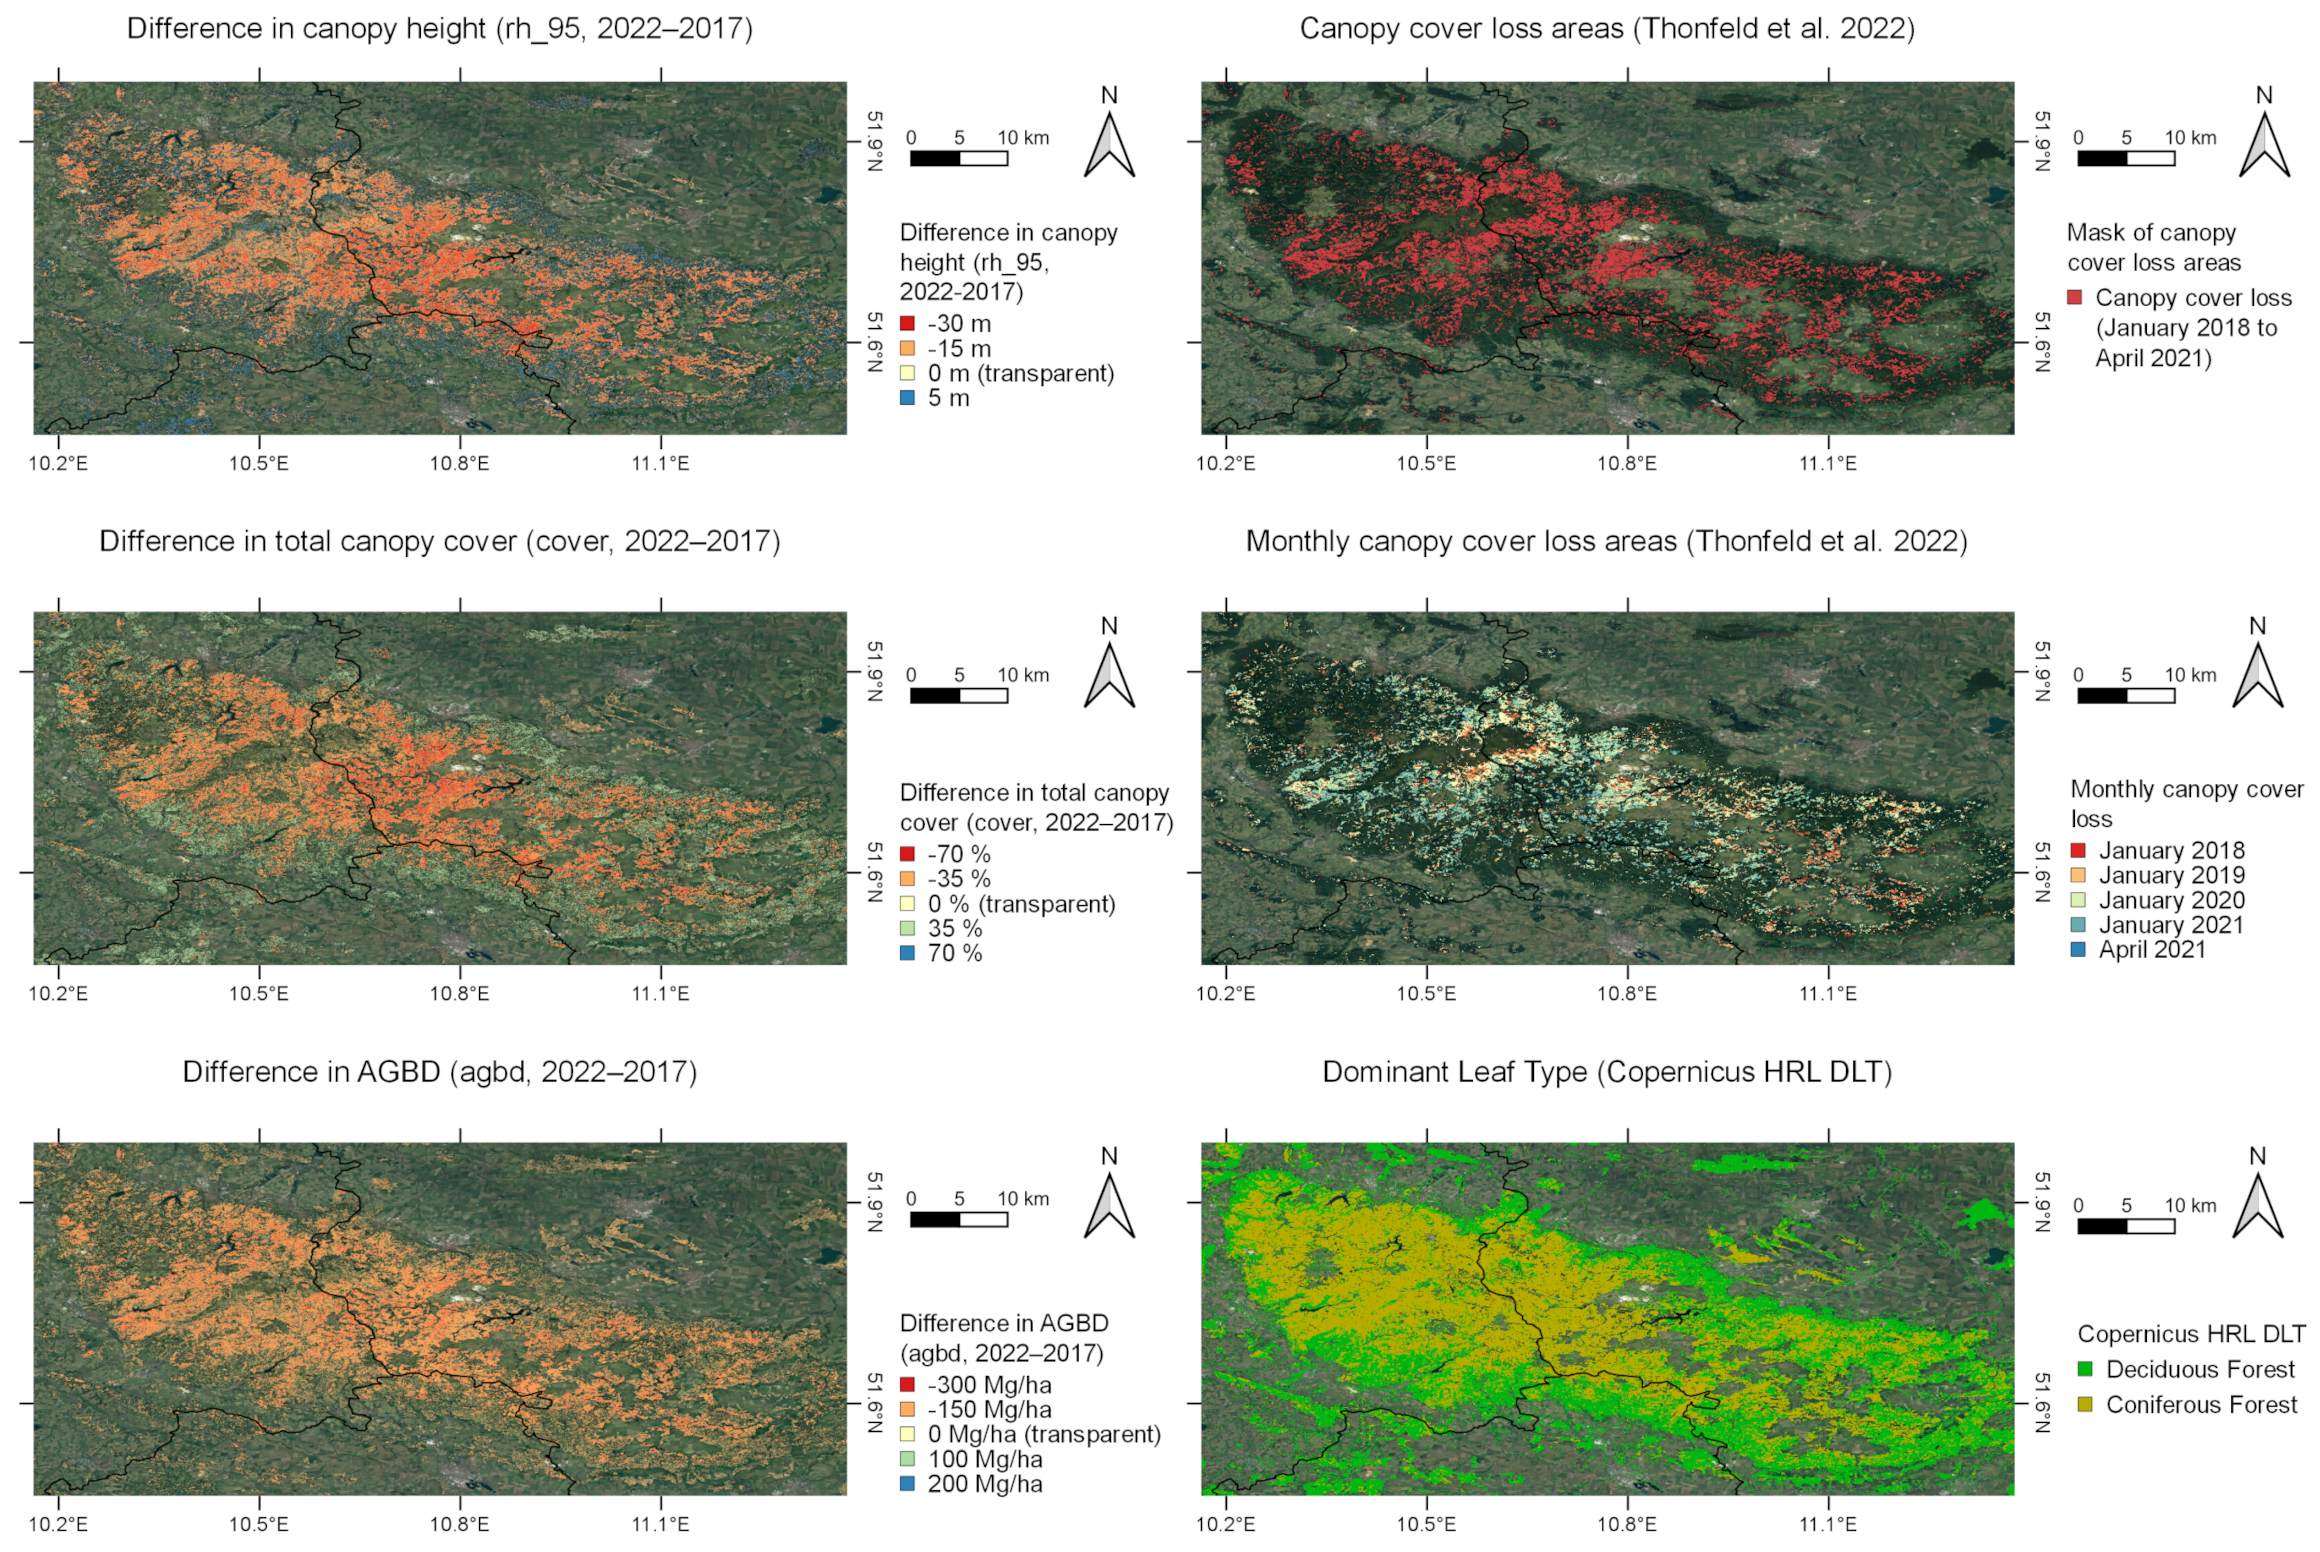
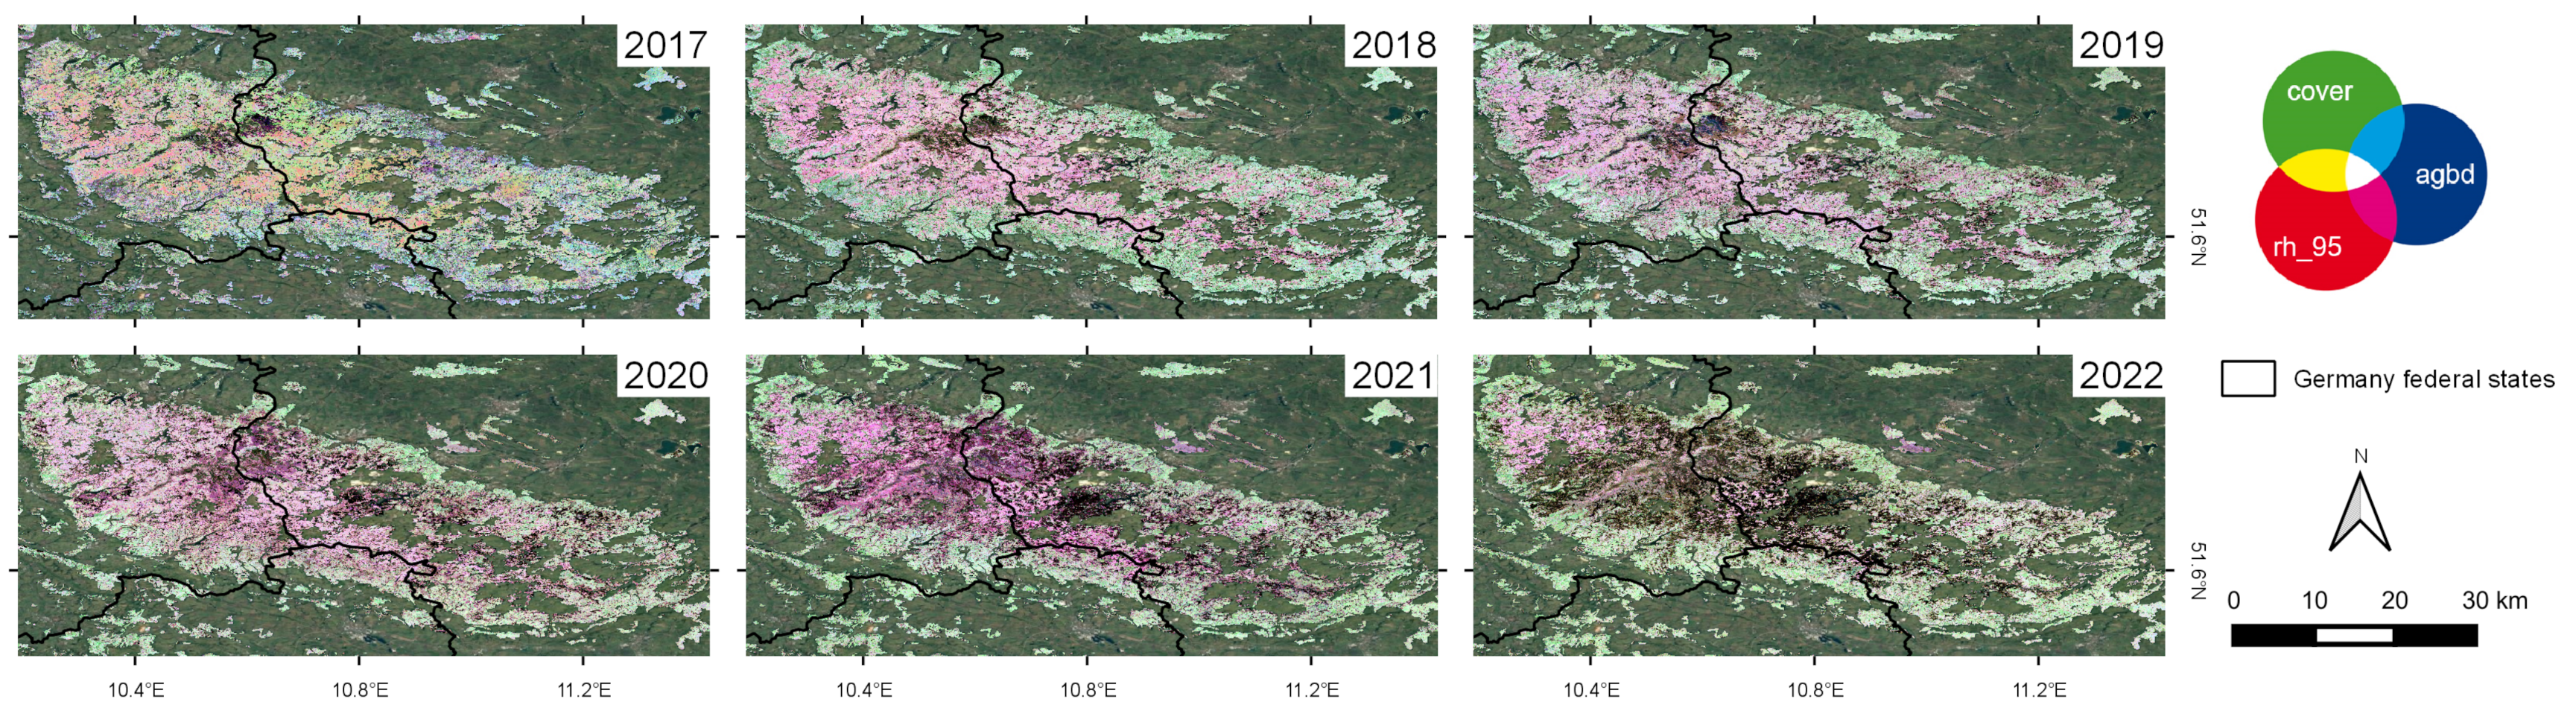
- Difference maps of forest structure for the Harz region highlight the dominance of strong negative changes in coniferous stands which are spatially corresponding to the canopy cover loss areas mapped by Thonfeld et al., 2022 [29]. Furthermore, there are asynchronous temporal dynamics in canopy height, cover density and AGBD for the Harz region enabling a more detailed understanding of post-disturbance conditions.
Author Contributions
Funding
Data Availability Statement
Conflicts of Interest
Appendix A


References
- Buras, A.; Rammig, A.; Zang, C.S. Quantifying impacts of the 2018 drought on European ecosystems in comparison to 2003. Biogeosciences 2020, 17, 1655–1672. [Google Scholar] [CrossRef]
- Rakovec, O.; Samaniego, L.; Hari, V.; Markonis, Y.; Moravec, V.; Thober, S.; Hanel, M.; Kumar, R. The 2018–2020 Multi-year drought sets a new benchmark in Europe. Earth’s Future 2022, 10, e2021EF002394. [Google Scholar] [CrossRef]
- Senf, C.; Buras, A.; Zang, C.S.; Rammig, A.; Seidl, R. Excess forest mortality is consistently linked to drought across Europe. Nat. Commun. 2020, 11, 6200. [Google Scholar] [CrossRef]
- Schuldt, B.; Buras, A.; Arend, M.; Vitasse, Y.; Beierkuhnlein, C.; Damm, A.; Gharun, M.; Grams, T.E.; Hauck, M.; Hajek, P.; et al. A first assessment of the impact of the extreme 2018 summer drought on Central European forests. Basic Appl. Ecol. 2020, 45, 86–103. [Google Scholar] [CrossRef]
- Statistical office of the European Union (Eurostat). Share of Timber Removals to Net Increment in EU Forests. 2020. Available online: https://ec.europa.eu/eurostat/statistics-explained/index.php?title=File:Figure_3_Share_of_timber_removals_to_net_increment_in_EU_forests,_2020_(%25).png (accessed on 26 January 2023).
- Federal Ministry of Food and Agriculture (BMEL). Waldbericht der Bundesregierung 2021. Available online: https://www.bmel.de/SharedDocs/Downloads/DE/Broschueren/waldbericht2021.pdf?__blob=publicationFile&v=11 (accessed on 25 January 2023).
- Statistisches Bundesamt (Destatis). Flächengröße des Waldes nach Bundesländern. Available online: https://www.destatis.de/DE/Themen/Branchen-Unternehmen/Landwirtschaft-Forstwirtschaft-Fischerei/Wald-Holz/Tabellen/waldflaeche-bundeslaender.html (accessed on 25 January 2023).
- Statistisches Bundesamt (Destatis). Structural Survey of Forestry Holdings: Forest Area by Types of Forest Ownership. Available online: https://www.destatis.de/EN/Themes/Economic-Sectors-Enterprises/Agriculture-Forestry-Fisheries/Forestry-Wood/Tables/structural-survey-of-forestry-holdings-forest-area-by-types-of-forest-ownership.html (accessed on 25 January 2023).
- Statistical office of the European Union (Eurostat). Employment in Forestry and Logging, 2000 and 2020. Available online: https://ec.europa.eu/eurostat/statistics-explained/index.php?title=File:Table_2_Employment_in_forestry_and_logging,_2000_and_2020.png (accessed on 26 January 2023).
- Statistisches Bundesamt (Destatis). Exports of Raw Timber up 42.6% in 2020. Available online: https://www.destatis.de/EN/Press/2021/05/PE21_N031_51.html (accessed on 25 January 2023).
- Statistisches Bundesamt (Destatis). 2008 to 2018: Sawmills Increase Their Turnover and Now Earn One in Three Euros Abroad. Available online: https://www.destatis.de/EN/Press/2019/09/PE19_377_412.html (accessed on 25 January 2023).
- European Environment Agency. Dominant Leaf Type 2018. 2020. Available online: https://land.copernicus.eu/pan-european/high-resolution-layers/forests/dominant-leaf-type/status-maps/dominant-leaf-type-2018 (accessed on 3 February 2023).
- Johann Heinrich von Thünen Institute (Federal Research Institute for Rural Areas, Forestry and Fisheries)—Institute of Forest Ecosystems. Ergebnisse der Bundesweiten Waldzustandserhebung. Available online: https://wo-apps.thuenen.de/apps/wze/ (accessed on 12 January 2023).
- Statistisches Bundesamt (Destatis). Impact of Extreme wind and Weather Conditions on the Forests. Available online: https://www.destatis.de/EN/Press/2020/02/PE20_N006_413.html (accessed on 25 January 2023).
- Statistisches Bundesamt (Destatis). Forest Damage: Logging of Timber Damaged by Insect Infestation Grew More than Tenfold within Five Years. Available online: https://www.destatis.de/EN/Press/2021/08/PE21_N050_41.html (accessed on 25 January 2023).
- Statistisches Bundesamt (Destatis). Total Timber Cutting by Cutting Cause and Forest Ownership Types. Available online: https://www.destatis.de/EN/Themes/Economic-Sectors-Enterprises/Agriculture-Forestry-Fisheries/Forestry-Wood/Tables/timber-cutting-causes.html (accessed on 25 January 2023).
- Federal Ministry of Food and Agriculture (BMEL). Ergebnisse der Waldzustandserhebung 2021. Available online: https://www.bmel.de/SharedDocs/Downloads/DE/Broschueren/ergebnisse-waldzustandserhebung-2021.pdf?__blob=publicationFile&v=10 (accessed on 25 January 2023).
- Thorn, S.; Bässler, C.; Brandl, R.; Burton, P.J.; Cahall, R.; Campbell, J.L.; Castro, J.; Choi, C.Y.; Cobb, T.; Donato, D.C.; et al. Impacts of salvage logging on biodiversity: A meta-analysis. J. Appl. Ecol. 2018, 55, 279–289. [Google Scholar] [CrossRef]
- Holzwarth, S.; Thonfeld, F.; Abdullahi, S.; Asam, S.; Da Ponte Canova, E.; Gessner, U.; Huth, J.; Kraus, T.; Leutner, B.; Kuenzer, C. Earth observation based monitoring of forests in germany: A review. Remote Sens. 2020, 12, 3570. [Google Scholar] [CrossRef]
- Wellbrock, N.; Bolte, A. Status and Dynamics of Forests in Germany: Results of the National Forest Monitoring; Springer: Berlin/Heidelberg, Germany, 2019. [Google Scholar]
- Jetz, W.; Cavender-Bares, J.; Pavlick, R.; Schimel, D.; Davis, F.W.; Asner, G.P.; Guralnick, R.; Kattge, J.; Latimer, A.M.; Moorcroft, P.; et al. Monitoring plant functional diversity from space. Nat. Plants 2016, 2, 1–5. [Google Scholar]
- Randin, C.F.; Ashcroft, M.B.; Bolliger, J.; Cavender-Bares, J.; Coops, N.C.; Dullinger, S.; Dirnböck, T.; Eckert, S.; Ellis, E.; Fernández, N.; et al. Monitoring biodiversity in the Anthropocene using remote sensing in species distribution models. Remote Sens. Environ. 2020, 239, 111626. [Google Scholar] [CrossRef]
- Hansen, M.C.; Potapov, P.V.; Moore, R.; Hancher, M.; Turubanova, S.A.; Tyukavina, A.; Thau, D.; Stehman, S.V.; Goetz, S.J.; Loveland, T.R.; et al. High-Resolution Global Maps of 21st-Century Forest Cover Change. Science 2013, 342, 850–853. [Google Scholar] [CrossRef] [PubMed]
- Hansen, M.; Egorov, A.; Potapov, P.; Stehman, S.; Tyukavina, A.; Turubanova, S.; Roy, D.; Goetz, S.; Loveland, T.; Ju, J.; et al. Monitoring conterminous United States (CONUS) land cover change with Web-Enabled Landsat Data (WELD). Remote Sens. Environ. 2014, 140, 466–484. [Google Scholar] [CrossRef]
- Montzka, C.; Bayat, B.; Tewes, A.; Mengen, D.; Vereecken, H. Sentinel-2 analysis of spruce crown transparency levels and their environmental drivers after summer drought in the Northern Eifel (Germany). Front. For. Glob. Chang. 2021, 4, 667151. [Google Scholar] [CrossRef]
- Philipp, M.; Wegmann, M.; Kübert-Flock, C. Quantifying the response of German forests to drought events via Satellite imagery. Remote Sens. 2021, 13, 1845. [Google Scholar] [CrossRef]
- European Environment Agency. Forest Type 2015; European Environment Agency: Copenhagen, Denmark, 2017.
- European Environment Agency. Tree Cover Density 2018; European Environment Agency: Copenhagen, Denmark, 2020.
- Thonfeld, F.; Gessner, U.; Holzwarth, S.; Kriese, J.; Da Ponte, E.; Huth, J.; Kuenzer, C. A First Assessment of Canopy Cover Loss in Germany’s Forests after the 2018–2020 Drought Years. Remote Sens. 2022, 14, 562. [Google Scholar] [CrossRef]
- Welle, T.; Aschenbrenner, L.; Kuonath, K.; Kirmaier, S.; Franke, J. Mapping Dominant Tree Species of German Forests. Remote Sens. 2022, 14, 3330. [Google Scholar] [CrossRef]
- Bruening, J.M.; Fischer, R.; Bohn, F.J.; Armston, J.; Armstrong, A.H.; Knapp, N.; Tang, H.; Huth, A.; Dubayah, R. Challenges to aboveground biomass prediction from waveform lidar. Environ. Res. Lett. 2021, 16, 125013. [Google Scholar] [CrossRef]
- Fischer, R.; Knapp, N.; Bohn, F.; Shugart, H.H.; Huth, A. The relevance of forest structure for biomass and productivity in temperate forests: New perspectives for remote sensing. Surv. Geophys. 2019, 40, 709–734. [Google Scholar] [CrossRef]
- Marselis, S.M.; Abernethy, K.; Alonso, A.; Armston, J.; Baker, T.R.; Bastin, J.F.; Bogaert, J.; Boyd, D.S.; Boeckx, P.; Burslem, D.F.; et al. Evaluating the potential of full-waveform lidar for mapping pan-tropical tree species richness. Glob. Ecol. Biogeogr. 2020, 29, 1799–1816. [Google Scholar] [CrossRef]
- Marselis, S.M.; Keil, P.; Chase, J.M.; Dubayah, R. The use of GEDI canopy structure for explaining variation in tree species richness in natural forests. Environ. Res. Lett. 2022, 17, 045003. [Google Scholar] [CrossRef]
- Schneider, F.D.; Ferraz, A.; Hancock, S.; Duncanson, L.I.; Dubayah, R.O.; Pavlick, R.P.; Schimel, D.S. Towards mapping the diversity of canopy structure from space with GEDI. Environ. Res. Lett. 2020, 15, 115006. [Google Scholar] [CrossRef]
- Potapov, P.; Li, X.; Hernandez-Serna, A.; Tyukavina, A.; Hansen, M.C.; Kommareddy, A.; Pickens, A.; Turubanova, S.; Tang, H.; Silva, C.E.; et al. Mapping global forest canopy height through integration of GEDI and Landsat data. Remote Sens. Environ. 2021, 253, 112165. [Google Scholar] [CrossRef]
- Lang, N.; Kalischek, N.; Armston, J.; Schindler, K.; Dubayah, R.; Wegner, J.D. Global canopy height regression and uncertainty estimation from GEDI LIDAR waveforms with deep ensembles. Remote Sens. Environ. 2022, 268, 112760. [Google Scholar] [CrossRef]
- Dubayah, R.; Blair, J.B.; Goetz, S.; Fatoyinbo, L.; Hansen, M.; Healey, S.; Hofton, M.; Hurtt, G.; Kellner, J.; Luthcke, S.; et al. The Global Ecosystem Dynamics Investigation: High-resolution laser ranging of the Earth’s forests and topography. Sci. Remote Sens. 2020, 1, 100002. [Google Scholar] [CrossRef]
- Duncanson, L.; Neuenschwander, A.; Hancock, S.; Thomas, N.; Fatoyinbo, T.; Simard, M.; Silva, C.A.; Armston, J.; Luthcke, S.B.; Hofton, M.; et al. Biomass estimation from simulated GEDI, ICESat-2 and NISAR across environmental gradients in Sonoma County, California. Remote Sens. Environ. 2020, 242, 111779. [Google Scholar] [CrossRef]
- Skidmore, A.K.; Coops, N.C.; Neinavaz, E.; Ali, A.; Schaepman, M.E.; Paganini, M.; Kissling, W.D.; Vihervaara, P.; Darvishzadeh, R.; Feilhauer, H.; et al. Priority list of biodiversity metrics to observe from space. Nat. Ecol. Evol. 2021, 5, 896–906. [Google Scholar] [CrossRef] [PubMed]
- Abdullahi, S.; Schardt, M.; Pretzsch, H. An unsupervised two-stage clustering approach for forest structure classification based on X-band InSAR data—A case study in complex temperate forest stands. Int. J. Appl. Earth Obs. Geoinf. 2017, 57, 36–48. [Google Scholar] [CrossRef]
- Cazcarra-Bes, V.; Pardini, M.; Papathanassiou, K. Definition of tomographic SAR configurations for forest structure applications at L-band. IEEE Geosci. Remote Sens. Lett. 2020, 19, 1–5. [Google Scholar] [CrossRef]
- Drag, L.; Burner, R.C.; Stephan, J.G.; Birkemoe, T.; Doerfler, I.; Gossner, M.M.; Magdon, P.; Ovaskainen, O.; Potterf, M.; Schall, P.; et al. High-resolution 3D forest structure explains ecomorphological trait variation in assemblages of saproxylic beetles. Funct. Ecol. 2022, 37, 150–161. [Google Scholar] [CrossRef]
- Pardini, M.; Cazcarra-Bes, V.; Papathanassiou, K.P. TomoSAR mapping of 3D forest structure: Contributions of L-band configurations. Remote Sens. 2021, 13, 2255. [Google Scholar] [CrossRef]
- Schlund, M.; Magdon, P.; Eaton, B.; Aumann, C.; Erasmi, S. Canopy height estimation with TanDEM-X in temperate and boreal forests. Int. J. Appl. Earth Obs. Geoinf. 2019, 82, 101904. [Google Scholar] [CrossRef]
- Senf, C.; Mori, A.S.; Müller, J.; Seidl, R. The response of canopy height diversity to natural disturbances in two temperate forest landscapes. Landsc. Ecol. 2020, 35, 2101–2112. [Google Scholar] [CrossRef]
- Tello, M.; Cazcarra-Bes, V.; Pardini, M.; Papathanassiou, K. Forest structure characterization from SAR tomography at L-band. IEEE J. Sel. Top. Appl. Earth Obs. Remote Sens. 2018, 11, 3402–3414. [Google Scholar] [CrossRef]
- Wernicke, J.; Seltmann, C.T.; Wenzel, R.; Becker, C.; Körner, M. Forest canopy stratification based on fused, imbalanced and collinear LiDAR and Sentinel-2 metrics. Remote Sens. Environ. 2022, 279, 113134. [Google Scholar] [CrossRef]
- Pucher, C.; Neumann, M.; Hasenauer, H. An Improved Forest Structure Data Set for Europe. Remote Sens. 2022, 14, 395. [Google Scholar] [CrossRef]
- Kacic, P.; Hirner, A.; Da Ponte, E. Fusing Sentinel-1 and-2 to Model GEDI-Derived Vegetation Structure Characteristics in GEE for the Paraguayan Chaco. Remote Sens. 2021, 13, 5105. [Google Scholar] [CrossRef]
- Mullissa, A.; Vollrath, A.; Odongo-Braun, C.; Slagter, B.; Balling, J.; Gou, Y.; Gorelick, N.; Reiche, J. Sentinel-1 SAR Backscatter Analysis Ready Data Preparation in Google Earth Engine. Remote Sens. 2021, 13, 1954. [Google Scholar] [CrossRef]
- Louis, J.; Debaecker, V.; Pflug, B.; Main-Knorn, M.; Bieniarz, J.; Mueller-Wilm, U.; Cadau, E.; Gascon, F. Sentinel-2 Sen2Cor: L2A processor for users. In Proceedings of the Proceedings Living Planet Symposium 2016, Spacebooks Online, 9 May 2016; pp. 1–8. [Google Scholar]
- Main-Knorn, M.; Pflug, B.; Louis, J.; Debaecker, V.; Müller-Wilm, U.; Gascon, F. Sen2Cor for sentinel-2. In Proceedings of the Image and Signal Processing for Remote Sensing XXIII; SPIE: Bellingham, DC, USA, 2017; Volume 10427, pp. 37–48. [Google Scholar]
- Gorelick, N.; Hancher, M.; Dixon, M.; Ilyushchenko, S.; Thau, D.; Moore, R. Google Earth Engine: Planetary-scale geospatial analysis for everyone. Remote Sens. Environ. 2017, 202, 18–27. [Google Scholar] [CrossRef]
- Dubayah, R.; Hofton, M.; Blair, J.; Armston, J.; Tang, H.; Luthcke, S. GEDI L2A Elevation and Height Metrics Data Global Footprint Level V002. 2021. Available online: https://lpdaac.usgs.gov/products/gedi02_av002/ (accessed on 11 October 2022).
- Dubayah, R.; Tang, H.; Armston, J.; Luthcke, S.; Hofton, M.; Blair, J. GEDI L2B Canopy Cover and Vertical Profile Metrics Data Global Footprint Level V002. 2021. Available online: https://lpdaac.usgs.gov/news/release-of-gedi-v2-data-for-february-through-june-2021/ (accessed on 11 October 2022). [CrossRef]
- Dubayah, R. GEDI L2B Description Update Release 2. Canopy Cover and Vertical Profile Metrics Data Global Footprint Level 2021. Available online: https://lpdaac.usgs.gov/products/gedi02_bv001/ (accessed on 11 October 2022).
- Dubayah, R.; Armston, J.; Kellner, J.; Duncanson, L.; Healey, S.; Patterson, P.; Hancock, S.; Tang, H.; Bruening, J.; Hofton, M.; et al. GEDI L4A Footprint Level Aboveground Biomass Density; Version 2.1; ORNL DAAC: Oak Ridge, TN, USA, 2022.
- Tang, H.; Armston, J. Algorithm Theoretical Basis Document (ATBD) for GEDI L2B Footprint Canopy Cover and Vertical Profile Metrics. 2020. Available online: https://lpdaac.usgs.gov/documents/588/GEDI_FCCVPM_ATBD_v1.0.pdf (accessed on 11 October 2022).
- Kellner, J.R.; Armston, J.; Duncanson, L. Algorithm theoretical basis document for GEDI footprint aboveground biomass density (1.0). Earth Space Sci. 2021, e2022EA002516. [Google Scholar]
- Hoffrén, R.; Lamelas, M.T.; de la Riva, J.; Domingo, D.; Montealegre, A.L.; García-Martín, A.; Revilla, S. Assessing GEDI-NASA system for forest fuels classification using machine learning techniques. Int. J. Appl. Earth Obs. Geoinf. 2023, 116, 103175. [Google Scholar] [CrossRef]
- Franklin, S.E.; Ahmed, O.S.; Wulder, M.A.; White, J.C.; Hermosilla, T.; Coops, N.C. Large Area Mapping of Annual Land Cover Dynamics Using Multitemporal Change Detection and Classification of Landsat Time Series Data. Can. J. Remote Sens. 2015, 41, 293–314. [Google Scholar] [CrossRef]
- Müller, H.; Griffiths, P.; Hostert, P. Long-term deforestation dynamics in the Brazilian Amazon—Uncovering historic frontier development along the Cuiabá–Santarém highway. Int. J. Appl. Earth Obs. Geoinf. 2016, 44, 61–69. [Google Scholar] [CrossRef]
- Zanaga, D.; Van De Kerchove, R.; De Keersmaecker, W.; Souverijns, N.; Brockmann, C.; Quast, R.; Wevers, J.; Grosu, A.; Paccini, A.; Vergnaud, S.; et al. ESA WorldCover 10 m 2020 V100. 2021. Available online: https://developers.google.com/earth-engine/datasets/catalog/ESA_WorldCover_v100 (accessed on 4 December 2022).
- Breiman, L. Bagging predictors. Mach. Learn. 1996, 24, 123–140. [Google Scholar] [CrossRef]
- Breiman, L. Random forests. Mach. Learn. 2001, 45, 5–32. [Google Scholar] [CrossRef]
- Belgiu, M.; Drăguţ, L. Random forest in remote sensing: A review of applications and future directions. Isprs J. Photogramm. Remote. Sens. 2016, 114, 24–31. [Google Scholar] [CrossRef]
- Pal, M. Random forest classifier for remote sensing classification. Int. J. Remote. Sens. 2005, 26, 217–222. [Google Scholar] [CrossRef]
- Sothe, C.; Gonsamo, A.; Lourenço, R.B.; Kurz, W.A.; Snider, J. Spatially Continuous Mapping of Forest Canopy Height in Canada by Combining GEDI and ICESat-2 with PALSAR and Sentinel. Remote Sens. 2022, 14, 5158. [Google Scholar] [CrossRef]
- Rishmawi, K.; Huang, C.; Zhan, X. Monitoring Key Forest Structure Attributes across the Conterminous United States by Integrating GEDI LiDAR Measurements and VIIRS Data. Remote Sens. 2021, 13, 442. [Google Scholar] [CrossRef]
- Rishmawi, K.; Huang, C.; Schleeweis, K.; Zhan, X. Integration of VIIRS Observations with GEDI-Lidar Measurements to Monitor Forest Structure Dynamics from 2013 to 2020 across the Conterminous United States. Remote Sens. 2022, 14, 2320. [Google Scholar] [CrossRef]
- Bundesamt für Kartographie und Geodäsie. GeoBasis-DE/BKG Digitales Landschaftsmodell 1:250,000 (DLM250). 2020. Available online: https://gdz.bkg.bund.de/index.php/default/digitales-landschaftsmodell-1-250-000-ebenen-dlm250-ebenen.html (accessed on 28 December 2022).
- Lang, N.; Schindler, K.; Wegner, J.D. High carbon stock mapping at large scale with optical satellite imagery and spaceborne LIDAR. 2021. Available online: http://xxx.lanl.gov/abs/2107.07431 (accessed on 5 January 2023).
- Verheyen, R. Rechtliche Optionen für den Dannenröder Wald: Rodungsstopp, Ergänzungsverfahren-Ist das Wirklich unmöglich? Greenpeace eV Hamburg: Hamburg, Germany, 2020. [Google Scholar]
- Jung, C.; Schindler, D. Historical winter storm atlas for Germany (GeWiSA). Atmosphere 2019, 10, 387. [Google Scholar] [CrossRef]
- Adam, M.; Urbazaev, M.; Dubois, C.; Schmullius, C. Accuracy Assessment of GEDI Terrain Elevation and Canopy Height Estimates in European Temperate Forests: Influence of Environmental and Acquisition Parameters. Remote Sens. 2020, 12, 3948. [Google Scholar] [CrossRef]
- Roy, D.P.; Kashongwe, H.B.; Armston, J. The impact of geolocation uncertainty on GEDI tropical forest canopy height estimation and change monitoring. Sci. Remote Sens. 2021, 4, 100024. [Google Scholar] [CrossRef]
- Wang, C.; Elmore, A.J.; Numata, I.; Cochrane, M.A.; Shaogang, L.; Huang, J.; Zhao, Y.; Li, Y. Factors affecting relative height and ground elevation estimations of GEDI among forest types across the conterminous USA. Gisci. Remote Sens. 2022, 59, 975–999. [Google Scholar] [CrossRef]
- Hirschmugl, M.; Lippl, F.; Sobe, C. Assessing the Vertical Structure of Forests Using Airborne and Spaceborne LiDAR Data in the Austrian Alps. Remote Sens. 2023, 15, 664. [Google Scholar] [CrossRef]
- Arekhi, M.; Goksel, C.; Balik Sanli, F.; Senel, G. Comparative evaluation of the spectral and spatial consistency of Sentinel-2 and Landsat-8 OLI data for Igneada longos forest. Isprs Int. J.-Geo-Inf. 2019, 8, 56. [Google Scholar] [CrossRef]
- Kottek, M.; Grieser, J.; Beck, C.; Rudolf, B.; Rubel, F. World map of the Köppen-Geiger Climate Classification Updated. 2006. Available online: https://www.schweizerbart.de/papers/metz/detail/15/55034/World_Map_of_the_Koppen_Geiger_climate_classificat?af=crossref (accessed on 20 January 2023).
- Peel, M.C.; Finlayson, B.L.; McMahon, T.A. Updated world map of the Köppen-Geiger climate classification. Hydrol. Earth Syst. Sci. 2007, 11, 1633–1644. [Google Scholar] [CrossRef]
- Hlásny, T.; Krokene, P.; Liebhold, A.; Montagné-Huck, C.; Müller, J.; Qin, H.; Raffa, K.; Schelhaas, M.; Seidl, R.; Svoboda, M.; et al. Living with Bark Beetles: Impacts, Outlook and Management Options; Number 8; European Forest Institute: Joensuu, Finland, 2019. [Google Scholar]
- Hlásny, T.; König, L.; Krokene, P.; Lindner, M.; Montagné-Huck, C.; Müller, J.; Qin, H.; Raffa, K.F.; Schelhaas, M.J.; Svoboda, M.; et al. Bark beetle outbreaks in Europe: State of knowledge and ways forward for management. Curr. For. Rep. 2021, 7, 138–165. [Google Scholar] [CrossRef]
- Thorn, S.; Bässler, C.; Svoboda, M.; Müller, J. Effects of natural disturbances and salvage logging on biodiversity–Lessons from the Bohemian Forest. For. Ecol. Manag. 2017, 388, 113–119. [Google Scholar] [CrossRef]
- Duncanson, L.; Kellner, J.R.; Armston, J.; Dubayah, R.; Minor, D.M.; Hancock, S.; Healey, S.P.; Patterson, P.L.; Saarela, S.; Marselis, S.; et al. Aboveground biomass density models for NASA’s Global Ecosystem Dynamics Investigation (GEDI) lidar mission. Remote Sens. Environ. 2022, 270, 112845. [Google Scholar] [CrossRef]
- Dubayah, R.; Armston, J.; Healey, S.P.; Bruening, J.M.; Patterson, P.L.; Kellner, J.R.; Duncanson, L.; Saarela, S.; Ståhl, G.; Yang, Z.; et al. GEDI launches a new era of biomass inference from space. Environ. Res. Lett. 2022, 17, 095001. [Google Scholar] [CrossRef]
- GEDI Ecosystem Lidar. GEDI could Get Extension under New Proposal. Available online: https://gedi.umd.edu/gedi-could-get-extension-under-new-proposal/ (accessed on 27 January 2023).
- Rocchini, D.; Salvatori, N.; Beierkuhnlein, C.; Chiarucci, A.; De Boissieu, F.; Förster, M.; Garzon-Lopez, C.X.; Gillespie, T.W.; Hauffe, H.C.; He, K.S.; et al. From local spectral species to global spectral communities: A benchmark for ecosystem diversity estimate by remote sensing. Ecol. Inform. 2021, 61, 101195. [Google Scholar] [CrossRef]
- Rocchini, D.; Torresani, M.; Beierkuhnlein, C.; Feoli, E.; Foody, G.M.; Lenoir, J.; Malavasi, M.; Moudrỳ, V.; Šímová, P.; Ricotta, C. Double down on remote sensing for biodiversity estimation: A biological mindset. Community Ecol. 2022, 23, 267–276. [Google Scholar] [CrossRef]
- Rocchini, D.; Santos, M.J.; Ustin, S.L.; Féret, J.B.; Asner, G.P.; Beierkuhnlein, C.; Dalponte, M.; Feilhauer, H.; Foody, G.M.; Geller, G.N.; et al. The spectral species concept in living color. J. Geophys. Res. Biogeosci. 2022, 127, e2022JG007026. [Google Scholar] [CrossRef] [PubMed]
- Wang, R.; Gamon, J.A. Remote sensing of terrestrial plant biodiversity. Remote Sens. Environ. 2019, 231, 111218. [Google Scholar] [CrossRef]
- Kacic, P.; Kuenzer, C. Forest Biodiversity Monitoring Based on Remotely Sensed Spectral Diversity—A Review. Remote Sens. 2022, 14, 5363. [Google Scholar] [CrossRef]


| GEDI Data Set | L2A | L2B | L4A |
|---|---|---|---|
| Key attributes (official names in brackets) | Relative heights metrics of percentiles (e.g., rh_95; 95th percentile of the relative height metrics) | Canopy height (rh_100), total canopy cover (cover), Plant-Area-Index (pai), Foliage-Height-Diversity-Index (fhd_normal) | Above-ground biomass density (agbd) |
| Data availability (date: 11 January 2023) | April 2019 to June 2022 | April 2019 to June 2022 | April 2019 to June 2022 |
| 2019 | 6,924,457 | 13,938,669 | 7,612,182 |
| 2020 | 11,432,909 | 21,130,478 | 10,514,746 |
| 2021 | 8,638,058 | 8,717,241 | 7,233,623 |
| 2022 | 3,935,107 | 3,545,429 | 3,287,678 |
| GEDI Attribute | Canopy Height (rh_95) | Total Canopy Cover (Cover) | Above-Round Biomass Density (Agbd) | ||||||
|---|---|---|---|---|---|---|---|---|---|
| Efficiency Criteria | R2 [%] | MAE [m] | RMSE [m] | R2 [%] | MAE [%] | RMSE [%] | R2 [%] | MAE [Mg/ha] | RMSE [Mg/ha] |
| 2017 | 66.9 | 4.1 | 6.5 | 68.4 | 11.6 | 18.3 | 61.1 | 41.2 | 65.3 |
| 2018 | 69.7 | 4.2 | 6.2 | 67.7 | 11.8 | 18.5 | 62.8 | 38.8 | 61.3 |
| 2019 | 66.5 | 4.3 | 6.6 | 68.3 | 11.8 | 18.4 | 61.3 | 40.6 | 63.7 |
| 2020 | 65.3 | 4.2 | 6.5 | 68.2 | 11.8 | 18.4 | 61.9 | 38.3 | 60.2 |
| 2021 | 56.2 | 5.1 | 7.7 | 61.5 | 14.5 | 21.2 | 50.9 | 47.7 | 73.0 |
| 2022 | 65.7 | 4.3 | 6.3 | 67.7 | 13.3 | 19.7 | 54.7 | 39.5 | 62.4 |
| Mean | 64.6 | 4.4 | 6.6 | 67.0 | 12.5 | 19.1 | 58.8 | 41.0 | 64.3 |
Disclaimer/Publisher’s Note: The statements, opinions and data contained in all publications are solely those of the individual author(s) and contributor(s) and not of MDPI and/or the editor(s). MDPI and/or the editor(s) disclaim responsibility for any injury to people or property resulting from any ideas, methods, instructions or products referred to in the content. |
© 2023 by the authors. Licensee MDPI, Basel, Switzerland. This article is an open access article distributed under the terms and conditions of the Creative Commons Attribution (CC BY) license (https://creativecommons.org/licenses/by/4.0/).
Share and Cite
Kacic, P.; Thonfeld, F.; Gessner, U.; Kuenzer, C. Forest Structure Characterization in Germany: Novel Products and Analysis Based on GEDI, Sentinel-1 and Sentinel-2 Data. Remote Sens. 2023, 15, 1969. https://doi.org/10.3390/rs15081969
Kacic P, Thonfeld F, Gessner U, Kuenzer C. Forest Structure Characterization in Germany: Novel Products and Analysis Based on GEDI, Sentinel-1 and Sentinel-2 Data. Remote Sensing. 2023; 15(8):1969. https://doi.org/10.3390/rs15081969
Chicago/Turabian StyleKacic, Patrick, Frank Thonfeld, Ursula Gessner, and Claudia Kuenzer. 2023. "Forest Structure Characterization in Germany: Novel Products and Analysis Based on GEDI, Sentinel-1 and Sentinel-2 Data" Remote Sensing 15, no. 8: 1969. https://doi.org/10.3390/rs15081969
APA StyleKacic, P., Thonfeld, F., Gessner, U., & Kuenzer, C. (2023). Forest Structure Characterization in Germany: Novel Products and Analysis Based on GEDI, Sentinel-1 and Sentinel-2 Data. Remote Sensing, 15(8), 1969. https://doi.org/10.3390/rs15081969