Article

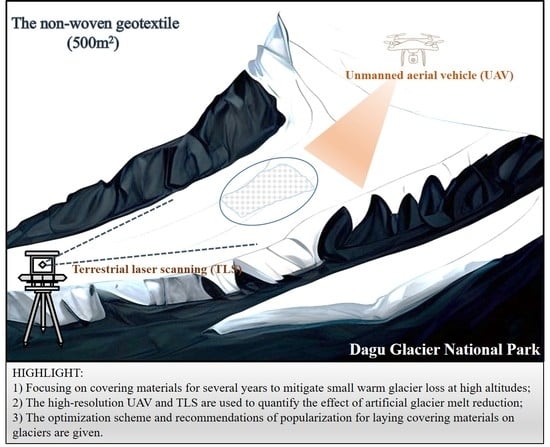
Applying Artificial Cover to Reduce Melting in Dagu Glacier in the Eastern Qinghai-Tibetan Plateau

1
State Key Laboratory of Cryospheric Science, Northwest Institute of Eco-Environment and Resources, Chinese Academy of Sciences, Lanzhou 730000, China
2
University of Chinese Academy of Sciences, Beijing 100049, China
*
Author to whom correspondence should be addressed.
Remote Sens. 2023, 15(7), 1755; https://doi.org/10.3390/rs15071755
Submission received: 15 February 2023 / Revised: 16 March 2023 / Accepted: 22 March 2023 / Published: 24 March 2023

Abstract

:
Global warming has accelerated during the past decades, causing a dramatic shrinking of glaciers across the globe. So far, the attempts to counterbalance glacial melt have proven to be inadequate and are mostly limited to a few glacial landscapes only. In the present study, a scientific glacier protection experiment was conducted at the Dagu Glacier site. Specifically, the study site was the Dagu Glacier No. 17, situated 4830 m a.s.l. The study involved a deliberate verification of the feasibility and effectiveness of using geotextile covers on small glaciers located at high altitudes between August 2020 and October 2021. The observations revealed that the mass loss in the area covered with geotextiles was, on average, 15% lower (per year) compared to that in the uncovered areas combining field campaigns, terrestrial laser scanning, and unmanned aerial vehicle. The reason for this could be that the albedo of the geotextile is higher than that of the glacier surface. In addition, the aging of geotextiles causes a decline in their albedo, leading to a gradual decline in the effectiveness of the resulting glacier protection. It was indicated that geotextiles could be effective in facilitating the mitigation of glacier ablation, although the cost-related limitations render it difficult to upscale the use of artificial cover. Nonetheless, using active artificial cover could be effective in the case of small glaciers, glacier landscapes, and glacier terminus regions.

Graphical Abstract

1. Introduction

Mountain glaciers form a crucial component of the cryosphere and are sensitive to climatic fluctuations [1]. The accelerated rate of global warming in recent decades has caused evident glacier retreating, particularly in the glacier landscapes. The melting of glaciers, in addition to affecting the natural environment, has potential implications for the socioeconomic development and the aspects of civilization and spirituality [2,3,4]. Although numerous studies have investigated glacial changes in China [5,6,7], few have focused on glacier conservation. Besides the observed and predicted rapid melting of glaciers, the predestination of glaciers is of particular concern [8,9,10]. Therefore, it is imperative to explore different ways to prevent the dramatic melting of glacier ice [11].
Artificial mitigation of glacier melt has been applied to facilitate operability in reducing the rates of glacier melt [12]. It has also been applied to the glaciers of a few ski resorts [13,14,15]. Various materials, such as foam, sawdust, wood chips, and textiles, have been investigated in this regard to evaluate their capability of preserving snow and ice for several decades in the Alps [11]. While certain studies have evaluated the use of artificial cover in glacier regions [16,17], most such studies have evaluated the conservation effectiveness in ski areas only during the summer ablation period and not for the whole year. In particular, the glacier regions with imminent extinction observed in the landscape have not been focused on. Moreover, most glacier protection experiments have been conducted in low-altitude regions (≤3000 m a.s.l.) in the Alps, while studies conducted at high altitudes are rarely reported. It is noteworthy that most such experiments have focused on the protective effect of ski resorts during the summer ablation period [12,13,14], and not on assessing efficiently the cover material protected the glacier throughout the year at high altitudes. In this context, the present study selected small glacier areas located at high altitudes as the study regions to evaluate the conservation efficiency of the cover material at different periods. The objective was to provide suggestions for glacier conservation and fill the gap in the existing literature regarding conservation attempts in small glacier and high-altitude glaciers. Accordingly, a rapidly melting glacier, Dagu Glacier No. 17 (DG17), located in a conservation area with high tourism in the eastern Qinghai-Tibetan Plateau, was selected for the study.
To better assess the specific effect of artificial cover on the study region, glacier variation was surveyed based on the high-resolution elevation of the ground surface [18,19,20]. Field observations and Terrestrial Laser Scanning (TLS) of the glacier were conducted in the year 2020. The glacier was surveyed for Unmanned Aerial Vehicles (UAV) and TLS to generate the digital elevation model (DEM) in the summer of 2021. The main objectives of the experiments were as follows: (1) to investigate and compare the glacier changes in covered and uncovered regions; (2) to evaluate the effectiveness of geotextiles in reducing glacier melt at different periods; and (3) to analyze the applicability of geotextiles in reducing glacier melt through a comparative analysis.

2. Study Site

The experiment area was located on DG17 (32°13′30″N, 102°45′0″E, Figure 1), which is the only accessible glacier in Dagu Glacier National Park and also the third largest glacier tourism destination in China. DG17 is the greatest glacier in the Dagu National Park, with an area of approximately 0.05 km2 (almost 0.120 ± 0.004 km2 a–1) [21]. The altitude range of this glacier is 4800~4900 m. In addition to being a part of the Glacier National Park, it is a nationally designated National Geopark Geological Remnant Reserve as well. However, the prospects are bleak as glaciers continue to melt in certain landscape regions [22].

3. Materials

The covered glacier surface exerted a significant impact on the energy balance of the underlying glacier by reducing the amount of energy available for melting during the ablation period. Figure 2 graphically illustrates glacier melt mitigation based on cover materials placed at the glacier terminal, along with a few pictures of the study region. Researchers analyzed the insulation performance of nine cover materials (three natural and six artificial materials) against snow and reported that non-woven fabrics (geotextiles) composed of stabilized polypropylene fibers exhibited superior insulation performance [23]. Non-woven geotextile is a permeable geosynthetic material, which is typically made of synthetic materials such as polypropylene, polyethylene, polyamide, polyester, etc [24]. Polypropylene fiber dominates in geotextile applications because of its excellent properties such as lightweight, low cost, corrosion resistance, anti-filtering, drainage, isolation, enhancement, and more. Therefore, in the present study, non-woven geotextiles were used as the cover material.
In practice, non-woven geotextile rolls were transported via gondola to the altitude of 4800 m a.s.l., followed by being transported to the study site by manpower on 5 August 2020. The geotextile rolls (50 m × 2 m) were spliced together by securing the geotextile surface with a tape adhesive. When laying, it should be noted that the rough and burnt surface faces upwards, then one end is fixed with a fixture, and it is tightened with machinery or manpower, with a stretching elongation rate of about 1.0% to 1.5% and laid straight and close to the road surface. A certain degree of overlap (usually 0.1 m~0.3 m) between adjacent geotextiles was ensured (Figure 2b,c). White ropes were used for fixing the coverage area at intervals of 4 m, and the ends of these ropes were fixed with white cloth bags containing stones. Finally, a non-woven geotextile was installed along the main flowline of DG17, 50 m from the glacier terminus, representing approximately 1% of the total glacier area. Figure 2c presents an overview of the coverage area after it had been laid out.

4. Methods

In this study, we took advantage of a field campaign performed during August and October 2020. Then, performing TLS surveys in October 2020 and October 2021. We conducted surveys using a UAV in August and October 2021. The terrestrial laser scanner Riegl VZ-6000 scanner was employed to scan the DG17 in the 2020–2021 period. A DJI Phantom 4 RTK UAV survey was conducted at DG17 in August 2021 and then in October 2021 (refer to Table 1). Note that performing TLS and UAV surveys when the DG17 surface was barren of snow each time.

4.1. Glaciological Method

The mass balance could be calculated from the stakes from August 2020 to October 2020. Although a total of 10 stakes were installed along the DG17 in August 2020, only five were available for mass-balance measurements—four stakes installed in the uncovered regions and 1 stake installed in the regions covered with geotextiles (Figure 1). The designated observer performed data acquisition and maintenance of the study region at intervals of 15 days. Since the regulations related to glacier protection limited the continuous access to DG17, field campaigns could be conducted from August 2020 to October 2020.
The observations included the stake’s vertical height above the glacier surface, the thickness of superimposed ice, and the thickness and density of each snow layer. The single-point mass balance can be expressed as [25]:
σ n = σ S + σ ice + σ si
where σS, σice, and σsi are the mass balances of the snow, glacier ice, and superimposed ice, respectively [26].

4.2. Terrestrial Laser Scanning

4.2.1. Riegl VZ®-6000 Terrestrial Laser Scanner

Laser ranging technology is one of the core technologies of 3D laser scanners. Riegl VZ®-6000 uses the pulse laser ranging method, where the laser transmitter emits a laser pulse that is reflected back by the target object and received by the laser receiver. Based on this, the pulse time difference t can be calculated and multiplied by the pulse propagation speed (i.e., the speed of light c) to obtain the distance from the scanner to the target object [27].
D = c * t / 2
At the same time, the internal measurement system of the instrument can obtain the longitudinal (θ) and horizontal (φ) angles of the laser pulse at the moment of measurement, which can be used to calculate the three-dimensional coordinates (x, y, z) of the target object.
{ x = Dcos θ cos φ y = Dcos θ cos φ z = Dsin θ
Based on obtaining the single-point coordinates of the target object, the scanner realizes vertical 60° (−30°~+30°) line scanning (fast scanning) through the rotation of the reflection prism, and horizontal 360° surface scanning (slow scanning) through the rotation scanner to obtain a continuous and dense three-dimensional coordinate of the target object, while recording the emitted light to form point cloud data. Measuring personnel can scan the interested target object by setting the angle range of line scanning and surface scanning, as well as setting the laser pulse repetition frequency and determining the data acquisition speed within the configured range. TLS is relatively simple, cost-effective, and highly mobile, making it an excellent tool for conducting observations of individual glaciers [28].

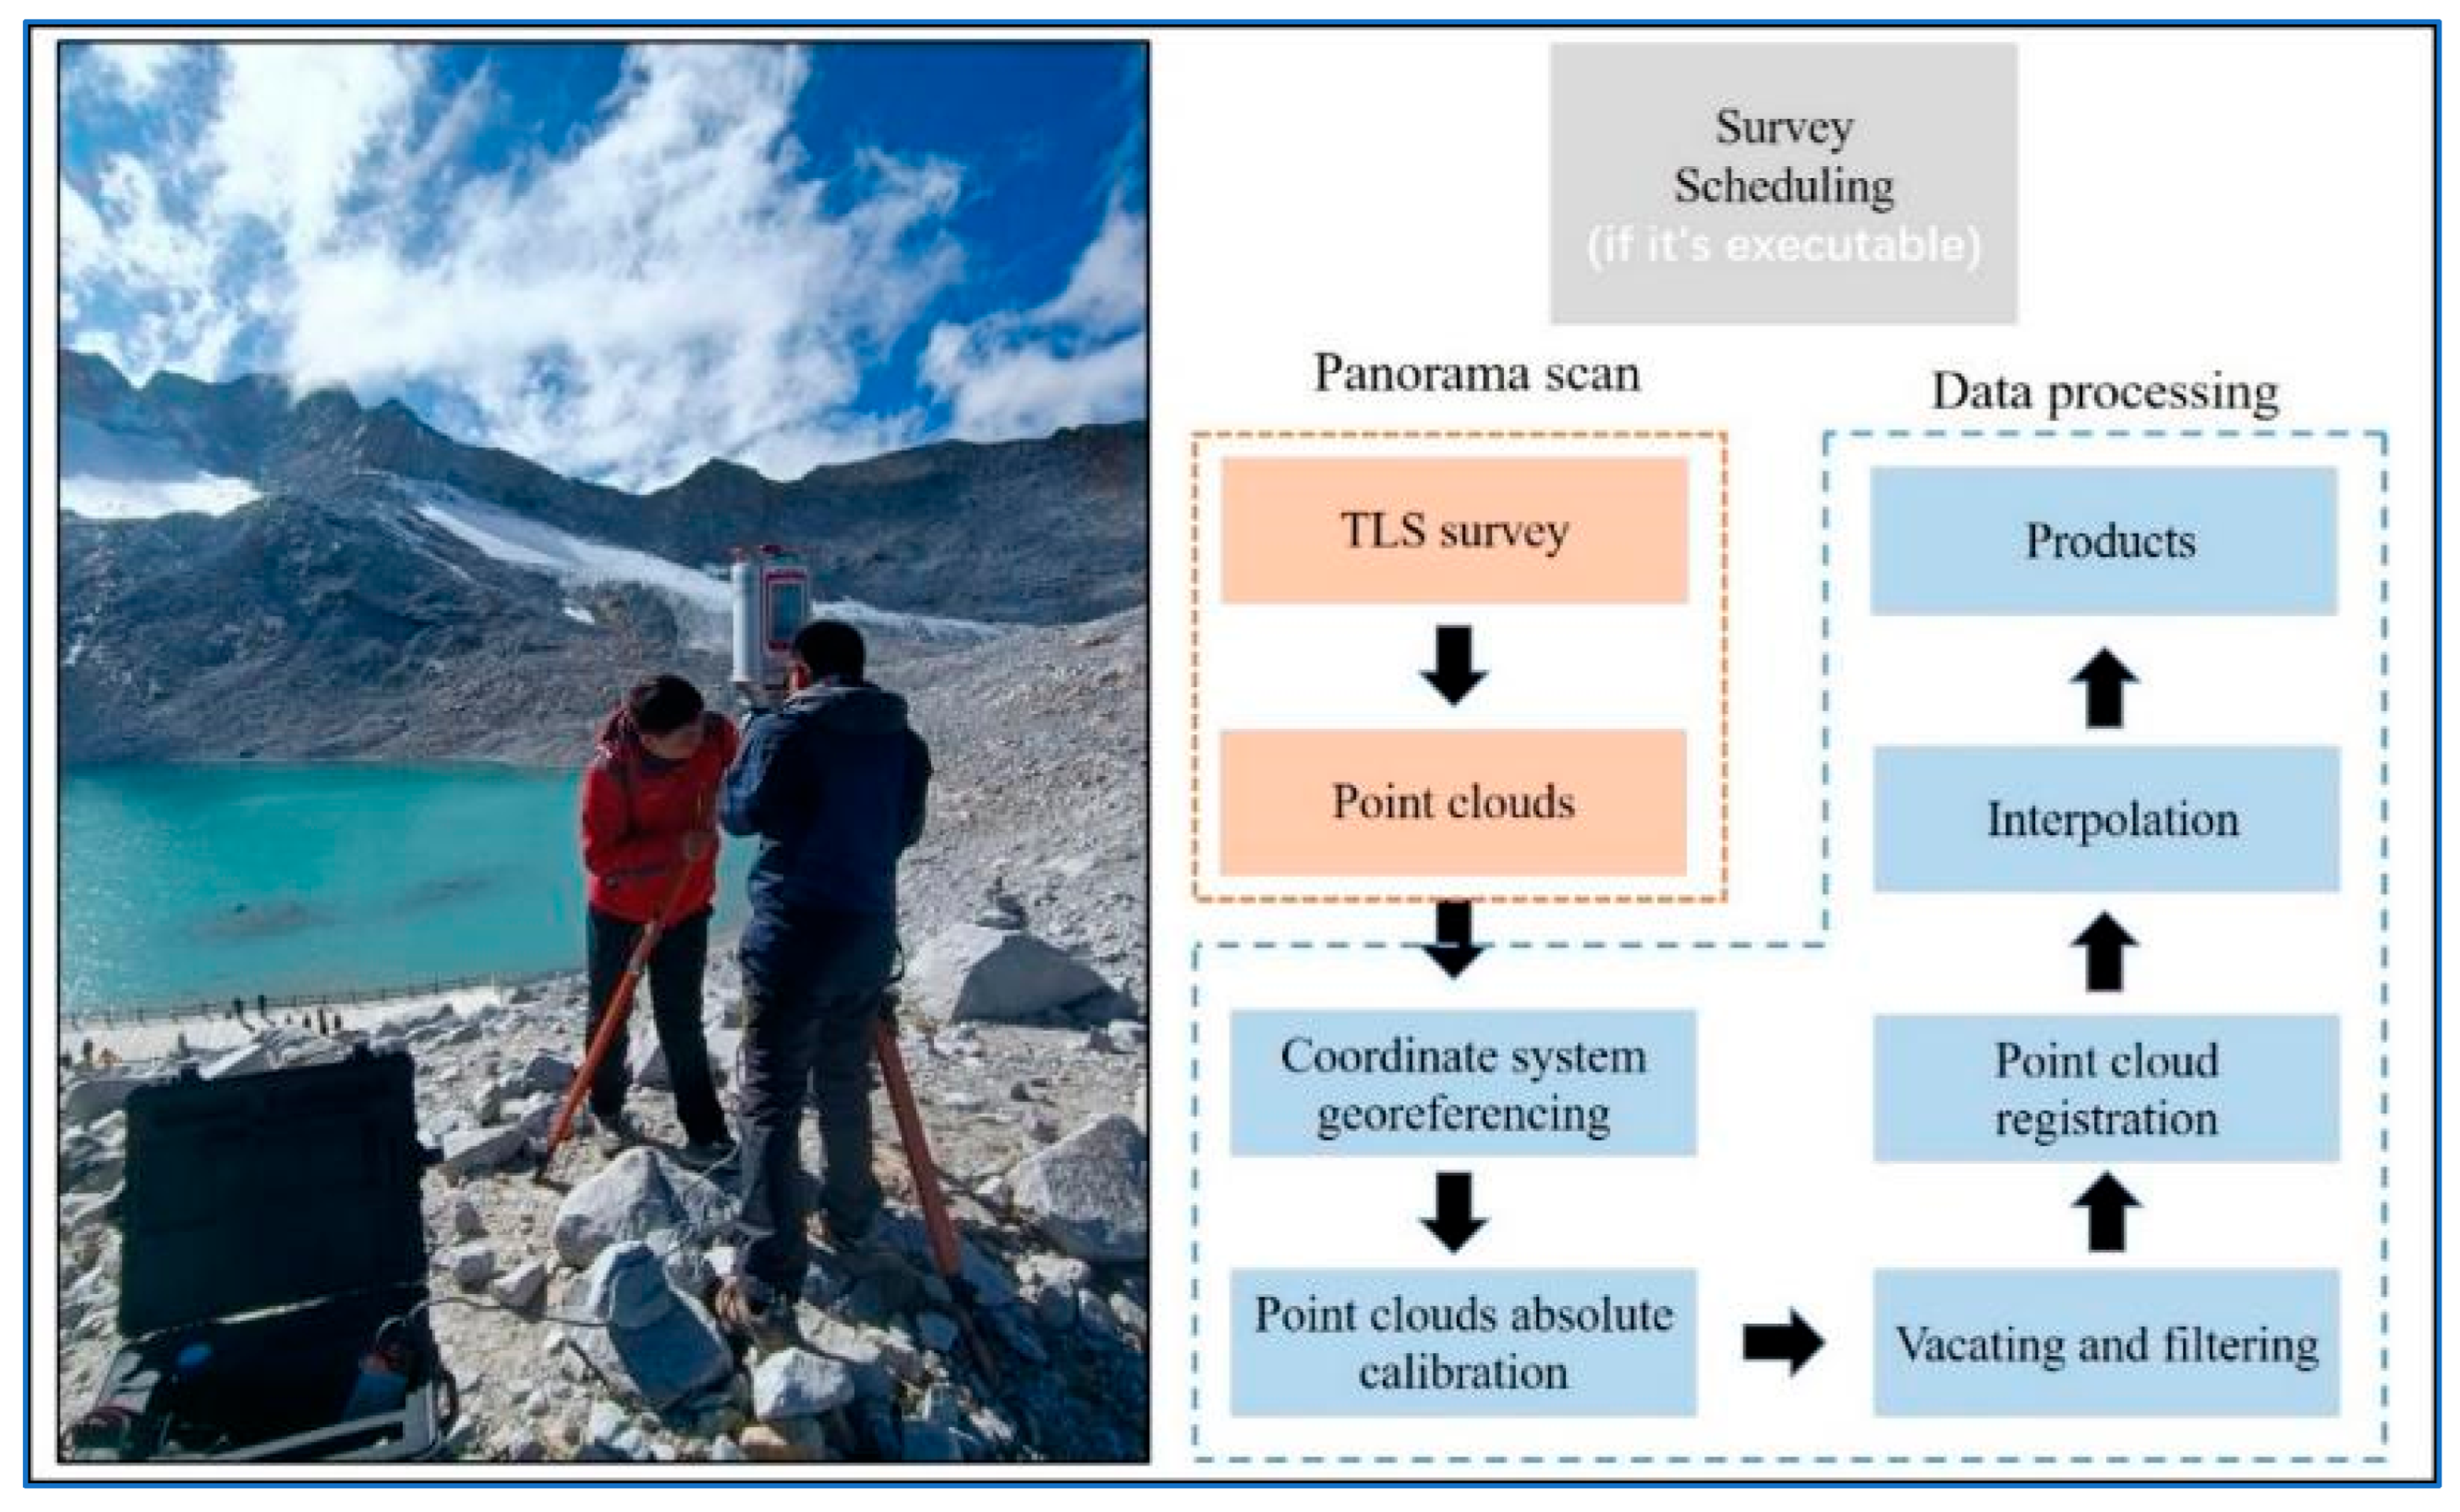
4.2.2. Point Cloud Data Acquisition and Processing

In this paper, a total of 2 phases of scanning data were used, and each phase of the data was acquired in the same way. Specifically, on the same days as those of the last field campaign days of 2020, a TLS-based survey was conducted in DG17, and another survey was conducted in October 2021. Scanning location was selected from the directions where most glacier surface point clouds would be achieved (i.e., the best possible visibility to glacier surface terrain). An instrumented site was established on the right flank of Lake Moraine at the glacier terminus. To obtain a fine scan of the glacier surface, the repetition rate of the laser pulse was set to 50 kHz, with the vertical and horizontal angular ranges of 60°–120° and 0°–360°, respectively, from the zenith [26]. The overlap percentage of each scan was above 30%. All scans are performed on sunny days (dry and windless atmosphere) to avoid the influence of precipitation and fog, which can absorb laser pulse and reduce the possible survey distance. The surveying parameters of DG17 are listed in Table 1.
The data were processed using Riegl RiSCAN Pro v2.10.2 (http://www.riegl.com, accessed on 6 October 2020) [29]. This includes
(1)
Direct georeferencing. The method uses a total station to transform the laser scanner system [25]. The coordinates of the scanning system are transformed from the local coordinate system to the global coordinate system using RTK measurements from various scanning stations.
(2)
Point cloud vacuation and filtering. An octree algorithm was applied to the registered scans to generate points with equal spacing to realize point cloud data reduction [27], and a terrain filter was used to remove noise and non-ground points.
(3)
Point cloud registration was performed based on the Iterative Closest Point (ICP) algorithm. Based on minimizing the least squares of residuals, the direction of each scan was iteratively adjusted, and the optimal fitting between the point clouds was calculated [29]. The specific processing flow is shown in Figure 3.

4.3. Unmanned Aerial Vehicle Surveys

4.3.1. DJI Phantom 4 RTK

The Phantom 4 RTK is equipped with a new RTK application module that collects data from satellites and fixed base (ground) stations to provide centimeter-accurate 3D coordinates for image geotagging, eliminating the need for ground control. The positioning system supports connection to the D-RTK 2 precision GNSS mobile station and can connect to NTRIP (RTCM network transmission protocol) through a 4G wireless card or WiFi hotspot. High-resolution orthomosaic and high-density point cloud data are obtained from UAV-RTK surveys using a standard SfM processing workflow. Based on stable terrain evaluation and adjustment of the corresponding point cloud accuracy, the 3D-aligned error is reduced to an average of 0.02 m.
A DJI Phantom 4 RTK UAV (P4RTK) was flown twice under the covering network, once on 13 August 2020 and then on 14 October 2020, spanning the DG17 study site and capturing 300 images each time (Table 1). P4RTK consists of aircraft, a remote controller, a gimbal camera, and the DJIGS RTK App used in conjunction. RTK (Real-time kinematic) positioning technology is a real-time dynamic positioning technology based on carrier phase observation values. It can provide real-time three-dimensional positioning results of the measuring station in a specified coordinate system, achieving centimeter-level accuracy.

4.3.2. UAV Data Acquisition and Processing

Automatic mission flights were executed using the P4RTK platform in this paper. P4RTK equipped with RTK receivers could receive data broadcast from collated RTK base stations in real time. P4RTK has the potential to reduce the survey duration by up to 75%, owing to its superior RTK positioning accuracy. Stott demonstrated the versatility of the GNSS-RTK UAV in rapid kilometer-scale topographic surveys under various geomorphic environmental conditions and no Ground Control Points (GCP) [30]. Therefore, in the present study, no control ground points were established considering the areas of the study site (500 m2) and DG17 (<0.05 km2). According to the requirements of aerial survey for image overlap, the course overlap of UAVs in the field is between 65~80%, and the overlap of side direction is between 20%~60%. Generally, under the condition that other factors remain unchanged, the lower the flight altitude, the higher the ground resolution, so in order to achieve centimeter-level ground resolution, the two flight heights are mostly between 100~200 m, and the ground resolution is therefore 0.8 and 2.5 cm (Table 2). In order to assess the aerial survey error, a complete GNSS survey was conducted prior to each flight [31]. The obtained UAV images were processed using Pix4Dmapper (https://www.pix4d.com, accessed on 25 August 2021) [32], which is described below:
(1)
Initial processing: This process uses the structure-from-motion algorithm to generate a sparse point cloud [33]. Firstly, a feature matching algorithm (such as scale-invariant feature transform (SIFT), which can detect key points in photos under different viewing angles and lighting conditions) is used. Secondly, the rough position and orientation of the camera at each exposure station is reconstructed using internal parameters (focal length, photo principal point coordinates) and external parameters (i.e., POS data). A sparse point cloud is created.
(2)
Point cloud densification: In this step, multi-view stereo techniques are applied to obtain a higher point cloud density than in the previous step [34]. Therefore, the spatial resolution of the product can be enhanced, and an irregular network can be created for the next step.
(3)
Digital elevation model (DEM) and orthomosaic generation: DEM and orthomosaic are the two main final products. DEM can be constructed using a dense point cloud and an irregular network, with high accuracy for rugged terrain. Each image pixel is projected onto the DEM to generate a geo-referenced orthomosaic [35]. Since P4RTK is equipped with RTK, no GCP has to be installed for the geo-correction of the photogrammetric point cloud, and only checkpoints have to be established to evaluate the accuracy of the derived DEMs with 5 checkpoints for the first flight and 6 checkpoints for the second (Figure 4).

4.4. Uncertainty Assessment

4.4.1. Uncertainties of Glaciological Measurements

There are further sources of error in glaciological measurements that lead to uncertainties in the glaciological mass balance that are not easily quantified [36]. These uncertainties are divided into three groups: (i) errors in field observations, (ii) errors related to spatial extrapolation over the entire glacier, and (iii) errors due to non-updated glacier area [37]. Notice that the uncertainty of spatial extrapolation and non-updated glacier area seems to be negligible due to the short time interval (nearly 2 months) and small area (less than 0.05 km2) in glaciological measurements.
Point measurement uncertainties are prone to errors in stake readings in our study [38,39]. Here errors of ablation measured in ice (σice) is calculated using 0.14/√(Nice) where Nice denotes the number of ablation stakes [40]. Taking into account the above-mentioned factors, the σ field is calculated as:
σ field = ( σ ice ) 2
The resulting values of σfield are discussed in Section 6.1.

4.4.2. Uncertainties of Geodetic Mass Balance

The accuracy of the DEMs is estimated in three ways. Firstly, the photogrammetric software provides several different error statistics including tie point matching error and CP placement error (difference between actual coordinates and estimated position from SfM processing) (Table 1). Secondly, the surveyed GNSS elevation at the checkpoint locations are compared against the elevation extracted from the DEM surface to provide a more precise estimate of absolute elevation error for each surface. A third method for estimation of error is to compare differences in the DEM elevations over regions that have experienced no change.
(1)
UAV uncertainty assessment
The accuracy of the UAV surveys was estimated using different approaches. First, the photogrammetry software was employed to obtain the error statistics in terms of RMSE (Table 1). In order to estimate the error of the technique, the error of the UAV aerial survey processing report was analyzed using the software. Next, the absolute error of the surface elevation was derived by comparing the checkpoint elevation measured using GNSS with the surface elevation extracted from the UAV [41,42]. The independent GCPs in the glacier regions were selected to perform the uncertainty of the DEMs using the following equation:
σ DEM = 1 n ( σ UAV σ CP ) n
where σ DEM is the uncertainty of UAV’s DEM, σ UAV is the elevation of the UAV’s DEM, σ C P is the checkpoints elevation surveyed by GNSS, and n is the number of checkpoints. The results are shown in Table 1, i.e., the average difference between checkpoints and UAV surveys. The results are shown in Table 2, i.e., errors between checkpoints and DEM elevations.
(2)
TLS uncertainty assessment
After multi-temporal registration, errors related to the spatial bias of the multi-temporal DEMs may be negligible. In addition to density conversion for converting TLS-derived glacier surface elevation changes to mass balance, uncertainties in the geodetic mass balances derived from the TLS may be related to: (1) point cloud data acquisition errors, including topography and atmospheric environment (wind and moisture); (2) data processing errors and DEM creation, i.e., registration (multi-station adjustment), point cloud filtering, and raster DEM interpolation (smooth terrain information) [27]. Because the registration error cannot be distinguished from the positional uncertainties and the surface, it is difficult to assess registration-induced uncertainty. The standard deviation of errors (σ) from the set of residuals obtained from registering the point cloud can be considered an indication of registration quality [28]. The lack of dense measured 3-D coordinates of the terrain limits us from assessing terrain-induced errors qualitatively. No better ways can be used to evaluate the uncertainty of DEMs without precise and well-distributed stable points. The standard error (σ) of elevation changes over stable terrain also can be considered a criterion of the uncertainty of the entire glacier [37]. The standard deviation stable terrain elevation changes are suitable for estimating the uncertainty of the DEM differences at the individual pixel scale.
We used elevation changes in the off-glacier to assess systematic errors between repeated TLS scanning. The impact of glacial movement on its surrounding terrain is present, but negligible for a relatively small glacier. Therefore, the height difference in the off-glacier should be close to zero. The accuracy of the TLS survey was estimated by comparing the DEM elevation differences in the off-glacier. Accordingly, the elevation difference of the off-glacier terrain was calculated to determine the error of DEM of TLS-derived data in the vertical direction.

5. Results

The present study focused on the analysis of artificial interventions in the changes of glacier surface elevation, which challenge the normal operations in Dagu Glacier National Park and the National Geopark Geological Remnant Reserve. When the installation was just completed (5 August 2020), the area of the glacier covered with non-woven geotextiles was 500 m2. Meanwhile, the surface of the glacier was flat and free of snow in both covered and non-covered regions. With time, a height difference appeared between the covered area and the non-covered area, and this difference gradually increased as time passed.
Two months later, on 17 October 2020, the effects of the geotextile were more evident. The covered area was, on average, 0.46 m higher than the surrounding uncovered surface. According to the ablation records available in the measurement database, the unprotected region’s ablation rate was 1.9 cm·d–1 between 5 August 2020 and 17 October 2020, while the rate was only 1.2 cm·d–1 in the protected region. The last survey was conducted on 17 October 2020, which revealed an average height difference of 0.46 m (i.e., 0.41 m w.e., with a density of 900 kg·m–1) between the covered and natural surfaces. The elevation changes were 1.21 m w.e. in uncovered areas and 0.8 m w.e. in covered areas between 5 August 2020 and 17 October 2020. There is approximately 27% less ablation in protected areas than in unprotected areas (Figure 4). While the initial state of the covered ice was flat with regular parallelograms, the final shape resembled a trapezoidal solid, which was attributed to greater melting on the sides of the covered area that had consistent geotextile covering (Figure 5). The volume of the preserved ice was determined to be 178 m3 by the formula for the volume of a trapezium (Figure 5). In other words, 500 m2 of geotextile cover reduced the total ablation by 27%, saving 178 m3 out of the 670 m3 area of the glacier from ablation.
The initial objective of the present study was to evaluate the effectiveness of geotextiles in glacier protection during different periods across the year. However, high-altitude mountain conditions and the scarcity of experimental researchers severely hindered the development of field observations. As a consequence, the terrestrial laser scanner Riegl VZ-6000 scanner had to be employed on 17 October 2020 for the campaign to obtain high-resolution DEMs, and a second scanning using this instrument was performed on 14 October 2021. The glacier elevation change was calculated by using the raster calculator. The DG17 glacier tongue melted significantly throughout the observation period. In the 2020–2021 period, the maximum melting occurred in the northern section of the glacier, with a change of less than 4 m, while the upper part of the glacier became thinner by 1–3 m. This demonstrates the urgency of implementing measures for glacier protection. Figure 6b,c depict that the average elevation change in the study area, excluding the area covered with the material, was 2.7 m, while the elevation change in the protected region was only 2.3 m. In other words, geotextile cover mitigated glacier melting by 15% in a year.
Furthermore, the elevation change information was obtained using photogrammetry to evaluate the protective effect of geotextiles on the glaciers after one year. Specifically, efficient UAV surveys were conducted on 13 August 2021 and 14 October 2021 to obtain accurate ultra-high-resolution (with an average ground sampling distance (GSD) in the range of 1–3 cm) data from UAV images (Figure 7). As visible in Figure 6, although the surface elevation of the DG17 changed significantly during the two periods, particularly at the glacier terminus (close to 2.5 m), the geotextiles were nonetheless effective in mitigating glacier ablation even one year after covering. Figure 8 depicts the statistical frequency histograms of the elevation changes that occurred in the protected and unprotected regions. The unprotected region ablated by 1.3 to 1.4 m over two months, while the covered area ablated by 1.1 to 1.3 m. In addition, the average ablation in the protected regions was 1.1 m, while the average ablation in the non-protected regions was 1.2 m. These data implied that after one year of geotextile cover, ablation was reduced by 0.1 m (1.2 m less 1.1 m), which accounted for an 8% reduction in glacier melting.
If geotextile was not removed, the snow cannot accumulate over the surface in covered areas. Nevertheless, uncovered areas are able to accumulate through the snow. Therefore, the evaluation results demonstrated that the glacier cover could mitigate at least 15% of the DG17 from melting throughout the year. However, the glacier ablation mitigating effect of artificial active cover continued to decrease gradually, with only 8% protection efficiency achieved in the second period compared to the 27% protection efficiency observed in the first period.

6. Discussion

6.1. Accuracy in Glaciological Measurement

Uncertainties in a glaciological measurement consist of systematic and random errors and arise primarily from uncertainties in spatial interpolation, point measurements, as well as glacier reference zone. As the research period is only two months, glacier reference region uncertainty is negligible, and, thus, stake readings are the main causes of point measurement uncertainty. Dense spatially measured sites surround the glacier-covered surface (the average density is about 1 stake per 100 m−2 from 5 August 2020 and 17 October 2020) to measure the glaciological mass balance (Figure 1c). In particular, the mean uncertainty of σfield was ±0.06 m w.e.
Estimated tie point (image) matching errors of UAVs are summarised in Table 1. The DEMs generated without GCP presented vertical RMSE values of 0.02 m and 0.06 m. To gain a better understanding of the absolute accuracy of the two DEM surfaces, elevations from the DEM were compared against those from checkpoints surveyed in their respective years (Table 2). The mean difference between DEM and GNSS checkpoints on 13 August 2021 is 0.07 m; on 14 October 2021, the mean difference is 0.11 m. Negative values indicate an underestimation of the DEM surface concerning surveyed positions and thus imply flattening of the DEM surface. Most errors are less than ±15 cm and are the combined result of errors in image matching/SfM processing, GNSS positional errors, and DEM smoothing of small surface features.
Generally, the environment (terrain and atmosphere) around the glacierized area is complicated and the quality of TLS survey data is influenced by the surroundings. This paper has shown that an ultra-long-range TLS is well suited for surveying ice-covered terrain, as it provides precise detail of glacier surface elevation changes. Additionally, systematic shifts in DEMs in the horizontal and vertical directions introduce other errors. Therefore, the elevation difference in the off-glacier terrain between the TLS-derived DEMs was calculated to quantify the accuracy of the results for the vertical direction. The mean error of the TLS-derived DEMs in the vertical direction was 0.1 m, with a standard deviation of 0.37 m (Figure 9). The above results indicated that the DEMs used in the analyses were aligned accurately in the vertical direction. Overall, these results indicated that the geodetic method adopted in the present study yielded relatively satisfactory results, and these errors are small and negligible for the uni-temporal analysis performed in this study.

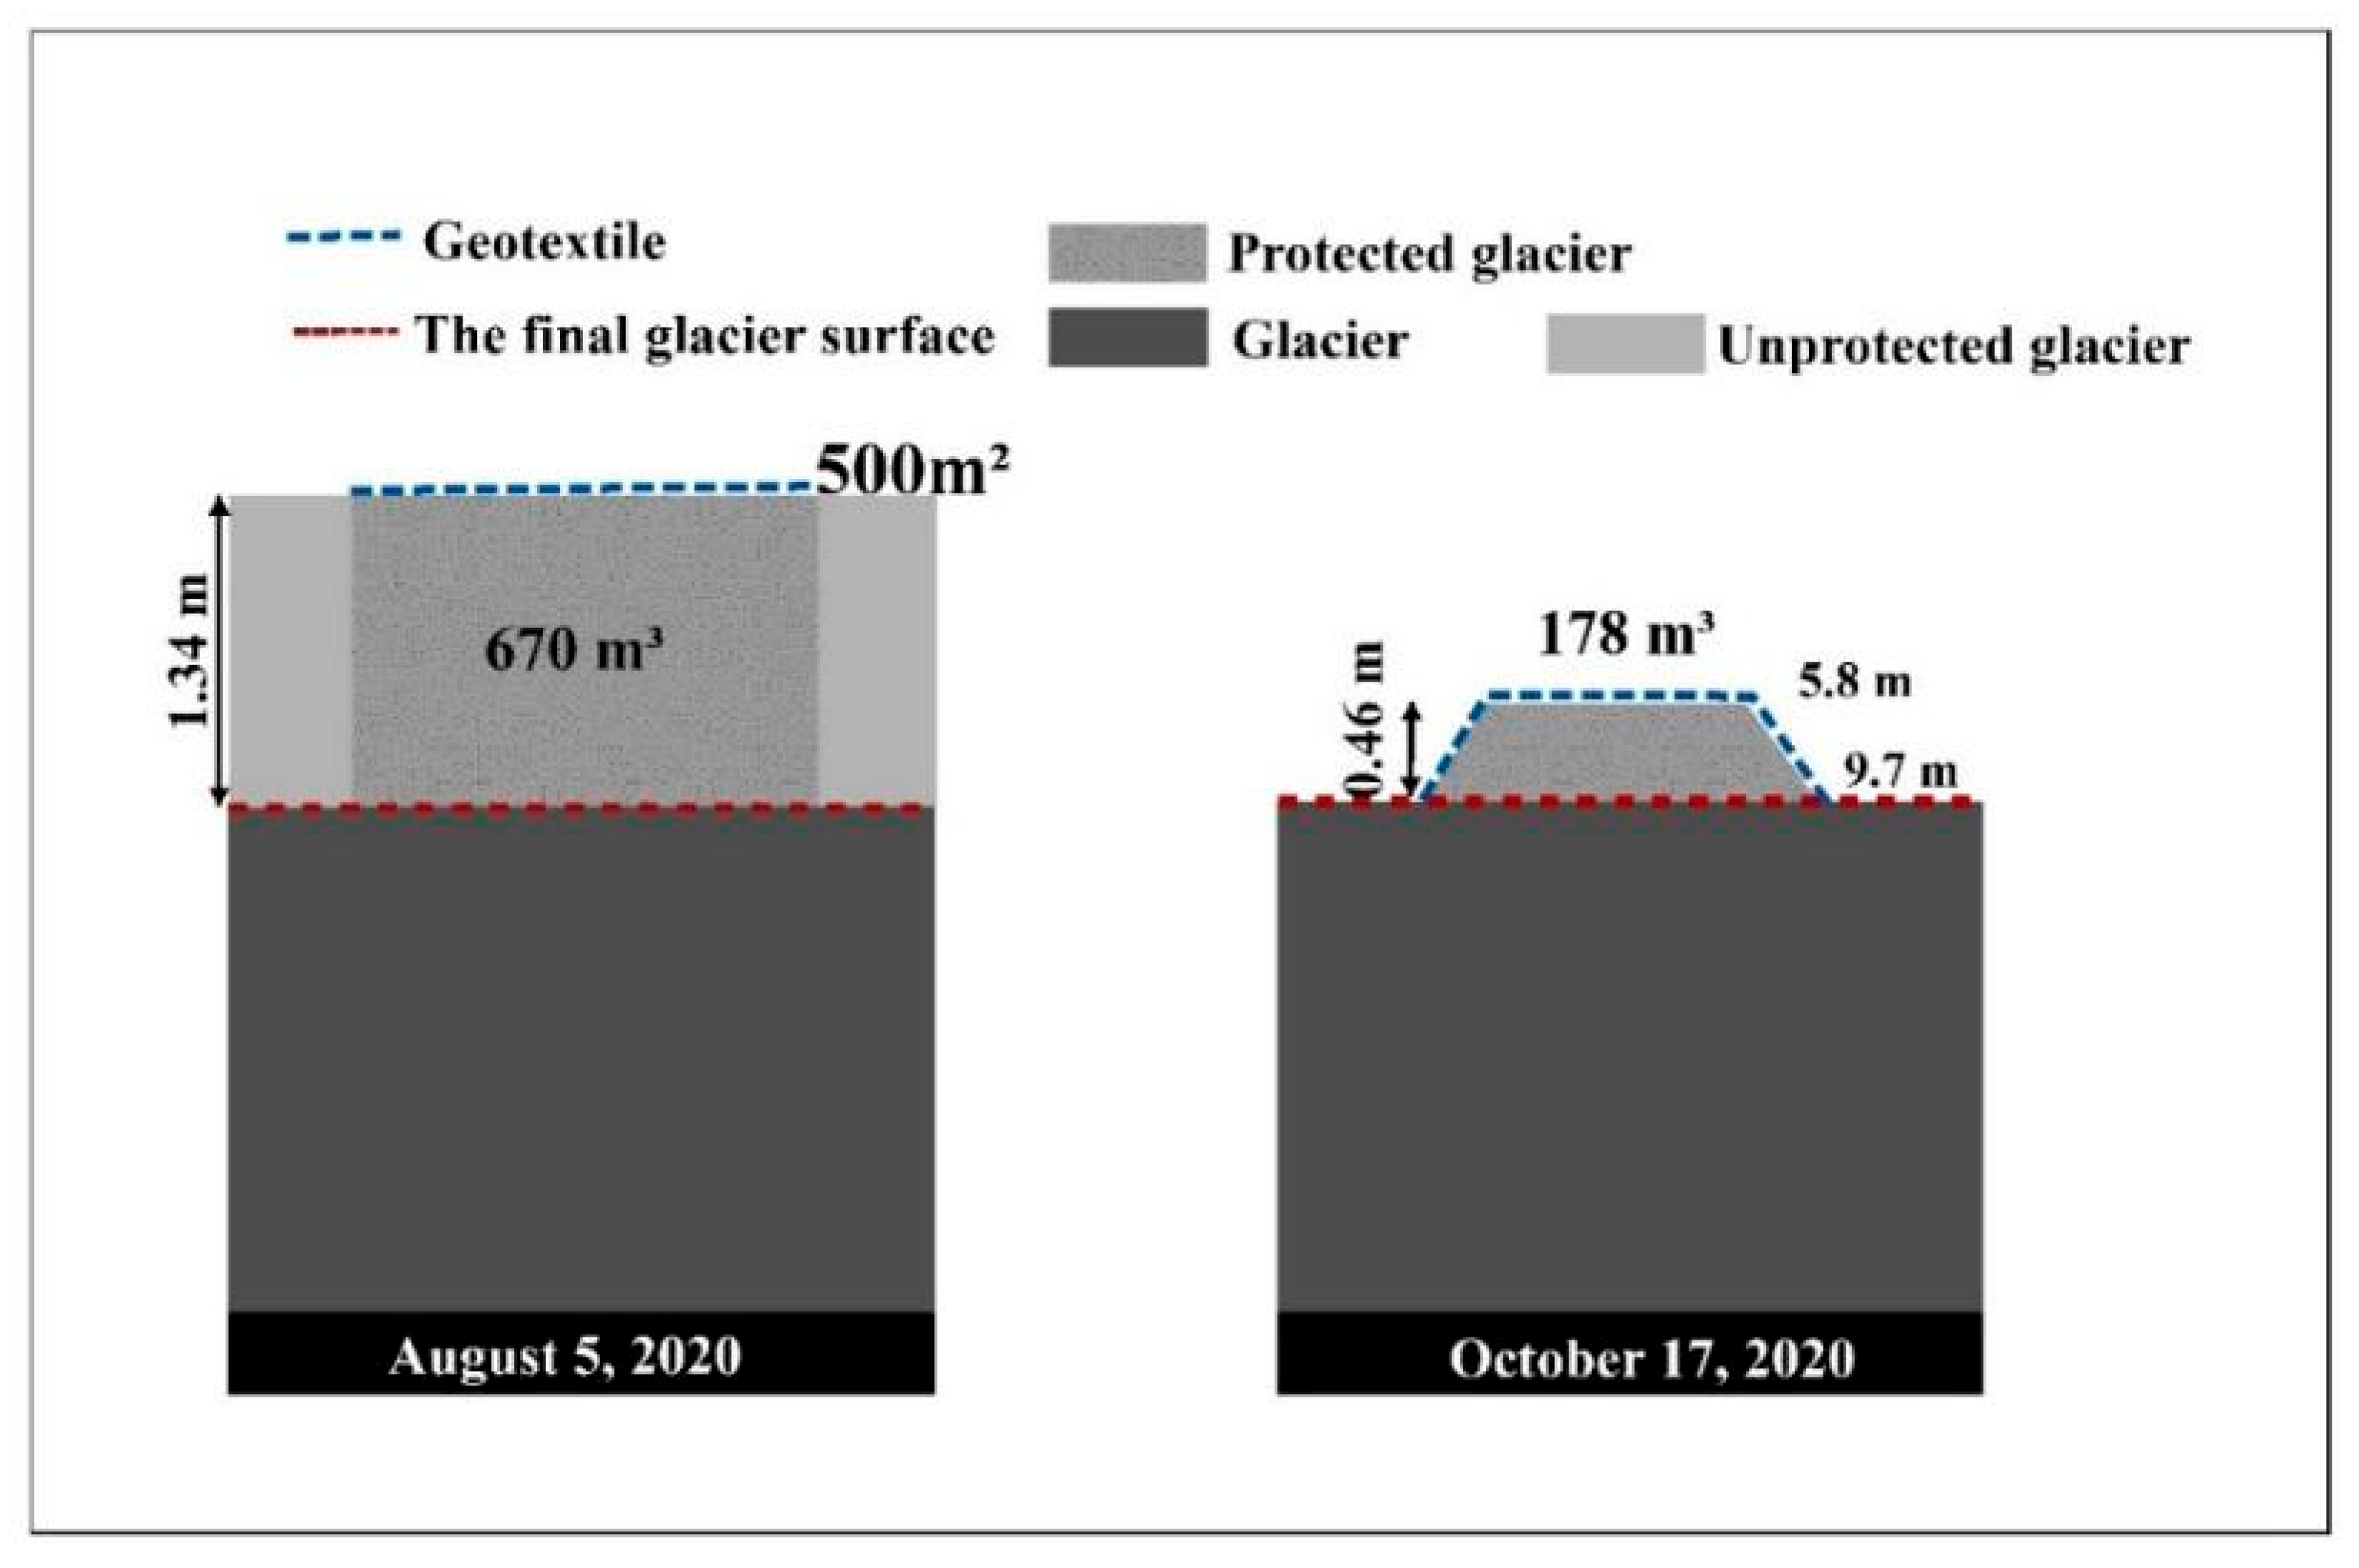
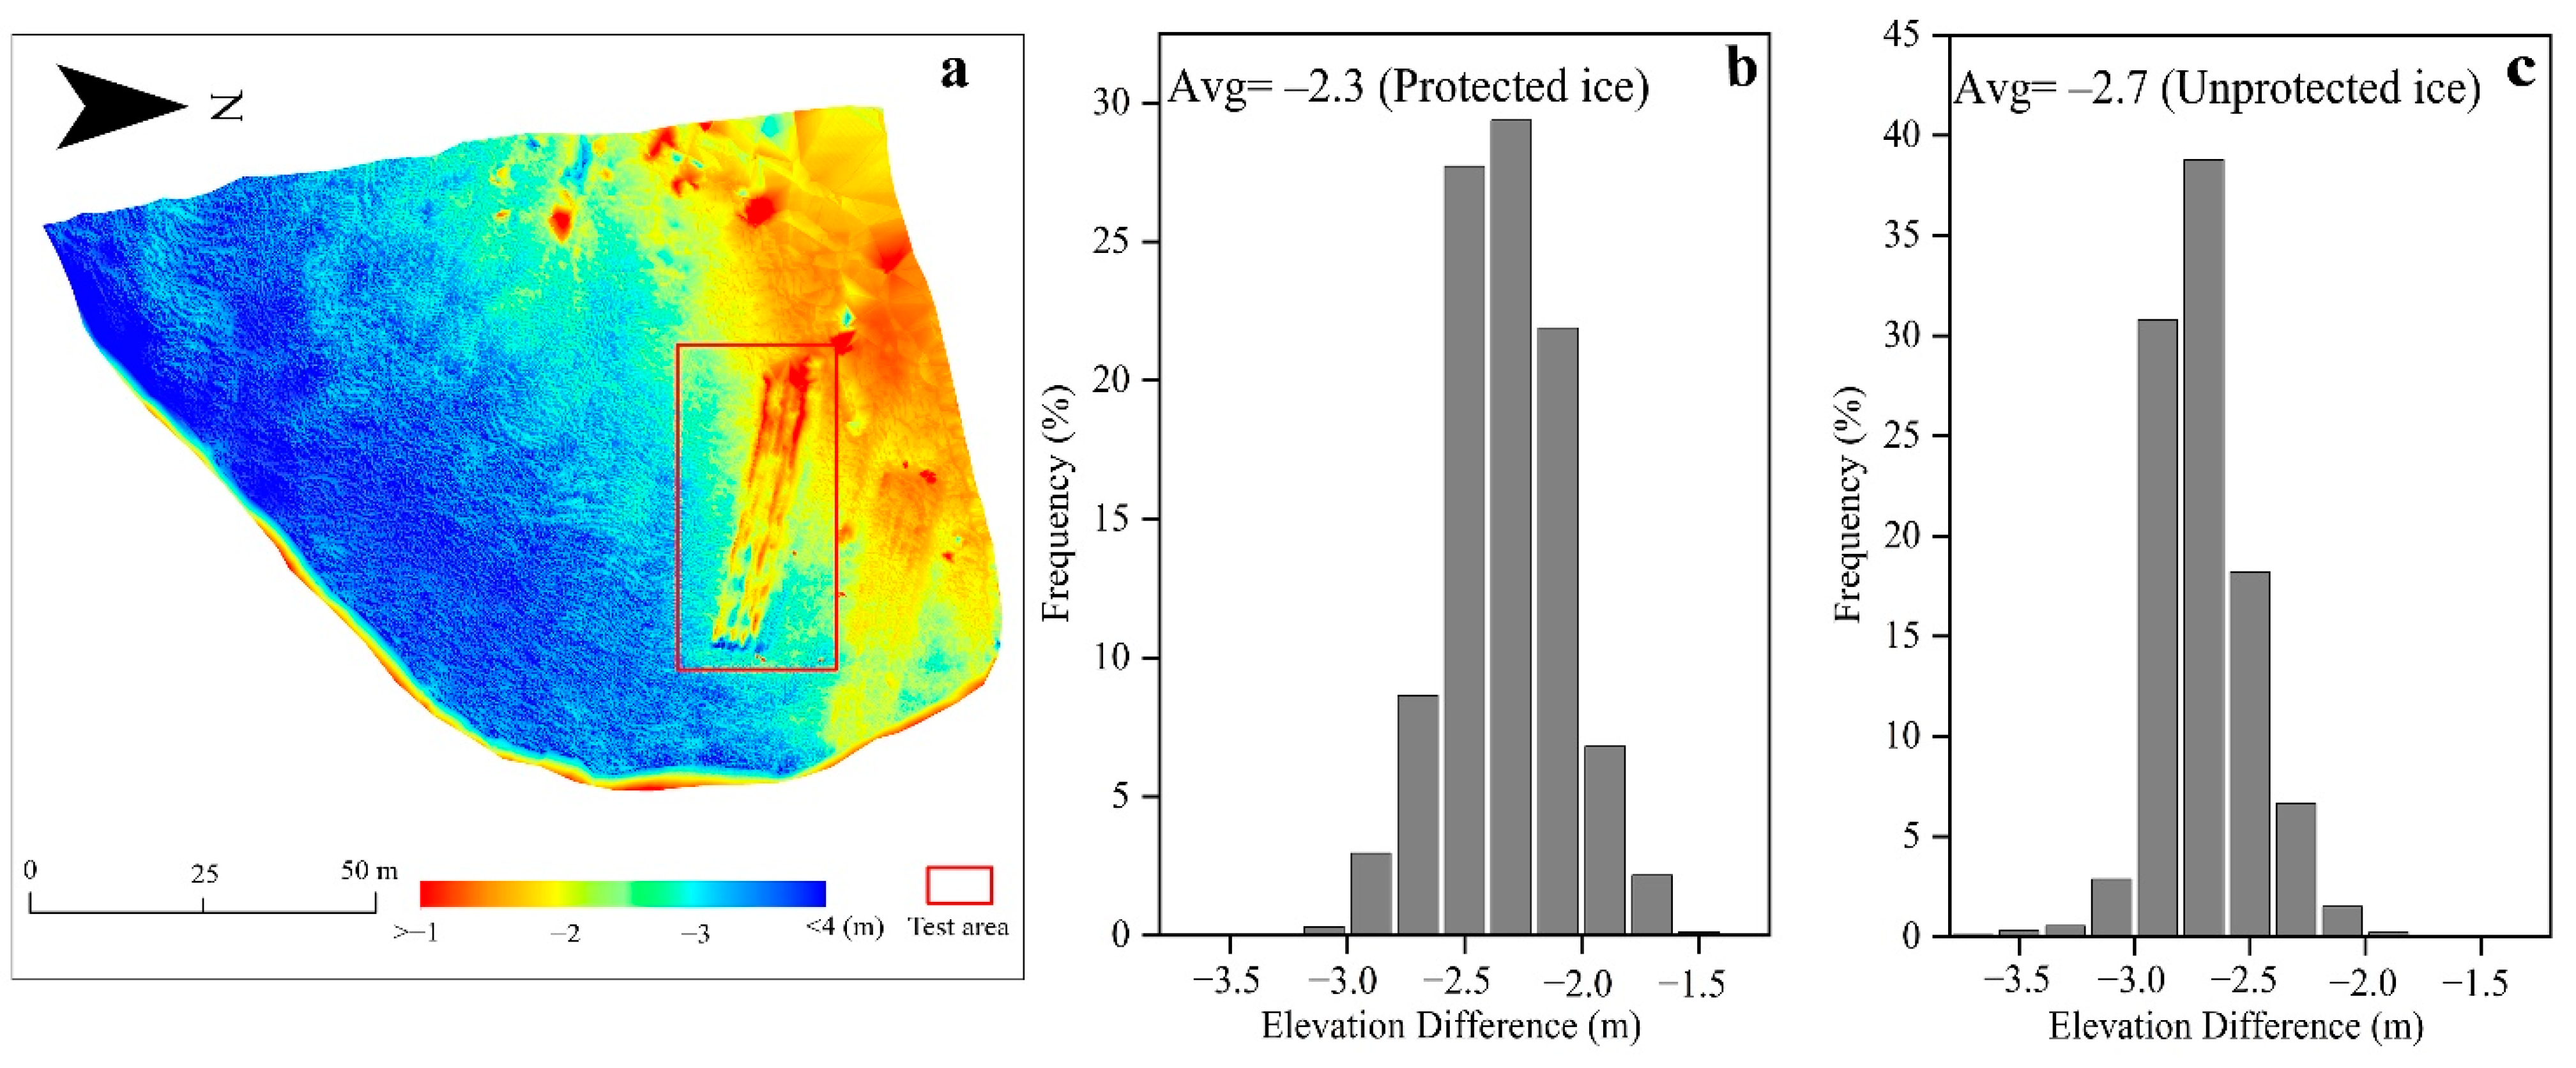
6.2. The Effects of the Geotextiles

The accelerated loss of glacier mass is mainly attributed to the increase in positive cumulative temperature, the decrease in ice surface albedo, and glacier fragmentation. Compared to the trend of increasing temperature and glacier fragmentation, ice surface albedo is more easily regulated in the short term and can be improved by artificial intervention from the perspective of solar radiation. Glacier albedo is an important physical parameter reflecting the energy balance, which is closely related to the glacier melting rate [43,44]. The geotextile is crucial for regulating the albedo of the ice surface. The ASD FieldSpec HandHeld 2 spectroradiometer was employed to investigate the reflectance data of the cover material at different periods.
Figure 10 presents the surface albedo at the geotextile and glacier surfaces. The albedo of the geotextile was 0.71 in October 2020, and this value decreased over time to 0.39 in October 2021. A gradual decrease in the albedo of the geotextile was observed, despite the insignificant trend of decreasing albedo in the later period. The albedo of the material was much higher in the early stage compared to the later stage (i.e., 26% higher in the early stage compared to the later stage). The decrease in the albedo of geotextiles indicates less ability to reflect solar radiation. In other words, the higher the solar radiation energy received by the ice surface, the faster the glacier melts. The albedo of geotextiles decreased from 71% to 39% just corresponding to the efficiency of geotextiles decreasing from 27% to 8%. The mass balance and the temperature variations of a glacier depend in part on the heat energy received or lost from the external environment—an exchange that takes place almost entirely on the upper surface. Geotextile, as mentioned earlier, is an insulating and highly reflective material. In other words, the thermal insulation and reflective capability of the material are used to reduce the heat exchange between the glacier and the environment, enabling the covered glacier surface to maintain a relatively low temperature. However, geotextile albedo decreases from 71% to 39%, causing the glacier beneath the cover to receive more radiant energy, which in turn increases the ablation rate of the covered area.
Moreover, it was speculated that the aging of the material is another reason for the decrease in its effectiveness. In particular, when light-absorbing impurities are deposited on the surface of the covering and the concentration of these impurities increases over time, it combines with the effects of other environmental factors (such as precipitation) to cause surface staining that eventually weakens the overall protective effect. In addition, geotextiles are susceptible to internal fractures under low temperatures and humid conditions, resulting in poorly insulating turbulent heat exchange between the glacier and the atmosphere. However, the effect of the aging of the cover material on its protective effect was not assessed comprehensively in the present study, and further detailed investigation is, therefore, warranted to better understand the interrelationship of these two parameters.

6.3. Comparison of Similar Experiments

Table 3 presents a compilation of studies on melting reduction achieved using geotextiles. Assessing the effectiveness of geotextiles in protecting snow and ice requires knowledge of the ablation intensity in both covered and uncovered areas. The protective ratio derived by comparing the melt over unprotected areas to the melt below the geotextile was used as the efficiency £. The value of £ = 0% indicated unaffected glacier while £ = 100% indicated complete prevention of glacier melting. Table 3 presents three groups of foreign studies conducted on the artificial reduction of glacier ablation at low altitudes (≤3200 m a.s.l.) in the Alps, with an average effect of 56% achieved, which decelerated glacier ablation by a minimum of 49%.
According to Table 3, the effect of the DG17 coverage experiment was slightly worse than that observed in other similar experiments. This could be partly attributed to the following reasons. First, the glacier ablation rates were negatively correlated with the altitude, and higher altitudes are influenced by temperature, which results in greater glacier ablation rates at lower altitudes compared to higher altitudes. Accordingly, the experimental results obtained in the Alps were superior to those obtained in the present study. Another reason for the difference between the effects achieved in the Alpine experiment and the present study could be because lower altitude ski resorts, where both ice and snow were already preserved (refer to Table 3), were selected as the experiment sites in the present study [14,15]. The resulting discrepancy was also affected by glacier scale and local climate change. Note that its area is considerably less than the similar experimental glaciers, even though similar to Alpine glaciers, resulting in more vulnerability to climate change. Furthermore, in the Alps, the snow preserved in the experiment was retained in large quantities due to the superior insulation properties of the covering material, compared to the snow in the uncovered areas that melted away during the experiment, which could also have resulted in a further pronounced effect achieved in that study. Last but not least, the Alpine trial covered an earlier period than this trial. In comparison, the present study appears to be quite preliminary and warrants future studies to be conducted considering the influence on the covering period, climatic factors, topographic factors, and elevation gradients on the effects of artificial cover on glacier melt.

6.4. Feasibility Analysis

According to the protective effectiveness achieved in DG17, it could be stated that artificial cover for reducing glacier melt is applicable to a wide range of glacier regions. In particular, the 27% protective effect of the artificial cover could be applied for active glacier protection to the other glacial landscapes in China, e.g., Hailuogou glacier, and Yulong Snow Mountain. Furthermore, the total annual glacial savings that could be achieved using the geotextile cover would be significant in the context of global warming. In terms of effectiveness, using artificial cover is undoubtedly one of the most effective approaches to mitigating glacier melt with little energy loss compared to artificial snowmaking.
However, the harsh geography of the glacier regions prevents human access to these regions, which would limit the overall application of active artificial cover. The high cost of geotextiles also limits their widespread application. In addition, the removal of geotextiles is rather difficult because of the active adsorption and freezing, which further increases the application costs and render the operation difficult. Moreover, the aging of geotextiles reduces the albedo and, ultimately, the protective effectiveness achieved using the cover. All these factors limit the extensive application of manual coverage on a large scale.
Despite the above-stated concerns, the application of artificial cover is feasible for the glaciers or glacial landscapes that are accessible. It is noteworthy that glacier melt occurs mainly at the glacier terminus, with little ablation in the accumulation zone, which is the most intense ablation area. Therefore, at the glacier terminus, it would be feasible to use active artificial cover. Within the cost constraints related to geotextiles, the artificial cover strategy could be combined with other technology-based measures, such as artificial snowfall and snowmaking, to the permissible extent to achieve further effective results. In general, reasonable and profitable glacier ablation mitigation measures should be considered separately from their theoretical large-scale application, while the use of geotextile-covered glacier protection in small glaciers, glacier landscapes, and glacier terminus should be advocated at present. Future studies should investigate the mitigating effects of using a combination of artificial snowmaking, artificial snowfall, and cover on glacier ablation zones and its applicability to partial glaciers.

7. Conclusions

The present study is a pioneer in the estimation of artificial intervention for mitigating glacier ablation throughout the year in small glaciers located at high altitudes. The area covered with geotextiles in the study region of the present study was just 0.0005 km2, which was equivalent to 1% of the total area of the DG17 landscape (0.05 km2). A comprehensive analysis of the ice volume changes in the area covered with geotextiles since 2020, through both actual measurements and imagery, revealed that a significant proportion of the ice in the study region has not dissolved. It was evident from the collected data that the installation of geotextiles reduced the rate of ablation by 15% throughout the year, although better protection was achieved in the initial period (27%) compared to the later period (8%). In the period between October 2020 and October 2021, the protective effectiveness achieved using the cover material decreased by 19% from the pre- to the post-evaluation period. In comparison to the approximate total mass loss in the Dagu glacier, the one observed in the present study was minute during the same years.
Higher albedo is an important physical parameter indicating the effectiveness of geotextiles in reducing glacier melt, as it leads to reduced energy absorption in the glaciers compared to that on the unprotected fouled glacier surfaces. In general, it appears that geotextiles exert a protective effect on glaciers precisely because of the albedo range of 0.39~0.71 to solar radiation, which explains their strong protective effect on the glaciers covered with fouled or debris-deposited portions. Indeed, the decrease in the protective efficiency of geotextiles could be well explained by the decrease in the albedo of the cover material from 70% in the pre-evaluation period to 40% by the end of the experiment. It could, therefore, be suggested that the aging of the cover material limits its effect of reducing glacial melt. According to the mechanism, the high albedo of geotextiles results in the mass reduction in glaciers. Nonetheless, a quantitative analysis of the relationship between the albedo of the cover material and the glacier ablation ratio is warranted in future studies.
The findings of the present study suggest that a considerable small-scale artificial glacier melt reduction is achievable, which would be significant for the operability of glacial landscapes, small glaciers, and glacier terminus regions. However, the evaluation conducted in the present study was relatively simple in terms of the feasibility analysis of glacier coverage. Therefore, the present study should be considered preliminary research in this area, and further investigations on glacier coverage effectiveness and feasibility should be conducted at different elevation gradients. In addition, the glacier melting reduction effect should be considered in conjunction with other technical strategies under different climatic conditions in future studies.

Author Contributions

Conceptualization, Y.X. and F.W.; methodology, Y.X.; software, Y.X.; validation, Y.X., C.X. and X.Y.; formal analysis, Y.X., C.X. and S.Y.; investigation, Y.X.; resources, Y.X.; data curation, Y.X. and X.Y.; writing—original draft preparation, Y.X.; writing—review and editing, Y.X. and S.Y.; visualization, Y.X. and C.X.; supervision, F.W.; project administration, F.W.; funding acquisition, F.W. All authors have read and agreed to the published version of the manuscript.

Funding

This research was funded by the State Key Laboratory of Cryospheric Science (SKLCS-ZZ-2022), the National Key R&D Program of China (2020YFF0304400), the National Natural Science Foundation (41721091, 42001067), and Natural Science Foundation of Gansu Province (21JR7RA059).

Data Availability Statement

Data are available upon request by email to the corresponding author.

Conflicts of Interest

The authors declare no conflict of interest.

References

  1. Su, B.; Xiao, C.; Chen, D.; Huang, Y.; Che, Y.; Zhao, H.; Zou, M.; Guo, R.; Wang, X.; Li, X. Glacier change in China over past decades: Spatiotemporal patterns and influencing factors. Earth Sci. Rev. 2022, 226, 103926. [Google Scholar] [CrossRef]
  2. Azam, M.F.; Kargel, J.S.; Shea, J.M.; Nepal, S.; Haritashya, U.K.; Srivastava, S.; Maussion, F.; Qazi, N.; Chevallier, P.; Dimri, A.P.; et al. Glaciohydrology of the Himalaya-Karakoram. Science 2021, 373, eabf3668. [Google Scholar] [CrossRef] [PubMed]
  3. Syvitski, J.; Ángel, J.R.; Saito, Y.; Overeem, I.; Vörösmarty, C.J.; Wang, H.; Olago, D. Earth’s sediment cycle during the Anthropocene. Nat. Rev. Earth. Environ. 2022, 3, 179–196. [Google Scholar] [CrossRef]
  4. Zemp, M.; Huss, M.; Thibert, E.; Eckert, N.; McNabb, R.; Huber, J.; Barandun, M.; Machguth, H.; Nussbaumer, S.U.; Gärtner-Roer, I. Global glacier mass changes and their contributions to sea-level rise from 1961 to 2016. Nature 2019, 568, 382–386. [Google Scholar] [CrossRef] [Green Version]
  5. Shen, C.; Jia, L.; Ren, S. Inter- and Intra-Annual Glacier Elevation Change in High Mountain Asia Region Based on ICESat-1&2 Data Using Elevation-Aspect Bin Analysis Method. Remote Sens. 2022, 14, 1630. [Google Scholar] [CrossRef]
  6. Wu, K.; Liu, S.; Zhu, Y.; Xie, F.; Gao, Y.; Qi, M.; Miao, W.; Duan, S.; Han, F.; Grunwald, R. Monitoring the Surface Elevation Changes of a Monsoon Temperate Glacier with Repeated UAV Surveys, Mainri Mountains, China. Remote Sens. 2022, 14, 2229. [Google Scholar] [CrossRef]
  7. Liu, L.; Jiang, L.; Jiang, H.; Wang, H.; Ma, N.; Xu, H. Accelerated glacier mass loss (2011–2016) over the Puruogangri ice field in the inner Tibetan Plateau revealed by bistatic InSAR measurements. Remote Sens. Environ. 2019, 231, 111241. [Google Scholar] [CrossRef]
  8. Bolibar, J.; Rabatel, A.; Gouttevin, I.; Zekollari, H.; Galiez, C. Nonlinear sensitivity of glacier mass balance to future climate change unveiled by deep learning. Nat. Commun. 2022, 13, 409. [Google Scholar] [CrossRef]
  9. Bosson, J.-B.; Huss, M.; Osipova, E. Disappearing World Heritage Glaciers as a Keystone of Nature Conservation in a Changing Climate. Earth’s Future 2019, 7, 469–479. [Google Scholar] [CrossRef] [Green Version]
  10. Marzeion, B.; Champollion, N.; Haeberli, W.; Langley, K.; Leclercq, P.; Paul, F. Observation-Based Estimates of Global Glacier Mass Change and Its Contribution to Sea-Level Change. Surv. Geophys. 2017, 38, 105–130. [Google Scholar] [CrossRef] [Green Version]
  11. Huss, M.; Schwyn, U.; Bauder, A.; Farinotti, D. Quantifying the overall effect of artificial glacier melt reduction in Switzerland, 2005–2019. Cold Reg. Sci. Technol. 2021, 184, 103237. [Google Scholar] [CrossRef]
  12. Fischer, A.; Helfricht, K.; Stocker-Waldhuber, M. Local reduction of decadal glacier thickness loss through mass balance management in ski resorts. Cryosphere 2016, 10, 2941–2952. [Google Scholar] [CrossRef] [Green Version]
  13. Grünewald, T.; Wolfsperger, F.; Lehning, M. Snow farming: Conserving snow over the summer season. Cryosphere 2018, 12, 385–400. [Google Scholar] [CrossRef] [Green Version]
  14. Olefs, M.; Fischer, A. Comparative study of technical measures to reduce snow and ice ablation in Alpine glacier ski resorts. Cold Reg. Sci. Technol. 2008, 52, 371–384. [Google Scholar] [CrossRef]
  15. Senese, A.; Azzoni, R.S.; Maragno, D.; D’Agata, C.; Fugazza, D.; Mosconi, B.; Trenti, A.; Meraldi, E.; Smiraglia, C.; Diolaiuti, G. The non-woven geotextiles as strategies for mitigating the impacts of climate change on glaciers. Cold Reg. Sci. Technol. 2020, 173, 103007. [Google Scholar] [CrossRef]
  16. Olefs, M.; Lehning, M. Textile protection of snow and ice: Measured and simulated effects on the energy and mass balance. Cold Reg. Sci. Technol. 2010, 62, 126–141. [Google Scholar] [CrossRef]
  17. Wang, F.; Yue, X.; Wang, L.; Li, H.; Du, Z.; Ming, J.; Li, Z. Applying artificial snowfall to reduce the melting of the Muz Taw Glacier, Sawir Mountains. Cryosphere 2020, 14, 2597–2606. [Google Scholar] [CrossRef]
  18. Geissler, J.; Mayer, C.; Jubanski, J.; Münzer, U.; Siegert, F. Analyzing glacier retreat and mass balances using aerial and UAV photogrammetry in the Ötztal Alps, Austria. Cryosphere 2021, 15, 3699–3717. [Google Scholar] [CrossRef]
  19. Goerlich, F.; Bolch, T.; Paul, F. More dynamic than expected: An updated survey of surging glaciers in the Pamir. Earth Syst. Sci. Data 2020, 12, 3161–3176. [Google Scholar] [CrossRef]
  20. Stumm, D.; Joshi, S.P.; Gurung, T.R.; Silwal, G. Mass balances of Yala and Rikha Samba glaciers, Nepal, from 2000 to 2017. Earth Syst. Sci. Data 2021, 13, 3791–3818. [Google Scholar] [CrossRef]
  21. Wei, Y.; Wang, S.; Liu, J.; Zhou, L. Multi-Source Remote-Sensing Monitoring of the Monsoonal Maritime Glaciers at Mt. Dagu, East Qinghai-Tibetan Plateau, China. IEEE Access 2019, 7, 48307–48317. [Google Scholar] [CrossRef]
  22. Wang, S.J.; Zhou, L.Y. Integrated impacts of climate change on glacier tourism. Adv. Clim. Chang. Res. 2019, 10, 71–79. [Google Scholar] [CrossRef]
  23. Wang, X.; Qin, D.-H.; Ren, J.-W.; Wang, F.-T. Numerical estimation of thermal insulation performance of different coverage schemes at three places for snow storage. Adv. Clim. Chang. Res. 2021, 12, 903–912. [Google Scholar] [CrossRef]
  24. Palmeira, E.M.; Gardoni, M.G. Drainage and filtration properties of non-woven geotextiles under confinement using different experimental techniques. Geotext Geomembranes 2002, 20, 97–115. [Google Scholar] [CrossRef]
  25. Wang, P.; Li, Z.; Li, H.; Wang, W.; Zhou, P.; Wang, L. Characteristics of a partially debris-covered glacier and its response to atmospheric warming in Mt. Tomor, Tien Shan, China. Glob. Planet Chang. 2017, 159, 11–24. [Google Scholar] [CrossRef]
  26. Mukupa, W.; Roberts, G.W.; Hancock, C.M.; Al-Manasir, K. A review of the use of terrestrial laser scanning application for change detection and deformation monitoring of structures. Survey Rev. 2017, 49, 99–116. [Google Scholar] [CrossRef]
  27. Xu, C.; Li, Z.; Wang, F.; Li, H.; Wang, W.; Wang, L.I.N. Using an ultra-long-range terrestrial laser scanner to monitor the net mass balance of Urumqi Glacier No. 1, eastern Tien Shan, China, at the monthly scale. J. Glaciol. 2017, 63, 792–802. [Google Scholar] [CrossRef]
  28. Fischer, M.; Huss, M.; Kummert, M.; Hoelzle, M. Application and validation of long-range terrestrial laser scanning to monitor the mass balance of very small glaciers in the Swiss Alps. Cryosphere 2016, 10, 1279–1295. [Google Scholar] [CrossRef] [Green Version]
  29. Prantl, H.; Nicholson, L.; Sailer, R.; Hanzer, F.; Juen, I.F.; Rastner, P. Glacier Snowline Determination from Terrestrial Laser Scanning Intensity Data. Geosciences 2017, 7, 60. [Google Scholar] [CrossRef] [Green Version]
  30. Stott, E.; Williams, R.; Hoey, T. Ground Control Point Distribution for Accurate Kilometre-Scale Topographic Mapping Using an RTK-GNSS Unmanned Aerial Vehicle and SfM Photogrammetry. Drones 2020, 4, 55. [Google Scholar] [CrossRef]
  31. Wigmore, O.; Mark, B. Monitoring tropical debris-covered glacier dynamics from high-resolution unmanned aerial vehicle photogrammetry, Cordillera Blanca, Peru. Cryosphere 2017, 11, 2463–2480. [Google Scholar] [CrossRef] [Green Version]
  32. Revuelto, J.; López-Moreno, J.I.; Alonso-González, E. Light and Shadow in Mapping Alpine Snowpack With Unmanned Aerial Vehicles in the Absence of Ground Control Points. Water Resour. Res. 2021, 57, e2020WR028980. [Google Scholar] [CrossRef]
  33. Turner, D.; Lucieer, A.; Watson, C. An Automated Technique for Generating Georectified Mosaics from Ultra-High Resolution Unmanned Aerial Vehicle (UAV) Imagery, Based on Structure from Motion (SfM) Point Clouds. Remote Sens. 2012, 4, 1392–1410. [Google Scholar] [CrossRef] [Green Version]
  34. Mölg, N.; Bolch, T. Structure-from-Motion Using Historical Aerial Images to Analyse Changes in Glacier Surface Elevation. Remote Sens. 2017, 9, 1021. [Google Scholar] [CrossRef] [Green Version]
  35. Xue, Y.; Jing, Z.; Kang, S.; Xiaobo, H.; Li, C. Combining UAV and Landsat data to assess glacier changes on the central Tibetan Plateau. J. Glaciol. 2021, 67, 1–13. [Google Scholar] [CrossRef]
  36. Zemp, M.; Thibert, E.; Huss, M.; Stumm, D.; Denby, C.; Nuth, C.; Nussbaumer, S.; Moholdt, G.; Mercer, A.; Mayer, C. Uncertainties and re-analysis of glacier mass balance measurements. Cryosphere 2013, 7, 789–839. [Google Scholar] [CrossRef] [Green Version]
  37. Xu, C.; Li, Z.; Li, H.; Wang, F.; Zhou, P. Long-range terrestrial laser scanning measurements of annual and intra-annual mass balances for Urumqi Glacier No. 1, eastern Tien Shan, China. Cryosphere 2019, 13, 2361–2383. [Google Scholar] [CrossRef] [Green Version]
  38. Huss, M.; Bauder, A.; Funk, M. Homogenization of long-term mass-balance time series. Ann. Glaciol. 2009, 50, 198–206. [Google Scholar] [CrossRef] [Green Version]
  39. Zemp, M.; Jansson, P.; Holmlund, P.; Gärtner-Roer, I.; Koblet, T.; Thee, P.; Haeberli, W. Reanalysis of multi-temporal aerial images of Storglaciären, Sweden (1959–99)—Part 2: Comparison of glaciological and volumetric mass balances. Cryosphere 2010, 4, 345–357. [Google Scholar] [CrossRef] [Green Version]
  40. Thibert, E.; Blanc, R.; Vincent, C.; Eckert, N. Glaciological and volumetric mass-balance measurements: Error analysis over 51 years for Glacier de Sarennes, French Alps. J. Glaciol. 2008, 54, 522–532. [Google Scholar] [CrossRef] [Green Version]
  41. Lamsters, K.; Jeskins, J.; Sobota, I.; Karuss, J.; Dzerins, P. Surface Characteristics, Elevation Change, and Velocity of High-Arctic Valley Glacier from Repeated High-Resolution UAV Photogrammetry. Remote Sens. 2022, 14, 1029. [Google Scholar] [CrossRef]
  42. De Gaetani, C.I.; Ioli, F.; Pinto, L. Aerial and UAV Images for Photogrammetric Analysis of Belvedere Glacier Evolution in the Period 1977–2019. Remote Sens. 2021, 13, 3787. [Google Scholar] [CrossRef]
  43. Dumont, M.; Gardelle, J.; Sirguey, P.; Guillot, A.; Six, D.; Rabatel, A.; Arnaud, Y. Linking glacier annual mass balance and glacier albedo retrieved from MODIS data. Cryosphere 2012, 6, 1527–1539. [Google Scholar] [CrossRef] [Green Version]
  44. Naegeli, K.; Huss, M. Sensitivity of mountain glacier mass balance to changes in bare-ice albedo. Ann. Glaciol. 2017, 58, 119–129. [Google Scholar] [CrossRef] [Green Version]
  45. Nestler, A.; Huss, M.; Ambartzumian, R.; Hambarian, A. Hydrological Implications of Covering Wind-Blown Snow Accumulations with Geotextiles on Mount Aragats, Armenia. Geosciences 2014, 4, 73–92. [Google Scholar] [CrossRef] [Green Version]
Figure 1. Study site. (a) Location of DG17 in the eastern Qinghai-Tibetan Plateau. (b) The extent of the monitored area with artificial melt reduction in DG17. (c) The measuring point network in 2020, a geotextile boundary was added.
Remotesensing 15 01755 g001
Figure 2. (a) Schematic diagram of the artificial cover for reducing glacier melt using non-woven geotextiles in the ablation zone (refer to [11]). (bd) The overview of the study site at the beginning and the end of the experiment.
Remotesensing 15 01755 g002
Figure 3. TLS fine scanning of DG17 with the Riegl VZ®-6000 terrestrial laser scanner (left) and process of point cloud data processing (right).
Remotesensing 15 01755 g003
Figure 4. Orthomosaic on 13 August 2021 and 14 October 2021 at DG17. The geotextile borders are indicated with red boxes, while the blue squares indicate the checkpoints.
Remotesensing 15 01755 g004
Figure 5. The schematic diagram for the protective effect of non-woven geotextile on DG17 between 5 August 2020 and 17 October 2020 (refer to [15]).
Remotesensing 15 01755 g005
Figure 6. (a) The annual surface elevation change statistics after TLS-derived DEM differencing for two consecutive years. (b,c) The corresponding frequency distribution (indicated using a red box) in the elevation change between 2020 and 2021.
Remotesensing 15 01755 g006
Figure 7. Surface DEM maps and elevation differences for the UAV surveys of DG17 conducted on 13 August 2021 and 14 October 2021. The contour lines are indicated by brown lines, and the area in the red box represents the comparison between the covered and uncovered areas depicted in Figure 8.
Remotesensing 15 01755 g007
Figure 8. Histogram illustrating the elevation changes that occurred in the protected (left) and unprotected (right) regions of DG17. The area has been outlined using the red block in Figure 6.
Remotesensing 15 01755 g008
Figure 9. Left: the spatial distribution of elevation changes in non-glacial areas; Right: the frequency distribution corresponding to the left, along with the mean (µ), the standard deviation (σ), variance (R2), and the number of pixels (N).
Remotesensing 15 01755 g009
Figure 10. The albedo of the cover materials at different stages and that of the snow and ice surfaces. Albedo of clean snow and dirty ice is observed in August 2020 and August 2021. The average value is in parentheses in the legend.
Remotesensing 15 01755 g010
Table 1. Riegl VZ®-6000 TLS surveying parameters of DG17.
DateScanning Range (m2)Number of PointsPoint Density (m−2)Angle Increment (°)Numbers of Scans
17 October 20202,140,6579,013,7904.210.021
14 October 20211,997,9447,893,1983.950.021
Table 2. Details of the UAV coverage area, flight-related information, and UAVs’ error during the flight over DG17.
Date 13 August 2021 14 October 2021
Coverage (km2)0.0090.122
Flight altitude (m)100200
Resolution of orthomosaic/DSM (cm)0.82.5
Number of photos taken/valid photos257/263370/397
Number of checkpoints used56
RMSE Z error (m)0.020.06
Errors between GNSS and DEM elevations in vertical direction (m)0.070.11
Table 3. Studies documenting the local melt reduction by geotextiles. £ refers to the percentage reduction in melting compared to an uncovered location. εsnow refers to the presence of snow under the cover. εice refers to the fact that there is only ice under the cover.
Glacier (Country) Tested Period Latitude
(N)
Longitude
(E)
Altitude
(m a.s.l.)
Area
(m2)
εicesnow £
(%)
Source
Dosdè Est (Italy)15 May 2008–4 October 200846°23′10°13′2800150εsnow, εice69[45]
Presena Ovest (Italy)15 May 2008–4 October 200846°13′10°34′2765600εsnow, εice49[14]
Mount Aragatz (Armenia)29 June 2012–22 June 201340°28′40°28′320020,000εsnow, εice57[15]
DaGu No.17
(China)
5 August 2020–17 October 202032°13′ 102°45′4830500εice27This paper
DaGu No.17
(China)
17 October 2020–14 October 202132°13′102°45′4830500εice15This paper
Disclaimer/Publisher’s Note: The statements, opinions and data contained in all publications are solely those of the individual author(s) and contributor(s) and not of MDPI and/or the editor(s). MDPI and/or the editor(s) disclaim responsibility for any injury to people or property resulting from any ideas, methods, instructions or products referred to in the content.

