Abstract
This paper presents the results of a multiyear program conducted in Khiva, by a research team from the University of California, Berkeley (USA) and Urgench State University, Urgench (Uzbekistan). It was focused on the Juma (Djuma) Mosque in Itchan Kala (Khiva, Uzbekistan). The main objective was to generate a digital twin of the mosque, with an accuracy of a few millimeters, by utilizing a laser scanner. The idea of a digital twin was expanded further, to ensure that the physical properties and structural response of the digital twin were closely correlated to that of the actual object. To achieve this objective, the following was conducted. First, a laser scanning of the historic monument was conducted. The laser scans were collected by a terrestrial laser scanner. Subsequently, a study of the monument’s structural response was conducted in ambient vibration tests that focused on measuring the resonant frequencies of the mosque’s minaret. Based on all of the information collected during both field studies, a sophisticated finite element model of the minaret was developed. The calibration of the model was based on the results of the ambient vibration study. The performance of the model was shown to be close to that of the actual monument. The digital twin and associated numerical model will be used in structural health monitoring, numerical predictions of the structural performance, and in the development of restoration strategies.
1. Introduction
Literature review. This paper discusses the results of a combined application of terrestrial laser scanners (TLS), ambient vibration tests, and finite element modeling. A short review of relevant papers is presented in this section. Terrestrial laser scanners are commonly used means for registration of the geometry of infrastructure, and its monitoring. An extensive review of TLS applications for bridges is provided in [1]. An application of TLS to a detailed bridge information model (BrIM) is discussed in [2]. An extensive review of the application of remote sensing techniques to heritage buildings can be found in [3]. An application of TLS to document a heritage building in Uzbekistan was the objective of [4]. There are several papers focused on ambient vibration studies of tall masonry towers [5,6,7]. Results of finite element modeling and ambient vibration tests of minarets are discussed in [8,9,10,11]. The application of TLS to heritage monuments, with subsequent numerical modeling, is a commonly used approach for the preservation and prediction of their structural performance [12,13,14].
Background and motivation. Itchan Kala is one of the few historic cities in the world with an active working population. Because of its unique status, the city was included in UNESCO’s heritage list in 1990 [15]. This inner fortress of the old Khiva oasis represents a good example of the well-preserved architecture of Central Asia. There are many outstanding monuments inside Itchan Kala, including the Juma Mosque. The latter was studied in this extensive project. The Juma Mosque and its minaret have been studied from a structural point of view by many authors [16,17]. A laser scanning project of the interior of the Juma Mosque’s courtyard was conducted by a research team from Poland [18]. A structural assessment of the monument’s current condition is discussed in [19]. In the first phase of the project, the monument was studied by means of laser scanning. The objective of this phase was to obtain the geometry of the object with a high accuracy. A few results of this phase of the project were discussed in [20]. Based on the geometry obtained from the point clouds collected by the laser scanner, a simplified model of the minaret was created, which was discussed in [21]. This simplified model was used to optimize the placement of the accelerometers used in the ambient vibration study. In the next publication [22], a simplified finite element model of the complete structure of the monument was generated, an analysis of which showed that the frequencies of the walls are much greater than the first resonant frequencies of the minaret. It was shown that ambient vibration tests were necessary to generate a model that matched the physical performance of the actual minaret. In the final phase, an ambient vibration study of the monument was performed, and the resonant frequencies of the minaret were measured. As a logical continuation of the previous publications, this paper is focused on creating a sophisticated model of the minaret, that consists of the core tower, with a staircase connecting the tower to the outer wall of the minaret. This model fully replicates all of the imperfections of the minaret obtained by the laser scanner. The material parameters of the model are adjusted in such a way that its resonant frequencies closely match those of the actual minaret. The motivation of the paper is based on the overall goal aimed at a generation of live digital twins of all major monuments inside of Itchan Kala, that combine accurately documented geometry with finite element modeling of the monuments. This paper is one step toward this overall goal. The finite element models can be used for the development of preservation and restoration strategies. The geometry, and the respective models, will be continuously updated based on changes in geometry due to aging or reconstruction efforts. In addition, the finite element models will be updated based on the non-linear performance of the monuments during large seismic events, based on data from permanently installed seismic monitoring equipment (similar to [23]). A detailed discussion of the results is presented below.
2. Laser Scanning of the Monument
2.1. Laser Scanning Procedure
Laser scanning of the Juma Mosque was conducted in December 2020. A terrestrial laser scanner, C10 from Leica Geosystems [24], was used for this study. The point clouds were collected from eleven positions, the so-called stations. The final stitching of the point clouds from all scanner positions was conducted in Cyclone, from Leica GeoSystems [25]. The point clouds from all stations were cross-correlated and combined into a single point cloud, the so-called registration. The registration was conducted without the utilization of the laser targets and was based on point cloud to point cloud registration, which is one of the options in Cyclone [25]. It was ensured that the average overlap error does not exceed 10 mm. The analysis of the fully-registered point cloud was conducted in the Matlab environment [26]. The paper presents the results not previously discussed. For prior published results see [20,21,22]. The latter publications reflect the results of the preparatory steps. These steps were needed to achieve the results presented in this paper. Figure 1a shows a Google Maps view of the monument. An isometric view of the monument’s point cloud is presented in Figure 1b.
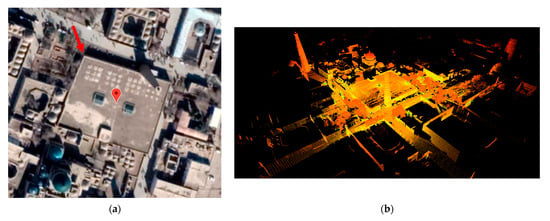
Figure 1.
Views of the monument: (a) Google Maps view of the monument [22]; (b) isometric view of monument’s point cloud.
Two point cloud views are shown in Figure 2. A view from the top is presented in Figure 2a and a view from the north wall is presented in Figure 2b.
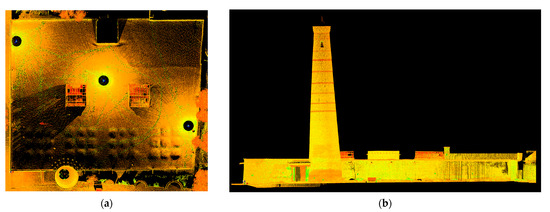
Figure 2.
Elevation views of the monument’s point cloud: (a) plan view from the top; (b) elevation view from the north wall.
During the laser scanning phase of the project, the global orientation of the walls was measured. The measurement was done during the project’s second phase, in October 2021. As shown in Figure 3a, the orientation was estimated by a digital compass application available on Android phones and iPhones. As presented in Figure 3b, the north wall’s orientation is seven degrees off from the east–west (EW) orientation.
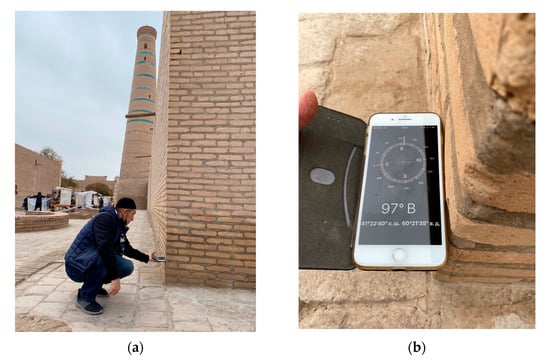
Figure 3.
Estimation of the north wall’s orientation by an iPhone: (a) team member holds iPhone parallel to the wall; (b) angle measured by digital compass.
The images presented in Figure 3 were taken at the northwest (NW) corner of the monument, indicated by a red arrow in Figure 1a. In January 2022 the north wall’s orientation angle, obtained by a mobile phone, was re-evaluated using surveyor-grade equipment. These measurements were in good agreement with the angle measured by a digital compass. Based on this result, the orientation of the monument’s point cloud was corrected, by introducing this angle with respect to magnetic north.
To simplify the discussion presented in this paper, a special local coordinate system was introduced, with its origin at the bottom of the monument’s northeast (NE) corner. The orientation of the point cloud was adjusted to ensure that the point cloud was oriented correctly with respect to magnetic north. The isometric and plan views of the monument, with the correct orientation to magnetic north, are presented in Figure 4. In these images, the direction to magnetic north coincides with the negative direction of the y-axis, as presented in Figure 4b. This image is similar to an image published earlier [19], with the main difference that Figure 4b presents the point cloud in the coordinate system with correct orientation with respect to magnetic north shown by red arrow.

Figure 4.
Point cloud of the minaret, adjusted for the global orientation of the walls: (a) point cloud with a horizontal section shown in magenta; (b) plan view of the horizontal slice at an elevation of 3.5 m.
2.2. Analysis of Point Cloud: Window Locations
Further detailed measurements of the minaret were conducted in January 2022. These detailed measurements were needed for the finite element modeling of the minaret. A simplified numerical model of the minaret, without consideration of its core tower and the staircase, was created earlier [22]. The results of that study [22] were used to establish the optimal locations of the accelerometers to measure vibration modes during the ambient vibration study. This section of the paper focuses on the more detailed measurements of the minaret’s interior, which were necessary to establish the geometry of the staircase, the radius of the core tower, and the thickness of the outer wall.
The minaret has six window openings (excluding four large windows at the very top). Based on the point cloud shown in Figure 5, it seems that the minaret has more windows. It was discovered by the research team that a few of these are false windows, that had been bricked in on the interior.
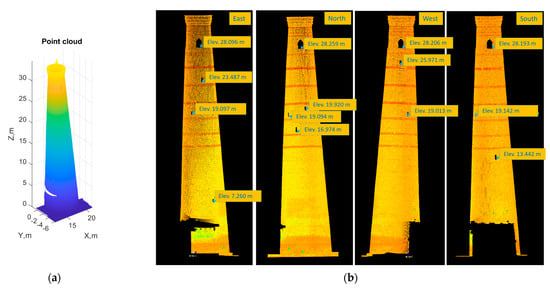
Figure 5.
Juma minaret: (a) point cloud (Matlab) [26]; (b) window elevations from the east, north, west, and south sides (Cyclone).
The windows are critical components for an accurate estimation of the radius of the core tower and the thickness of the outer wall, and, as such, knowing their elevations was very important for the model development. The windows are easier to study when the conical surface of the minaret is unwrapped into a plane image. The unwrapped representation of the minaret’s point cloud provides two major advantages, and is commonly used for point clouds with a shape close to a cone or a cylinder [27,28]. First, it allows the location of each opening to be measured with respect to the orientation of magnetic north. Second, the elevation of each opening can be measured from a single unwrapped plot. As presented in Figure 6a, the outer surface has been cut along its north line (in magenta) and unwrapped. As a result, the points of the minaret’s surface are presented in a plane, with a horizontal axis showing the angle of the point to magnetic north, as presented in Figure 6b. The window elevations can be clearly estimated from this unwrapped surface, as presented in Figure 6b, and are indicated by magenta dashed lines. Each dashed line shows each window’s lowest point. It is worth noting that the unwrapped surface also provides accurate information about the orientation of each window, with respect to magnetic north. This image is similar to an image published earlier [21], with the main difference that Figure 6b shows the unwrapped surface in the coordinate system with correct orientation with respect to magnetic north.
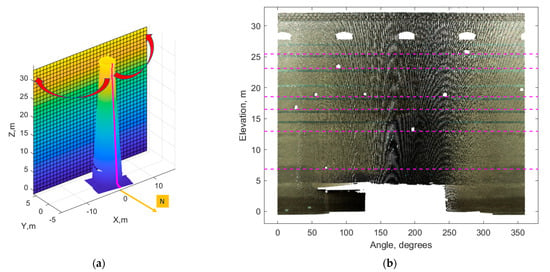
Figure 6.
The unwrapped outer surface of the minaret with the elevations of all windows: (a) procedure of unwrapping the outer surface; (b) unwrapped surface (shifted by 180 degrees, so the north direction starts at 0 degrees and ends at 360 degrees): dashed lines indicate the window elevations.
3. Manual Measurements of the Monument
3.1. Spiral Staircase: Angle of Each Stair
The dimensions of the staircase inside the minaret were obtained via manual measurements. The stairs are very irregular, so the plan was to model them in a simplified way. Hence, the accuracy of manual measurements was sufficient for the generation of the minaret’s finite element model. The finite element model will be updated later when the staircase is laser scanned by TLS in future phases of the project.
The minaret has 82 stairs. The first stair starts in the courtyard of the minaret, as shown in Figure 7a. The staircase is constructed as a spiral structure, that connects the core tower to the exterior wall. This shape can be accurately represented by a tapered hollow cone. The next step of the field studies was focused on measuring the orientation of each stair, with respect to magnetic north. A schematic image showing how the measurements were taken is presented in Figure 7b.
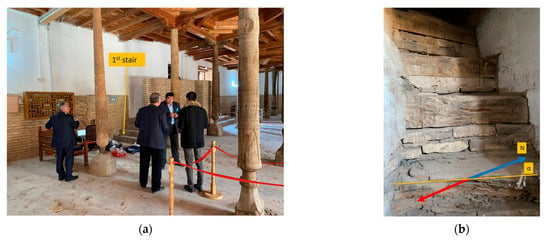
Figure 7.
Starting stair and the procedure for the angle measurement of each stair: (a) view of the first stair; (b) schematic of the angle measurement.
The angle of each stair to magnetic north was measured by a surveyor-grade compass, as presented in Figure 8a. A summary of these measurements is presented in Figure 8b. A long ruler was used to average the angle measurement over the larger surface of each stair. The ruler was placed at the top edge of each stair. Based on the analysis of these measurements, the following was concluded. First, the orientation of the first stair is very close to 180 degrees to magnetic north. Second, the angles steadily change after the first stair, with an increment that gradually increases toward the top. Third, the staircase spiral has one half-turn (180 degrees) for the bottom stairs and three full-turns (360 degrees) for all remaining stairs.
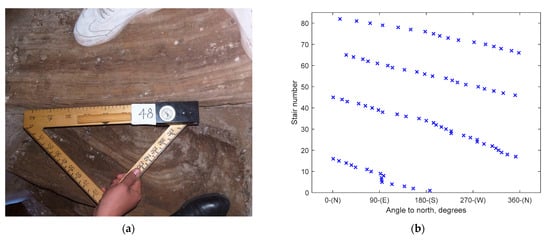
Figure 8.
Measurements of each stair’s orientation: (a) typical measurement (stair no. 48 is shown); (b) angles of all stairs.
The conclusion regarding the increase in the increments between the stair angles when elevation increases, is confirmed by the results presented in Table 1. This table shows the number of stairs in each 180-degree turn. As presented in this table, the number of stairs in each 180-degree turn steadily decreases toward the top of the minaret. This can be explained by the fact that the radius of the spiral decreases as the elevation increases.

Table 1.
Estimated number of stairs in each 180-degree turn.
3.2. Spiral Staircase: Width of Each Stair
In addition to the angle measurements, the width (W) of each stair at the inner surface of the outer wall was measured. It is worth noting that, for the spiral staircase, this area represents the widest side of the stair, as shown in Figure 9a. A summary of the results is presented in Figure 9b. Based on the results of the measurements, the following was concluded. The width of the stairs has a somewhat limited variation over elevation; it varies from approximately 0.69 m to approximately 1.11 m, if one of the narrowest stairs (no. 25) is excluded. If this outlier is excluded the mean width is computed as 0.83 m, with a coefficient of variation (COV) of 11.2%.

Figure 9.
Width measurements of each stair: (a) schematic of measuring procedure; (b) widths of all stairs.
3.3. Spiral Staircase: Height of Each Stair
In addition to the angle and width measurements, the height (H) of each stair was measured. The measurement was taken where the stair had the greatest height with respect to the previous stair, as presented in Figure 10a. A summary of the results is presented in Figure 10b. Based on the results of the height measurements, the following was concluded. First, the height of the stairs does not change in a significant way with elevation. Second, it varies from about 0.17 m to about 0.41 m, if the tallest stair (no. 82) is excluded. Third, if this outlier is excluded, the mean height is computed as 0.30 m, with a coefficient of variation (COV) of 15.1%.
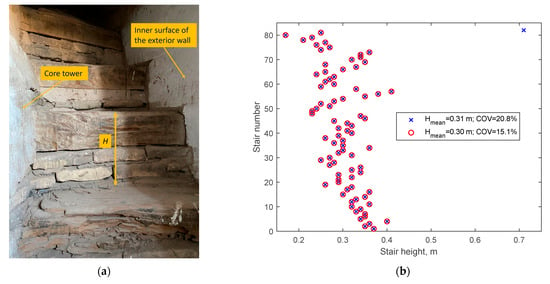
Figure 10.
Height measurements of each stair: (a) schematic of measuring procedure; (b) heights of all stairs.
4. Manual Measurements Combined with Analysis of Point Cloud Data
Diameter of the Core Tower and the Thickness of the Minaret’s Outer Wall
The exterior shape of the minaret was modeled based on an analysis of the point cloud. This was achieved by introducing horizontal sections of the point cloud with the same increment throughout the minaret’s elevation. The sections were best fit to circles, by utilizing the nonlinear least squares Gauss–Newton method [29] in the Matlab environment. A typical case is presented in Figure 11a. In addition, the deviations from the circle were estimated, which was normalized to the radius of the circle. As shown in Figure 11b these normalized deviations did not exceed 4%. Similar to [30], these relatively small values of the normalized deviation confirm that the cross-sections can be closely represented by circles.
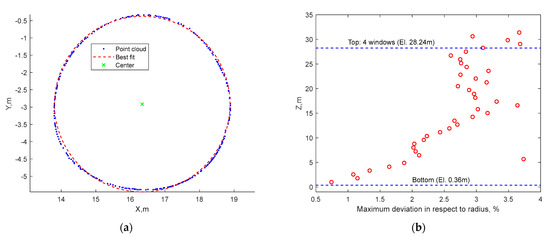
Figure 11.
The proximity of the horizontal cross-sections to circles: (a) typical cross-section (elevation of 16.59 m) with a best fit circle; (b) normalized deviations over the elevation.
The laser scans were conducted from the outside of the minaret, and, as such, the diameter of the core tower and the thickness of the minaret’s outer wall were not captured. Therefore, manual measurements at the elevations of the windows were conducted. The main reason for selecting these elevations was that the window opening allows for measuring the thickness of the wall and the distance between the core tower to the wall, as presented in the schematic of Figure 12a. In addition, the orientations of the window openings with respect to magnetic north were measured. The latter measurement was used to eliminate from consideration the false window openings. The window elevations were obtained from the point cloud (see Figure 6b). The results are presented in Figure 12b. This plot shows the radii of the minaret’s outer surface estimated by best fitting its horizontal cross-sections of the point cloud to circles [21]. These radii (shown by magenta crosses) were calculated with a consistent elevation increment from top to bottom of the minaret. The corresponding radii at the window elevations are shown by blue squares. The thickness of the outer wall was measured at the elevations of the windows and is presented in this plot by magenta circles. The core’s radius at each elevation was calculated in the following way. First, the thickness of the wall and the length of the stair (in the radial direction of the minaret) were added together. Second, this total was subtracted from the minaret’s radius at this elevation. The respective results for all stairs are shown by green triangles in Figure 12b.
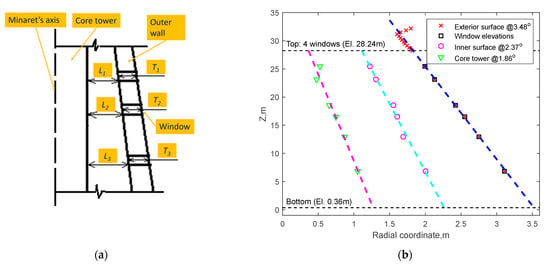
Figure 12.
Measurements at window elevations: core tower and wall thickness: (a) schematic; (b) measured core tower and wall thickness.
Based on the linear regression analysis of the wall thickness and the core radius estimates, a few conclusions were made, which are presented in Figure 12b and Table 2. First, the taper of the outer wall with respect to the minaret’s axis, is close to 3.52 degrees. It is very consistent over more than forty elevation points used in this analysis, because the R-squared coefficient of the regression analysis was very close to 1. Second, the taper of the inner surface of the wall is about 2.37 degrees, with respect to the same vertical axis. This estimate is quite consistent for six window elevations, with the R-squared coefficient at 0.9878. Third, the taper of the core tower was estimated at 1.86 degrees, and it was not as consistent as the other measurements, with the R-squared coefficient at 0.9661.

Table 2.
Results of linear regression analysis for taper estimates.
5. Ambient Vibration Study
5.1. Ambient Vibration Test Procedure
An ambient vibration study represents a very important tool for obtaining the physical properties of an object when only non-destructive measurements are allowed. The use of only non-destructive measurements is the case for many heritage monuments, including the Juma Mosque’s minaret. Hence, an ambient vibration study was performed at this historical site.
The ambient vibration study of the minaret in the Juma Mosque monument was conducted in October 2021. Accelerometers with high sensitivity were used. In the case of the ambient vibrations, the amplitude of the vibration on the top of the minaret was about 0.003–0.004 g (for unfiltered records) which was close to those measured in a similar project by one of the authors of this paper [31]. In the latter publication, high-sensitivity velocimeters were utilized and they are bulky and difficult to use. In this project, PCB 393B05 accelerometers [32], from PCB Piezotronics, were used. These accelerometers are significantly smaller and easier to use.
In addition, human-induced forced vibrations of the minaret were studied. In this case, the forced excitation was caused by a simultaneous jump by a group of people. Six people, with a total weight of about 360 kg, created an impact on the ground, approximately 2 m from the minaret’s bottom. The total number of accelerometers was limited to seven and they were installed in a few configurations. Only one configuration is discussed herein (configuration 2), as summarized in Table 3. The table shows the accelerometer’s number, its location, and its global orientation (NS stands for the north–south axis and Z stands for the vertical axis).

Table 3.
Location and orientation of accelerometers.
As presented in the flowchart shown in Figure 13, the acceleration data was processed in the following way. First, a trapezoidal filter [33] was applied in the frequency domain, to remove noise at very low and very high frequencies. Second, the fast-Fourier-transformation (FFT) was applied to the filtered time history at each level. This transformation was conducted in the Matlab environment [26]. Third, the transfer functions were computed by dividing output FFT by input FFT for each direction of measured vibrations. Fourth, at the final stage, a smoothing function was applied to the obtained transfer functions. The smoothing function was based on the calculation of a moving average of seven neighboring points.
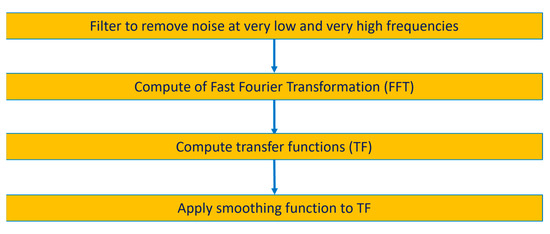
Figure 13.
Flowchart of ambient data processing.
5.2. Ambient Vibration Test Results
Since powerful forced vibration equipment is not allowed inside Itchan Kala, it was decided to conduct a few forced vibration tests under human-induced excitations. Because the level of excitation in both forced and ambient testing was about the same, all test configurations produced similar results. Only typical results for configuration 2 are discussed in the paper. In this case, all seven accelerometers were utilized. Four were assembled on special attachment cubes in pairs, to capture accelerations in both principal horizontal directions. The first set of two accelerometers was installed at the bottom of the minaret, on the ground level, as summarized in Table 3. The second set of two accelerometers was installed in the third window. The remaining three accelerometers were assembled on the attachment cube, to ensure that accelerations in all three principal directions were captured. The photos showing some typical installations of the accelerometers are presented in Figure 14.
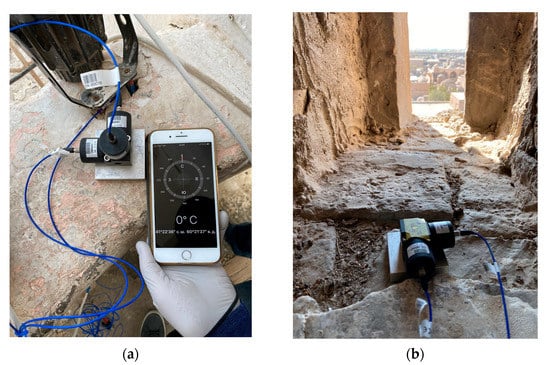
Figure 14.
Sets of accelerometers installed at two elevations of minaret: (a) top window; (b) two-accelerometer set, in a window at mid-level.
The data processing and analysis of the ambient vibration tests were based on commonly used techniques (see [5] as a representative example).
Typical results for the first and the second modes of vibration are presented in Figure 15 (Run029 stands for data file number 29). The plots show transfer functions (TFs) for the first and the second modes of vibration. Since TF is a ratio of the FFT of the input to that of the output of any mechanical system, it indicates an amplification of the response, which peaks at resonance frequencies. Due to its definition, it is unitless. It is worth noting that the first resonant frequency is lower in the NS direction when compared to that in the EW direction. This corresponds to the fact that the minaret is connected to the courtyard’s walls, which run in the EW direction. Because these walls provide an additional stiffness, the resonant frequency in the EW direction is greater than that in the NS direction.
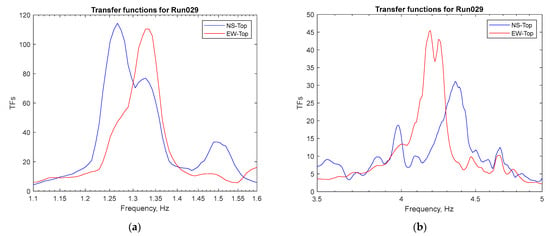
Figure 15.
Typical results of resonant frequency estimates: (a) 1st mode of vibration; (b) 2nd mode of vibration.
A summary of the results is presented in Table 4. The frequencies are obtained from four test runs, with the coefficient of variation less than 1.7%. In other configurations, a human-induced excitation was used. The results show that for these higher excitations, the resonant frequencies are slightly lower than those for the ambient vibrations. This was observed earlier for other buildings [34].

Table 4.
Summary of ambient test results.
6. Finite Element Modeling
6.1. Core Tower and Outer Wall without Staircase
Based on the measurements and associated discussions presented above, the minaret’s structure consists of two masonry substructures: (1) the core tower and (2) the outer wall. Based on the results presented in Figure 12b, the former can be closely represented by a truncated solid cone, and the latter can be very closely represented by a truncated hollow cone, with a wall thickness that gradually changes over the elevation. As the first step of modeling, these two substructures were modeled in SAP2000 [35], to estimate their standalone frequencies and to assess how the staircase is affecting these frequencies, by combining both substructures into a single system. For this part of the study, the crown of the minaret was not modeled.
6.2. Spiral Staircase
The stairs in the Juma minaret are constructed from large timber members, as shown in Figure 16. A space between the timbers is filled with bricks and mortar. The timber members were modeled by the so-called frame elements, in the SAP2000 terminology [35]. The material properties of the timber were adapted from [36], which studied a few ancient mosques built from timber in Turkey. The material properties of the timber in these ancient structures were obtained via tests conducted in a laboratory environment and ultrasonic tests conducted in situ.
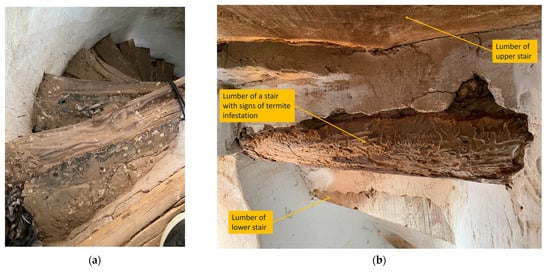
Figure 16.
Construction details of the staircase: (a) typical view of a stair’s top; (b) typical view of a stair’s bottom.
The bricks and the mortar between the timber members were accounted for by adding an additional mass to each stair, while assuming that only the timber established a structural connection between the substructures. In an earlier study [37], it was shown that a small deviation in the modeling of the staircase has a negligible effect on the minaret’s overall structural performance. Hence, the FEM of the staircase was based on the manual measurements, and this accuracy was considered acceptable as the first step in modeling the minaret. The finite element models of the substructures and the staircase are presented in Figure 17.
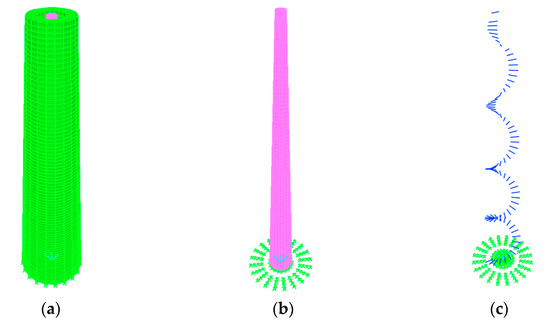
Figure 17.
Major components of finite element model: (a) core tower with outer wall; (b) core tower only; (c) staircase.
A modal analysis was performed to estimate the resonant frequencies, which are summarized in Table 5. As evident from the table, the core tower has the lowest first mode frequency, which is much lower than that for the structure with a staircase. The first mode frequency for the outer wall is greater than that of the fully integrated structure. Once the core tower and outer wall are connected to each other, the first resonant frequency of the fully integrated structure becomes very close to, and slightly under, the corresponding frequency of the outer wall. The same conclusion can be made regarding the second mode frequency. The torsional frequency of the fully integrated structure is almost the same as that of the outer wall. In this analysis the material properties of the calibrated model (discussed below) are utilized. This part of the study was undertaken to show how each substructure participates in the dynamic performance of the fully integrated structure.

Table 5.
Resonant frequencies of the minaret and its substructures.
6.3. Complete Model with Staircase
In the next stage of numerical modeling, all information discussed above was accounted for in the final FE model. A minaret’s crown was added to the model of the outer wall and all windows were introduced, as presented in Figure 18. The models of the core tower and the staircase were not altered.
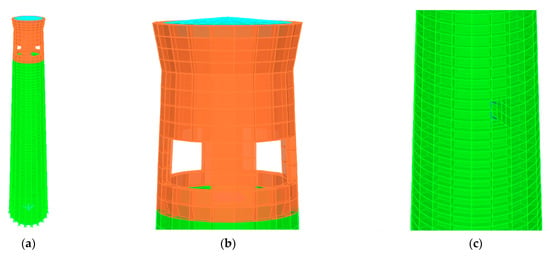
Figure 18.
Details of the final model: (a) overall view; (b) core tower only; (c) typical window opening.
The modes of vibrations are shown in Figure 19. The first mode corresponds to the first frequency in the NS direction and to the first frequency in the EW direction. These frequencies are numbered as F1 and F2 in the output of the modal analysis. The second mode corresponds to the second frequency in the NS direction and to the second frequency in the EW direction. Respectively, they are numbered as F3 and F4 in the output of the modal analysis. The torsional mode corresponds to the fifth frequency of vibration, F5.
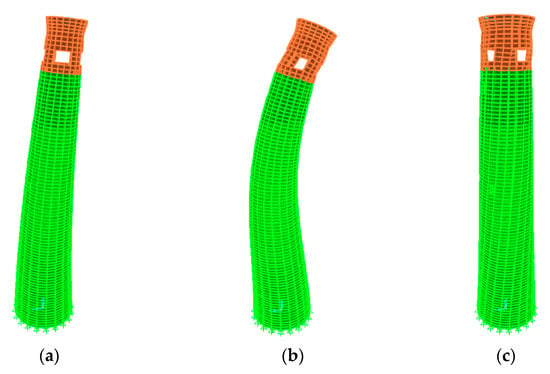
Figure 19.
Minaret’s first three modes of vibration: (a) first mode in NS and EW directions (F1 and F2); (b) second mode in NS and EW directions (F3 and F4); (c) torsional mode (F5).
6.4. Complete Model with Residual Inclination
In the final stage of numerical modeling, the residual inclination of the minaret was considered. As was reported earlier [16,20], the minaret has a residual inclination from a vertical axis. The inclination of the minaret was estimated by best fitting cross-sections of the point clouds to circles, and estimating the locations of all these centers for each elevation, as presented in Figure 20a. Based on the linear regression analysis of these centers’ locations, the overall direction of the minaret’s inclination is estimated to be 142.34 degrees, with respect to magnetic north, as presented in Figure 20b. This plot shows the locations of the centers in the horizontal plane relative to the location of the center obtained for the very first section, which was introduced at an elevation of 1.0 m. This plot, and the plot shown in Figure 20a, were generated for the sections of the point cloud, using a consistent increment throughout the elevation.
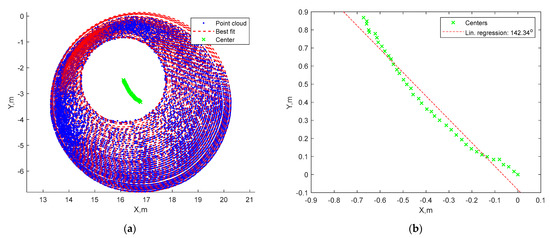
Figure 20.
Analysis of residual inclination from point cloud—plan views: (a) cross-sections of the minaret with best fit circles and their centers; (b) centers of circles in the horizontal plane.
The evolution of the residual inclination, with respect to elevation change, is presented in Figure 21a. It shows the locations of the centers in the vertical plane of the overall inclination. The horizontal axis in Figure 20a shows the drift of the minaret in respect to the first cross-section of the point cloud, which was introduced at an elevation of 1.0 m. The vertical axis shows the minaret’s elevations. As evident from this plot, the maximum drift is quite significant. For example, at an elevation of 31.4 m the drift of the minaret is 1.10 m with respect to the elevation at 1.0 m. A linear regression analysis showed that the overall inclination is about 2.16 degrees, as presented in this plot. This inclination was introduced into the final model. A rigid body rotation was introduced to the minaret’s model to achieve this inclination, after which the bottom nodes of the minaret were adjusted to ensure that they were still located in a single horizontal plane. The final numerical model is shown in Figure 21b. A modal analysis was repeated, to evaluate the effect of the inclination on the model’s performance.
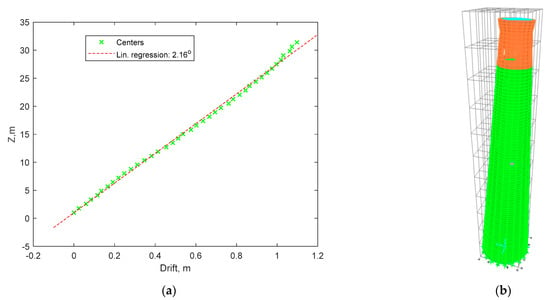
Figure 21.
Estimation of the residual inclination and the model with residual inclination: (a) residual drift of the minaret in the vertical plane of overall inclination; (b) model with grid lines added.
A summary of the resonant frequencies of the finite element model of the minaret is presented in Table 6. As presented in this table the measured frequencies are very close to those estimated by the finite element analysis. It is worth noting that the presented frequencies of the numerical model are a result of the so-called calibration procedure, which is based on updating the physical properties of the model [9,37]. The material properties before calibration were taken from [38], which were based on testing typical masonry bricks of Uzbekistan [39]. Although the brick material was tested in [38], the effective Young’s modulus of the minaret will be lower than that reported earlier [40]. This corresponds to the fact that the brick masonry wall consists of bricks and the mortar between the bricks, and, as such, the Young’s modulus of the mortar is much lower than that of the brick alone. The frequencies summarized in Table 6 are based on the material properties listed in Table 7 (NM stands for not measured). As evident from the table, the inclination of the model does not affect the resonant frequencies of the model, this was expected for this relatively small imperfection.

Table 6.
Resonant frequencies of the numerical model compared to ambient vibration test results.

Table 7.
Material properties of the brick masonry in the calibrated model.
Table 8 includes a comparative summary of the first resonant frequencies published earlier, with respect to those reported in this paper. The first resonant frequency of the Juma minaret is greater than the resonant frequency of a generic minaret replication [8] of a typical Turkish minaret built of stone masonry. The first resonant frequency of the latter minaret, of about the same height, was estimated to be 0.71 Hz. Another Turkish minaret [9] was shorter than the one studied herein (about 21 m tall), nevertheless, its first resonant frequency, estimated at 1.16 Hz, was still lower than that of the Juma minaret. This result corresponds to the fact that, contrary to Turkish minarets, the minarets in Uzbekistan (including the Juma minaret) have a tapered shape, and are constructed of masonry bricks. In addition, stone masonry can be heavier than brick masonry of the same volume. A numerical study, focused on comparing the Turkish minarets to those in Uzbekistan [10], confirmed that the latter has higher frequencies than the former. The Kalyan minaret in Bukhara was compared to two Turkish minarets, one of which was even shorter than the Kalyan minaret. The first resonance frequency of another Turkish minaret [11], of about the same height, was also lower than that studied in this paper.

Table 8.
Comparative analysis of the first resonant frequencies of a few minarets.
As discussed earlier, this paper is based on finite element modeling in the SAP2000 environment. It does not require a lot of computational time because it is limited to linear modal analysis. In the next phases of this multiyear long-term project, the minaret will be instrumented with permanently installed seismic monitoring equipment. This will provide an opportunity to develop a more complex model that closely replicates the minaret’s response to seismic excitations. Based on this comparative analysis of the model and the actual minaret, the former will be continuously updated. As a result, the model will represent a live digital twin of the actual monument, aging over time. If a large deviation in the response is observed, this will trigger another investigation of the minaret, with TLS or other remote sensing means.
In the next phases of the project, the shape of the minaret’s model will be adjusted by considering more accurate 3D reconstruction software (see [41] as an example). A sensitivity study of this adjustment, to the performance of the finite element model, will be performed.
7. Conclusions
This paper highlights the results of the extensive research projects conducted from 2019 to 2022. It was part of the educational and knowledge exchange program conducted between the University of California, Berkeley (USA) and Urgench State University (Uzbekistan). A number of faculty and students of Urgench State University were involved. In addition to the educational goals, the main objective of the project was to conduct an extensive structural health monitoring of one of the ancient monuments in Khiva, Uzbekistan. Juma Mosque was selected for this purpose. During this project, the monument was laser scanned, to record its geometry with a high accuracy. The current state of the monument and its anomalies were captured, including a residual inclination of the minaret. The residual inclination of the minaret was estimated based on the analysis of the point cloud. The laser scanning was conducted for the exterior surface of the minaret, and, as such, a few measurements of the staircase inside of the minaret were conducted in addition to the laser scans. In the final stage of the monitoring, ambient vibration tests were performed, to estimate the resonant frequencies of the minaret. Based on all the collected information, a sophisticated numerical model of the minaret was developed. The finite element model of the minaret was calibrated based on the results of the ambient vibration tests. The laser scanning enabled the measurement of the residual drift of the minaret and an estimate of the orientation of the overall plane of inclination. The residual inclination was also included in the numerical model. It showed that the resulting finite element model has almost the same frequencies as the actual monument. The ambient vibration measurements revealed the fact that the resonant frequencies are slightly different in the NS direction than those in the EW direction. This can be related to the presence of the wall in the EW direction, which will be addressed in future research. The main objective of creating a geometrically accurate digital twin, with physical properties closely correlated to the actual object, was achieved. The resonant frequencies are very important from the structural performance point of view, especially in seismically active regions. If the earthquake’s dominant frequency is close to the minaret’s natural frequency, it can lead to resonance effects and ultimately its complete destruction. In the next phases, the model will be updated based on the results of the permanently installed seismic monitoring equipment. This continuously updated model will be crucial for the development of preservation and reconstruction strategies based on numerical simulations of the minaret’s structural performance.
Author Contributions
This paragraph specifies individuals’ contributions. Conceptualization and methodology—S.T.; laser scanning—S.T.; field studies—B.R.; manual measurements—R.N., A.S. and S.S.; formal analysis—S.T., B.R., R.N., A.S. and S.S. All authors have read and agreed to the published version of the manuscript.
Funding
The project would not be possible without funding provided by the Central Asia University Partnerships Program (UniCEN). UniCEN is sponsored by the U.S. Embassy in Tashkent, Uzbekistan and administered by the American Councils for International Education. The grant number is SUZ800-180CA-0001.
Data Availability Statement
The point cloud data is not available due to privacy restrictions.
Acknowledgments
Special thanks are due to Brian Quigley of BNZ, Uzbekistan for providing access to a terrestrial laser scanner. The authors would like to acknowledge the Delta Group Max, Uzbekistan for logistical and technical support provided for the laser scanning project. Special thanks are due to Javlon Musurmanov of BNZ and Bakhtiyor Takhirov for technical support during the laser scanning of the monument. The successful completion of the project would not have been possible without the strong support of Ravshan Shamansurov of Sigma Innovative Tech, Uzbekistan. A large number of students and faculty actively participated in this multiyear program, which is greatly appreciated. Special thanks are due to Anvar Bobodjonov and Khumoun Bekchonov of Urgench State University, Uzbekistan for organizing large groups of students to participate in the ambient vibration studies. The authors would like to acknowledge Holly Halligan of UC Berkeley for editing the paper.
Conflicts of Interest
The authors declare no conflict of interest.
References
- Rashidi, M.; Mohammadi, M.; Sadeghlou Kivi, S.; Mehdi Abdolvand, M.; Truong-Hong, L.; Samali, B. A Decade of Modern Bridge Monitoring Using Terrestrial Laser Scanning: Review and Future Directions. Remote Sens. 2020, 12, 3796. [Google Scholar] [CrossRef]
- Mohammadi, M.; Rashidi, M.; Mousavi, V.; Yu, Y.; Samali, B. Application of TLS Method in Digitization of Bridge Infrastructures: A Path to BrIM Development. Remote Sens. 2022, 14, 1148. [Google Scholar] [CrossRef]
- Remondino, F. Heritage Recording and 3D Modeling with Photogrammetry and 3D Scanning. Remote Sens. 2011, 3, 1104–1138. [Google Scholar] [CrossRef]
- Kęsik, J.; Miłosz, M.; Montusiewicz, J.; Samarov, K. Documenting the geometry of large architectural monuments using 3D scanning—The case of the dome of the Golden Mosque of the Tillya-Kori Madrasah in Samarkand. Digit. Appl. Archaeol. Cult. Herit. 2021, 22, e00199. [Google Scholar] [CrossRef]
- Ivorra, S.; Pallares, F.J. Dynamic investigations on a masonry bell tower. Eng. Struct. 2006, 28, 660–667. [Google Scholar] [CrossRef]
- Gentile, C.; Saisi, A. Ambient vibration testing of historic masonry towers for structural identification and damage assessment. Constr. Build. Mater. 2007, 21, 1311–1321. [Google Scholar] [CrossRef]
- D’Ambrisi, A.; Mariani, V.; Mezzi, M. Seismic assessment of a historical masonry tower with nonlinear static and dynamic analyses tuned on ambient vibration tests. Eng. Struct. 2012, 36, 210–219. [Google Scholar] [CrossRef]
- Dogangun, A.; Acar, R.; Sezen, H.; Livaoglu, R. Investigation of dynamic response of masonry minaret structure. Bull. Earthq. Eng. 2008, 6, 505–517. [Google Scholar] [CrossRef]
- Bayraktar, A.; Altunişik, A.; Sevim, B.; Türker, T. Seismic Response of a Historical Masonry Minaret using a Finite Element Model Updated with Operational Modal Testing. J. Vib. Control. 2010, 17, 129–149. [Google Scholar] [CrossRef]
- Dere, Y.; Erdoğan, H.; Başar, M. Dynamic Comparison of Three Major Turkic Minarets in the History of Minaret Evolution. In Proceedings of the International Conference on Advances in Civil and Structural Engineering, Kuala Lumpur, Malaysia, 2–3 August 2014. [Google Scholar]
- Hacıefendioğlu, K.; Demir, G.; Alpaslan, E. Determination of Modal Parameters of Historical Masonry Minarets by using Operational Modal Analysis. In Proceedings of the World Congress on Civil, Structural, and Environmental Engineering (CSEE’16), Prague, Czech Republic, 30–31 March 2016. Paper No. ICSENM 104. [Google Scholar] [CrossRef]
- Korumaz, M.; Betti, M.; Conti, A.; Tucci, G.; Bartoli, G.; Bonora, V.; Korumaz, A.G.; Fiorini, L. An integrated Terrestrial Laser Scanner (TLS), Deviation Analysis (DA) and Finite Element (FE) approach for health assessment of historical structures. A minaret case study. Eng. Struct. 2017, 153, 224–238. [Google Scholar] [CrossRef]
- Teza, G.; Pesci, A. Geometric characterization of cylinder-shaped structure from laser scanner data: Development of an analysis tool and its use on a leaning bell tower. J. Cult. Herit. 2013, 14, 411–423. [Google Scholar] [CrossRef]
- Castellazzi, G.; D’Altri, A.M.; Bitelli, G.; Selvaggi, I.; Lambertini, A. From Laser Scanning to Finite Element Analysis of Complex Buildings by Using a Semi-Automatic Procedure. Sensors 2015, 15, 18360–18380. [Google Scholar] [CrossRef] [PubMed]
- Available online: https://whc.unesco.org/en/list/543 (accessed on 9 February 2023).
- Abdurashidov, K.S.; Kabulov, F.R.; Rakhmanov, B.K. Engineering Problems of Architectural Monuments; “Fan” publishing house of Academy of Sciences of Republic of Uzbekistan: Tashkent, Uzbekistan, 2011. (In Russian) [Google Scholar]
- Mankovskaya, L.Y.; Bulatova, V.A. Monuments of the Architecture of Khorezm; Gafur Gulyam Publishing House: Tashkent, Uzbekistan, 1978; 162p. (In Russian) [Google Scholar]
- Miłosz, M.; Kęsik, J.; Badurowicz, M. 3D scanning of the interior of Juma Mosque in Khiva, International Conference “3D Digital Silk Road Project” (3DSR’2022). 7–9 September 2022. Available online: https://silkroad3d.com/wp-content/uploads/2022/08/14_3D-scanning-of-the-interior-of-Juma-Mosque-in-Khiva.pdf (accessed on 11 March 2023).
- Durdieva, G.; Davletov, B. Results of Technical Condition’s Monitoring Conducted in Itchan Kala: Juma Mosque; Khorezm Mamun Academy: Khiva, Uzbekistan, 2008. (In Uzbek) [Google Scholar]
- Takhirov, S.; Rakhmonov, B.; Nafasov, R.; Samandarov, A.; Sultanova, S.; Musurmanov, J.; Takhirov, B. Structural health monitoring of Juma Mosque in Itchan Kala, Uzbekistan by laser scanning. In Proceedings of the International Conference on Structural Health Monitoring of Intelligent Infrastructure: Transferring Research into Practice, SHMII, Porto, Portugal, 30 June–2 July 2021; pp. 1331–1337, ISSN 2564-3738. [Google Scholar]
- Takhirov, S.; Rakhmonov, B. Structural Health Monitoring of the Juma Mosque in Itchan Kala in Khiva (Uzbekistan): Laser Scanning Combined with Numerical Modelling. In Proceedings of the 12th International Conference on Structural Analysis of Historical Constructions SAHC, Barcelona, Spain, 16–18 September 2020; Roca, P., Pelà, L., Molins, C., Eds.; pp. 3361–3370. Available online: https://congress.cimne.com/SAHC2020/frontal/doc/Ebook_SAHC2020.pdf (accessed on 11 March 2023). [CrossRef]
- Takhirov, S.M.; Rakhmonov, B.S. Finite element analysis of Juma Mosque in Uzbekistan based on laser scanning and Ambient studies. COMPDYN Proc. 2021. [Google Scholar] [CrossRef]
- Takhirov, S.M.; Aripov, I.; Matrasulov, D. Real-time Structural Monitoring of Bibi-Khanum in Samarkand (Uzbekistan) Combined with Subsequent Laser Scans. In Proceedings of the 12th International Conference on Structural Analysis of Historical Constructions SAHC, Barcelona, Spain, 16–18 September 2020; Roca, P., Pelà, L., Molins, C., Eds.; pp. 3339–3348. Available online: https://congress.cimne.com/SAHC2020/frontal/doc/Ebook_SAHC2020.pdf (accessed on 11 March 2023).
- Leica Geosystems AG. Leica ScanStation C10. 2011. Available online: https://w3.leicageosystems.com/downloads123/hds/hds/ScanStation%20C10/brochuresdatasheet/Leica_ScanStation_C10_DS_en.pdf (accessed on 19 October 2021).
- Leica Geosystems AG. Cyclone Version 9.2.1; Housing & Development Software LLC: Miami Lakes, FL, USA, 2018. [Google Scholar]
- MathWorks. Matlab Version R2020a; MathWorks: Natick, MA, USA, 2020. [Google Scholar]
- An, Z.; Froese, R.E. Tree stem volume estimation from terrestrial LiDAR point cloud by unwrapping. Can. J. For. Res. 2022, 53, 60–70. [Google Scholar] [CrossRef]
- Duan, D.; Qiu, W.; Cheng, Y.; Zheng, Y.; Lu, F. Reconstruction of shield tunnel lining using point cloud. Autom. Constr. 2021, 130, 103860. [Google Scholar] [CrossRef]
- Gander, W.; Golub, G.; Strebel, R. Least-squares fitting of circles and ellipses. In BIT Numerical Mathematics; Springer: Berlin/Heidelberg, Germany, 1994. [Google Scholar]
- Alsadik, B.; Abdulateef, N.A.; Khalaf, Y.H. Out of Plumb Assessment for Cylindrical-Like Minaret Structures Using Geometric Primitives Fitting. ISPRS Int. J. Geo-Inf. 2019, 8, 64. [Google Scholar] [CrossRef]
- Takhirov, S.; Blondet, M. Ambient Vibration Study of Berkeley Public Library, Report to Berkeley Public Library; Report No. UCB/SEMM-97/10, Structural Engineering Mechanics and Materials; University of California: Berkeley, California, USA, 1997. [Google Scholar]
- Available online: https://www.pcb.com/contentstore/mktgcontent/linkeddocuments/vibration/tm-vib-seismic_lowres.pdf (accessed on 9 February 2023).
- Takhirov, S.; Fenves, G.; Fujisaki, E.; Clyde, D. Ground Motions for Earthquake Simulator Qualification of Electrical Equipment, Pacific Earthquake Engineering Research Center; PEER 2004/07; University of California at Berkeley: Berkeley, California, USA, 2005. [Google Scholar]
- Takhirov, S.M.; Gilani, A.S.J.; Tedesco, L. Seismic Testing of Non-structural components and Assessment of the Prescribed Response Spectrum. In Proceedings of the 10th US National Conference on Earthquake Engineering, Frontiers of Earthquake Engineering, Quake Summit 2012, Anchorage, AK, USA, 21–25 July 2014. [Google Scholar]
- Computers and Structures Inc (CSI). SAP2000 Ultimate Version 16.1.1.; Structural Analysis Program: Berkeley, CA, USA, 2014. [Google Scholar]
- Bağbancı, M.B.; Bağbancı, O. The Effects of Construction Techniques and Geometrical Properties on the Dynamic Behavior of Historic Timber Minarets in Sakarya. Turkey Shock. Vib. 2018, 2018, 9853896. [Google Scholar] [CrossRef]
- Karatzetzou, A.; Pitilakis, D.; Karafagka, S. System Identification of Mosques Resting on Soft Soil. The Case of the Suleiman Mosque in the Medieval City of Rhodes, Greece. Geosciences 2021, 11, 275. [Google Scholar] [CrossRef]
- Takhirov, S.M.; Gilani, A.; Quigley, B.; Myagkova, L. Assessment of Seismic Vulnerability and Retrofit Strategies of a Historic Building on the Great Silk Road Based on its Current Condition Captured by Laser Scans. Int. J. Archit. Herit. 2019, 13, 192–204. [Google Scholar] [CrossRef]
- Takhirov, S.M.; Mosalam, K.M.; Moustafa, M.A.; Myagkova, L.; Quigley, B. Laser scanning, modeling, and analysis for damage assessment and restoration of historical structures. COMPDYN 2015. In Proceedings of the 5th ECCOMAS Thematic Conference on Computational Methods in Structural Dynamics and Earthquake Engineering, Crete Island, Greece, 25–27 May 2015. [Google Scholar]
- Arash, S. Mechanical Properties of Masonry Samples for Theoretical Modeling. In Proceedings of the 15th International Brick and Block Masonry Conference Florianópolis, Santa Caterina, Brazil, 3–6 June 2012. [Google Scholar]
- Mousavi, V.; Khosravi, M.; Ahmadi, M.; Noori, N.; Haghshenas, S.; Hosseininaveh, A.; Varshosaz, M. The performance evaluation of multi-image 3D reconstruction software with different sensors. Measurement 2018, 120, 1–10. [Google Scholar] [CrossRef]
Disclaimer/Publisher’s Note: The statements, opinions and data contained in all publications are solely those of the individual author(s) and contributor(s) and not of MDPI and/or the editor(s). MDPI and/or the editor(s) disclaim responsibility for any injury to people or property resulting from any ideas, methods, instructions or products referred to in the content. |
© 2023 by the authors. Licensee MDPI, Basel, Switzerland. This article is an open access article distributed under the terms and conditions of the Creative Commons Attribution (CC BY) license (https://creativecommons.org/licenses/by/4.0/).