

Resolving the Urban Dilemma of Two Adjacent Rivers through a Dialogue between GIS and Augmented Reality (AR) of Fabrics

Abstract
:
1. Introduction
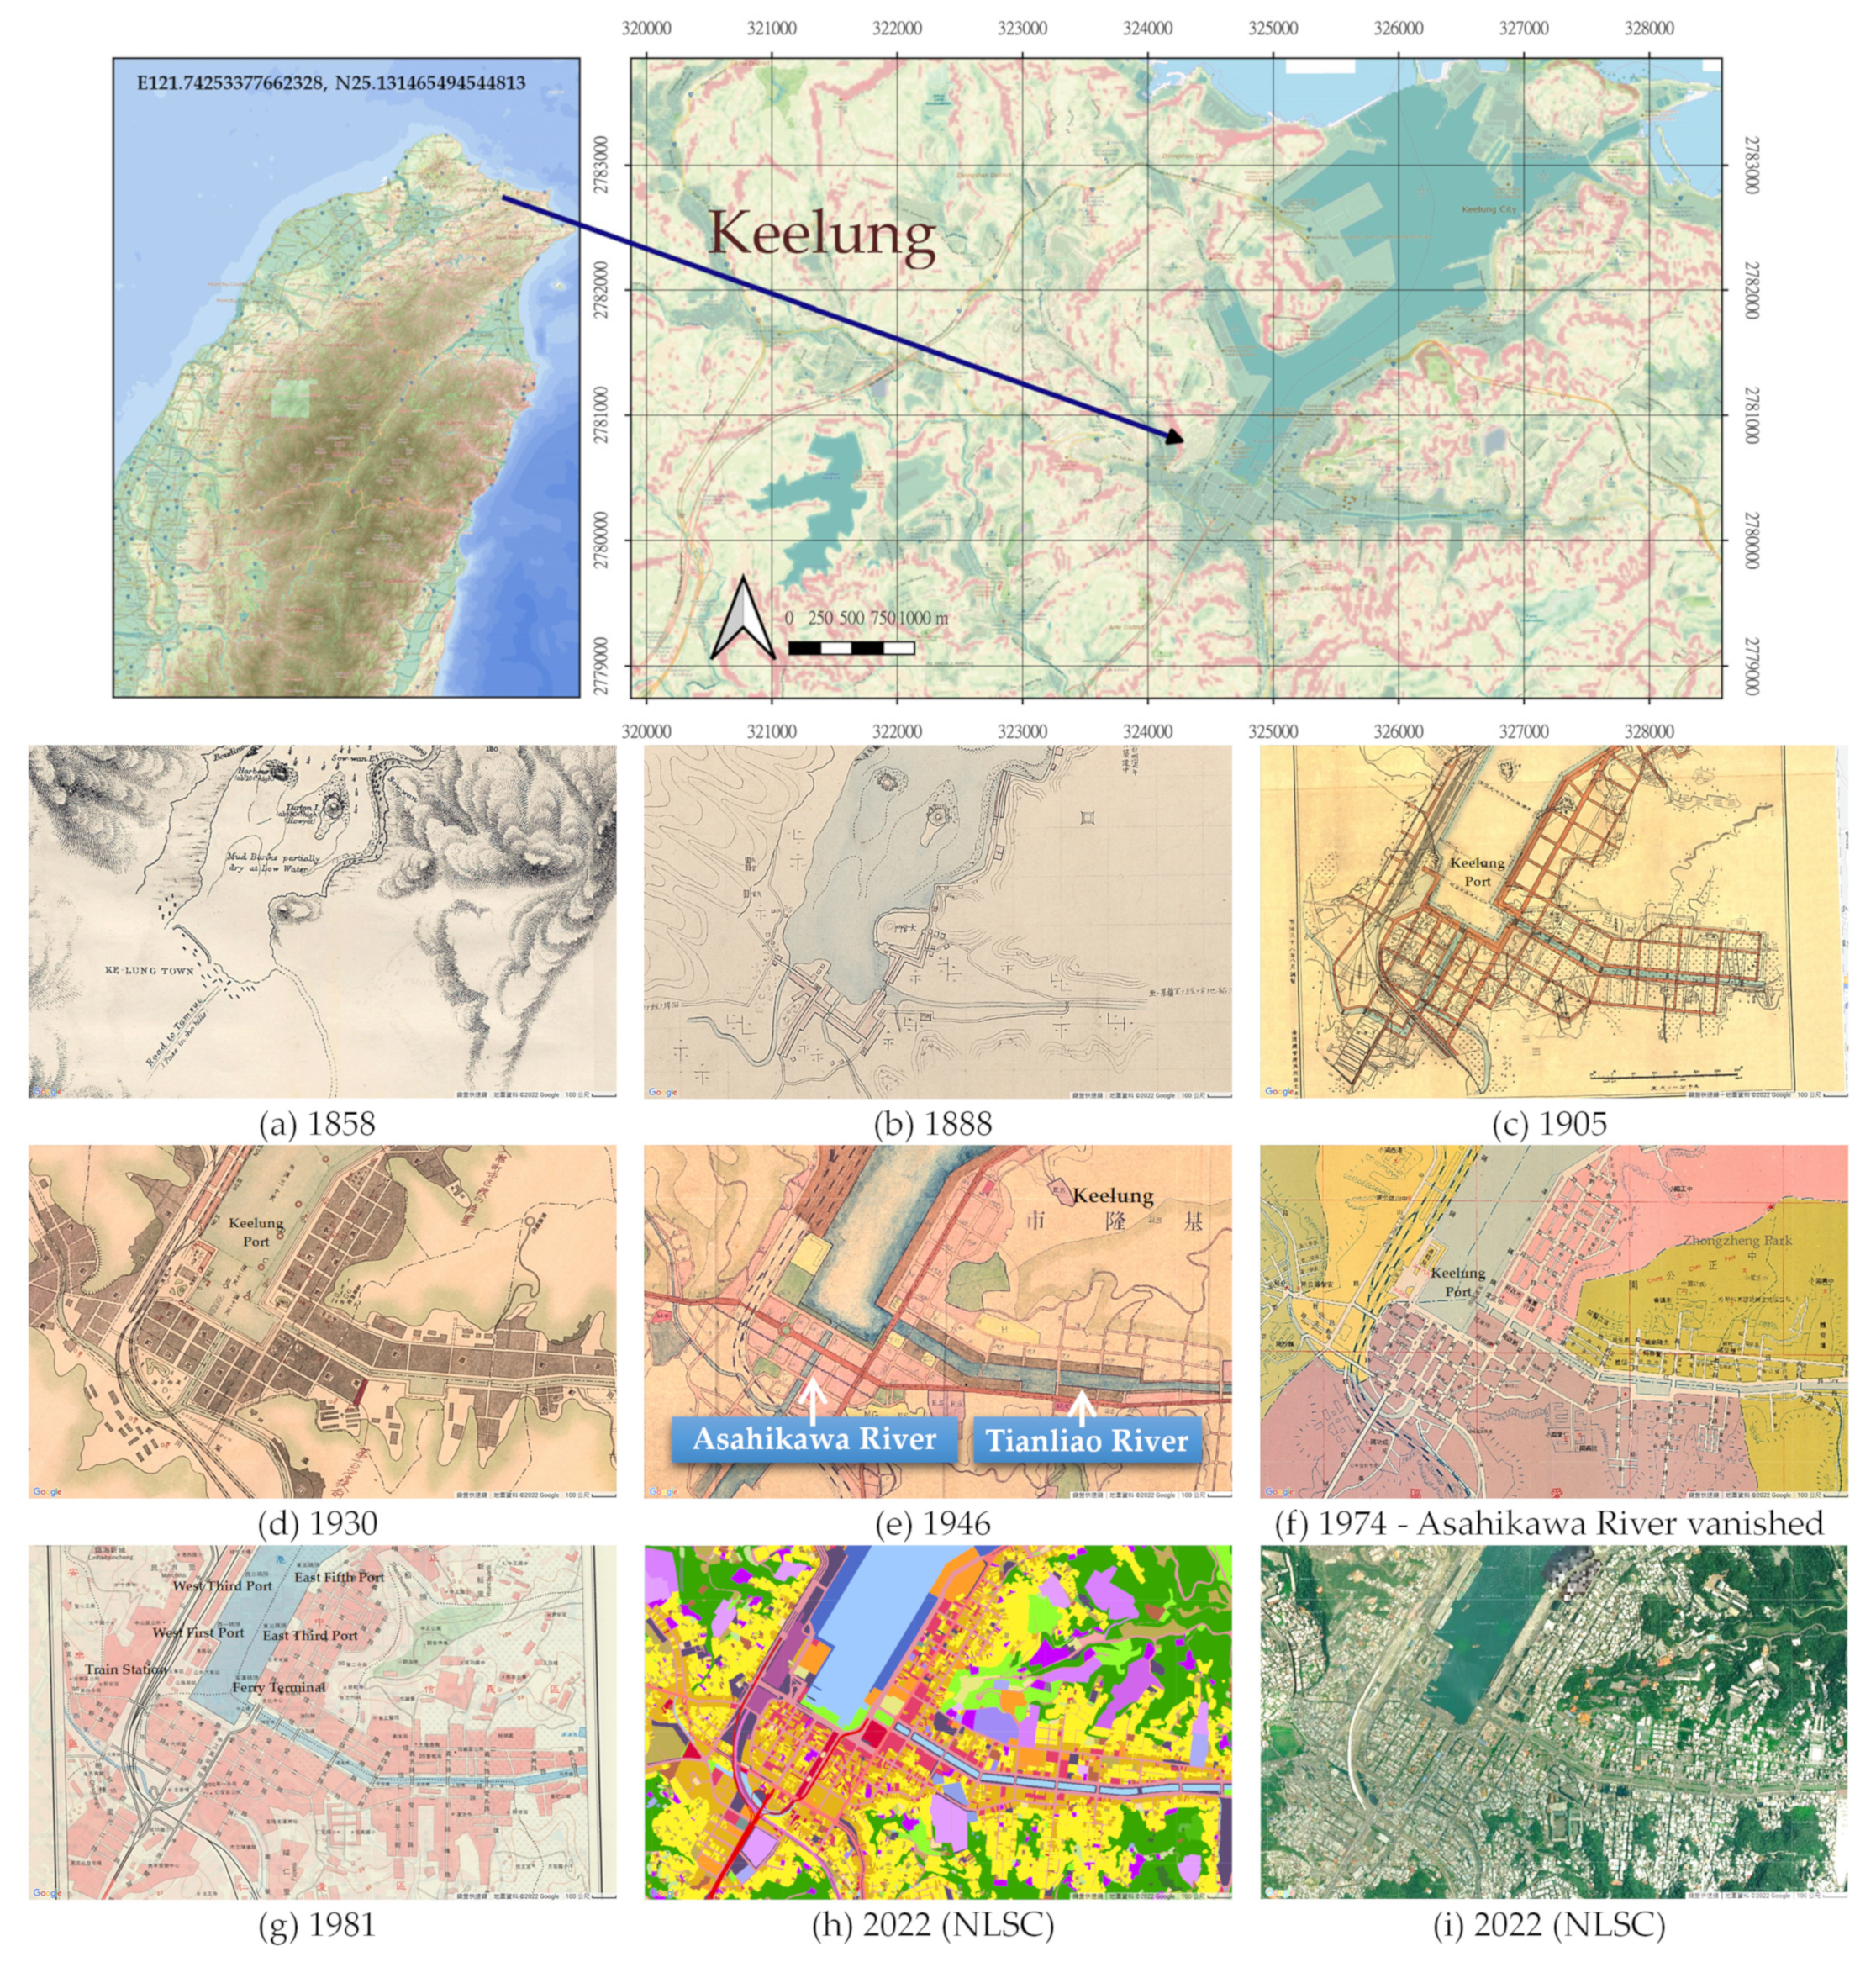
1.1. History of Keelung
1.2. Related Studies
2. Materials and Methods
2.1. Physical and AR Dynamics
2.2. Measures
2.3. Comparing Scenarios
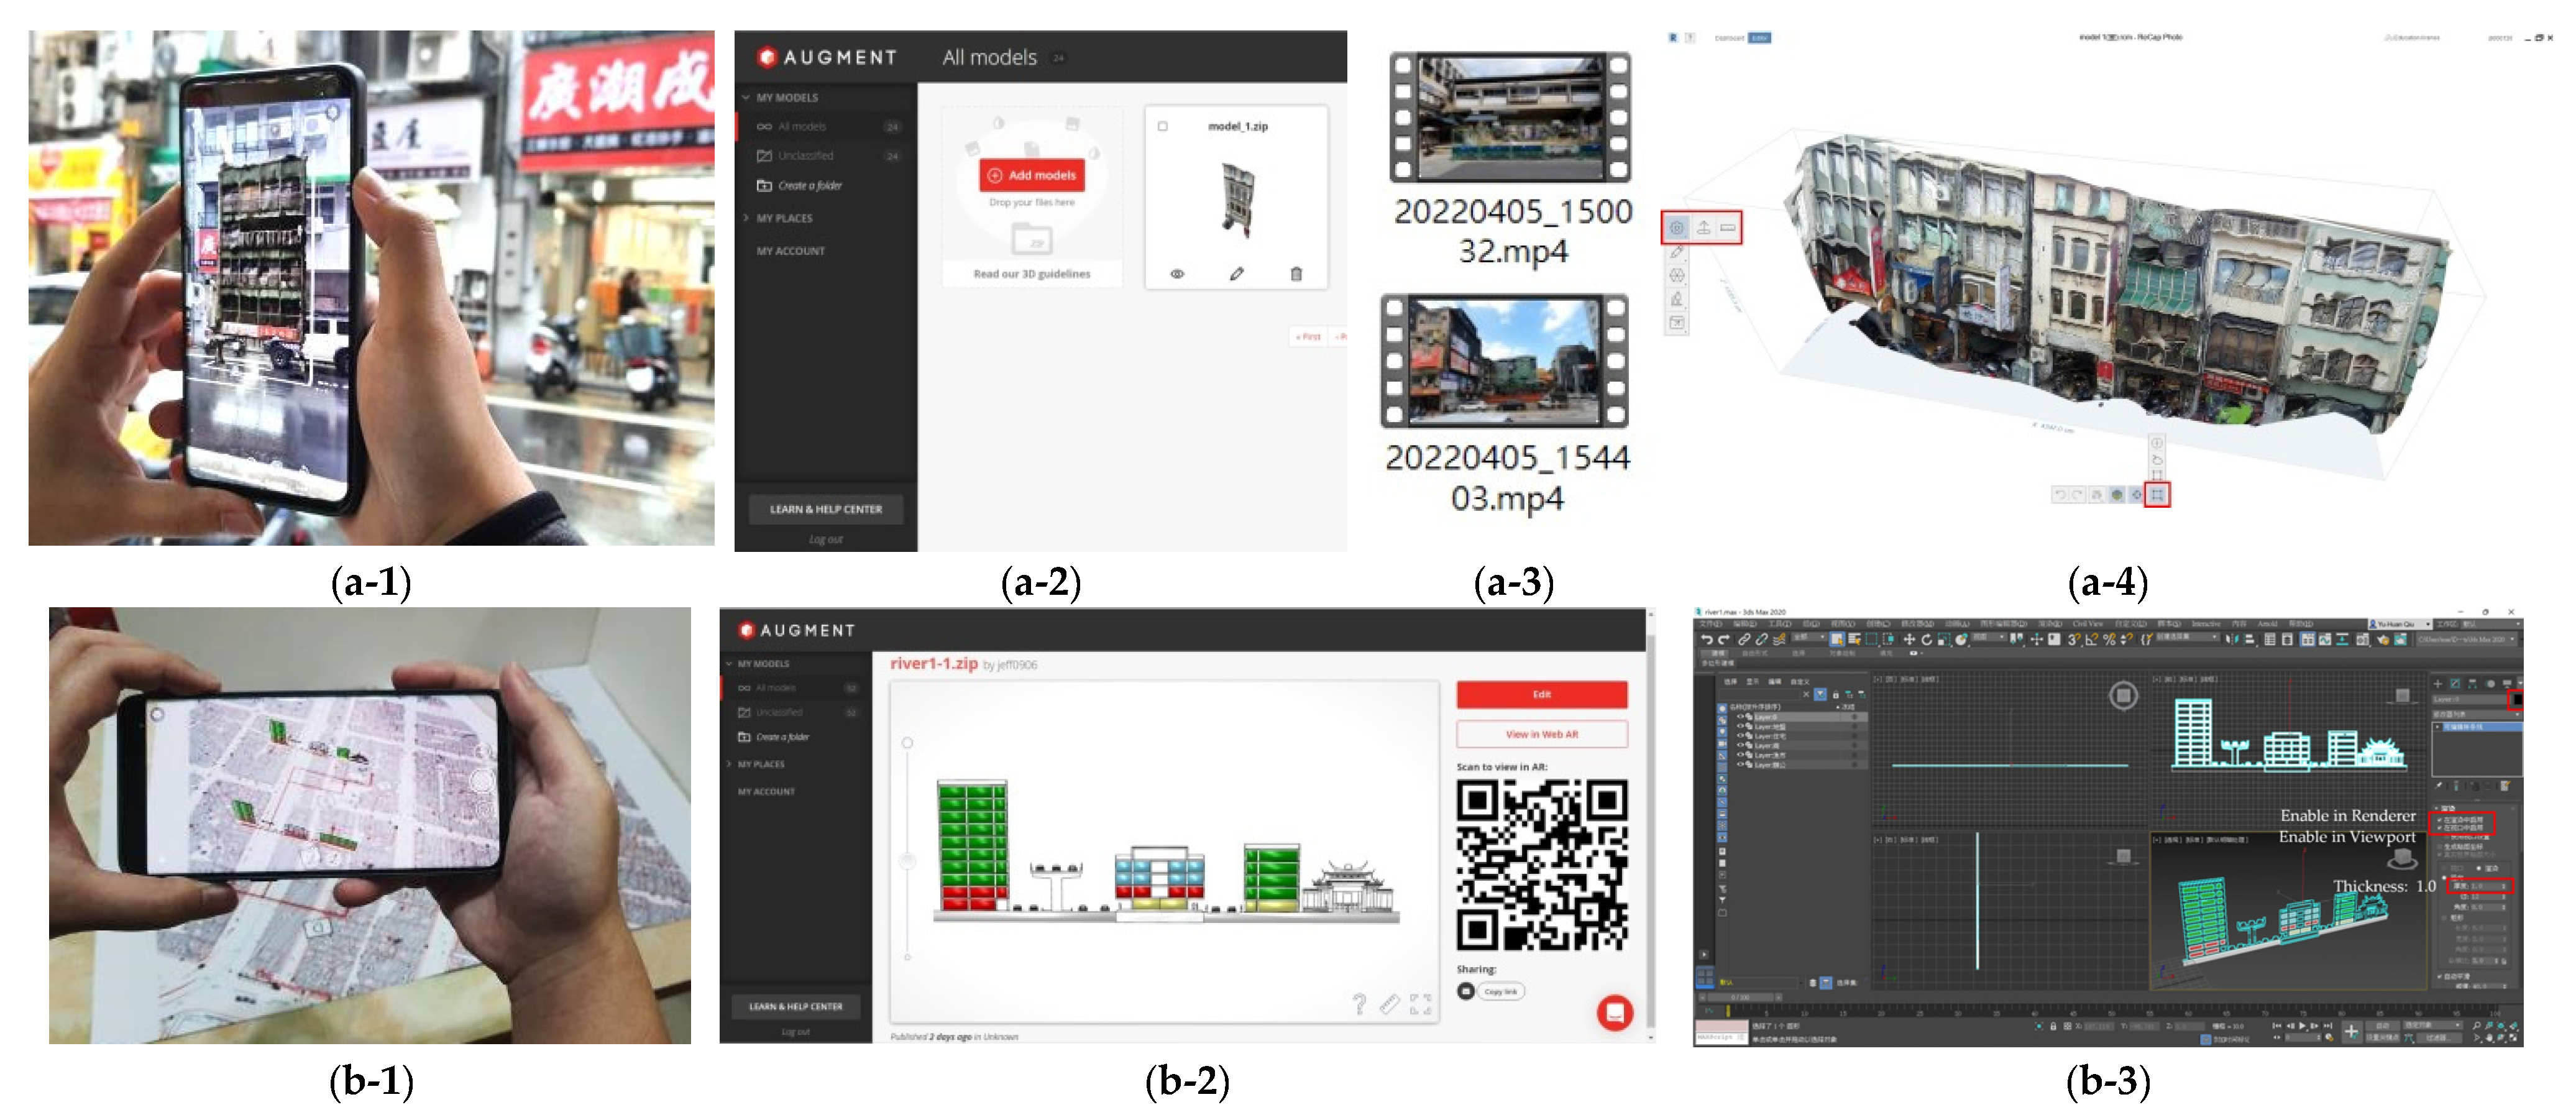
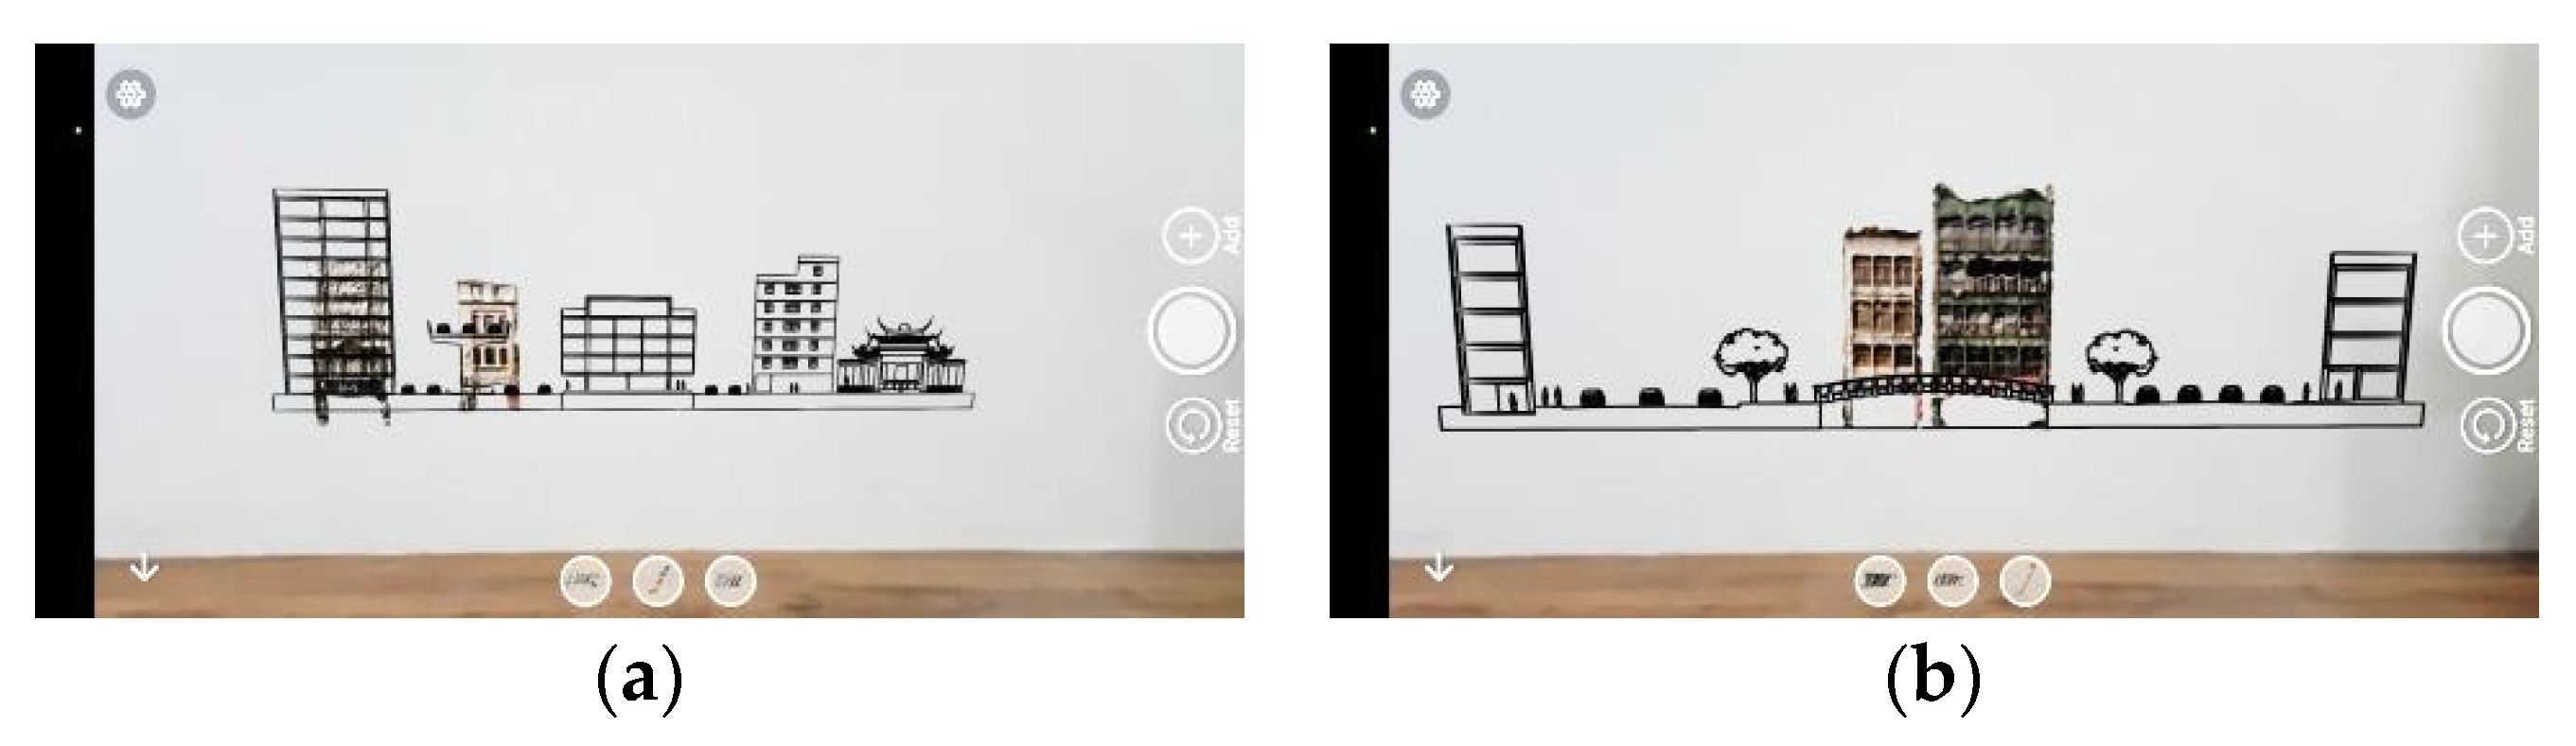
- GIS to AR: The first two scenarios of this type consisted of: (a) using a map for trend estimation and setting, with a model from tradition drawings, and (b) using a map for geo-referencing, with a model from UAV models. The former was oriented from QGIS® to AR as a map-based estimation from a big urban picture and early history to focused factors (QGIS® map) simulated by 3D AR. The latter was oriented from geo-referenced 3D browsing (QGIS® 3D view) to AR in an open product platform (Augment®). The former was scaled down from hydrogeography to architecture maps as a top-down inductive method for induced design possibilities. The latter opened up a large variety of map databases and 3D views in QGIS® with geo-referenced models.
- AR to GIS: this scenario used a bottom-up deductive method from an open eCommerce platform (Augment®) to provide a more detailed simulation, which was missing in QGIS® 3D view, such as skyline overlapping, fabric substitution, and fabric disposition as enforced corrections and representation with or without reference to historical development.
- GIS to AR + AR to GIS: the building information modeling (BIM) details served the simulation and inspection on both platforms such as QGIS® in a larger scope by connecting the river to the harbor front, and in Augment® AR by focusing on smaller parts between street blocks (Figure 6).
2.4. Cross Platform Tools
3. Results
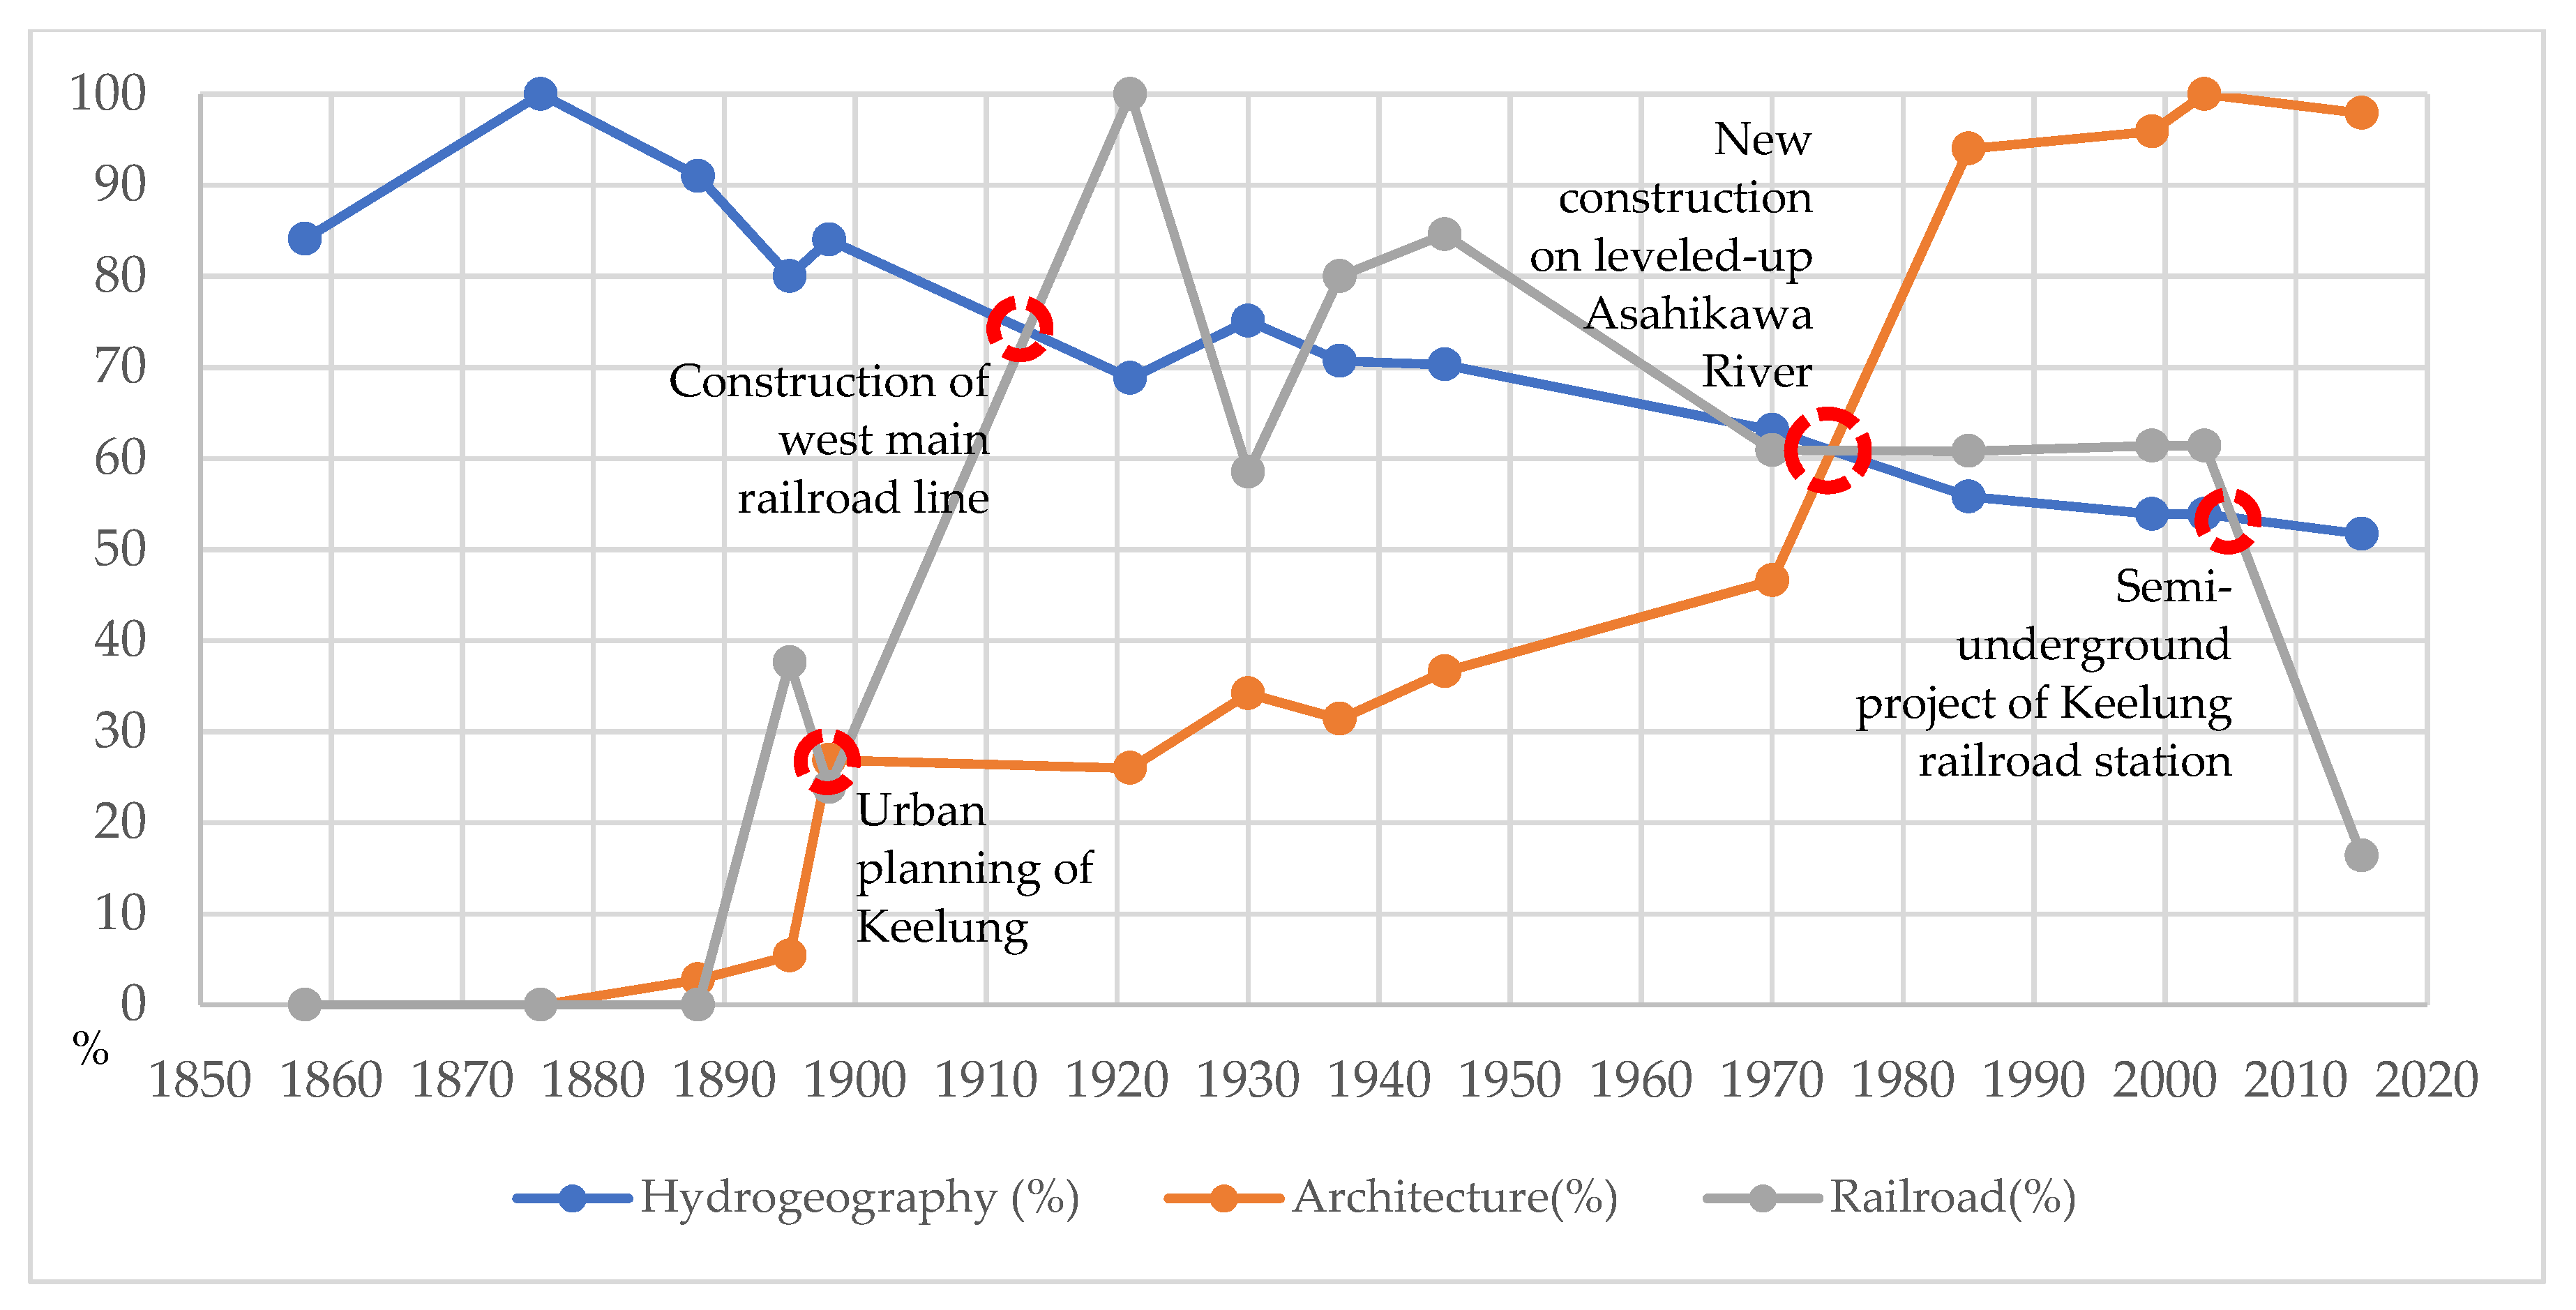
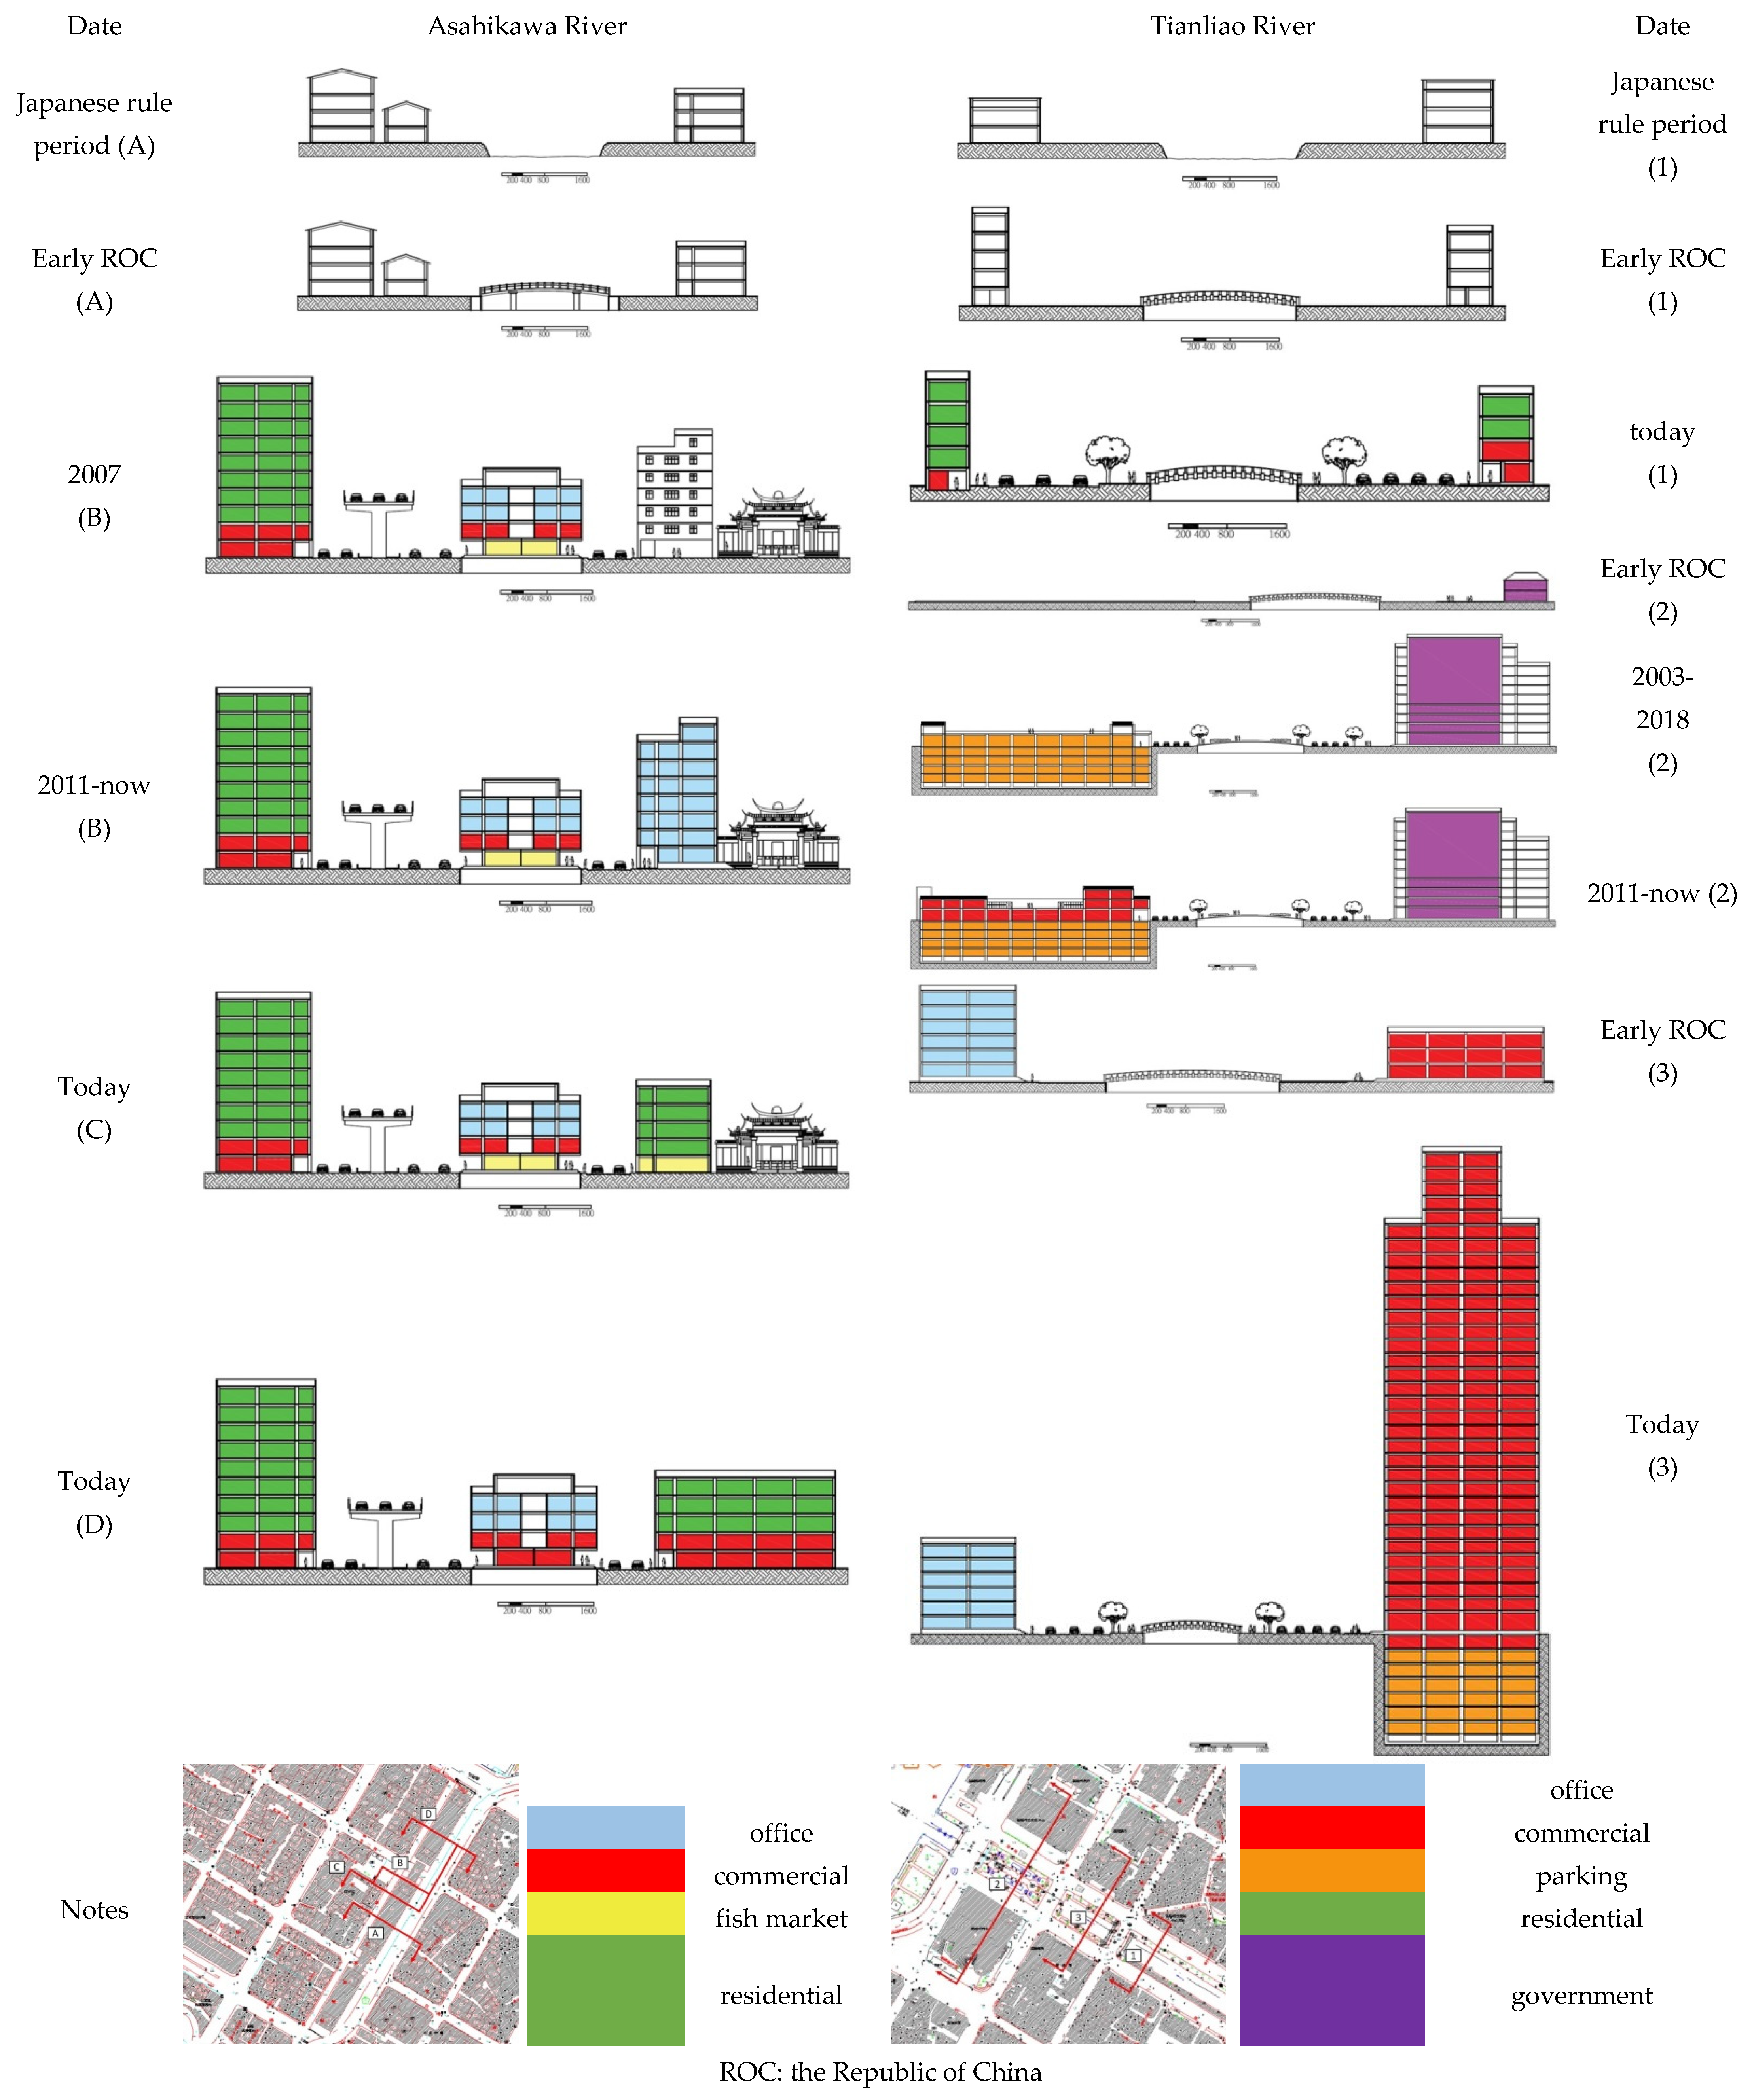
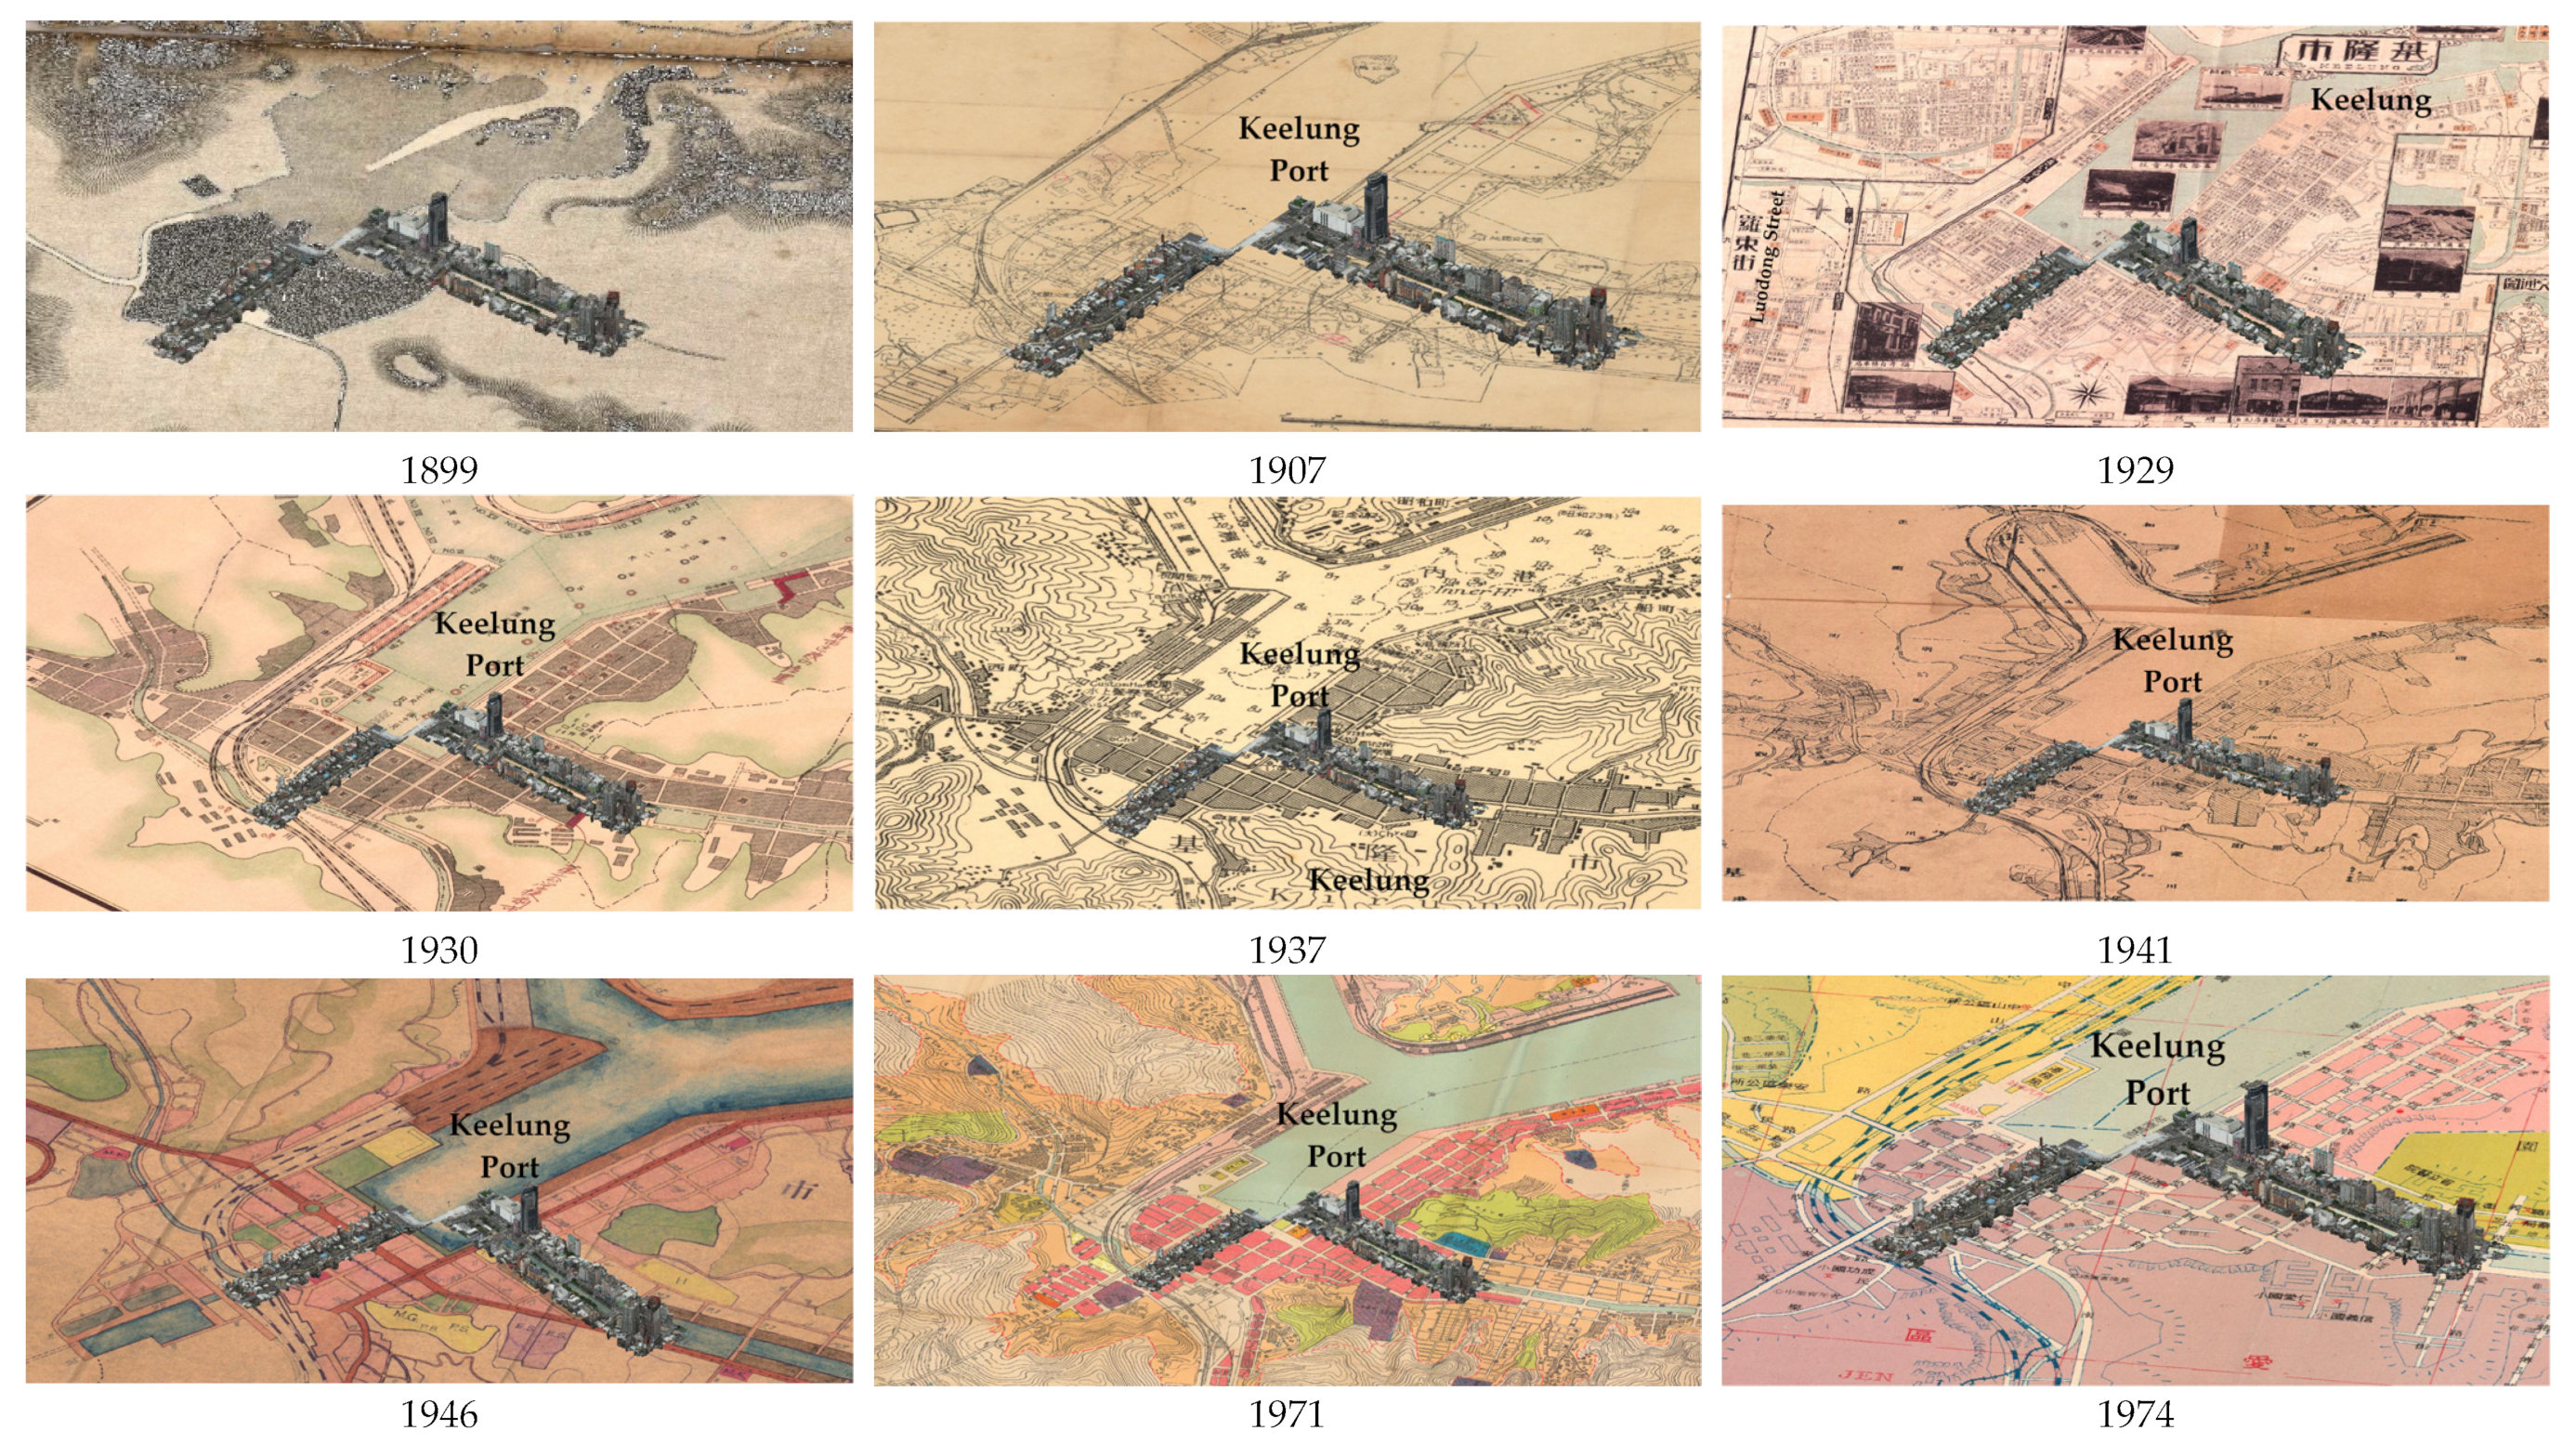
3.1. Macro Evolvement of Hydrogeography, Architecture, and Railroad
- Hydrogeography: This was one of the main factors in formulating the city from a fishing, naval, and commercial harbor to a tourism harbor. Port planning oriented the layout of the circulation system. By overlapping the configuration of the waterfront, historical development was quantified by assessing the surface area of water surrounded by the long-term construction of facilities.
- Architecture: The waterfront, government policies, and economic development contributed to the main harbor identity. Historical development was assessed by the area of building footage as an indicator to quantify the ascending trend of development.
- Railroad: the old railroad system was closely connected to the harbor’s history and government policy and was used as an indicator to quantify the ascending and descending developing trend of industry and trade.
- Hydrogeography and architecture: the ascending trend of building area intersected that of water surface area by a large immigrant population and spreading construction area above the Asahikawa River.
- Hydrogeography and railroad: the ascending and descending trend of the railroad was caused by the completion of the main west railroad line, the semi-underground railway project, the home port of cruise tourism, and the transfer of a major part of the container port business to Taipei Port.
- Architecture and railroad: Keelung was the seventh largest container port in the world. The economy exceeded the development of the railroad. The railroad construction began in the Qing Dynasty. It has carried coal and containers since the construction of the west harbor line in 1899.
3.2. Base Fabric and Evolved Facade Vocabulary
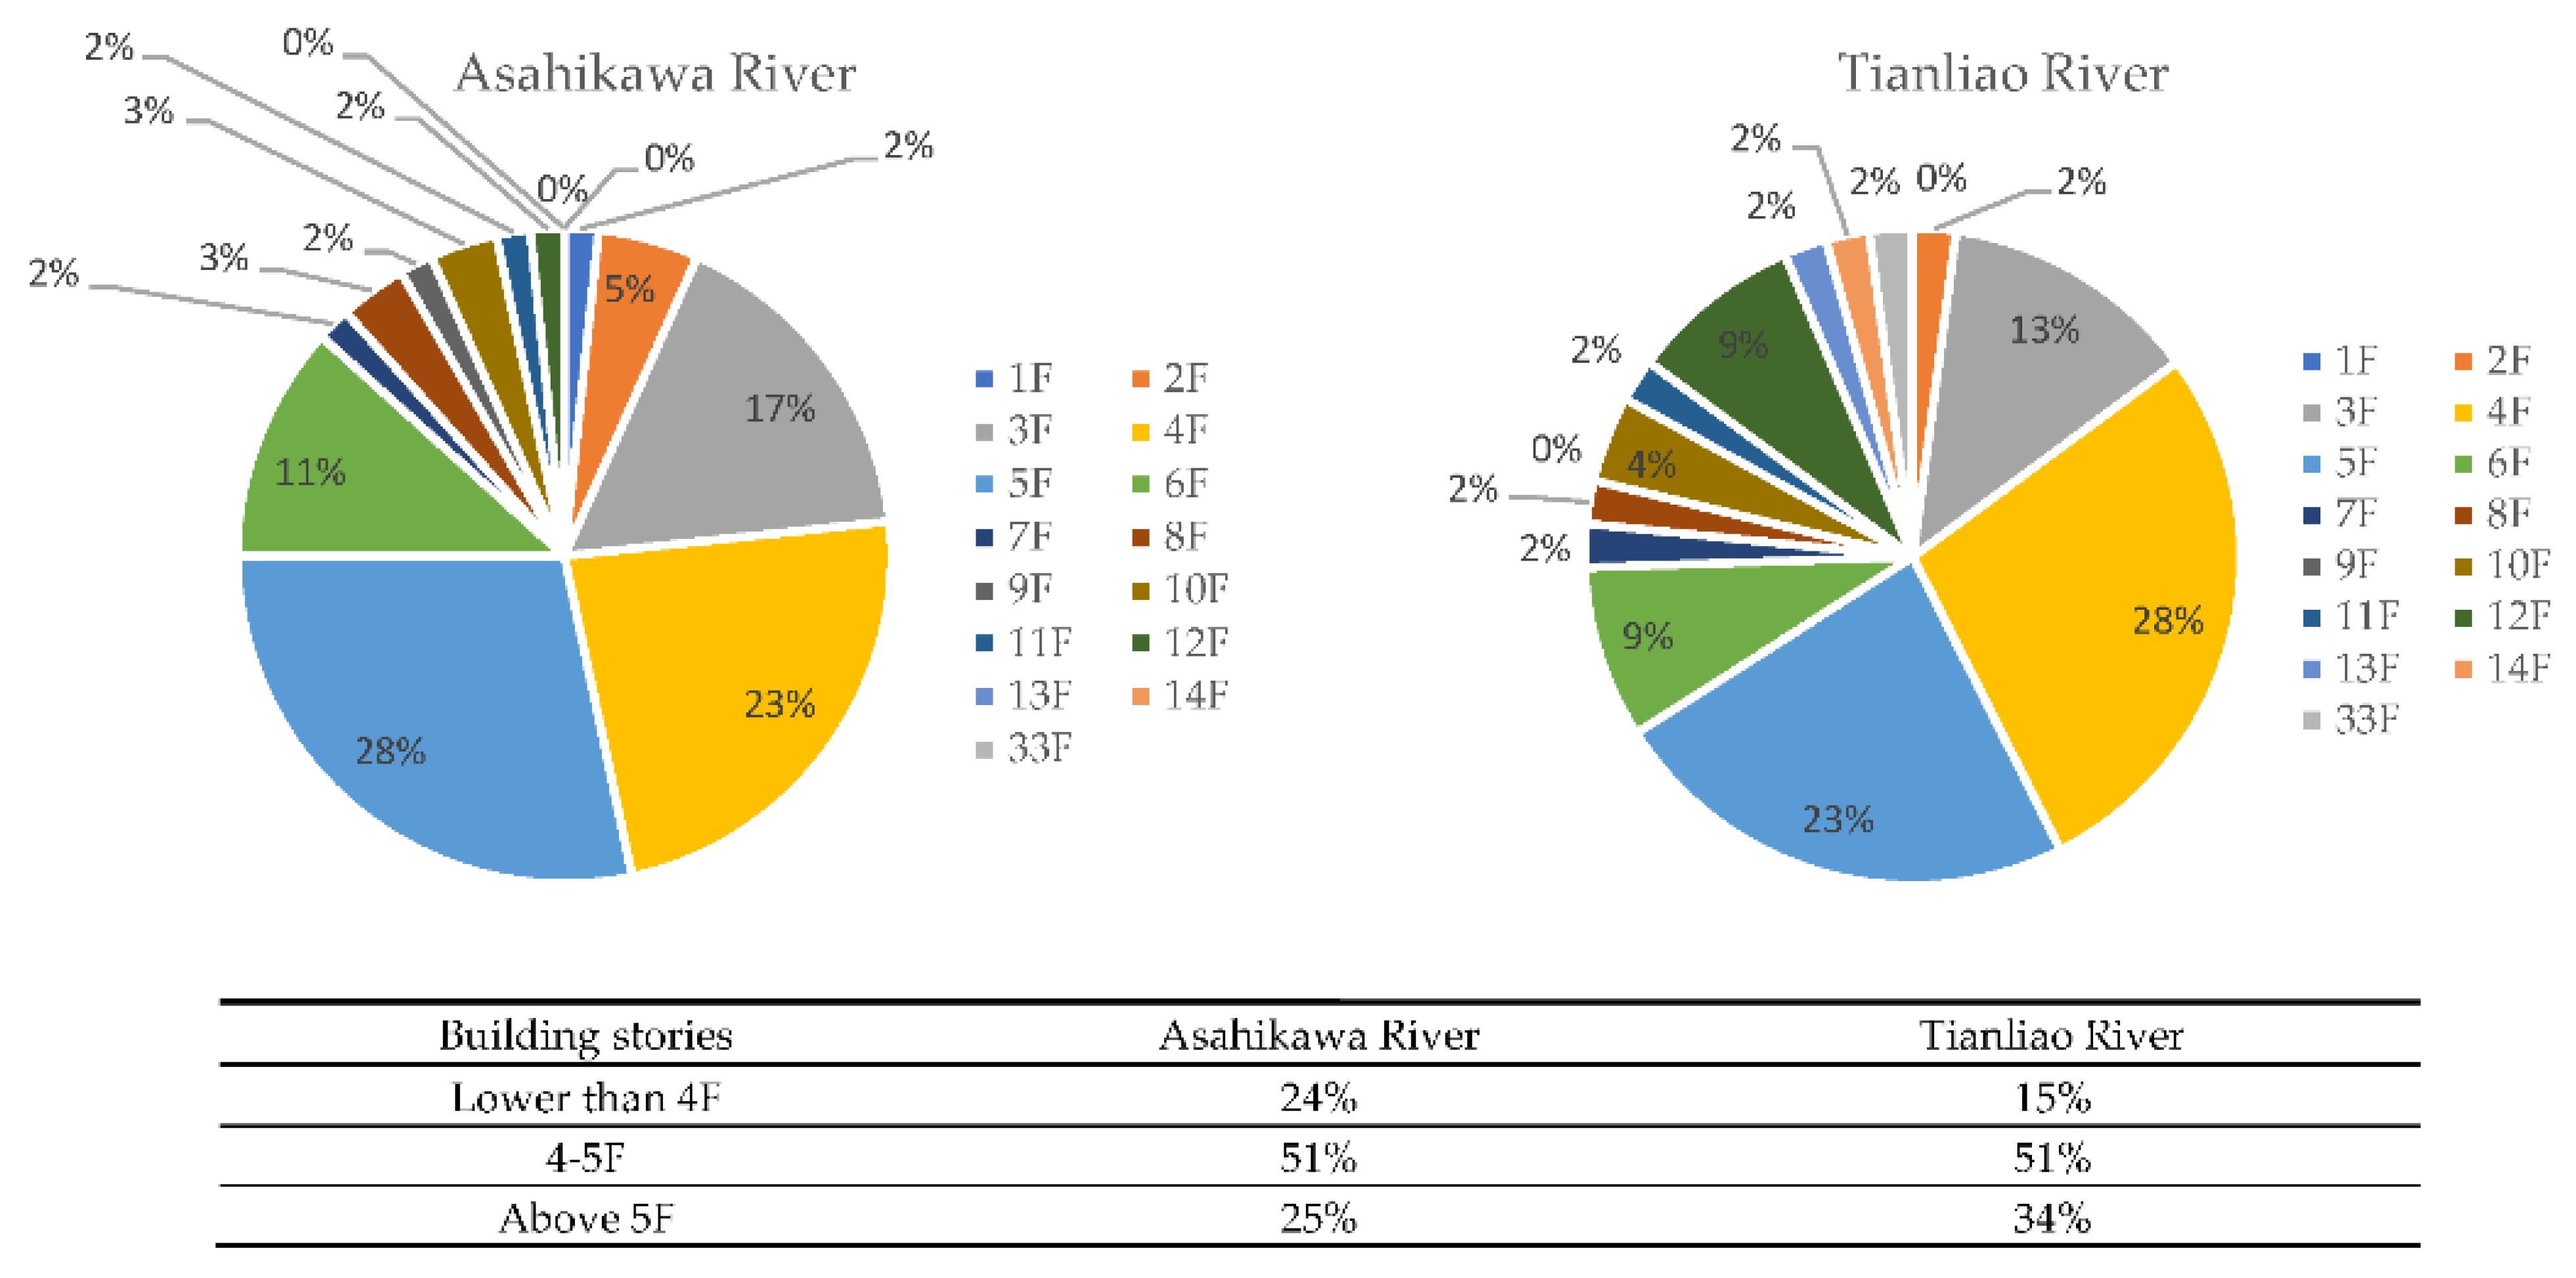
3.2.1. BCR and FAR
3.2.2. Second Skin
3.3. Evolved Fabrics
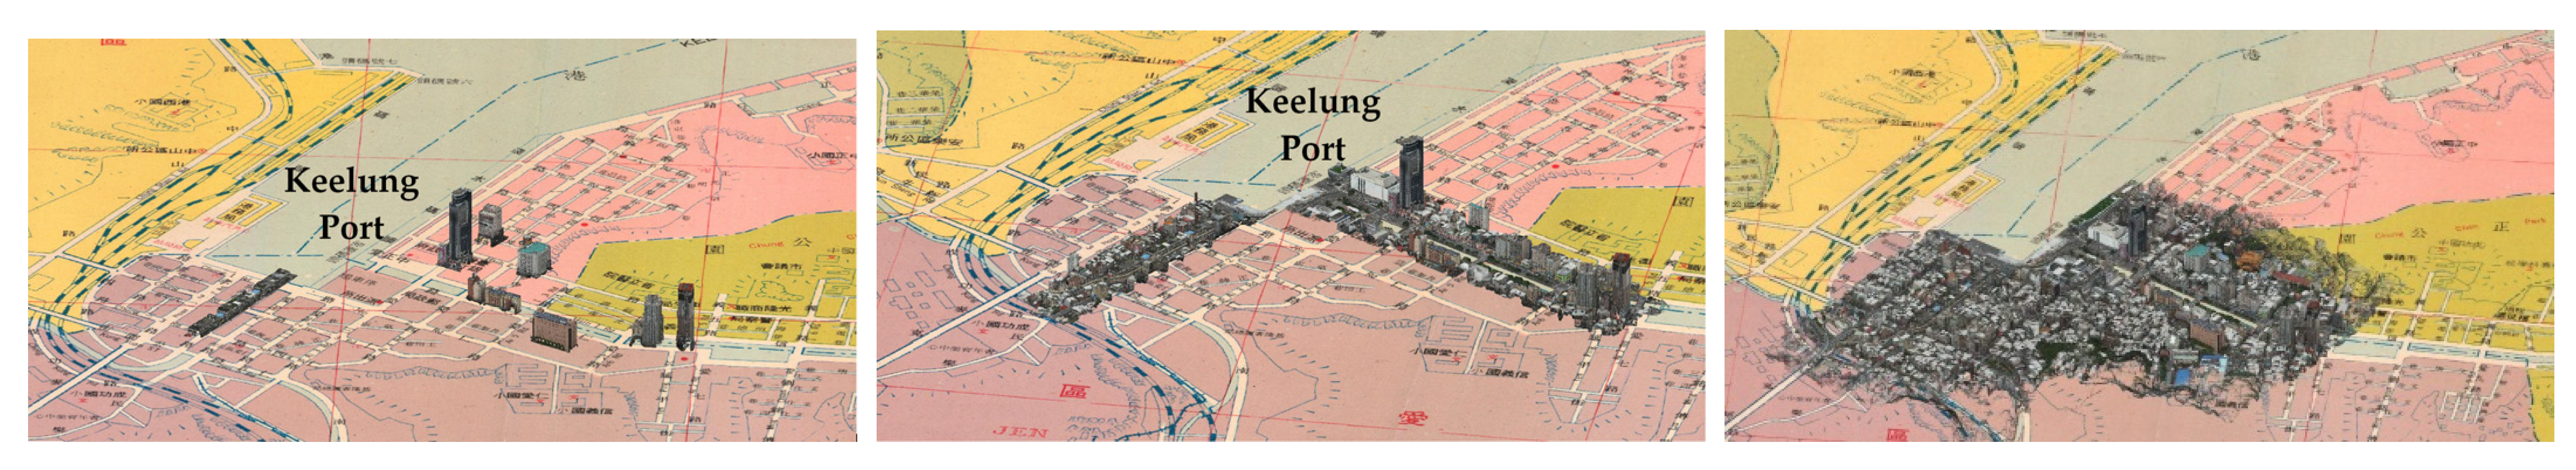
3.3.1. Skyline Alterations
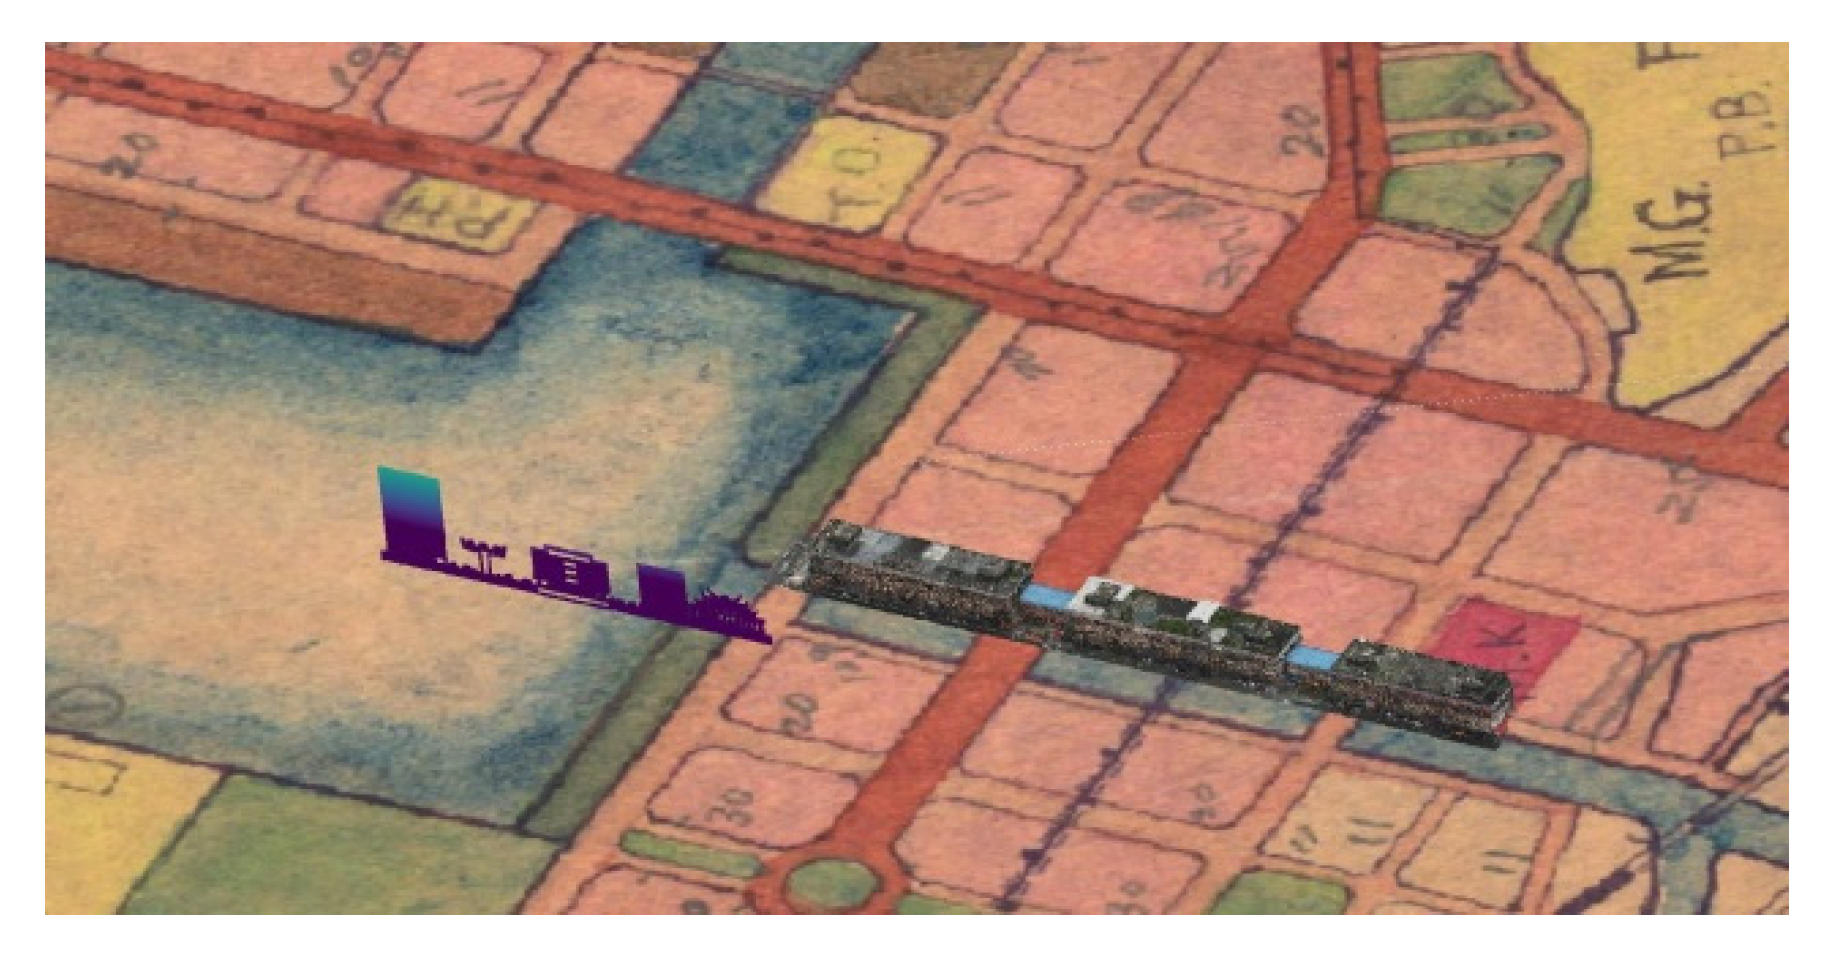
3.3.2. Fabric Substitution
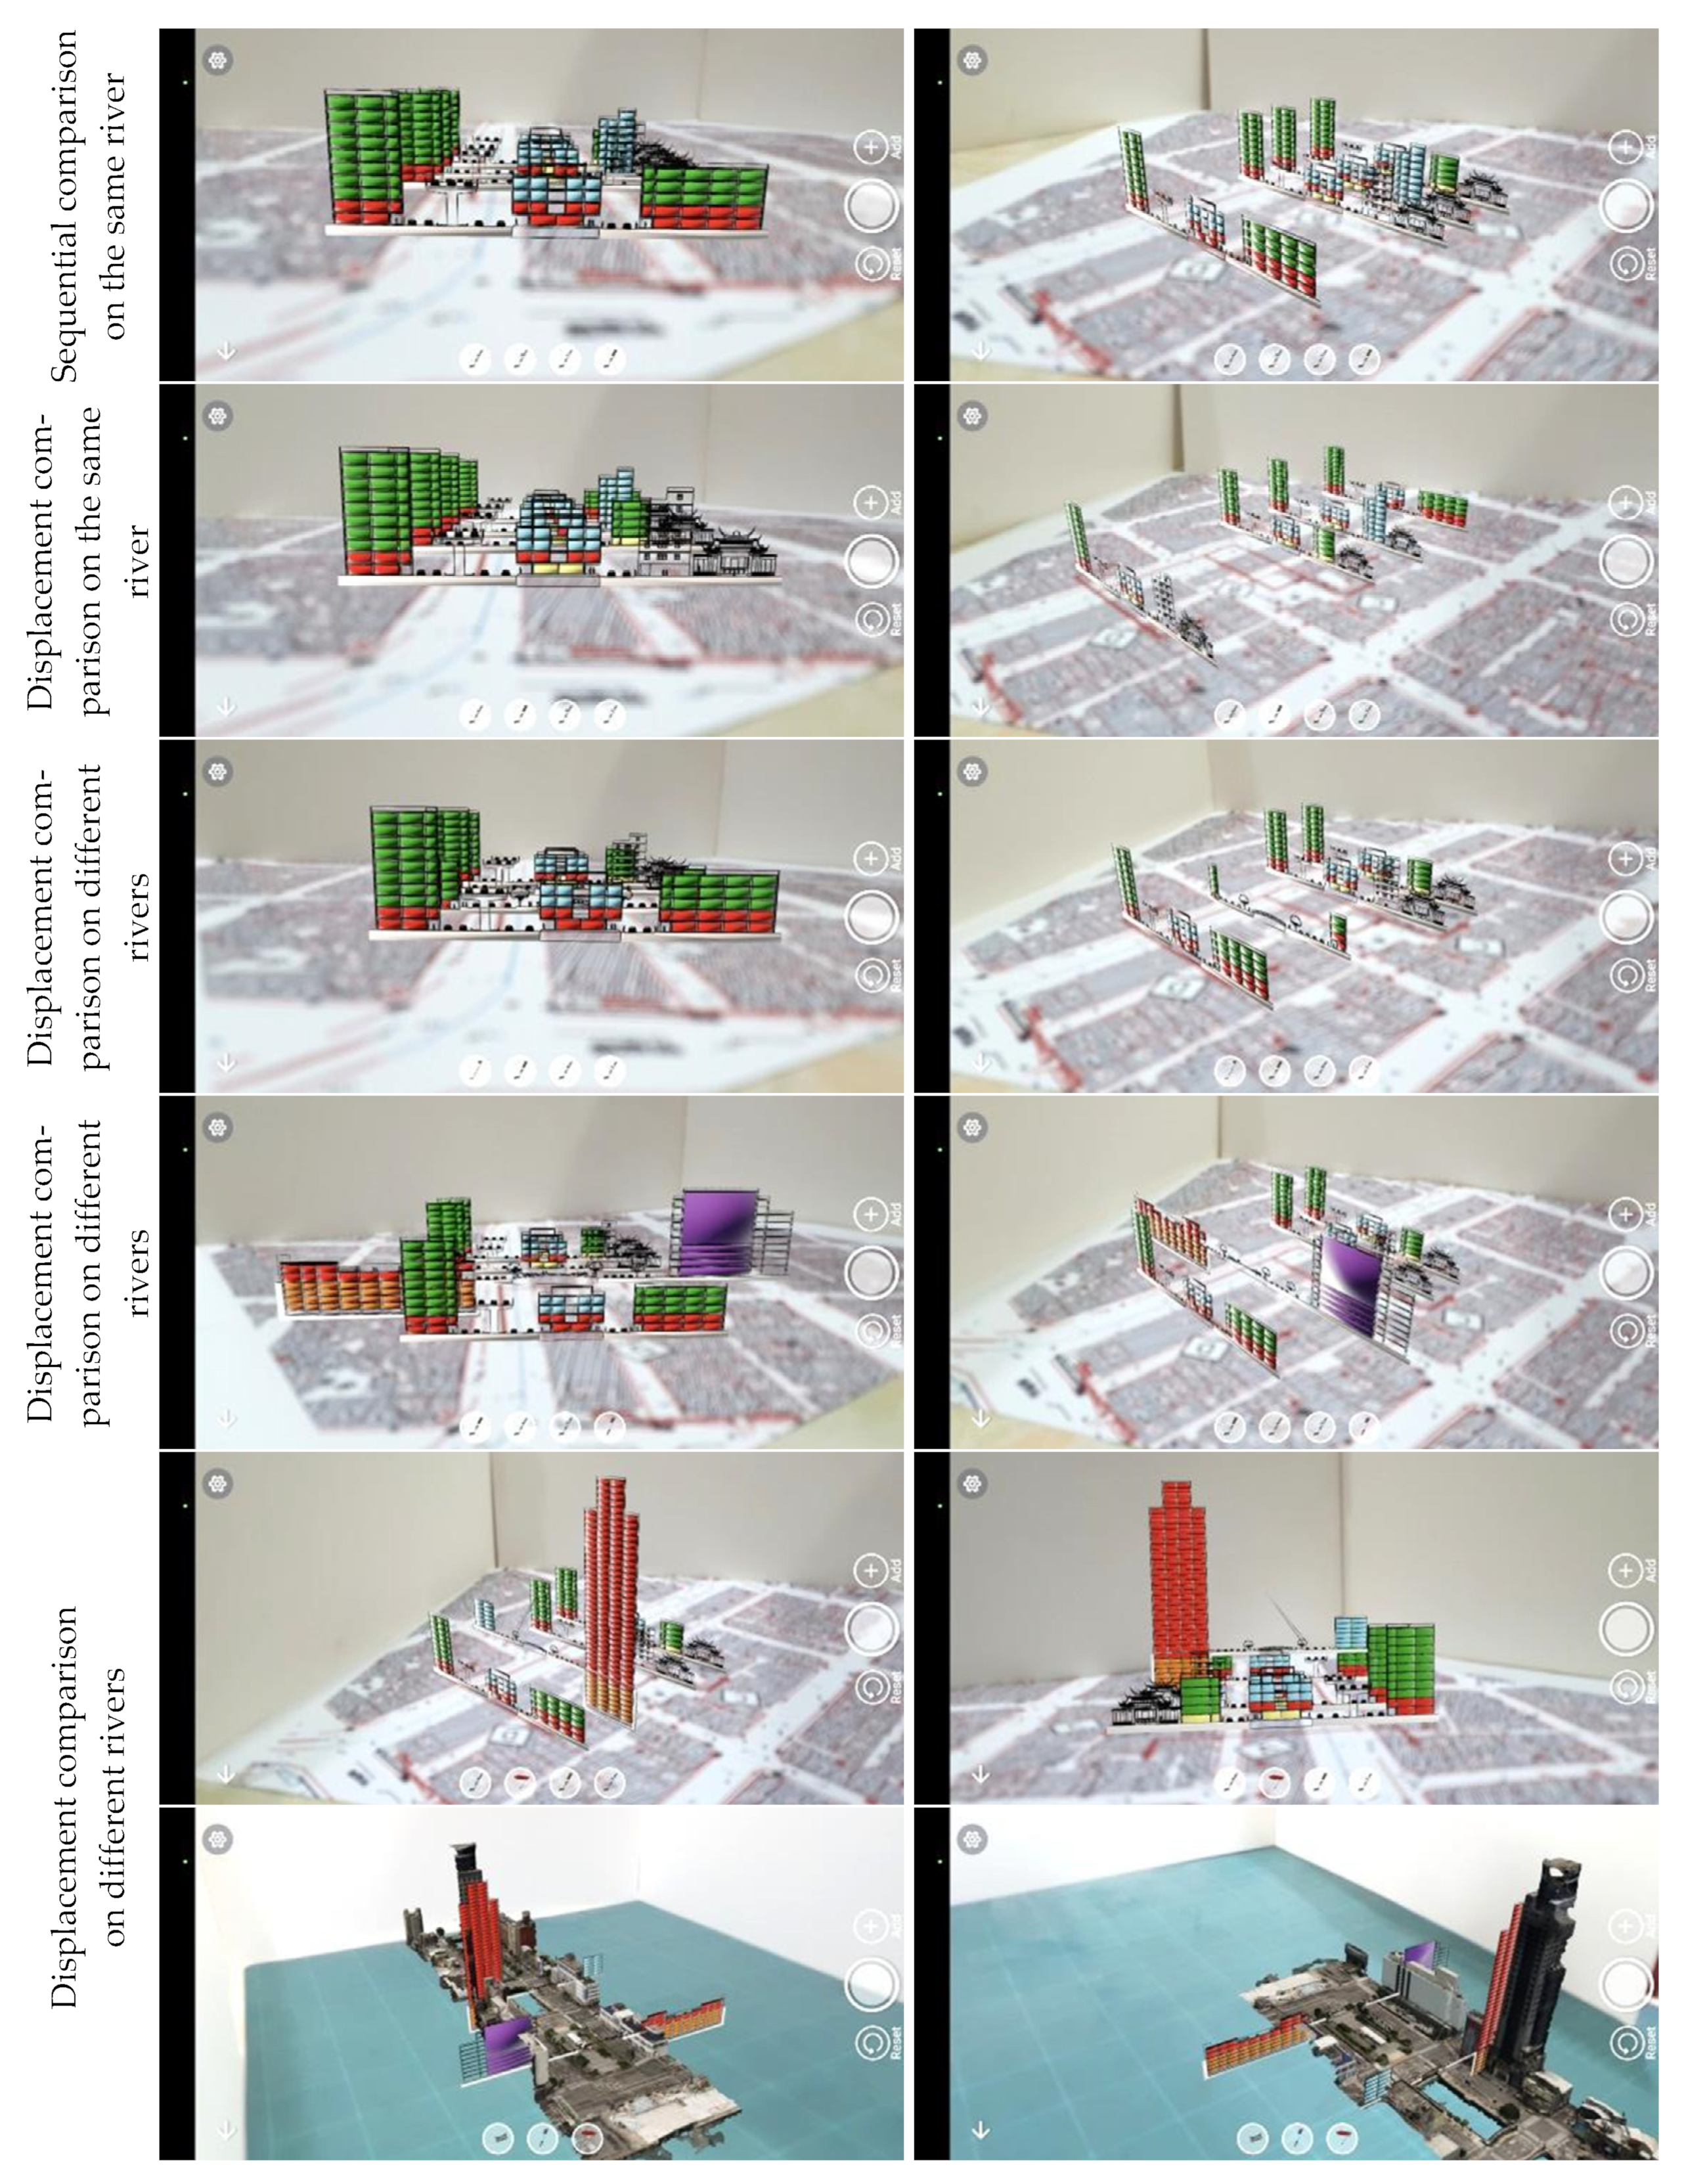
3.3.3. Fabric Disposition
- Sequential comparison on the same river, showing current layout and stages of historical development on the Asahikawa River. This arrangement presents a baseline for comparison to the current spatial arrangement with which people are familiar.
- Displacement comparison on the same river, where the harbor front is replaced with the fish market and the temple on the Asahikawa River. Sections were displaced in different sequences from harbor front to inland. For example, the commercial area was replaced by a fish market near the harbor front. The reallocation gathered similar activities, with the trade-off of potential pollution at the center of tourism. The AR interaction enabled planning to determine whether more integrated development could redefine the harbor area.
- Displacement comparison on different rivers, showing the temple front on old blocks of the Asahikawa River and on new blocks of the Tianliao River. This displacement reoccurred in the religious center along the Asahikawa River to the new Tianliao River area, to simulate the old fabric in a new integrated location. Snack culture, which usually appears at the temple front, can join the harbor front under a more concentrated arrangement of tourism space.
- Displacement comparison on different rivers, showing commercial and administrative areas on old blocks of the Asahikawa River and on new blocks of the Tianliao River. This arrangement differentiates the sustainable design of the harbor front by using the fabric of the old fish market.
- Displacement comparison on different rivers, showing landmark commercial buildings on old blocks of the Asahikawa River and on new blocks of the Tianliao River. A landmark building was located near the harbor front at the end of the Tianliao River. The cultural center, which was located between the harbor front and the landmark building, was replaced by the Mazu Temple to remind people of the old connection between religion and the traditional fishing culture. It is hoped that a synergistic effect can be created in the open spaces and associated activities at the temple front, river front, and harbor front. This effect was vividly illustrated on the GIS platform.
3.4. Emerging Dynamics
3.5. Historical Reference of Urbanization
4. Discussion
4.1. Inductive and Deductive Dynamics
- Physical dynamics, top-down, GIS to AR: maps were assessed to determine the major turning event and its drawbacks, and then to suggest the particular fabric to be simulated in AR.
- Augmented dynamics, bottom-up, AR to GIS: AR models were applied to the new fabric and were taken further back to join old maps in GIS by activating the simulation between current as-built status and past maps.
- GIS–AR–GIS or AR–GIS–AR, converging from both ends of the hierarchy: GIS–AR–GIS presented both deduction and induction of the historical fabric evolvement. A mesh model was converted to a cloud model for GIS application (Figure 16). The two-way iteration met in the middle by extending from micro interaction to macro study and the results were verified in areas by percentage diagrams. The two-way iteration included traditional vector data, second skin, and UAV models to formulate contexts and to enrich the design assumptions.
4.2. Matrix of Key Elements and Major Influential Factors
4.3. Sustainability and Urbanization
5. Conclusions
Author Contributions
Funding
Acknowledgments
Conflicts of Interest
References
- Keelung Environmental Protection Bureau (KLEPB-1). The History and Humanity of Asahikawa River. The Improvement Plan of Water Environment in Keelung. Available online: https://keelungwater.org/Environments/1589085627327 (accessed on 24 March 2022). (In Chinese).
- Keelung Environmental Protection Bureau (KLEPB-2). The History and Humanity of Tianliao River. The Improvement Plan of Water Environment in Keelung. Available online: https://keelungwater.org/Environments/1589085627328 (accessed on 24 March 2022). (In Chinese).
- RCHSS, Center for GIS. Keelung Historical Maps. Academia Sinica, Taiwan. Available online: http://gissrv4.sinica.edu.tw/gis/keelung.aspx (accessed on 18 July 2022).
- National Land Survey and Mapping Center (NLSC). Keelung Historical Maps. Center for GIS, RCHSS, Academia Sinica, Taiwan. Available online: http://gissrv4.sinica.edu.tw/gis/keelung.aspx (accessed on 18 July 2022).
- Taiwan International Ports Cooperation Ltd. (TIPC) The Introduction of Ports in Taiwan. Available online: https://www.twport.com.tw/chinese/cp.aspx?n=0D069787F30F3F6A (accessed on 24 March 2022). (In Chinese).
- Cheng, S.I. Port City-the Outward Voyage of Culture: The Investigation of Humanity Collage in Keelung Harbor; Keelung Cultural Center: Keelung, Taiwan, 2003. (In Chinese) [Google Scholar]
- Taiwan Economic Society Analysis System (TESAS). The Economy and Industry of Renai District, Keelung. Available online: https://tesas.nat.gov.tw/lflt/analysis.html (accessed on 27 July 2022). (In Chinese)
- Department of Tourism and City Marketing (DTCM), Keelung. Business District of Consignment Shops. Available online: https://tour.klcg.gov.tw/zh-hant/dining/eateries/91472862/ (accessed on 27 July 2022). (In Chinese)
- Haidvogl, G.; Winiwarter, V.; Dressel, G.; Gierlinger, S.; Hauer, F.; Hohensinner, S.; Pollack, G.; Spitzbart-Glasl, C.; Raith, E. Urban Waters and the Development of Vienna between 1683 and 1910. Environ. HIST-US. 2018, 23, 721–747. [Google Scholar] [CrossRef]
- Du, L.J.; Wang, F.; Zhang, Q.; Fang, Y.Y. Adaptation of urban distribution to the fluvial geomorphic environment and the reconstruction of the river system structure by urban distribution in Haihe Plain in the past 2200 years. River Res. Applic. 2022, 1–13. [Google Scholar] [CrossRef]
- Wang, Y.G.; Zhang, Q.H.; Zhang, F. Effects of the Fenhe River reconstruction project on wild vascular plants in urban Taiyuan, China. Ecol. Eng. 2006, 28, 174–180. [Google Scholar] [CrossRef]
- Frank, T.; Bender, J.; Wieland, J.; Jensen, J.; Griese, T. A Hydraulic and Architectural Model as Basis for Reconstruction Measures at River Sieg in the City Centre of Siegen. Wasserwirtschaft 2013, 103, 10–16. [Google Scholar] [CrossRef]
- Lyons, K. Rivers have memory: The (im)possibility of floods and histories of urban de-and- reconstruction in the Andean-Amazonian foothills. City Soc. 2018, 30, 1–15. [Google Scholar] [CrossRef]
- Ballestero, A. The Anthropology of Water. Annu. Rev. Anthropol. 2019, 48, 405–421. [Google Scholar] [CrossRef]
- Bristow, G.; Healy, A. Crisis response, choice and resilience: Insights from complexity thinking. Camb. J. Regions Econ. Soc. 2015, 8, 241–256. [Google Scholar] [CrossRef]
- Lyon, C.; Parkins, J.R. Toward a Social Theory of Resilience: Social Systems, Cultural Systems, and Collective Action in Transitioning Forest-Based Communities: Social Systems and Cultural Systems. Rural. Sociol. 2013, 78, 528–549. [Google Scholar] [CrossRef]
- Norris, F.H.; Stevens, S.P.; Pfe_erbaum, B.; Wyche, K.F.; Pfe_erbaum, R.L. Community Resilience as a Metaphor, Theory, Set of Capacities, and Strategy for Disaster Readiness. Am. J. Community Psychol. 2008, 41, 127–150. [Google Scholar] [CrossRef]
- Welsh, M. Resilience and responsibility: Governing uncertainty in a complex world. Geogr. J. 2014, 180, 15–26. [Google Scholar] [CrossRef]
- Folgado-Fernández, J.A.; Di-Clemente, E.; Hernández-Mogollón, J.M.; Campón-Cerro, A.M. Water Tourism: A New Strategy for the Sustainable Management of Water-Based Ecosystems and Landscapes in Extremadura (Spain). Land 2019, 8, 2. [Google Scholar] [CrossRef]
- LaDon, S.; Sempier, T.; Boehm, C.; Wright, C.; Thompson, J. Tourism Resilience Index: A Business Self-Assessment; MASGP-15-007-02; U.S. Department of Commerce, National Oceanic and Atmospheric Administration (NOAA): Washington, DC, USA, 2015.
- Strickland-Munro, J.K.; Allison, H.E.; Moore, S.A. Using resilience concepts to investigate the impacts of protected area tourism on communities. Ann. Tour. Res. 2010, 37, 499–519. [Google Scholar] [CrossRef]
- United Nations. United Nations Sustainable Development Knowledge Platform. Sustainable Tourism. 2016. Available online: https://sustainabledevelopment.un.org/topics/sustainabletourism (accessed on 18 November 2020).
- Ettenger, K. Marine Tourism, Climate Change, and Resilience in the Caribbean, Vol. I-Ocean Health, Fisheries, and Marine Protected Areas; Ettenger, K., Ed.; Business Expert Press: Hampton, NJ, USA, 2017; pp. 3–8. [Google Scholar]
- National Oceanic and Atmospheric Administration (NOAA). Sea Grant Coastal Tourism Vision Plan 2018–2028, Submitted 31 August 2018. Available online: https://seagrant.noaa.gov/Portals/1/FINAL%20%20Coastal%20Tourism%20Vision%20Plan%20.pdf (accessed on 14 November 2020).
- Sandhu, S.C.; Kelkar, V.; Sankaran, V. Resilient Coastal Cities for Enhancing Tourism Economy: Integrated Planning Approaches. Asian Development Bank Institute, No. 1043. November 2019. Available online: https://www.adb.org/sites/default/files/publication/541031/adbi-wp1043.pdf (accessed on 14 November 2020).
- Cole, S.; Browne, M. Tourism and Water Inequity in Bali: A Social-Ecological Systems Analysis. Hum Ecol. 2015, 43, 439–450. [Google Scholar] [CrossRef]
- Sharifi, A. Resilient urban forms: A macro-scale analysis. Cities 2019, 85, 1–14. [Google Scholar] [CrossRef]
- Cardoso, M.A.; Telhado, M.J.; Almeida, M.D.C.; Brito, R.S.; Pereira, C.; Barreiro, J.; Morais, M. Following a Step by Step Development of a Resilience Action Plan. Sustainability 2020, 12, 9017. [Google Scholar] [CrossRef]
- Desouza, K.C.; Flanery, T.H. Designing, planning, and managing resilient cities: A conceptual framework. Cities 2013, 35, 89–99. [Google Scholar] [CrossRef]
- Meerow, S.; Newell, J.P.; Stults, M. Defining urban resilience: A review. Landsc. Urban Plan. 2016, 147, 38–49. [Google Scholar] [CrossRef]
- Zhang, M.; Zhang, J.; Li, G.; Zhao, Y. A Framework for Identifying the Critical Region in Water Distribution Network for Reinforcement Strategy from Preparation Resilience. Sustainability 2020, 12, 9247. [Google Scholar] [CrossRef]
- Padilla-Llano, S.E.; Machado-Penso, M.V.; Reyes-Schade, E.; Larios-Giraldo, P.M.; Cabrera-Sánchez, I.; Martínez-Palacios, E.; González-Forero, D.; Martínez, T. BARRIO EL PRADO Un Museo Vivo Para La Ciudad De Barranquilla. Waterfront 2020, 62, 3–46. [Google Scholar] [CrossRef]
- Kane, S.C. Stencil graffiti in urban waterscapes of Buenos Aires and Rosario, Argentina. Crime Media Media Cult. 2009, 5, 9–28. [Google Scholar] [CrossRef]
- De Alarcón, M.A. Imag(e)ing the Urban Water Commons. J. Archit. Educ. 2020, 74, 49–59. [Google Scholar] [CrossRef]
- Gopikumar, S.; Banu, J.R.; Robinson, Y.H.; Raja, S.; Vimal, S.; Pelusi, D.; Kaliappan, M. Geo Spatial Based Real Time Monitoring on Eutrophic Evaluation of Porunai River Basin for Pollution Risk Assessment. Eur. J. Remote Sens. 2022, 1–13. [Google Scholar] [CrossRef]
- Changsen, Z.; Shengtian, Y. Ecology of China’s pilot cities for creating healthy aquatic communities: Heterogeneity, niches and environmental factors. Mar. Freshw. Res. 2019, 70, 611–614. [Google Scholar] [CrossRef]
- Faggi, A. Renewal of Buenos Aires city waterfront. In Proceedings of the Institution of Civil Engineers-Municipal Engineer; Thomas Telford Services Ltd.: London, UK, 2010; Volume 163, pp. 23–31. [Google Scholar] [CrossRef]
- Marti-Ciriquian, P.; Garcia-Mayor, C. Waterfronts in Spanish cities: New urban spaces. Bitácora Urbano Territ. 2018, 28, 71–79. [Google Scholar] [CrossRef]
- Arthington, A.H. Environmental Flows: Saving Rivers in the Third Millennium; University of California Press: Berkeley, CA, USA, 2012. [Google Scholar]
- Rodríguez-Burgueño, J.E.; Shanafield, M.; Ramírez-Hernández, J. Comparison of infiltration rates in the dry riverbed of the Colorado River Delta during environmental flows. Ecol. Eng. 2017, 106 (Pt B), 675–682. [Google Scholar] [CrossRef]
- Trombadore, O.; Nandi, I.; Shah, K. Effective data convergence, mapping, and pollution categorization of ghats at Ganga River Front in Varanasi. Environ. Sci. Pollut. Res. 2020, 27, 15912–15924. [Google Scholar] [CrossRef]
- Barsi, Á.; Kugler, Z.; Juhász, A.; Szabó, G.; Batini, C.; Abdulmuttalib, H.; Huang, G.; Shen, H. Remote sensing data quality model: From data sources to lifecycle phases. Int. J. Image Data Fusion 2019, 10, 280–299. [Google Scholar] [CrossRef]
- Lunetta, R.S.; Congalton, R.G.; Fenstermaker, L.K.; Jensen, J.R.; McGwire, K.C.; Tinny, L.R. Remote Sensing and Geographic Information System Data Integration: Error Sources and Research Issues. Photogramm. Eng. Remote Sens. 1991, 57, 677–687. [Google Scholar]
- Pylvänäinen, T.; Berclaz, J.; Korah, T.; Hedau, V.; Aanjaneya, M.; Grzeszczuk, R. 3D city modeling from street-level data for augmented reality applications. In Proceedings of the Second Joint 3DIM/3DPVT Conference: 3D Imaging, Modeling, Processing, Visualization & Transmission, Zurich, Switzerland, 13–15 October 2012; pp. 238–245. [Google Scholar] [CrossRef]
- Di Angelo, L.; Di Stefano, P.; Fratocchi, L.; Marzola, A. An AHP-based method for choosing the best 3D scanner for cultural heritage applications. J. Cult. Herit. 2018, 34, 109–115. [Google Scholar] [CrossRef]
- Kounavis, C.D.; Kasimati, A.E.; Zamani, E.D. Enhancing the Tourism Experience through Mobile Augmented Reality: Challenges and Prospects. Int. J. Eng. Bus. Manag. 2012, 4, 1–6. [Google Scholar] [CrossRef]
- Comes, R.; Neamțu, C.; Buna, Z.; Badiu, I.; Pupeză, P. Methodology to Create 3D Models for Augmented Reality Applications Using Scanned Point Clouds. Mediterr. Archaeol. Archaeom. 2014, 14, 35–44. [Google Scholar] [CrossRef]
- Bekele, M.K.; Pierdicca, E.; Frontoni, E.; Malinverni, S.; Gain, J. A survey of augmented, virtual, and mixed reality for cultural heritage. J. Comput. Cult. Herit. 2018, 11, 1–36. [Google Scholar] [CrossRef]
- Wu, B.; Tang, S.; Zhu, Q.; Tong, K.Y.; Hu, H.; Li, G. Geometric integration of high-resolution satellite imagery and airborne LiDAR data for improved geopositioning accuracy in metropolitan areas. ISPRS J. Photogramm. Remote Sens. 2015, 109, 139–151. [Google Scholar] [CrossRef]
- Lachat, E.; Landes, T.; Grussenmeyer, P. Investigation of a combined surveying and scanning device: The Trimble SX10 scanning total station. Sensors 2017, 17, 730. [Google Scholar] [CrossRef] [PubMed]
- Wu, Q.; Lane, C.R.; Li, X.; Zhao, K.; Zhou, Y.; Clinton, N.; DeVries, B.; Golden, H.E.; Lang, M.W. Integrating LiDAR data and multi-temporal aerial imagery to map wetland inundation dynamics using Google Earth Engine. Remote Sens. Environ. 2019, 228, 1–13. [Google Scholar] [CrossRef]
- Georgoula, O.; Stamnas, A.; Patias, P.; Georgiadis, C.; Fragkoulidou, V. Historical coastal urban landscapes digital documentation and temporal study with 2D/3D modeling functionality: The case of Thessaloniki, Greece. J. Cult. Herit. 2013, 14, 396–402. [Google Scholar] [CrossRef]
- Mohd Noor, N.; Ibrahim, I.; Abdullah, A.; Abdullah, A.A.A. Information Fusion for Cultural Heritage Three-Dimensional Modeling of Malay Cities. ISPRS Int. J. Geo-Inf. 2020, 9, 177. [Google Scholar] [CrossRef]
- Ergun, B.; Sahin, C.; Baz, I.; Ustuntas, T. A case study on the historical peninsula of Istanbul based on three-dimensional modeling by using photogrammetry and terrestrial laser scanning. Environ. Monit. Assess. 2010, 165, 595–601. [Google Scholar] [CrossRef]
- Shih, N.J.; Lin, C.Y. The evolving urban fabric and contour of old mountain streets in Taiwan. Tour. Geogr. 2019, 21, 24–53. [Google Scholar] [CrossRef]
- RCHSS-2, Center for GIS. Keelung historical maps WMTS service. (Version 2021-02-03T16:04:00.078753) [Keelung_14.6K_1899, Keelung_5K_1907b, Keelung_1929, Keelung_1930, Keelung_10K_1937, Keelung_10K_1941, Keelung_10K_1946b, Keelung_6K_1971, Keelung_7.6K_1974], Academia Sinica, Taiwan. Available online: http://gissrv4.sinica.edu.tw/gis/keelung.aspx (accessed on 18 July 2022).


| 2D and 3D Resources | Cross Platforms | Software Environment | Situated Simulation |
|---|---|---|---|
| Images: smartphone, UAV Vector drawings: sections 3D wireframe 3D mesh 3D point cloud GIS maps | UAV Photogrammetry GIS Smartphone Imaging AR Drafting 3D modeling | 3D: AutoCAD®, Revit® Photogrammetry modeling: Zephyr®, Recap 3D®, by field photos and UAV: Dji® (Table 2) GIS: QGIS® AR: Augment® AR types: skyline + façade mesh, map + 3D wireframe, 3D model + wireframe | Concluded façade patterns: façade height, partition Evolving fabrics Renewal plans Reactivated experience Reallocated experience |
| Cameras | Camera Name | Focal Length | Resolution | |||
|---|---|---|---|---|---|---|
| DJI Zenmuse P1® | 35.0 mm | 8192 × 5460 | ||||
| Internal camera parameters | Camera Model | Skew | Focals | Optical center | Radial distortion | Tangential distortion |
| DJI Zenmuse P1® | 0.000000 | X: 8193.548775 Y: 8193.548775 | X: 4070.504310 Y: 2771.848868 | K1: −0.048187 K2: 0.017366 K3: −0.087201 | P1: 0.002215 P2: −0.001303 | |
| Statistics | 3D points per image | Oriented cameras | BA mean square error | BA reference variance | ||
| 3654 | 1351 | 1.96012 px | 0.586896 px | |||
| Mean GSD | 0.0320376 | |||||
| Mean error |  | |||||
| Measure instance: verification of pavement length |  |  | ||||
| Measure in Zephyr®: 20.46644 m (avg.) | Field measure: 20.525 m | |||||
| Types of 3D Models | Types of AR Applications | Map Sets |
|---|---|---|
| 3D wireframe sections: 14 Second skin facade 3D mesh models: 10 Paired model comparison: 45 Paired pattern comparison: 45 Point cloud model: 4 Riverfront: 2 Tall building set: 1 Area: 1 Inner harbor mesh model: 1 | Skyline alternations: 4 Fabric substitutions: 8 Fabric disposition: 10 Two-way experiences of approaching orientations | Assessment: 10 QGIS® 3D view: 10 |
| vocabulary 1 | old | new | now | |
 | Asahikawa River |  | 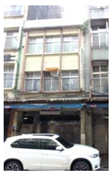 |  |
| vocabulary 2 | old | now | ||
 | Tianliao River |  |  | |
| Model No. (Asahikawa River) | Model l | Model 2 | Model 3 | ||
|---|---|---|---|---|---|
| AR façade model (left) Vertical and horizontal partitions (right) |  |  |  | ||
| Building materials | Face bricks | Granitoid, face bricks | Concrete | ||
| Height/width ratio | 14.45:6.38 (2.26) | 17:6.27 (2.71) | 7.6:6.32 (1.20) | ||
| Building style | Baroque | Baroque | Modern | ||
| Usage | Commercial buildings, residences | Commercial buildings, residences | Fish market | ||
| Leveled-up area | x | x | x | ||
| Paired comparisons | Model 1 vs. 9 | Model 1 vs. 10 | Model 2 vs. 3 | Model 3 vs. 5 | Model 1 vs. 5 |
| Vertical and horizontal partitions |  |  |  |  |  |
| Hydrogeography | Architecture | Railroad | |
|---|---|---|---|
| Quantification | Max. area: increased 2.147 km2 in 1876 (7.8%) Min. area: increased 1.111 km2 in 2015 (4%) Max. %: from 6.5% in 1858 to 7.8% in 1875 | Max. area: increased 2.88 km2 in 2003 (14.6%) Min. area: increased 0 km2 in 1858, 1876 (0%) Max. %: from 4.7% in 1979 to 13.7% in 1985 | Max. area: increased 7.856 km in 1921 (12.4%) Min. area: increased 0 km in 1858, 1876, 1888, 1899 (0%) Max. %: from 0% in 1899 to 12.4% in 1921 |
| Phase 1 port construction | x | ||
| Phase 2 port construction | x | ||
| Phase 3 port construction | x | ||
| Phase 4 port construction | x | ||
| Phase 5 port construction | x | ||
| New construction on leveled-up Asahikawa River | x | x | |
| Urban planning of Keelung | x | ||
| Positioned as main container port in N Taiwan | x | x | |
| Positioned as main cruise port | x | x | |
| Construction of west main railroad line | x | ||
| Railroad construction for mining industry | x | ||
| Semi-underground project of Keelung railroad station | x |
Publisher’s Note: MDPI stays neutral with regard to jurisdictional claims in published maps and institutional affiliations. |
© 2022 by the authors. Licensee MDPI, Basel, Switzerland. This article is an open access article distributed under the terms and conditions of the Creative Commons Attribution (CC BY) license (https://creativecommons.org/licenses/by/4.0/).
Share and Cite
Shih, N.-J.; Qiu, Y.-H. Resolving the Urban Dilemma of Two Adjacent Rivers through a Dialogue between GIS and Augmented Reality (AR) of Fabrics. Remote Sens. 2022, 14, 4330. https://doi.org/10.3390/rs14174330
Shih N-J, Qiu Y-H. Resolving the Urban Dilemma of Two Adjacent Rivers through a Dialogue between GIS and Augmented Reality (AR) of Fabrics. Remote Sensing. 2022; 14(17):4330. https://doi.org/10.3390/rs14174330
Chicago/Turabian StyleShih, Naai-Jung, and Yu-Huan Qiu. 2022. "Resolving the Urban Dilemma of Two Adjacent Rivers through a Dialogue between GIS and Augmented Reality (AR) of Fabrics" Remote Sensing 14, no. 17: 4330. https://doi.org/10.3390/rs14174330
APA StyleShih, N.-J., & Qiu, Y.-H. (2022). Resolving the Urban Dilemma of Two Adjacent Rivers through a Dialogue between GIS and Augmented Reality (AR) of Fabrics. Remote Sensing, 14(17), 4330. https://doi.org/10.3390/rs14174330