Article

Impacts of National Highway G214 on Vegetation in the Source Area of Yellow and Yangtze Rivers on the Southern Qinghai Plateau, West China

1
School of Civil Engineering, Permafrost Institute, Ministry of Education Observation and Research Station of Permafrost Geo-Environment System in Northeast China, Northeast Forestry University, Harbin 150040, China
2
State Key Laboratory of Frozen Soils Engineering, Key Laboratory of Remote Sensing of Gansu Province, Northwest Institute of Eco-Environment and Engineering, Chinese Academy of Sciences, Lanzhou 730000, China
3
Institute for Alpine Environment, Eurac Research, 39100 Bolzano, Italy
4
Applied Geomorphology and Interdisciplinary Research Centre, Department of Geography, West University of Timișoara, 300223 Timișoara, Romania
5
Department of Oil&Gas Storage and Transportation Engineering, School of Engineering, China University of Petroleum-Beijing at Karamay, Karamay 834000, China
6
School of Forestry, Northeast Forestry University, Harbin 150040, China
*
Author to whom correspondence should be addressed.
These authors contributed equally to this work.
Remote Sens. 2023, 15(6), 1547; https://doi.org/10.3390/rs15061547
Submission received: 2 February 2023 / Revised: 4 March 2023 / Accepted: 7 March 2023 / Published: 12 March 2023
(This article belongs to the Special Issue Remote Sensing of Dynamic Permafrost Regions Ⅱ)

Abstract

:
Engineering corridors on the Qinghai–Tibet Plateau have substantially modified the regional ecosystem functions and environment, resulting in changes in the alpine ecosystem. In addition, the building and operation of these engineering corridors have led to rapid permafrost degradation, which in turn has impacted local vegetation along these corridors. This study investigated vegetation changes and their driving factors by the methods of coefficient of variation, correlation analysis, and GeoDetector in a 30 km wide buffer zone at each side along the National Highway G214 (G214) at the northern and southern flanks of the Bayan Har Mountains in part of the source area of the Yellow and Yangtze rivers on the southern Qinghai Plateau, West China. The following results were obtained: (1) The Normalized Difference Vegetation Index in Growing Season (NDVIgs) rose slightly in 2010–2019, with an average annual change rate of 0.006/a. Patterns of NDVIgs along the G214 exhibited “low at the northern flank and high at the southern flank of the Bayan Har Mountains”. (2) Spatially, average NDVIgs increased from the first buffer zone at the distance of 0–10 km from the highway centerline to the second buffer zone at 20–30 km perpendicularly away from the G214. Furthermore, the first buffer zone had the lowest coefficient of variation, possibly due to a low vegetation recovery as a result of the greatest influence of the G214 on NDVIgs at 0–10 km. (3) Furthermore, annual precipitation (AP) was the dominant factor for significantly (p < 0.01) and positively influencing the variations in NDVIgs (R = 0.75, p < 0.01). Additionally, NDVIgs was more strongly influenced by the two combined factors than any single one, with the highest q-value (0.74) for the interactive influences of AP and annual average air temperature (AAAT) and followed by that of the AP and mean annual ground temperature (MAGT) at the depth of zero annual amplitude (15 m). Evidently, the construction and operation of the G214 have directly and indirectly affected vegetation through changing environmental variables, with significant impacts on NDVIgs extended at least 20 km outwards from the highway. This study helps better understand the environmental impacts along the engineering corridors in elevational permafrost regions at mid and low latitudes and their management.

1. Introduction

Climate warming and human disturbances can directly affect the thermal state of permafrost or indirectly impact permafrost through changes in vegetation, snow cover, land use and cover change, and in many other hydroclimatic aspects [1,2]. A gradual intensification of climate warming might lead to increased droughts and floods, reduced vegetation cover and biodiversity, and warming and thawing of permafrost, with profound impacts on natural ecosystems and human societies [3,4,5,6,7]. Found between the atmosphere and soil or surface waters [8], vegetation is important for global mass, energy, and carbon cycles [9]. With rapidly advancing technology in remote sensing, the accumulation of abundant multi-temporal, multi-band, and higher-resolution satellite remote sensing data [10,11] has provided powerful tools and data support for the monitoring of large-scale vegetation dynamics [12,13,14]. This has facilitated the study of longtime series of vegetation change, which plays a crucial role in our responses and adaptation to rapidly changing climate, prudent management of the ecological environment, and future harmonious coexistence of humans and nature [15,16,17].
As a result of climate change and anthropogenic pressures, vegetation cover has changed substantially at global and regional scales [18,19,20]. Using the Normalized Difference Vegetation Index (NDVI), numerous studies have documented the rapidness and complexity of vegetative responses to climate change [21,22,23], and as a handy and effective tool, NDVI could quantitatively reflect the dynamics of vegetation cover [24,25,26,27,28]. Globally, annual precipitation (AP) and air temperature are key climate controllers and important environmental variables for NDVI dynamics and their changes [29,30]. Regionally, Growth Season NDVI (NDVIgs) is highly correlated with growth season precipitation, and the NDVI tends to increase significantly [31,32]. For example, in alpine regions, changes in NDVI are also influenced by ground thermal regimes, snow cover, and altitudinal climate zonation [33,34,35]. In plains, hills, mountains, and grasslands, changes in NDVI are inevitably and extensively affected by the magnitude and intensity of human activities (e.g., extensive urbanization, massive construction projects, intensive cattle grazing, and rapid population growth) [36,37,38]. Overall, these studies have improved our understanding of the responsive shifts of vegetation to hydroclimatic and environmental changes at different spatiotemporal scales.
The responses of vegetation to environmental changes are extremely complex [39,40] and highly variable [41,42]. Related studies have shown that the effects of precipitation, air temperature, permafrost conditions, and human activities on vegetation are spatially heterogeneous [43,44,45]. Meanwhile, there are certain lags in related vegetation changes in response to shifts in hydroclimate patterns [46,47]. Furthermore, many scholars have analyzed the correlations between NDVI and its drivers, using correlation, regression trends, and geographically weighted regression, e.g., [48,49,50]. However, analyses with a single method may not be adequate for reflecting the changes or evolution of the interactive hydroclimatic and environmental processes or trends. Therefore, in this study, the methods of spatial autocorrelation, coefficient of variation (CV), and Geographical Detector (GeoDetector) have been adopted for more systematic and more in-depth investigation of the influences of single and multiple drivers on changes in NDVI in alpine permafrost regions.
Since the 21st century, with rapidly developing highway networks, engineering activities have increased. The construction, operation, and maintenance activities of highways have affected vegetation in permafrost regions [51,52]. Despite an overall increased trend in alpine vegetation, the deterioration of alpine vegetation was found in the Qinghai–Tibet Engineering Corridor [53]. In addition, another study showed that the impacts of the Qinghai–Tibet Engineering Corridor were extended to about 1.5 km on each side [54]. However, there is insufficient information regarding the dominant influencing factors on alpine vegetation. Additionally, there is a paucity of information regarding elevational permafrost and its degradation along the highway and whether this is associated with alpine vegetation and its changes. The impacts of climate change on the Qinghai–Tibet Plateau (QTP), a region of key ecological significance, have been well-reported, with only little attention paid to the smaller corridor regions along major lifelines, such as the Qinghai–Tibet highway and railway [55,56].
The source area of the Yellow and Yangtze rivers (SAYYR) is on the southern Qinghai Plateau (SQP), West China. Its unique geological and hydroclimatic environment has long nurtured relatively stable alpine vegetation ecosystems extremely sensitive and responsive to hydroclimatic and environmental changes [57,58,59]. Under the dual action of climate change and human disturbances, alpine ecology and the periglacial environment along the National Highway 214 (G214) in the SAYYR have changed substantially, and vegetation cover and land use have also been modified accordingly [58,60]. The G214 is an important part of the Qinghai–Kang (West Sichuan Province) Engineering Corridor, and vegetation and changing permafrost have irreplaceable roles in maintaining basin-wide and regional ecological security and sustainable development of human society. In this study, along the G214 in the SAYYR, the spatiotemporal patterns of alpine vegetation have been characterized; the impacts of the G214 on the NDVIgs have been evaluated, and their environmental drivers have been identified. This study could help better understand the impacts of highway and hydroclimate changes on alpine vegetation in elevational permafrost regions and, accordingly, planning and management.

2. Materials and Methods

2.1. Study Area

In the SAYYR on the SQP, permafrost interacts intricately and intensively with alpine hydroclimate and ecological environment. The continental high-plateau or alpine climate of the study area is characterized by long and severely cold winters but short and mild summers, large diurnal temperature differences, small AP, major rainfall in the warm season, and distinct dry and wet seasons [54]. During the period of 2010–2019, average annual air temperature (AAAT) was −5.7 °C, and AP was 326.2–618.9 mm in the study area. Precipitation varied significantly from season to season. The temperature and precipitation decreased from southeast to northwest in the SAYYR [26].
Increasing human activities have resulted in permafrost degradation in the SAYYR [58,60,61]. The construction and operation of the G214 have directly or indirectly affected alpine vegetation and changed soil hydrology and nutrients along the engineering corridor, resulting in warming and/or thawing of the underlying active layer and permafrost and modified or altered alpine ecosystems in the right-of-way along the engineering corridor [55,62,63,64,65].
The chosen study area is a segment of the G214 from the Changshitoushan Mountain Pass to Qingshui’he Riverside crossing the northern and southern flanks of the Bayan Har Mountains; it is a 60 km wide buffer zone (a 30 km buffer zone at each side) with elevation at 3761–5767 m a. s. l. (Figure 1). This 30 km buffer zone was divided into three subzones based on the resolution of the data we used. The southern flank of the Bayan Har Mountains in the Yangtze River Basin is characteristic of a semi-humid and cold climate, while the northern flank in the Yellow River Basin is characteristic of a semi-arid and cold climate, with strong influences from the summer monsoons on the southern flank and the upper winter westerlies on the northern flank [65]. They result in more precipitation on the windward southern flank and less precipitation on the leeward northern flank of the Bayan Har Mountains, significantly impacting the spatial variations in vegetation features [60]. Sedge-dominated alpine (marsh) meadows prevail in the study area.

2.2. Data Sources

Growth season (from May to September) NDVI (NDVIgs) data in the study area for each year from 2010 to 2019 were downloaded from the Data Center for Resource and Environmental Sciences, Chinese Academy of Sciences (URL:https://www.resdc.cn/data.aspx?DATAID=342, accessed on 5 March 2023), with a spatial resolution of 1.0 km. Elevation data were downloaded from the Japan Aerospace Exploration Agency (JSXA URL:https://www.eorc.jaxa.jp/ALOS/en/aw3d30/data/index.htm, accessed on 9 March 2023); the slope data were generated by DEM, with a spatial resolution of 30 m (released in March 2017). Meteorological data were collected from the annual spatial interpolation dataset of Chinese meteorological elements (URL:http://www.resdc.cn, accessed on 5 March 2023), and in this paper, a 1.0 km spatial resolution was obtained for the datasets of AP and AAAT. Snow cover data were acquired from the day-by-day cloudless MODIS Normalized Difference Snow Index (NDSI) product for Asian high mountains, with a spatial resolution of 0.5 km (URL:https://cstr.cn/18406.11.Cryos.tpdc.272836, accessed on 9 March 2023) [67] (Table 1). The data of mean annual ground temperatures (MAGT) at the depth of zero annual amplitude (15 m) were manually obtained from boreholes in July or August in 2010, 2013, 2016, and 2019 along the G214. All ground temperatures are calculated from the electrical resistivity measured in the field using the Fluke meter (accuracy of 0.05%, model: 289, Fluke Corporation, Everett, Washington, DC, USA). More detailed information about boreholes can be found in Luo et al. [54].

2.3. Methods

2.3.1. Pearson Correlation Analysis

Pearson correlation method can be applied to detect the correlation between each factor. In this case, positive and negative correlation coefficients represent the effect of one variable on another variable and are used to calculate the correlation between different factors [68,69]. The calculation equation is shown as follows.
R x y , z = R x y R x z R y z ( 1 R x z ) 2 ( 1 R y z ) 2 ¯
where x, y, and z represent three factors. Rxy, Rxz, and Ryz represent the correlations between the pairs of factors x, y, and z, respectively. Rxy, z represents the correlation between the variables xy and z after excluding the interference associated with factor z.

2.3.2. Coefficient of Variation (CV)

The CV can reflect the fluctuating characteristics of the time series data [70]. This study aims to investigate the large variation of NDVI in response to changes in regional climate (i.e., AAAT and AP). The calculation equation is shown as follows.
C V = 1 N D V I ¯ 1 n 1 i = 1 n ( N D V I i N D V I ¯ ) 2
where CV is the coefficient of variation of NDVI values; NDVIi is the NDVI in the year i, and; NDVI ¯ is the multi–year average of annual NDVIi of the study region from 2010 to 2019.
The stability of CV was classified into five categories according to the natural interruption point method [71]: Minimum (0.02, 0.12), Low (0.13, 0.30), Medium (0.31, 0.70), High (0.71, 1.54), and Maximum fluctuations (1.55, 4.12). A large value of CV means greater NDVI variation and poorer stability; the smaller the value of CV, the higher the NDVI stability.

2.3.3. Geographical Detector

The Geographical Detector (GeoDetector) is used to detect spatial stratified heterogeneity, and thus to reveal the drivers behind it. These include factor, interaction, risk, and ecological detectors [72]. The factor detector is used to detect the spatial differentiation of the dependent factor Y and how much the changes in the independent factor X explain the spatial differentiation of the attribute Y [73]. The performance of the GeoDetector is generally valued by the function of q-statistic with its range of (0 to 1). A value of 1 indicates the factor completely controls the spatial patterns of the geographical phenomenon, and a value of 0 indicates no relationship between the dependent and independent factors.
q = 1 h = 1 L N h σ h 2 N σ 2
where h = 1, L is the strata of variable Y or factor X (that is, classification or partitioning), and Nh and N are the numbers of units in the layer h and the whole region, respectively. The variables σh2 and σ2 are variances of the Y values of the hth layer and the entire area, respectively.
The interaction detector measures the value of q-statistic for the two explanatory variables after their interaction q (X1X2) (Table 2). The interaction is used to investigate whether there is interaction between two factors and the variation in the degree of influence on the attribute Y under the interaction [74]. Ecological probing is used to compare whether there is a significant difference in the effect of factor–factor interactions on the spatial differentiation of Y [45,75].

3. Results

3.1. Spatiotemporal Patterns of NDVIgs along the G214

The results of interannual variation analysis showed that regional NDVIgs fluctuated between 0.53 to 0.58 in the past decade (2010–2019) and increased slightly with a linearly regressed increase rate of 0.006/a. Compared with a trend of slight decline in NDVIgs at the northern flank of the Bayan Har Mountains in 2010–2019, NDVIgs at the southern flank increased instead. Spatial analysis exhibited a northward decreasing pattern of NDVIgs and “low at the northern flank and high at the southern flank of the Bayan Har Mountains” (Figure 2a). To facilitate a comparison of NDVIgs patterns, the spacing method was applied to divide the NDVIgs into five classes, namely Lower (0.10, 0.20), Low (0.20, 0.40), Medium (0.40, 0.60), High (0.60, 0.80), and Higher (0.80, 0.90). During the period of 2010 to 2019, the areal extent of the Higher NDVIgs class increased by 14.9%; that of the High class increased by 0.3%; that of the medium class increased by 1.6%; that of the Low class decreased by 5.7%; and that of the Lower class decreased by 11.1% (Figure 2b). This shows that the NDVIgs class in the study area changed significantly, and the NDVIgs change in the south flank showed an increasing trend compared with the north flank, while the NDVIgs change trend in the north flank had greater fluctuations but showed an overall increasing trend. In terms of G214 highway, the NDVIgs change characteristics showed a decreasing feature from south to north along G214 in the Bayan Har Mountains. Therefore, there were more areas with the High and the Higher NDVIgs in the southern flank, and most areas of the Low and the Lower NDVIgs were in the northern flank. Overall, NDVIgs displayed a slightly rising trend in the study area from 2010 to 2019. Spatially, a northward decline was found in NDVIgs across the study area, characterized by ”low at the northern flank and high at the southern flank”.

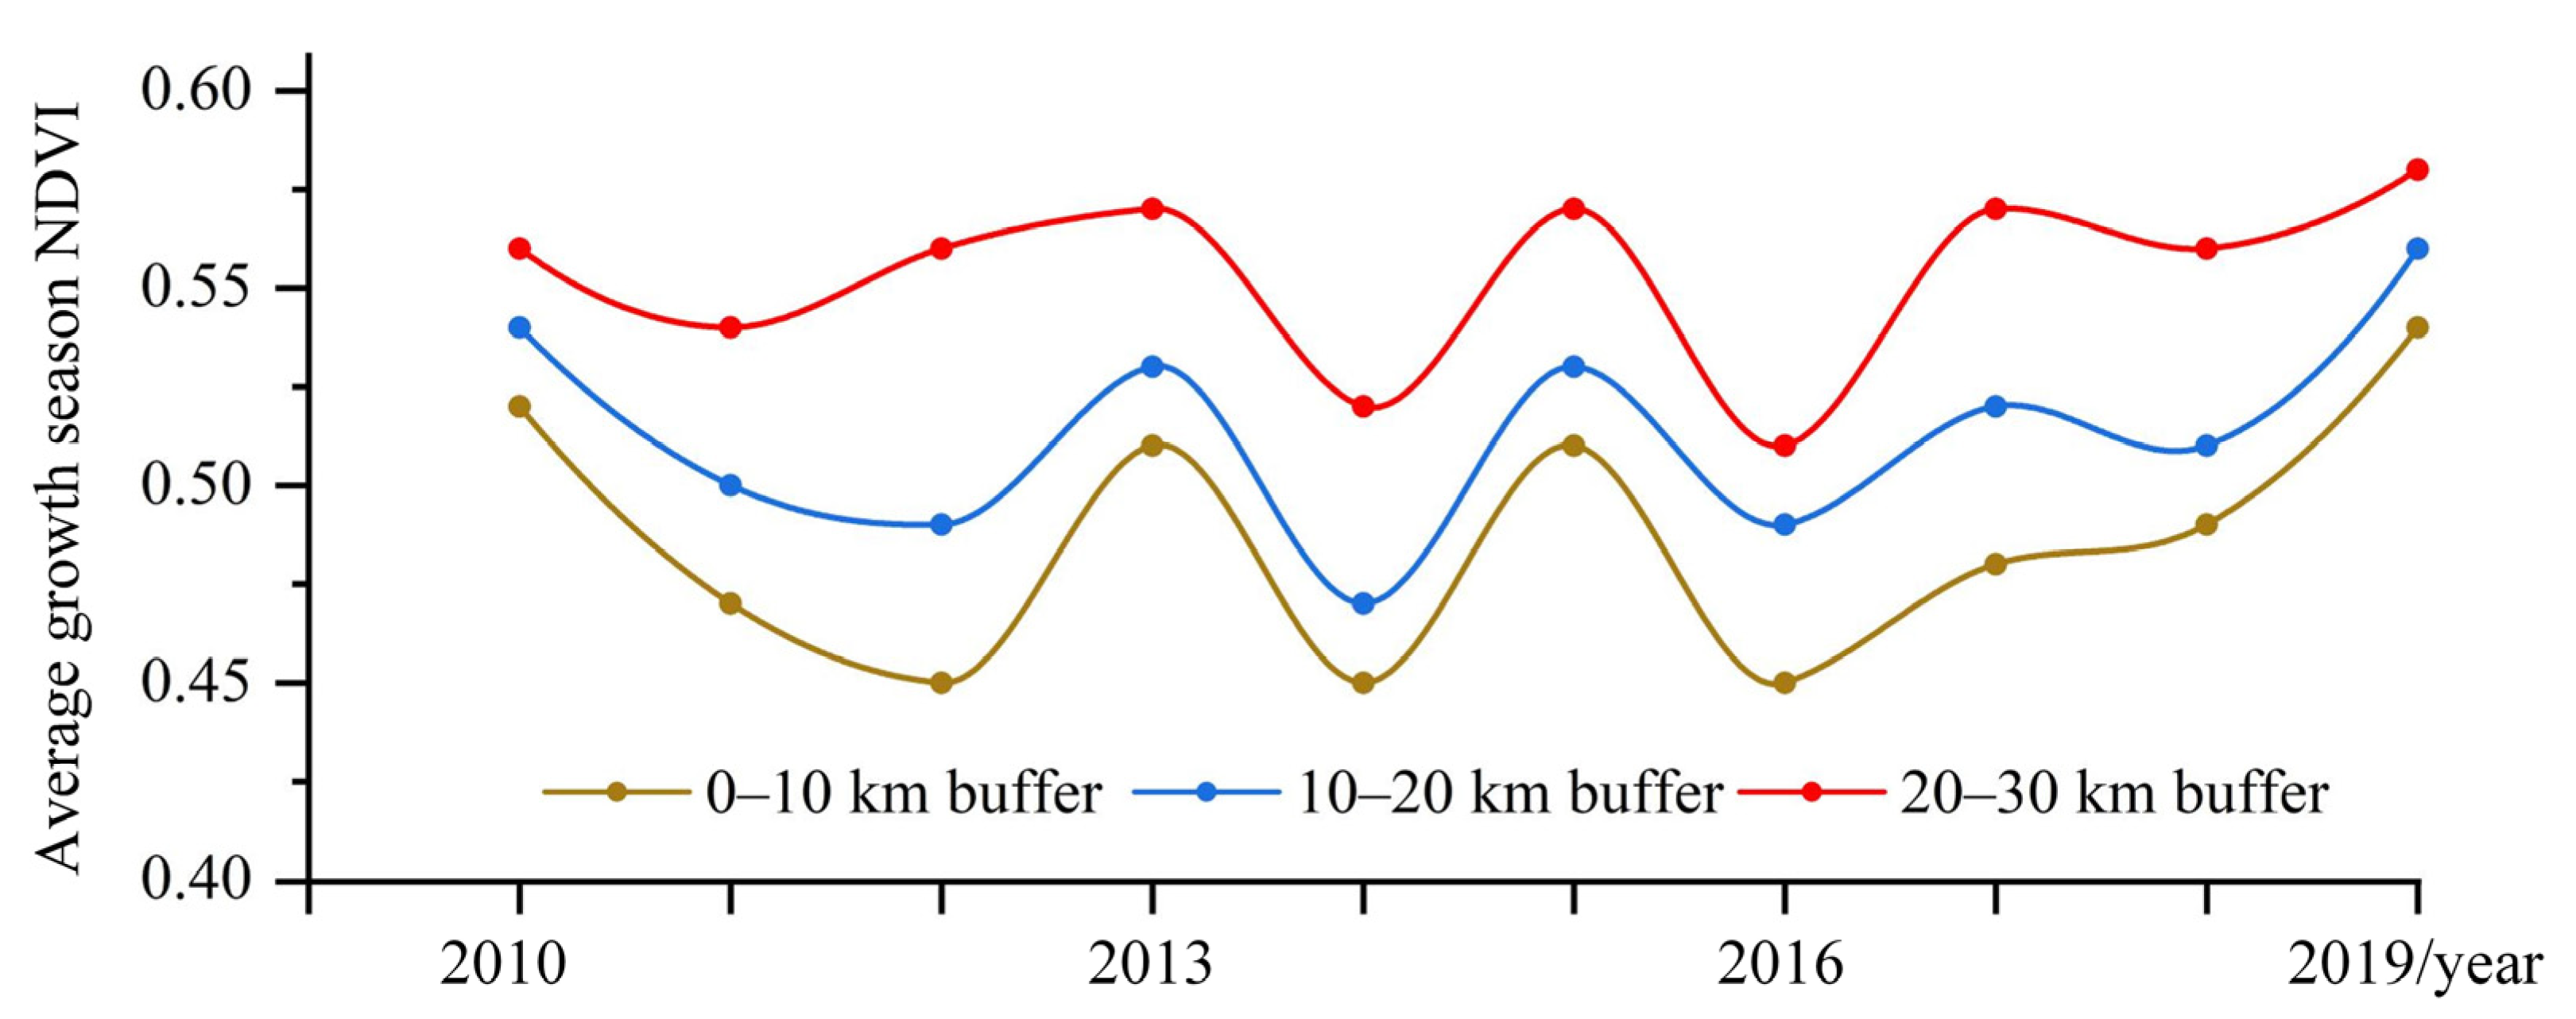
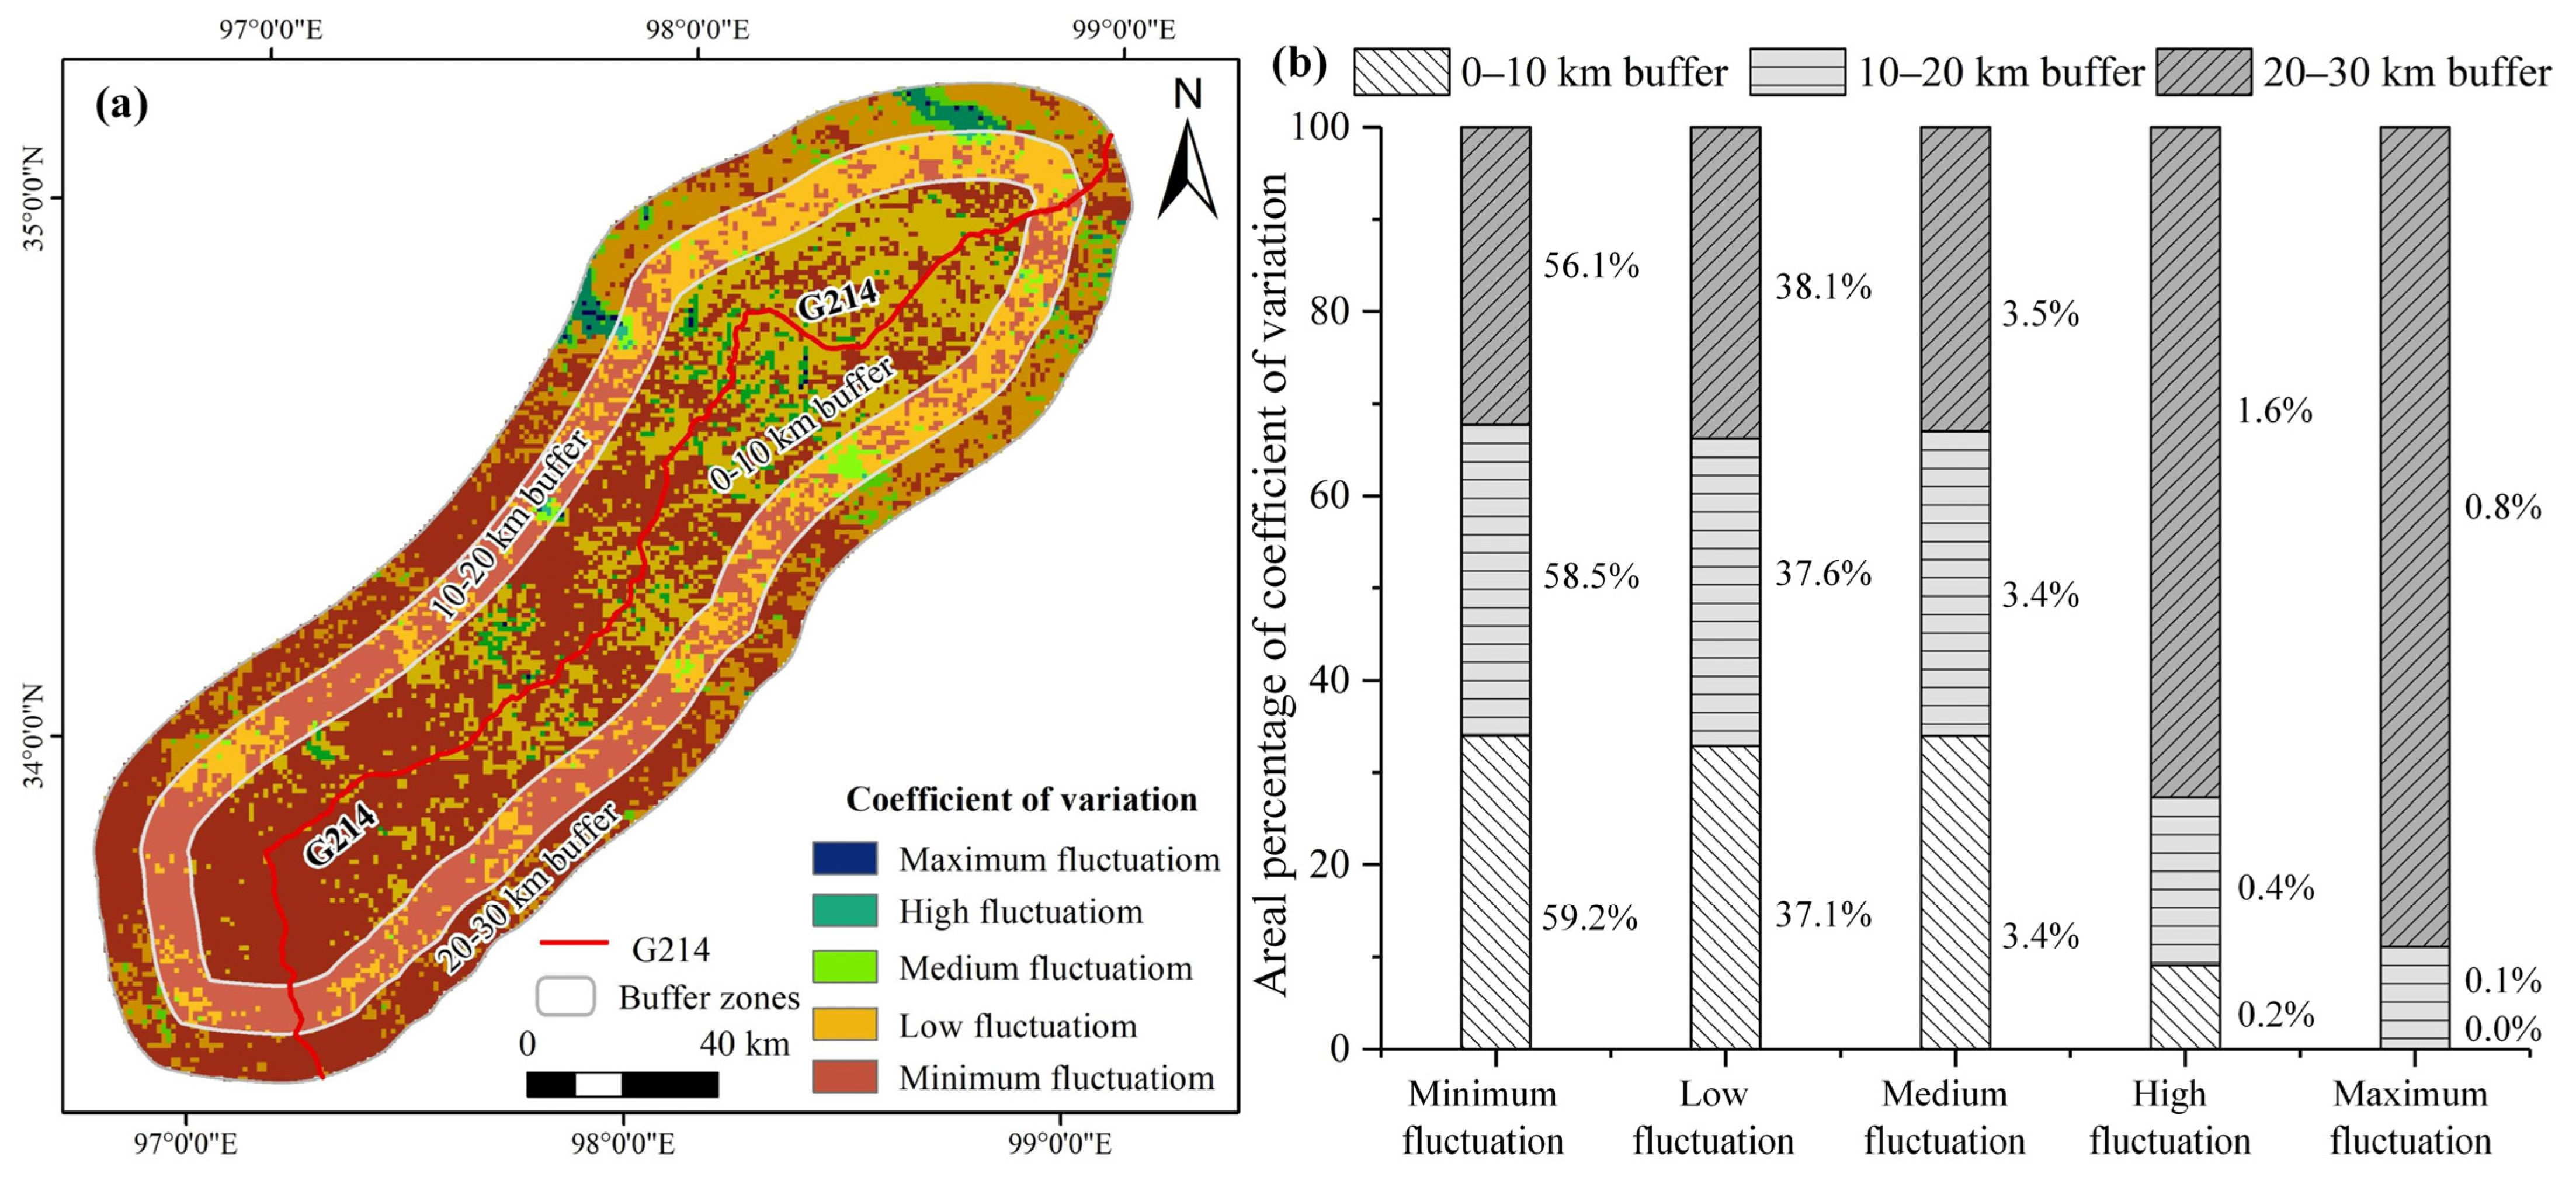
3.2. NDVIgs Variations in the Three Buffer Zones along the G214

The average NDVIgs increased gradually with the increasing perpendicular distance away from the G214, i.e., 0–10, 10–20, and 20–30 km symmetrically with the highway centerline as the axis. Among them, the average NDVIgs was greatest in the buffer zone of 20–30 km with a value of 0.57 and lowest at the zone of 0–10 km with a value of 0.50 (Figure 3). Average NDVIgs over the three buffer zones exhibited a similar overall increasing trend from 2010 to 2019. In addition, there was a slight increasing trend from 2010 to 2013, with the same pattern of increase or decrease in each buffer zone. However, NDVIgs gradually decreased in each buffer zone from 2013 to 2016. Then, NDVIgs increased steadily from 2016 to 2019, reaching the maxima in all three buffer zones in 2019. In summary, the NDVIgs of each buffer zone decreased from 2013 to 2016, with fluctuations, and gradually increased with some fluctuations from 2016 to 2019. This indicates the gradually ameliorating vegetation of each buffer zone over the study period.
The average of coefficients of variation (CV) was 0.23 from 2010 to 2019 in the three buffer zones. To study the influences of the G214 on the stability of NDVIgs, the engineering corridor along the G214 was divided into equally spaced buffer zones at an interval of 10 km. They are: the first buffer zone at distances of 0–10 km perpendicularly away from the highway centerline, the second at 10–20 km, and the third at 20–0 km, symmetrically at both sides of the G214, to analyze the variability of NDVIgs (Figure 4). The variability was relatively low in the first outgoing (0–10 km) buffer zone, with minimum and low fluctuation areas accounting for 96.3% in the three buffer zones, while the areas of the medium, high, and maximum fluctuation account for only 3.7%. Therefore, from 2010 to 2019, the NDVIgs in the 0–10 km buffer zone had not changed much and had the best stability. In the second outgoing (10–20 km perpendicularly away from the G214) buffer zone, the magnitude of changes in NDVIgs was relatively larger than that of the first (0–10 km) buffer zone, and the areas with medium and greater fluctuations in NDVIgs account for 3.9% in all three buffer zones. Among them, the patchy areas with the maximum fluctuations account for only 0.1% of the total area. In the third buffer zone (20–30 km perpendicularly away from the G214), the area with medium fluctuations was 3.4%, and that of high and maximum fluctuations was 1.4%. This suggests the best stability of CV at the first buffer zone (0–10 km) followed by the second (10–20 km), while the third buffer zone (20–30 km) had the least stability.

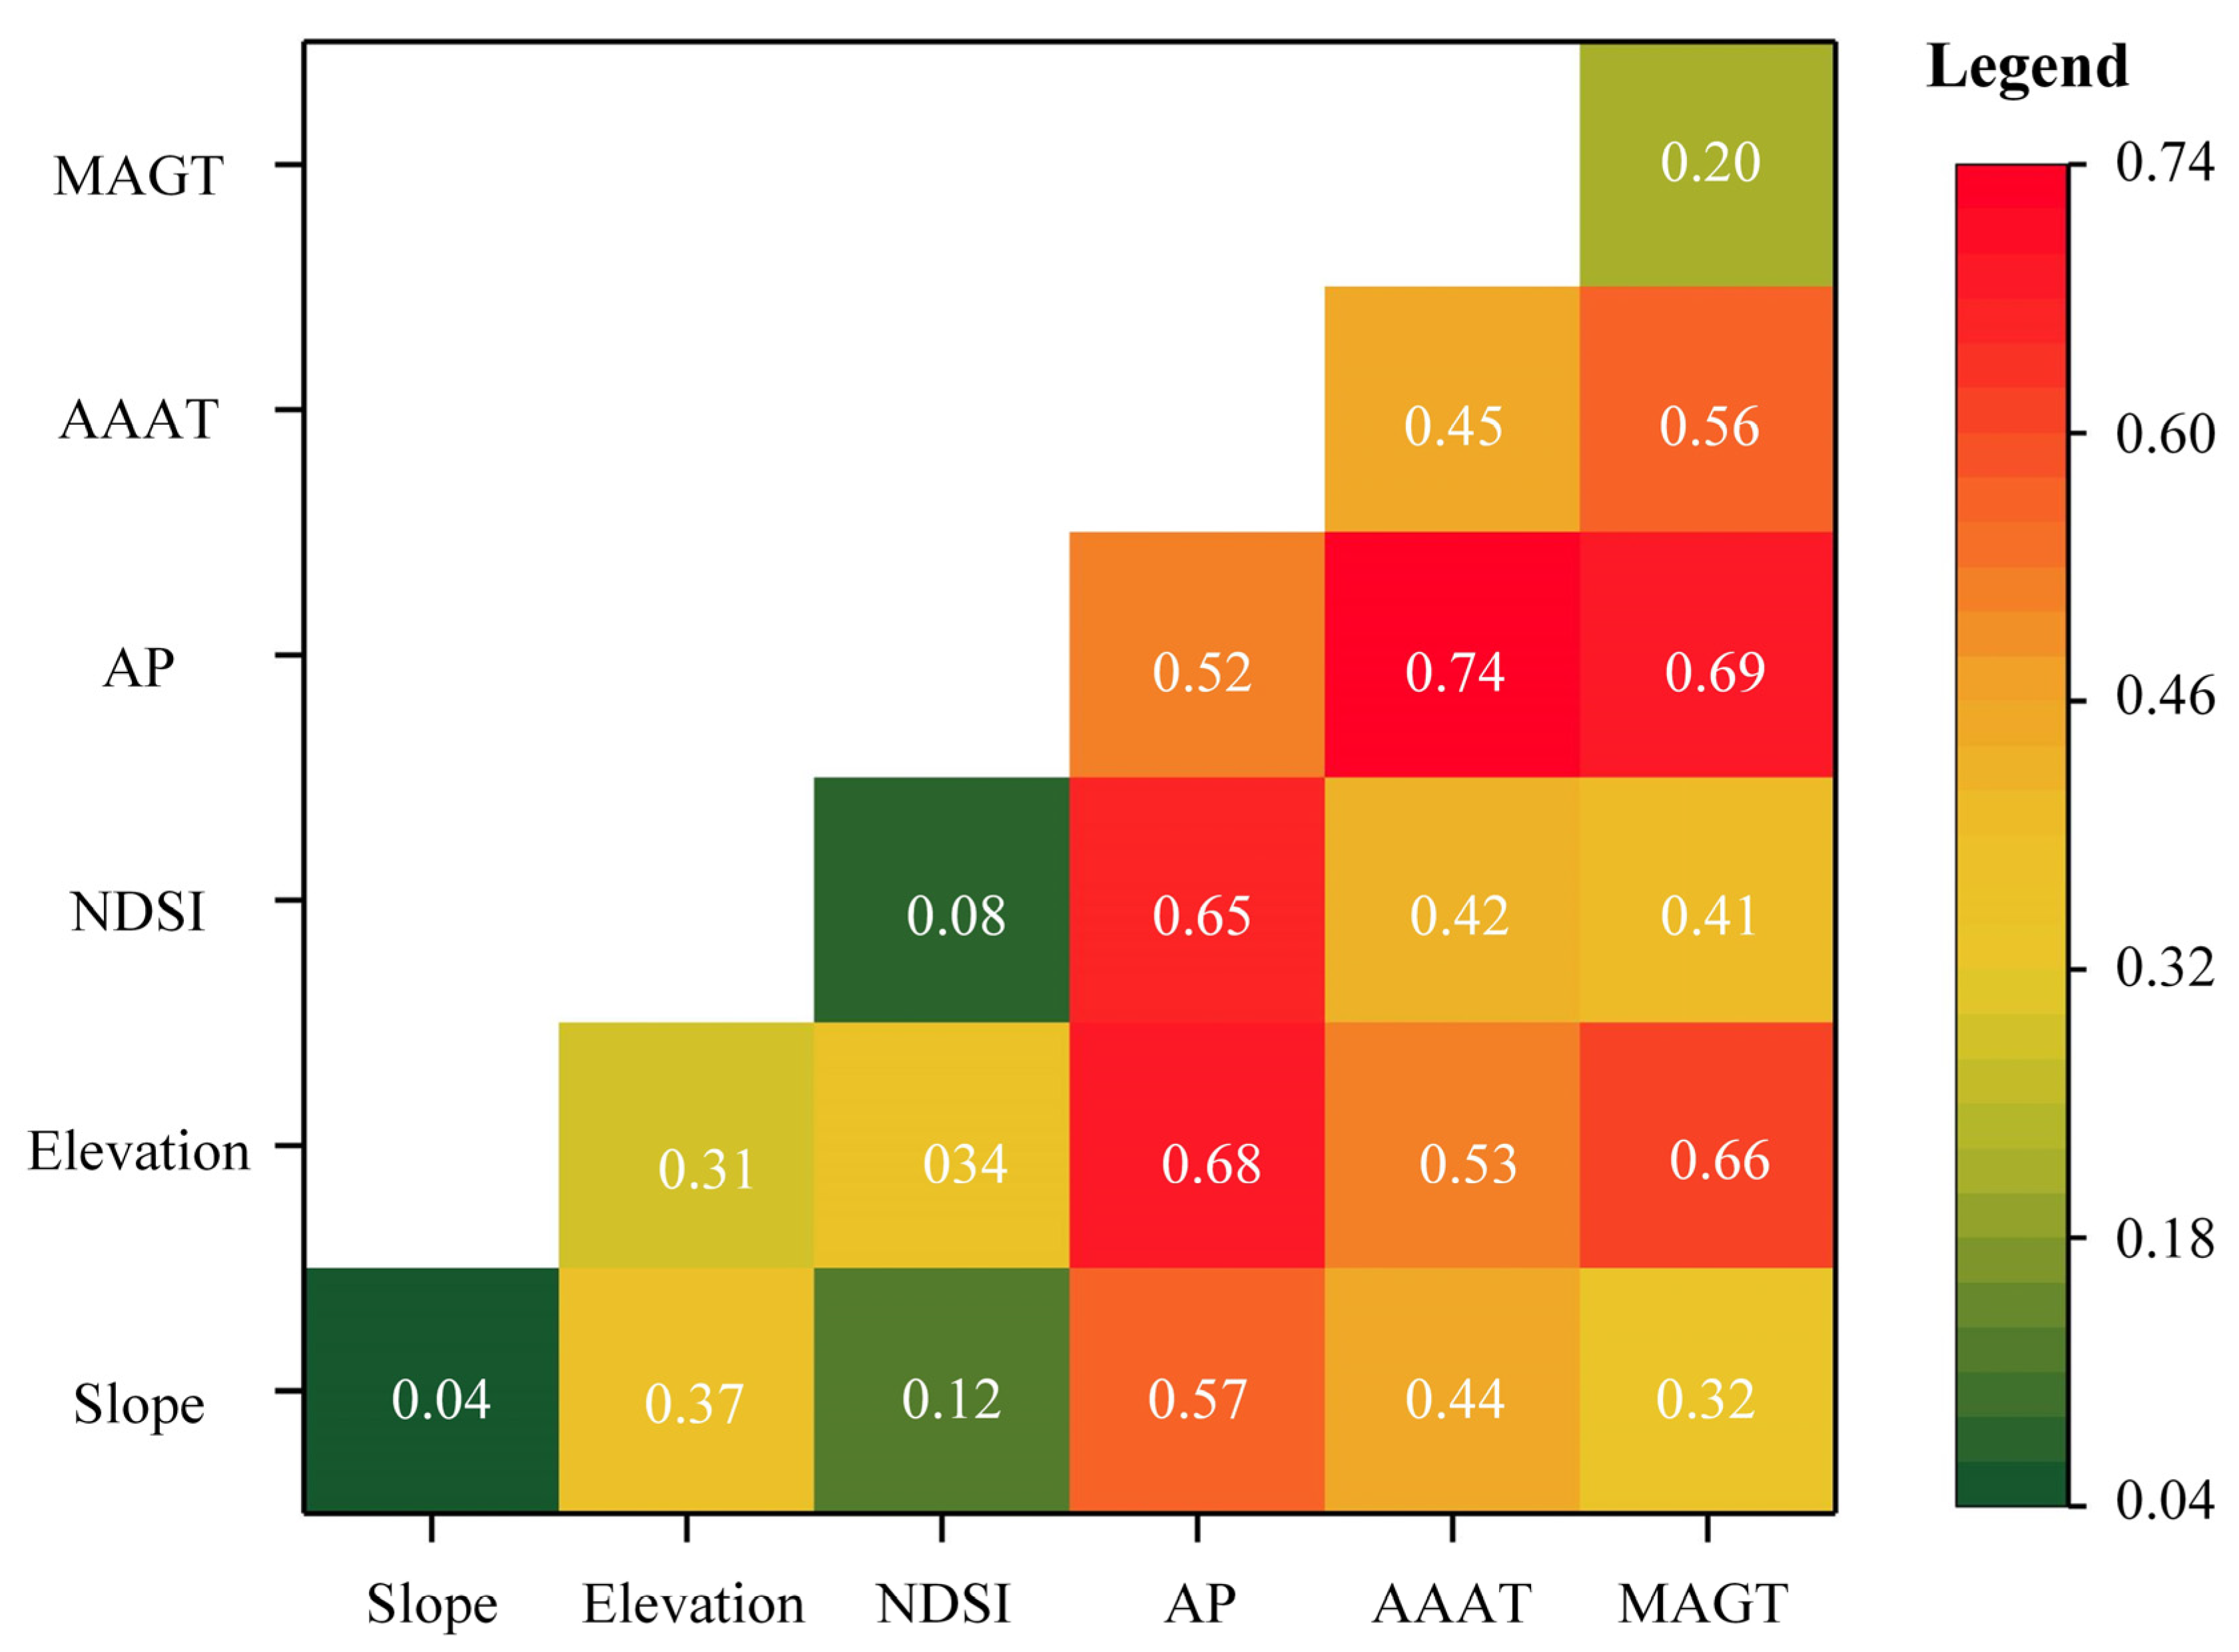
3.3. Correlation and Sensitivity Analysis of Drivers for NDVIgs

The GeoDetector was applied to examine the environmental drivers for NDVIgs. In this study, the q-values of different factors were calculated by the GeoDetector (Table 3). In Table 3, AP had the highest q-value (0.52), followed by AAAT (0.45) and elevation (0.31). In addition, Pearson correlation also showed a higher positive correlation of NDVIgs with AP (R = 0.75), followed by that of AAAT (R = 0.63). Meanwhile, there was a significant negative correlation between AAAT and NDSI (R = −0.59) (Figure S1). The q-value of MAGT was 0.20, that of NDSI was 0.08, and that of the slope was the lowest (0.04), indicating insignificant effects of NDSI and slope on NDVIgs. Overall, AP and AAAT were the main drivers for variations in NDVIgs. The contributions of each driver to the spatial variations in NDVIgs decline in the order of AP, AAAT, elevation, MAGT, NDSI, and slope.
The interaction detection analysis demonstrated that the effects of the two interactive factors were greater than those of a single factor. The interactions of all influencing factors showed a two-factor enhancement, among which the q-value of AP ∩ AAAT was the highest at 0.74 (Figure 5). This suggests that the interactive AP and MAAT were the two key factors for driving the spatial variations in NDVIgs along the G214. Additionally, the q-values of AP ∩ MAGT, AP ∩ elevation, elevation ∩ MAGT, and AP ∩ NDSI were all greater than 0.6, indicating the strong interactive effects of these four factors on NDVIgs.

4. Discussion

4.1. Vegetation Change in the Source Area of the Yellow and Yangtze Rivers (SAYYR)

The NDVIgs along the G214 in our study area showed a northward decreasing pattern, possibly because of the upward decline trend in hydrothermal regimes from southeast to northwest in the SAYYR with rising elevation [76,77]. Furthermore, NDVIgs was “low at the northern flank and high at the southern flank of the Bayan Har Mountains”. This indicates a higher vegetation cover at the southern flank in the source area of the Yangtze River than at the northern flank in the Headwater Area of the Yellow River along the G214 in the study area due to the linear relationship between vegetation cover and NDVIgs [78]. There could be two main explanations for this. One is that on the northern flank, there are lower elevations, gentler slopes, more lakes and rivers, and lower vegetation cover. Therefore, the NDVIgs at the northern flank of the Bayan Har Mountains are mostly areas of low NDVIgs, with milder fluctuations. Second, there is more AP at high elevations at the southern flank and thus better vegetation. Therefore, this leads to more areas of high NDVIgs at the south flank, with large fluctuations.
From 2010 to 2019, NDVIgs displayed an overall upward trend in the study area, ranging between 0.53 and 0.58 and with an increasing rate of 0.006/a. This trend is consistent with previous studies on changes in NDVI in the SAYYR [79,80,81]. A study using multiple high-resolution satellite data showed a slightly increasing pattern, and the NDVI ranged from 0.23 and 0.27 in the Headwater Area of Three Rivers (Yangtze, Yellow, and Lancang Rivers) on the northeastern QTP from 1982 to 2015 [24]. The increasing rate of NDVI in the study area (0.0002/a from 1980 to 2018 [59]) was higher than that for the whole SAYYR (0.0020/a from 1998 to 2016 [82]).

4.2. Impacts of the Highway on Vegetation in Permafrost Regions

Spatially, NDVIgs showed an upward trend from the buffer zones at the distance of 0–10 to 20–30 km perpendicularly away from the G214, suggesting that the impacts of the highway on vegetation weaken with increasing outward distance. NDVIgs varied substantially in the first buffer zone and stabilized in the second zone. Therefore, we may preliminarily conclude that the G214 have a significant effect at a distance extending up to 10 km from the highway. This result is comparable with findings of previous studies [54,83].
The former G214 was about 4 m wide. The construction of the approximately 6 m wide new G214 (the Gonghe–Yushu Expressway), almost parallel and adjacent to the former one, was started in 2011, and it was put into operation in 2017. During the construction, soils were collected from the nearby or designated quarries and filled into the subgrade, generally about 1–5 m higher than the original natural ground. This process destroyed the pristine alpine grasslands and created new patches or stripes of bare ground along the highway. In addition, similar bare patches and stripes were created by the temporary stacking of construction materials and facilities. Although revegetation was carried out after the highway’s construction, the recovery rate of alpine vegetation was slow or even impossible because of the simple plant community structure and the harsh periglacial and arid environment [51,63]. This could be the main reason for the most stable zone of 0–10 km. In addition, there are substantially less important local, branch, and access roads and trails and small- to mid-size towns and villages along the highway, which have also modified and damaged the alpine grasslands to different extents, creating some new patches and stripes of bare ground.
It was unexpected that the influences of the G214 on the SQP extended as far as 10 km, since NDVIgs still showed similar changing patterns with the zones close to the highway. This is inconsistent with some results from other permafrost regions on the interior QTP, which documented that the impacts of the Qinghai–Tibet Engineering Corridor (both highway and railway) from Golmud to Lhasa, Tibet Autonomous Region, Southwest China were limited to about 1.5 km on each side [53]. This may be because of the different vegetation indicators used in the study [84]. In addition, the source and resolution of data and the unique location of the research area, in addition to regional hydroclimate and alpine environments, could be reasons for this discrepancy. In our research, a spatial resolution of 1.0 × 1.0 km NDVI data was used, while a spatial resolution of 250 × 250 m was used in the other study [86]. The influences of data resolution on the study of highway effects, in addition to the criteria for judging the “affected zones,” need further systematic and in-depth studies in the future.

4.3. Interactive Impacts of Geocryological, Topographical, Hydroclimatic, and Other Factors on NDVI

Changing vegetation patterns along the G214 in the buffer zone were mainly driven by AP, AAAT, MAGT, and construction and operation of the G214. Pearson correlation analysis show that AP, AAAT, and MAGT have significant positive effects on NDVIgs. This is supported by earlier studies of the QTP, showing that AP and AAAT are important for vegetation dynamics [24,53,83,85]. On the QTP, precipitation and temperature are key factors for plant growth, and due to the nature of the arid environment, precipitation is more limiting than other driving factors for vegetation growth [83]. However, other studies reported that the upward trend of NDVI was more associated with recently rising air temperature on the QTP [86]. This is associated with the hydrothermal conditions of the study site. For example, vegetation is more related to air temperature in the Headwater Area of the Three Rivers on the northeastern QTP, where the regional climate is characterized of relatively low AAAT and relatively higher AP, and thus the warmth has more of the limiting effect for vegetation growth [87]. This is also the main reason for the NDVI patterns of “low at the northern flank and high at the southern flank” in the study area striding across the Bayan Har Mountains along the G214.
Although precipitation and temperature dominated in driving NDVI changes in alpine regions, ground temperature was also a significant driver for NDVI changes [88], suggesting that the presence of permafrost could be a major driver for better vegetation growth on the QTP. This result agrees well with other studies on the QTP, e.g., [53,63,82].
Permafrost, as an aquitard, could inhibit the unfrozen water in the surface soil from percolating downwards and stored soil moisture in the active layer in the growing season or slightly above the permafrost table, thus facilitating vegetation growth [64]. In this study, permafrost was gradually warming from 2010 to 2019 according to the data from the borehole along the G214, and the average rate was 0.01 °C/a (Table S1). It has been widely reported that the plateau permafrost has been degrading extensively and rapidly, as characterized by shrinkage of the area extent of permafrost, increasing of the active layer thickness, ground temperature, and the extent of taliks, e.g., [89,90]. These effects of permafrost degradation could enhance the upward evaporation and downward infiltration of soil waters, subsequently adversely impacting the growth of alpine vegetation [53,63].
Furthermore, the results of GeoDetector analysis showed a stronger interactive effect of two factors on NDVIgs than a single one. This agrees well with other similar observations, e.g., [83,91,92]. Our study showed that NDVIgs was largely influenced by the interactions between AP ∩ AAAT and AP ∩ MAGT. Additionally, the interactions between AP ∩ elevation, AP ∩ NDSI, and MAGT ∩ elevation had relatively stronger effects on NDVI. This is because AP, AAAT, and MAGT vary along the elevational gradient and north–south flanks of the Bayan Har Mountains, affecting the spatial distribution and growth of vegetation [93].
Unfortunately, this study is unable to separate the individual influences of the G214 and environmental factors. The construction of the highway locally and directly destroyed the alpine vegetation along the highway, while the impacts of the operating highway on alpine vegetation could be indirectly exerted through changing the environmental variables [54]. For example, several studies have documented permafrost degradation along the major engineering corridors on the QTP, e.g., [62,90,94] and at high latitudes, e.g., [44,95,96,97]. This may further alter the hydrothermal conditions and landscapes along the highways and accelerate vegetation changes under a warming climate.

4.4. Implications and Limitations

This research used NDVI from MODIS data to study the impacts of G214 on vegetation changes, and the main environmental drivers were detected. We found that MAGT was one of the major influencing factors for alpine vegetation. However, due to the data’s limitations, only data from 16 boreholes along the G214 at the northern and southern flanks of the Bayan Har Mountains were used to address the permafrost changes and their impacts on NDVI. Furthermore, it is challenging to separate the influences of the G214 and permafrost degradation on NDVI, although we have theoretically concluded that the vegetation is affected by the G214 and permafrost degradation. More systematically designed permafrost boreholes away from the highway and systematic methods to analyze the data are deemed necessary to investigate the influences of highway on vegetation in permafrost regions.
The impacts of the G214 on vegetation were explored in this study. However, it is challenging to define the extents of the impacts of the G214 in the study area, because the criteria for the impacted zone could be very complex and not all variables are systematically measured over long periods. In addition, the impacted outward distance is tremendously influenced by the sources of datasets and the areal extent of the study region. More studies in different spatial scales are needed to further explore and understand the influences of highways on vegetation in alpine permafrost regions.

5. Conclusions

The spatiotemporal patterns of NDVIgs along the G214 at the southern and northern flanks of the Bayan Har Mountains were reported in this paper. Furthermore, the impacts of the G214 on NDVIgs of alpine vegetation along the engineering corridor therewith were studied. Finally, the links between NDVIgs and environmental variables were systematically analyzed. The main conclusions are as follows: (1) NDVIgs showed a slight upward tendency (0.006/a) from 2010 to 2019. The spatial distribution of NDVIgs along the G214 showed a pattern of “low at the northern flank and high at the southern flank of the Bayan Har Mountains”. NDVIgs declined by 16.8% in the Low and Lower classes and increased by 15.2% in the High and Higher classes. (2) The average NDVIgs gradually increased with the increasing outward distance from the G214, indicating the greatest influence in the first buffer zone at the perpendicular distances of 0–10 km away from the highway. The average CV in the engineering corridor was 0.23, and CV in the first buffer zone of 0–10 km was relatively small, with the highest stability of NDVIgs and with 96.3% of the area showing minimum and low fluctuations. (3) AP, AAAT, and elevation were the major drivers for the NDVI patterns, with the highest q-value of AP (0.52). Furthermore, the interaction analysis showed that the two-factor interactions had a stronger effect than that of one single factor. The interactive q-value of AP ∩ AAAT was the highest (0.74), suggesting that these interactive climate variables dominated in driving the distribution of NDVIgs and its changes.

Supplementary Materials

The following supporting information can be downloaded at: https://www.mdpi.com/article/10.3390/rs15061547/s1, Figure S1: Correlation between hydroclimatic and environmental drivers and NDVI on north and south flanks of the Bayan Har Mountains along the G214 on the northeastern Qinghai-Tibet Plateau during 2010–2019. Note: NDSI, Normalized Difference Snow Index; AP, annual precipitation; AAAT, average annual air temperature. MAGT, mean annual ground temperature; Table S1: Warming rate of ground temperature during 2010–2019 in boreholes on north and south flanks of the Bayan Har Mountains along the National Highway G214 from the Changshitoushan Mountain Pass to the Qingshui’he Riverside at the northern and southern flanks of the Bayan Har Mountains, southern Qinghai, China from 2010 to 2019.

Author Contributions

Conceptualization, X.J. and H.J.; methodology, J.T. and D.L.; figure visualization, R.-D.S., M.S. and W.W.; writing—review and editing, X.J., J.T., D.L., Q.W. (Qingbai Wu), R.H., Y.L., X.L. (Xinze Li), H.W., X.L. (Xiaoying Li), Q.W. (Qingfeng Wang) and H.J. All authors have read and agreed to the published version of the manuscript.

Funding

This research was funded by the Chinese Academy of Sciences (CAS) Strategic Priority Research Program (CAS Grant No. XDA20100103), National Natural Science Foundation of China (NSFC Grant Nos. 42101119, U20A2082 & 41871052). Details: (1) CAS Strategic Priority Research Program on “Changing permafrost hydrology in the Qilian Mountains and the Source Area of the Yellow River and its impacts on water supplies and security” (Grant No. XDA20100103); (2) NSFC Program “Shrubification and its hydrothermal impacts on the frozen ground along the China-Crude Oil Pipelines” (Grant No. 42101119); (3) Key Program of NSFC Joint Foundation with Heilongjiang Province for Regional Development “Response mechanisms and carbon cycling processes of the Xing’an permafrost to global change” (Grant No. U20A2082); and (4) NSFC Program “Impacts of forest fires in the Da Xing’anling Mountains, Northeast China on the permafrost environment” (Grant No. 41871052).

Data Availability Statement

Data are accessible through emailing the corresponding author.

Acknowledgments

We are thankful for support from West Young Scholars Program of the Chinese Academy of Sciences (Grant No. E2290601, Chengdong Leadership Research Funding of Northeast Forestry University (Grant No. LJ2020-01), and funding from the Autonomous Province of Bozen/Bolzano—Department for Innovation, Research and University in the frame of the Seal of Excellence Programme (project TEMPLINK, Grant No. D55F20002520003). We appreciate all the generous help from unidentified reviewers in improving this paper.

Conflicts of Interest

The authors declare no conflict of interest.

References

  1. Jorgenson, M.T.; Romanovsky, V.; Harden, J.; Shur, Y.; Donnell, J.; Schuur, E.A.G.; Kanevskiy, M.; Marchenko, S. Resilience and vulnerability of permafrost to climate change. Can. J. For. Res. 2010, 40, 1219–1236. [Google Scholar] [CrossRef] [Green Version]
  2. Kurylyk, B.L.; MacQuarrie, K.T.B.; McKenzie, J.M. Climate change impacts on groundwater and soil temperatures in cold and temperate regions: Implications, mathematical theory, and emerging simulation tools. Earth-Sci. Rev. 2014, 138, 313–334. [Google Scholar] [CrossRef]
  3. Dai, A. Drought under global warming: A review. Wiley Interdiscip. Rev.-Clim. Chang. 2011, 2, 45–65. [Google Scholar]
  4. Koven, C.D.; Ringeval, B.; Friedlingstein, P.; Ciais, P.; Cadule, P.; Khvorostyanov, D.; Krinner, G.; Tarnocai, C. Permafrost carbon-climate feedbacks accelerate global warming. Proc. Natl. Acad. Sci. USA 2011, 108, 14769–14774. [Google Scholar] [CrossRef] [Green Version]
  5. Trenberth, K.E. Changes in precipitation with climate change. Clim. Res. 2011, 47, 123–138. [Google Scholar] [CrossRef] [Green Version]
  6. Liang, Q.; Xu, X.; Mao, K.; Wang, M.; Wang, K.; Xi, Z.; Liu, J. Shifts in plant distributions in response to climate warming in a biodiversity hotspot, the Hengduan Mountains. J. Biogeogr. 2018, 45, 1334–1344. [Google Scholar] [CrossRef]
  7. Song, X.; Hansen, M.C.; Stehman, S.V.; Potapov, P.V.; Tyukavina, A.; Vermote, E.F.; Townshend, J.R. Global land change from 1982 to 2016. Nature 2018, 560, 639–643. [Google Scholar] [CrossRef]
  8. Chandrasekar, K.; Sesha Sai, M.V.R.; Roy, P.S.; Dwevedi, R.S. Land Surface Water Index (LSWI) response to rainfall and NDVI using the MODIS Vegetation Index product. Int. J. Remote Sens. 2010, 31, 3987–4005. [Google Scholar] [CrossRef]
  9. Chen, J.; Ju, W.; Ciais, P.; Viovy, N.; Liu, R.; Lu, H. Vegetation structural change since 1981 significantly enhanced the terrestrial carbon sink. Nat. Commun. 2019, 10, 1–7. [Google Scholar] [CrossRef] [PubMed] [Green Version]
  10. Xu, J.; Zhao, H.; Yin, P.; Jia, D.; Li, G. Remote sensing classification method of vegetation dynamics based on time series Landsat image: A case of opencast mining area in China. EURASIP J. Image Video Process. 2018, 2018, 114. [Google Scholar] [CrossRef]
  11. Li, J.; Pei, Y.; Zhao, S.; Xiao, R.; Sang, X.; Zhang, C. A review of remote sensing for environmental monitoring in China. Remote Sens. 2020, 12, 1130. [Google Scholar] [CrossRef] [Green Version]
  12. Gao, Y.; Zhou, X.; Wang, Q.; Wang, Z.; Zhan, M.; Chen, F.; Yan, X.; Qu, R. Vegetation net primary productivity and its response to climate change during 2001–2008 in the Tibetan Plateau. Sci. Total Environ. 2013, 444, 356–362. [Google Scholar] [CrossRef] [PubMed]
  13. Knauer, K.; Gessner, U.; Dech, S.; Kuenzer, C. Remote sensing of vegetation dynamics in West Africa. Int. J. Remote Sens. 2014, 35, 6357–6396. [Google Scholar] [CrossRef]
  14. He, B.; Chen, A.; Wang, H.; Wang, Q. Dynamic response of satellite-derived vegetation growth to climate change in the Three North Shelter Forest Region in China. Remote Sens. 2015, 7, 9998–10016. [Google Scholar] [CrossRef] [Green Version]
  15. Jamali, S.; Jönsson, P.; Eklundh, L.; Ardö, J.; Seaquist, J. Detecting changes in vegetation trends using time series segmentation. Remote Sens. Environ. 2015, 156, 182–195. [Google Scholar] [CrossRef]
  16. Sun, W.; Song, X.; Mu, X.; Gao, P.; Wang, F.; Zhao, G. Spatiotemporal vegetation cover variations associated with climate change and ecological restoration in the Loess Plateau. Agric. For. Meteorol. 2015, 209, 87–99. [Google Scholar] [CrossRef]
  17. Nolan, C.; Overpeck, J.T.; Allen, J.R.M.; Anderson, P.M.; Betancourt, J.L.; Binney, H.A.; Brewer, S.; Bush, M.B.; Chase, B.M.; Cheddadi, R.; et al. Past and future global transformation of terrestrial ecosystems under climate change. Science 2018, 361, 920–923. [Google Scholar] [CrossRef] [Green Version]
  18. Bamba, A.; Dieppois, B.; Konaré, A.; Pellarin, T.; Balogun, N.D.; Kamagate, B.; Savané, I.; Diedhiou, A. Changes in vegetation and rainfall over West Africa during the last three decades (1981–2010). Atmos. Clim. Sci. 2015, 5, 367–379. [Google Scholar] [CrossRef] [Green Version]
  19. Kapfer, J.; Hédl, R.; Jurasinski, G.; Kopecký, M.; Schei, F.H.; Grytnes, J.A. Resurveying historical vegetation data-opportunities and challenges. Appl. Veg. Sci. 2017, 20, 164–171. [Google Scholar] [CrossRef] [PubMed]
  20. Abel, C.; Horion, S.; Tagesson, T.; Keersmaecker, W.; Seddon, A.; Abdi, A.; Fensholt, R. The human–environment nexus and vegetation–rainfall sensitivity in tropical drylands. Nat. Sustain. 2021, 4, 25–32. [Google Scholar] [CrossRef]
  21. Zhao, Y.; Herzschuh, U.; Li, Q. Complex vegetation responses to climate change on the Tibetan Plateau: A paleoecological perspective. Natl. Sci. Rev. 2015, 2, 400–402. [Google Scholar] [CrossRef] [Green Version]
  22. Kong, D.; Zhang, Q.; Singh, V.P.; Shi, P. Seasonal vegetation response to climate change in the Northern Hemisphere (1982–2013). Glob. Planet. Change. 2017, 148, 1–8. [Google Scholar] [CrossRef] [Green Version]
  23. Wang, M.; An, Z. Regional and phased vegetation responses to climate change are different in Southwest China. Land 2022, 11, 1179. [Google Scholar] [CrossRef]
  24. Bai, Z.; Fang, S.; Gao, J.; Zhang, Y.; Jin, G. Could vegetation index be derived from synthetic aperture radar?–the linear relationship between interferometric coherence and NDVI. Sci. Rep. 2020, 10, 1–9. [Google Scholar] [CrossRef] [Green Version]
  25. Zhang, Y.; Ye, A. Spatial and temporal variations in vegetation coverage observed using AVHRR GIMMS and Terra MODIS data in the mainland of China. Int. J. Remote Sens. 2020, 41, 4238–4268. [Google Scholar] [CrossRef]
  26. Sun, R.; Chen, S.; Su, H. Climate dynamics of the spatiotemporal changes of vegetation NDVI in northern China from 1982 to 2015. Remote Sens. 2021, 13, 187. [Google Scholar] [CrossRef]
  27. Piao, S.; Mohammat, A.; Fang, J.; Cai, Q.; Fang, J. NDVI-based increase in growth of temperate grasslands and its responses to climate changes in China. Glob. Environ. Chang. 2006, 16, 340–348. [Google Scholar] [CrossRef]
  28. Xu, S.; Yu, Z.; Lettenmaier, D.P.; McVicar, T.R.; Ji, X. Elevation-dependent response of vegetation dynamics to climate change in a cold mountainous region. Environ. Res. Lett. 2020, 15, 094005. [Google Scholar] [CrossRef]
  29. Papagiannopoulou, C.; Miralles, D.G.; Dorigo, W.A.; Verhoest, N.E.C.; Depoorter, M.; Waegeman, W. Vegetation anomalies caused by antecedent precipitation in most of the world. Environ. Res. Lett. 2017, 12, 074016. [Google Scholar] [CrossRef]
  30. Zhao, L.; Dai, A.; Dong, B. Changes in global vegetation activity and its driving factors during 1982–2013. Agric. For. Meteorol. 2018, 249, 198–209. [Google Scholar] [CrossRef]
  31. Birtwistle, A.N.; Laituri, M.; Bledsoe, B.; Friedman, J.M. Using NDVI to measure precipitation in semi-arid landscapes. J. Arid Environ. 2016, 131, 15–24. [Google Scholar] [CrossRef] [Green Version]
  32. Chen, Z.; Wang, W.; Fu, J. Vegetation response to precipitation anomalies under different climatic and biogeographical conditions in China. Sci. Rep. 2020, 10, 1–16. [Google Scholar] [CrossRef] [PubMed] [Green Version]
  33. Wang, S.; Wang, X.; Chen, G.; Yang, Q.; Wang, B.; Ma, Y.; Shen, M. Complex responses of spring alpine vegetation phenology to snow cover dynamics over the Tibetan Plateau, China. Sci. Total Environ. 2017, 593, 449–461. [Google Scholar] [CrossRef]
  34. Guo, W.; Liu, H.; Anenkhonov, O.A.; Shangguan, H.; Sandanow, D.V.; Korolyuk, A.; Hu, G.; Wu, X. Vegetation can strongly regulate permafrost degradation at its southern edge through changing surface freeze-thaw processes. Agric. For. Meteorol. 2018, 252, 10–17. [Google Scholar] [CrossRef]
  35. Heijmans, M.M.P.D.; Magnússon, R.Í.; Lara, M.J.; Frost, G.V.; Myers-Smith, I.H.; Huissteden, J.; Torre, J.M.; Fedorov, A.N.; Epstein, H.E.; Lawrence, D.L.; et al. Tundra vegetation change and impacts on permafrost. Nat. Rev. Earth Environ. 2022, 3, 68–84. [Google Scholar] [CrossRef]
  36. Wang, J.; Wang, K.; Zhang, M.; Zhang, C. Impacts of climate change and human activities on vegetation cover in hilly southern China. Ecol. Eng. 2015, 81, 451–461. [Google Scholar] [CrossRef]
  37. Li, S.; Liang, W.; Fu, B.; Lü, Y.; Fu, S.; Wang, S.; Su, H. Vegetation changes in recent large-scale ecological restoration projects and subsequent impact on water resources in China’s Loess Plateau. Sci. Total Environ. 2016, 569, 1032–1039. [Google Scholar] [CrossRef]
  38. Jiang, L.; Jiapaer, G.; Bao, A.; Guo, H.; Ndayisaba, F. Vegetation dynamics and responses to climate change and human activities in Central Asia. Sci. Total Environ. 2017, 599, 967–980. [Google Scholar] [CrossRef] [PubMed]
  39. Rohde, R.F.; Hoffman, M.T. The historical ecology of Namibian rangelands: Vegetation change since 1876 in response to local and global drivers. Sci. Total Environ. 2012, 416, 276–288. [Google Scholar] [CrossRef]
  40. Piao, S.; Wang, X.; Park, T.; Chen, C.; Lian, X.; He, Y.; Bjerke, J.W.; Chen, A.; Ciais, P.; Tømmervik, H.; et al. Characteristics, drivers and feedbacks of global greening. Nat. Rev. Earth Environ. 2020, 1, 14–27. [Google Scholar] [CrossRef] [Green Version]
  41. Shen, Z.; Fu, G.; Yu, C.; Sun, W.; Zhang, X. Relationship between the growing season maximum enhanced vegetation index and climatic factors on the Tibetan Plateau. Remote Sens. 2014, 6, 6765–6789. [Google Scholar] [CrossRef] [Green Version]
  42. Gu, Z.; Duan, X.; Shi, Y.; Li, Y.; Pan, X. Spatiotemporal variation in vegetation coverage and its response to climatic factors in the Red River Basin, China. Ecol. Indic. 2018, 93, 54–64. [Google Scholar] [CrossRef]
  43. Zhao, W.; Zhao, X.; Zhou, T.; Wu, D.; Tang, B.; Wei, H. Climatic factors driving vegetation declines in the 2005 and 2010 Amazon droughts. PLoS ONE. 2017, 12, e0175379. [Google Scholar] [CrossRef]
  44. Li, C.; Wang, R.; Cui, X.; Wu, F.; Yan, Y.; Peng, Q.; Qian, Z.; Xu, Y. Responses of vegetation spring phenology to climatic factors in Xinjiang, China. Ecol. Indic. 2021, 124, 107286. [Google Scholar] [CrossRef]
  45. Zhao, W.; Yu, X.; Jiao, C.; Xu, C.; Liu, Y.; Wu, G. Increased association between climate change and vegetation index variation promotes the coupling of dominant factors and vegetation growth. Sci. Total Environ. 2021, 767, 144669. [Google Scholar] [CrossRef]
  46. Wu, D.; Zhao, X.; Liang, S.; Zhou, T.; Huang, K.; Tang, B.; Zhao, W. Time-lag effects of global vegetation responses to climate change. Glob. Chang. Biol. 2015, 21, 3520–3531. [Google Scholar] [CrossRef]
  47. Tang, W.; Liu, S.; Kang, P.; Peng, X.; Li, Y.; Guo, R.; Jia, J.; Liu, M.; Zhu, L. Quantifying the lagged effects of climate factors on vegetation growth in 32 major cities of China. Ecol. Indic. 2021, 132, 108290. [Google Scholar] [CrossRef]
  48. Ichii, K.; Kawabata, A.; Yamaguchi, Y. Global correlation analysis for NDVI and climatic variables and NDVI trends: 1982–1990. Int. J. Remote Sens. 2002, 23, 3873–3878. [Google Scholar] [CrossRef]
  49. Eckert, S.; Hüsler, F.; Liniger, H.; Hodel, E. Trend analysis of MODIS NDVI time series for detecting land degradation and regeneration in Mongolia. J. Arid. Environ. 2015, 113, 16–28. [Google Scholar] [CrossRef]
  50. Zhao, Z.; Gao, J.; Wang, Y.; Liu, J.; Li, S. Exploring spatially variable relationships between NDVI and climatic factors in a transition zone using geographically weighted regression. Theor. Appl. Climatol. 2015, 120, 507–519. [Google Scholar] [CrossRef]
  51. Auerbach, N.A.; Walker, M.D.; Walker, D.A. Effects of roadside disturbance on substrate and vegetation properties in arctic tundra. Ecol. Appl. 1997, 7, 218–235. [Google Scholar] [CrossRef]
  52. Jin, X.; Jin, H.; Yang, X.; Wang, W.; Huang, S.; Zhang, S.; Yang, S.; Li, X.; Wang, H.; He, R.; et al. Shrubification along pipeline corridors in permafrost regions. Forests 2022, 13, 1093. [Google Scholar] [CrossRef]
  53. Song, Y.; Jin, L.; Wang, H. Vegetation changes along the Qinghai-Tibet Plateau engineering corridor since 2000 induced by climate change and human activities. Remote Sens. 2018, 10, 95. [Google Scholar] [CrossRef] [Green Version]
  54. Luo, L.; Ma, W.; Zhuang, Y.; Zhang, Y.; Yi, S.; Xu, J.; Long, Y.; Ma, D.; Zhang, Z. The impacts of climate change and human activities on alpine vegetation and permafrost in the Qinghai-Tibet Engineering Corridor. Ecol. Indic. 2018, 93, 24–35. [Google Scholar] [CrossRef]
  55. Jin, H.; Yu, Q.; Wang, S.; Lü, L. Changes in permafrost environments along the Qinghai–Tibet engineering corridor induced by anthropogenic activities and climate warming. Cold Reg. Sci. Technol. 2008, 53, 317–333. [Google Scholar] [CrossRef]
  56. Luo, L.; Duan, Q.; Wang, L.; Zhao, W.; Zhuang, Y. Increased human pressures on the alpine ecosystem along the Qinghai-Tibet Railway. Reg. Environ. Chang. 2020, 20, 1–13. [Google Scholar] [CrossRef]
  57. Yang, J.; Ding, Y.; Chen, R. Spatial and temporal of variations of alpine vegetation cover in the source regions of the Yangtze and Yellow Rivers of the Tibetan Plateau from 1982 to 2001. Environ. Geol. 2006, 50, 313–322. [Google Scholar] [CrossRef]
  58. Jin, H.; He, R.; Cheng, G.; Wu, Q.; Wang, S.; Lü, L.; Chang, X. Changes in frozen ground in the Source Area of the Yellow River on the Qinghai–Tibet Plateau, China, and their eco-environmental impacts. Environ. Res. Lett. 2009, 4, 045206. [Google Scholar] [CrossRef]
  59. Wang, M.; Fu, J.; Wu, Z.; Pang, Z. Spatiotemporal variation of NDVI in the vegetation growing season in the source region of the Yellow River, China. ISPRS Int. J. Geo-Inf. 2020, 9, 282. [Google Scholar] [CrossRef] [Green Version]
  60. Jin, X.; Jin, H.; Luo, D.; Sheng, Y.; Wu, Q.; Wu, J.; Wang, W.; Huang, S.; Li, X.; Liang, S.; et al. Impacts of permafrost degradation on hydrology and vegetation in the Source Area of the Yellow River on northeastern Qinghai-Tibet Plateau, Southwest China. Front. Earth Sci. 2022, 10, 845824. [Google Scholar] [CrossRef]
  61. Sheng, Y.; Ma, S.; Cao, W.; Wu, J. Spatiotemporal changes of permafrost in the Headwater Area of the Yellow River under a changing climate. Land Degrad. Dev. 2020, 31, 133–152. [Google Scholar] [CrossRef]
  62. Jin, H.; Zhao, L.; Wang, S.; Jin, R. Thermal regimes and degradation modes of permafrost along the Qinghai-Tibet Highway. Sci. China-Earth Sci. 2006, 49, 1170–1183. [Google Scholar] [CrossRef]
  63. Jin, X.; Jin, H.; Wu, X.; Luo, D.; Yu, S.; Li, X.; He, R.; Wang, Q.; Knops, J. Permafrost degradation leads to biomass and species richness decreases on the northeastern Qinghai-Tibet Plateau. Plants 2020, 9, 1453. [Google Scholar] [CrossRef]
  64. Jin, X.; Jin, H.; Iwahana, G.; Marchenko, S.; Luo, D.; Li, X.; Liang, S. Impacts of climate-induced permafrost degradation on vegetation: A review. Adv. Clim. Chang. Res. 2021, 12, 29–47. [Google Scholar] [CrossRef]
  65. Luo, D.; Jin, H.; Jin, X.; He, R.; Li, X.; Muskett, R.R.; Marchenko, S.; Romanovsky, V.E. Elevation-dependent thermal regime and dynamics of frozen ground in the Bayan Har Mountains, northeastern Qinghai-Tibet Plateau, southwest China. Permafr. Periglac. Process. 2018, 29, 257–270. [Google Scholar] [CrossRef]
  66. Gruber, S. Derivation and analysis of a high-resolution estimate of global permafrost zonation. Cryosphere 2012, 6, 221–233. [Google Scholar] [CrossRef] [Green Version]
  67. Tang, Z.; Deng, G.; Hu, G.; Zhang, H.; Pan, H.; Sang, G. Satellite observed spatiotemporal variability of snow cover and snow phenology over High Mountain Asia from 2002 to 2021. J. Hydrol. 2022, 613, 128438. [Google Scholar] [CrossRef]
  68. Afyouni, S.; Smith, S.M.; Nichols, T.E. Effective degrees of freedom of the Pearson’s correlation coefficient under autocorrelation. Neuroimage 2019, 199, 609–625. [Google Scholar] [CrossRef]
  69. Huang, Y.; Jiang, N.; Shen, M.; Li, G. Effect of preseason diurnal temperature range on the start of vegetation growing season in the Northern Hemisphere. Ecol. Indic. 2020, 112, 106161. [Google Scholar] [CrossRef]
  70. Kalisa, W.; Igbawua, T.; Henchiri, M.; Ali, S.; Zhang, S.; Bai, Y.; Zhang, J. Assessment of climate impact on vegetation dynamics over East Africa from 1982 to 2015. Sci. Rep. 2019, 9, 1–20. [Google Scholar] [CrossRef] [Green Version]
  71. Liu, S.; Li, T. Geographic detection and optimizing decision of the differentiation mechanism of rural poverty in China. Acta Geogr. Sin. 2017, 72, 161–173. (In Chinese) [Google Scholar]
  72. Song, Y.; Wang, J.; Ge, Y.; Xu, C. An optimal parameters-based geographical detector model enhances geographic characteristics of explanatory variables for spatial heterogeneity analysis: Cases with different types of spatial data. GISci. Remote Sens. 2020, 57, 593–610. [Google Scholar] [CrossRef]
  73. Zhang, Y.; Lu, H.; Qu, W. Geographical detection of traffic accidents spatial stratified heterogeneity and influence factors. Int. J. Environ. Res. Public Health 2020, 17, 572. [Google Scholar] [CrossRef] [PubMed] [Green Version]
  74. Wang, J.; Zhang, T.; Fu, B. A measure of spatial stratified heterogeneity. Ecol. Indic. 2016, 67, 250–256. [Google Scholar] [CrossRef]
  75. Wang, J.; Li, X.; Christakos, G.; Liao, Y.; Zhang, T.; Gu, X.; Zheng, X. Geographical Detectors-based health risk assessment and its application in the neural tube defects study of the Heshun region, China. Int. J. Geogr. Inf. Sci. 2010, 24, 107–127. [Google Scholar] [CrossRef]
  76. Yang, Z.; Gao, J.; Zhou, C.; Shi, P.; Zhao, L.; Shen, W.; Ouyang, H. Spatio-temporal changes of NDVI and its relation with climatic variables in the source regions of the Yangtze and Yellow rivers. J. Geogr. Sci. 2011, 21, 979–993. [Google Scholar] [CrossRef]
  77. Tang, R.; Zhao, Y.; Lin, H. Spatio-Temporal Variation Characteristics of Aboveground Biomass in the Headwater of the Yellow River Based on Machine Learning. Remote Sens. 2021, 13, 3404. [Google Scholar] [CrossRef]
  78. Jacquin, A.; Sheeren, D.; Lacombe, J. Vegetation cover degradation assessment in Madagascar savanna based on trend analysis of MODIS NDVI time series. Int. J. Appl. Earth Obs. 2010, 12S, S3–S10. [Google Scholar] [CrossRef] [Green Version]
  79. Ge, J.; Meng, B.; Liang, T.; Feng, Q.; Gao, J.; Yang, S.; Huang, X.; Xie, H. Modeling alpine grassland cover based on MODIS data and support vector machine regression in the headwater region of the Huanghe River, China. Remote Sens. Environ. 2018, 218, 162–179. [Google Scholar] [CrossRef]
  80. Shen, X.; An, R.; Feng, L.; Ye, N.; Zhu, L.; Li, M. Vegetation changes in the Three-River Headwaters Region of the Tibetan Plateau of China. Ecol. Indic. 2018, 93, 804–812. [Google Scholar] [CrossRef]
  81. Ji, G.; Song, H.; Wei, H.; Wei, H.; Wu, L. Attribution analysis of climate and anthropic factors on runoff and vegetation changes in the source area of the Yangtze River from 1982 to 2016. Land 2021, 10, 612. [Google Scholar] [CrossRef]
  82. Wang, R.; Dong, Z.; Zhou, Z. Different responses of vegetation to frozen ground degradation in the Source Region of the Yellow River from 1980 to 2018. Chin. Geogr. Sci. 2020, 30, 557–571. [Google Scholar] [CrossRef]
  83. Liu, Y.; Chen, Y.; Wu, Z.; Wang, B.; Wang, S. Geographical detector-based stratified regression kriging strategy for mapping soil organic carbon with high spatial heterogeneity. Catena 2021, 196, 104953. [Google Scholar] [CrossRef]
  84. Meng, X.; Gao, X.; Li, S.; Lei, J. Spatial and temporal characteristics of vegetation NDVI changes and the driving forces in Mongolia during 1982–2015. Remote Sens. 2020, 12, 603. [Google Scholar] [CrossRef] [Green Version]
  85. Yu, Q.; Lu, H.; Yao, T.; Xue, Y.; Feng, W. Enhancing sustainability of vegetation ecosystems through ecological engineering: A case study in the Qinghai-Tibet Plateau. J. Environ. Manage. 2023, 325, 116576. [Google Scholar] [CrossRef]
  86. Cong, N.; Shen, M.; Yang, W.; Yang, Z.; Zhang, G.; Piao, S. Varying responses of vegetation activity to climate changes on the Tibetan Plateau grassland. Int. J. Biometerol. 2017, 61, 1433–1444. [Google Scholar] [CrossRef]
  87. Xu, W.; Gu, S.; Zhao, X.; Xiao, J.; Tang, Y.; Fang, J. High positive correlation between soil temperature and NDVI from 1982 to 2006 in alpine meadow of the Three-River Source Region on the Qinghai-Tibetan Plateau. Int. J. Appl. Earth Obs. Geoinf. 2011, 13, 528–535. [Google Scholar] [CrossRef]
  88. Yuan, J.; Xu, Y.; Xiang, J.; Wu, L.; Wang, D. Spatiotemporal variation of vegetation coverage and its associated influence factor analysis in the Yangtze River Delta, eastern China. Environ. Sci. Pollut. Res. 2019, 26, 32866–32879. [Google Scholar] [CrossRef] [PubMed]
  89. Ran, Y.; Li, X.; Cheng, G. Climate warming over the past half century has led to thermal degradation of permafrost on the Qinghai-Tibet Plateau. Cryosphere 2018, 12, 595–608. [Google Scholar] [CrossRef] [Green Version]
  90. Zhao, L.; Zou, D.; Hu, G.; Du, E.; Pang, Q.; Xiao, Y.; Li, R.; Sheng, Y.; Wu, X.; Su, Z.; et al. Changing climate and the permafrost environment on the Qinghai–Tibet (Xizang) plateau. Permafr. Periglac. Process. 2020, 31, 396–405. [Google Scholar] [CrossRef]
  91. Nie, T.; Dong, G.; Jiang, X.; Lei, Y. Spatio-temporal changes and driving forces of vegetation coverage on the Loess Plateau of Northern Shaanxi. Remote Sens. 2021, 13, 613. [Google Scholar] [CrossRef]
  92. Zheng, K.; Tan, L.; Sun, Y.; Wu, Y.; Duan, Z.; Xu, Y.; Gao, C. Impacts of climate change and anthropogenic activities on vegetation change: Evidence from typical areas in China. Ecol. Indic. 2021, 126, 107648. [Google Scholar] [CrossRef]
  93. You, Q.; Chen, D.; Wu, F.; Pepin, N.; Cai, Z.; Ahrens, B.; Jiang, Z.; Wu, Z.; Kang, S.; AghaKouchak, A. Elevation dependent warming over the Tibetan Plateau: Patterns, mechanisms and perspectives. Earth-Sci. Rev. 2020, 210, 103349. [Google Scholar] [CrossRef]
  94. Yu, F.; Qi, J.; Yao, X.; Liu, Y. Degradation process of permafrost underneath embankments along Qinghai-Tibet Highway: An engineering view. Cold Reg. Sci. Technol. 2013, 85, 150–156. [Google Scholar] [CrossRef]
  95. Jin, H.; Hao, J.; Chang, X.; Zhang, J.; Qi, J.; Lü, L.; Wang, S. Zonation and assessment of frozen-ground conditions for engineering geology along the China-Russia Crude Oil Pipeline route from Mo’he to Daqing, Northeastern China. Cold Reg. Sci. Technol. 2010, 64, 213–225. [Google Scholar] [CrossRef]
  96. Panda, S.K.; Prakash, A.; Solie, D.N.; Romanovsky, V.E.; Jorgenson, M.T. Remote sensing and field-based mapping of permafrost distribution along the Alaska Highway corridor, interior Alaska. Permafr. Periglac. Process. 2010, 21, 271–281. [Google Scholar] [CrossRef]
  97. Kumpula, T.; Pajunen, A.; Kaarlejärvi, E.; Forbes, B.C.; Stammler, F. Land use and land cover change in Arctic Russia: Ecological and social implications of industrial development. Glob. Environ. Chang. 2011, 21, 550–562. [Google Scholar] [CrossRef]
Figure 1. Location map of the study area on northeastern Qinghai–Tibet Plateau in West China. Notes: (a) Relative location of the Qinghai–Tibet Plateau in China; (b) National Highway 214 (G214) (red line) across the southern Qinghai Plateau (SQP) and the key study segment of G214 across the Bayan Har Mountains (pink box). Permafrost distribution on the upper panel is derived from a global permafrost zonation index [66]; (c) Permafrost boreholes (green points), county towns (white points), rivers and lakes (blue line and areas), and study area (highlighted black-bordered box, a 60 km wide buffer zone mapped along each side of the G214).
Remotesensing 15 01547 g001
Figure 2. Distributive features of five classes of growth season Normalized Difference Vegetation Index (NDVIgs) along the National Highway G214 from the Changshitoushan Mountain Pass to Qingshui’he Riverside at the northern and southern flanks of the Bayan Har Mountains, southern Qinghai, China. Notes: (a) Spatiotemporal variation of NDVIgs, averaged by NDVIgs during 2010–2019; (b) Areal percentage of different classes of NDVIgs in the study area in 2010, 2013, 2016, and 2019.
Remotesensing 15 01547 g002
Figure 3. Changes in average growth season Normalized Difference Vegetation Index (NDVIgs) in three buffer zones along the National Highway G214 from the Changshitoushan Mountain Pass to the Qingshui’he Riverside at the northern and southern flanks of the Bayan Har Mountains on the southern Qinghai Plateau, West China, from 2010 to 2019.
Remotesensing 15 01547 g003
Figure 4. Coefficients of variation (CV) of growth season Normalized Difference Vegetation Index (NDVIgs) within the three buffer zones along National Highway G214 from Changshitoushan Mountain Pass to Qingshui’he Riverside at the northern and southern flanks of the Bayan Har Mountains, southern Qinghai, China, from 2010 to 2019. Notes: (a) Spatial stability distribution of coefficients of variation within the 0–30 km buffers; (b) Areal percentage of coefficient of variation in the three buffer zones.
Remotesensing 15 01547 g004
Figure 5. Effects of two interactive factors on Normalized Difference Vegetation Index (NDVI) along the National Highway G214 from the Changshitoushan Mountain Pass to Qingshui’he Riverside at the northern and southern flanks of the Bayan Har Mountains, southern Qinghai, China, from 2010–2019. Note: NDSI, Normalized Difference Snow Index; AP, annual precipitation; AAAT, average annual air temperature; MAGT, mean annual ground temperature.
Remotesensing 15 01547 g005
Table 1. List of the data in this study.
CategoryDataYearSpatial
Resolution
Vegetation indexNDVI2010, 2013, 2016, 20191 km
Snow indexNDSI2010, 2013, 2016, 20190.5 km
Meteorological factorsAP and AAAT 2010, 2013, 2016, 20191 km
Terrain factorsElevation and slope201730 m
PermafrostMAGT2010, 2013, 2016, 2019N/A
Note: NDVI, Normalized Difference Vegetation Index; NDSI, Normalized Difference Snow Index; AP, annual precipitation; AAAT, average annual air temperature; MAGT, mean annual ground temperature, which was obtained at the depth of zero annual amplitude at 15 m in depth in July or August from the 16 boreholes along the G214 in the study area.
Table 2. Types of interaction between two covariates.
Criteria of IntervalInteraction
q X 1 X 2 < M i n q X 1 , q X 2 Nonlinear weakening
M i n q X 1 , q X 2 < q X 1 X 2 < M a x q X 1 , q X 2 Single-factor nonlinear weakening
q X 1 X 2 > M a x q X 1 , q X 2 Dual-factor enhancement
q X 1 X 2 = q X 1 + q X 2 Independence
q X 1 X 2 > q X 1 + q X 2 Nonlinear enhancement
Table 3. The q-statistics of the contribution of each factor to NDVIgs along National Highway G214 from the Changshitoushan Mountain Pass to the Qingshui’he Riverside at the northern and southern flanks of the Bayan Har Mountains, southern Qinghai, China, from 2010 to 2019.
TypesElevationSlopeNDSIAPAAATMAGT
q-statistic0.310.040.080.520.450.20
p-value<0.01<0.01<0.01<0.01<0.01<0.01
Note: NDSI, Normalized Difference Snow Index; AP, annual precipitation; AAAT, average annual air temperature. Mean annual ground temperature (MAGT) was obtained at the depth of zero annual amplitude at 15 m in depth from the 16 boreholes along the G214 in the study area.
Disclaimer/Publisher’s Note: The statements, opinions and data contained in all publications are solely those of the individual author(s) and contributor(s) and not of MDPI and/or the editor(s). MDPI and/or the editor(s) disclaim responsibility for any injury to people or property resulting from any ideas, methods, instructions or products referred to in the content.

