Article

A Remote Sensing View of the 2020 Extreme Lake-Expansion Flood Event into the Peace–Athabasca Delta Floodplain—Implications for the Future SWOT Mission

by
Nicolas M. Desrochers
1,*,
Daniel L. Peters
2,
Gabriela Siles
1,
Elizabeth Cauvier Charest
1,
Mélanie Trudel
1 and
Robert Leconte
1
1
Department of Civil Engineering and Building, University of Sherbrooke, Sherbrooke, QC J1K 2R1, Canada
2
Watershed Hydrology and Ecology Research Division, Environment and Climate Change Canada, University of Victoria Queenswood Campus, Victoria, BC V8N 1V8, Canada
*
Author to whom correspondence should be addressed.
Remote Sens. 2023, 15(5), 1278; https://doi.org/10.3390/rs15051278
Submission received: 20 January 2023 / Revised: 13 February 2023 / Accepted: 22 February 2023 / Published: 25 February 2023

Abstract

:
The Peace–Athabasca Delta (PAD) in western Canada is one of the largest inland deltas in the world. Flooding caused by the expansion of lakes beyond normal shorelines occurred during the summer of 2020 and provided a unique opportunity to evaluate the capabilities of remote sensing platforms to map surface water expansion into vegetated landscape with complex surface connectivity. Firstly, multi-source remotely sensed data via satellites were used to create a temporal reconstruction of the event spanning May to September. Optical synthetic aperture radar (SAR) and altimeter data were used to reconstruct surface water area and elevation as seen from space. Lastly, temporal water surface area and level data obtained from the existing satellites and hydrometric stations were used as input data in the CNES Large-Scale SWOT Simulator, which provided an overview of the newly launched SWOT satellite ability to monitor such flood events. The results show a 25% smaller water surface area for optical instruments compared to SAR. Simulations show that SWOT would have greatly increased the spatio-temporal understanding of the flood dynamics with complete PAD coverage three to four times per month. Overall, seasonal vegetation growth was a major obstacle for water surface area retrieval, especially for optical sensors.

1. Introduction

Deltaic environments are of vital importance for the health and prosperity of many living species [1]. Yet their dynamic aquatic nature makes them vulnerable to various threats and changes [2], such as the Mississippi (USA) and the Mekong (Vietnam) river deltas that have been affected by climate change and water alteration schemes [3]. An example of a remote inland delta that has experienced multiple hydrologic stressors on its ecosystem is the Peace–Athabasca Delta (PAD; Canada) [4,5]. The PAD is one of the largest inland deltas in the world, with floodplains comprised of channels, levees, plains, wetland and lake complexes [4]. This region is home to diverse ecosystem processes [6] and has experienced several cycles of dry and wet conditions in the last few centuries [7], but faces challenges in ground-based monitoring due to its remote location and spatial extent.
In the summer of 2020, the PAD experienced the second-highest central lake level in >90 years of hydrometric record. Waters rose almost 1.5 m above average and expanded into the surrounding deltaic floodplains. Such an inundation mechanism has received some attention in the PAD (e.g., [2]), but an event of this magnitude during the open-water season has not been observed by modern space-based earth observation (SBEO) satellites. This represents a scientific opportunity to test a variety of remotely-sensed data sources to assess the advantages and disadvantages of SBEO instruments to observe surface water expansion into normally drier, vegetated deltaic areas.
A recurring theme in the analysis of remotely-sensed data for any specific event is the trade-off between their spatial and temporal resolution. Coarse spatial resolution instruments usually have a shorter revisiting cycle (finer temporal resolution) and, therefore, capture a more consistent history of an event. Comparatively, high spatial resolution instruments typically have a longer revisitation cycle (coarser temporal resolution) but can capture parts the event in more details. Another important parameter is the width of the swath. Instruments with broader swath will cover a greater portion of an area of interest at a given point in time, making spatial comparisons more reliable because observed data values may change from day-to-day due to atmospheric conditions. Furthermore, a specific area of interest may have more coverage, with satellites having overlapping swaths. Further information on spatial and temporal parameters of SBEO instruments can be found in Chawla et al. [8].
When applied to inland deltaic ecosystems, such as the PAD, space-borne observations need to be capable of detecting water surface area (WSA) in complex, semi-aquatic terrain. Multispectral optic (passive) instruments have been a key aspect in furthering our understanding of surface water hydrology [9]. SBEO Missions such as Landsat and MODIS have provided a stream of reliable observations for 20+ years, along with the more recent Sentinel constellation. This suite of satellites has proven useful for remotely-sensed wetland classification and monitoring thanks to their spectral range which enables estimation of biochemical and biophysical parameters of wetland vegetation [10]. Huang et al. [11] reviewed the various approaches for monitoring surface water using optical instruments and noted that water indices are a relatively easy and effective way to delineate water bodies. The Normalized Difference Water Index (NDWI, [12]) uses optical bands ratios to accentuate areas with prevailing water bodies. Other water indices have been proposed since McFeeter [12], as detailed by Huang [11]. While relatively user-friendly, optical images have several drawbacks, most notably, the occurrence of obstructed view by cloud and vegetation. In spite of potential limitations, a wide selection of optical instruments provide freely accessible data at relatively frequent revisiting cycles and high spatial resolution, which contribute to a growing trend in open data accessibility [13].
Contrary to optical observations, Synthetic Aperture Radar (SAR) are active instruments that can detect and observe a target or phenomenon at night and below vegetation [14]. While being slightly more recent (1990s) than optical, SAR instruments have been the focus of many studies on wetland classification [15] and have proved useful for estimating soil moisture and surface water observations [16,17]. Established approaches of flood mapping range from global or enhanced thresholding, to active contour and change detection [18]. Although SAR instruments do not have as frequent a revisitation cycle as most optical instruments, they can be more reliable in certain environments since the wavelength range of SAR can penetrate cloud cover and smoke [17].
Water level in wetlands has been estimated using interferometric SAR [19] or using both optical and SAR observations in tandem with a Digital Elevation Model (DEM) [20,21]. However, radar altimeter instruments offer a relatively more precise water surface elevation (WSE), albeit lacking spatial extent with pre-2023 satellites. The use of altimeters for monitoring WSE change in lakes has been around for more than 25 years [22]. Multiple altimetry missions have been launched (e.g., ENVISAT, SARAL Altika, Jason 1, 2 and 3, IceSat and Sentinel 3) and have proven crucial in assessing wetland water dynamics [23]. However, present-day radar altimeters are not imager instruments, meaning that their data represent a point in space, thus, lacking spatial information and possibly leading to pixel mixing between land and water [24].
The Surface Water and Ocean Topography (SWOT) mission was recently launched in December 2022. This state-of-the-art SBEO mission will allow detection of lakes of at least 250 m × 250 m and rivers of at least 100 m of width. Its innovation lies in detecting WSE at a 10 cm vertical accuracy (averaged over 1 km2) [25]. The SWOT mission will also detect WSA to an expected accuracy of 15%. This simultaneous two-dimensional spatial data should allow for a better understanding of the distribution and movement of water in floodplains, such as the PAD. Similarly to the RADARSAT Constellation Mission (RCM) [26], the PAD has been chosen as one of the Canadian calibration/validation sites for the SWOT mission [27]. Once operational, the SWOT mission will offer various global products for lakes and rivers in the form of WSE, WSA, and slopes [25]. The lake product uses a prior lake database (PLD) [28] to help SWOT in the classification and create unique lake identification (ID), as well as naming lakes when such information is available. The algorithm for this product is still being tested and optimized. An updated version of the PLD is expected before and further optimized after the launch. The SWOT mission shows great promise in monitoring deltaic floodplains as indicted by simulations [29,30,31,32,33].
In terms of monitoring flood events, concerns were raised about the temporal resolution of the SWOT mission. Frasson et al. [34] showed that the SWOT mission could make a reliable observation once or twice per 21-day cycle in latitudes between 20°N and 20°S, which would have observed 55% of floods since 1985 as compiled by the Dartmouth Flood Observatory. Higher latitudes are likely to have more frequent revisitation. Their research also demonstrated that the SWOT mission will have a higher likelihood of observing more destructive flood events since they tend to last longer. However, there is no practical knowledge as to how useful SWOT’s revisiting cycle and swath coverage will be when monitoring a particular flood event [35].
This study capitalizes on the hydrological happenings of 2020 in the PAD to evaluate the plus value of SWOT data in monitoring an extreme flood event caused by lake expansion. Here, the focus is not on the quality of the SWOT mission’s measurement, which will be evaluated during the calibration/validation period in spring 2023, but rather on its ability to monitor flood events on a temporal and spatial scale. To accomplish this task, a suite of remotely-sensed data available over the delta were examined. In particular, the spatial and temporal coverage of SBEO optical, SAR and altimetry data, as well as simulations of the yet-to-be available SWOT mission products, were analyzed over the PAD for a period spanning the 2020 open-water period.
Firstly, a data-query of freely available SBEO is carried out to evaluate the temporal resolution of each SBEO satellite. Secondly, a WSA retrieval process of optical and SAR data is performed to highlight the water expansion throughout the event. As part of this step, WSE is also retrieved from altimetric data. Lastly, SWOT simulations are performed over the entire PAD and focus on one of the larger central lakes for the duration of the 2020 flood period. An important question to consider is “how would the upcoming SWOT mission have seen the progression of lake expansion across the PAD”, which is representative of remote, high latitude deltaic ecosystems. Such an analysis will provide valuable insights into how existing and future SBEO technologies can be incorporated into an integrated research and monitoring program for the internationally recognized PAD ecosystem.

2. Materials and Methods

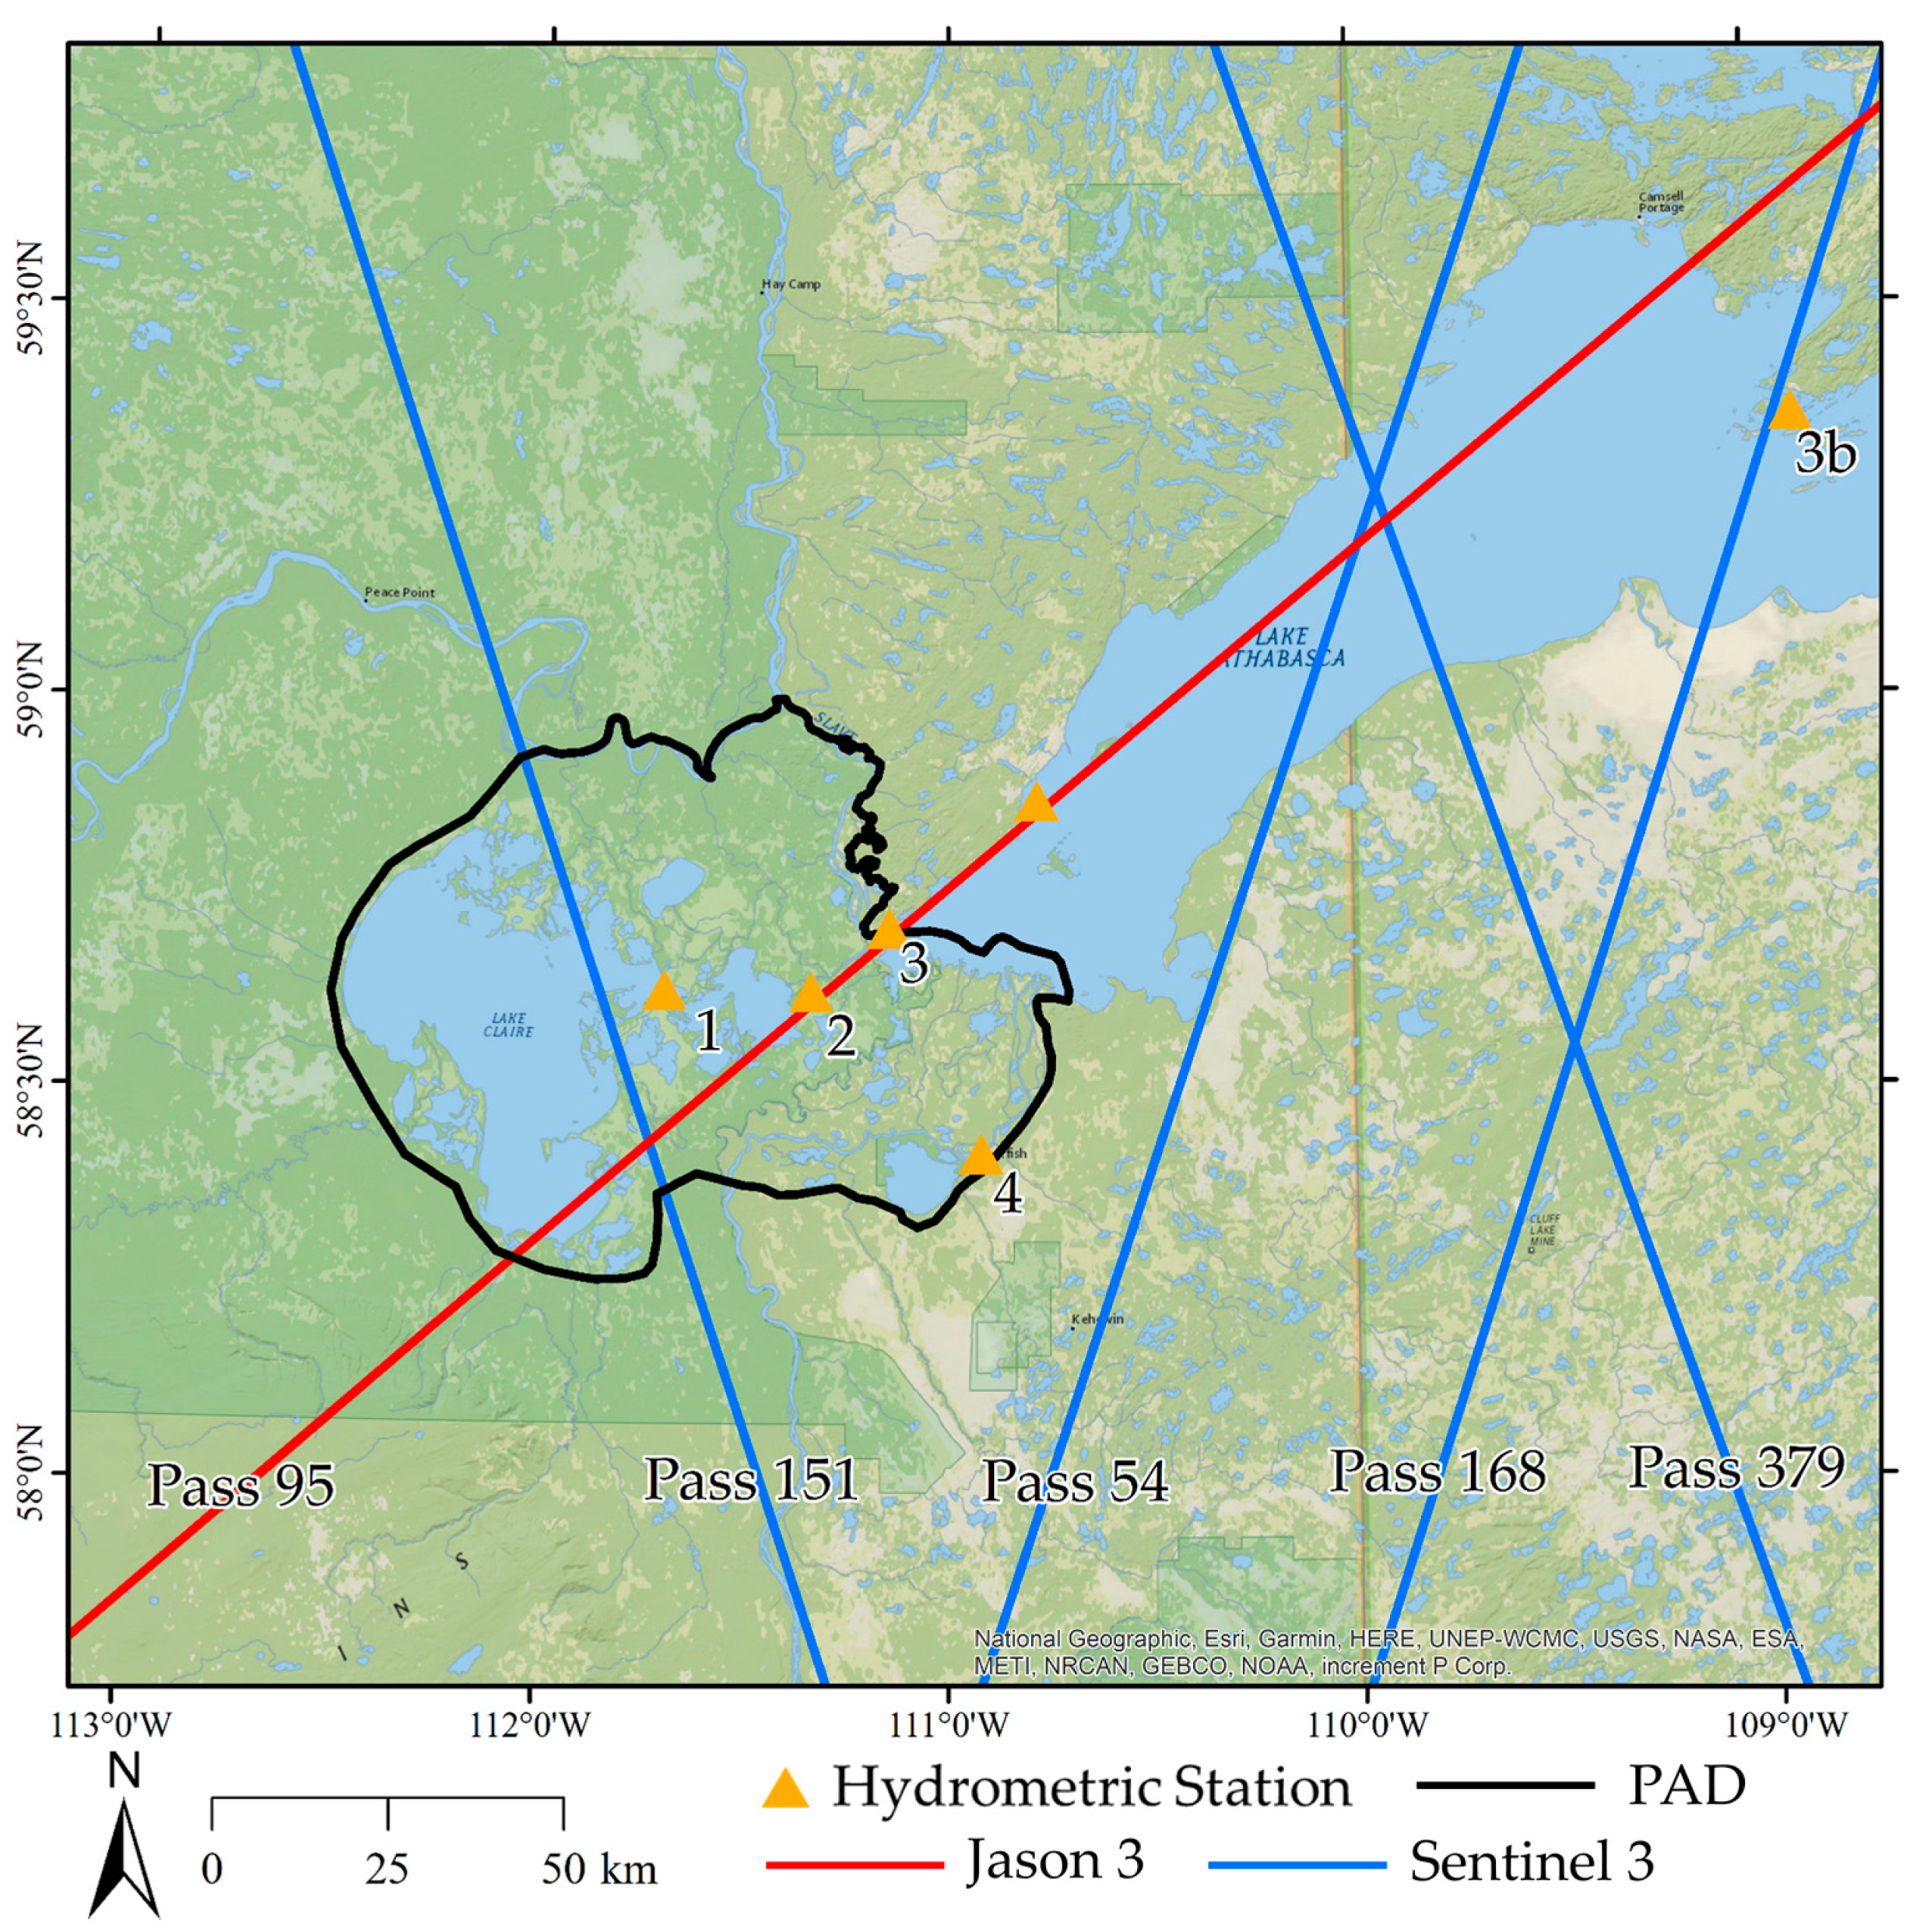
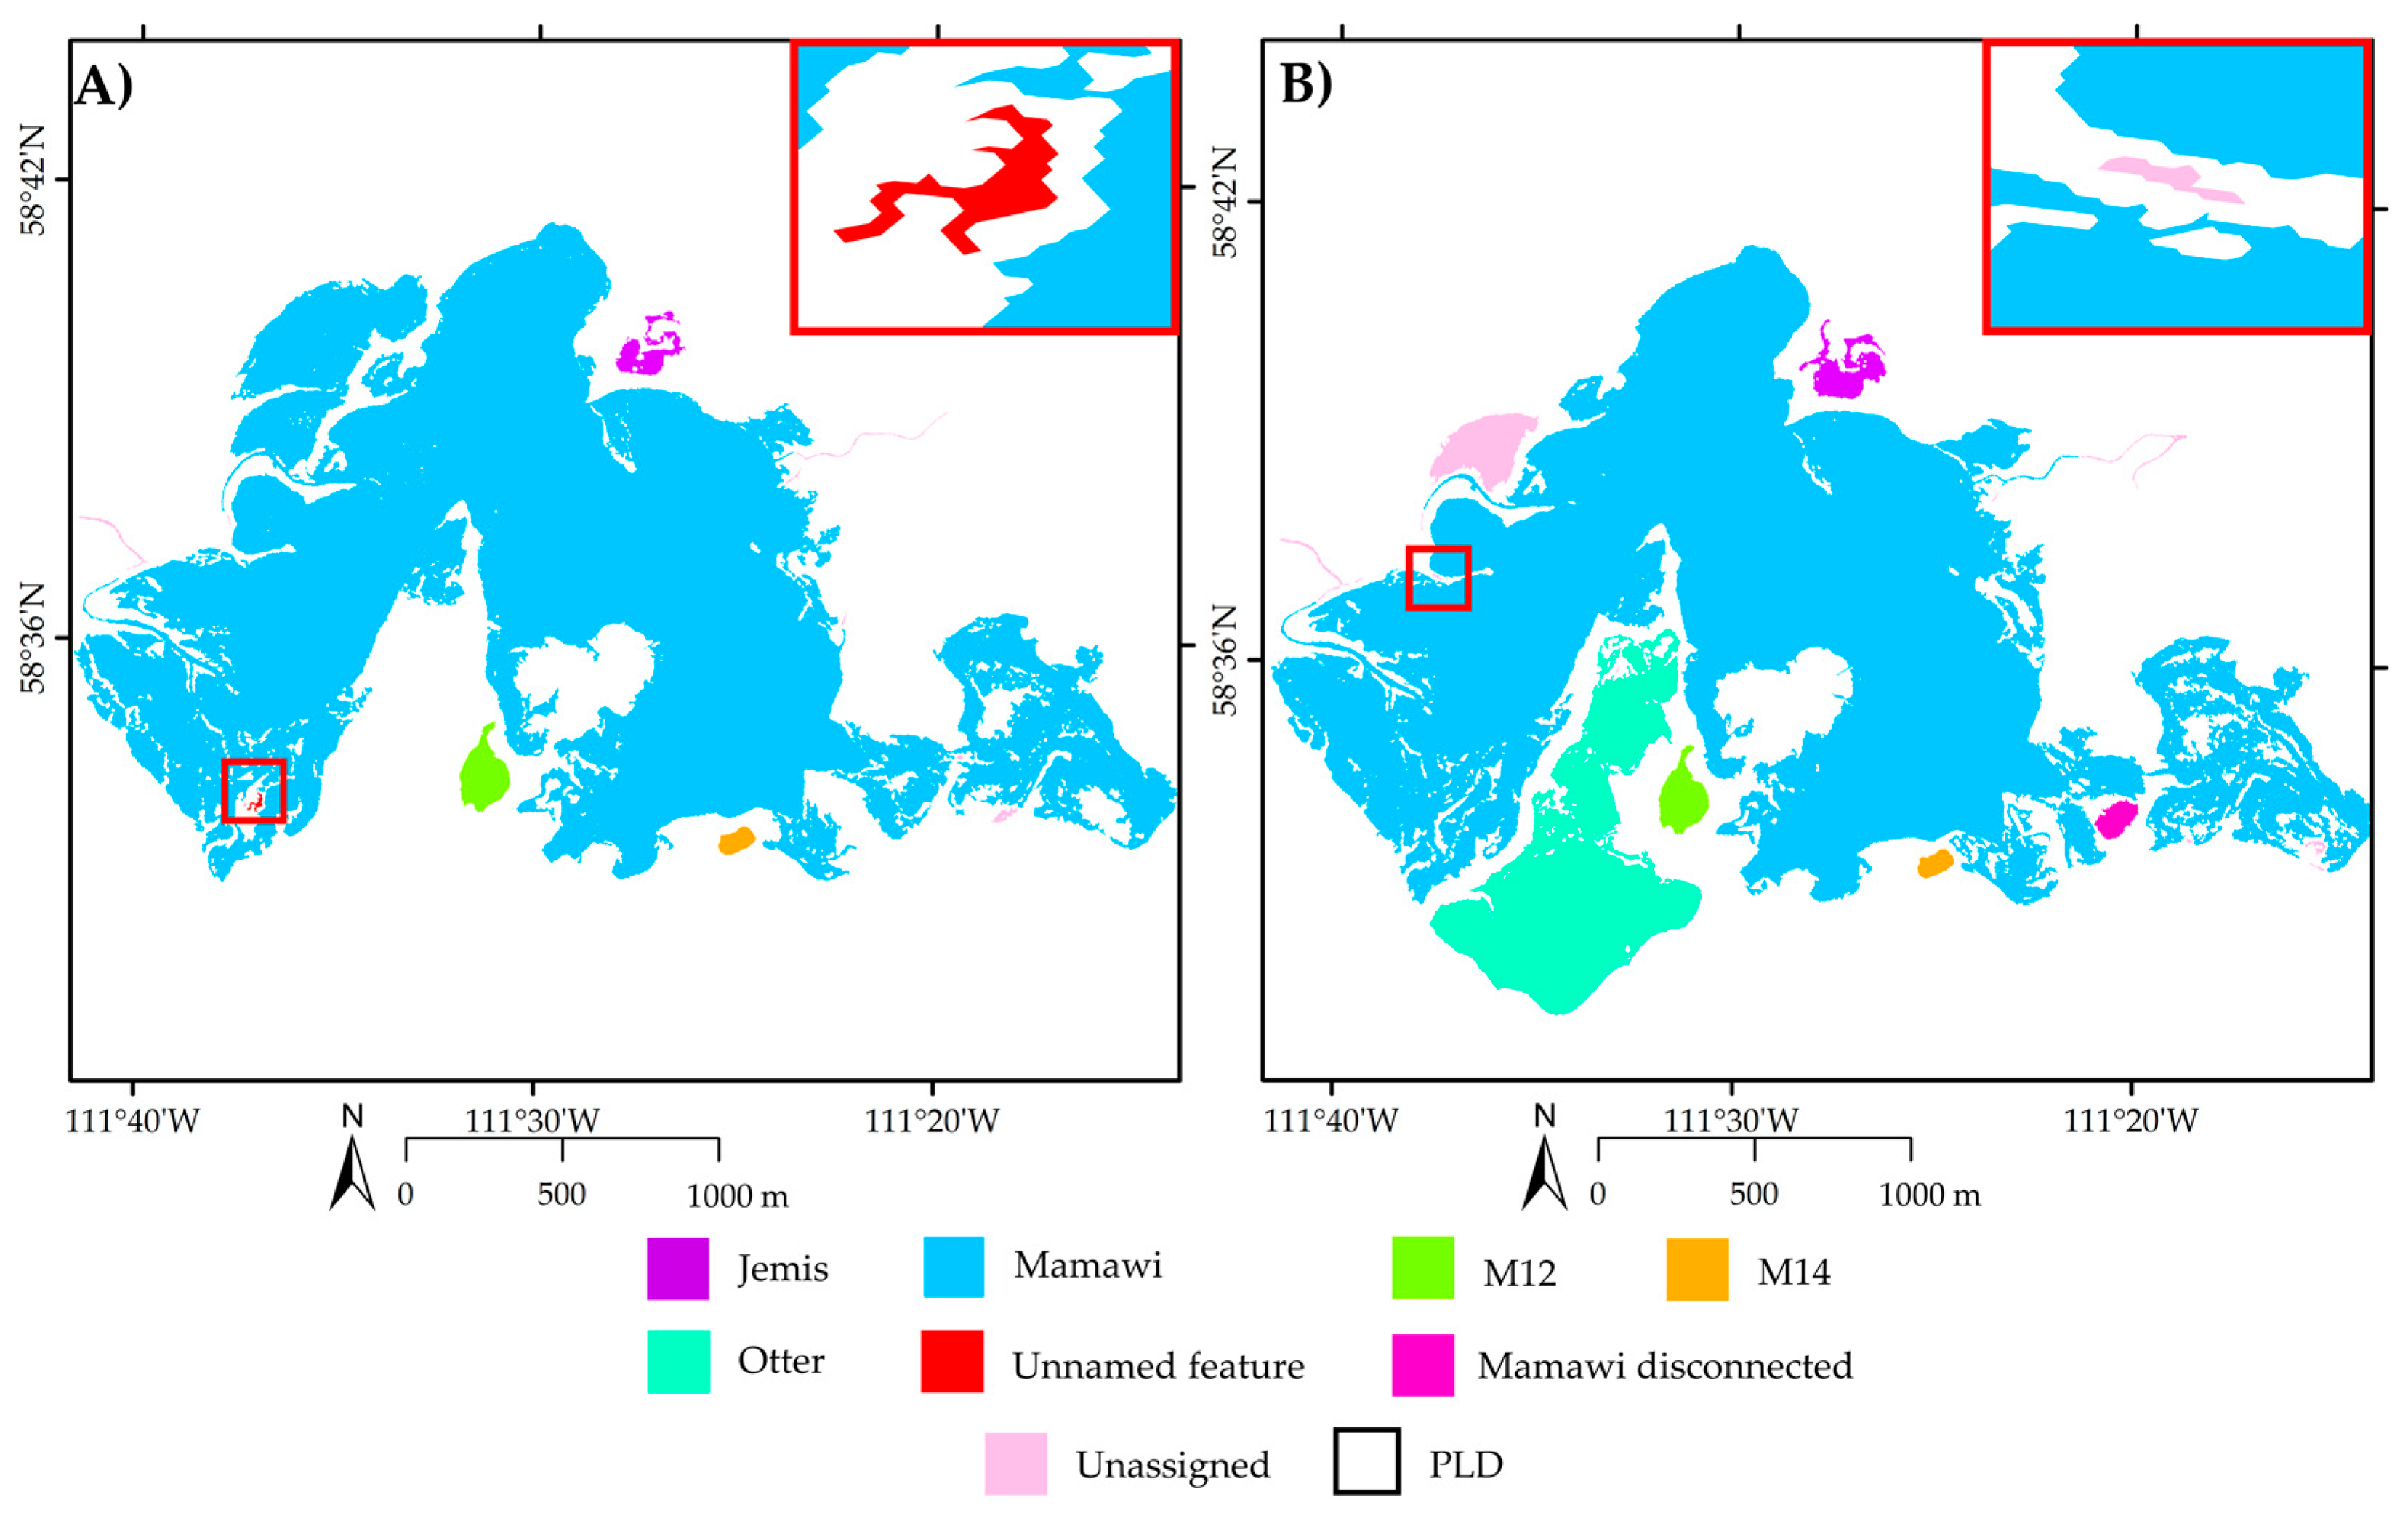
2.1. Site Description

The PAD formed at the confluence of the Peace, Athabasca and Birch River deltas at the western-end of Lake Athabasca in northern Alberta, Canada (Figure 1). The PAD is one of the largest freshwater deltaic ecosystems in the world (>5500 km2) and has been recognized as a Ramsar Wetland site of international importance (1982) and is largely contained within the Wood Buffalo National Park, which is a UNESCO Heritage site (1983). The prominent central lakes (Claire, Mamawi and Athabasca) and surrounding deltaic floodplains provide habitats for many species of mammals, fish, and waterfowls, which are also traditional hunting and trapping grounds for the Indigenous peoples of the area.
As seen in Figure 1, the PAD is comprised of lakes, wetlands and channels with varying connectivity to the main flow system. Inland flooding can occur via three predominant mechanisms: (i) ice-jam induced high waters, (ii) open-water high stormflow overbanking local levees and (iii) open-water expansion of the central lakes beyond normal shorelines [6]. To a lesser extent, wind seiches can also move water into the adjacent landscape.
The vegetation cover in the delta follows an elevation and moisture gradient with aquatic vegetation (e.g., floating or submerged) being at lowest elevation and succeeded by marsh and meadows (e.g., grasses and reeds), thickets and savannah (e.g., willows and alders), and forest (e.g., balsam poplar and white spruce) which are at highest elevation. Further information on the delta’s natural characteristics can be found in Timoney [4].
It should be noted that the hydrology of the PAD has been, in addition to climate variability and change, influenced by flow regulation since 1968 with the operation of a large hydroelectric reservoir in the headwaters of the Peace River and subsequent construction of weirs on delta outflow channels (Rivières des Rochers and Revillon Coupé) that drain the system north to the Slave River [2]. The Athabasca River mainstem is unregulated, with <5% of the natural flow allocated for agriculture, municipal and industrial water uses (e.g., oil sands mining) [36].

2.2. Data

The five hydrometric stations used in this study are located at Lake Claire near outlet to Prairie River (07KF002), Mamawi Lake Channel at Old Dog Camp (07KF003), Lake Athabasca at Fort Chipewyan (07MD001) and Lake Athabasca near Crackingstone Point (07MC003), and Athabasca River above Jackfish Creek (07DD007) near the outflow of Richardson Lake (Figure 1). These data obtained from the HYDAT database [37] were used as benchmarks for comparing WSE from SBEO altimeters and as input to the SWOT simulations. Water levels for the temporary loggers (Jemis, Otter, M12, and M14) were obtained from Parks Canada.
Freely available remotely-sensed data were obtained for SBEO Sentinel 1, 2 and 3, Landsat 8, RCM and Jason-3. Table 1 summarizes the various parameters for each mission. These remotely-sensed data are used for spatial and temporal coverage analyses in Section 2.3. Optical and SAR data are used for WSA extraction. The WSA retrieved from Sentinel-1 data was also used as input data for the SWOT simulations. As seen in Figure 1, several of the hydrometric gauges are not located directly on the lake or represent a portion of the lake, which may lead to difficulty in comparing SBEO altimetry to ground measured WSE.
This study also makes use of the Large-Scale SWOT Simulator (SWOT-LS) developed by CNES (Centre Nationale d’Étude Spatiale) [38] to generate the footprints of SWOT-like data over the PAD as if the SWOT mission had been operational during the 2020 event.

2.3. Data Query

Since one of the goals of the study is to identify how many SBEO observations occurred prior to, during and subsequent to the summer 2020 lake expansion event, search queries were submitted to mission data hubs to find all images that had a complete cover of the PAD (red line on Figure 1) between 1 May and 1 October 2020. This period covers the end of spring snowmelt/ice breakup that experienced notable ice-jam induced flooding, ensuing landscape drainage, and the storage of water within the large central lakes.

2.4. Spatial and Temporal Coverage

The spatial coverage refers to the percentage of the images that covered the PAD, while the temporal coverage refers to the number of images per cycle that passed over the delta. This latter definition of temporal coverage differs from repeat cycle (Table 1), since a mission may cover the same area multiple times per cycle (i.e., each mission orbits the earth hundreds of times per cycle) with various orientations. Some missions also have multiple satellites, constellations, that follow one another (i.e., Sentinel-1 to 3 and RCM) with a few days of separation. It is, thus, possible for a mission to have taken several images with complete spatial coverage and other missions with only partial spatial coverage.
The temporal coverage was analyzed by counting the number of images per cycle found in the data query for each mission. All images are identified by the day in which they passed over the study site during a cycle. For example, an acquisition made on the 4th day of a 12-day cycle is simply called ‘day 4’. Secondly, the spatial coverage was analyzed by calculating the percentage of the PAD area that is within the image swath. Optical images with total cloud cover received a spatial coverage of 0%, but were still counted in the global coverage analysis.
Since altimeter missions (i.e., Sentinel 3 and Jason 3) are not imagers (meaning they do not have a swath coverage), they cannot be spatially analyzed in the same manner as the other SBEO observed data. However, altimeters can repeatedly observe the WSE of specific lakes on the different days of an orbit cycle. All missions were then mapped on a linear timetable and compared over the entire lake expansion event. In the case of the SWOT mission data, no query was made since the satellite was launched in December 2022 and the SWOT-LS provided estimates (Section 2.6).

2.5. Remotely-Sensed Water Surface Area and Water Level

For the retrieval of WSA, only the spatial coverage data that completely mapped the PAD were used to facilitate the comparisons between instruments with similar observation dates. In the case of optical data, the Modified Normalized Difference Water Index (mNDWI, [39]) was first performed to accentuate areas with prevailing surface water. Then, an Otsu thresholding technique [40] was applied to delineate the water bodies. A similar approach was used for SAR data where an Otsu thresholding technique was also used to delineate water bodies after the images’ preprocessing. Total WSAs were then calculated by multiplying the number of water pixels in a given image by the surface area corresponding to a pixel for a given mission. This approach to WSA retrieval was used because of its simplicity, and a visual inspection was carried out to verify the result and make corrections, if needed. Higher accuracy methods [11,18] were considered, but judged to be unnecessary since accuracy was not the purpose of this study. This method was applied to all SAR and optical images (except for the SWOT mission).
Altimetric water levels (i.e., Sentinel 3 and Jason 3) were processed using the Altimetry Time Series (AlTiS) software developed by the Centre de Topographie des Océans et de l’Hydrosphère (CTOH), an observation service labelled by Institut National des Sciences de l’Univers (INSU) based at Laboratoire des Études en Géophysique et Océanography Spatiales (LEGOS) [41]. AlTiS allow the extraction of different parameters from signal processing of different altimetric instruments. In this case, we used the derived orthometric heights referred to the EGM2008 geoid.

2.6. SWOT-LS Simulations

Two SWOT-like datasets were simulated using the version of the CNES Large-Scale Simulator as of May 2022. The simulator generates SWOT-like data using WSA and WSE information from other sources (i.e., hydrometric stations and SBEOs). The output of SWOT-LS comprises different product with the same structure as the ones that will be available once the SWOT mission is operational, such as a pixel cloud (PIXC) and a vectorial lake product (Lake_SP). From PIXC, information on the pixel classification (water, land, etc.), ellipsoid water surface elevation and water surface area are presented in the form of NETCDF, which is a file format that can store multidimensional scientific data. The Lake_SP procures a vectorial lake-shaped open water area product, with WSE and WSA data for each identified lake, divided in three sub-products: ‘obs’, ‘prior’ and ‘unassigned’. These three sub-products offer different classifications of lakes based on the PLD. For instance, if two adjacent lakes are merged due to water expansion, the prior sub-products will still classify them as two separate lakes, while the obs sub-products will classify them as a single lake entity. Unassigned is used when a lakeform is observed but not present in the PLD. For further details on the workings of the SWOT-LS, see Elmer et al. (2020) [38] (https://github.com/CNES/swot-hydrology-toolbox (accessed on 16 September 2022)).
For the first SWOT-LS scenario, data were simulated from 1 May to 1 October to cover the end of the spring breakup and the complete open-water period. The SWOT-LS uses polygon shapefiles which include WSE information to calculate proxy SWOT-like data. Inputs for the simulator were generated with WSA retrieved with Sentinel-1 data in conjunction WSE data from hydrometric stations. The WSA polygon shapefile from Sentinel-1 retrieved WSA include the four main lakes (i.e., Claire, Mamawi, Richardson and Athabasca) and their connecting channels. The observed WSE values from hydrometric stations were attributed to the corresponding lakes, while the WSE of connecting channels were characterized by the average WSE of adjacent lakes. Outputs from the simulator were subjected to the spatial and temporal analysis presented in Section 2.4.
Focusing on the Mamawi Lake region of the PAD, the second SWOT-LS included surrounding perched lakes (Jemis, M12, M14) and connected Otter Lake was completed using WSA from Sentinel-1 data (10 June and 3 August) and temporary in situ WSE data (May to September). SWOT-LS simulated products were then scrutinized to see if there was any discrepancy in the Lake-SP classifications.

3. Results

Extensive inundation occurred in the Athabasca River Delta, around Mamawi Lake and portions of the Peace Delta as a result of spring snowmelt runoff and ice-jamming on several channels starting about 29 April, with flooding relating to breakup complete by 11 May (Figure 2). In response to subsequent high river discharge, water levels in the connected large lake system continued to rise into July and August, further inundating adjacent inland basins, which will be the focus of this study and referred to as the 2020 lake expansion event.

3.1. Hydrological Event

Surface water conditions were observed starting in May and into September 2020 via field-based hydrometric measurements and SBEO methods. Figure 2 shows the 40-year median water levels for the connected Lakes Claire, Mamawi, and Athabasca. In general, there is typically a surface water level slope from Lake Claire (western part) down to Lake Athabasca (eastern part) from May to mid-July, indicative of an eastwardly flow. During this period, the median water level rises slightly for all three lakes, as they free themselves of ice, with water level varying between 208.6 m to 209.8 m. Mid to late July shows very similar water level for all three lakes, which is demonstrative of the connectivity and low relief. For the remaining part of the season (late-July to late September), the surface water-level changes from a linear downward slope to a concave slope where the water level is slightly higher for Lake Claire than for Lake Athabasca and Mamawi Lake.
As shown in Figure 2, the 2020 open-water lake levels start off higher than normal in the early season (0.5 to 1 m above 40-year median). Noteworthy is the rapid rise and fall water level for Mamawi Lake, as measured on an outflow channel, in response to the large influx of water and a small ice-jam at Dog Camp [42] just downstream of the gauge. A continued rise in lake levels is observed into early August, reaching a peak of ~211 m for Mamawi Lake, which is ~1.5 m above median water levels. On several occasions, the changing surface water slopes are indicative of flow direction reversals likely due to wind seiches. Following the summer highs, the three lakes exhibit slowly decreasing water levels in response to an eastward surface water slope in late August and into September. Overall, the 2020 summer lake expansion event is second to the all-time high of ~211.44 m observed on Lake Athabasca in mid-July 1935.

3.2. Satellite Coverage

Table 2 and Figure 3 summarize the numbers of observation days for each satellite instrument, with a total of 350 remotely-sensed observation days gathered over the 153-day study period. Except for Sentinel-2, instruments had more observation days with partial than complete spatial coverage. RCM had the greatest number of observation days (130 out of 153) with 41 days of complete coverage and 89 days of partial coverage. Sentinel-2 had the most days of complete spatial coverage (62 out of 153). Precipitation at the nearby Fort Chipewyan meteorological station revealed that the study area experienced 66 days of measurable rainfall (Figure 3), suggesting that cloud cover may have been an important factor for optical images on these days.
As discussed in Section 2.5, WSA retrieval was carried out only if there was a complete SBEO coverage of the PAD. High cloud cover percentage significantly reduced the number of useable observations for optical instruments. Six images were used for Sentinel-2 and three for Landsat-8. Sentinel-1 had seventeen images out of 20 that were useable, with three images omitted from the analysis due to the presence of ice (5 May) and quality issues (4 July and 27 August). The frequency of complete spatial coverage for RCM varied between modes and were mainly in the 50 and 100 m resolution. A few images at 30 m compactpol mode (CP) were available for 1 June and 23 August. The RCM 100 m imagery was considered too coarse and we thus focused our study on the RCM-50 m data with 15 useable days of observation out of the initial 41.
Simulated SWOT-LS data generated a total of 53 images over the PAD spanning 7 orbits and 7.3 cycles ( Figure 3). SWOT-LS image footprints are presented in two groups with succeeding acquisition days: group A (Figure 4A) is composed of day 1, 2, 3 and 21; while group B (Figure 4B) is composed of day 11, 12 and 13. Note that day 21 was linked to group A since it is the last day of a cycle and is followed by day 1 of the next cycle.
Group A has nearly 100% coverage between day 1 and 2, with day 3 adding additional coverage to the western and day 21 to the eastern parts of the PAD, as well as completing the data between the swaths of day 2. Group B has a complete spatial coverage between days 11 and 13, with both days having above 85% coverage (Figure 4) each because of the space between swaths. While day 12 only adds a small portion of the eastern part of the PAD, it covers the western part of lake Athabasca. As shown by both groups, SWOT-LS is simulated to have complete spatial coverage two times during each cycle; in other words, 3 to 4 days per month.
The coverage extent of the SWOT-LS simulation is based on the PLD, which currently has 862 water bodies with different lake IDs, but only 5 lakes that are named (Lakes Claire, Mamawi, Baril, Richardson and Athabasca). Some of these water bodies are given the same name as nearby water bodies (i.e., Mamawi Lake has 32 water bodies identified with that name). A quick analysis showed that of the 862 lakes, 290 had a WSA of 6 ha or larger. These are explained just as quick reference, but should not be of concern for readers since the PLD will have many updates after launch.
Figure 5 shows the distribution of the Jason-3 and Sentinel-3 altimetry passes over the PAD. Jason-3 had only one pass (pass 95) per cycle that measured Lakes Mamawi and Athabasca for a total of 12 observations or once per cycle for 12 cycles (10 days per cycle). Although it appeared to also cover the southern part of Lake Claire, aquatic and riparian vegetation renders the observation erroneous. Sentinel-3 passed over Lake Claire 5 times during the event or once per cycle for 5 cycles (27 days per cycle). Lake Athabasca had Sentinel-3 observations three times per cycles, on day 3 (pass 54), 11 (pass 168) and 26 (pass 379) of the 27 days repeat cycle. Pass 151 on Lake Claire was ~10 km away from the nearest hydrometric station (station 07KF002); while passes 54 and 168 on Lake Athabasca were nearest to 07MD001 at Fort Chipewyan (~85 km). Pass 379 was readily aligned with station 07MC003 near Crackingstone Point. It should be noted that station 07MC003 is not located within the PAD study area but is important given its data exhibits lower day-to-day variability than the levels measured on the west end of this lake; likely due to the measurement site not being as affected by wind seiche and the large inflow of water from the Athabasca River close to the station.
Table 3 summarizes the number of passes on each of the five lakes for Sentinel-3, Jason-3 and SWOT-LS. Sentienl-3 and Jason-3 only covered the three biggest lakes (Athabasca, Claire and Mamawi), while SWOT-LS shows a complete coverage of all the study lakes and the number of passes is more than double compared to Sentinel-3 and Jason-3. The latter result indicates that the SWOT instrument would have provided considerably more spatio-temporal information over the 2020 event than the other EBOS instruments.

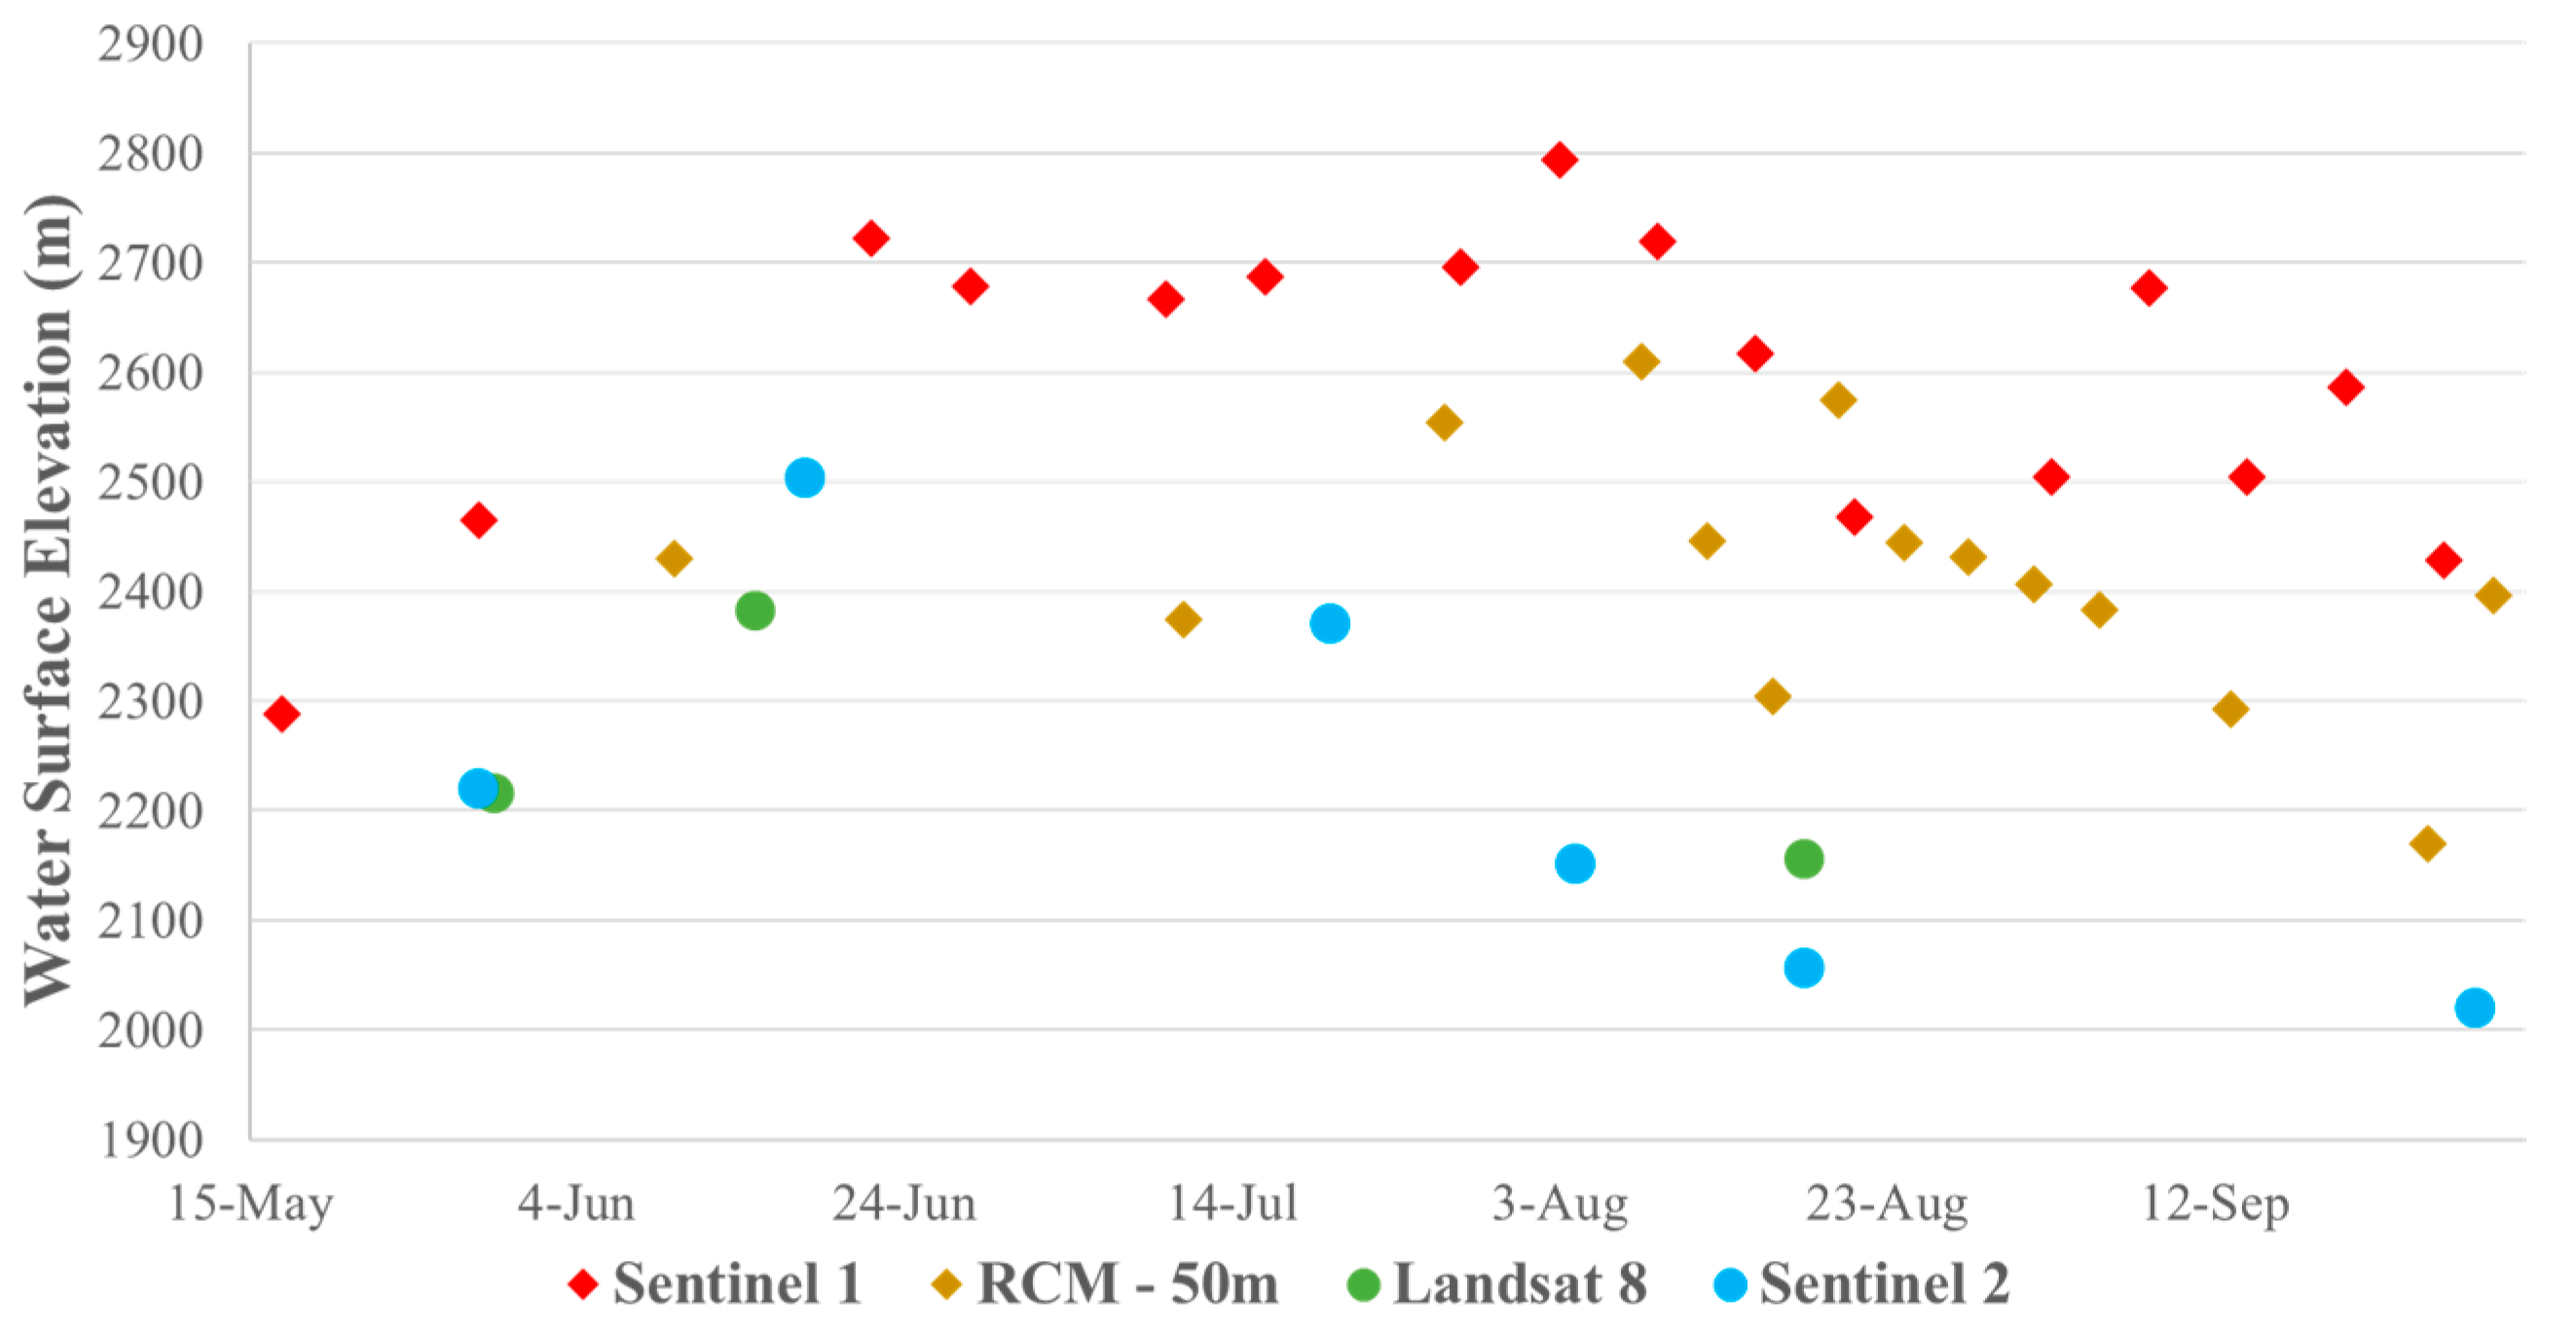
3.3. Water Surface Area
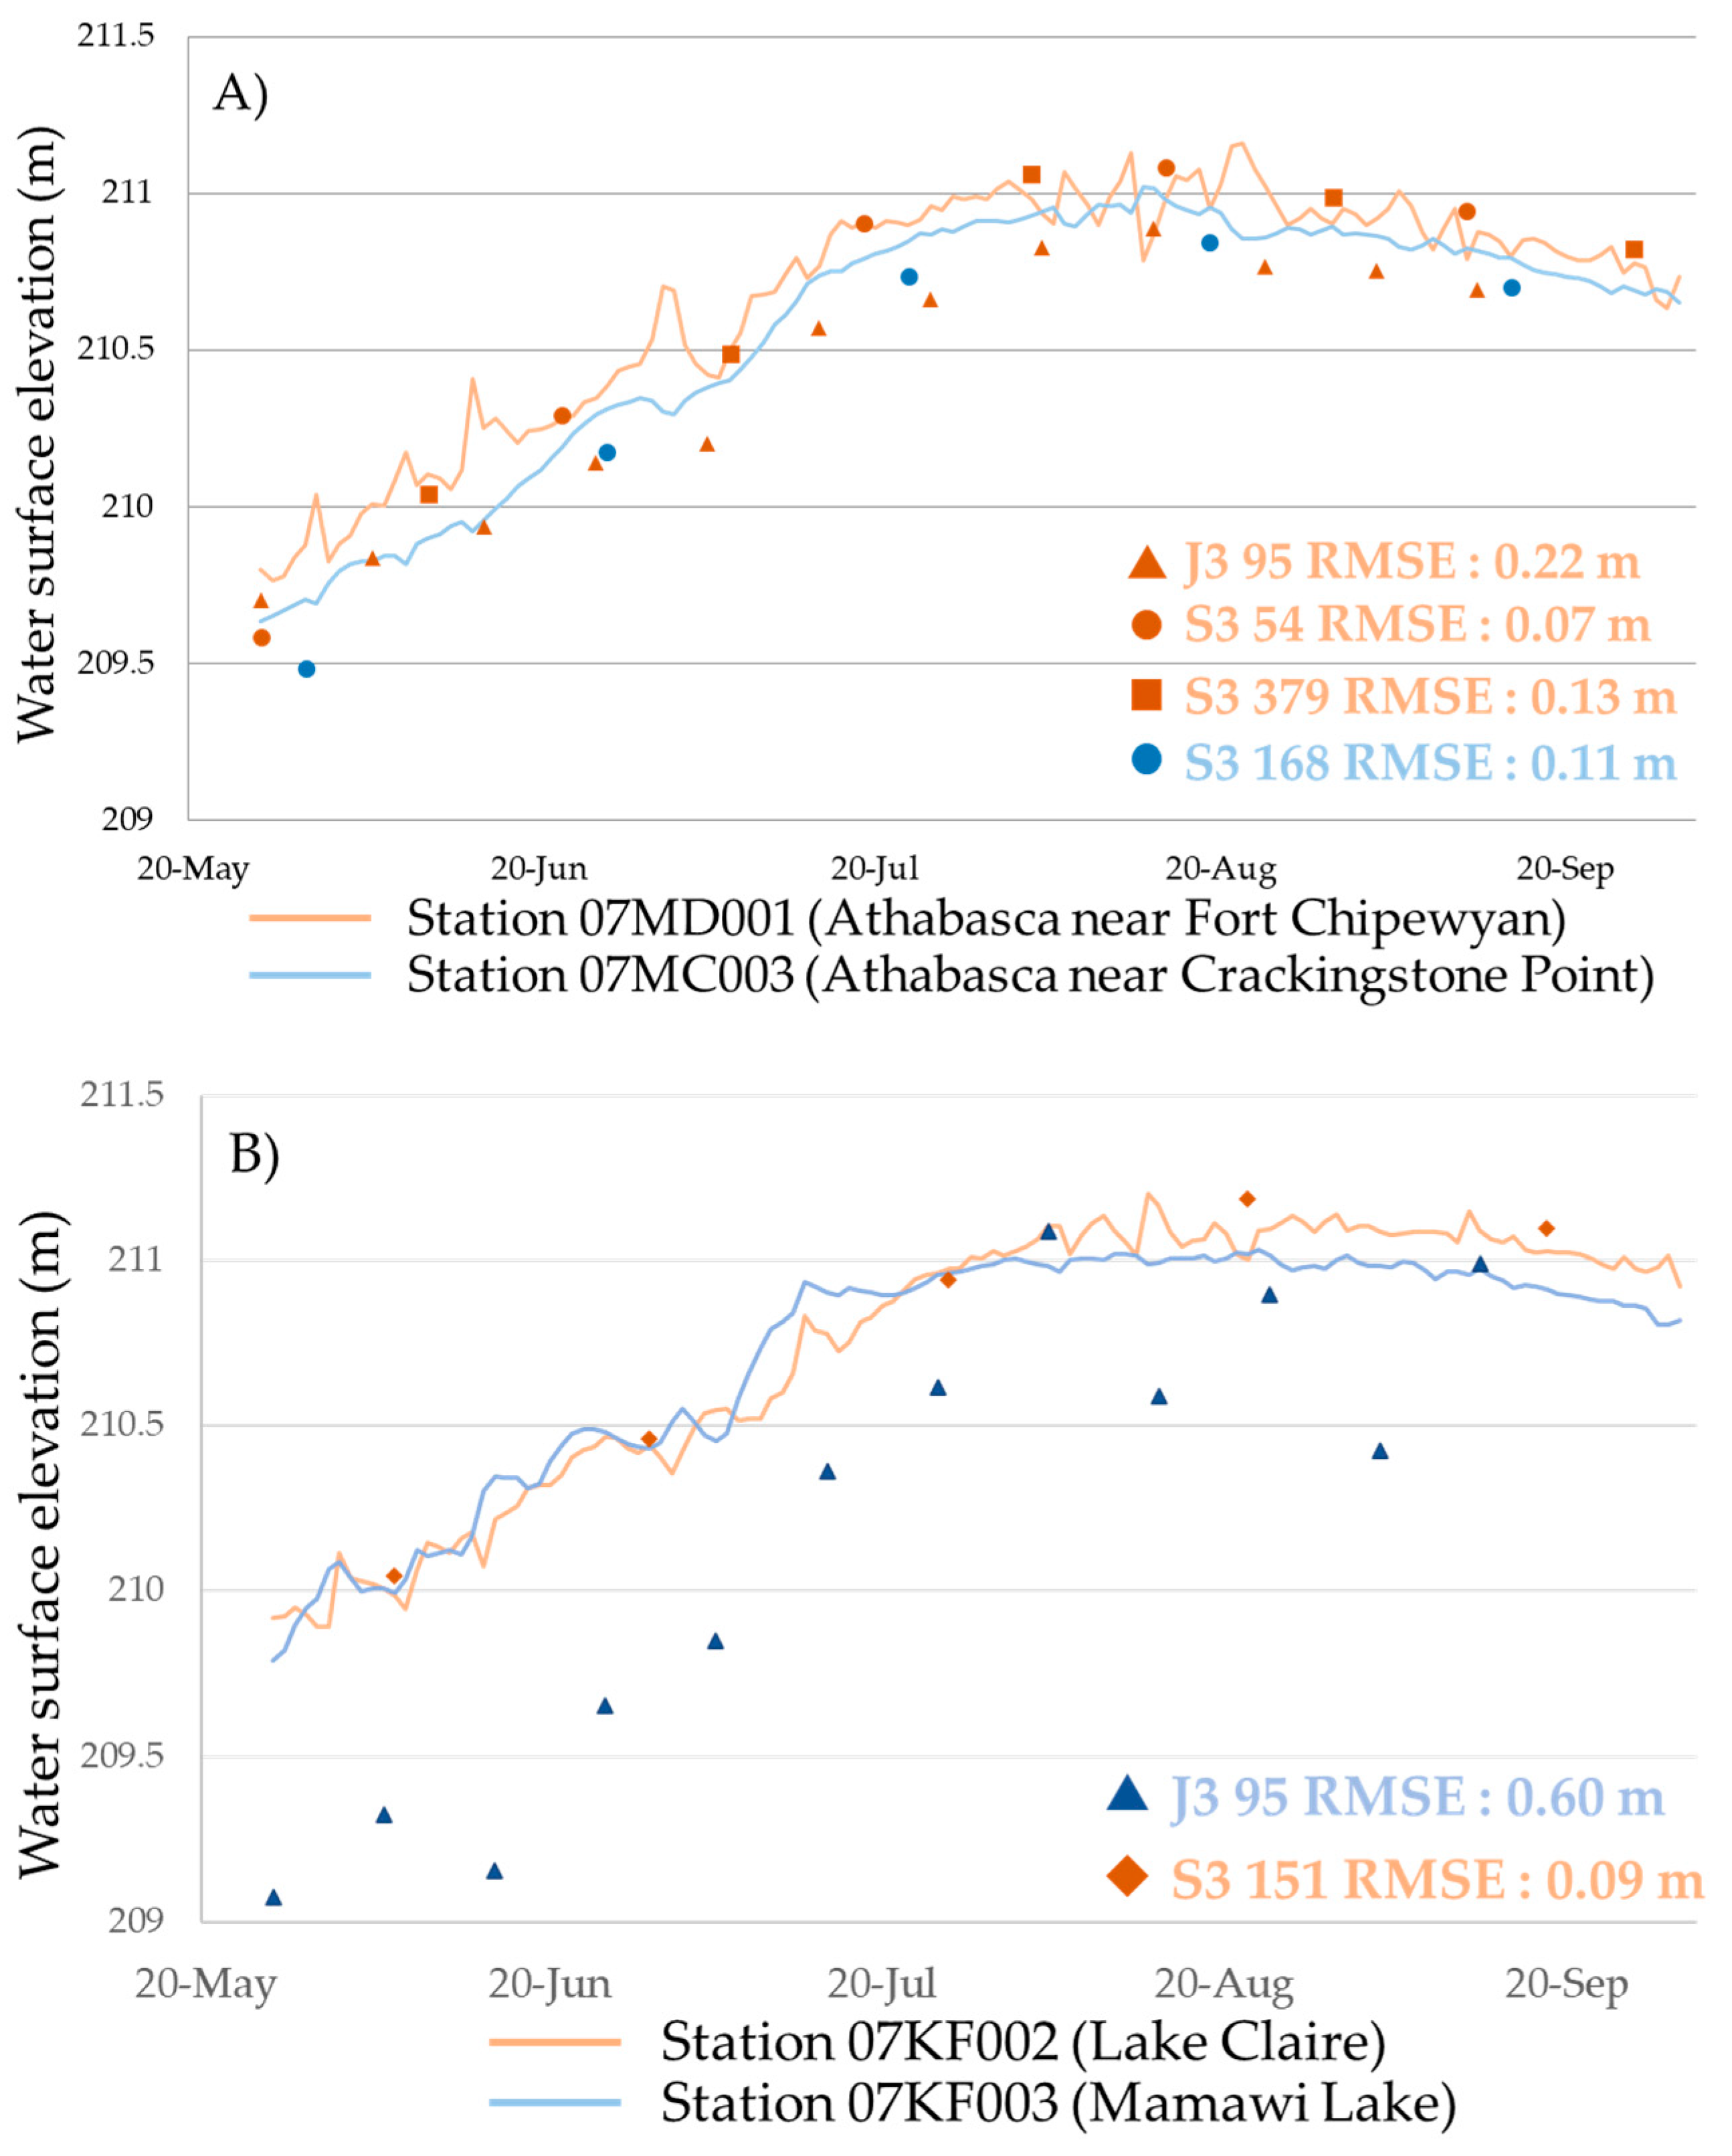
Figure 6 exhibits the WSA evolution throughout the 2020 lake expansion event. SAR observations remain relatively stable over the event, oscillating slightly between each measurement. This result is in line with drainage of ice-jam floodwater in certain areas of the PAD, while the large lakes expanded into previously unflooded areas, leading to fairly stable WSA over the study period. The timing of the SAR WSA peak aligns with subsequent WSE decline of Lakes Claire, Mamawi and Athabasca starting in August. For a given day, areal differences between optical and SAR observations can vary up to 25%. For example, 3 August and 4 August show Sentinel-1 WSA observation of 2793 km2 and Landsat-8 WSA observation of 2150 km2, respectively, for a 23% WSA difference.
Figure 7 shows the WSAs estimated from Sentinel-1, Sentinel-2 and Landsat-8 for June (red) and August (blue) as compared to the WSA of the SWOT PLD (black contours). The WSA reductions of Sentinel-2 and Landsat-8 between June and August are mostly concentrated in areas north of Lake Claire, surrounding Mamawi Lake, and between lakes Richardson and Athabasca. The water also expanded into certain areas of the PAD, such as north of Mamawi Lake and south of Otter Lake (located between Claire and Mamawi). Sentinel-2 image analysis also shows a reduced WSA, but to a lesser amount, and similarly to Sentinel-1 also shows a larger water extension northwest of Mamawi Lake.
Figure 8 shows a close-up of Mamawi Lake and its surroundings. Here, RCM data at 30 m resolution were added since both June and August Swath frame covered this lake. WSAs observed on both June and August are much more apparent in the Sentinel-1 data, while both optical instruments and RCM-30m show a vast reduction in WSA from June to August, while hydrometric stations show increasing water levels for all lakes presented in this study. Furthermore, water expansion appears to be sparse in the northern part of the PAD. Further discussions are presented in Section 4, detailing the differences between each instrument in terms of observed WSA and the impact of vegetation on observations.

3.4. Water Level

Figure 9 shows the water level measured by Jason-3 and Sentinel-3 for lakes Athabasca (Figure 9A), Claire and Mamawi (Figure 9B). When comparing WSE obtained via distant satellites and in situ hydrometric station, Jason-3 has a RMSE of 0.6 m for Mamawi Lake and 0.22 m for Lake Athabasca, and Sentinel-3 a RMSE of 0.09 m for Lake Claire. In the case of Sentinel-3 observations on Lake Athabasca, passes 54 and 168 were compared to water level station 07MD001 near Fort Chipewyan and pass 379 was compared to station 07MC003 near Crackingstone Point. The calculated RMSE for the three passes over Lake Athabasca are 0.11 m (pass 379), 0.07 m (pass 54) and 0.13 m (pass 168). Water levels for small lakes surrounding Mamawi Lake that were temporarily monitored are presented in Figure 10. Jemis Lake follows Mamawi Lake’s water level pattern from May onward, indicating earlier connection, while M14 and M12 merge WSE later during the event.

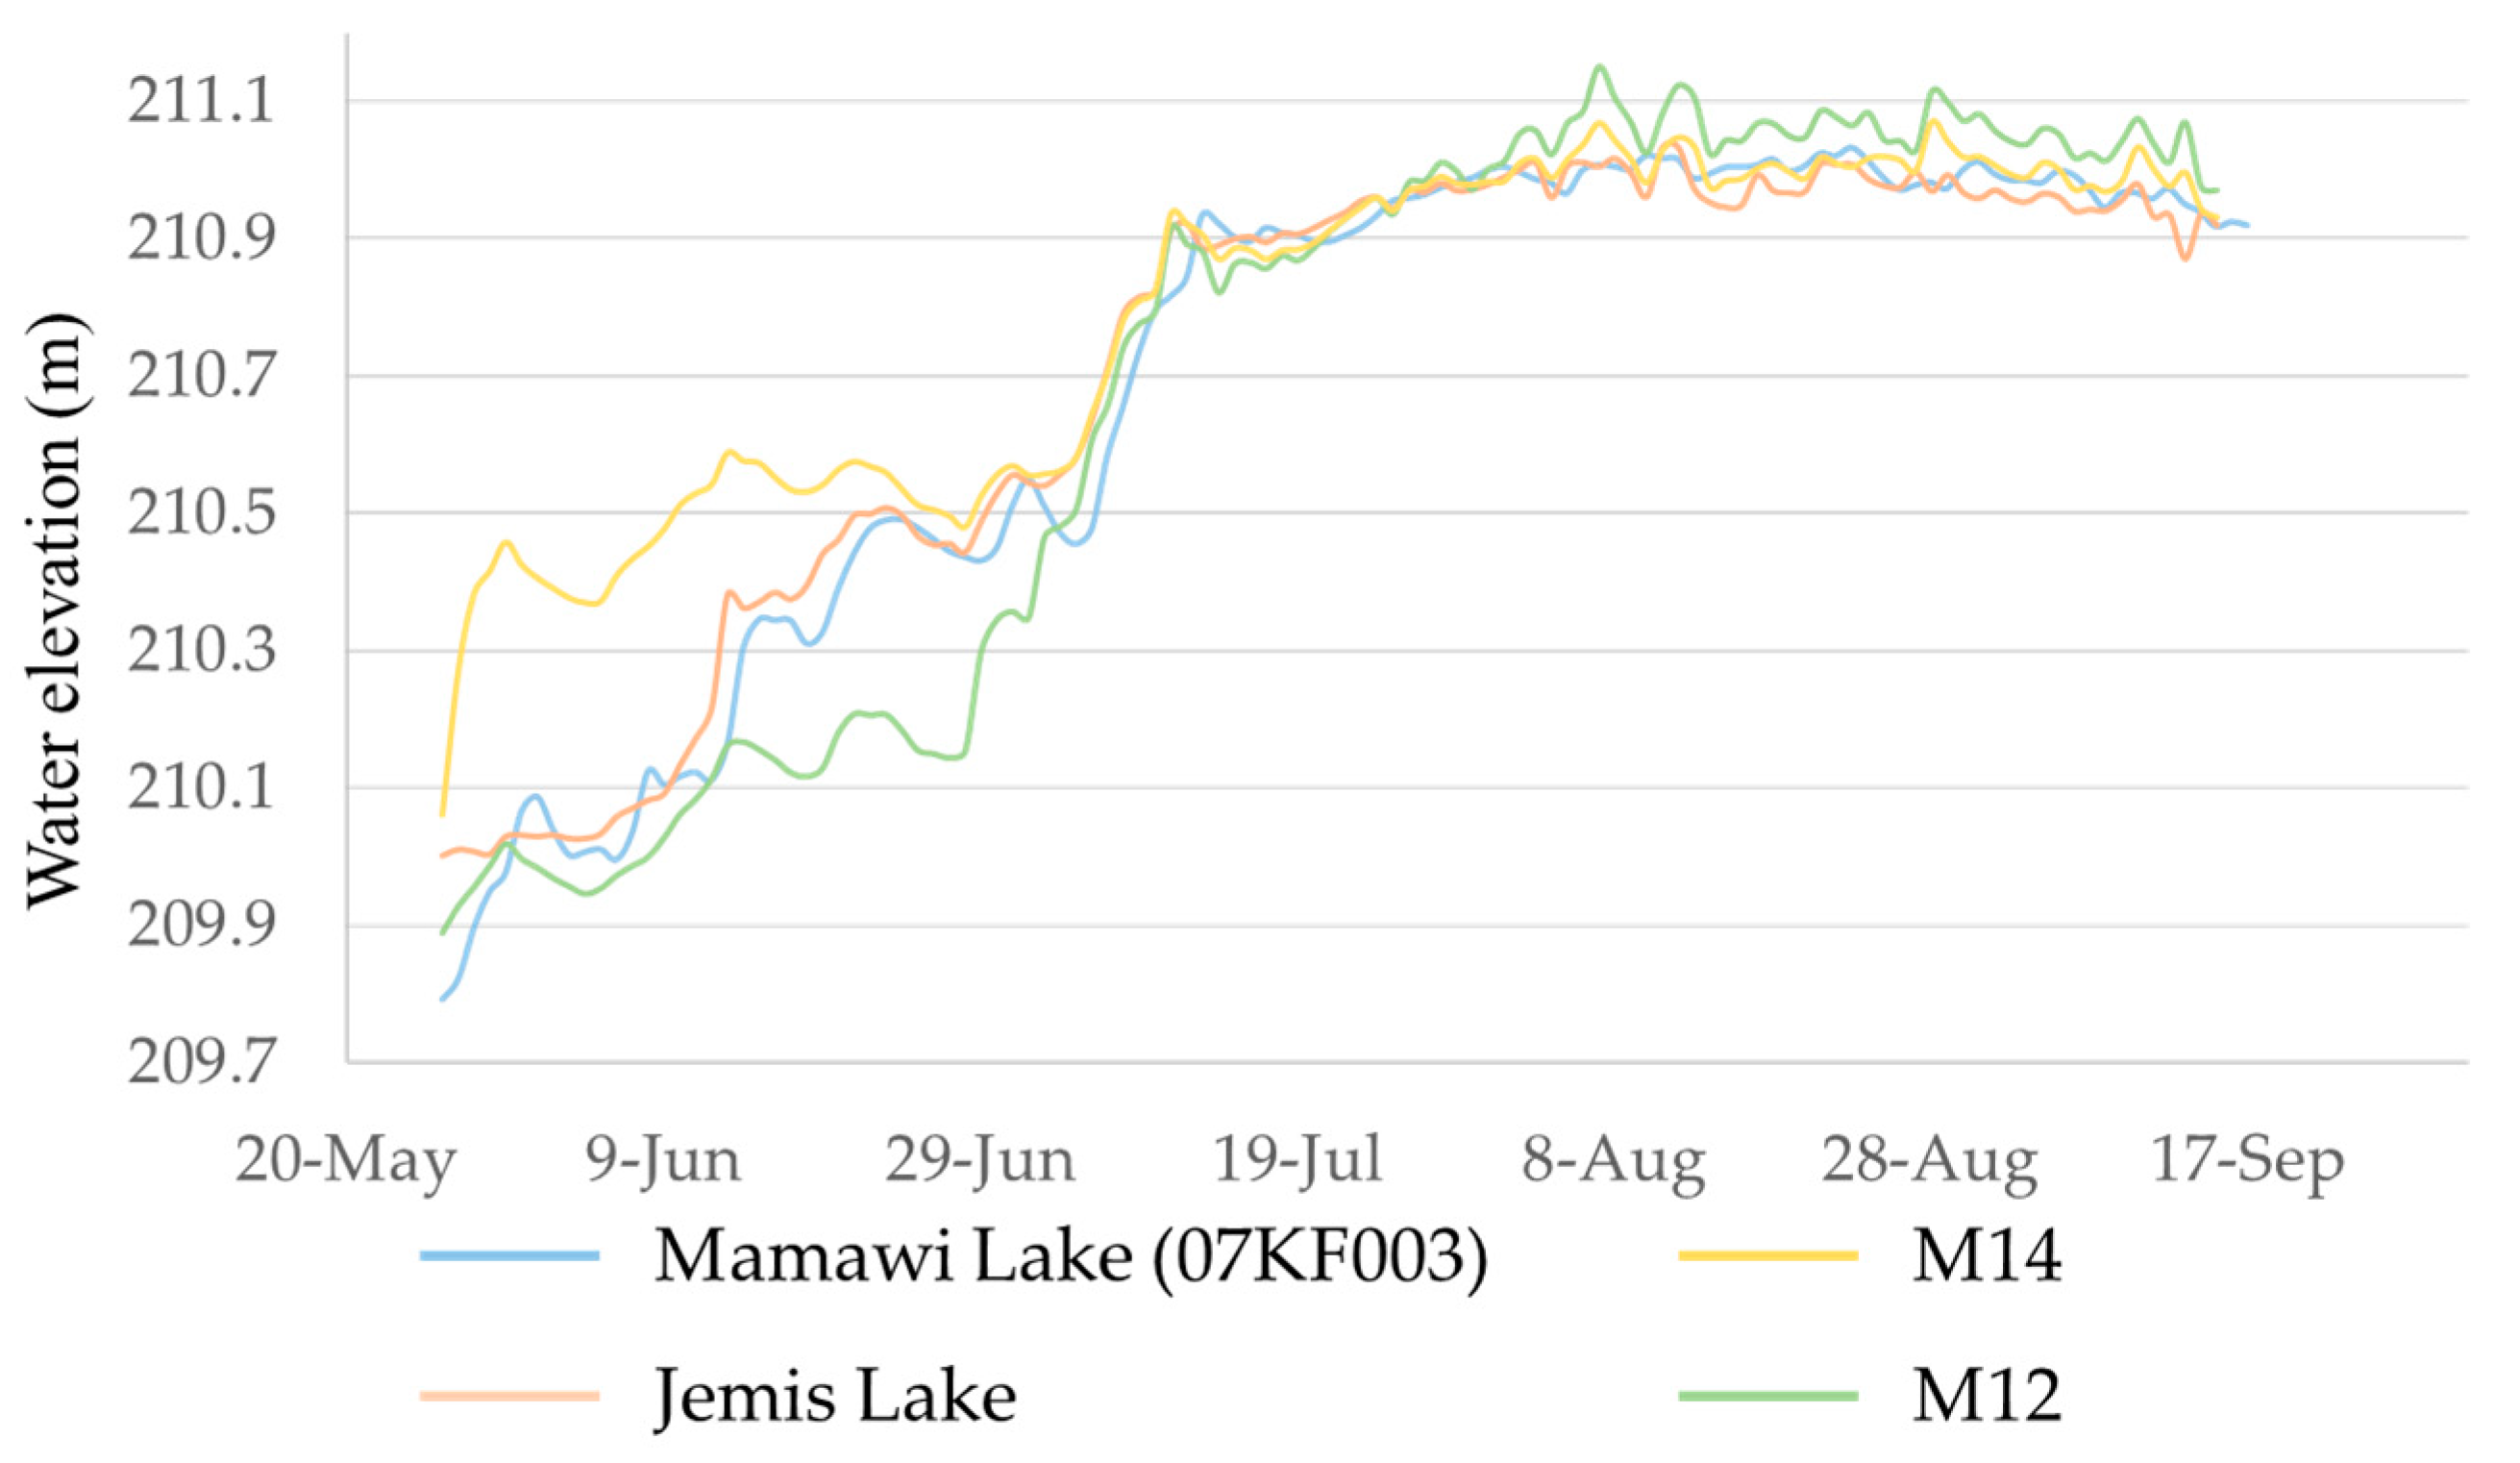
3.5. SWOT-LS Simulations

The SWOT-LS simulation covered a full 21-day cycle for both dates (10 June and 3 August) where five passes (for each date) covered the PAD to various areal proportions (three passes had full coverage). It should be noted that for the optical and SAR observations, small lakes that would not normally be analyzed by the SWOT mission (e.g., less than 250 m × 250 m) are incorporated in the WSA calculations. It is possible that the SWOT mission will have viable measurements of small lakes even if they are not currently in the 2022 version of the PLD. Such lakes could be found in the PIXC and the WSA could be calculated using the total pixel area. As stated in Section 2.6, some lakes could also be found in the ‘unassigned’ LakeSP sub-product.
For the three passes that fully cover the PAD (pass 11, 50 and 356), all lake-form water bodies with a water level that was input in SWOT-LS were observed and given the same lake ID between passes and observation dates. The obs ID of a lake (not shown in results), which is the ID given to any distinctively observed lake from the simulated ‘obs’ product, always varies between passes and dates, and is attributed according to various characteristics of the observation such as the right or left swath.
Table 4 shows a WSE example of database compiled by the SWOT-LS simulated Lake_SP product (prior sub-product). For example, Otter Lake has two Lake IDs, which shows that its WSA covered two distinct lake polygons in the PLD. Other lake forms have different Lake ID but have the same name (ID and name results not shown). Furthermore, a closer inspection of the PLD revealed several smaller inland lakes adjacent to Mamawi Lake were given the same name as Mamawi Lake. In terms of WSA (Figure 11), normally disconnected lakes (Jemis, M12 and M14) show increasing WSA from June to August relative to Mamawi Lake, indicating water inputs that are supported by in-situ observations (Figure 10 and Figure 11). Water surface elevation (Figure 10) has very small variations, with slightly higher than input WSE in the perched lakes (Jemis, M12, M14) and connected Otter Lake.
Figure 11 shows a visual representation of pass 356 of the simulated SWOT-LS lake products (Lake_SP) of Mamawi Lake and surrounding lakes for 10 June and 3 August. Several lakes are similar between these two dates, such as Mamawi Lake (blue), Jemis Lake (purple), Lake M12 (lime) and Lake M14 (orange). Otter Lake (Teal) is only shown on 3 August because the in-situ water logger was lost. To get around this mishap, a commonly used water transfer approach was used to assign Otter Lake a Mamawi Lake level on 3 August when it was certainly connected and essentially part of an expanded Mamawi Lake. Unassigned lakes are shown in pink and occur where a lake is observed but is absent in the PLD. Most of the unassigned lake forms are from rivers.

4. Discussion

4.1. Spatial and Temporal Coverage

The analysis of temporal SBEO coverage revealed that optical instruments had a more frequent revisiting cycle than SAR over the PAD in 2020. However, the recurrent cloud cover rendered optical observations less reliable than SAR. Various techniques for masking cloud have been developed over the years [43], but are ineffective at reconstructing information underneath an opaque cloud. The spatial and temporal coverage of a given event via optical instruments, as happened in 2020, can thus be considerably diminished due to the presence of clouds which, in turn, diminished its full potential in examining the lake expansion event. Less vulnerable instruments to cloud cover obstruction should therefore be included in the study approach, such as SAR.
Sentinel-1 (SAR) had the least number of revisitations over the PAD per cycle of the imager instruments examined. Although half of the observations per cycle were partial coverage, Sentinel-1 had 100% reliability for useable images when acquired. RCM showed by far the most observation days out of all the instruments with close to daily frequency. However, the modes of acquisition were set by the Canadian Space Agency (CSA), leading to many partial observation days in Stripmap mode (5 m spatial resolution with a 30 km swath); it could, thus, be argued that more complete observation days could have been acquired if a mode with a wider swath had been selected for acquisition. For this study, the available medium-resolution mode at 30 m (125 km swath) was the highest resolution RCM that covered the PAD area, but only on two relative orbits (91 and 106).
As for altimetric data, spatially punctual measurement of the big lakes can often result in varying water level between passes. This is particularly the case for the Sentinel-3 data over Lake Athabasca, which is comprised of three observations per cycle (pass 54, 168 and 379). Available altimetric instruments have too infrequent revisitation cycles compared to other SBEO which, combined with their lack of spatial resolution, makes them inadequate to understand water dynamics within wetland floodplains such as the PAD.

4.2. Water Surface Area

The WSA results (Figure 6) show varying outcomes between instruments. Both optical instruments show a decreasing WSA from June to August, which would normally be consistent with ice-jam floodwater drainage from the landscape and into the lakes. However, these results are not in line with central lakes water levels rising 0.75 m to a level higher than the contiguous landscape, which would indicate an expansion of the lakes beyond their normal shoreline. Although both optical and SAR measurements show similar patterns throughout the 2020 event, SAR observations captured an overall higher WSA than optical observations. This was expected, as it is well documented that the presence of vegetation has a more significant detrimental impact on the ability of optical instruments to see surface water than for SAR instruments [11,18]. In line with vegetation growth over the summer months, the WSA differences between optical and SAR increases as the season progresses. Closer examination using the NDVI [44]) for June versus August (Figure 12) clearly shows an increase in vegetation intensity in areas where water was observed in June but not in August. In fact, both instrument types saw reducing WSA as the event progressed even though the large central lake levels increased, although SAR did not see as large a reduction, indicating drainage of the spring flood waters in certain portions of the PAD and expansion in the others over the summer.
The impact of the vegetation on WSA detection is most apparent on and around Mamawi Lake. Figure 7 and Figure 8 compare the water surface of June and August for Sentinel-1 and 2, Landsat-8 and RCM. For optical observations, the WSA in June extends beyond the August limits. In addition, the June WSA of Sentinel-1 connects with the southeastern extension of Mamawi Lake, which is shallow and has emergent and riparian vegetation. The density of vegetation in June was low enough for the SAR signal to penetrate and detect water underneath, but too dense in August to do so (even for SAR). The above is similarly seen in the southwestern part of Mamawi Lake where optical observations show reducing extent over the summer despite the water level rising nearly 50 cm, with the Sentinel-1 not showing such a decrease in WSA, which is indicative of emergent/riparian vegetation.
There are also notable differences between instruments of the same type in terms of observed WSA. An average of 165 km2 (~6%) difference is observable between the SAR instruments with Sentinel-1 seeing a larger water area. The steeper incidence angle of RCM would normally be better at penetrating the vegetation [33] and in a few instances RCM observed water underneath vegetation in August that had disappeared on the Sentinel-1 images. However, the RCM-50m data available for this study was 2.5 times coarser than Sentinel-1, likely enabling the latter to detect smaller small water bodies than RCM since the backscattering signal is mixing water and vegetation.
When comparing the RCM-30m to Sentinel-1, the former also detects a smaller WSA than the latter. Overall RCM-30m WSA for 1 June is 2358.2 km2 compared to 2465.5 km2 for Sentinel-1 on 29 May. Although RCM-30m does not cover the full extent of the PAD for August (23rd), comparison with Sentinel-1 and RCM-50m can still be made with lakes Claire, Mamawi and Baril. As shown in Table 5, RCM-30m has a lower WSA than both Sentinel-1 and RCM-50m for all three lakes. This could be a characteristic of the compact polarimetry mode (CP) of RCM-30m. Further investigation would be needed in order to understand if CP has a reduced vegetation penetration or if a different preprocessing of the images is needed. It is important to note that RCM’s default mode was at 30m resolution CP, but was not constantly available for this study’s time frame.
For the optical observations, the overall difference in WSA was less than 5%. Slight variations could have occurred because of the differences in spatial resolution (Landsat-8 at 30 m vs. Sentinel-2 at 10 m). The difference in spectral bands is relatively minor, but could account for minor differences. Although, optical instruments have more difficulty observing water underneath vegetation, their diversity of spectral bands enables them to produce biochemical and biophysical analysis of the said vegetation, which can be a great asset when characterizing wetlands [45].

4.3. Water Level

Having a complete spatio-temporal water level coverage over the PAD is challenging with available techniques (i.e., hydrometric station or altimetric data) as there are simply too many water bodies to realistically monitor in such a remote environment. Altimetric data coverage presented on Figure 5 show coverage over some of the major lakes (i.e., Mamawi, Claire and Athabasca) but omit nearly all the smaller lakes. The latter are inland lakes within the delta floodplains that are not normally connected to the main flow system, meaning that their relative WSE fluctuation is also missed by the hydrometric monitoring network unless temporary gauges are installed. Jason-3 showed notable water level errors compared to ground-based stations for both Mamawi Lake and Lake Athabasca. Given that Jason-3 passes of a short distance from shorelines, as shown in Figure 5, it is possible that the measurements were affected by vegetation. It should be mentioned that InSAR techniques were not attempted in the present study, but have shown to have reliable precision for monitoring relative water fluctuation in the PAD [19].
As for the small lakes surrounding Mamawi Lake, when their water-level matches this central water body, it is understood from past studies (e.g., [6,46]) that water from Mamawi Lake has traversed the vegetated shoreline levees and connected to inland lakes. It is unclear if the ice-jam flood in early May had recharged Jemis, Otter, M12 and M14 since the water loggers were deployed after this event. It is also unclear if Jemis Lake was already connected when the data began (28 May) as the water levels are very similar. However, both M12 and M14 water levels show that they connected during the summer lake expansion event and responded similarly to Mamawi Lake after June and into September.

4.4. SWOT Mission Plus Value

The SWOT-LS simulation results reveal that this soon-to-be operational SBEO platform would have had complete spatial coverage over the PAD three times in its 21-day cycle (days 2, 11 and 13). Many extreme flood events have a tendency to occur over a longer period [34], thus, creating particular water flow dynamics that would not normally be observed under hydrological mean states. The SWOT-LS simulation is based on an arbitrary start date and the temporal relation between other satellites and SWOT-LS should not be taken into consideration.
SWOT-LS simulations over Mamawi Lake and its surroundings floodplain show that some misclassification could sometimes occur in the SWOT-LS lake product if the WSA observation extends beyond the PLD. The various passes have different incidence angles (closer or farther from the nadir) and different look angles (right or left looking from nadir), as well as travelling direction (ascending or descending). These characteristics affect the way each pass observes the same lake throughout a cycle and explains why the Lake_SP product shows variability (although small) between WSA. It also explains why some passes (notably pass 356) shows additional lakes (with lake ID) that are not present in the other passes (notably 11 and 50). As can be seen in Figure 11, some lakes had the same name as another nearby lake but are classified with different lake ID. Other lakes were given a lake ID but not associated with a lake name. This is because the current PLD PAD is not finalized and is missing several lakes and names. Further updates to the PLD are expected after the launch of the SWOT mission. Depending on the user’s need, the PIXC product could also be used to calculate WSA and WSE. This would require some data manipulation on the part of the user, such as adding the WSA of all pixels within the studied lakes, but could be an alternative when the Lake_SP product show signs of errors.
Discrete WSE provided by current SBEO altimetry are insufficient to capture temporal and spatial details of a flood event in complex deltaic environments. Daily water levels are available at monitoring sites that form the National Hydrometric Network, but these are sparsely distributed on the connected waterways of the PAD and not on inland lakes except for focused studies. However, the broad spatial components of the SWOT mission will measure WSE and WSA throughout the PAD, which will enable a higher resolution assessment of water storage change and water movement. In situ water level monitoring is essential as ground references and the addition of the SWOT mission would have provided a dramatically enhanced spatial approach towards understanding the flow dynamics of 2020, such as inland expansion of the large lakes that occurred subsequent to the spring ice-jam flood event.
The Mamawi Lake simulation showed that connectivity between lakes can be observed in terms of water level even though they appear as different entities on the Lake_SP product due to the separation of these entities by thick vegetation. This situation could pose some problems for the SWOT mission’s water volume algorithm. There is currently no established error threshold for the water volume algorithm, which precludes the possibility of flagging sites with high errors. Analysis of WSA between optical and SAR data demonstrated how vegetation can have an impact on the observation of water within vegetated areas that are seasonally flooded. Higher frequency SAR has been shown to penetrate the vegetation less than lower frequency SAR [47], which could prove problematic for the SWOT mission since the mission will feature Ka-band instruments. Fayne et al. [48] characterized the Ka-band signal from the AirSWOT mission and revealed that water is up to five times more distinct than dry land, but can potentially be misclassified as littoral or wet soil. Desrochers et al. [29] showed that emergent riparian vegetation could potentially cause classification errors in the SWOT mission level 2 products, such as in the uncertainty of discriminating between land and emergent riparian vegetation in wet conditions. These authors noted [29] that an amended PLD with SAR data in specific problematic regions could be applied to remove such processing errors. The RCM mission, if tasked at the optimal resolution and mode may be able to help further understand and address these errors.

5. Conclusions

This study focused on a lake expansion flood event that occurred in the Peace–Athabasca Delta during the summer of 2020. This event provided a unique opportunity to test a flood hydrology application of several SBEO satellites, such as Sentinel-1, Sentinel-2, Sentinel-3, Jason 3, RADARSAT Constellation Mission, and simulated data of the recently launched (December 2022) SWOT mission to see how they have, or would have, witnessed this extreme event. Although beyond the scope of this study, a three-month fast sampling calibration orbit period will soon be undertaken to evaluate the actual precision of the SWOT mission, which will include Lake Athabasca and the PAD in its orbit [27].
Sentinel-2 and Landsat-8 showed a promising number of revisiting passes, but most of them were not useable owing to cloud cover. Vegetation was also shown to be an important obstacle of both optical and SAR instruments in observing water, although SAR instruments do have a better penetration to see the water surface. Altimetric instruments were shown to be relatively accurate but are extremely limited in their usefulness due to being spatially discrete and having extended revisiting cycle; in other words, poor spatiotemporal scale necessary to examine complex deltaic ecosystems. For instance, as water levels rose within this low relief floodplain, lakes and channels began to connect into normally drier, vegetated upland areas. However, the connections were not always seen by SBEO instruments. SWOT-LS simulations were shown to address this observation gap and provide the ability to increase our ability to detect the connections between lakes via spatially distributed WSE and WSA measurements.
The SWOT mission is anticipated to significantly improve how flood events are monitored, especially in remote and complex environments such as the PAD. Addressing the goal of our study, SWOT-LS simulations of the PAD revealed that complete spatial coverage would have occurred three to four times a month with several partial coverages in between, providing spatially distributed WSEs at a spatio-temporal scale never seen before by field-based hydrologists. SWOT-LS simulation focused on Mamawi Lake and its surroundings deltaic floodplain showed that lakes with initial water level inputs were correctly identified in the Lake_SP product and given the same lake ID. The 2020 lake expansion event happened over a 5-month period and the SWOT mission would have had ample revisitation opportunities to detect the rise and fall of WSE. Importantly, understanding the temporal resolution of the SWOT mission will help with the planning of future field-based studies, such as surface water connectivity, muskrat and vegetation surveys.
Our study highlighted potential issues that may influence how SWOT-like data are used. A slight variability in WSA was observed between passes which can be attributed to variability of certain parameters such as the incidence angle, right or left looking and ascending or descending. However, some passes showed lakes that were not present in other passes for the same date, which could be troublesome when comparing intra- and inter-annual WSE at specific sites. There is also a concern regarding the SWOT mission’s ability to see lake connectivity in deltaic environments. Different instruments do not necessarily see the same overland surface water linkages between lakes. The current SWOT mission PLD is based on optical Landsat images, leading to some lakes shown as separate water bodies while in reality they are one, and vice versa. Care should be given towards updating versions of the PLD over the mission lifespan. Future SAR missions, such as NiSAR, could prove to be extremely useful for low gradient deltas since their lower frequency (L-band) would have a better penetration of the vegetation than C-band SAR (i.e., RCM, Sentinel-1). Nevertheless, continued field validation of the SWOT mission products, especially in complex, low elevation floodplain environments is encouraged to address these potential issues.

Author Contributions

Conceptualization, N.M.D., D.L.P., M.T. and R.L.; methodology, N.M.D., D.L.P. and M.T.; formal analysis, N.M.D., G.S. and E.C.C.; writing—original draft preparation N.M.D.; writing—review and editing, D.L.P., G.S., M.T. and R.L.; supervision, D.L.P. and M.T.; project administration, D.L.P.; funding acquisition, D.L.P., M.T. and R.L. All authors have read and agreed to the published version of the manuscript.

Funding

This work was supported in part by the Canadian Space Agency under Grant 14USWOTSH and Canadian Space Agency SWOT funding to Environment and Climate Change Canada (DL Peters).

Data Availability Statement

All Sentinel 1 and Sentinel 2 data are available online at https://scihub.copernicus.eu/ (accessed on 12 September 2021). All Landsat 8 data are available at https://earthexplorer.usgs.gov/ (accessed on 21 September 2021). Some RCM data are available at https://www.eodms-sgdot.nrcan-rncan.gc.ca/ (accessed on 9 December 2021). Limited access is given to full RCM data. Hydrometric data are available at https://wateroffice.ec.gc.ca/search/historical_e.html (accessed on 17 April 2021).

Acknowledgments

In situ water-level data were measured by ECCC as part of the National Hydrometric Network and Parks Canada provided data from temporary gauges installed on small deltaic lakes/wetlands. RCM data were available thanks to special permission for the Canadian Space Agency.

Conflicts of Interest

The authors declare no conflict of interest. The funders had no role in the design of the study; in the collection, analyses, or interpretation of data; in the writing of the manuscript, or in the decision to publish the results.

References

  1. Davidson, N.C.; van Dam, A.A.; Finlayson, C.M.; McInnes, R.J. Worth of Wetlands: Revised Global Monetary Values of Coastal and Inland Wetland Ecosystem Services. Mar. Freshw. Res. 2019, 70, 1189–1194. [Google Scholar] [CrossRef]
  2. Giosan, L.; Syvitski, J.; Constantinescu, S.; Day, J. Climate Change: Protect the World’s Deltas. Nature 2014, 516, 31–33. [Google Scholar] [CrossRef] [PubMed] [Green Version]
  3. Masselink, G.; Gehrels, R. Coastal Environments and Global Change; John Wiley & Sons: Hoboken, NJ, USA, 2014. [Google Scholar]
  4. Timoney, K.P. The Peace-Athabasca Delta: Portrait of a Dynamic Ecosystem; University of Alberta: Edmonton, Alberta, Canada, 2013. [Google Scholar]
  5. Prowse, T.D.; Conly, F.M. A Review of Hydroecological Results of the Northern River Basins Study, Canada. Part 2. Peace–Athabasca Delta. River Res. Appl. 2002, 18, 447–460. [Google Scholar] [CrossRef]
  6. Peters, D.L.; Prowse, T.D.; Pietroniro, A.; Leconte, R. Flood Hydrology of the Peace-Athabasca Delta, Northern Canada. Hydrol. Process. 2006, 20, 4073–4096. [Google Scholar] [CrossRef]
  7. Wolfe, B.B.; Karst-Riddoch, T.L.; Vardy, S.R.; Falcone, M.D.; Hall, R.I.; Edwards, T.W.D. Impacts of Climate and River Flooding on the Hydro-Ecology of a Floodplain Basin, Peace-Athabasca Delta, Canada since A.D. 1700. Quat. Res. 2005, 64, 147–162. [Google Scholar] [CrossRef]
  8. Chawla, I.; Karthikeyan, L.; Mishra, A.K. A Review of Remote Sensing Applications for Water Security: Quantity, Quality, and Extremes. J. Hydrol. 2020, 585, 124826. [Google Scholar] [CrossRef]
  9. Chasmer, L.; Mahoney, C.; Millard, K.; Nelson, K.; Peters, D.; Merchant, M.; Hopkinson, C.; Brisco, B.; Niemann, O.; Montgomery, J. Remote Sensing of Boreal Wetlands 2: Methods for Evaluating Boreal Wetland Ecosystem State and Drivers of Change. Remote Sens. 2020, 12, 1321. [Google Scholar] [CrossRef] [Green Version]
  10. Adam, E.; Mutanga, O.; Rugege, D. Multispectral and Hyperspectral Remote Sensing for Identification and Mapping of Wetland Vegetation: A Review. Wetl. Ecol. Manag. 2010, 18, 281–296. [Google Scholar] [CrossRef]
  11. Huang, C.; Chen, Y.; Zhang, S.; Wu, J. Detecting, Extracting, and Monitoring Surface Water From Space Using Optical Sensors: A Review. Rev. Geophys. 2018, 56, 333–360. [Google Scholar] [CrossRef]
  12. McFEETERS, S.K. The Use of the Normalized Difference Water Index (NDWI) in the Delineation of Open Water Features. Int. J. Remote Sens. 1996, 17, 1425–1432. [Google Scholar] [CrossRef]
  13. Bevington, A.; Gleason, H.; Giroux-Bougard, X.; de Jong, J.T. A Review of Free Optical Satellite Imagery for Watershed-Scale Landscape Analysis. Conflu. J. Watershed Sci. Manag. 2018, 2. [Google Scholar] [CrossRef]
  14. White, L.; Brisco, B.; Dabboor, M.; Schmitt, A.; Pratt, A. A Collection of SAR Methodologies for Monitoring Wetlands. Remote Sens. 2015, 7, 7615–7645. [Google Scholar] [CrossRef] [Green Version]
  15. Adeli, S.; Salehi, B.; Mahdianpari, M.; Quackenbush, L.J.; Brisco, B.; Tamiminia, H.; Shaw, S. Wetland Monitoring Using SAR Data: A Meta-Analysis and Comprehensive Review. Remote Sens. 2020, 12, 2190. [Google Scholar] [CrossRef]
  16. Kornelsen, K.C.; Coulibaly, P. Advances in Soil Moisture Retrieval from Synthetic Aperture Radar and Hydrological Applications. J. Hydrol. 2013, 476, 460–489. [Google Scholar] [CrossRef]
  17. Musa, Z.N.; Popescu, I.; Mynett, A. A Review of Applications of Satellite SAR, Optical, Altimetry and DEM Data for Surface Water Modelling, Mapping and Parameter Estimation. Hydrol. Earth Syst. Sci. 2015, 19, 3755–3769. [Google Scholar] [CrossRef] [Green Version]
  18. Landuyt, L.; Van Wesemael, A.; Schumann, G.J.-P.; Hostache, R.; Verhoest, N.E.C.; Van Coillie, F.M.B. Flood Mapping Based on Synthetic Aperture Radar: An Assessment of Established Approaches. IEEE Trans. Geosci. Remote Sens. 2018, 57, 722–739. [Google Scholar] [CrossRef]
  19. Siles, G.; Trudel, M.; Peters, D.L.; Leconte, R. Hydrological Monitoring of High-Latitude Shallow Water Bodies from High-Resolution Space-Borne D-InSAR. Remote Sens. Environ. 2020, 236, 111444. [Google Scholar] [CrossRef]
  20. Matgen, P.; Schumann, G.; Henry, J.-B.; Hoffmann, L.; Pfister, L. Integration of SAR-Derived River Inundation Areas, High-Precision Topographic Data and a River Flow Model toward near Real-Time Flood Management. Int. J. Appl. Earth Obs. Geoinf. 2007, 9, 247–263. [Google Scholar] [CrossRef]
  21. Hostache, R.; Matgen, P.; Schumann, G.; Puech, C.; Hoffmann, L.; Pfister, L. Water Level Estimation and Reduction of Hydraulic Model Calibration Uncertainties Using Satellite SAR Images of Floods. IEEE Trans. Geosci. Remote Sens. 2009, 47, 431–441. [Google Scholar] [CrossRef]
  22. Birkett, C.M. Radar Altimetry: A New Concept in Monitoring Lake Level Changes. Eos Trans. Am. Geophys. Union 1994, 75, 273–275. [Google Scholar] [CrossRef]
  23. Eldardiry, H.; Hossain, F.; Srinivasan, M.; Tsontos, V. Success Stories of Satellite Radar Altimeter Applications. Bull. Am. Meteorol. Soc. 2021, 103. [Google Scholar] [CrossRef]
  24. Mohammadimanesh, F.; Salehi, B.; Mahdianpari, M.; Brisco, B.; Motagh, M. Wetland Water Level Monitoring Using Interferometric Synthetic Aperture Radar (InSAR): A Review. Can. J. Remote Sens. 2018, 44, 247–262. [Google Scholar] [CrossRef]
  25. Biancamaria, S.; Lettenmaier, D.P.; Pavelsky, T.M. The SWOT Mission and Its Capabilities for Land Hydrology. In Remote Sensing and Water Resources; Springer: Berlin/Heidelberg, Germany, 2016; pp. 117–147. [Google Scholar]
  26. Thompson*, A.A. Overview of the RADARSAT Constellation Mission. Can. J. Remote Sens. 2015, 41, 401–407. [Google Scholar] [CrossRef]
  27. Pietroniro, A.; Peters, D.L.; Yang, D.; Fiset, J.-M.; Saint-Jean, R.; Fortin, V.; Leconte, R.; Bergeron, J.; Siles, G.L.; Trudel, M.; et al. Canada’s Contributions to the SWOT Mission—Terrestrial Hydrology(SWOT-C TH). Can. J. Remote Sens. 2019, 45, 116–138. [Google Scholar] [CrossRef]
  28. Sheng, Y.; Song, C.; Lettenmaier, D.P.; Ke, L. Where and in What Quantity Are Lakes Observable by SWOT? In AGU Fall Meeting Abstracts; American Geophysical Union: Washington, DC, USA, 2016. [Google Scholar]
  29. Desrochers, N.M.; Trudel, M.; Biancamaria, S.; Siles, G.; Desroches, D.; Carbonne, D.; Leconte, R. Effects of Aquatic and Emergent Riparian Vegetation on SWOT Mission Capability in Detecting Surface Water Extent. IEEE J. Sel. Top. Appl. Earth Obs. Remote Sens. 2021, 14, 12467–12478. [Google Scholar] [CrossRef]
  30. Domeneghetti, A.; Schumann, G.-P.; Frasson, R.P.M.; Wei, R.; Pavelsky, T.M.; Castellarin, A.; Brath, A.; Durand, M.T. Characterizing Water Surface Elevation under Different Flow Conditions for the Upcoming SWOT Mission. J. Hydrol. 2018, 561, 848–861. [Google Scholar] [CrossRef]
  31. Grippa, M.; Rouzies, C.; Biancamaria, S.; Blumstein, D.; Cretaux, J.; Gal, L.; Robert, E.; Gosset, M.; Kergoat, L. Potential of SWOT for Monitoring Water Volumes in Sahelian Ponds and Lakes. IEEE J. Sel. Top. Appl. Earth Obs. Remote Sens. 2019, 12, 2541–2549. [Google Scholar] [CrossRef]
  32. Elmer, N.J.; Hain, C.; Hossain, F.; Desroches, D.; Pottier, C. Generating Proxy SWOT Water Surface Elevations Using WRF-Hydro and the CNES SWOT Hydrology Simulator. Water Resour. Res. 2020, 56, e2020WR027464. [Google Scholar] [CrossRef]
  33. Nair, A.S.; Verma, K.; Karmakar, S.; Ghosh, S.; Indu, J. Exploring the Potential of SWOT Mission for Reservoir Monitoring in Mahanadi Basin. Adv. Space Res. 2022, 69, 1481–1493. [Google Scholar] [CrossRef]
  34. Frasson, R.P.D.M.; Schumann, G.J.-P.; Kettner, A.J.; Brakenridge, G.R.; Krajewski, W.F. Will the Surface Water and Ocean Topography (SWOT) Satellite Mission Observe Floods? Geophys. Res. Lett. 2019, 46, 10435–10445. [Google Scholar] [CrossRef] [Green Version]
  35. Parks Canada. Wood Buffalo National Park World Heritage Site Action Plan; Parks Canada: Gatineau, QC, Canada, 2019.
  36. Peters, D.L.; Watt, D.; Devito, K.; Monk, W.A.; Shrestha, R.R.; Baird, D.J. Changes in Geographical Runoff Generation in Regions Affected by Climate and Resource Development: A Case Study of the Athabasca River. J. Hydrol. Reg. Stud. 2022, 39, 100981. [Google Scholar] [CrossRef]
  37. ECCC Environment And Climage Change Canada HYDAT Water Survey Data Product 2022. Available online: https://wateroffice.ec.gc.ca/ (accessed on 17 April 2021).
  38. Elmer, N.J. CNES Large Scale SWOT Simulator: User’s Tutorial for Terrestrial Surface Water Applications. 2020. Available online: https://github.com/CNES/swot-hydrology-toolbox (accessed on 16 September 2022).
  39. Xu, H. Modification of Normalised Difference Water Index (NDWI) to Enhance Open Water Features in Remotely Sensed Imagery. Int. J. Remote Sens. 2006, 27, 3025–3033. [Google Scholar] [CrossRef]
  40. Otsu, N. A Threshold Selection Method from Gray-Level Histograms. IEEE Trans. Syst. Man Cybern. 1979, 9, 62–66. [Google Scholar] [CrossRef] [Green Version]
  41. Frappart, F.; Blarel, F.; Fayad, I.; Bergé-Nguyen, M.; Crétaux, J.-F.; Shu, S.; Schregenberger, J.; Baghdadi, N. Evaluation of the Performances of Radar and Lidar Altimetry Missions for Water Level Retrievals in Mountainous Environment: The Case of the Swiss Lakes. Remote Sens. 2021, 13, 2196. [Google Scholar] [CrossRef]
  42. Beltaos, S.; Carter, T. Minor 2020 Ice Jamming in Lower Peace River despite Extreme Breakup Flows: Assessment of Hydroclimatic Controls. In Proceedings of the CGU HS Committee on River Ice Processes and the Environment 21st Workshop on the Hydraulics of Ice Covered Rivers, Saskatoon, SK, Canada, 29 August 2021; Volume 29. [Google Scholar]
  43. Li, Z.; Shen, H.; Weng, Q.; Zhang, Y.; Dou, P.; Zhang, L. Cloud and Cloud Shadow Detection for Optical Satellite Imagery: Features, Algorithms, Validation, and Prospects. ISPRS J. Photogramm. Remote Sens. 2022, 188, 89–108. [Google Scholar] [CrossRef]
  44. Pettorelli, N.; Vik, J.O.; Mysterud, A.; Gaillard, J.-M.; Tucker, C.J.; Stenseth, N.C. Using the Satellite-Derived NDVI to Assess Ecological Responses to Environmental Change. Trends Ecol. Evol. 2005, 20, 503–510. [Google Scholar] [CrossRef] [PubMed]
  45. Mahdavi, S.; Salehi, B.; Granger, J.; Amani, M.; Brisco, B.; Huang, W. Remote Sensing for Wetland Classification: A Comprehensive Review. GIScience Remote Sens. 2018, 55, 623–658. [Google Scholar] [CrossRef]
  46. Peters, D.L.; Prowse, T.D.; Marsh, P.; Lafleur, P.M.; Buttle, J.M. Persistence of Water within Perched Basins of the Peace-Athabasca Delta, Northern Canada. Wetl. Ecol. Manag. 2006, 14, 221–243. [Google Scholar] [CrossRef]
  47. Tsyganskaya, V.; Martinis, S.; Marzahn, P.; Ludwig, R. SAR-Based Detection of Flooded Vegetation—A Review of Characteristics and Approaches. Int. J. Remote Sens. 2018, 39, 2255–2293. [Google Scholar] [CrossRef]
  48. Fayne, J.V.; Smith, L.C. Characterization of Near-Nadir Ka-Band Scattering from Wet Surfaces. In Proceedings of the 2021 IEEE International Geoscience and Remote Sensing Symposium IGARSS, Brussels, Belgium, 11–16 July 2021; pp. 6132–6135. [Google Scholar]
Figure 1. The red star shows the location of the study site in Canada. The red line shows the extent of the PAD. The darker blue highlights the major central lakes and rivers relevant to our study area. Light blue depicts water bodies recognized in the National Hydrographic Network of Canada map. Hydrometric stations highlighted are: 1—07KF002 Lake Claire near Outlet to Prairie River; 2—07KF003 Mamawi Lake Channel at Old Dog Camp; 3—07MD001 Lake Athabasca at Fort Chipewyan and 3b—07MC003 Lake Athabasca near Crackingstone Point; and 4—07DD007 Athabasca River above Jackfish Creek. Temporary water loggers and the local weather station are also shown as red triangle and purple square, respectively.
Remotesensing 15 01278 g001
Figure 2. 2020 flood event compared to the 40-year median and the 1935 flood event [37] for Lakes Claire, Mamawi and Athabasca.
Remotesensing 15 01278 g002
Figure 3. Remotely sensed data acquisition along the 2020 lake expansion event. Lake levels are from Figure 2. Colored lines shows water levels of Mamawi Lake (green), Lake Athabasca (purple) and Lake Claire (blue).
Remotesensing 15 01278 g003
Figure 4. Study period SWOT-LS spatial coverage featured in two groups. (A) group A; (B) group B; (C) coverage percentage.
Remotesensing 15 01278 g004
Figure 5. Study period altimetric instrument passes over the PAD (black outline) See Figure 1 for names of hydrometric stations 1 to 4.
Remotesensing 15 01278 g005
Figure 6. 2020 water surface areas estimated for Sentinel-1, Landsat 8, Sentinel-2 and RADARSAT Constellation instruments.
Remotesensing 15 01278 g006
Figure 7. 2020 water surface area comparison between June and August for Sentinel-1 (S1), Sentinel-2 (S2) and Landsat-8 (LS8) where grey shows area of open water seen at both dates, blue shows open water seen in June only and red shows open water seen in August only. SWOT mission Prior Lake Database is also shown in black contour line.
Remotesensing 15 01278 g007
Figure 8. Mamawi Lake water surface area difference between June (blue) and August (red) for Sentinel-1, Sentinel-2, Landsat-8 and RCM-30 m. The SWOT PLD contour is shown in black lines.
Remotesensing 15 01278 g008
Figure 9. Water levels from altimetric instruments: (A) Sentinel-3 and Jason-3 for Lake Athabasca; (B) Sentinel-3 for Lake Claire and Jason-3 for Mamawi Lake.
Remotesensing 15 01278 g009
Figure 10. Water levels of Mamawi Lake and surrounding Jemis Lake, M12 and M14.
Remotesensing 15 01278 g010
Figure 11. Results of SWOT-LS Lake_SP Prior product simulation on Mamawi Lake. Coloured lakes represent the separated lake forms observed in the SWOT-LS lake product. SWOT-LS simulation from (A) 1 June and (B) 3 August.
Remotesensing 15 01278 g011
Figure 12. Sentinel-2 NDVI for the eastern portion of the PAD between Richardson Lake and Lake Athabasca for (A) 20 June 2020 and (B) 17 August 2020.
Remotesensing 15 01278 g012
Table 1. Summary of the various SBEO remotely-sensed data used for this study, including their different configurations. Acronyms are defined in text.
Mission Type Spatial
Resolution
(m)
Swath
Width
(km)
Polarisation (SAR Only)Repeat Cycle# of
Satellites
RCMSAR30/50 *350Variable12 days3
Sentinel-1SAR20250VV VH12 days2
Sentinel-2Optical10290N/A10 days2
Landsat-8Optical30185 × 180N/A16 days1
Sentinel-3AltimetricN/AN/AN/A27 days2
Jason-3AltimetricN/AN/AN/A10 days1
SWOTAltimetric SAR100 and 250 **2 × 50VV (right),
HH (left)
21 days1
* 50 m spatial resolution used for the temporal aspect this study. ** SWOT mission raster product spatial resolution (from Podaac SWOT L2_HR_Raster: https://podaac-tools.jpl.nasa.gov/drive/files/misc/web/misc/swot_mission_docs/pdd/D-56416_SWOT_Product_Description_L2_HR_Raster_20201105.pdf (accessed on 3 October 2022)).
Table 2. Summary of remote sensing data query.
Instruments# of
Cycles
# of Days Full CoverageTotal # of Observation Days# of Relative
Orbits per Cycle
# of Observation Days Used in WSA Analysis
Sentinel-112.752044417
Sentinel-215.3626226
Landsat-89.592933
RCM *12.75411301015
Jason-315.451212112
Sentinel-35.72020220
SWOT7.314537N/A
Total78.751783502971
* Only RCM at 50 m resolution.
Table 3. Numbers of images capturing water level of the four major lakes, as well as Baril Lake, during the 2020 flood event (May to October).
Jason-3Sentinel-3SWOT-LS
Mamawi Lake12035
Lake Claire0535
Lake Athabasca121535
Baril Lake0028
Richardson Lake0021
Table 4. WSE, WSA and Lake name of SWOT-LS simulated results for 10 June and 3 August.
Lake NameObserved
Input WSE June (m)
SWOT-LS
WSE June (m)
Observed
Input WSE August (m)
SWOT-LS
WSE August (m)
Mamawi210.08210.08210.98210.98
Jemis210.30210.04210.98210.99
Otter --210.98210.98
M12210.20210.02210.98211.01
M14210.46210.47210.98210.99
Table 5. Water surface area (WSA) comparison of Sentinel-1 (21 August), RCM-50m (24 August) and RCM-30m (23 August) for lakes Claire, Mamawi and Baril.
MissionWSA Claire (km2)WSA Mamawi (km2)WSA Baril (km2)
Sentinel-11330.1120.731.7
RCM 50m1506.5131.327.5
RCM 30m1302.4111.313.7
Disclaimer/Publisher’s Note: The statements, opinions and data contained in all publications are solely those of the individual author(s) and contributor(s) and not of MDPI and/or the editor(s). MDPI and/or the editor(s) disclaim responsibility for any injury to people or property resulting from any ideas, methods, instructions or products referred to in the content.

