Article

Quantifying the Effects of Snow on the Beginning of Vegetation Growth in the Mongolian Plateau

1
College of Geographic Science, Inner Mongolia Normal University, Hohhot 010022, China
2
Inner Mongolia Key Laboratory of Remote Sensing and Geographic Information Systems, Hohhot 010022, China
3
Department of Geography, School of Arts and Sciences, National University of Mongolia, Ulaanbaatar 14200, Mongolia
4
Baotou Teachers’ College, Inner Mongolia University of Science & Technology, Baotou 014030, China
*
Author to whom correspondence should be addressed.
Remote Sens. 2023, 15(5), 1245; https://doi.org/10.3390/rs15051245
Submission received: 1 January 2023 / Revised: 19 February 2023 / Accepted: 21 February 2023 / Published: 23 February 2023
(This article belongs to the Section Environmental Remote Sensing)

Abstract

:
Snow is one of the important water sources for vegetation growth in the Mongolian Plateau, and temporal and spatial changes to it have a profound impact on terrestrial vegetation phenology. In recent years, due to global climate change, the snow associated with the different vegetation types of the Mongolian Plateau has changed substantially, and the mechanism of the resulting change in the vegetation growth date needs to be studied. To address this issue, we used the modified Carnegie Ames Stanford Approach (CASA) model was to estimate the start of growing season net primary productivity (SOSNPP) for different types of vegetation over the Mongolian Plateau from 2001 to 2019. An extensive study of the spatial changes in the SOSNPP and the responses reflected by the winter snow cover fraction (SCFWinter), spring snow melting date (SMDSpring), and SOSNPP to influencing factors is of great significance for ecosystem maintenance. We observed: (1) Different vegetation types exhibited similar changes; SCFWinter underwent a significant decrease of −0.2%, and SMDSpring followed a slow downward trend of −0.59 day of the year (DOY)/year for the whole study area. (2) In the Mongolia Plateau, SOSNPP showed a trend of significant decrease of −0.53 DOY/year. (3) The local hydrothermal condition coupling relationship effect on different vegetation types. Spring temperature (TEMSpring) has a direct effect on vegetation SOSNPP, with a path coefficient of −0.09 in the Mongolian Plateau. SCFWinter and SMDSpring were shown through a path analysis to employ different effects on vegetation SOSNPP. SMDSpring has a direct effect on vegetation SOSNPP, with a path coefficient of 0.53. (4) The SMDSpring and PRESpring factors have a significant impact on vegetation SOSNPP, and they account for 21.11% and 21.26% of the whole study area SOSNPP, respectively. This study is expected to promote the examination of the snow phonological parameters of different related vegetation types and theoretical research on SOSNPP.

1. Introduction

Long-term observation records have tracked significant changes in China and the terrestrial vegetation abroad over the past 20 years, and there have been significant change in the climatic conditions [1,2,3]. Recent studies have shown that climate change is likely to affect crop adaptation and strategies, phenology, carbon storage, productivity, and biomass [4,5,6]. Snow cover changes the surface albedo and vegetation productivity, and it can impact climate conditions and energy balances [7,8]. As a common natural phenomenon, snow can introduce a lot of water and influence the local natural environment. Specifically, snow accumulation or it melting on soil and vegetation can directly change the hydrothermal conditions that affect vegetation growth and development [9,10,11]. Snow cover protects vegetation and soil from damaging natural factors such sun radiation, wind erosion, and freezing damage. Zheng et al., (2022) reported that snowfall in the early spring at the start of the growing season can promote vegetation growth [12]. Wang et al., (2013) showed that the vegetation responds strongly to snow phenology [13]. With the development of snow cover research, remote sensing monitoring of large-scale snow cover has been widely performed. Liu et al., (2022) used normalised difference snow index (NDSI) remote sensing data to create snow pixels with 500 m resolution studies regarding the long-term effects of snow cover on the phonological changes in high-altitude mountains [14]. Sa et al., (2021) used MOD10A1 snow data to analyse the spatiotemporal distribution characteristics of snow cover on the Mongolian Plateau [15]. They showed that the snow cover fraction (SCF) of the Mongolian Plateau decreased every year due to global climate change, which would affect the date of the vegetation growth season. Above all, snow cover changes can promote the growth of vegetation through snowmelt, which has feedback effects on the global climate.
In the arid and semi-arid regions of the Mongolian Plateau, the change in the snow melting date has a crucial impact on the surface energy balance cycle [16]. As one of parameters of snow phenology, the snow melting date plays key role in local vegetation growth. Early snow melting dates, the infiltration of snowmelt water, and insulation of the remaining snow cover stimulate the vegetation activities below the snow [12]. An earlier snow melting in the early spring can effectively promote soil moisture, leading to higher vegetation absorption. The role of early melting water in spring can provide a basic reference for spring irrigation, an early warning system for melting water disasters, and research on soil and water conservation [17]. In addition, in a year with a relatively late snow melting date, the number of plants in the growing season is relatively high. It may be due to the increase in snow water input, which can maintain an effective soil moisture level.
Terrestrial vegetation, which mostly consists of forests, grasslands, and shrubs, offers ecosystem services by storing carbon and performing water cycle transfer. Earth’s biochemical cycle depends heavily on vegetation. It has a positive impact on the ocean, environment, and climate through altering carbon sequestration, oxygen release, the water cycle, and the nutrients. The net primary productivity (NPP) of vegetation is a significant factor in the terrestrial carbon cycle. The NPP directly represents the capacity of the plants to convert CO2 into organic matter. NPP is the dry weight of the organic matter left by vegetation after photosynthesis and respiration in units of time and area. The vegetation NPP represents the spatial distribution of ecosystem carbon storage and is an essential indicator of the carbon cycle [18]. Therefore, the analysis of temporal and spatial evolution characteristics of NPP for vegetation is of fundamental value for research on ecological environment protection. Following the introduction of the concept of NPP, the NPP for various vegetation types was mostly studied using biochemical methods by creating the vegetation NPP model [19,20,21]. With the development of remote sensing technology, vegetation NPP based on remote sensing technology has gradually become a research hotspot. Xu and Wang (2016) used remote sensing data from 2000 to 2013 to analyse the evolution characteristics of vegetation NPP in arid areas of northwest China in the context of climate change [22]. They reported that the vegetation NPP in most areas covered by vegetation showed a significant increasing trend. Yin et al., (2022) used ground observation and remote sensing data to analyse the response relationship between natural and anthropogenic factors and NPP changes over the past 20 years in the Mongolian Plateau [23]. In their study, the vegetation NPP of different vegetation types showed a trend of significant increase. The spatial-temporal evolution analysis of vegetation NPP remote sensing monitoring research with an inversion model is widely used, has gradually become a research field, and most of the studies have explored the direct response of natural factors and human activities to the vegetation NPP. From a global perspective, biological events from ecosystems (such as the flowering, emergence, growth, and decay of vegetation) to human systems (such as agriculture). Vegetation phenology is one of the most controversial topics in ecology. In the past few decades, people’s interest in phenology has grown rapidly, focusing on the results of global climate change. Hart et al. found that the phenological responses to temperature cause changes in plants [24]. Tenaw and Jebessa Debella researched the start of the growing period, which they found begun earlier than it usually did, and the growing period elongated for most of the ecoregions in Ethiopia [25]. With specificity of the relationship between the study area and response factors, consideration of only the natural factors and human activities is inadequate. The indirect effects of soil moisture and the hydrothermal conditions of the vegetation growth environment caused by the lack of snow cover change cannot be ignored. Therefore, in the context of global change, the response relationship between vegetation NPP and snow phenology parameters has become an urgent research problem. Vegetation phenology refers to the temporal pattern of seasonal development and senescence during plant growth [26]. Vegetation phenology is particularly sensitive to climate change, as the latter phenomenon involves temperature change. In recent years, consequent to the growth of remote sensing image research, vegetation phenology has been widely researched [27,28,29]. The change in the start of the vegetation growing season date in spring and the length of the growing season are the key factors leading to climate change. Gao et al., (2022) found that an early start of the vegetation growth season promotes the ratio of precipitation to temperature, but the growth is limited in cold and dry areas [30]. Through a path analysis, they showed that when the growth season started early, it mainly promoted growth by easing the restrictions on the formation of northern forests and prolonging the growth period of temperate forests. Some other related studies showed that early snow melting affects the spring vegetation phenology. More intense and early snow melting delays the start of growing season and improves vegetation productivity [31,32]. Yu et al., (2013) studied the effects of seasonal snow on the start of the growing season for vegetation in China [33]. Chen et al., (2015) reported that the snow melting date affects the gross primary production (GPP) during the spring and summer seasons through their influences on the start date of the growing season (SGS) and the maximum daily GPP (GPPmax), respectively [34]. These studies indicate that the parameters of early snow cover phenology have a significant impact.
In recent years, many studies based on long-term remote sensing data have established that snow phenology parameters have an impact on the SOSNPP for vegetation, but most of these data are at the global scale. At present, a few studies have been conducted on the response of vegetation snow phonological parameters to the SOSNPP in the Mongolian Plateau. In this paper, we have applied the path analysis method to quantitatively analyse the response of snow phenology parameters to different vegetation SOSNPP. The analysis demonstrates the clear impact of the snow phenology parameters on the SOSNPP of different vegetation types. We have also elucidated the mechanism of the effect of snow phonological parameters on the SOSNPP for different types of vegetation.

2. Materials and Methods

2.1. Study Area

The Mongolian Plateau is an inland plateau in East Asia that includes all of Mongolia, southern Russia, and northern China. As shown in Figure 1, the major section of the Mongolian Plateau is chosen as the research region in this study, covering Mongolia and the Inner Mongolia Autonomous Region of China, with coordinates of 37°46′–53°08′N and 87°40′–122°15′E [35]. The climate here is arid and semi-arid, with a short, hot summer and a maximum temperature of 30–35 °C, while the winters are long and cold, with a minimum temperature of −40 °C and annual precipitation of 25 mm. The main geomorphic types are high plains and mountains. The west side of this region is made up of highlands, whereas the east side is made up of lowlands, with an average altitude of 1580 m. In the north, there are many mountains at altitudes. From northwest to southeast, these are Altai Mountain, Hang’ai Mountain, Kent Mountain, Daxing’an Mountain, and Yinshan Mountain [36]. Due to climate warming, permafrost on the edge of the mountains has degraded and resulted in a perennially low temperature and humid environment. Different vegetation types on the Mongolian Plateau, in Table 1, mainly include a broadleaf forest, a coniferous forest, a meadow steppe, a typical steppe, and a desert steppe.

2.2. Data Sources

Based on the classification of the international geosphere-biosphere program (IGBP), moderate-resolution imaging spectrometer (MODIS) land cover data (MCD12Q1) with 500 m resolution was used to identify temperate biological communities on the Mongolia Plateau. The majority of the area consists of forests, steppe, shrub, deserts, water, and agricultural vegetation.
MOD13A1.006 calculated NDVI vegetation parameters based on a global grid, L3, with 500 m pixel spatial resolution, which was obtained every 16 days (https://lpdaacsvc.cr.usgs.gov/appeears/task/area, (accessed on 27 June 2022)). The period examined in this study was between February 2000 and December 2020.
The SCF was calculated by MOD10A1.006 based on a global grid, L3, with 500 m spatial resolution per day (https://lpdaacsvc.cr.usgs.gov/appeears/task/area (accessed on 27 June 2022)). These data from December 2000 to February 2019 were studied. Snow melt date (SMD) refers to the last DOY of 5 continuous days with the SCF in a hydrological year (from September 1 of the current year to August 31 of the next year) [37].
Solar radiation photosynthetically active radiation (PAR) data were produced with the breathing earth system simulator (BESS), referred to as BESS PAR for short, from 2000 to 2019, with 0.05° spatial resolution per day (https://www.environment.snu.ac.kr/bess-rad (accessed on 3 August 2022)) [38].
ERA5-land data are fifth-generation atmospheric reanalysis data of the global climate, which we obtained from the European centre for medium range weather forecasts and compared with other climate reanalysis data. We extracted monthly precipitation (PRE), average temperature (TEM), and soil moisture (SM) data with 0.1° spatial resolution from the Mongolia Plateau from 2001 to 2019 to calculate the vegetation NPP by exploring the interrelation of snow phenology, NPP, and climatic factors.
The livestock data of cattle, with a spatial resolution of 0.083° (2010), were obtained from the Food and Agriculture Organization of the United Nations (FAO, https://dataverse.harvard.edu/dataverse/glw_3 (accessed on 20 November 2022)), and the spatial distribution of grazing activities was analysed. The population spatial data from UNEP/GRID-Geneva (http://www.worldpop.org.uk/ (accessed on 20 November 2022)) with a spatial resolution of 1 km (2010) and the spatial distribution of the population were analysed.

2.3. Methods

2.3.1. Snow Phenology Parameters

The SMD refers to the last DOY of 5 continuous days with the SCF in a hydrological year (from September 1 of the current year to August 31 of the next year) [37]. As an indicator of snow phenology, the SMD affects the growth of vegetation and ecosystem productivity in spring. The monthly SCF was calculated through the maximum value synthesis method, and then the multi-year winter value of each snow parameter was calculated using the average value method. We calculated the SCF of the study area according to the formula in the user guide of MODIS snow products MOD10A1 [39]. The formula is as follows:
SCF = 0.01 + 1.45 × NDSI × 100   %

2.3.2. CASA Model

The CASA model can evaluate the photosynthesis intensity of vegetation driven by temperature, water, and light to retrieve the vegetation NPP, in which the maximum utilisation rate of light energy determines the difference between the photosynthesis and respiration of vegetation.
To calculate the NPP, it is necessary to transform solar radiation into photosynthetically active radiation (APAR), NDVI into the component of vegetation, which is a fraction of PAR (FPAR), and a specific light energy conversion rate, which is determined based on the type of vegetation [40].
NPP x , t = APAR x , t × ε x , t
APAR x , t = SOL x , t × FPAR x , t × 0.5
FPAR x , t = m i n SR     SR m i n SR m a x   SR m i n , 0.95
SR x , t = 1 + NDVI x ,   t 1 NDVI x ,   t
ε x , t = T ε 1 x , t × T ε 2 x , t × W ε x , t × ε m a x
Here, NPP x , t represents the actual NPP of the vegetation (g·C/m2), APAR x , t represents the radiation absorbed by photosynthetically active vegetation, ε x , t represents the actual light use efficiency of different types of vegetation, SOL x , t represents the absorption ratios of total solar radiation, SR x , t represents the ratio vegetation index, T ε 1 x , t and T ε 2 x , t represent the temperature stress coefficients, W ε x , t represents the water stress coefficient, and ε m a x represents maximum light energy utilisation rate of the NPP. ε m a x of different vegetation types is shown in Table 2.

2.3.3. Cumulative Logistic Curvature Method

The cumulative logistic curvature method was used to extract the start of the growing season vegetation NPP (SOSNPP). The cumulative value of the SOSNPP data of each year was calculated pixel by pixel. Then, the cumulative SOSNPP data were fitted with a four-parameter logistic curve (Formula (7)), and the curvature K of the logistic fitting curve (Formulas (8) and (9)) was calculated [41,42]. Finally, the date corresponding to the minimum curvature value was defined as the start date of the growing season.
y t = c 1 + e a + b t + d
K = d α d s = b 2 c z 1 z 1 + z 3 1 + z 4 + b c z 2 1.5
z = e a + b t
Here, t is the day in the year (DOY), y(t) is the cumulative NPP value corresponding to time t, d is the background NPP, c + d is the maximum cumulative NPP, and a and b are the fitting parameters.

2.3.4. Path Analysis

We identified the main factors and used the path analysis method to evaluate both the direct and indirect effects of SOSNPP. A path model was established in past studies using the multivariate statistical analysis approach [43]. The models used in path analysis show that a group of variables interact with one another [44]. The path analysis includes the conventional dimensionless process of each variable and the direct and indirect impacts of the factors on the response variables. We constructed a conceptual path model analysis, and its correlation was obtained by integrating intervention factors, since one entity can affect another entity in many ways.
y 1 = β 1 x 1 + β 2 x 2 + β 3 x 3 + ε 1
y 2 = β 4 x 1 + β 5 x 2 + β 6 x 3 + ε 2
y 3 = β 7 x 2 + β 8 y 1 + β 9 y 2 + ε 3
Here, y 1 , y 2 , and y 3 , respectively, represent three different dependent variables; x 1 , x 2 , and x 3 , respectively, represent three different independent variables; β 1 β 9 represent the regression coefficients of each factor; ε 1 , ε 2 , and ε 3 represent residuals of three different regression equations, respectively. A path diagram is an illustration of the variables, wherein an arrow from one variable to another variable indicates a causal relationship based on a theory. A single arrow points away from the cause, whereas bidirectional bending arrows indicate that the variables are related, and no causality is assumed. An independent variable (x) is called an exogenous variable. The factor variable (y) is called an endogenous variable [43].

2.3.5. Grey Relation Analysis

To quantify the effect of snow on the Mongolian Plateau, we used grey relation grade analysis to determine the factors affecting the SOSNPP. Grey relation analysis quantitatively describes and compares the trend of development in a system. Its main idea is to compare the geometric similarity between the reference and several comparison data. Dominance determines the factors and the same reference sequence by calculating the correlation between multiple factors [45,46].
Let both   X i and X j be the equally spaced sequence and let X i 0 = X i 0 1 ,   X i 0 2 ,   ,   X i 0 n   , and X j 0 = X j 0 1 ,   X j 0 2 ,   ,   X j 0 n   , respectively, be the zeroed value of the start point [47]. Then, the grey absolutely relational degree of X i and X j is
ε i j = 1 + S i + S j 1 + S i + S j + S i S j
S i S j = k = 2 n 1 x i 0 k x j 0 k
s = k = 2 n = 1 x 0 k + 1 2 x 0 n
In addition, there is a relatively relational degree in grey relational analysis. Its construction is similar to the absolutely relational degree, with a slight difference being that X i and X j are processed by the initial value before computing the zeroed value of the start point.

3. Results

3.1. Spatiotemporal Characteristics of SCFWinter and SMDSpring

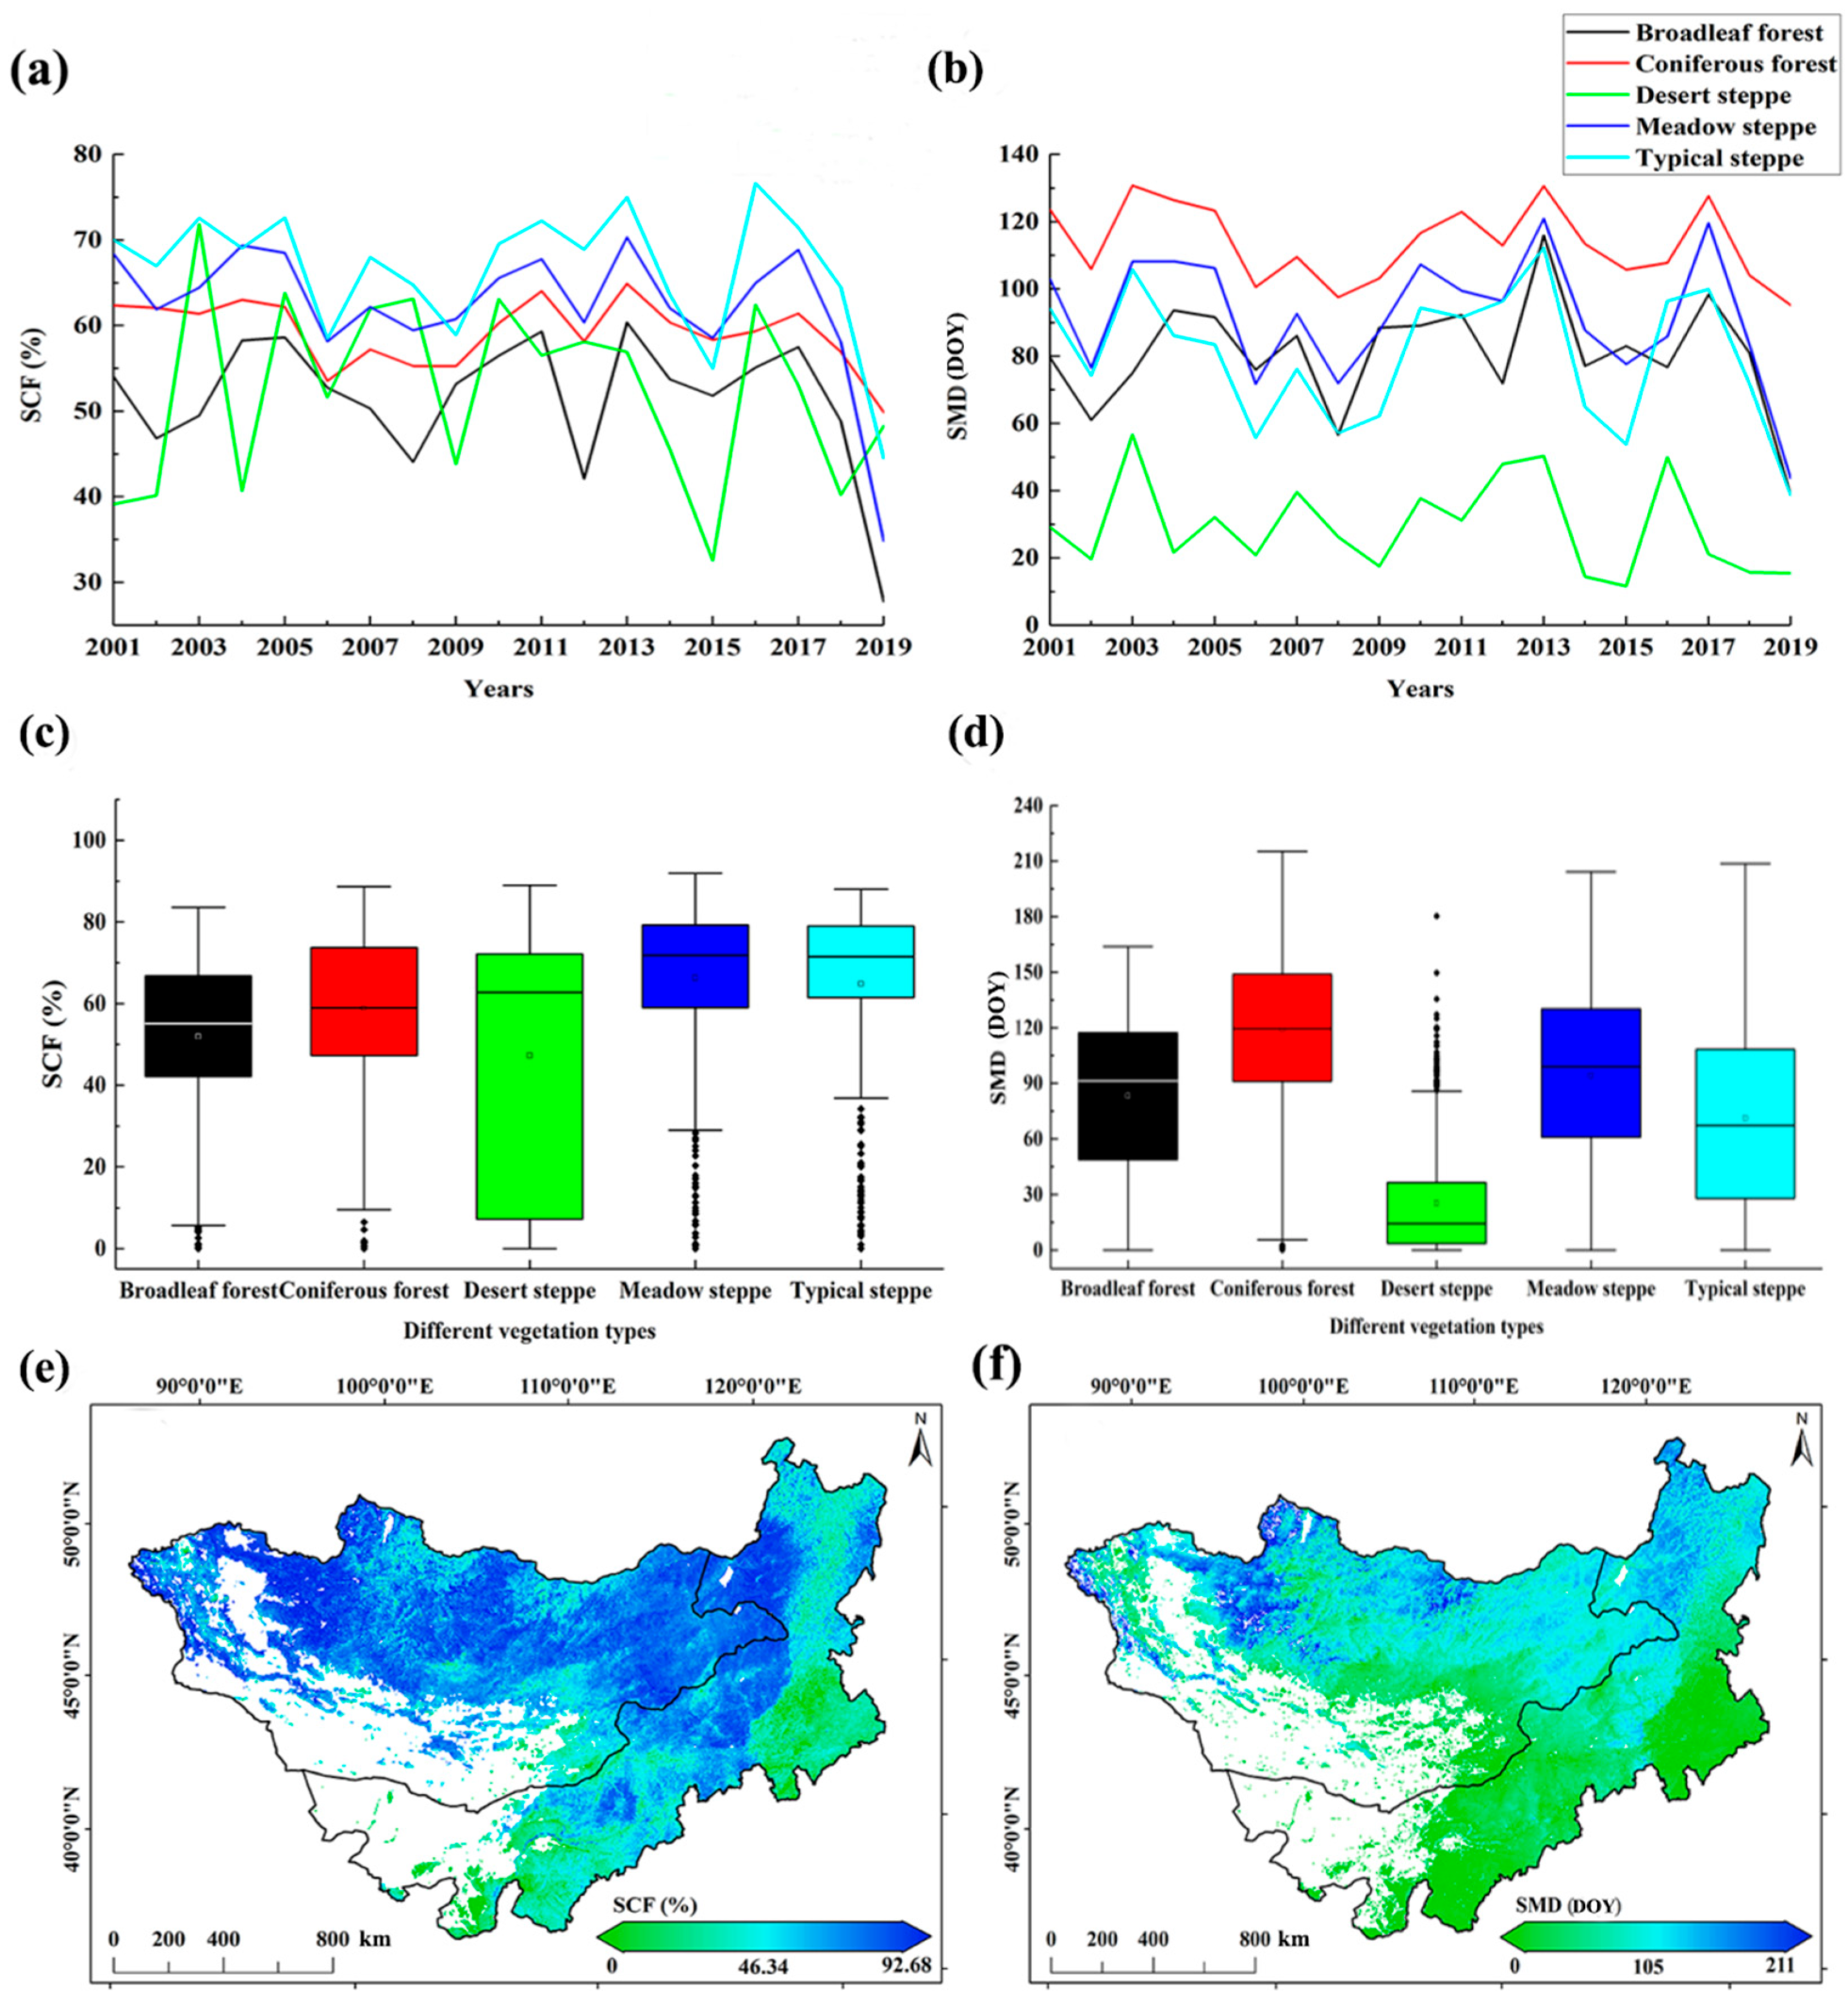
The SCFWinter changes among the different vegetation types on the Mongolian Plateau from 2001 to 2019 are shown in Figure 2a. Evidently, different vegetation types for the whole study area show a similar slow, downward trend for the SCFWinter. The average SCFWinter for the typical steppe area ranges from 44.53% to 76.62%, whereas it is from 32.56 to 71.85% for the desert steppe area. The minimum and maximum values of SCFWinter for all the vegetation types are observed in the years 2015 and 2013, respectively. The changes in the spring SMD for different vegetation types are shown in Figure 2b, which reveals a slow downward trend for the whole study area. The average SMDSpring values for the coniferous forest area range from 95 to 131 DOY, whereas for the desert steppe area, they are from 12 to 57 DOY. The minimum SMDSpring values for the different vegetation types correspond to the year, 2015. As shown in Figure 2c, according to the SCFWinter spatial statistics box plot results; in the desert steppe, the mean SCFWinter is 47.26%, whereas the maximum SCFWinter is 89%; in the coniferous forest, the mean and maximum SCFWinter values are 58.79% and 88.65%, respectively; and in meadow steppe the mean and maximum SCFWinter values are 66.26% and 91.9%, respectively. The mean SMDSpring spatial statistics box plot is depicted in Figure 2d. As is clear in this Figure 2d, the mean SMDSpring in the desert steppe is 25 DOY. For the coniferous forest, the mean and maximum SMDSpring values are 118 and 215 DOY, respectively. Further, for the meadow steppe, the mean and maximum SMDSpring values are 94 and 204 DOY, respectively. In Figure 2e, the northern and western parts of the Mongolian Plateau exhibit average SCFWinter values of 50–60%. The major parts of the Mongolian Plateau show an SCFWinter distribution characteristic of typical meadow and steppe vegetation zones. The average SCFWinter value in the meadow steppe area is 62.3%, which is mainly distributed in the northern regions; the average SCFWinter value in a typical steppe area is 66.46%, which is mainly distributed in the eastern regions. In Figure 2f, the spatial distribution of SMDSpring on the Mongolian Plateau is seen to be gradually decreasing from north to south. SMDSpring values with more than 105 DOY are mainly distributed in the north part of the Mongolian Plateau, indicating long snow cover durations and a relatively delayed melting date of snow cover in spring in this region.

3.2. Spatiotemporal Characteristics of Vegetation NPP and SOSNPP

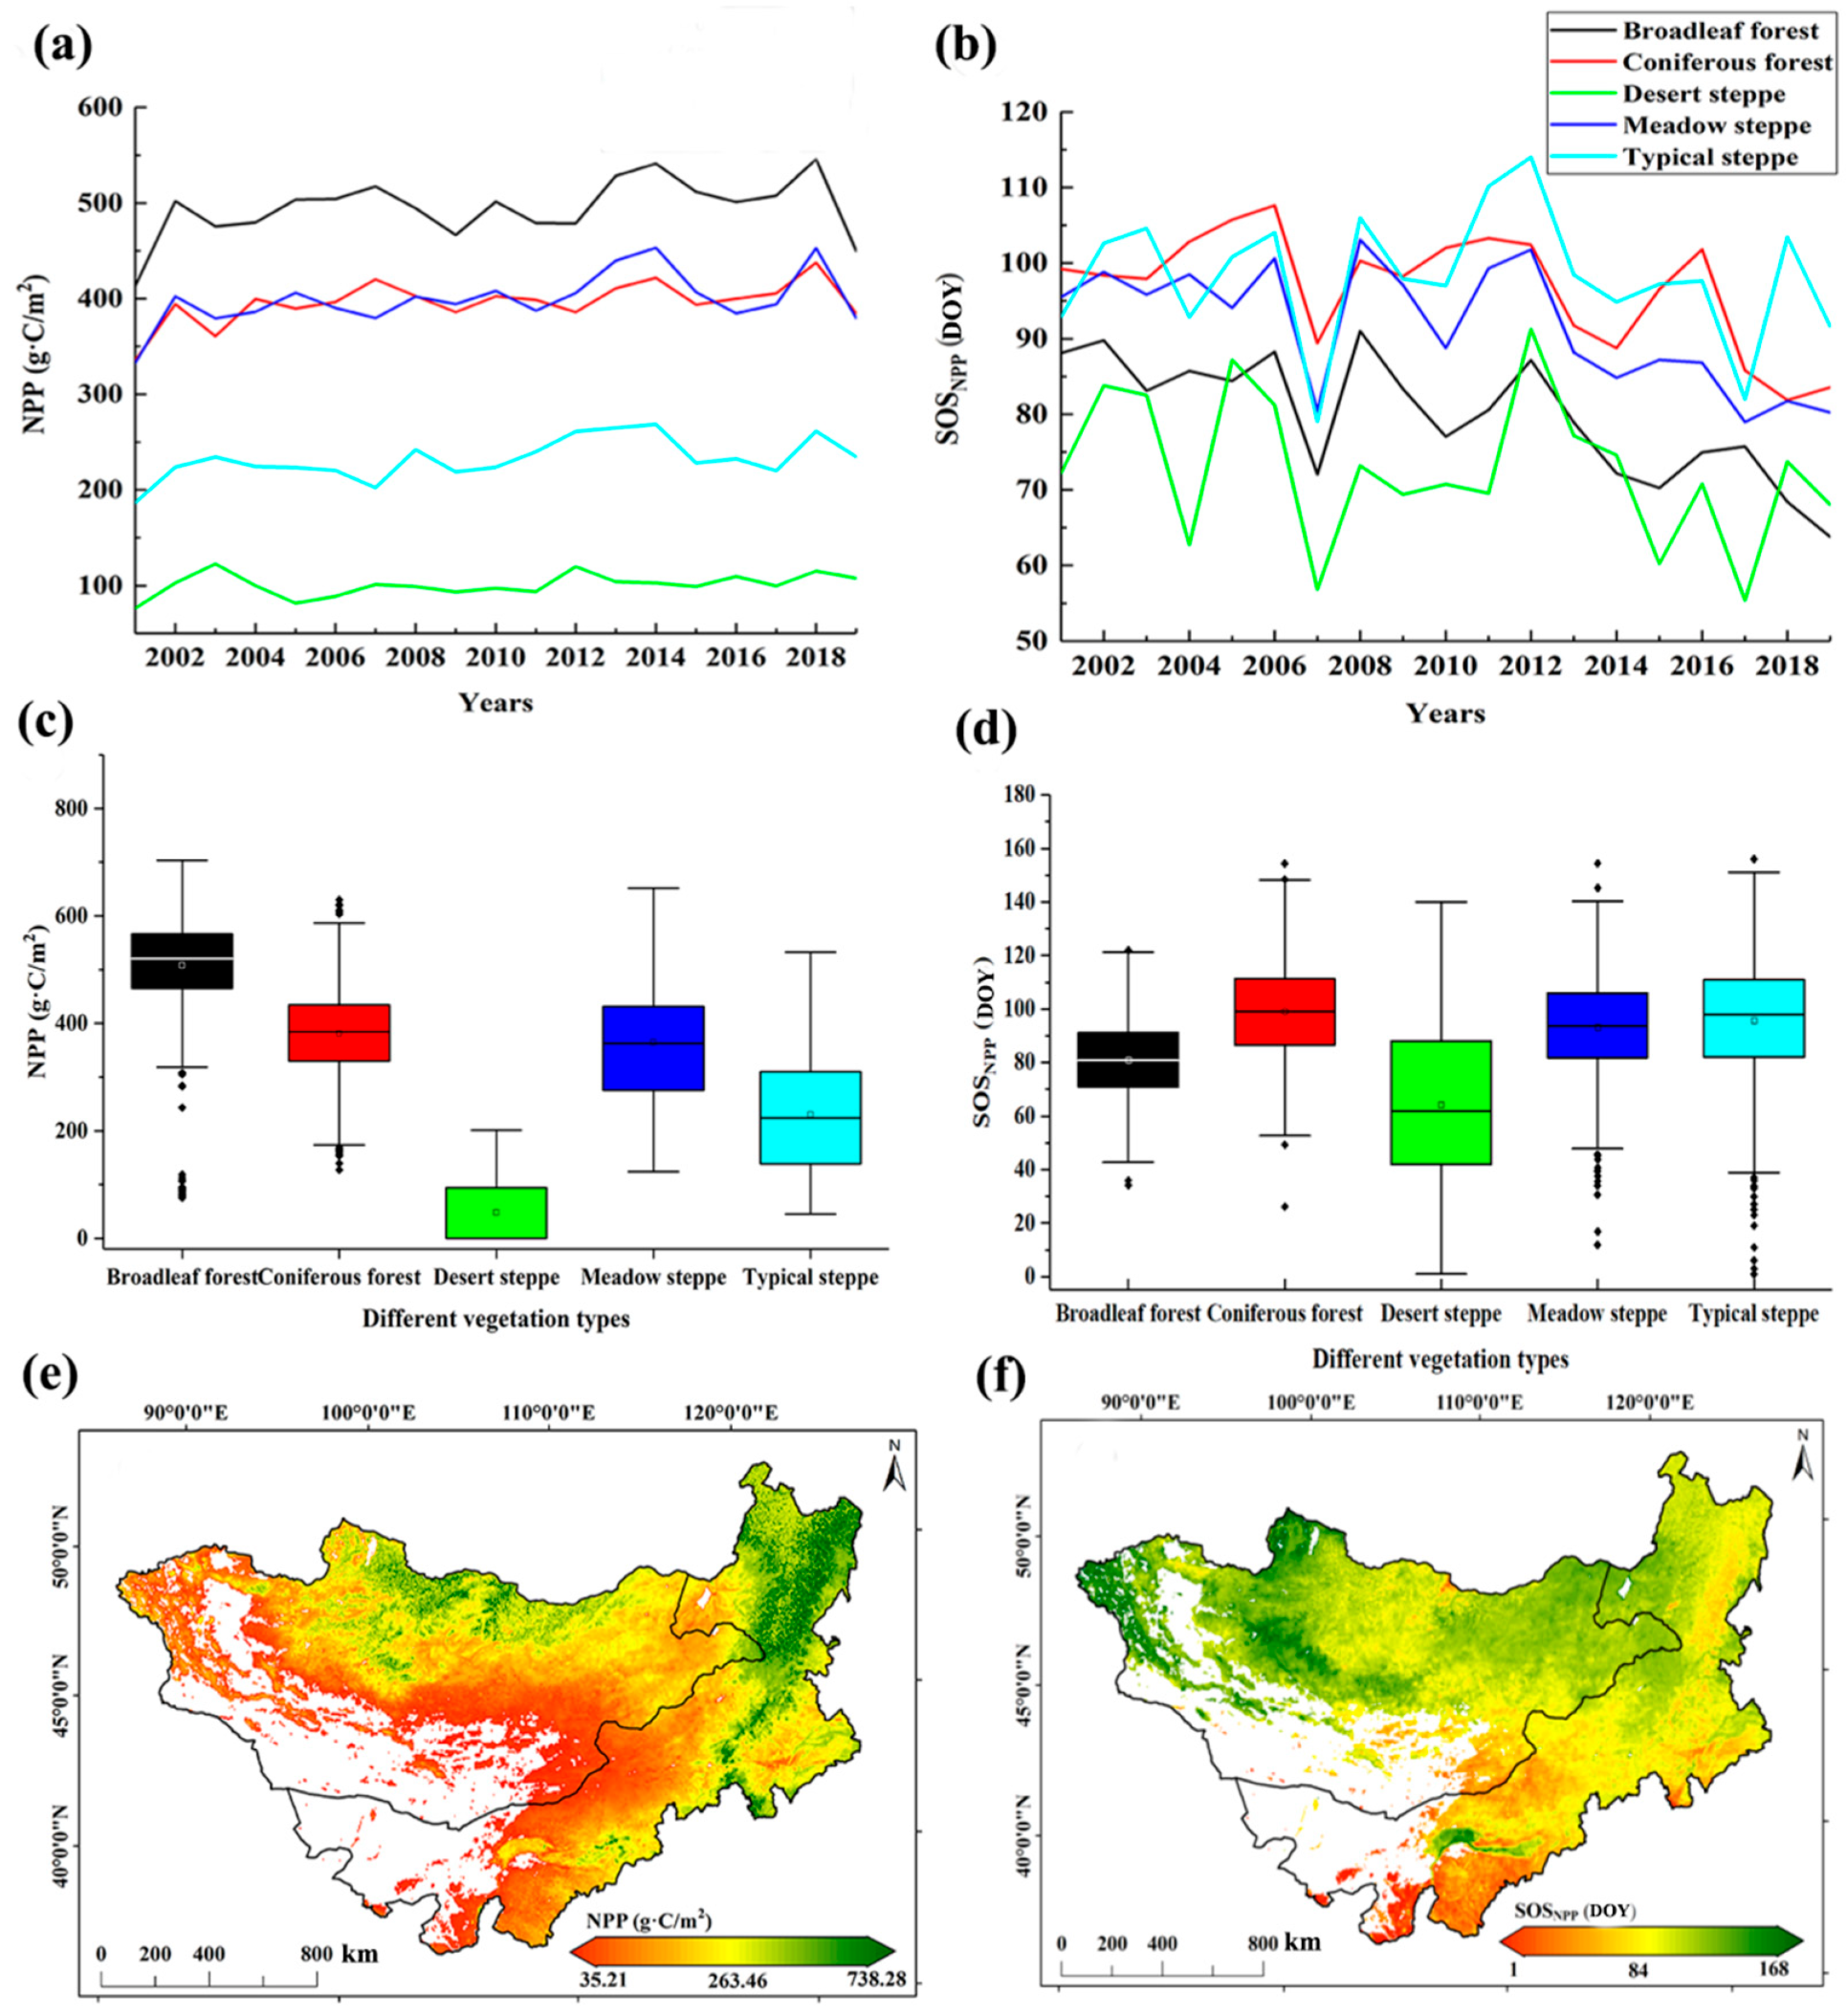
Using the CASA model, we analysed the NPP distribution of different vegetation types on the Mongolian Plateau from 2001 to 2019. As shown in Figure 3a, different vegetation types have same characteristics of NPP with a trend of steady increase every year. Among them, the average NPP ranges from 413.04 to 545.83 g·C/m2 in the broadleaf forest area. In the desert steppe area, the average NPP ranges from 76.25 to 122.66 g·C/m2. While the years 2001, 2009, 2015, and 2017 correspond to a minimum NPP value for the different vegetation types, the maximum NPP values are visible in 2003, 2014, and 2018. In Figure 3b, different vegetation types show the same characteristics of SOSNPP, with a stable decreasing trend every year. In 2007, different vegetation types reached a minimum SOSNPP DOY. In Figure 3c, the NPP spatial statistics box plot is shown. In the desert steppe, the mean NPP is 47.37 g·C/m2, and the maximum NPP is 201.22 g·C/m2. In the broadleaf forest, the mean NPP is 506.77 g·C/m2, and the maximum NPP in the coniferous forest is 703.59 g·C/m2. In the meadow steppe, the mean and maximum NPP values are 363.14 g·C/m2 and 651.93 g·C/m2, respectively. An SOSNPP spatial statistics box plot is depicted in Figure 3d. It shows that the mean and maximum SOSNPP values for the desert steppe are 64 and 140 DOY, respectively. The mean SOSNPP value for the broadleaf forest is 81 DOY, whereas the maximum SOSNPP for the coniferous forest is 154 DOY. The mean and maximum SOSNPP values for the meadow steppe are 93 and 154 DOY, respectively. In Figure 3e, the spatial distribution of the average NPP is shown. Whereas the northern and eastern parts of the Mongolian Plateau exhibited an average NPP of 400–560 g·C/m2, this value was from 0 to 240 g·C/m2 in the desert steppe. The desert vegetation NPP is mainly distributed in the western regions of the Mongolian Plateau. Figure 3f depicts the spatial distribution of the average SOSNPP. Here, an average SOSNPP of above 84 DOY is mainly distributed in the northern part of the Mongolian Plateau, indicating a long SOSNPP duration and a relatively delayed start of the vegetation growing season in spring in this region.

3.3. The Relationship between SOSNPP and Driving Factors

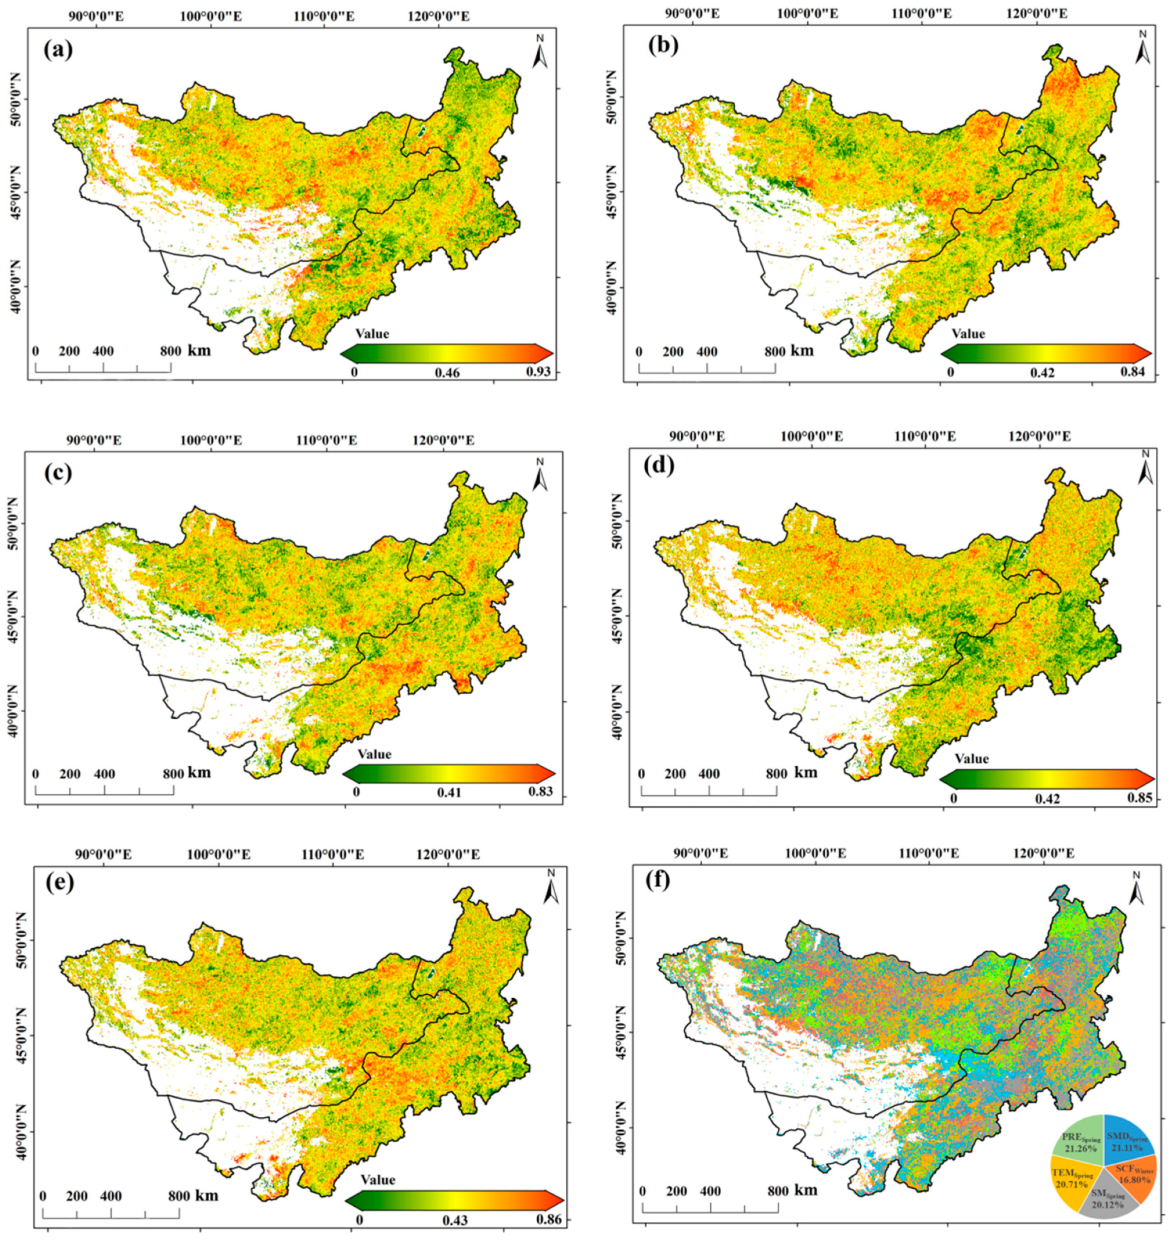
We further studied the importance of different influencing factors on the spatial correlation of the SOSNPP using the spatial grey relation analysis method. The result of the spatial importance analysis of the SOSNPP and TEMSpring is shown in Figure 4a, which shows values higher than 0.5 in most areas of the northern Mongolian Plateau, indicating that the TEMSpring exerts an effect on the SOSNPP in most areas of the northern Mongolian Plateau. The degree of spatial importance of the SOSNPP and PRESpring was generally higher than 0.5 in most areas of the northeast and central part of the Mongolian Plateau (Figure 4b), indicating that PRESpring plays a key role in the SOSNPP in most areas of the north-eastern and central Mongolian Plateau. The results of the spatial importance analysis of the SOSNPP and SMSpring are shown in Figure 4c, in which a value higher than 0.5 is observed in the southern part of the Mongolian Plateau, indicating that SMSpring affects the SOSNPP in the southern part of the Mongolian Plateau. Further, the results of the spatial importance analysis of the SOSNPP and SCFWinter are shown in Figure 4d. In this case, the degree of spatial importance analysis is observed to be generally higher than 0.5 in the northern part of the Mongolian Plateau, indicating an important role of SCFWinter in SOSNPP in the northern part of the Mongolian Plateau. As shown in Figure 4e, the spatial importance analysis of the SOSNPP and SMDSpring reveals that in the southern part of the Mongolian Plateau, the degree of spatial importance analysis is generally higher than 0.5, indicating that the SMDSpring is more related to the SOSNPP in the southern part of the Mongolian Plateau. Further, we calculated the effects of the influencing factors on the spatial SOSNPP, and as shown in Figure 4f, we observed relatively balanced effects of the influencing factors on the spatial SOSNPP. The spatial distribution was found to be relatively scattered in the whole Mongolian Plateau study area. Among them, PRESpring and SMDSpring accounted for 21.26% and 21.11%, respectively, of the SOSNPP for the whole study area.
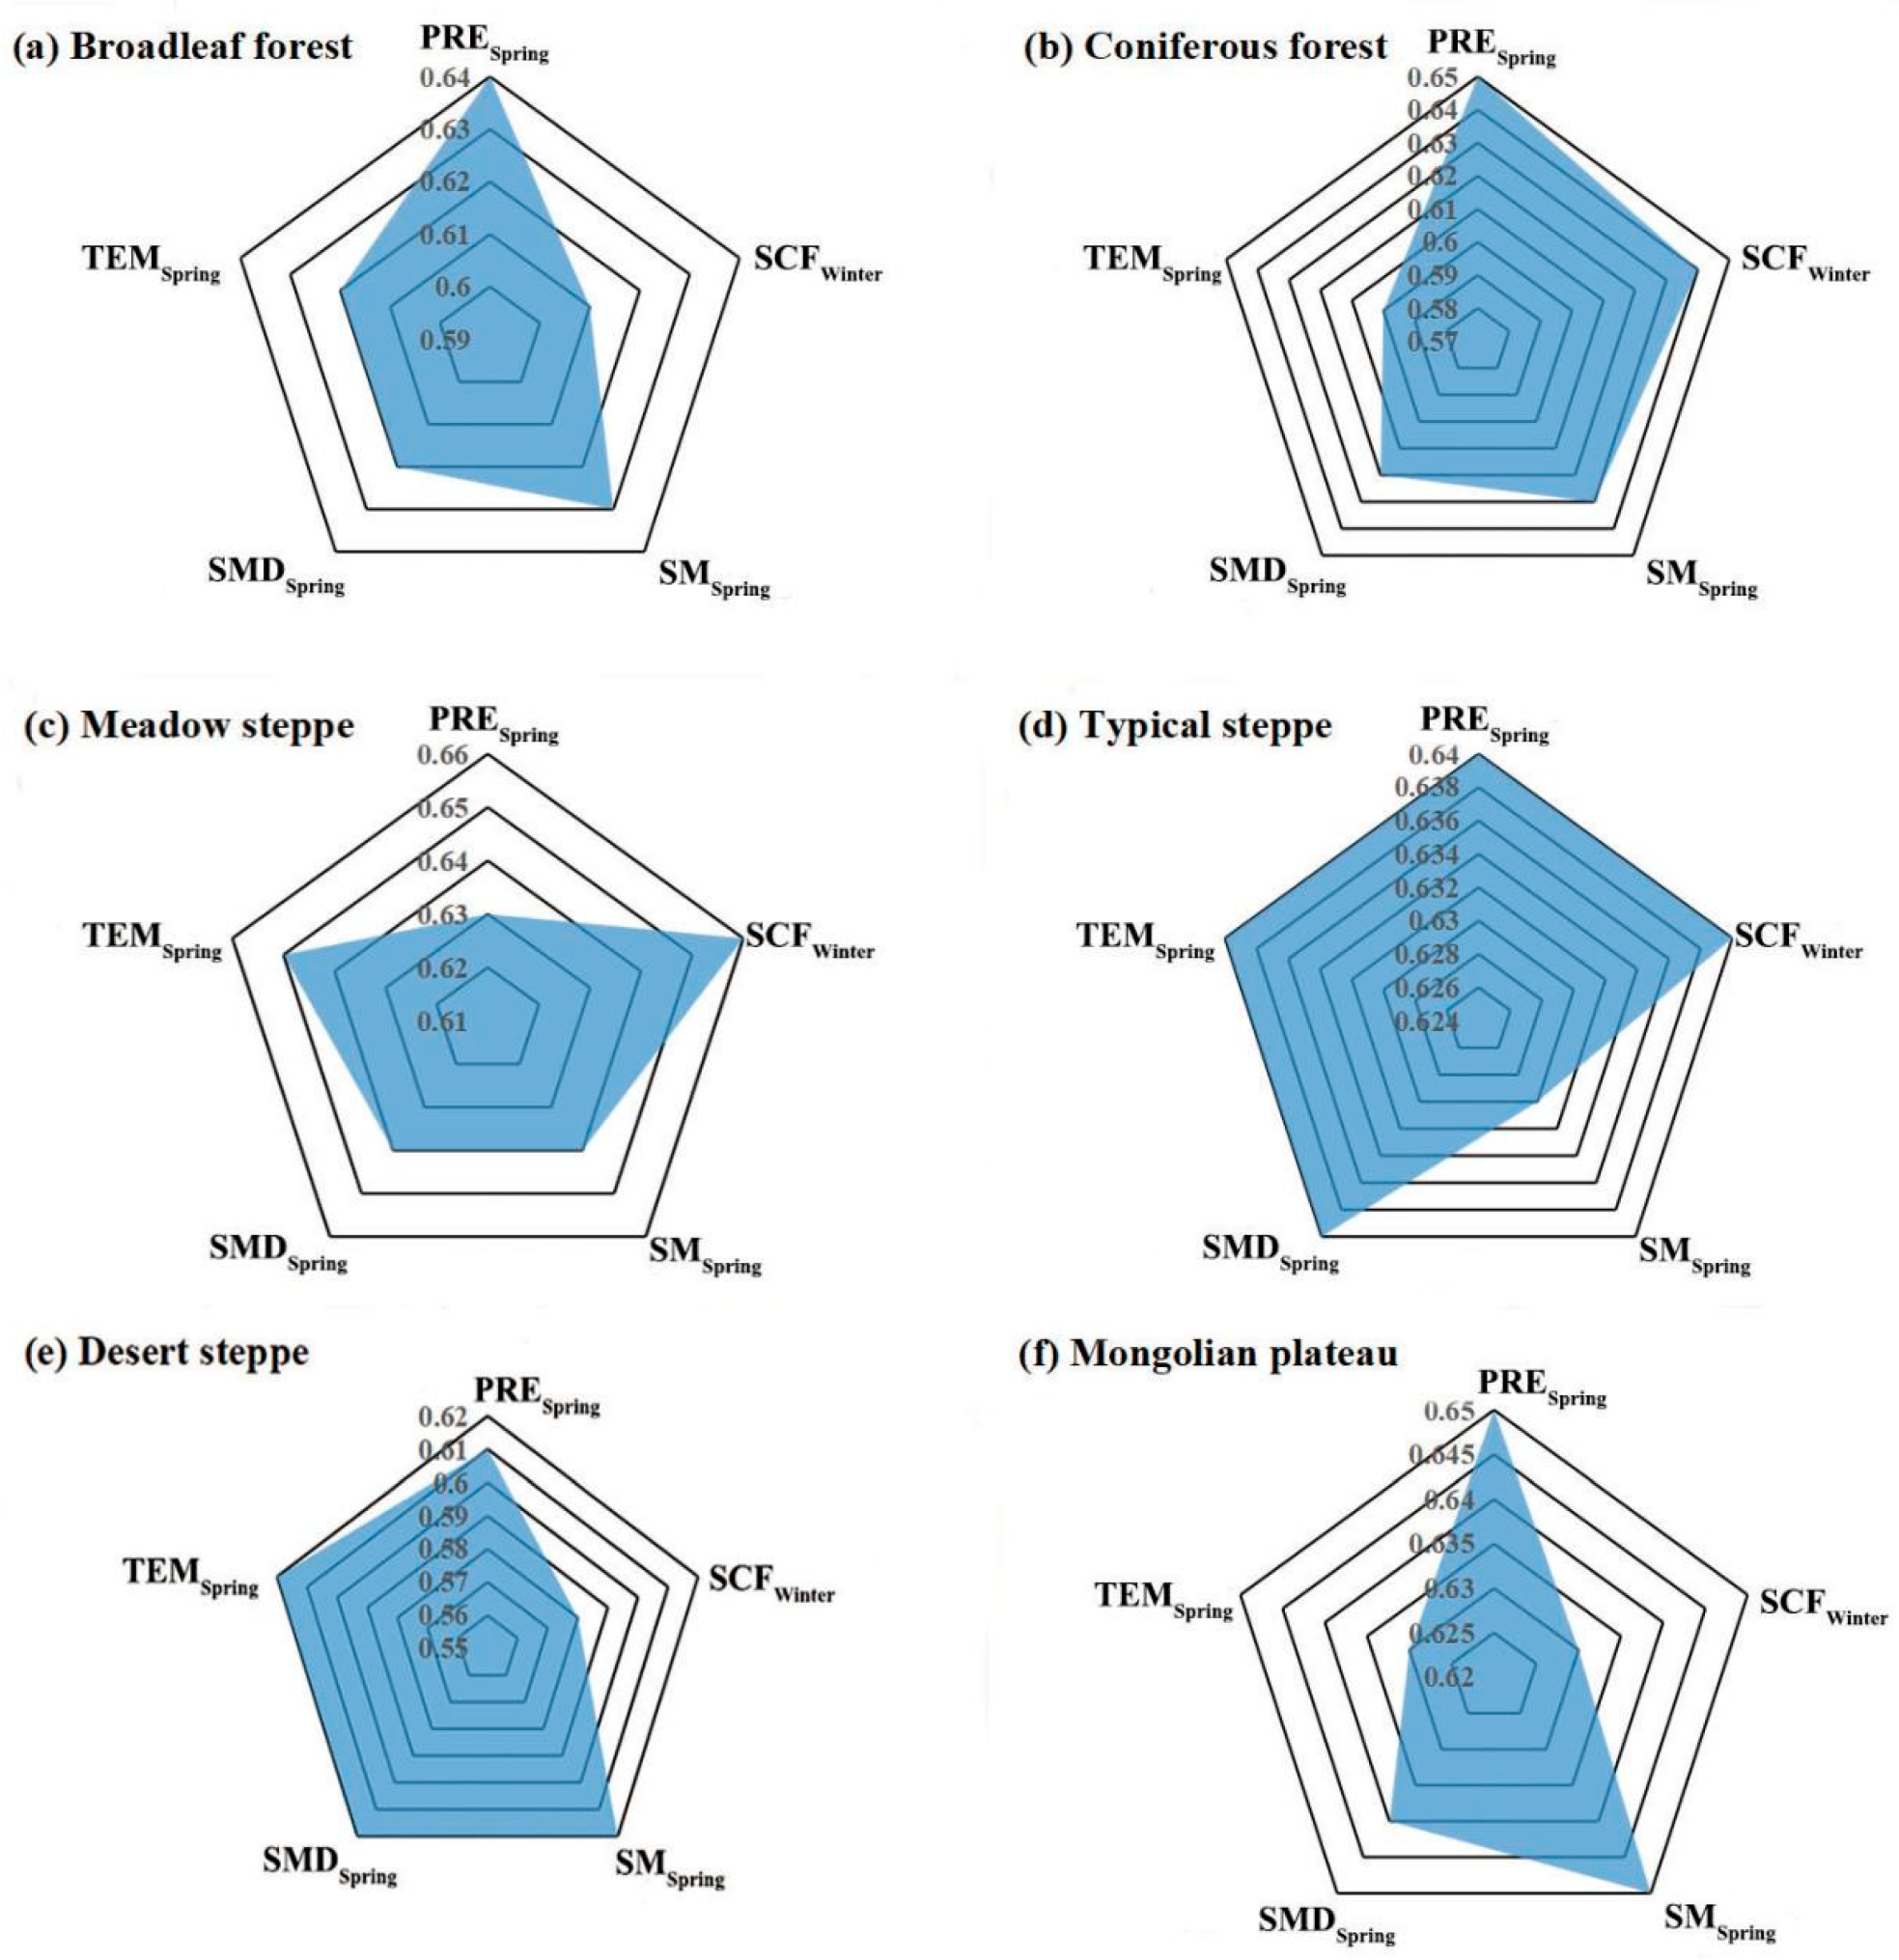
The value of grey correlation can indicate the extent of the influence exerted by different factors on the vegetation SOSNPP in the Mongolian Plateau. In general, the impact of different factors on the SOSNPP of vegetation types in the Mongolian Plateau varies (Figure 5). As shown in Figure 5a,b, PRESpring and SMSpring have a greater impact on the SOSNPP in the broadleaf and coniferous forest areas. The PRESpring reaches maximum values of 0.64 in the broadleaf forest area and 0.65 in the coniferous forest area, which indicate that PRESpring has a significant effect on the SOSNPP. As shown in Figure 5c,d, the SCFWinter has an important impact on the SOSNPP in the meadow and typical steppe, and the grey correlation grade values are 0.66 and 0.64, respectively. As shown in Figure 5e, TEMSpring, SMDSpring, and SMSpring have equal effects on the SOSNPP, with a grey correlation grade value of 0.62. However, SCFWinter has a lower impact on the SOSNPP in the desert steppe. As shown in Figure 5f, PRESpring and SMSpring have an equally significant effect on the SOSNPP, with a grey correlation grade value of 0.65. The second most significant influencing factor is SMDSpring, followed by PRESpring and SMSpring.

3.4. Path Analysis of SOSNPP Changes in Snow Dynamics

The path analysis results of different vegetation types show the impact of the SOSNPP response mechanism. Figure 6a shows the negative feedback effects of TEMSpring and PRESpring on SOSNPP in the broadleaf forest. With the increase in TEMSpring and PRESpring, the SOSNPP decreases significantly, as reflected in the path coefficients of −0.2 and −0.09, respectively. SCFwinter has a positive feedback effect on the SMDSpring, and the path coefficient is 0.19, which indicates that SCFwinter and SMDSpring are highly sensitive to the SOSNPP in the broadleaf forest area. SMDSpring has a positive feedback effect on the local broadleaf forest vegetation SOSNPP, and its path coefficient is 0.22, indicating that SMDSpring can mainly promote the local vegetation SOSNPP. In Figure 6b, TEMSpring has a negative and significant interaction effect on the SOSNPP in the coniferous forest area, and the path coefficient is −0.6. Furthermore, SCFwinter and SMSpring have significant promoting effect on the vegetation SOSNPP, and the corresponding path coefficients were 0.13 and −0.23, respectively. The analysis of the five paths of SCFWinter–SOSNPP, SCFWinter–SMSpring–SOSNPP, and SMDSpring–TEMSpring–SOSNPP showed that the local SMDSpring can indirectly promote SOSNPP effectively, and then, SMSpring can significantly delay the growth of local vegetation SOSNPP, with a path coefficient of −0.23. Figure 6c shows that SCFwinter can affect the vegetation SOSNPP through four paths in the meadow steppe vegetation area. Through the analysis of SMDSpring–TEMSpring–SOSNPP path, it can be concluded that TEMSpring has a significant negative feedback effect on the SOSNPP, with a path coefficient of −0.33, and SMDSpring has an indirect significant negative effect on the vegetation SOSNPP. According to the path analysis of SCFwinter–SMSpring–SOSNPP, SCFwinter has an indirect feedback effect on the SOSNPP through SMSpring. According to Figure 6d, SCFwinter and SMDSpring have an indirect feedback effect on the SOSNPP. Through the path analysis of SCFwinter–SMSpring–SOSNPP, it is concluded that SCFwinter has a significant indirectly correlation with SOSNPP. Then, the SMSpring of local vegetation can be effectively delayed by the SOSNPP, with a path coefficient of −0.17. In Figure 6e, the local SMDSpring condition can promote the vegetation SOSNPP in the desert steppe area. The SMDSpring has a positive feedback effect on the SOSNPP in the desert steppe. On the one hand, through the SMDSpring–TEMSpring–SOSNPP path, SMDSpring positively affects the vegetation SOSNPP through the action of TEMSpring. On the other hand, through the SMDSpring–TEMSpring–SOSNPP path, SMDSpring indirectly affects the SOSNPP through the action of TEMSpring. Figure 6f shows the impact of the factors SCFwinter, TEMSpring, PRESpring, SMSpring, and SMDSpring in the whole Mongolian Plateau research area. These factors can have a complex impact on the vegetation SOSNPP. The feedback effect of SMDSpring on the vegetation SOSNPP is direct, with a path coefficient of 0.53. As suggested by the SMDSpring–TEMSpring–SOSNPP path, SMDSpring can indirectly affect the SOSNPP through the action of TEMSpring.

4. Discussion

4.1. Possible Impact of the Cloud Snow Cover Product Data

Although MOD10A1.006 snow cover product data have a coarse resolution (500 m) compared with Landsat and Sentinel-2 data, it is still the data source for large-scale and long-time-series monitoring of snow dynamics [48]. Similarly, we also found that the MOD10A1 data have a certain practicability in the Mongolian Plateau. Sa et al., (2021) used MOD10A1 snow cover data and obtained spatial distribution information of the snow cover parameters on grassland phenology on the Mongolian Plateau [15]. Ersi et al., (2023) used the daily snow cover product of MOD10A1 from 2000 to 2020 and the path analysis method to analyse the direct or indirect effects of the snow cover area in winter and the snow melting date on the start of the vegetation growing season under the synergistic effect of the spring temperature [49]. However, cloud cover seriously limits the application of snow cover product data. In the past few decades, people have proposed cloud removal methods for a large number of snow products. Jing et al., (2019) proposed a two-stage spatio-temporal fusion framework for cloud removal in MODIS C6 snow product data [50]. Dietz et al., (2012) combined Terra and Aqua with applied a temporal cloud filter to eliminate cloud cover [51]. This cloud gap-filling method is simple and effective and has high accuracy in filling the missing data within the cloud coverage. Tang et al., (2013) used the cubic spline interpolation algorithm to fill in the data gaps caused by clouds [52]. In addition, Hao et al., (2022) researched a cloud-gap-filled snow-cover-extent (CGF-SCE) dataset with cloudless snow area product data. The overall accuracy of the CGF-SCE dataset cloudless snow area product is as high as 93.15%, while that of the MOD10A1F product is 89.54%, and that of the MYD10A1F product is 84.36%. The system products provide more reliable data support for the temporal and spatial distribution of snow under the condition of climate change in China and better serve relevant research of China’s climate, hydrology, ecology, and other fields [53].

4.2. Discussion of NPPSOS Results

The modified CASA model can be widely used for the NPP of Mongolian Plateau vegetation. Jin et al. [54] discussed the vegetation NPP on the Mongolian Plateau and the response of the NPP to the change in hydrothermal conditions from 1982 to 2015. At the growing season scale, the NPP increased across 94.7% of the plateau and significantly increased across 32.0% over 2001–2015. In this study, we comprehensively investigated SOSNPP. Using the modified CASA model and cumulative Logistic curvature method, we estimated the change in the SOSNPP throughout the whole Mongolian Plateau from 2001 to 2019. The modified CASA model also captures the plant growth status, changes in the ecosystem services, and the health status under environmental conditions. The modified CASA model can minimise the uncertainty produced by extrapolation and interpolation [55]. Remote sensing has its own limitations in terms of data errors and a tendency to be influenced by the surroundings (i.e., atmosphere, sensors, and soil). The SOSNPP data of this study varied slightly from those of some previous studies [56,57], which might be explained by the resolution, quality, and smoothing method used in the vegetation index [58]. The different smoothing models for remote sensing time series data differ significantly [59]. The values are likely to change with some smoothing methods, even if the default parameter values are entered. This makes the outcomes of the smoothing process highly uncertain, and incorrect smoothing parameter values may result in wrong findings in the phenology extraction [60].

4.3. Principle and Results of Path Analysis

The path analysis employs a series of models that describe the interaction between a set of variables. In fact, the path analysis is an extension of the regression model. The purpose of the path analysis is to estimate the magnitude and importance of relations between the variables displayed using the path diagrams. Path analysis requires researchers to determine the path assumptions in regression with enough samples to determine and evaluate the importance through the path analysis. In general, the accuracy and stability of path analysis decline with the decrease in the sample size and the increase in the number of variables. One advantage of path analysis is that it allows researchers to simultaneously study the direct and indirect effects of multiple independent and dependent variables. In some cases, the independent variable affects the dependent variable directly. Alternatively, the effect of the independent variables upon the dependent variables may occur through intermediary variables in an indirect manner [61]. Another advantage of a path analysis is that it allows researchers to plot a set of hypothetical relationships, which can be directly transformed into the equations needed for analysis.
In our path analysis, we used SOSNPP as a dependent variable to explore the relationship between the internal factors of different vegetation types of SOSNPP on the Mongolian Plateau. Many researchers have the notion that TEM and PRE tend to directly affect the role of the vegetation NPP. Bao et al., (2019) showed that a summer drought on the Mongolian Plateau had a significant impact on the NPP (R2 = 0.47, p < 0.001) during 1982–2011 [56]. According to Yuan et al., (2021), the NPP is positively correlated with the annual temperature and precipitation time scale [62]. Further, many studies showed that the local temperature and precipitation conditions affect the SMD and snow depth [63,64], which are changes that affect soil moisture in the Mongolian Plateau and the greening of vegetation in spring and interfere with the growth of vegetation in the terrestrial ecosystem [65]. However, these researchers often neglect the indirect effects of temperature and precipitation on the SOSNPP. Therefore, we used three mediator variables, SCFWinter, SMSpring, and SMDSpring, to investigate their indirect effects on the SOSNPP through a path analysis and observed that they exerted different effects on different vegetation types. So, we investigated the effects of these mediator variables on vegetation growth. Prolonged snow cover has adverse effects on vegetation growth the following year [66]. The vegetation growth in different regions was demonstrated to be influenced by the seasonal snow cover duration [67,68]. Grippa et al., (2005) reported that a late snow melting date delays the depletion of soil water in summer, thus delaying and reducing plant water stress [69]. Francon et al., (2020) found that earlier melting dates and the associated late frost exposure lead to radial growth reduction [70].

4.4. SOSNPP Result and Influence Factors

The influence of factors on the SOSNPP in different spatial regions of the Mongolian Plateau varies according to the spatial grey relation degrees. This phenomenon may be attributed to the geographical diversity within the Mongolian Plateau. We used grey relation to analyse the spatial importance of the SOSNPP and found that SMDSpring accounted for 21.11% in the concentrated part of the Mongolian Plateau. In high vegetation coverage areas, snow melting has a stronger effect on the vegetation because the high thermal conductivity developed at the bottom of the snow cover promotes the release of soil heat in the frozen layer, thereby promoting vegetation growth [10,71]. Furthermore, PRESpring accounts for 21.26% of the concentrated part in some specific SOSNPP areas in the Mongolia Plateau. On the whole Mongolia Plateau, the western part is becoming wetter, while the central and eastern parts are becoming drier. The rate of precipitation in the central and eastern parts increases faster than it does in the western part, especially during the dry spring season [72].
When we analysed the factors influencing the SOSNPP of different vegetation types in the Mongolian Plateau, we found that SMDSpring was significantly positively correlated with the SOSNPP throughout the whole Mongolian Plateau, with a large correlation coefficient (Figure 7f). This conclusion is consistent with the findings of a previous study [73] and can be explained by the fact that in cold winters, the snow covering the surface separates the surface vegetation from the air, which plays a role in protecting the vegetation from death caused by strong winds and low temperatures through heat preservation in the plants [34,74]. In addition, the melting of snow provides a water source for plants in spring [72,73]. In our study, SCFWinter is used as a parameter to represent the range of surface snow, and SMDSpring is used as a parameter to represent the snow melting date. These values can well reflect the growth conditions of local plants in spring under natural conditions.
According to the spatial distribution of the SOSNPP, the SOSNPP in more than 21% of the regions we studied is related to precipitation and the snow melting date (Figure 4f). Most of the precipitation in these areas shows a downward trend, indicating that activities of the human population and livestock can compensate for the adverse impact of insufficient precipitation on vegetation to a certain extent. Towards the sustainable development of ecosystems, Mongolia and Inner Mongolia and China have affected appropriate policies and measures. Effective policies have been implemented, with efforts aimed at planting trees, reducing livestock, and promoting fence grazing, and they have reduced the burden of grasslands and the conflict between human beings and the environment. However, 1% of the vegetation has been destroyed by human activities, likely caused by over cultivation, which aggravated the conflict between human land use and vegetation growth [75].
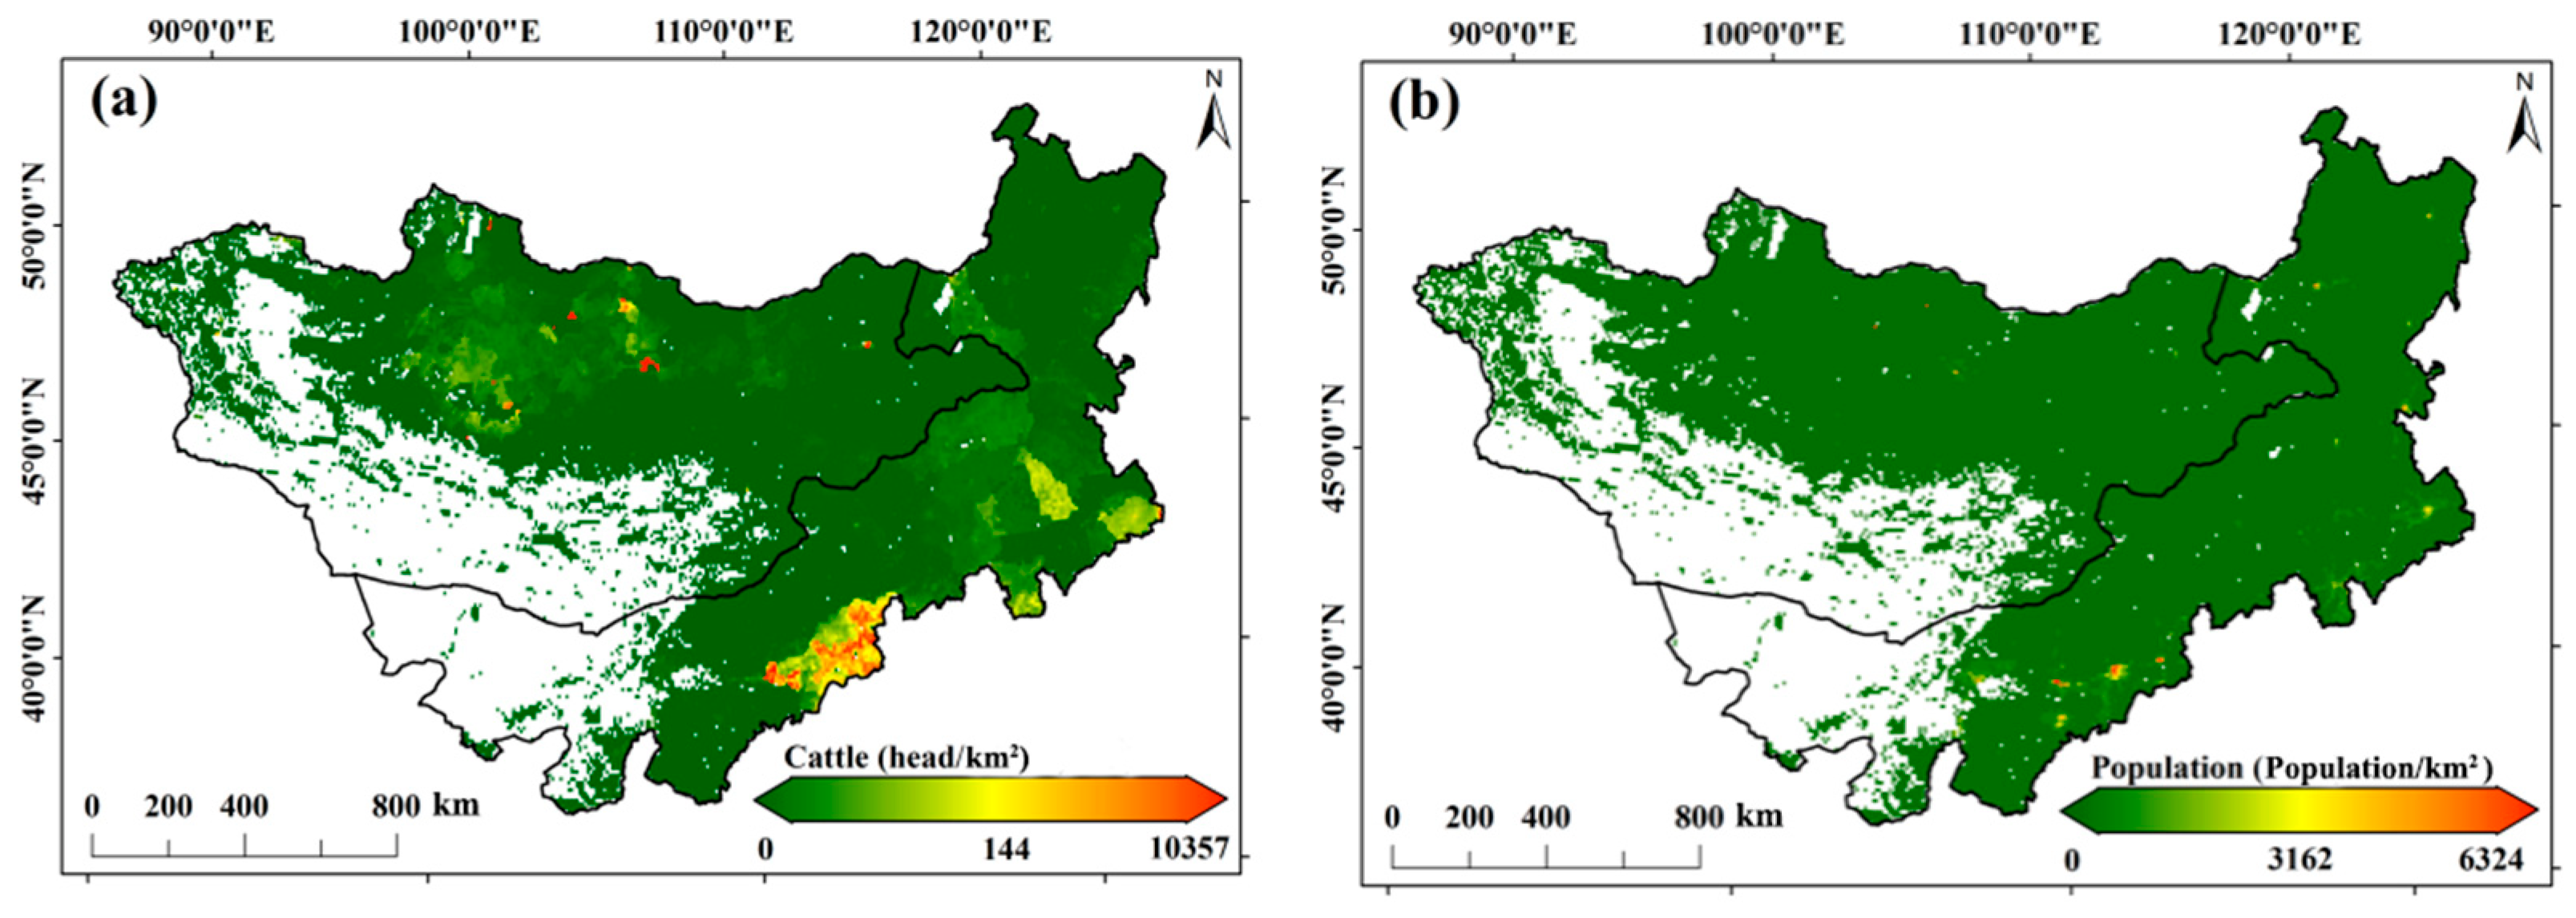
The activities of people and cattle are most affected by human disturbances, although these activities include ecological remediation measures, such as afforestation, grassland remediation, and urban expansion [76]. Figure 7a,b shows the spatial distribution of livestock and population areas in 2010, in which the area with vegetation change caused by human activities overlaps with the SOSNPP.
Figure 7a,b shows the spatial distribution of livestock and human populations on the Mongolian Plateau in 2010, reflecting the trajectory of human grazing activities to some extent. The cattle grazing density in some areas of the Mongolian Plateau is less than 50 heads/km2, and it is mainly concentrated in the southern and eastern parts of the Mongolian Plateau, overlapping with the spatial distribution of the population. This reflects that grazing is one of the primary activities leading to the change in vegetation on the Mongolian Plateau. The livestock population in most pastoral areas of the Mongolian Plateau has been shown to be positively correlated with NPP [31]. The vegetation coverage rate increases by 0.04–0.09% for every 1 percent increase in the livestock population [77]. This change leads to the increase in the NPP in plants, possibly due to the availability of nutrients for plant growth in animal fecal matter. However, though a greater grazing intensity can promote the NPP of plants, this effect is limited between very light and medium grazing [78]. Therefore, appropriate grazing policies have the potential to improve the vegetation yield, which cannot be ignored.
We have observed a stable line between SOSNPP and water-related ecosystem services for a long time, which provides us with a stable SOSNPP threshold with practical significance for guiding ecological restoration policies. However, the correlation between the SOSNPP and its influencing factors changes in different study areas. Additionally, the SOSNPP and its degree of impact will be different for different vegetation types. Therefore, we suggest analysing the constant effect of ecosystem services and its related key influence factors as much as possible under the vegetation conditions of the ecological environment. In addition, the grey correlation degree used in this study can only tell us which factors have an impact on the constraint effect, but they cannot indicate what these effects are. In future research, we should pay more attention to different effects of the vegetation SOSNPP.

5. Conclusions

This study was mainly based on the idea of environmental remote sensing diagnosis. On this basis, the impacts of factors influencing the vegetation SOSNPP in the Mongolian Plateau from 2001 to 2019 were quantitatively analysed, and the path coefficients on different vegetation types were also determined. The main conclusions are as follows:
(1)
Different vegetation types in the whole study area undergo similar changes in the SCFWinter, with a slow downward trend. In terms of spatial distribution, the spatial SCFWinter underwent a significant decrease of −0.2% from 2001 to 2019. The spatial distribution SCFWinter followed a decreasing trend from north to south.
(2)
The vegetation NPP in the broadleaf forest area reached a maximum value of 545.83 g·C/m2 in 2018, and its lowest value was 413.04 g·C/m2 in 2001. In terms of spatial distribution, the spatial NPP showed a significant increase of 1.95 g·C/m2 from 2001 to 2019. The spatial NPP diversity for different types of vegetation is obvious and shows decreasing trend from east to west.
(3)
With a path analysis, we highlight the correlation between the regional hydrothermal coupling relationship. The SOSNPP, TEMSpring, and PRESpring decreased significantly, as reflected in the path coefficients of −0.2 and −0.09 in the broadleaf forest SOSNPP, respectively. The TEMSpring has a significant negative effect on the SOSNPP in the Mongolia Plateau, with a path coefficient of −0.09.
(4)
With grey correlation analysis, it can be seen that different vegetation types have different effects on the SOSNPP in the Mongolian Plateau. The grey correlation degree of PRESpring to the forest vegetation-type SOSNPP reached a maximum of 0.65, and that of SCFWinter to steppe vegetation-type SOSNPP reached a maximum of 0.66. PRESpring, SMDSpring, TEMSpring, SMSpring and SCFWinter accounted for 21.26%, 21.11%, 20.72%, 20.12%, and 16.8% of the whole study area SOSNPP, respectively.

Author Contributions

Conceptualization, methodology, writing—original draft preparation, validation, X.Z.; software, H.Z.; data curation, H.G., C.Y., Y.Z. and H.S.; writing—review and editing, F.M.; visualization, Q.H.; supervision, project administration, C.S.; funding acquisition, C.S., F.M. and M.L. All authors have read and agreed to the published version of the manuscript.

Funding

This research was funded by the National Natural Science Foundation of China, grant numbers (41861014 and 42261079), the Natural Science Foundation of Inner Mongolia Autonomous Region, China (2022MS04004, 2020BS03042, and 2020BS04009), Key research, development and achievement transformation project of Inner Mongolia Autonomous Region (2022YFDZ0061), and Fundamental Research Funds for the Inner Mongolia Normal University (2022JBQN093 and 2022JBBJ014).

Data Availability Statement

Not applicable.

Acknowledgments

All authors would like to thank the editors and anonymous reviewers for their valuable comments and suggestions which improved the quality of the manuscript.

Conflicts of Interest

The authors declare no conflict of interest.

References

  1. Duda, M.P.; John, R.G.; Neal, M.; Gregory, J.R.; William, A.M.; Jennifer, A.K.; David, C.E.; Jules, M.B.; John, P.S. Long-Term Changes in Terrestrial Vegetation Linked to Shifts in a Colonial Seabird Population. Ecosystems 2020, 23, 1643–1656. [Google Scholar] [CrossRef]
  2. Li, L.; Zha, Y.; Zhang, J.; Li, Y.; Lyu, H. Effect of terrestrial vegetation growth on climate change in China. J. Environ. Manag. 2020, 262, 110321. [Google Scholar] [CrossRef] [PubMed]
  3. Zhao, Q.; Hao, X.; Wang, J.; Luo, S.; Shao, D.; Li, H.; Feng, T.; Zhao, H. Snow Cover Phenology Change and Response to Climate in China during 2000–2020. Remote Sens. 2022, 14, 3936. [Google Scholar] [CrossRef]
  4. Raza, A.; Razzaq, A.; Mehmood, S.S.; Zou, X.; Zhang, X.; Lv, Y.; Xu, J. Impact of Climate Change on Crops Adaptation and Strategies to Tackle Its Outcome: A Review. Plants 2019, 30, 34. [Google Scholar] [CrossRef] [Green Version]
  5. Numata, S.; Yamaguchi, K.; Shimizu, M.; Sakurai, G.; Morimoto, A.; Alias, N.; Azman, N.Z.N.; Satake, A. Impacts of climate change on reproductive phenology in tropical rainforests of Southeast Asia. Commun. Biol. 2022, 5, 311. [Google Scholar] [CrossRef]
  6. Stolaroff, J.K.; Pang, S.H.; Li, W.; Kirkendall, W.G.; Goldstein, H.M.; Aines, R.D.; Baker, S.E. Transport Cost for Carbon Removal Projects With Biomass and CO2 Storage. Front. Energy Res. 2021, 9, 639943. [Google Scholar] [CrossRef]
  7. Brown, R.D.; Mote, P.W. The Response of Northern Hemisphere Snow Cover to a Changing Climate. J. Clim. 2009, 22, 2124–2145. [Google Scholar] [CrossRef]
  8. Gong, G.; Entekhabi, D.; Cohen, J.; Robinson, D. Sensitivity of atmospheric response to modeled snow anomaly characteristics. J. Geophys. Res. Atmos. 2004, 109, D06107. [Google Scholar] [CrossRef] [Green Version]
  9. Assmann, J.J.; Myers-Smith, I.H.; Phillimore, A.B.; Bjorkman, A.D.; Ennos, R.E.; Prevéy, J.S.; Henry, G.H.R.; Schmidt, N.M.; Hollister, R.D. Local snow melt and temperature—But not regional sea ice—Explain variation in spring phenology in coastal Arctic tundra. Glob. Change Biol. 2019, 25, 2258–2274. [Google Scholar] [CrossRef] [Green Version]
  10. Musselman, K.N.; Molotch, N.P.; Brooks, P.D. Effects of vegetation on snow accumulation and ablation in a mid-latitude sub-alpine forest. Hydrol. Process. 2008, 22, 2767–2776. [Google Scholar] [CrossRef]
  11. Zhang, Y.; Wang, S.; Barr, A.G.; Black, T.A. Impact of snow cover on soil temperature and its simulation in a boreal aspen forest. Cold Reg. Sci. Technol. 2008, 52, 355–370. [Google Scholar] [CrossRef]
  12. Zheng, J.; Jia, G.; Xu, X. Earlier snowmelt predominates advanced spring vegetation greenup in Alaska. Agric. For. Meteorol. 2022, 315, 108828. [Google Scholar] [CrossRef]
  13. Wang, J.; Brown, D.G.; Chen, J. Drivers of the dynamics in net primary productivity across ecological zones on the Mongolian Plateau. Landsc. Ecol. 2013, 28, 725–739. [Google Scholar] [CrossRef]
  14. Liu, Y.; Fang, Y.; Li, D.; Margulis, S.A. How Well do Global Snow Products Characterize Snow Storage in High Mountain Asia? Geophys. Res. Lett. 2022, 49, e2022GL100082. [Google Scholar] [CrossRef]
  15. Sa, C.; Meng, F.; Luo, M.; Li, C.; Wang, M.; Adiya, S.; Bao, Y. Spatiotemporal variation in snow cover and its effects on grassland phenology on the Mongolian Plateau. J. Arid. Land 2021, 13, 332–349. [Google Scholar] [CrossRef]
  16. Ni-Meister, W.; Gao, H. Assessing the impacts of vegetation heterogeneity on energy fluxes and snowmelt in boreal forests. J. Plant Ecol. 2011, 4, 37–47. [Google Scholar] [CrossRef]
  17. Li, Y.; Fu, Q.; Li, T.; Liu, D.; Hou, R.; Li, Q.; Yi, J.; Li, M.; Meng, F. Snow melting water infiltration mechanism of farmland freezing-thawing soil and determination of meltwater infiltration parameter in seasonal frozen soil areas. Agric. Water Manag. 2021, 258, 107165. [Google Scholar] [CrossRef]
  18. Wang, L.X.; Gao, J.X.; Shen, W.M.; Shi, Y.L.; Zhang, H.W. Carbon storage in vegetation and soil in Chinese ecosystems estimated by carbon transfer rate method. Ecosphere 2021, 12, e03341. [Google Scholar] [CrossRef]
  19. Whittaker, R.H. Estimation of Net Primary Production of Forest and Shrub Communities. Ecology 1961, 42, 177–180. [Google Scholar] [CrossRef]
  20. Rupp, R.S.; Deroche, S.E. Standing Crops of Fishes in Three Small Lakes Compared with C14 Estimates of Net Primary Productivity. Trans. Am. Fish. Soc. 1965, 94, 9–25. [Google Scholar] [CrossRef]
  21. Hao, R.; Yu, D.; Huang, T.; Li, S.; Qiao, J. NPP plays a constraining role on water-related ecosystem services in an alpine ecosystem of Qinghai, China. Ecol. Indic. 2022, 138, 108846. [Google Scholar] [CrossRef]
  22. Xu, H.J.; Wang, X.P. Effects of altered precipitation regimes on plant productivity in the arid region of northern China. Ecol. Inform. 2016, 31, 137–146. [Google Scholar] [CrossRef]
  23. Yin, C.; Luo, M.; Meng, F.; Sa, C.; Yuan, Z.; Bao, Y. Contributions of Climatic and Anthropogenic Drivers to Net Primary Productivity of Vegetation in the Mongolian Plateau. Remote Sens. 2022, 14, 3383. [Google Scholar] [CrossRef]
  24. Hart, R.; Salick, J.; Ranjitkar, S.; Xu, J. Herbarium specimens show contrasting phenological responses to Himalayan climate. Proc. Natl. Acad. Sci. USA 2014, 111, 10615–10619. [Google Scholar] [CrossRef] [PubMed] [Green Version]
  25. Tenaw, G.; Jebessa Debella, H. Climate change and its effects on vegetation phenology across ecoregions of Ethiopia. Glob. Ecol. Conserv. 2017, 13, e00366. [Google Scholar] [CrossRef]
  26. Ding, M.; Li, L.; Zhang, Y.; Sun, X.; Liu, L.; Gao, J.; Wang, Z.; Li, Y. Start of vegetation growing season on the Tibetan Plateau inferred from multiple methods based on GIMMS and SPOT NDVI data. J. Geogr. Sci. 2015, 25, 131–148. [Google Scholar] [CrossRef]
  27. Moulin, S.; Kergoat, L.; Viovy, N.; Dedieu, G. Global-Scale Assessment of Vegetation Phenology Using NOAA/AVHRR Satellite Measurements. J. Clim. 1997, 10, 1154–1170. [Google Scholar] [CrossRef]
  28. Myneni, R.; Keeling, C.; Tucker, C.; Asrar, G.; Nemani, R. Increased Plant Growth in the Northern High Latitudes from 1981 to 1991. Nature 1997, 386, 698–702. [Google Scholar] [CrossRef]
  29. Jeong, S.J.; Ho, C.H.; Gim, H.J.; Brown, M.E. Phenology shifts at start vs. end of growing season in temperate vegetation over the Northern Hemisphere for the period 1982–2008. Glob. Change Biol. 2011, 17, 2385–2399. [Google Scholar] [CrossRef]
  30. Gao, S.; Liang, E.; Liu, R.; Babst, F.; Camarero, J.J.; Fu, Y.H.; Piao, S.; Rossi, S.; Shen, M.; Wang, T.; et al. An earlier start of the thermal growing season enhances tree growth in cold humid areas but not in dry areas. Nat. Ecol. Evol. 2022, 6, 397–404. [Google Scholar] [CrossRef]
  31. Pulliainen, J.; Aurela, M.; Laurila, T.; Aalto, T.; Takala, M.; Salminen, M.; Kulmala, M.; Barr, A.; Heimann, M.; Lindroth, A.; et al. Early snowmelt significantly enhances boreal springtime carbon uptake. Proc. Natl. Acad. Sci. USA 2017, 114, 11081–11086. [Google Scholar] [CrossRef] [Green Version]
  32. Qi, Y.; Wang, H.; Ma, X.; Zhang, J.; Yang, R. Relationship between vegetation phenology and snow cover changes during 2001–2018 in the Qilian Mountains. Ecol. Indic. 2021, 133, 108351. [Google Scholar] [CrossRef]
  33. Yu, Z.; Liu, S.; Wang, J.; Sun, P.; Liu, W.; Hartley, D.S. Effects of seasonal snow on the growing season of temperate vegetation in China. Glob. Change Biol. 2013, 19, 2182–2195. [Google Scholar] [CrossRef]
  34. Chen, X.; Liang, S.; Cao, Y.; He, T.; Wang, D. Observed contrast changes in snow cover phenology in northern middle and high latitudes from 2001–2014. Sci. Rep. 2015, 5, 16820. [Google Scholar] [CrossRef] [Green Version]
  35. Rihan, W.; Zhao, J.; Zhang, H.; Guo, X.; Ying, H.; Deng, G.; Li, H. Wildfires on the Mongolian Plateau: Identifying Drivers and Spatial Distributions to Predict Wildfire Probability. Remote Sens. 2019, 11, 2361. [Google Scholar] [CrossRef] [Green Version]
  36. Zhao, X.; Hu, H.; Shen, H.; Zhou, D.; Zhou, L.; Myneni, R.B.; Fang, J. Satellite-indicated long-term vegetation changes and their drivers on the Mongolian Plateau. Landsc. Ecol. 2015, 30, 1599–1611. [Google Scholar] [CrossRef]
  37. Sun, Y.; Zhang, T.; Liu, Y.; Zhao, W.; Huang, X. Assessing Snow Phenology over the Large Part of Eurasia Using Satellite Observations from 2000 to 2016. Remote Sens. 2020, 12, 2060. [Google Scholar] [CrossRef]
  38. Ryu, Y.; Jiang, C.; Kobayashi, H.; Detto, M. MODIS-derived global land products of shortwave radiation and diffuse and total photosynthetically active radiation at 5km resolution from 2000. Remote Sens. Environ. 2018, 204, 812–825. [Google Scholar] [CrossRef]
  39. Riggs, G.; Barton, J.; Casey, K.; Hall, D.; Salomonson, V. MODIS snow products user guide. NASA Goddard Space Flight Cent. Rep. 2006, 80, 1–45. [Google Scholar]
  40. Potter, C.S.; Randerson, J.T.; Field, C.B.; Matson, P.A.; Vitousek, P.M.; Mooney, H.A.; Klooster, S.A. Terrestrial ecosystem production: A process model based on global satellite and surface data. Glob. Biogeochem. Cycles 1993, 7, 811–841. [Google Scholar] [CrossRef]
  41. Ayiomamitis, A. Logistic curve fitting and parameter estimation using nonlinear noniterative least-squares regression analysis. Comput. Biomed. Res. 1986, 19, 142–150. [Google Scholar] [CrossRef] [PubMed]
  42. Vorobiova, N.; Chernov, A. Curve fitting of MODIS NDVI time series in the task of early crops identification by satellite images. Procedia Eng. 2017, 201, 184–195. [Google Scholar] [CrossRef]
  43. Stage, F.; Carter, H.; Nora, A. Path Analysis: An Introduction and Analysis of a Decade of Research. J. Educ. Res. 2004, 98, 5–13. [Google Scholar] [CrossRef]
  44. Vasconcelos, A.G.G.; Almeida, R.M.V.; Nobre, F.F. The Path Analysis Approach for the Multivariate Analysis of Infant Mortality Data. Ann. Epidemiol. 1998, 8, 262–271. [Google Scholar] [CrossRef]
  45. Dai, J.; Liu, X.; Hu, F. Research and application for grey relational analysis in multigranularity based on normality grey number. Sci. World J. 2014, 2014, 312645. [Google Scholar] [CrossRef] [Green Version]
  46. Wang, X. Application of Grey Relation Analysis Theory to Choose High Reliability of the Network Node. J. Phys. Conf. Ser. 2019, 1237, 032056. [Google Scholar] [CrossRef] [Green Version]
  47. Huang, Y.; Shen, L.; Liu, H. Grey relational analysis, principal component analysis and forecasting of carbon emissions based on long short-term memory in China. J. Clean. Prod. 2019, 209, 415–423. [Google Scholar] [CrossRef]
  48. Tang, Z.; Deng, G.; Hu, G.; Zhang, H.; Pan, H.; Sang, G. Satellite observed spatiotemporal variability of snow cover and snow phenology over high mountain Asia from 2002 to 2021. J. Hydrol. 2022, 613, 128438. [Google Scholar] [CrossRef]
  49. Ersi, C.; Bayaer, T.; Bao, Y.; Bao, Y.; Yong, M.; Lai, Q.; Zhang, X.; Zhang, Y. Comparison of Phenological Parameters Extracted from SIF, NDVI and NIRv Data on the Mongolian Plateau. Remote Sens. 2023, 15, 187. [Google Scholar] [CrossRef]
  50. Jing, Y.; Shen, H.; Li, X.; Guan, X. A Two-Stage Fusion Framework to Generate a Spatio–Temporally Continuous MODIS NDSI Product over the Tibetan Plateau. Remote Sens. 2019, 11, 2261. [Google Scholar] [CrossRef] [Green Version]
  51. Dietz, A.J.; Wohner, C.; Kuenzer, C. European Snow Cover Characteristics between 2000 and 2011 Derived from Improved MODIS Daily Snow Cover Products. Remote Sens. 2012, 4, 2432–2454. [Google Scholar] [CrossRef] [Green Version]
  52. Tang, Z.; Wang, J.; Li, H.; Yan, L. Spatiotemporal changes of snow cover over the Tibetan plateau based on cloud-removed moderate resolution imaging spectroradiometer fractional snow cover product from 2001 to 2011. J. Appl. Remote. Sens. 2013, 7, 3582. [Google Scholar] [CrossRef]
  53. Hao, X.; Huang, G.; Zheng, Z.; Sun, X.; Ji, W.; Zhao, H.; Wang, J.; Li, H.; Wang, X. Development and validation of a new MODIS snow-cover-extent product over China. Hydrol. Earth Syst. Sci. 2022, 26, 1937–1952. [Google Scholar] [CrossRef]
  54. Jin, H.; Bao, G.; Chen, J.Q.; Chopping, M.; Jin, E.; Mandakh, U.; Jiang, K.; Huang, X.J.; Bao, Y.H.; Vandansambuu, B. Modifying the maximal light-use efficiency for enhancing predictions of vegetation net primary productivity on the Mongolian Plateau. Int. J. Remote Sens. 2020, 41, 3740–3760. [Google Scholar] [CrossRef]
  55. Gang, C.; Zhao, W.; Zhao, T.; Zhang, Y.; Gao, X.; Wen, Z. The impacts of land conversion and management measures on the grassland net primary productivity over the Loess Plateau, Northern China. Sci. Total Environ. 2018, 645, 827–836. [Google Scholar] [CrossRef]
  56. Bao, G.; Chen, J.; Chopping, M.; Bao, Y.; Bayarsaikhan, S.; Dorjsuren, A.; Tuya, A.; Jirigala, B.; Qin, Z. Dynamics of net primary productivity on the Mongolian Plateau: Joint regulations of phenology and drought. Int. J. Appl. Earth Obs. Geoinf. 2019, 81, 85–97. [Google Scholar] [CrossRef]
  57. Miao, L.; Müller, D.; Cui, X.; Ma, M. Changes in vegetation phenology on the Mongolian Plateau and their climatic determinants. PloS ONE 2017, 12, e0190313. [Google Scholar] [CrossRef] [Green Version]
  58. Zeng, L.; Wardlow, B.D.; Xiang, D.; Hu, S.; Li, D. A review of vegetation phenological metrics extraction using time-series, multispectral satellite data. Remote Sens. Environ. 2020, 237, 111511. [Google Scholar] [CrossRef]
  59. Wang, J.; Sun, H.; Xiong, J.; He, D.; Cheng, W.; Ye, C.; Yong, Z.; Huang, X. Dynamics and Drivers of Vegetation Phenology in Three-River Headwaters Region Based on the Google Earth Engine. Remote Sens. 2021, 13, 2528. [Google Scholar] [CrossRef]
  60. Li, N.; Zhan, P.; Pan, Y.; Zhu, X.; Li, M.; Zhang, D. Comparison of Remote Sensing Time-Series Smoothing Methods for Grassland Spring Phenology Extraction on the Qinghai–Tibetan Plateau. Remote. Sens. 2020, 12, 3383. [Google Scholar] [CrossRef]
  61. Baron, R.M.; Kenny, D.A. The moderator-mediator variable distinction in social psychological research: Conceptual, strategic, and statistical considerations. J. Personal. Soc. Psychol. 1986, 51, 1173–1182. [Google Scholar] [CrossRef] [PubMed]
  62. Yuan, Z.; Wang, Y.; Xu, J.; Wu, Z. Effects of climatic factors on the net primary productivity in the source region of Yangtze River, China. Sci. Rep. 2021, 11, 1376. [Google Scholar] [CrossRef] [PubMed]
  63. Guo, L.; Li, L. Variation of the proportion of precipitation occurring as snow in the Tian Shan Mountains, China. Int. J. Climatol. 2015, 35, 1379–1393. [Google Scholar] [CrossRef]
  64. Ke, C.Q.; Li, X.C.; Xie, H.; Ma, D.H.; Liu, X.; Kou, C. Variability in snow cover phenology in China from 1952 to 2010. Hydrol. Earth Syst. Sci. 2016, 20, 755–770. [Google Scholar] [CrossRef] [Green Version]
  65. Han, F.; Zhang, Q.; Buyantuev, A.; Niu, J.; Liu, P.; Li, X.; Kang, S.; Zhang, J.; Chang, C.; Li, Y. Effects of climate change on phenology and primary productivity in the desert steppe of Inner Mongolia. J. Arid. Land 2015, 7, 251–263. [Google Scholar] [CrossRef]
  66. Wan, Y.F.; Gao, Q.Z.; Li, Y.; Qin, X.B.; Ganjurjav; Zhang, W.N.; Ma, X.; Liu, S. Change of Snow Cover and Its Impact on Alpine Vegetation in the Source Regions of Large Rivers on the Qinghai-Tibetan Plateau, China. Arct. Antarct. Alp. Res. 2014, 46, 632–644. [Google Scholar] [CrossRef] [Green Version]
  67. Unterholzner, L.; Prendin, A.L.; Dibona, R.; Menardi, R.; Casolo, V.; Gargiulo, S.; Boscutti, F.; Carrer, M. Transient Effects of Snow Cover Duration on Primary Growth and Leaf Traits in a Tundra Shrub. Front. Plant Sci. 2022, 13, 822901. [Google Scholar] [CrossRef]
  68. Li, C.; Leal Filho, W.; Wang, J.; Fudjumdjum, H.; Fedoruk, M.; Hu, R.; Yin, S.; Bao, Y.; Yu, S.; Hunt, J. An Analysis of Precipitation Extremes in the Inner Mongolian Plateau: Spatial-Temporal Patterns, Causes, and Implications. Atmosphere 2018, 9, 322. [Google Scholar] [CrossRef] [Green Version]
  69. Grippa, M.; Kergoat, L.; Le Toan, T.; Mognard, N.M.; Delbart, N.; L’Hermitte, J.; Vicente-Serrano, S.M. The impact of snow depth and snowmelt on the vegetation variability over central Siberia. Geophys. Res. Lett. 2005, 32, L21412. [Google Scholar] [CrossRef]
  70. Francon, L.; Corona, C.; Till-Bottraud, I.; Choler, P.; Carlson, B.Z.; Charrier, G.; Améglio, T.; Morin, S.; Eckert, N.; Roussel, E.; et al. Assessing the effects of earlier snow melt-out on alpine shrub growth: The sooner the better? Ecol. Indic. 2020, 115, 106455. [Google Scholar] [CrossRef]
  71. Barrere, M.; Domine, F.; Belke-Brea, M.; Sarrazin, D. Snowmelt Events in Autumn Can Reduce or Cancel the Soil Warming Effect of Snow–Vegetation Interactions in the Arctic. J. Clim. 2018, 31, 9507–9518. [Google Scholar] [CrossRef]
  72. Gao, R.; Li, F.; Wang, X.; Liu, T.; Du, D.; Bai, Y. Spatiotemporal variations in precipitation across the Chinese Mongolian plateau over the past half century. Atmos. Res. 2017, 193, 204–215. [Google Scholar] [CrossRef]
  73. Wang, X.; Wang, T.; Guo, H.; Liu, D.; Zhao, Y.; Zhang, T.; Liu, Q.; Piao, S. Disentangling the mechanisms behind winter snow impact on vegetation activity in northern ecosystems. Glob. Change Biol. 2018, 24, 1651–1662. [Google Scholar] [CrossRef]
  74. Qiao, D.; Wang, N. Relationship between Winter Snow Cover Dynamics, Climate and Spring Grassland Vegetation Phenology in Inner Mongolia, China. ISPRS Int. J. Geo-Inf. 2019, 8, 42. [Google Scholar] [CrossRef] [Green Version]
  75. Medková, H.; Vačkář, D.; Weinzettel, J. Appropriation of potential net primary production by cropland in terrestrial ecoregions. J. Clean. Prod. 2017, 150, 294–300. [Google Scholar] [CrossRef]
  76. Guo, E.; Wang, Y.; Wang, C.; Sun, Z.; Bao, Y.; Mandula, N.; Jirigala, B.; Bao, Y.; Li, H. NDVI Indicates Long-Term Dynamics of Vegetation and Its Driving Forces from Climatic and Anthropogenic Factors in Mongolian Plateau. Remote Sens. 2021, 13, 688. [Google Scholar] [CrossRef]
  77. Miao, L.; Sun, Z.; Ren, Y.; Schierhorn, F.; Müller, D. Grassland greening on the Mongolian Plateau despite higher grazing intensity. Land Degrad. Dev. 2021, 32, 792–802. [Google Scholar] [CrossRef]
  78. Schönbach, P.; Wan, H.; Gierus, M.; Bai, Y.; Müller, K.; Lin, L.; Susenbeth, A.; Taube, F. Grassland responses to grazing: Effects of grazing intensity and management system in an Inner Mongolian steppe ecosystem. Plant Soil 2011, 340, 103–115. [Google Scholar] [CrossRef]
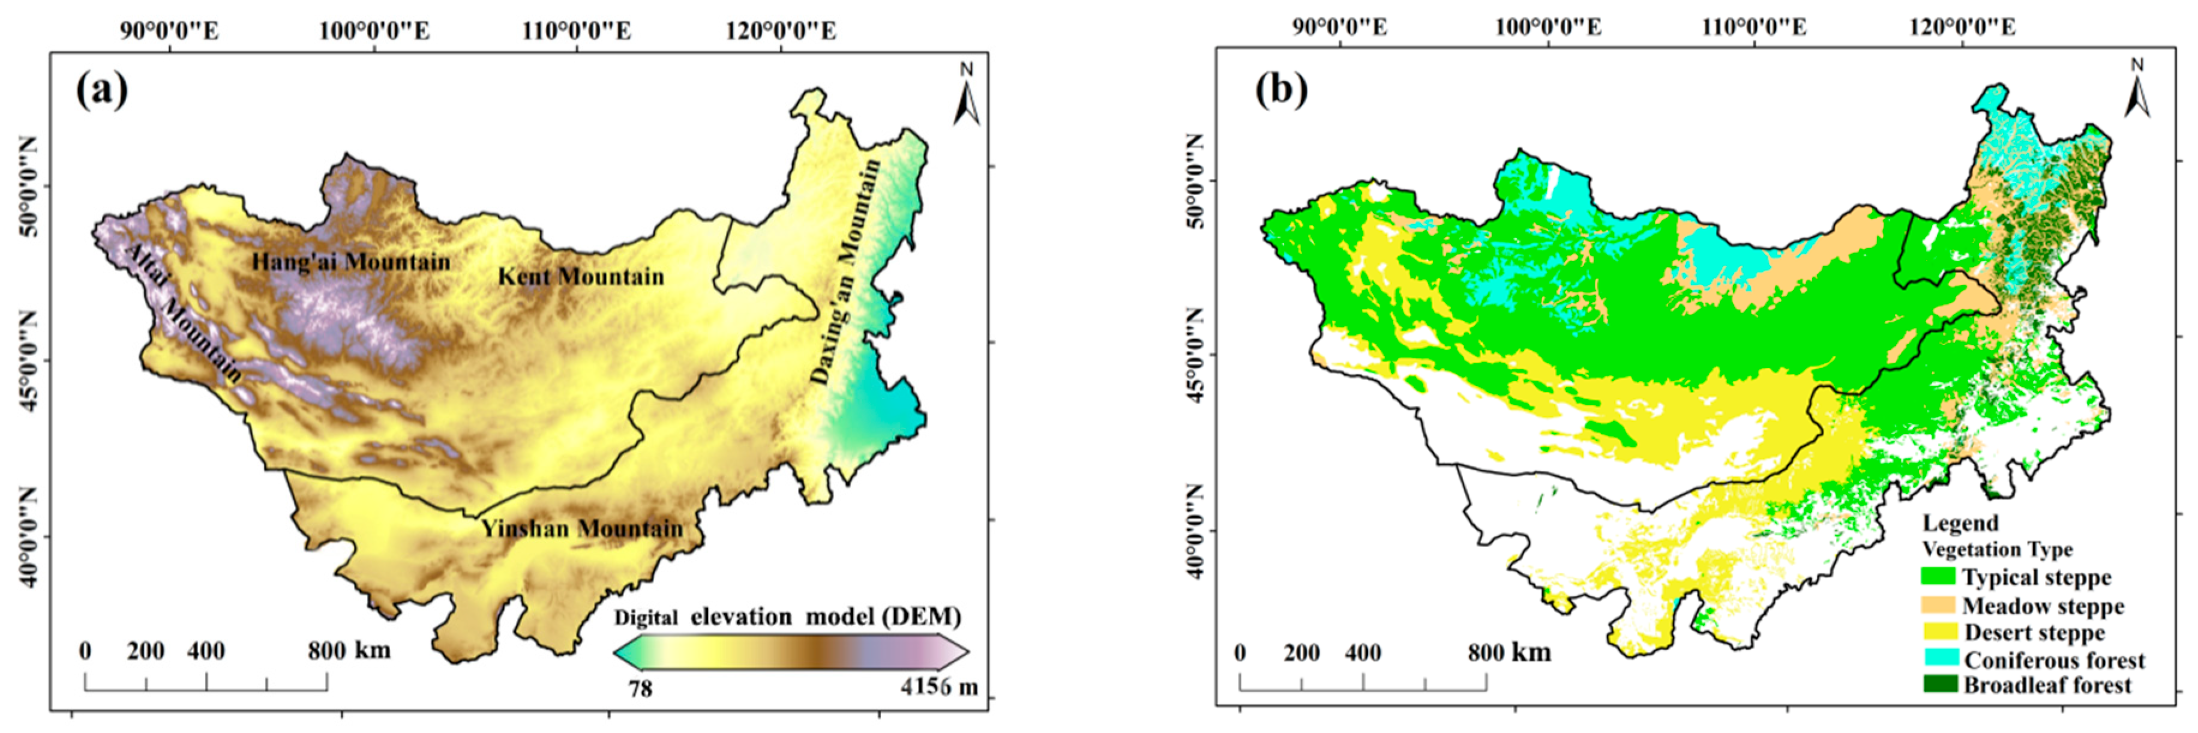
Figure 1. Study area: (a) DEM of the Mongolian Plateau; (b) distribution of different vegetation types.
Remotesensing 15 01245 g001
Figure 2. Different vegetation types of 2001–2019 SCFWinter and SMDSpring over the Mongolia Plateau: (a) SCFWinter change trend; (b) SMDSpring change trend; (c) SCFWinter spatial statistics box plot; (d) SMDSpring spatial statistics box plot; (e) distribution of average SCFWinter spatial map; (f) distribution of average SMDSpring spatial map.
Remotesensing 15 01245 g002
Figure 3. Different vegetation types of 2001–2019 NPP and SOSNPP over the Mongolia Plateau: (a) NPP change trend; (b) SOSNPP change trend; (c) NPP spatial statistics box plot; (d) SOSNPP spatial statistics box plot; (e) spatial map of average NPP distribution; (f) spatial map of average SOSNPP distribution.
Remotesensing 15 01245 g003
Figure 4. Different factors of 2001–2019 grey relation analysis: (a) SOSNPP–TEMSpring; (b) SOSNPP–PRESpring; (c) SOSNPP–SMSpring; (d) SOSNPP–SCFwinter; (e) SOSNPP–SMDSpring; (f) spatial importance analysis.
Remotesensing 15 01245 g004
Figure 5. Different vegetation types of 2001–2019 grey relation grade of SOSNPP.
Remotesensing 15 01245 g005
Figure 6. Different vegetation types of 2001–2019 grey relation grade of SOSNPP.
Remotesensing 15 01245 g006
Figure 7. Distribution map of: (a) livestock and (b) population in the Mongolian Plateau.
Remotesensing 15 01245 g007
Table 1. Different vegetation types on the Mongolian Plateau.
NumberVegetation TypeArea (km2)
1Broadleaf forest124,702.25
2Coniferous forest352,911.00
3Meadow steppe424,664.25
4Typical steppe1,640,985.75
5Desert steppe750,569.75
Table 2. ε m a x of different vegetation types.
NumberVegetation Type ε m a x ( g · C   / MJ )
1Broadleaf forest0.692
2Coniferous forest0.389
3Meadow steppe0.654
4Typical steppe0.553
5Desert steppe0.511
Disclaimer/Publisher’s Note: The statements, opinions and data contained in all publications are solely those of the individual author(s) and contributor(s) and not of MDPI and/or the editor(s). MDPI and/or the editor(s) disclaim responsibility for any injury to people or property resulting from any ideas, methods, instructions or products referred to in the content.