
Derived Profiles of CCN and INP Number Concentrations in the Taklimakan Desert via Combined Polarization Lidar, Sun-Photometer, and Radiosonde Observations

 ,
,  ,
,  , ,
, ,
Abstract

1. Introduction
2. Measurements and Methods
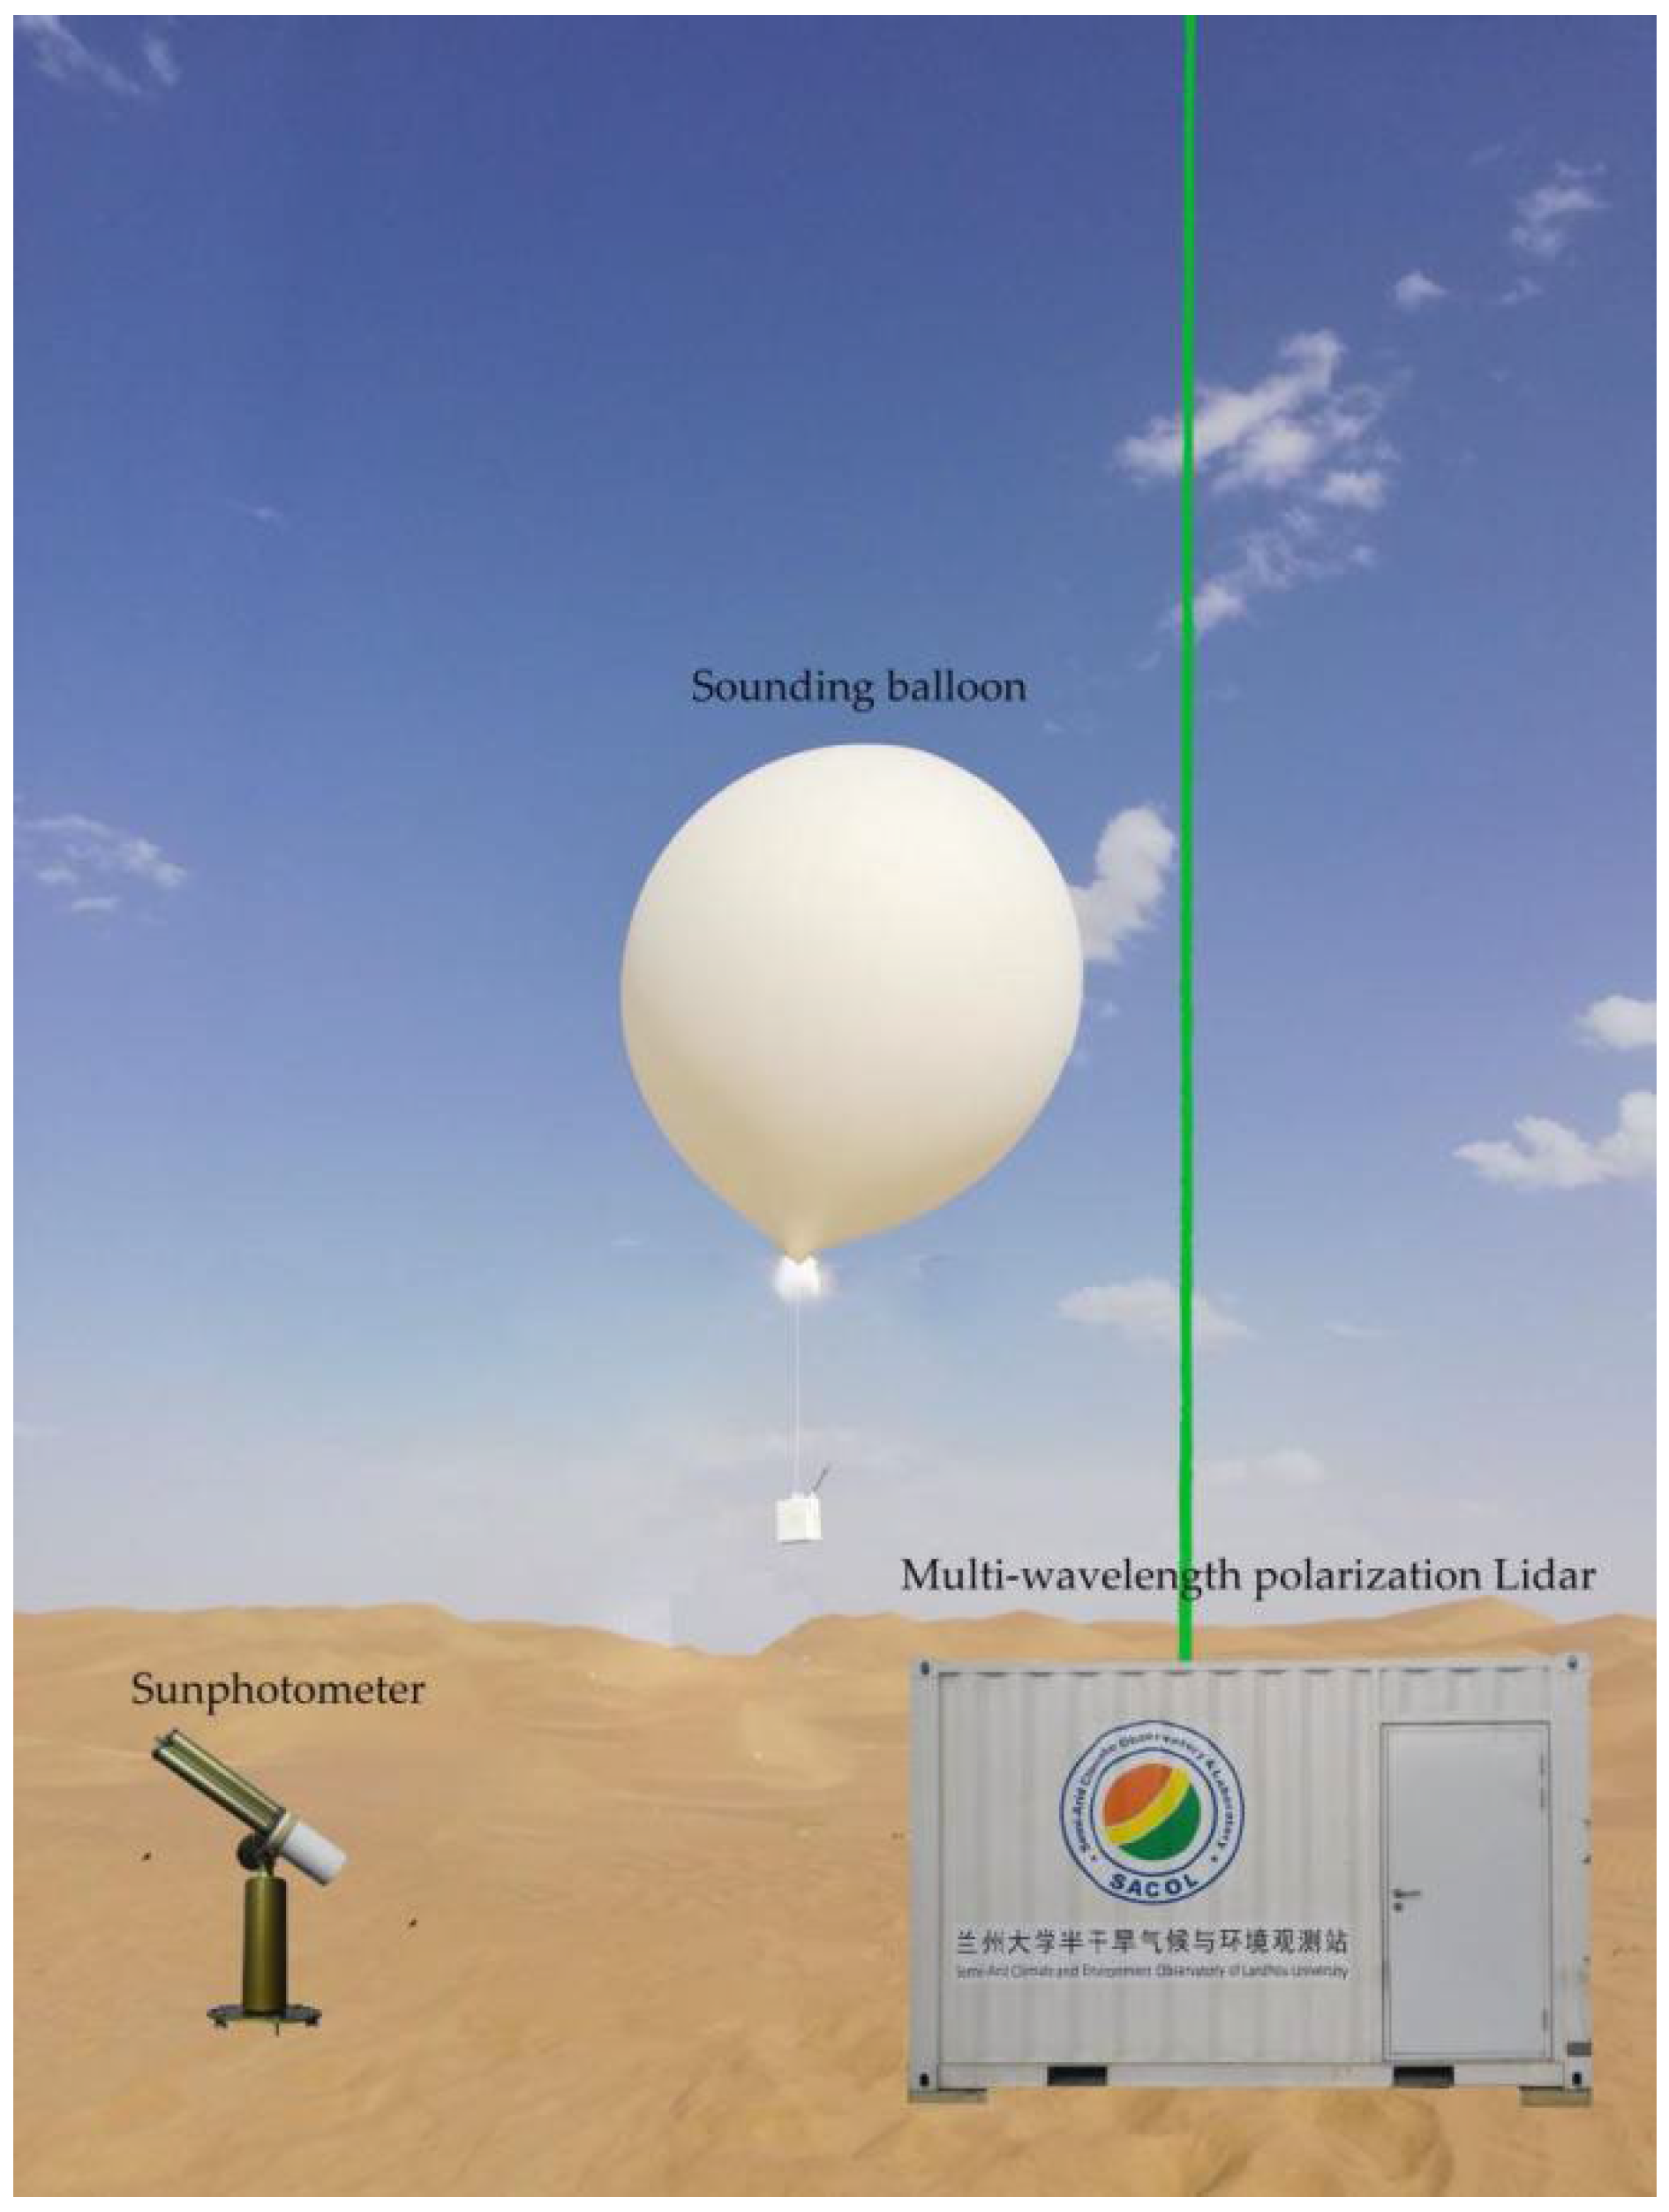
2.1. Polarization Lidar Measurements
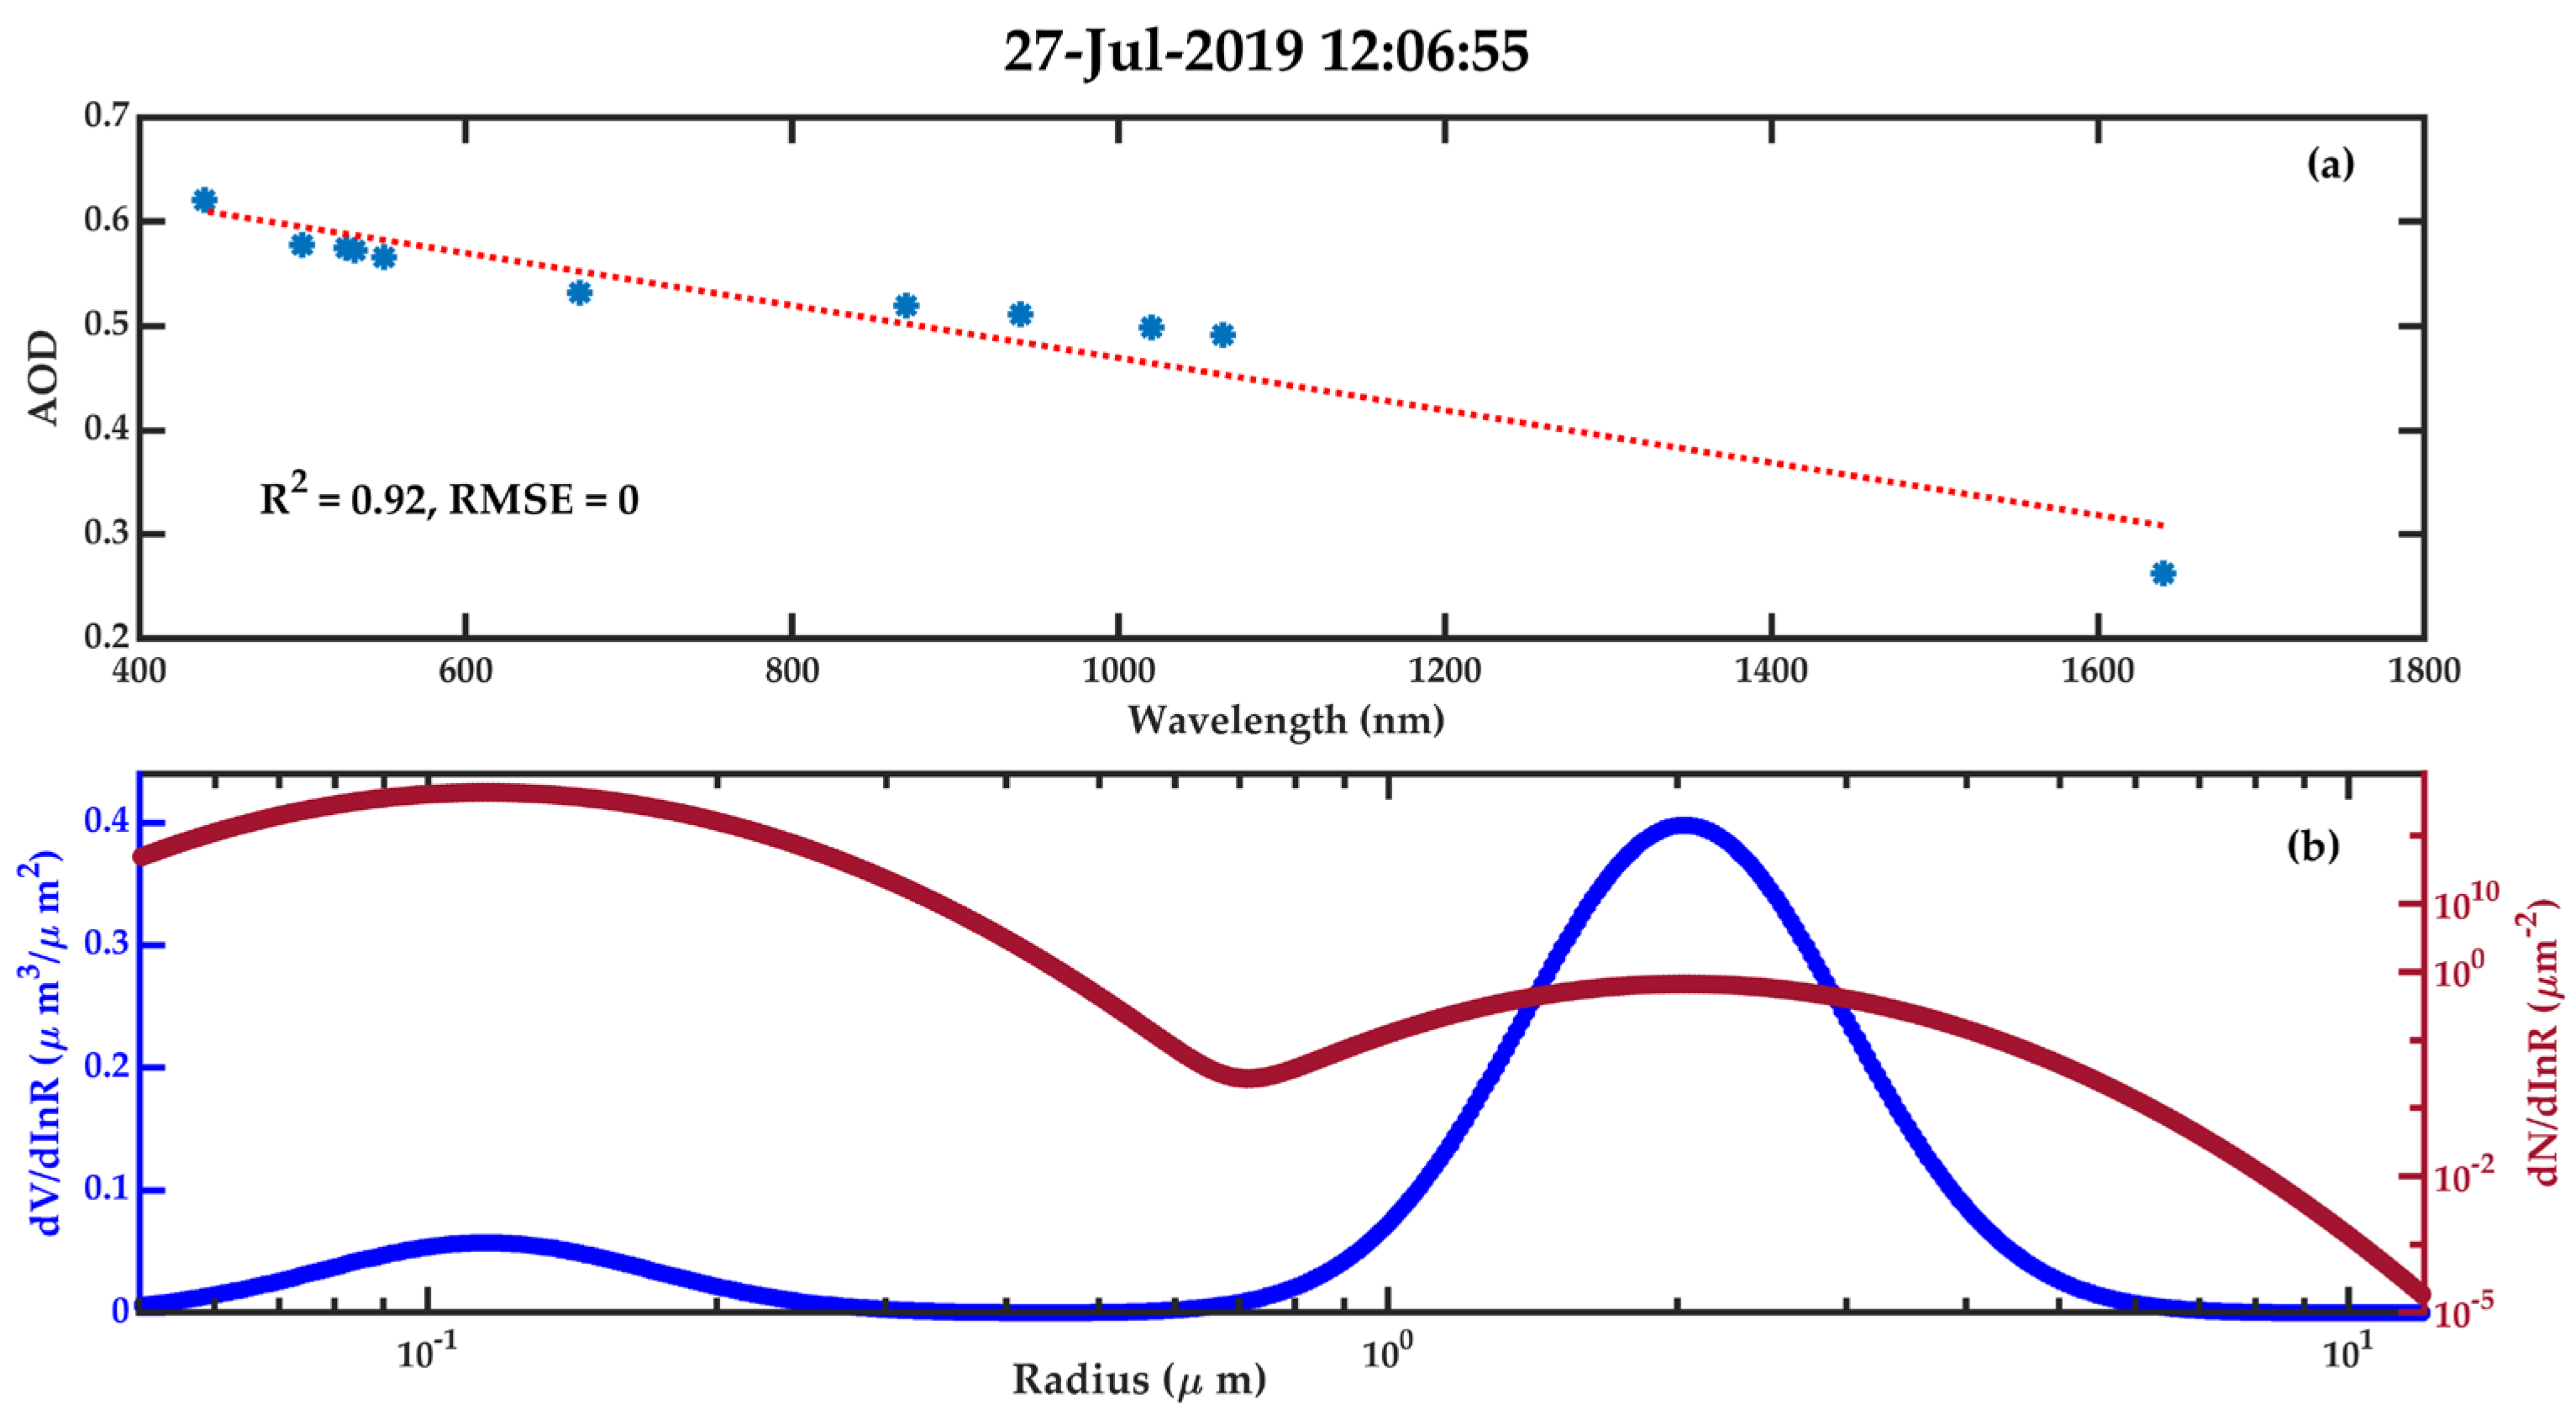
2.2. Sun Photometer Observations
2.3. Radiosonde Sounding Data
2.4. Retrieval Methods
3. Results and Discussion
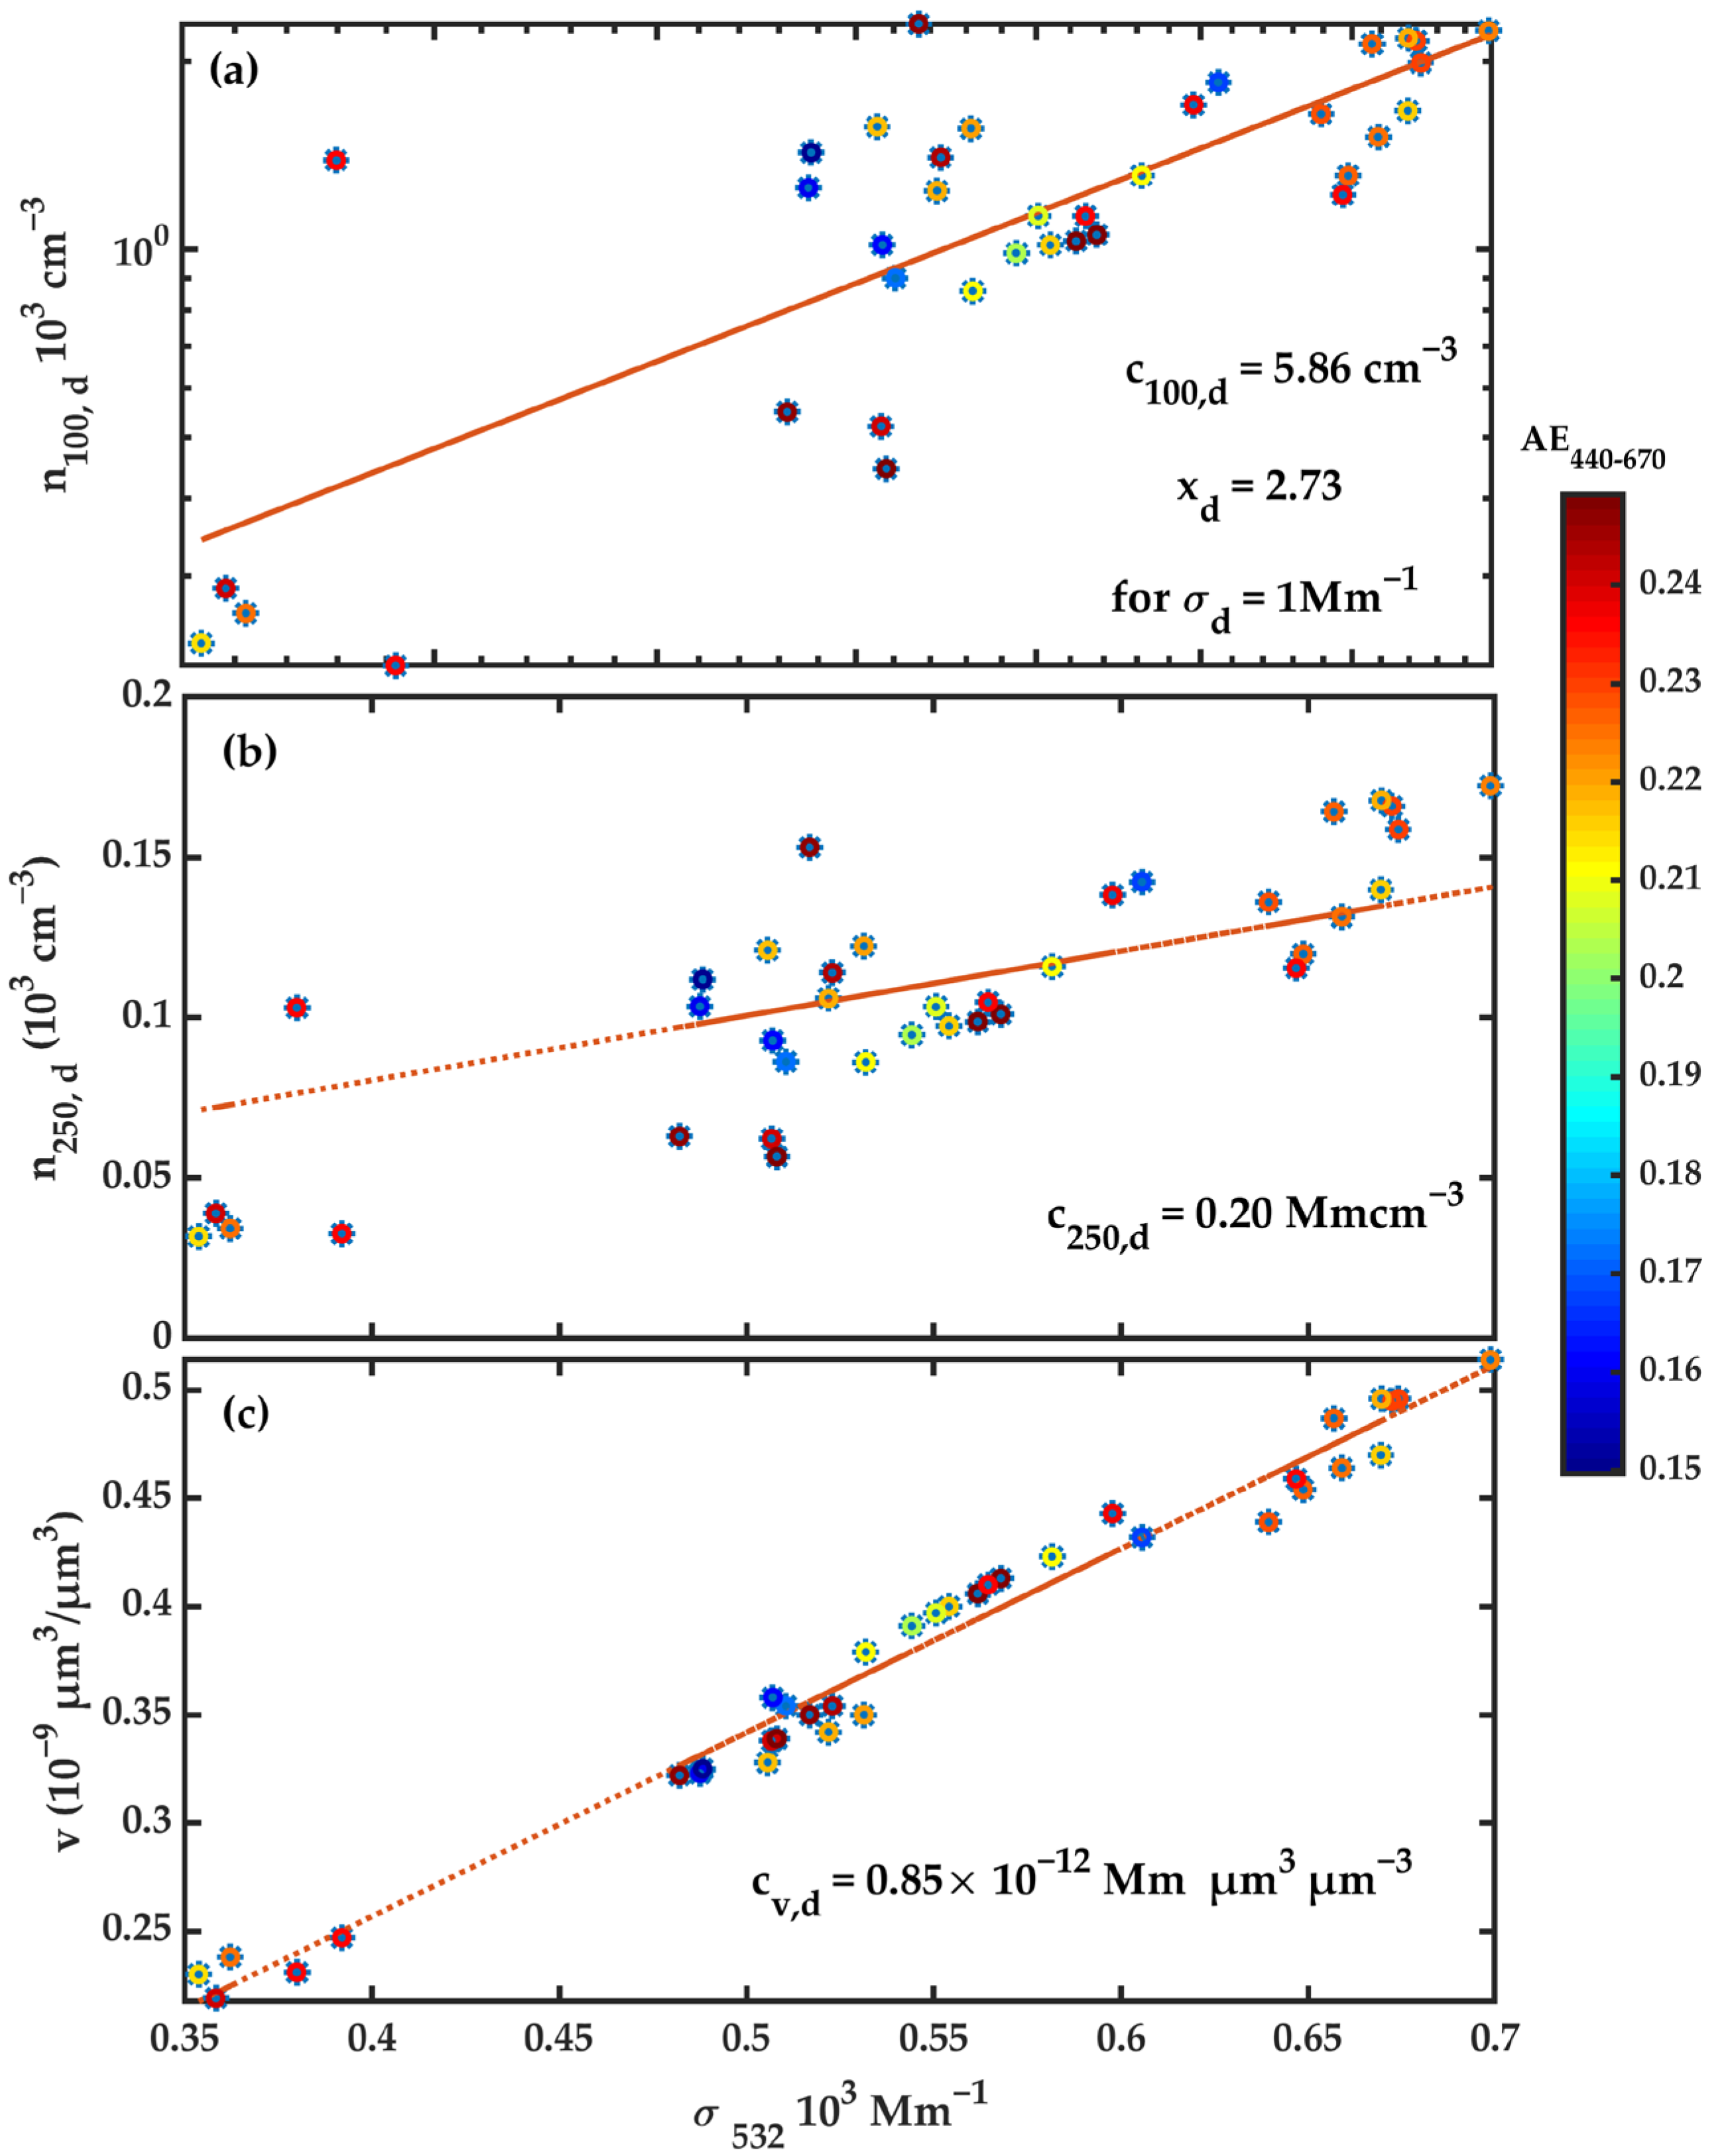
3.1. Polarization Lidar Photometer Networking Conversion Factors over Tazhong
3.2. Vertical Distribution of Clouds, CCN, and INPs in the Presence of Different Pollution Levels
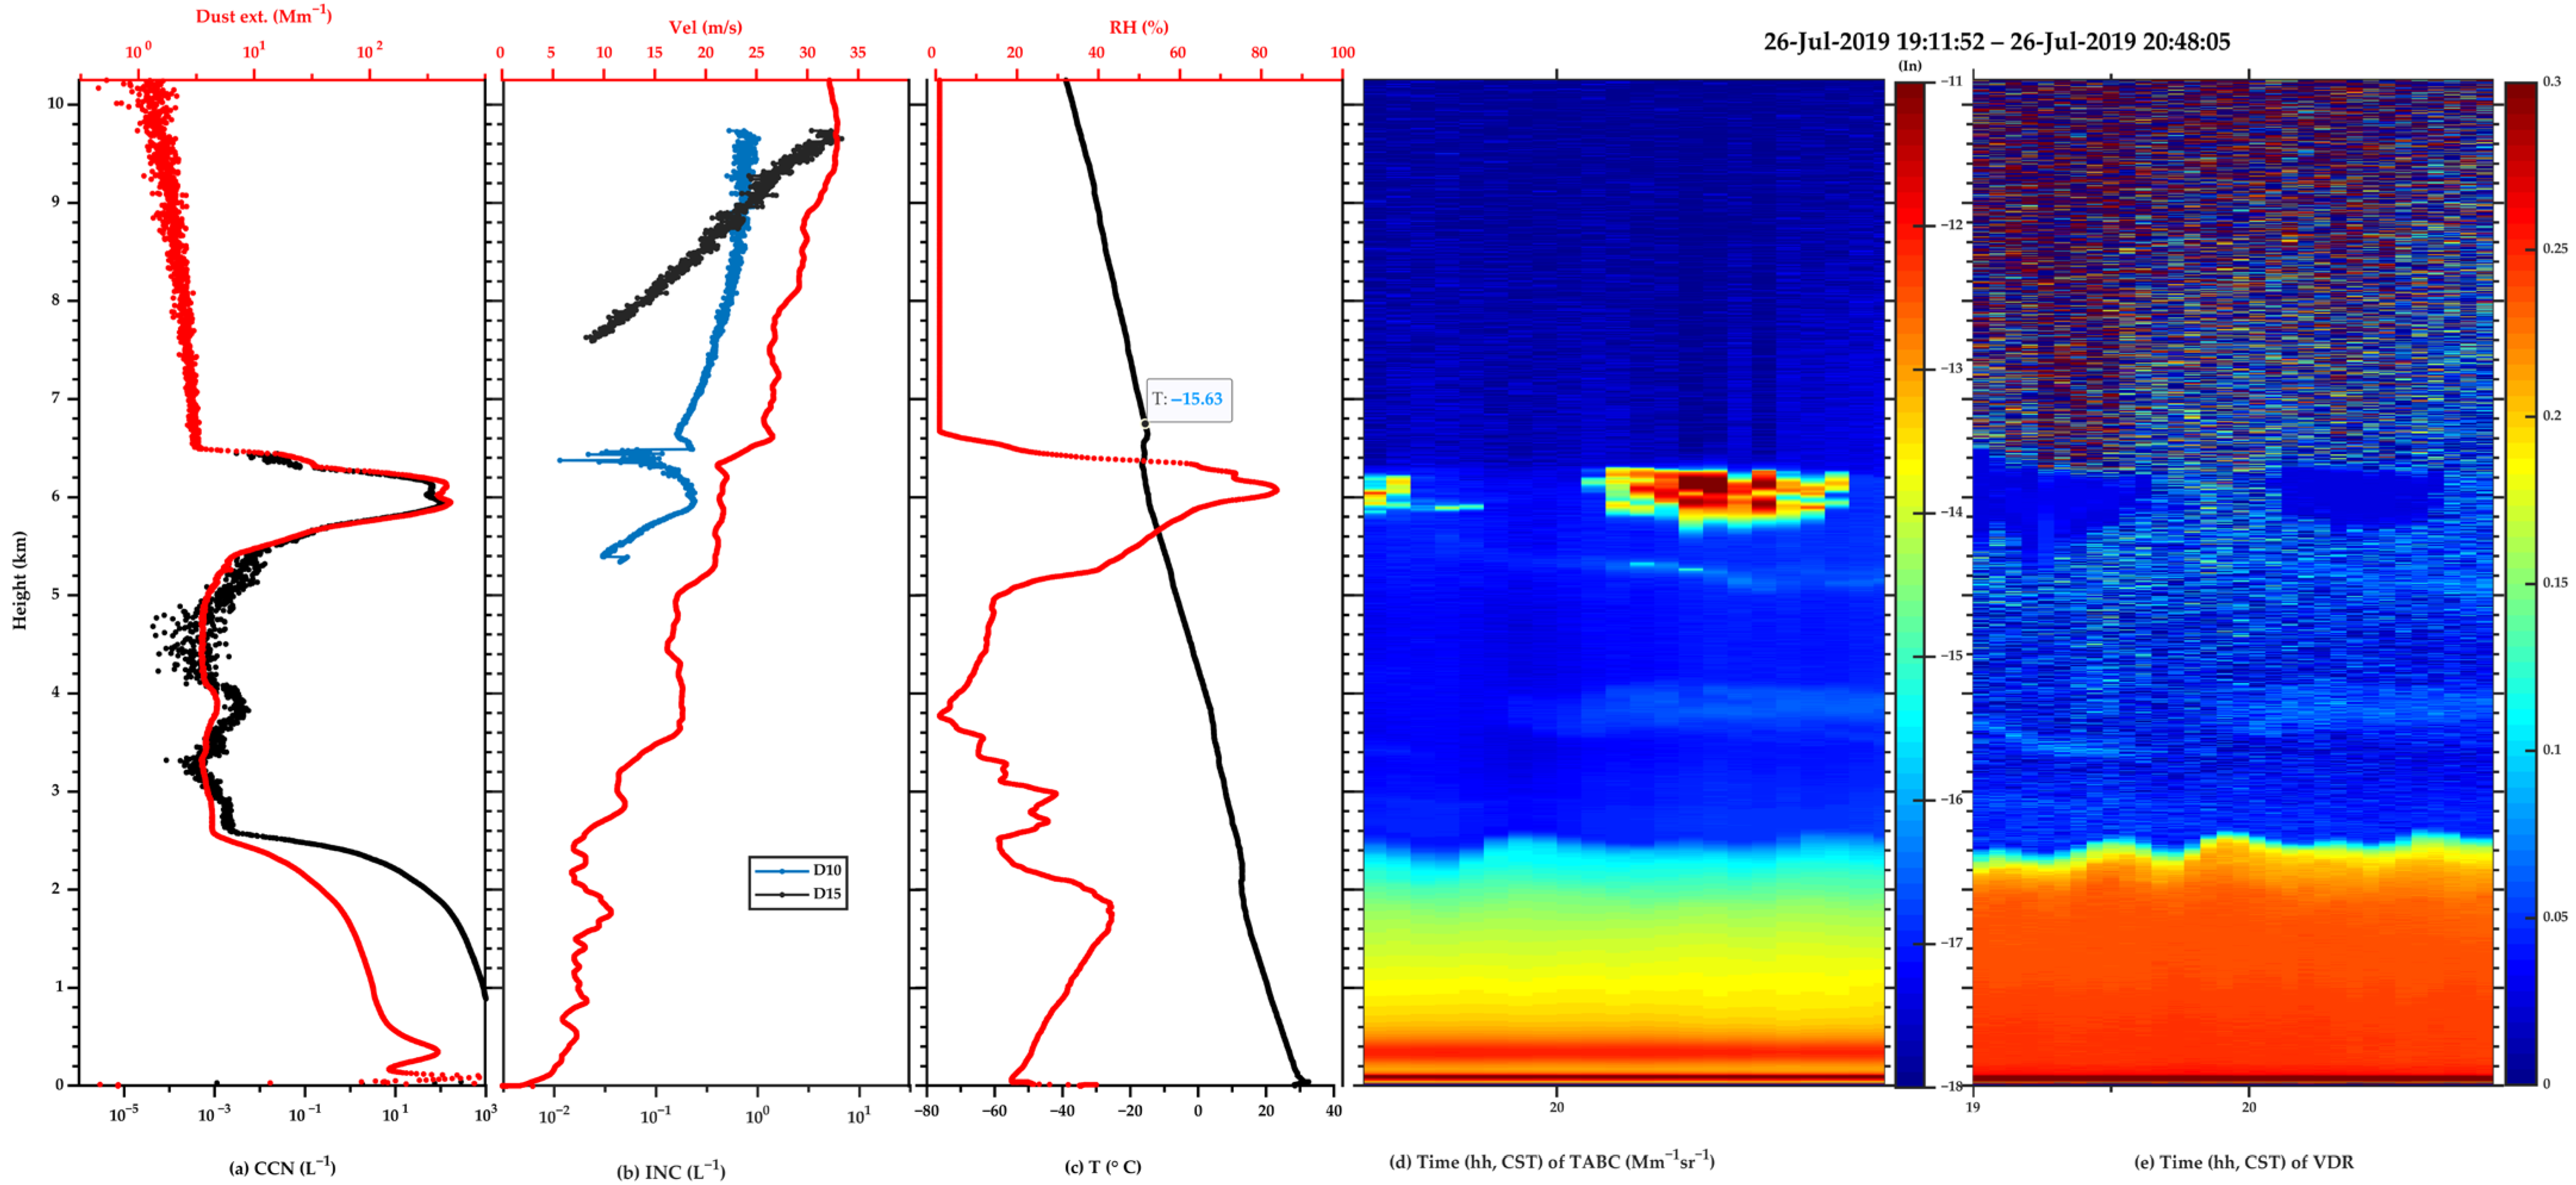
3.2.1. Water Cloud
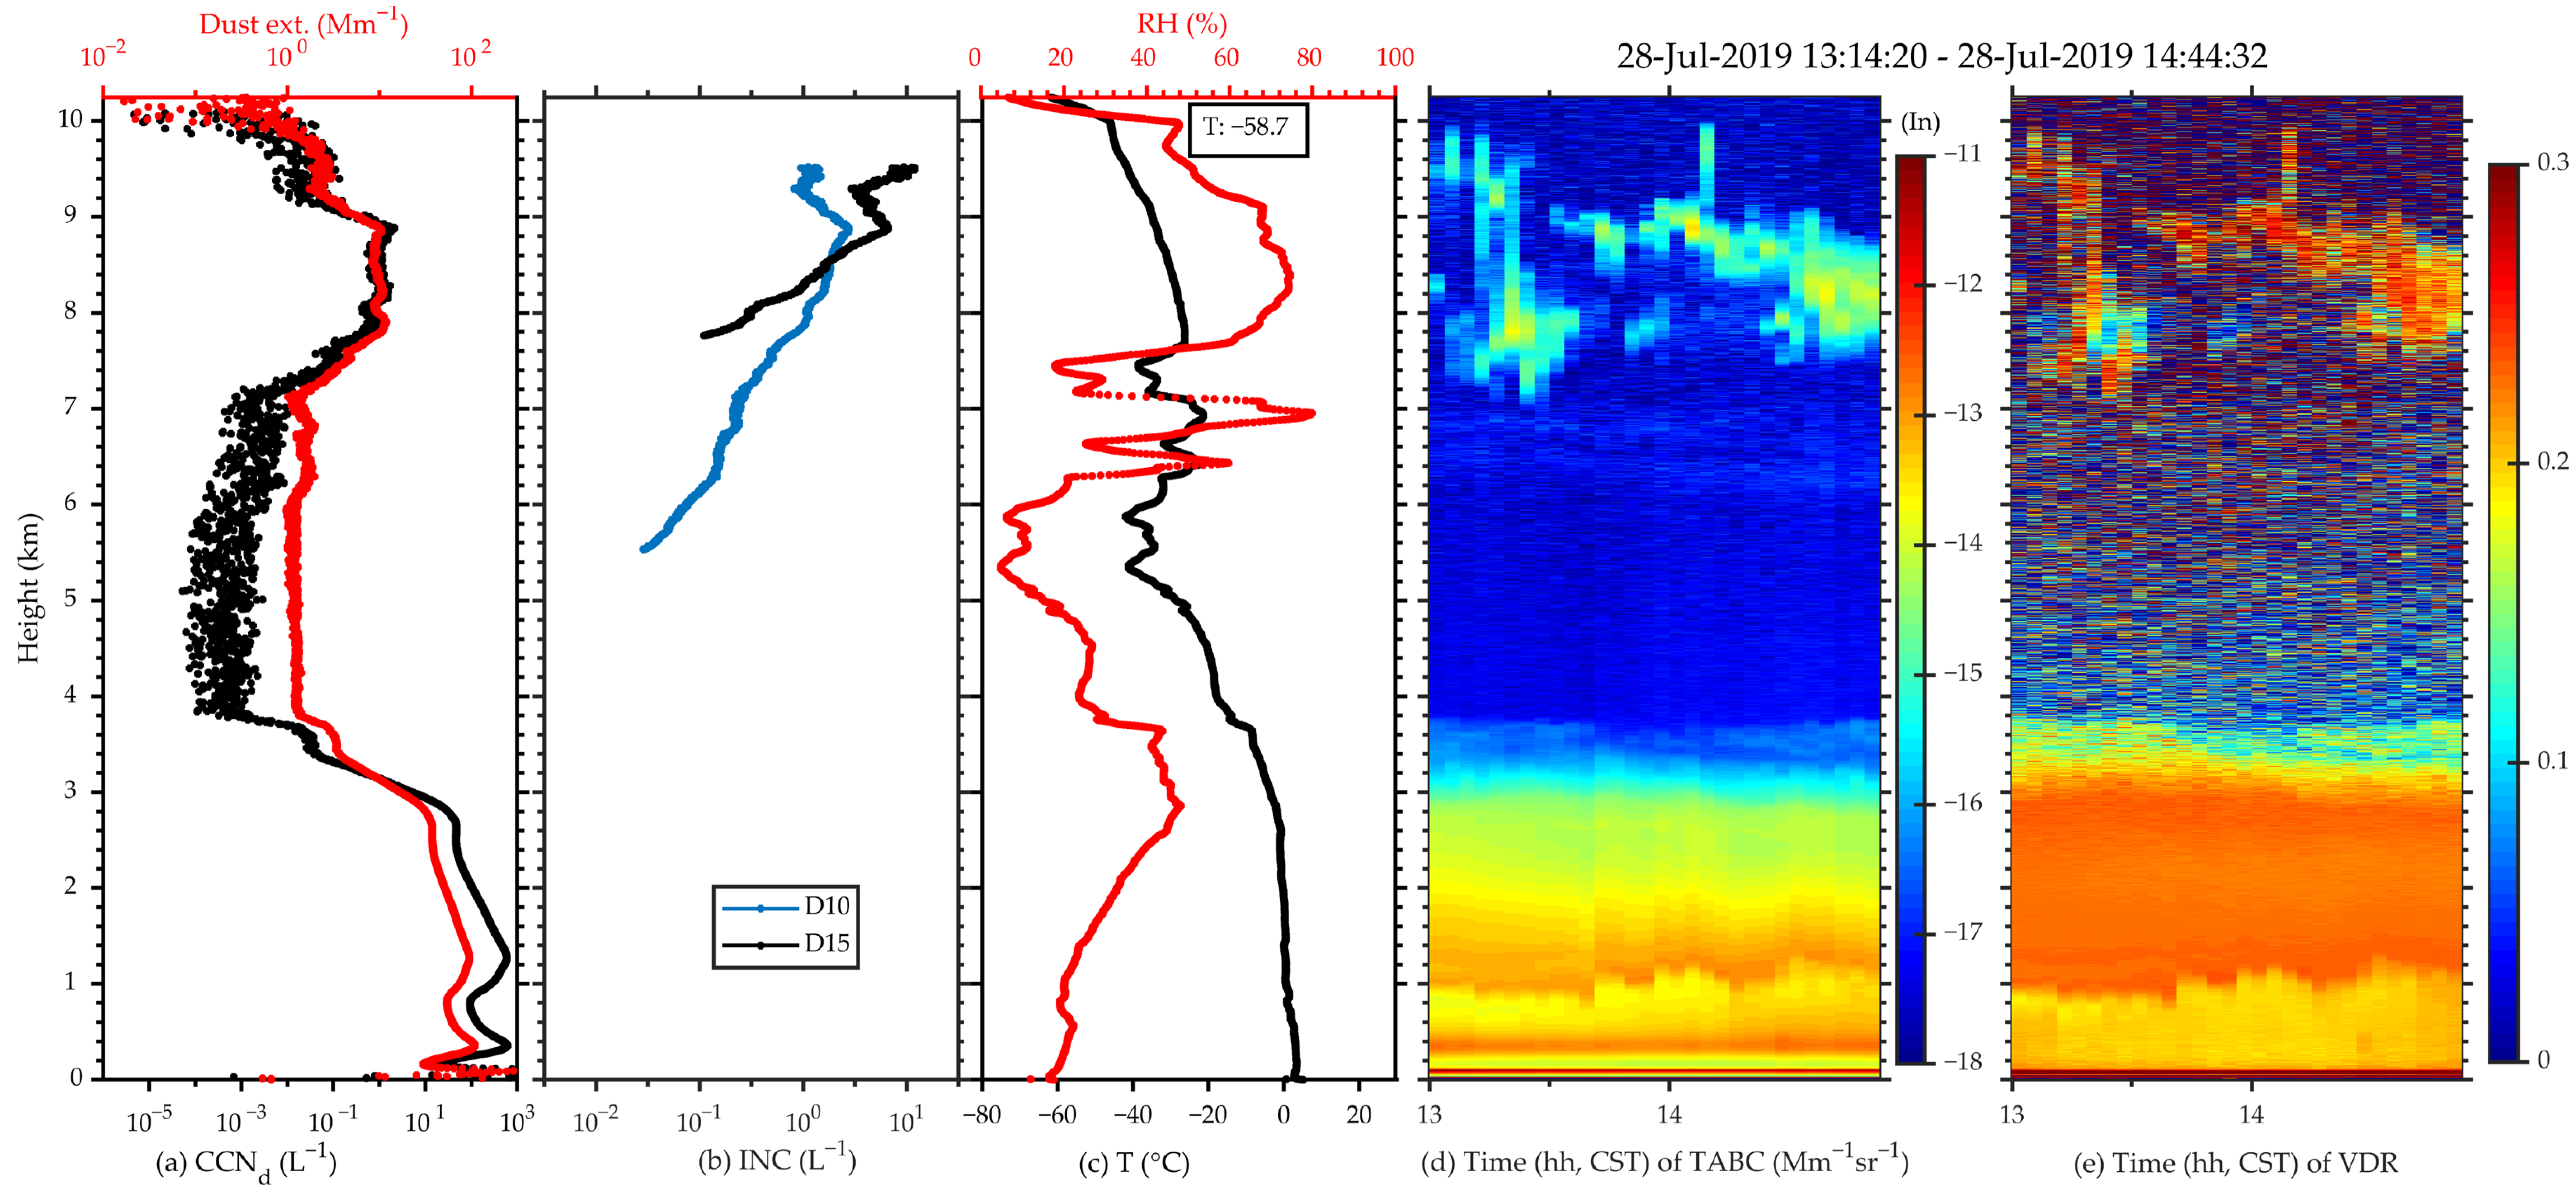
3.2.2. Mixed Cloud
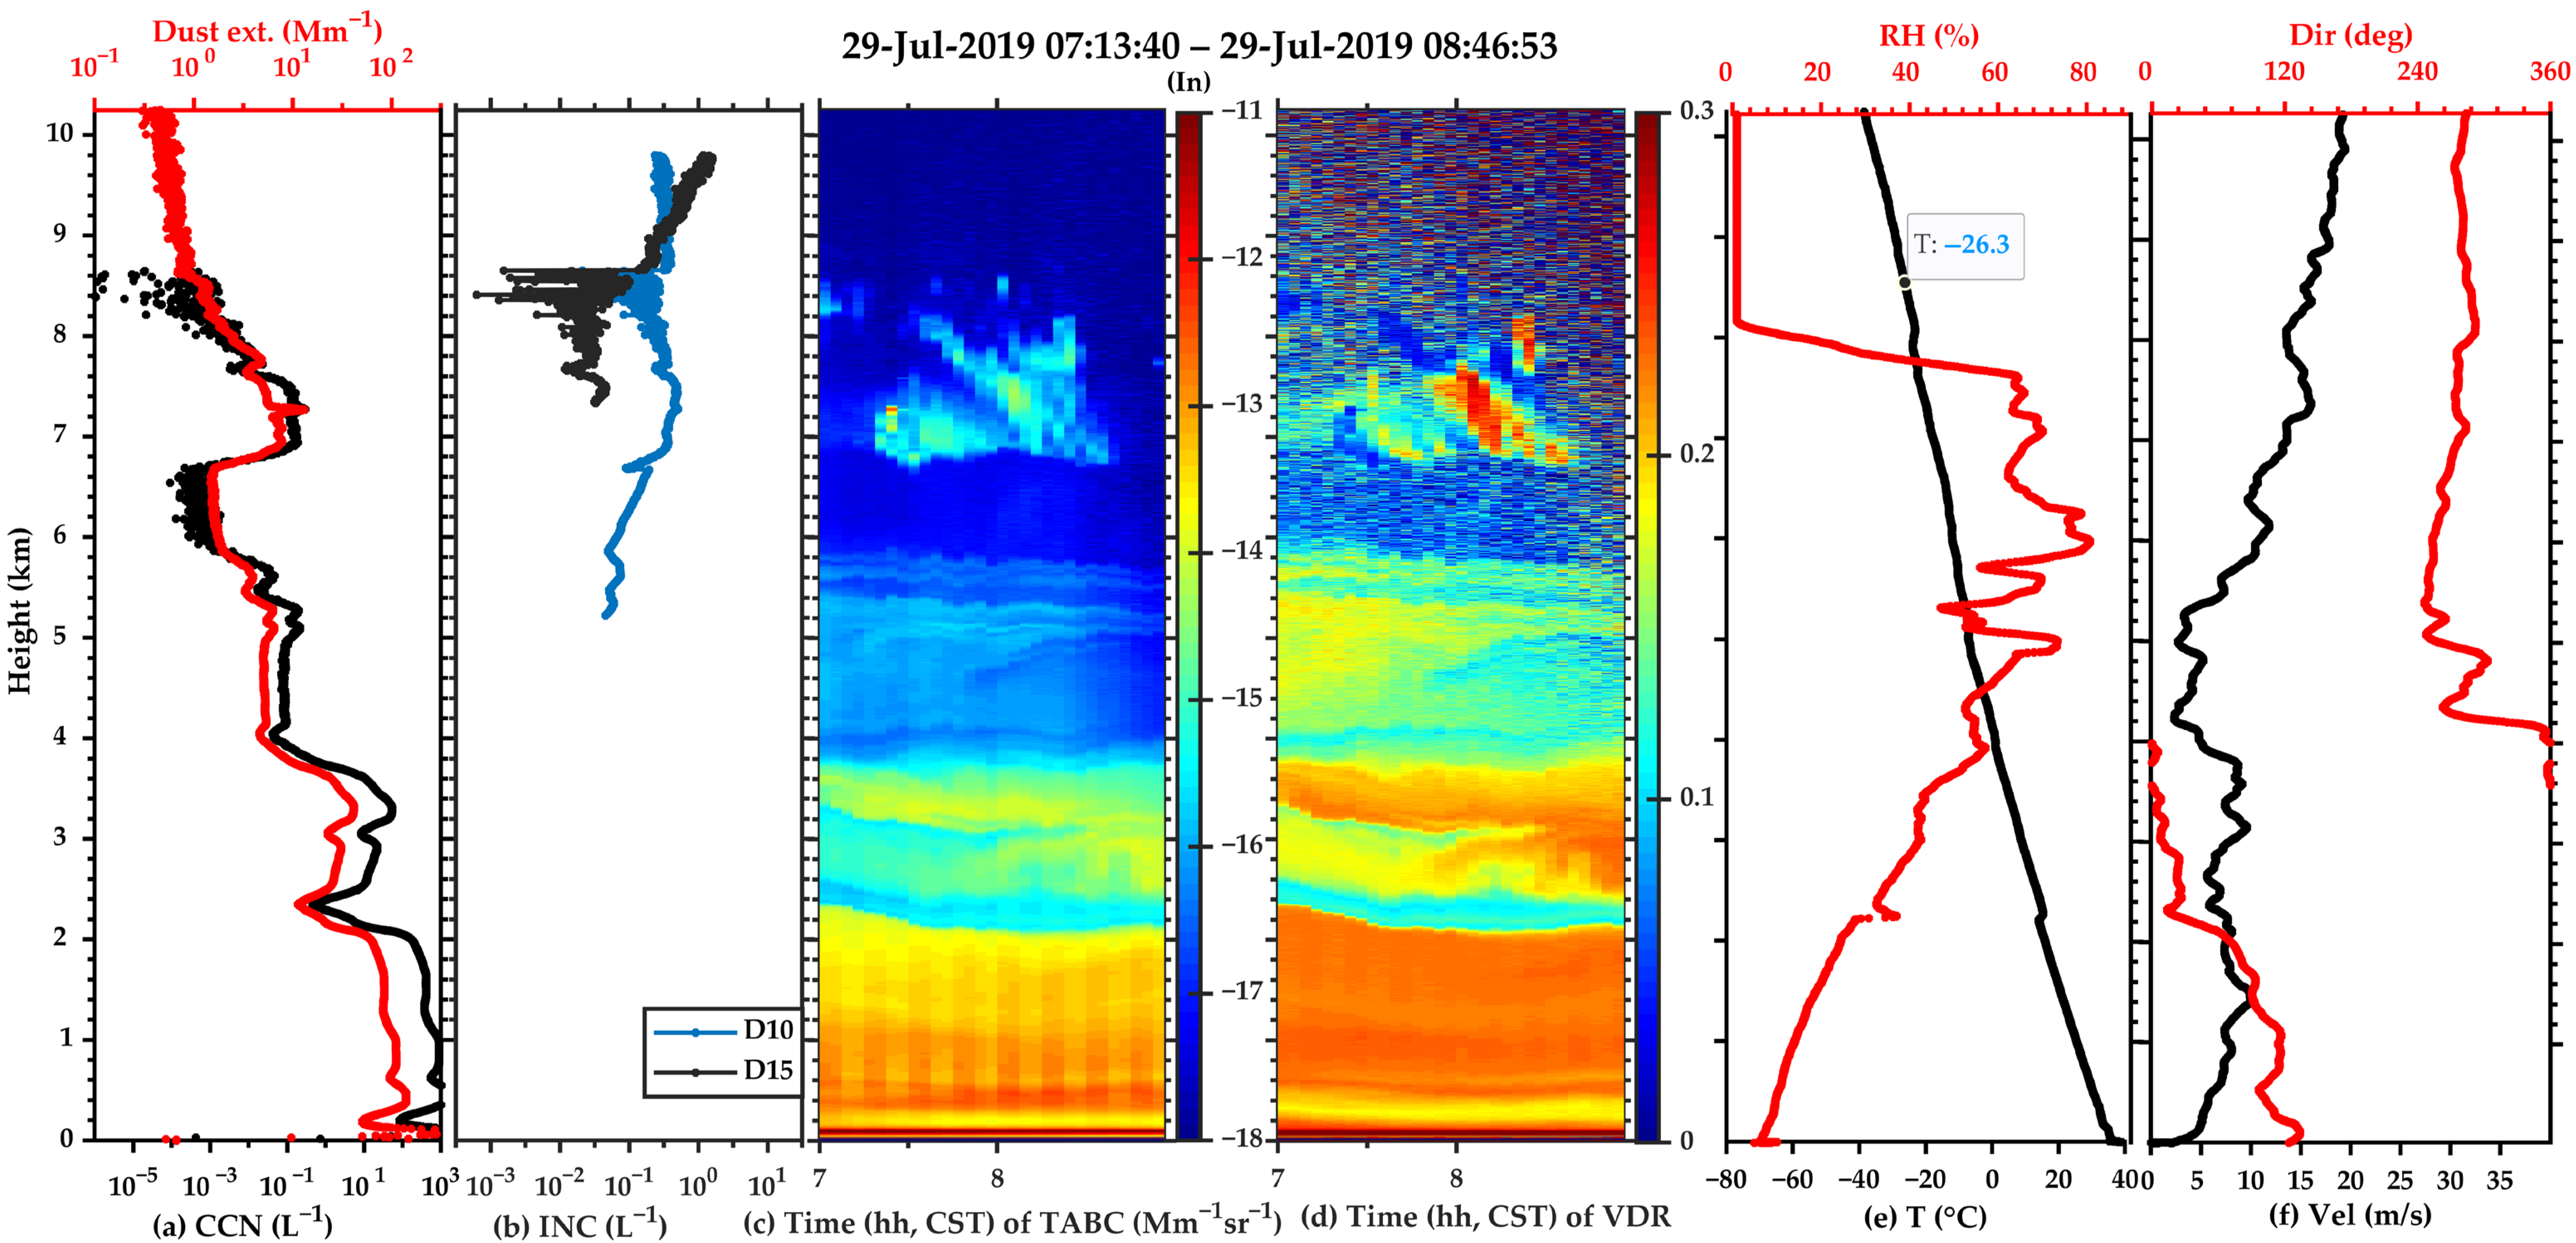
3.2.3. Ice Cloud
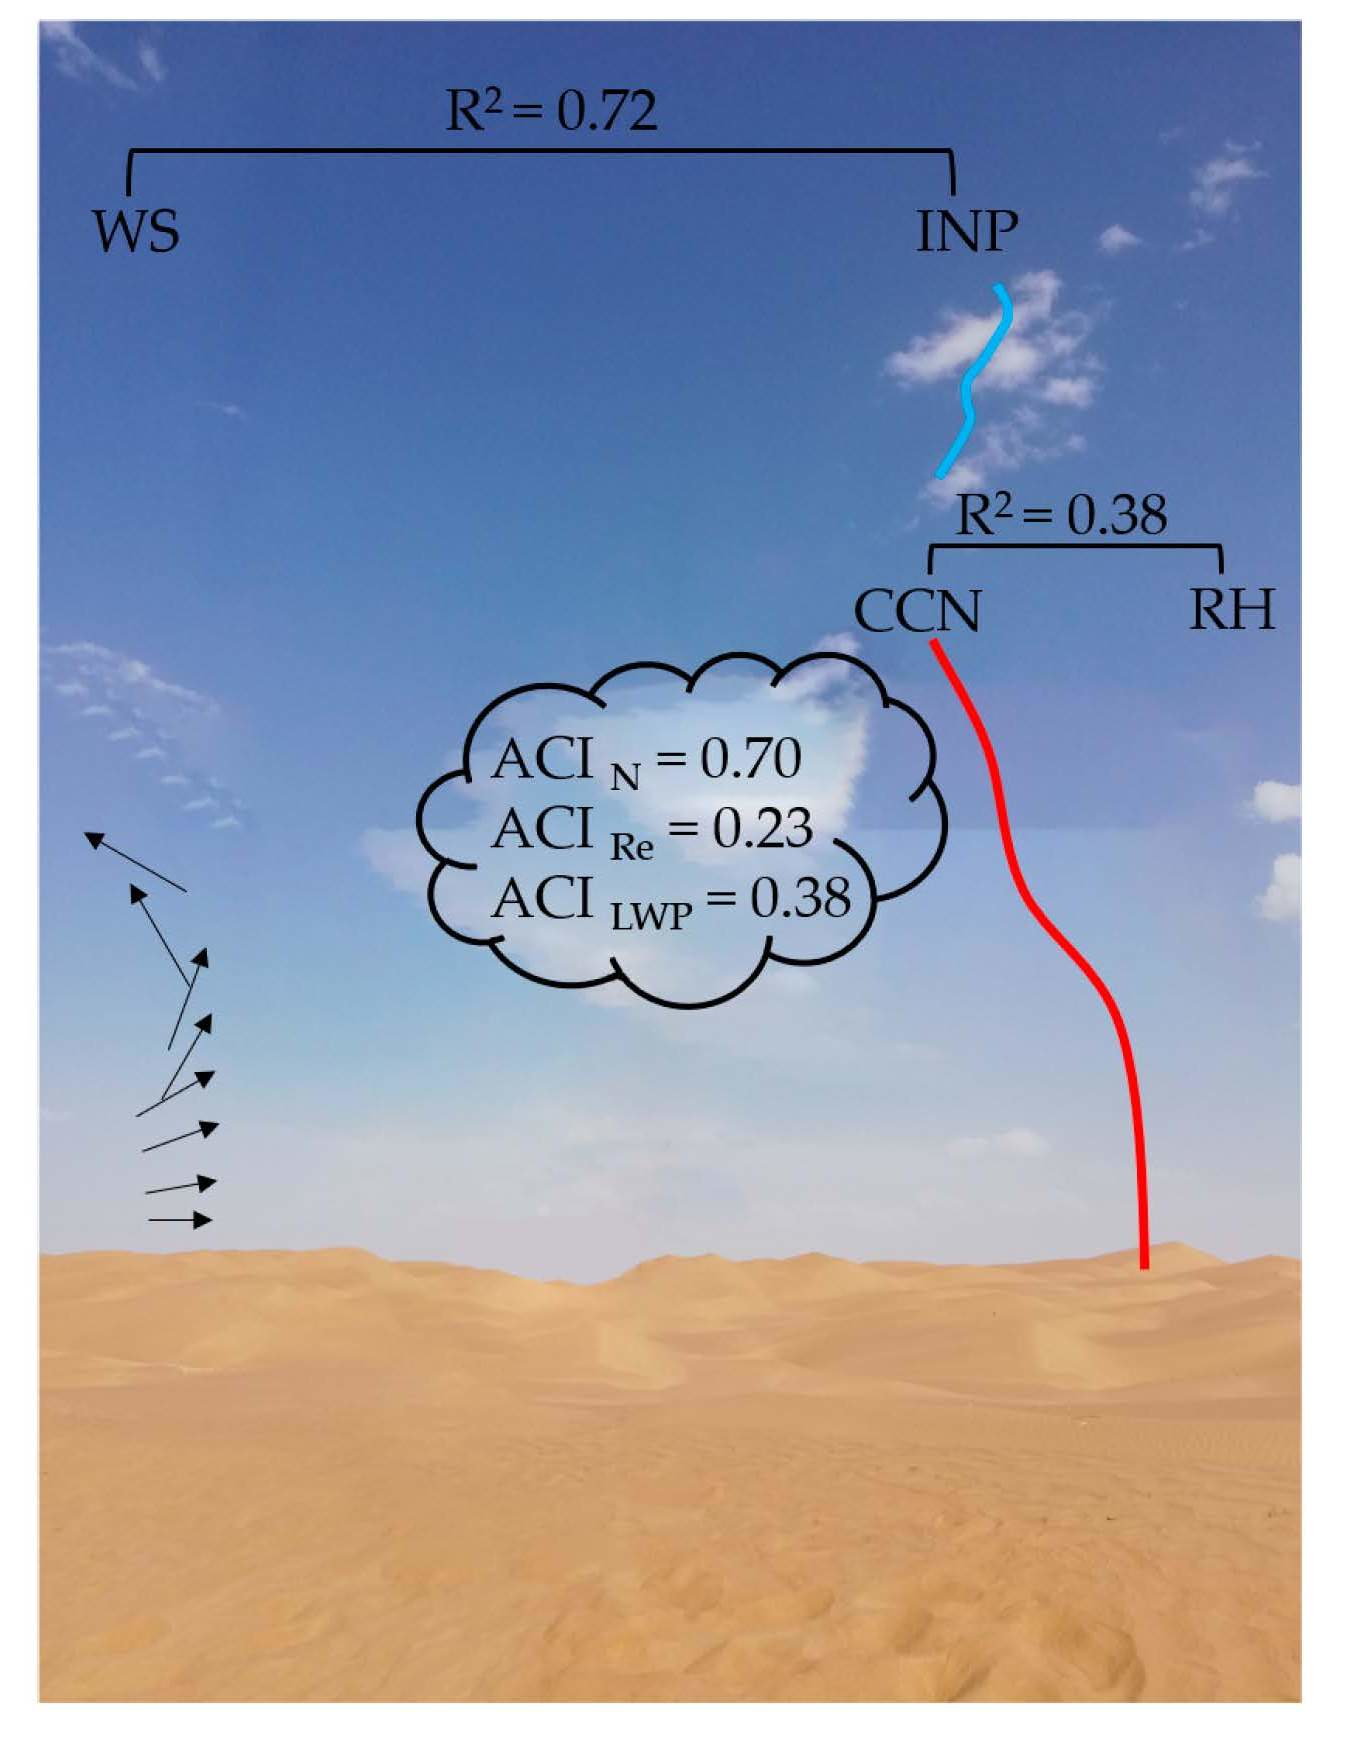
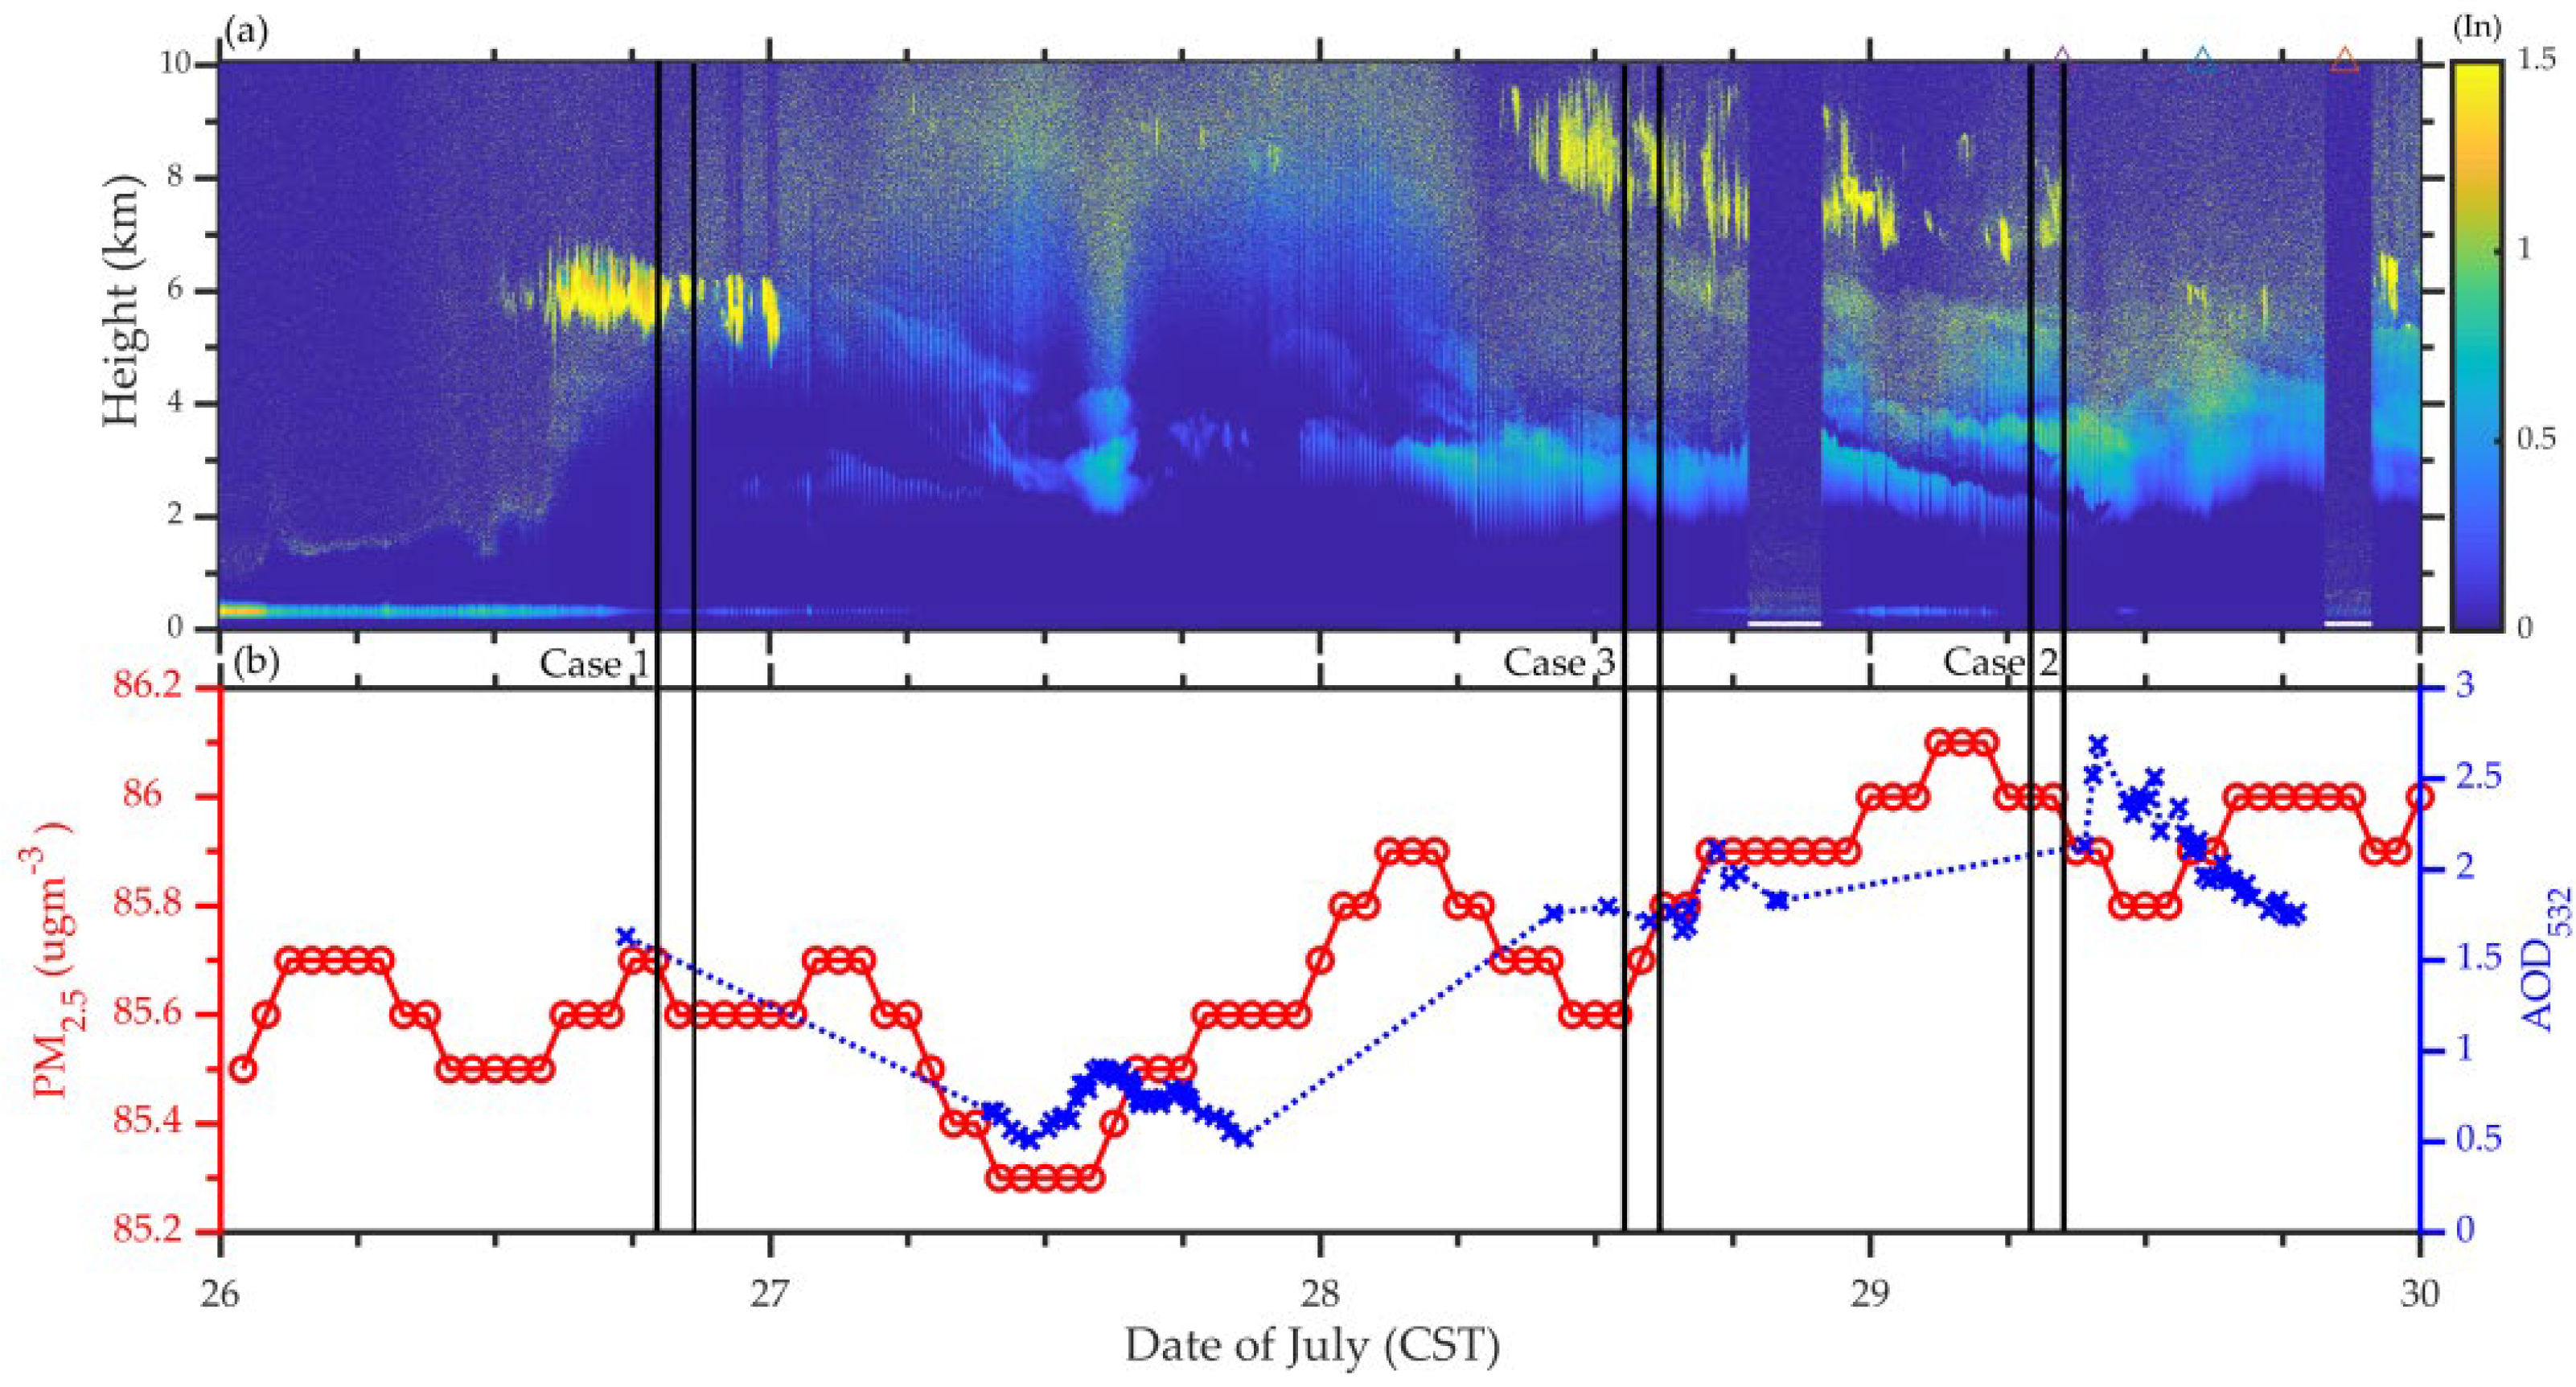
3.3. Effects of Atmospheric Dynamics on the CCN and INPs in the Hinterland of the Taklimakan Desert during the Summer of 2019
4. Conclusions
Author Contributions
Funding
Data Availability Statement
Acknowledgments
Conflicts of Interest
References
- Zhang, Z.; Zhou, W.; Wenig, M.; Yang, L. Impact of Long-Range Desert Dust Transport on Hydrometeor Formation over Coastal East Asia. Adv. Atmos. Sci. 2017, 34, 101–115. [Google Scholar] [CrossRef]
- Hoose, C.; Lohmann, U.; Erdin, R.; Tegen, I. The Global Influence of Dust Mineralogical Composition on Heterogeneous Ice Nucleation in Mixed-Phase Clouds. Environ. Res. Lett. 2008, 3, 25003. [Google Scholar] [CrossRef]
- Kelly, J.T.; Chuang, C.C.; Wexler, A.S. Influence of Dust Composition on Cloud Droplet Formation. Atmos. Environ. 2007, 41, 2904–2916. [Google Scholar] [CrossRef]
- Barahona, D.; West, R.E.L.; Stier, P.; Romakkaniemi, S.; Kokkola, H.; Nenes, A. Comprehensively Accounting for the Effect of Giant CCN in Cloud Activation Parameterizations. Atmos. Chem. Phys. 2010, 10, 2467–2473. [Google Scholar] [CrossRef]
- Lee, Y.H.; Chen, K.; Adams, P.J. Development of a Global Model of Mineral Dust Aerosol Microphysics. Atmos. Chem. Phys. 2009, 9, 2441–2458. [Google Scholar] [CrossRef]
- Manktelow, P.T.; Carslaw, K.S.; Mann, G.W.; Spracklen, D.V. The Impact of Dust on Sulfate Aerosol, CN and CCN during an East Asian Dust Storm. Atmos. Chem. Phys. 2010, 10, 365–382. [Google Scholar] [CrossRef]
- Orikasa, N.; Saito, A.; Yamashita, K.; Tajiri, T.; Zaizen, Y.; Kuo, T.H.; Kuo, W.C.; Murakami, M. Seasonal Variations of Atmospheric Aerosol Particles Focused on Cloud Condensation Nuclei and Ice Nucleating Particles from Ground-Based Observations in Tsukuba, Japan. Sci. Online Lett. Atmos. 2020, 16, 212–219. [Google Scholar] [CrossRef]
- Zhang, Y.; Yu, F.; Luo, G.; Fan, J.; Liu, S. Impacts of Long-Range-Transported Mineral Dust on Summertime Convective Cloud and Precipitation: A Case Study over the Taiwan Region. Atmos. Chem. Phys. 2021, 21, 17433–17451. [Google Scholar] [CrossRef]
- Uetake, J.; Hill, T.C.J.; Moore, K.A.; DeMott, P.J.; Protat, A.; Kreidenweis, S.M. Airborne Bacteria Confirm the Pristine Nature of the Southern Ocean Boundary Layer. Proc. Natl. Acad. Sci. USA 2020, 117, 13275–13282. [Google Scholar] [CrossRef]
- Ziemba, L.D.; Beyersdorf, A.J.; Chen, G.; Corr, C.A.; Crumeyrolle, S.N.; Thornhill, K.L.; Winstead, E.L.; Wisthaler, A.; Anderson, B.E. Airborne Observations of Bioaerosol over the Southeast United States Using a Wideband Integrated Bioaerosol Sensor. J. Geophys. Res. Atmos. 2016, 16, 8506–8524. [Google Scholar] [CrossRef]
- Gong, X.; Wex, H.; Müller, T.; Wiedensohler, A.; Höhler, K.; Kandler, K.; Ma, N.; Dietel, B.; Schiebel, T.; Möhler, O.; et al. Characterization of Aerosol Properties at Cyprus, Focusing on Cloud Condensation Nuclei and Ice-Nucleating Particles. Atmos. Chem. Phys. 2019, 19, 10883–10900. [Google Scholar] [CrossRef]
- Schrod, J.; Weber, D.; Drücke, J.; Keleshis, C.; Pikridas, M.; Ebert, M.; Cvetković, B.; Nickovic, S.; Marinou, E.; Baars, H.; et al. Ice Nucleating Particles over the Eastern Mediterranean Measured by Unmanned Aircraft Systems. Atmos. Chem. Phys. 2017, 17, 4817–4835. [Google Scholar] [CrossRef]
- Xi, Y.; Xu, C.; Downey, A.; Stevens, R.; Bachelder, J.O.; King, J.; Hayes, P.L.; Bertram, A.K. Ice Nucleating Properties of Airborne Dust from an Actively Retreating Glacier in Yukon, Canada. Environ. Sci. Atmos. 2022, 2, 714–726. [Google Scholar] [CrossRef]
- Paramonov, M.; Paramonov, M.; Van Dusseldorp, S.D.; Gute, E.; Abbatt, J.P.D.; Heikkilä, P.; Keskinen, J.; Chen, X.; Chen, X.; Luoma, K.; et al. Condensation/Immersion Mode Ice-Nucleating Particles in a Boreal Environment. Atmos. Chem. Phys. 2020, 20, 6687–6706. [Google Scholar] [CrossRef]
- Li, J.; Liu, W.; Castarède, D.; Gu, W.; Li, L.; Ohigashi, T.; Zhang, G.; Tang, M.; Thomson, E.S.; Hallquist, M.; et al. Hygroscopicity and Ice Nucleation Properties of Dust/Salt Mixtures Originating from the Source of East Asian Dust Storms. Front. Environ. Sci. 2022, 10, 897127. [Google Scholar] [CrossRef]
- Rinaldi, M.; Hiranuma, N.; Santachiara, G.; Mazzola, M.; Mansour, K.; Paglione, M.; Rodriguez, C.A.; Traversi, R.; Becagli, S.; Cappelletti, D.; et al. Ice-Nucleating Particle Concentration Measurements from Ny-Ålesund during the Arctic Spring-Summer in 2018. Atmos. Chem. Phys. 2021, 21, 14725–14748. [Google Scholar] [CrossRef]
- Huang, J.; Minnis, P.; Lin, B.; Wang, T.; Yi, Y.; Hu, Y.; Sun-Mack, S.; Ayers, K. Possible Influences of Asian Dust Aerosols on Cloud Properties and Radiative Forcing Observed from MODIS and CERES. Geophys. Res. Lett. 2006, 33, e2005GL024724. [Google Scholar] [CrossRef]
- Shinozuka, Y.; Clarke, A.D.; Nenes, A.; Jefferson, A.; Wood, R.; McNaughton, C.S.; Ström, J.; Tunved, P.; Redemann, J.; Thornhill, K.L.; et al. The Relationship between Cloud Condensation Nuclei (CCN) Concentration and Light Extinction of Dried Particles: Indications of Underlying Aerosol Processes and Implications for Satellite-Based CCN Estimates. Atmos. Chem. Phys. 2015, 15, 7585–7604. [Google Scholar] [CrossRef]
- Wang, M.; Xiao, M.; Bertozzi, B.; Marie, G.; Rörup, B.; Schulze, B.; Bardakov, R.; He, X.-C.; Shen, J.; Scholz, W.; et al. Synergistic HNO3–H2SO4–NH3 Upper Tropospheric Particle Formation. Nature 2022, 605, 483–489. [Google Scholar] [CrossRef]
- Phillips, V.T.J.; Choularton, T.W.; Illingworth, A.J.; Hogan, R.J.; Field, P.R. Simulations of the Glaciation of a Frontal Mixed-Phase Cloud with the Explicit Microphysics Model. Q. J. R. Meteorol. Soc. 2003, 129, 1351–1371. [Google Scholar] [CrossRef]
- Yin, Y.; Levin, Z.; Reisin, T.G.; Tzivion, S. The Effects of Giant Cloud Condensation Nuclei on the Development of Precipitation in Convective Clouds—A Numerical Study. Atmos. Res. 2000, 53, 91–116. [Google Scholar] [CrossRef]
- Yang, H.L.; Xiao, H.; Hong, Y.C. The Effects of Giant Cloud Condensation Nuclei on the Structure of Precipitation in Hailstorm Clouds. Sci. China Earth Sci. 2012, 55, 126–142. [Google Scholar] [CrossRef]
- He, Q.; Li, H.; Li, X.; Yang, Q.; Pan, X.; Gao, W. Preliminary Analysis on Boundary Climate Effects between Oasis and Desert in the North Margin of the Taklimakan Desert. Remote Sens. Model. Ecosyst. Sustain. 2004, 5544, 448. [Google Scholar] [CrossRef]
- Yang, Y.; Zhao, C.; Han, M.; Li, Y.; Yang, R. Temporal Patterns of Shrub Vegetation and Variation with Precipitation in Gurbantunggut Desert, Central Asia. Adv. Meteorol. 2015, 2015, 23–27. [Google Scholar] [CrossRef]
- Yang, P.; Zhao, L.; Liang, X.; Niu, Z.; Zhao, H.; Wang, Y.; Wang, N. Response of Net Ecosystem CO2 Exchange to Precipitation Events in the Badain Jaran Desert. Environ. Sci. Pollut. Res. 2022, 29, 36486–36501. [Google Scholar] [CrossRef]
- Li, G.; Yang, H.; Zhang, Y.; Huang, C.; Pan, X.; Ma, M.; Song, M.; Zhao, H. More Extreme Precipitation in Chinese Deserts From 1960 to 2018. Earth Planets Space 2019, 6, 1196–1204. [Google Scholar] [CrossRef]
- Naidoo, Y.; Valverde, A.; Pierneef, R.E.; Cowan, D.A. Differences in Precipitation Regime Shape Microbial Community Composition and Functional Potential in Namib Desert Soils. Microb. Ecol. 2022, 83, 689–701. [Google Scholar] [CrossRef]
- Salguero-Gómez, R.; Siewert, W.; Casper, B.B.; Tielbörger, K. A Demographic Approach to Study Effects of Climate Change in Desert Plants. Philos. Trans. R. Soc. B Biol. Sci. 2012, 367, 3100–3114. [Google Scholar] [CrossRef]
- Ma, N.; Wang, N.; Zhao, L.; Zhang, Z.; Dong, C.; Shen, S. Observation of Mega-Dune Evaporation after Various Rain Events in the Hinterland of Badain Jaran Desert, China. Chin. Sci. Bull. 2014, 59, 162–170. [Google Scholar] [CrossRef]
- Glassmeier, F.; Possner, A.; Vogel, B.; Vogel, H.; Lohmann, U. A Comparison of Two Chemistry and Aerosol Schemes on the Regional Scale and the Resulting Impact on Radiative Properties and Liquid- and Ice-Phase Aerosol-Cloud Interactions. Atmos. Chem. Phys. 2017, 17, 8651–8680. [Google Scholar] [CrossRef]
- Kumar, V.A.; Pandithurai, G.; Kulkarni, G.; Hazra, A.; Patil, S.S.; Dudhambe, S.D.; Patil, R.D.; Chen, J.P.; Niranjan, K. Atmospheric Ice Nuclei Concentration Measurements over a High Altitude-Station in the Western Ghats, India. Atmos. Res. 2020, 235, 104795. [Google Scholar] [CrossRef]
- Burkert-Kohn, M.; Wex, H.; Welti, A.; Hartmann, S.; Grawe, S.; Hellner, L.; Herenz, P.; Atkinson, J.D.; Stratmann, F.; Kanji, Z.A. Leipzig Ice Nucleation Chamber Comparison (LINC): Intercomparison of Four Online Ice Nucleation Counters. Atmos. Chem. Phys. 2017, 17, 11683–11705. [Google Scholar] [CrossRef]
- Zhang, D.; Wang, Z.; Kollias, P.; Vogelmann, A.M.; Yang, K.; Luo, T. Ice Particle Production in Mid-Level Stratiform Mixed-Phase Clouds Observed with Collocated A-Train Measurements. Atmos. Chem. Phys. 2018, 18, 4317–4327. [Google Scholar] [CrossRef]
- Hofer, J.; Ansmann, A.; Althausen, D.; Engelmann, R.; Baars, H.; Abdullaev, S.F.; Makhmudov, A.N. Long-Term Profiling of Aerosol Light Extinction, Particle Mass, Cloud Condensation Nuclei, and Ice-Nucleating Particle Concentration over Dushanbe, Tajikistan, in Central Asia. Atmos. Chem. Phys. 2020, 20, 4695–4711. [Google Scholar] [CrossRef]
- Mamouri, R.E.; Ansmann, A. Potential of Polarization Lidar to Provide Profiles of CCN-and INP-Relevant Aerosol Parameters. Atmos. Chem. Phys. 2016, 16, 5905–5931. [Google Scholar] [CrossRef]
- Zhang, S.; Huang, Z.; Li, M.; Shen, X.; Wang, Y.; Dong, Q.; Bi, J.; Zhang, J.; Li, W.; Li, Z.; et al. Vertical Structure of Dust Aerosols Observed by a Ground-Based Raman Lidar with Polarization Capabilities in the Center of the Taklimakan Desert. Remote Sens. 2022, 14, 2461. [Google Scholar] [CrossRef]
- Dubovik, O.; Herman, M.; Holdak, A.; Lapyonok, T.; Tanré, D.; Deuzé, J.L.; Ducos, F.; Sinyuk, A.; Lopatin, A. Statistically Optimized Inversion Algorithm for Enhanced Retrieval of Aerosol Properties from Spectral Multi-Angle Polarimetric Satellite Observations. Atmos. Meas. Tech. 2011, 4, 975–1018. [Google Scholar] [CrossRef]
- Ma, X.; Huang, Z.; Qi, S.; Huang, J.; Zhang, S.; Dong, Q.; Wang, X. Ten-Year Global Particulate Mass Concentration Derived from Space-Borne CALIPSO Lidar Observations. Sci. Total Environ. 2020, 721, 137699. [Google Scholar] [CrossRef]
- Horvath, H.; Gunter, R.L.; Wilkison, S.W. Determination of the Coarse Mode of the Atmospheric Aerosol Using Data from a Forward-Scattering Spectrometer Probe. Aerosol Sci. Technol. 1990, 12, 964–980. [Google Scholar] [CrossRef]
- Chen, L.; Peng, C.; Gu, W.; Fu, H.; Jian, X.; Zhang, H.; Zhang, G.; Zhu, J.; Wang, X.; Tang, M. On Mineral Dust Aerosol Hygroscopicity. Atmos. Chem. Phys. 2020, 20, 13611–13626. [Google Scholar] [CrossRef]
- Fernald, F.G. Analysis of Atmospheric Lidar Observations: Some Comments. Appl. Opt. 1984, 23, 652–653. [Google Scholar] [CrossRef] [PubMed]
- Marinou, E.; Tesche, M.; Nenes, A.; Ansmann, A.; Schrod, J.; Mamali, D.; Tsekeri, A.; Pikridas, M.; Baars, H.; Engelmann, R.; et al. Retrieval of Ice-Nucleating Particle Concentrations from Lidar Observations and Comparison with UAV in Situ Measurements. Atmos. Chem. Phys. 2019, 19, 11315–11342. [Google Scholar] [CrossRef]
- Ullrich, R.; Hoose, C.; Möhler, O.; Niemand, M.; Wagner, R.; Höhler, K.; Hiranuma, N.; Saathoff, H.; Leisner, T. A New Ice Nucleation Active Site Parameterization for Desert Dust and Soot. J. Atmos. Sci. 2017, 74, 699–717. [Google Scholar] [CrossRef]
- DeMott, P.J.; Prenni, A.J.; McMeeking, G.R.; Sullivan, R.C.; Petters, M.D.; Tobo, Y.; Niemand, M.; Möhler, O.; Snider, J.R.; Wang, Z.; et al. Integrating Laboratory and Field Data to Quantify the Immersion Freezing Ice Nucleation Activity of Mineral Dust Particles. Atmos. Chem. Phys. 2015, 15, 393–409. [Google Scholar] [CrossRef]
- DeMott, P.J.; Prenni, A.J.; Liu, X.; Kreidenweis, S.M.; Petters, M.D.; Twohy, C.H.; Richardson, M.S.; Eidhammer, T.; Rogers, D.C. Predicting Global Atmospheric Ice Nuclei Distributions and Their Impacts on Climate. Proc. Natl. Acad. Sci. USA 2010, 107, 11217–11222. [Google Scholar] [CrossRef]
- Haarig, M.; Walser, A.; Ansmann, A.; Dollner, M.; Althausen, D.; Sauer, D.; Farrell, D.; Weinzierl, B. Profiles of Cloud Condensation Nuclei, Dust Mass Concentration, and Ice-Nucleating-Particle-Relevant Aerosol Properties in the Saharan Air Layer over Barbados from Polarization Lidar and Airborne in Situ Measurements. Atmos. Chem. Phys. 2019, 19, 13773–13788. [Google Scholar] [CrossRef]
- Hu, D.; Wang, Y.; Yu, C.; Xie, Q.; Yue, S.; Shang, D.; Fang, X.; Joshi, R.; Liu, D.; Allan, J.; et al. Vertical Profile of Particle Hygroscopicity and CCN Effectiveness during Winter in Beijing: Insight into the Hygroscopicity Transition Threshold of Black Carbon. Faraday Discuss. 2021, 226, 239–254. [Google Scholar] [CrossRef]
- Van Pinxteren, M.; Wadinga Fomba, K.; Triesch, N.; Stolle, C.; Wurl, O.; Bahlmann, E.; Gong, X.; Voigtländer, J.; Wex, H.; Robinson, T.B.; et al. Marine Organic Matter in the Remote Environment of the Cape Verde Islands-an Introduction and Overview to the MarParCloud Campaign. Atmos. Chem. Phys. 2020, 20, 6921–6951. [Google Scholar] [CrossRef]
- Belosi, F.; Piazza, M.; Nicosia, A.; Santachiara, G. Influence of Supersaturation on the Concentration of Ice Nucleating Particles. Tellus B Chem. Phys. Meteorol. 2018, 70, 1–10. [Google Scholar] [CrossRef]
- Li, J.; Lv, Q.; Zhang, M.; Wang, T.; Kawamoto, K.; Chen, S.; Zhang, B. Effects of Atmospheric Dynamics and Aerosols on the Fraction of Supercooled Water Clouds. Atmos. Chem. Phys. 2017, 17, 1847–1863. [Google Scholar] [CrossRef]
- Chen, W.N.; Chiang, C.W.; Nee, J.B. Lidar Ratio and Depolarization Ratio for Cirrus Clouds. Appl. Opt. 2002, 41, 6470–6476. [Google Scholar] [CrossRef] [PubMed]
- Pal, S.R.; Steinbrecht, W.; Carswell, A.I. Automated Method for Lidar Determination of Cloud-Base Height and Vertical Extent. Appl. Opt. 1992, 31, 1488. [Google Scholar] [CrossRef] [PubMed]
- Tesche, M.; Ansmann, A.; Müller, D.; Althausen, D.; Engelmann, R.; Freudenthaler, V.; Groß, S. Vertically Resolved Separation of Dust and Smoke over Cape Verde Using Multiwavelength Raman and Polarization Lidars during Saharan Mineral Dust Experiment 2008. J. Geophys. Res. Atmos. 2009, 114, 1–14. [Google Scholar] [CrossRef]
- Wang, N.; Zhang, K.; Shen, X.; Wang, Y.; Li, J.; Li, C.; Mao, J.; Malinka, A.; Zhao, C.; Russell, L.M.; et al. Dual-Field-of-View High-Spectral-Resolution Lidar: Simultaneous Profiling of Aerosol and Water Cloud to Study Aerosol-Cloud Interaction. Proc. Natl. Acad. Sci. USA 2022, 119, e2110756119. [Google Scholar] [CrossRef] [PubMed]
- Austin, R.T.; Heymsfield, A.J.; Stephens, G.L. Retrieval of Ice Cloud Microphysical Parameters Using the CloudSat Millimeter-Wave Radar and Temperature. J. Geophys. Res. Atmos. 2009, 114, 1–19. [Google Scholar] [CrossRef]
- Qi, S.; Huang, Z.; Ma, X.; Huang, J.; Shi, J.; Zhou, T.; Zhang, S.; Dong, Q.; Bi, J.; Shi, J. Classification of Atmospheric Aerosols and Clouds by Use of Dual-Polarization Lidar Measurements. Opt. Express 2021, 29, 23461. [Google Scholar] [CrossRef]
- He, Y.; Zhang, Y.; Liu, F.; Yin, Z.; Yi, Y.; Zhan, Y.; Yi, F. Retrievals of Dust-Related Particle Mass and Ice-Nucleating Particle Concentration Profiles with Ground-Based Polarization Lidar and Sun Photometer over a Megacity in Central China. Atmos. Meas. Tech. 2021, 14, 5939–5954. [Google Scholar] [CrossRef]
- Ansmann, A.; Mamouri, R.E.; Hofer, J.; Baars, H.; Althausen, D.; Abdullaev, S.F. Dust Mass, Cloud Condensation Nuclei, and Ice-Nucleating Particle Profiling with Polarization Lidar: Updated POLIPHON Conversion Factors from Global AERONET Analysis. Atmos. Meas. Tech. 2019, 12, 4849–4865. [Google Scholar] [CrossRef]
- Zhang, R.; Wang, Y.; Li, Z.; Wang, Z.; Dickerson, R.R.; Ren, X.; He, H.; Wang, F.; Gao, Y.; Chen, X.; et al. Vertical Profiles of Cloud Condensation Nuclei Number Concentration and Its Empirical Estimate from Aerosol Optical Properties over the North China Plain. Atmos. Chem. Phys. 2022, 22, 14879–14891. [Google Scholar] [CrossRef]
- Hudson, J.G.; Noble, S. Cumulus Cloud and Drizzle Microphysics Relationships With Complete CCN Spectra. J. Geophys. Res. Atmos. 2021, 126, e2021JD034966. [Google Scholar] [CrossRef]
- Jimenez, C.; Ansmann, A.; Engelmann, R.; Donovan, D.; Malinka, A.; Seifert, P.; Wiesen, R.; Radenz, M.; Yin, Z.; Bühl, J.; et al. The Dual-Field-of-View Polarization Lidar Technique: A New Concept in Monitoring Aerosol Effects in Liquid-Water Clouds-Case Studies. Atmos. Chem. Phys. 2020, 20, 15265–15284. [Google Scholar] [CrossRef]
- Roesch, C.; Roesch, M.; Wolf, M.J.; Zawadowicz, M.A.; AlAloula, R.; Awwad, Z.; Cziczo, D.J. CCN and INP Activity of Middle Eastern Soil Dust. Aeolian Res. 2021, 52, 100729. [Google Scholar] [CrossRef]
- Wu, Z.; Wu, X.; Wang, Y.; He, S. PM2.5ĝ•PM10 Ratio Prediction Based on a Long Short-Term Memory Neural Network in Wuhan, China. Geosci. Model Dev. 2020, 13, 1499–1511. [Google Scholar] [CrossRef]
- Shi, L.; Zhang, J.; Yao, F.; Zhang, D.; Guo, H. Drivers to Dust Emissions over Dust Belt from 1980 to 2018 and Their Variation in Two Global Warming Phases. Sci. Total Environ. 2021, 767, 144860. [Google Scholar] [CrossRef] [PubMed]
- Georgakaki, P.; Bougiatioti, A.; Wieder, J.; Mignani, C.; Ramelli, F.; Kanji, Z.A.; Henneberger, J.; Hervo, M.; Berne, A.; Lohmann, U.; et al. On the Drivers of Droplet Variability in Alpine Mixed-Phase Clouds. Atmos. Chem. Phys. 2021, 21, 10993–11012. [Google Scholar] [CrossRef]
- Atkinson, J.D.; Murray, B.J.; Woodhouse, M.T.; Whale, T.F.; Baustian, K.J.; Carslaw, K.S.; Dobbie, S.; O’Sullivan, D.; Malkin, T.L. The Importance of Feldspar for Ice Nucleation by Mineral Dust in Mixed-Phase Clouds. Nature 2013, 498, 355–358. [Google Scholar] [CrossRef]
- Schmidt, J.; Ansmann, A.; Bühl, J.; Wandinger, U. Strong Aerosol-Cloud Interaction in Altocumulus during Updraft Periods: Lidar Observations over Central Europe. Atmos. Chem. Phys. 2015, 15, 10687–10700. [Google Scholar] [CrossRef]
- Uno, I.; Eguchi, K.; Yumimoto, K.; Liu, Z.; Hara, Y.; Sugimoto, N.; Shimizu, A.; Takemura, T. Large Asian Dust Layers Continuously Reached North America in April 2010. Atmos. Chem. Phys. 2011, 11, 7333–7341. [Google Scholar] [CrossRef]
- Tsunematsu, N.; Iwai, H.; Ishii, S.; Yasui, M.; Murayama, Y.; Mizutani, K. Influence of Surface-Based Stable Layer Development on Asian Dust Behaviour over Tokyo. Bound.-Layer Meteorol. 2009, 131, 263–275. [Google Scholar] [CrossRef]
- Leng, C.; Zhang, Q.; Zhang, D.; Xu, C.; Cheng, T.; Zhang, R.; Tao, J.; Chen, J.; Zha, S.; Zhang, Y.; et al. Variations of Cloud Condensation Nuclei (CCN) and Aerosol Activity during Fog-Haze Episode: A Case Study from Shanghai. Atmos. Chem. Phys. 2014, 14, 12499–12512. [Google Scholar] [CrossRef]
- Tatzelt, C.; Henning, S.; Welti, A.; Baccarini, A.; Hartmann, M.; Gysel-Beer, M.; Van Pinxteren, M.; Modini, R.L.; Schmale, J.; Stratmann, F.; et al. Circum-Antarctic Abundance and Properties of CCN and INP. Atmos. Chem. Phys. Discuss. 2021, 1–35, In review. [Google Scholar] [CrossRef]
- Genz, C.; Schrödner, R.; Heinold, B.; Henning, S.; Baars, H.; Spindler, G.; Tegen, I. Estimation of Cloud Condensation Nuclei Number Concentrations and Comparison to in Situ and Lidar Observations during the HOPE Experiments. Atmos. Chem. Phys. 2020, 20, 8787–8806. [Google Scholar] [CrossRef]
- Kova, N. Sensitivity Study of the Impact of CCN Size on Simulated Ground Precipitation for Deep Convection Case. Atmos. Environ. 2022, 289, 119309. [Google Scholar] [CrossRef]
- Liu, G.; Shao, H.; Coakley, J.A.; Curry, J.A.; Haggerty, J.A.; Tschudi, M.A. Retrieval of Cloud Droplet Size from Visible and Microwave Radiometric Measurements during INDOEX: Implication to Aerosols’ Indirect Radiative Effect. J. Geophys. Res. Atmos. 2003, 108, AAC 2-1–AAC 2-10. [Google Scholar] [CrossRef]


| Parameters | Values |
|---|---|
| Transmitter | Nd: YAG laser |
| Repetition rate | 10 HZ |
| Pulse energy | 450 mJ |
| Wavelength | 1064 nm, 532 nm and 355 nm |
| Vertical resolution | 3.75 m |
| Field of view | 2 mrad |
Disclaimer/Publisher’s Note: The statements, opinions and data contained in all publications are solely those of the individual author(s) and contributor(s) and not of MDPI and/or the editor(s). MDPI and/or the editor(s) disclaim responsibility for any injury to people or property resulting from any ideas, methods, instructions or products referred to in the content. |
© 2023 by the authors. Licensee MDPI, Basel, Switzerland. This article is an open access article distributed under the terms and conditions of the Creative Commons Attribution (CC BY) license (https://creativecommons.org/licenses/by/4.0/).
Share and Cite
Zhang, S.; Huang, Z.; Alam, K.; Li, M.; Dong, Q.; Wang, Y.; Shen, X.; Bi, J.; Zhang, J.; Li, W.; et al. Derived Profiles of CCN and INP Number Concentrations in the Taklimakan Desert via Combined Polarization Lidar, Sun-Photometer, and Radiosonde Observations. Remote Sens. 2023, 15, 1216. https://doi.org/10.3390/rs15051216
Zhang S, Huang Z, Alam K, Li M, Dong Q, Wang Y, Shen X, Bi J, Zhang J, Li W, et al. Derived Profiles of CCN and INP Number Concentrations in the Taklimakan Desert via Combined Polarization Lidar, Sun-Photometer, and Radiosonde Observations. Remote Sensing. 2023; 15(5):1216. https://doi.org/10.3390/rs15051216
Chicago/Turabian StyleZhang, Shuang, Zhongwei Huang, Khan Alam, Meishi Li, Qingqing Dong, Yongkai Wang, Xingtai Shen, Jianrong Bi, Jiantao Zhang, Wuren Li, and et al. 2023. "Derived Profiles of CCN and INP Number Concentrations in the Taklimakan Desert via Combined Polarization Lidar, Sun-Photometer, and Radiosonde Observations" Remote Sensing 15, no. 5: 1216. https://doi.org/10.3390/rs15051216
APA StyleZhang, S., Huang, Z., Alam, K., Li, M., Dong, Q., Wang, Y., Shen, X., Bi, J., Zhang, J., Li, W., Li, Z., Wang, W., Cui, Z., & Song, X. (2023). Derived Profiles of CCN and INP Number Concentrations in the Taklimakan Desert via Combined Polarization Lidar, Sun-Photometer, and Radiosonde Observations. Remote Sensing, 15(5), 1216. https://doi.org/10.3390/rs15051216