Abstract
For crop growth monitoring and agricultural management, it is important to use hyperspectral remote sensing techniques to estimate canopy nitrogen content in a timely and accurate manner. The traditional nadir method has limited ability to assess the nitrogen trophic state of cotton shoots, which is not conducive to high-precision nitrogen inversion, whereas the multi-angle remote sensing monitoring method can effectively extract the canopy’s physicochemical information. However, multi-angle spectral information is affected by a variety of factors, which frequently causes shifts in the band associated with nitrogen uptake, and lowers the estimation accuracy. The capacity of the spectral index to estimate aerial nitrogen concentration (ANC) in cotton was therefore investigated in this work under various observation zenith angles (VZAs), and the Relief−F method was employed to select the best spectral band with weight for ANC that is insensitive to VZA. Therefore, in this study, the ability of the spectral index to estimate ANC in cotton was explored under different VZAs, and the Relief-F algorithm was used to optimize the optimal spectral band with weight for ANC that is insensitive to VZA. The angle insensitive nitrogen index (AINI) for various VZAs was calculated using the expression (R530 − R704)/(R1412 + R704). The results show that the correlation between the spectral index and the ANC chosen in this study is stronger than the correlation between off-nadir observations, and the correlation coefficients between Photochemical Reflectance Index (PRI), AINI, and ANC are highest when VZA is −20° and −50° (r = 0.866 and 0.893, respectively). Compared with the traditional vegetation index, AINI had the best correlation with ANC under different VZAs (r > 0.84), and the performance of ANC in the backscatter direction was estimated to be better than that in the forward-scatter direction. At the same time, the ANC estimation model of the optimal indices AINI and PRI was combined with the machine learning method to achieve better accuracy, and the prediction accuracy of the random forest (RF) model was R2 = 0.98 and RMSE = 0.590. This study shows that the AINI index can estimate cotton ANC under different VZAs. Simultaneously, the backscattered direction is revealed to be more conducive to cotton ANC estimation. The findings encourage the use of multi-angle observations in crop nutrient estimation, which will also help to improve the use of ground-based and satellite sensors.
1. Introduction
Nitrogen is the most important mineral nutrient element for crops, and it is also a key factor for crop growth and yield formation. Timely and accurate estimation of crop canopy nitrogen content is the key to the scientific and efficient use of nitrogen [1]. Compared with the traditional method of destructive sampling to obtain crop nitrogen status, the use of remote sensing technology can non-destructively, accurately, and quickly obtain the spectral information of crops in a large area and provide decision support for the later formulation of scientific and reasonable fertilization programs. The use of spectral reflectance to accurately monitor crop canopy nitrogen content is based mainly on the response of the biophysical characteristics of crop leaves to spectral reflectance [2]. Crop canopy spectral reflectance is affected by crop plant type, canopy structure, solar zenith angle, observation angle, and canopy coverage [3]. At the same time, the optical remote sensing observation is affected by the bidirectional reflection of the canopy, and the observation from a single angle cannot rule out the interference of many factors [3]. This directly results in a large spatiotemporal variation in the spectral reflectance of the canopy and the physiological characteristics of plants and often causes the absorption characteristic bands of the nitrogen content of the canopy to shift [4]. The vegetation index established by using methods such as normalized difference can reduce the influence of canopy structure and angle to a certain extent; for example, the optimized soil-adjusted vegetation index (OSAVI) can alleviate the structural effect to a certain extent, but it has not yet solved Canopy spectral reflectance suffers from two-way (illumination and viewing geometry) effects [5].
Multi-angle remote sensing, when compared with nadir observation, can obtain more information about the crop canopy, and this provides a method for characterizing canopy reflectance anisotropy, which is useful for effectively extracting physicochemical information [6,7]. Many studies have proposed the use of anisotropy to reduce the impact of multi-angle effects and improve exponential performance. Such as, He et al. established the angle-insensitive vegetation index (AIVI) of winter wheat to improve the estimation progress of leaf nitrogen content and the stability of the angle [4]. Some studies have also found that compared with nadir observation, non-nadir observation, and multi-angle observation can improve the estimation accuracy of crop canopy parameters [8,9], such as the estimation of leaf area index [10]. Recent studies have also shown that plant biochemical parameters can be monitored using multi-angle data. For example, Kong et al. [11] and Peter et al. [12] found that when observation is undertaken at a zenith angle of 30°, the model estimation accuracy of leaf chlorophyll content (LCC) obtained is the highest and a larger zenith angle can be used for inversion, which can obtain a more accurate estimation effect [10].
In order to improve the accuracy and stability of the model, there have been attempts to use multi-angle remote sensing data to construct new spectral indices, such as the work of Li et al. [13], which uses the modified Datt index to reduce the directional reflection effect when estimating leaf chlorophyll content, and which improves the high-precision estimation of leaf chlorophyll content in all observation directions and species. Yang et al. [14] found that the improved LAI estimation of normalized difference ratio index (NDRI) and enhanced ratio vegetation index (ERVI) for different crop geometric features achieved a higher accuracy than other spectral indices or angles at 40° viewing angles. The multi-angle index MAVI, developed by He et al. [4], combines spectral data from two observation angles to improve the stability and accuracy of the estimation of nitrogen concentration in wheat leaves; the improved right peak area index (mRPA) at −10° to 10° can more accurately evaluate plant nitrogen status [15], and Wang et al. [16] also used 60°, 60°, and 50° to monitor leaf chlorophyll content in the upper, middle, and lower layers of winter wheat, respectively.
At present, the research mainly focuses on analyzing the performance of estimating vegetation physiological parameters under various observation zenith angles (VZAs), which limits the universality and practical value of remote sensing monitoring. The spectral characteristics of the canopy are affected by the leaf inclination, canopy structure, shadow, and soil background spectral reflection, resulting in frequent shifts in the characteristic band of nitrogen uptake [17,18,19]. As cotton is a crop with sunward characteristics [20], its leaf inclination angle changes with the change in the solar zenith angle under different growth periods and different times of the day, which leads to differences in canopy spectra under different VZAs, and affects the estimation accuracy of cotton aerial nitrogen concentration (ANC). In order to improve the model accuracy and stability of canopy spectral information construction under different VZAs, future research should focus on exploring how different VZA canopy spectra affect nutrient inversion accuracy and on constructing the spectral index with the lowest sensitivity to VZA but the highest ability to estimate ANC through multi-angle remote sensing data, so as to reduce the directional reflection effect when estimating ANC. In this study, the Relief-f feature selection algorithm was used to screen the optimal feature bands that can better retrieve cotton ANC under different observation angles and to construct an angle-insensitive nitrogen index (AINI). The Relief-f algorithm belongs to the classic multivariable filtering feature selection method. Compared with the encapsulation feature selection method, the Relief-f algorithm can reduce the complexity of feature search, accurately estimate the quality of strong correlation features, and detect outliers with strong robustness. Therefore, the objectives of this study were as follows: (1) to study the ability of canopy multi-angle spectra and existing spectral indices to estimate nitrogen concentration under different VZAs; (2) to find out the bands that can indicate the nitrogen content of cotton and further develop the spectral index that is most sensitive to nitrogen changes but not sensitive to VZA; and (3) construct a cotton nitrogen monitoring model based on the optimal spectral index under the best VZA to achieve rapid non-destructive monitoring of cotton nitrogen.
2. Materials and Methods
2.1. Experimental Design
The experiment was conducted in 2021 at Shihezi University’s second consecutive experimental teaching field in Shihezi City, Xinjiang, China (85°59′41″E, 44°19′54″N). The location of the test site is shown in Figure 1. The altitude is 429 m, the frost-free period is 168~171 days, the annual sunshine duration is 2721~2818 h, and the active accumulated temperature of ≥10 °C is 3570~3729 °C. The soil of the test field is loam, in which the alkali-hydrolyzed nitrogen content is 60.88 mg/kg, the available potassium content is 134 mg/kg, the available phosphorus content is 17.95 mg/kg, and the organic matter content is 19.90 g/kg. The fore-rotating crop is cotton.
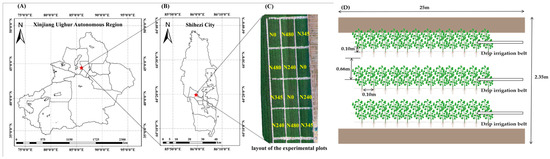
Figure 1.
Overview map of study area and layout of the experimental plots. (A) Location of the pilot area in Xinjiang Uighur Autonomous Region, (B) Location of the pilot area in Shihezi City, (C) layout of the experimental plots, (D) Layout of row spacing in the test plot.
During the whole growth process of cotton, nitrogen, phosphorus, and potassium fertilizers were applied dropwise with water, including urea (N, 46%), 345 kg/ha, and potassium dihydrogen phosphate (P2O5, 52%; K2O, 34%), 240 kg/ha, as the main fertilizers. There are nine periods of drip irrigation in the whole growth period. The urea application amount and proportion of each treatment are shown in Table 1. Before each fertilization, the required fertilizer is weighed in proportion and poured into the fertilizer tank for dissolution, then dropped into the plot with water.

Table 1.
Time, proportion, and amount of nitrogen application for each treatment in the test plot in 2021.
The main cultivars in the surrounding area of Shihezi City, Xinjiang, were “Xinlu Zao No. 53” (the plant was tube-shaped, and the leaves were dark green). The submembrane drip-irrigation planting mode (66 + 10 cm) was adopted, with 1 membrane, 3 tubes, 6 rows, and a membrane width of 2.35 m. We used a fully randomized block design with 4 nitrogen application rates, namely pure nitrogen at 0, 240, 480, and 345 kg/ha (expressed as N0, N240, N480, and N345). Each nitrogen application treatment was repeated 3 times for a total of 12 test cells, and protection rows were set between each cell, as shown in Figure 1.
2.2. Data Acquisition
2.2.1. Measurement of Canopy Multi-Angular Hyperspectral Reflectance
Canopy spectral data were measured at the bud stage (June 24), flowering stage (July 9), flowering and boll stage (July 24), boll maturation period (August 9), and boll opening stage (August 31). Between 11.00 and 16.00 local time, an SR-3500 portable ground feature spectrometer (field of view angle of 25°, sensor sampling interval of 1 nm, and spectral detection range of 350–2500 nm) produced by SR3500 full-spectrum portable ground object spectrometer from (Spectrum Evolution, Southlake, TX, USA) was used to col
Select the spectral reflectance data of cotton canopies under different nitrogen treatments. The sensor was placed on a rotating stand of the multi-angle observation device, and the different viewing angles of the spectrum were determined according to the angle knob on the bracket (Figure 2), measured with the sensor probe at a height of about 0.7 m above the cotton canopy (completely covering the collected sample within the field of view covering a circle with a diameter of 0.31 m). During the acquisition of backscatter spectra, shadowing problems are created by sensors and devices in order to eliminate as much as possible. The multi-angle observation bracket we use uses an inclined support rod for operation, which can reduce the shadow area of the support rod while achieving precise adjustment of the observation angle. VZAs were measured from −60° to 60°, at 10° intervals, with 10 spectra per angle. The direction of solar irradiation and the opposite side of the observation direction is defined as the “forward observation direction” (+), and the same side of the solar irradiation direction and observation direction is defined as the “backward observation direction” (−). In order to reduce the influence of cloud cover and solar altitude changes on spectral reflectance, BaSO4 was used for standard whiteboard correction before and after the measurement of each group of targets. The spectral data is stored by using the Personal Digital Assistant (PDA) through the CED Mobile-DAR Win compact software (Spectrum Evolution, Southlake, TX, USA) and then saved as a CSV format file by the computer’s SED to CSV Converter software (Spectrum Evolution, Southlake, TX, USA) for subsequent processing.
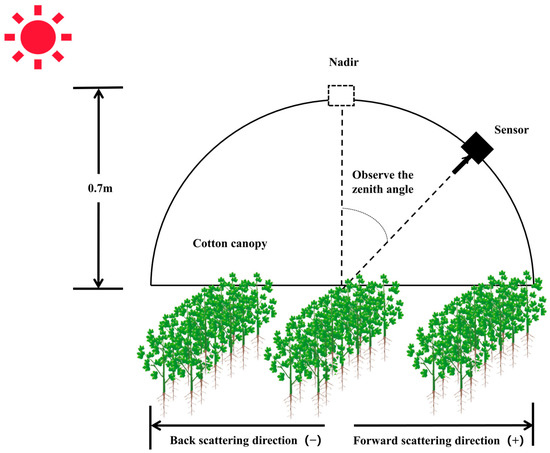
Figure 2.
Schematic diagram of measurement method.
2.2.2. Determination of Aboveground N Concentrations
All cotton plants in the test were sampled from the budding stage. The sampling periods were as follows: bud stage, flowering stage, flower bell stage, full bell stage, and spit stage. Three cotton plants were selected in each test area according to stems, leaves, bud bells, and other different organs. They were high-temperature desiccation at 105 °C for 30 min, baked to constant weight at 80 °C, and the dry matter weight was determined. The nitrogen content was determined by the Dumas method, the aerial nitrogen concentration was determined by Kjeldahl−N analysis, and the aerial nitrogen concentration (g/kg) was expressed by dry weight basis [21].
2.3. Evaluation of the Spectral Index of Nitrogen Nutrition in Cotton
In this study, based on the multi-angle spectral data collected under different nitrogen treatments in the five growth stages of cotton, the precise evaluation of cotton ANC and the elimination of the angle effect of the observed spectrum were carried out. The research process consisted of three modules: feature selection, index construction, and the construction of an ANC estimation model (Figure 3). Differences among multi-angle canopy spectral data collected at five cotton growth stages were analyzed by statistical tests (Figure 4). After the normality test, the forward scatter observations (0°–60°, 36 spectra × 5 growth periods) and backscatter observations (−60°–0°, 36 spectra × 5 growth periods) of the spectral data were subjected to a nonparametric Kruskal–Wallis test, respectively. Under the analysis of the variance of multiple sample sets, all spectral bands reached extremely significant differences (p < 0.01), so the Kruskal–Wallis test statistic H value was used to compare the two observation directions (forward scattering and backscattering scattering). The magnitude of the difference in spectral reflectance. The larger the H value, the more statistically significant the difference between the sample medians is, so spectral bands with relatively small differences in the spectral bands under different observation angles of the two scattering directions are obtained.
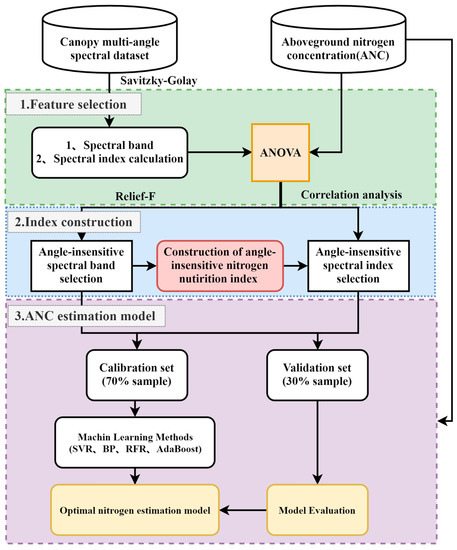
Figure 3.
Schematic illustration of cotton ANC estimation based on multi-angle hyperspectral data and machine learning.
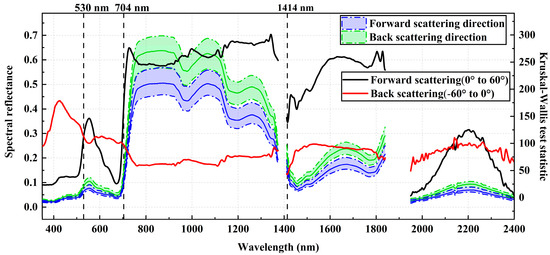
Figure 4.
Cotton canopy spectral change characteristics under two-way observation angles (purple and green areas are one-quarter median and three-quarters median spectral reflectance ranges in two scattering directions (n = 2340)). Solid black and red lines are Kruskal–Wallis test statistics between different viewing angles for two scattering directions (n = 1170).
2.3.1. Construction of the Spectral Index
Based on the results of variance analysis and the theoretical basis of plant leaf radiation, scattering, and absorption, the angle insensitive nitrogen index (AINI) suitable for different VZAs was constructed using the three-band index construction method, and the nitrogen nutrient spectral index insensitive to the observation angle was normalized through three different wavelength reflective factors. The bands with good correlation with nitrogen under different VZAs were screened using the Relief-F algorithm and the exhaustive method. The Relief-F algorithm selects the optimal characteristic wavelength with a strong correlation by accumulating the weight of the relevant wavelength, and it has strong robustness to outliers. The basic idea is to first obtain a sample R from the sample set D, and then take k adjacent samples from the sample set of the same type and the sample that is different from R, and then in the feature set F; if the heterogeneous sample on a certain feature is greater than the same sample, then this feature is conducive to classification, increase its weight, repeat n times, and take the mean of all results as the final weight value of each feature [22].
where Fj is the weight value of feature j. represents the sum of the distances of k homogeneous neighboring samples R on feature j; represents the sum of the distances of the selected k heterogeneous neighboring samples and sample R on feature j.
In order to find the best band combination, the two reference band ranges were exhaustively searched, and finally, the optimal wavelength combination was obtained, which inverted the cotton nitrogen content. The red edge (700–760 nm) is a transition region with rapid changes in leaf reflectivity caused by strong pigment absorption in the red spectrum and leaf scattering in the near-infrared spectrum, and it has been found that the red edge is sensitive to crop canopy nitrogen [23]. Nitrogen is the main raw material of chlorophyll, and nitrogen deficiency seriously affects photosynthetic utilization efficiency. The 530 nm band is considered to be a highly correlated band between the lutein cycle and the non-photochemical quenching of leaves; it can reflect the photosynthetic utilization efficiency of leaves and is an important band for monitoring nitrogen [24]. Through the Relief-F algorithm, we obtained two angle-insensitive spectral bands of 704 nm and 1412 nm, so the AINI expression is as follows:
2.3.2. Classical Vegetation Index Screening
In previous studies, a number of spectral indices have been developed for estimating crop nitrogen content. In this study, 19 spectral indices were selected to evaluate their ability to estimate ANC for different cotton VZAs. The selected spectral indexes are shown in Table 2.
Table 2.
Summary of selected spectral parameters reported in the literature.
2.4. Model Construction and Verification
The dataset is divided into two parts: 7/10 is the training set, and 3/10 is the validation set. In this study, according to the correlation between the spectral index and aboveground nitrogen concentration, the performance of different spectral indices at different VZAs was compared to determine the most suitable observation angle for the spectral index. The two spectral (AINI, PRI) exponential model input variables were screened. The output variable is the aboveground nitrogen concentration, and Python software is used to model four machine learning algorithms based on support vector regression (SVR), BP neural network, random forest (RF), and AdaBoost, which were selected to quantify the model accuracy.
Support Vector Machines (SVM) is a machine learning model that uses hyperplanes to segment data, and its method of segmenting data is to find a plane (or a straight line for two-dimensional data) to classify the data and then vector to maximize the segmentation of the data. Support vector regression (SVR) is a generalized form of support vector machine (SVM), which is mainly used to solve nonlinear regression problems. It solves the nonlinear regression problem of samples by selecting kernel function ideas. This article uses the linear kernel function in SVR, whose definition is shown in Equation (3):
Back Propagation (BP) artificial neural networks are the most widely used algorithms in the Artificial Neural Network (ANN) architecture and follow the basic principle of the Gradient Steepest Descent Method to iteratively minimize errors. The processing unit is the most basic component unit of the neural network, and the calculation equations for the input and output of the processing unit are shown in Equation (4):
where fi is the output signal of the artificial neural network processing unit; neti is an integration function; and f is the transfer function of the artificial neural network processing unit. Wij is the connection weight value between the processing units of the artificial neural network, Xi is the input vector, and θi is the threshold for the processing unit.
Random Forest (RF) is an ensemble learning bagging method designed for decision trees, which combines the inverse values of multiple decision trees to output the final prediction result, and each decision tree is built according to the random vector value of the random forest, and then outputs a high accuracy result.
Commonly used ensemble learning methods include bagging and boosting; this study uses the Adaboost algorithm in boosting, which is an iterative algorithm whose principle is to train different classifiers (weak classifiers) for the same training set, set these weak classifiers together to form a stronger final classifier (strong classifier), and use the voting method and vote by majority to determine the final prediction result. Among them, the base learner selected by the Adaboost algorithm in this study is Ridge Regression, which is a biased estimation regression method dedicated to collinear analysis. The structure of the Ridge Regression model is similar to the ordinary linear regression model; the difference is mainly reflected in the loss function, and the loss function calculation is shown in Equations (5) and (6).
w is a vector of length n; the coefficient θ excludes the intercept term; m is the sample number; and n is the number of features. Ridge regression tends to shrink some coefficients to 0, which can alleviate the problem of multiple collinearity and overfitting.
The coefficient of determination (R2) and the root-mean-square error (RMSE) were selected to evaluate the model. If the model R2 is higher and the RMSE is lower, the model precision and accuracy of the predicted ANC are higher, and a 1:1 plot of the observed and estimated values can be plotted to prove the degree of model fit.
3. Results
3.1. Change in the Law of Spectral Reflectance of the Cotton Canopy under Different VZAs
In order to more clearly show the differences in spectral reflectance at different observation angles, this study conducted non-parametric tests on the spectral data of all periods (Figure 4). The results show that after eliminating the bands affected by atmospheric noise around 1400 nm, 1920 nm, and 2400 nm, the entire spectral range (350 nm–2400 nm) shows that the backscattering reflectance is higher than the forward scattering, and the difference is extremely significant (p < 0.01). In the two scattering directions, the results under different observation angles show that all bands show extremely significant differences (p < 0.001), so the test statistic h value is used to show the spectral bands with relatively small differences. The results show that the test statistics in the visible light band (350–670 nm) show that the minimum value of the backscattering direction (0° to 60°) is in the red light band (672 nm), and the maximum value is in the green light band (555 nm); the minimum value in the forward scattering direction (−60° to 0°) is in the green light band (554 nm), and the maximum value appears in the blue light band (430 nm). It shows that the two scattering directions have different changes in the spectrum under different observation angles. The overall test statistics of the −60° to 0° observation angle are relatively stable and lower than the 0° to 60° observation angle, indicating that the cotton canopy spectrum The reflectance backscatter direction is less affected by the viewing angle than the forward scatter direction.
3.2. Nitrogen-Sensitive Spectral Band Screening of Different VZAs
The study aimed to establish the VZA-insensitive cotton canopy nitrogen nutrition spectrum index, the Relief-F algorithm was used to screen the VZA-insensitive characteristic bands, as shown in Figure 5, and the result was that the ANC of cotton had the strongest correlation with different angles at 705 nm and 1414 nm, and occupied the largest weight in all bands. At 1414 nm, VZA showed the optimal weight between −10° and 10°, 705 nm showed the optimal weight between 0° and 10°, and the rest showed a downward trend with the increase in VZA. This shows that simply using the spectral band to construct an angle-insensitive cotton nitrogen estimation model is disturbed by many external environments, and the vegetation index of the band combination can enhance a certain characteristic or detail of vegetation, which is more suitable for establishing a VZA-insensitive cotton canopy nitrogen estimation model.
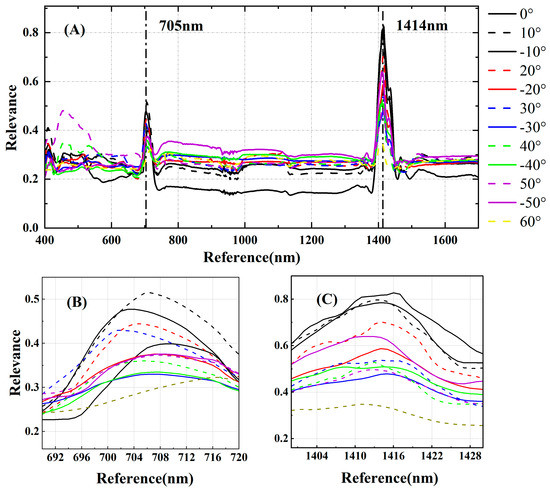
Figure 5.
Based on the Relief-F algorithm, the single-wavelength weight value of ANC with cotton under different VZAs was evaluated. (A) Single-wavelength weight value with cotton ANC under different VZA, (B) Weight value of ANC near 705 nm and cotton under different VZA, (C) Weight value of ANC near 1414 nm and cotton under different VZA.
3.3. Nitrogen-Sensitive Spectral Index Screening of Different VZAs
To further clarify the abilities of spectral indices to estimate ANC and whether ANC is affected by VZA, 20 spectral indices are listed in Table 3, including 19 published indices, as well as the correlation relationship between the constructed index and 180 samples of cotton ANC under different VZAs, expressed by the correlation coefficient (r); The two best-performing spectral indices (PRI and AINI) show a strong correlation (r ≥ 0.849) in the backscattering direction, so bolded r-values greater than 0.849 are represented. It can be seen from Table 3 that the correlation between most spectral indices and ANC changes greatly with the change in VZA, such as SIPI, TCARI/OSAVI, IPVI, GNDVI, etc., and some spectral indices are not strongly correlated with ANC in different VZAs, such as DVI, SAVI, SIPI, OSAVI, NRI, NDCI, and NPCI, indicating that they are not suitable for estimating ANC. It is worth noting that the correlation coefficients of all spectral indices in the table for nadir observations are smaller than those for off-nadir observations. Among them, PRI and AINI did not differ much under each VZA, indicating that PRI and AINI were relatively stable in estimating nitrogen using multi-angle remote sensing. In addition, PRIC, DDNI, MTCI, NPQI, and mSR705 can also be used as spectral indices to monitor nitrogen. SIPI, DDNI, mSR705, and MTCI are the most advantageous when observing at 60°, and the correlation coefficient is above 0.63. The above results show that, compared with nadir observation, the spectral information obtained by off-nadir observation can improve the inversion accuracy of ANC.
Table 3.
Correlation coefficient between ANC and spectral index of cotton with different VZAs.(r) * and ** represent spectral index and ANC correlation. * represents a significant correlation of p < 0.05, ** represents a very significant correlation of p < 0.01. values greater than 0.849 are expressed in bold.
By comparing the relationship between spectral index and ANC, it can be seen that the change in correlation has obvious angle sensitivity. Therefore, after removing the spectral indices with no significant correlation with ANC, 14 spectral indices with good correlation with ANC were screened out, and an analysis of variance was performed on different observation angles of the two scattering directions (Figure 6). The results showed that there were no significant differences in the angles of PRI, PRIC, NPQI, and AINI in the backscattering direction (−60° to 0°), and the F value of AINI was the smallest. In the forward scattering direction (0° to 60°), only GNDVI and NPQI are not sensitive to angle differences, and the rest show statistically significant differences. Except for GNDVI and CIred-edge3, the F values of other spectral indices at 0° to 60° observation angles are higher than those at backscattering (−60° to 0° observation angles), indicating that in the direction of backscattering, the spectral indices are affected by the angle with little effect. We found that the spectral index constructed from the near-infrared band is more affected by the observation angle, while the spectral index constructed from the visible light band range and the position of the red edge is less affected by the observation angle. The newly constructed AINI is superior to the spectral index with excellent correlation with ANC in Figure 6B in both scattering directions and can realize the estimation of cotton canopy ANC under the elimination of the influence of observation angle.
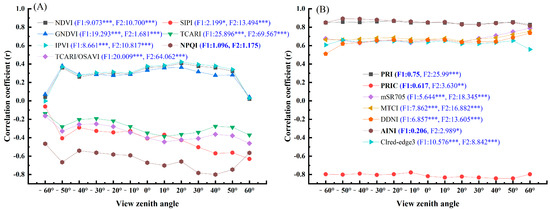
Figure 6.
Correlation between spectral indices and ANC under different VZAs. (A) VZA sensitivity index, (B) VZA insensitivity index. In the brackets of the legend, F1 is the F value of variance analysis in the backscattering direction (−60° to 0°), F2 is the F value in the forward scattering direction (0° to 60°), * p < 0.05; ** p < 0.01; *** p < 0.001.
Through the results of variance analysis and correlation, six optimal spectral indices (PRI, NPQI, AINI, PRIC, mSR705, and MTCI) were selected, and the linear relationship with ANC was compared under the optimal VZA and nadir observation angle (Figure 7 and Figure 8). The results show that the six indices all have higher estimation accuracy at larger observation angles. At the same time, the three indexes of AINI, PRI, and PRIC have little change in the linear model accuracy of ANC at the lowest point observation angle, and the best observation angle compared with other indexes and are less affected by the observation angle. The index with the best test accuracy is AINI, which improves the estimation accuracy R2 by 0.13–0.29 at the best observation angle compared with other spectral indices, and at the same time, at the lowest observation angle, the estimation accuracy R2 increases by 0.04–0.43. In summary, the AINI constructed in this study can be better used for ANC estimation and is less affected by the observation angle.
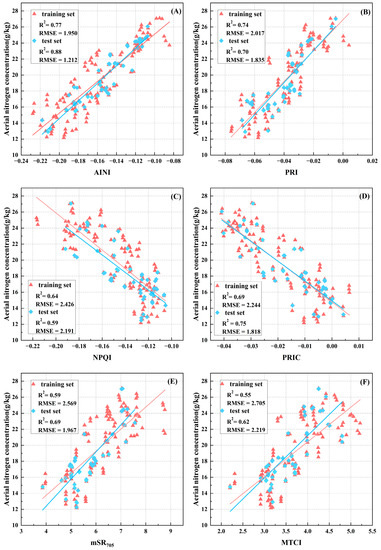
Figure 7.
Linear relationship between ANC and spectral index at specific angles: (A) −50° PRI, (B) −50° AINI, (C) 40° NPQI, (D) 50° PRIC, (E) 60° mSR705, (F) 60° MTCI.
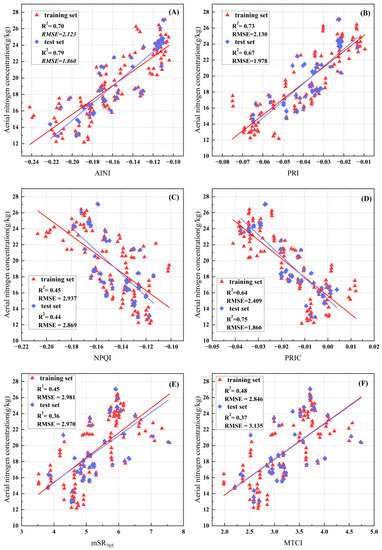
Figure 8.
Linear relationship between 0° ANC and spectral index: (A) 0° PRI, (B) 0° AINI, (C) 0° NPQI, (D) 0° PRIC, (E) 0° mSR705, (F) 0° MTCI.
3.4. Cotton Nitrogen Content Estimation Model Based on Multi-Angle Spectral Data
It can be seen from Table 3 that after correlation analysis, the indices PRI and AINI are significantly correlated with ANC, and the correlation between each VZA reaches more than 0.8, so these two spectral indices were selected as the input variables for the construction of machine learning models. A total of 70% of the data volume was randomly selected as the training data set, and 30% was used as the test data set. The four models, support vector regression (SVR), BP neural network, random forest (RF), and AdaBoost, were used for training, and the Python programming language was used to implement the algorithm.
Taking the −20° PRI index and −50° AINI as the model input variables, the measured and predicted values of the four machine-learning models were compared; Figure 9 shows the two best spectral-index VZA estimation models and the combined index estimation model. As can be seen from Figure 10, the measured value and the predicted value of the model based on −20° PRI are R2 0.76 and 0.71, and the RMSE values are 2.314 and 2.190, respectively, based on −50° AINI. The measured and predicted R2 values of the model are greater than −20° PRI, and the RMSE is less than the −20° PRI index model. Although both the −50°AINI model and the −20°PRI model can be used for nitrogen estimation, they are based on a single VZA, and combining the two can greatly improve the accuracy of the model. Compared with SVR, BP neural network, and AdaBoost, the RF model predicts the change in cotton ANC better, with a prediction accuracy R2 of 0.98 and an RMSE of 0.590 in the training set. The above results show that, compared with the single VZA spectral index model, the model based on the combination of the best VZA and the best spectral index can better estimate the ANC. The above results also show that the spectral index constructed in this study can improve the estimation accuracy of nitrogen.
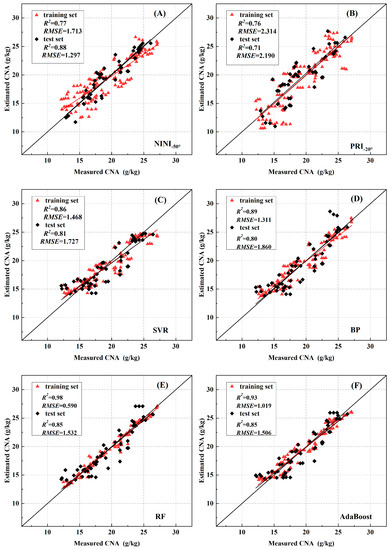
Figure 9.
Comparison of predicted and measured values of nitrogen accumulation in cotton canopy based on AINI−50°, PRI−20°, and their combinations (n = 180, training set = 126, validation set = 54): (A) −50° AINI, (B) −20° PRI, (C) SVR Modeling of two spectral indices combination, (D) BP Modeling of two spectral indices combination, (E) RF Modeling of two spectral indices combination, (F) AdaBoost Modeling of two spectral indices combination.
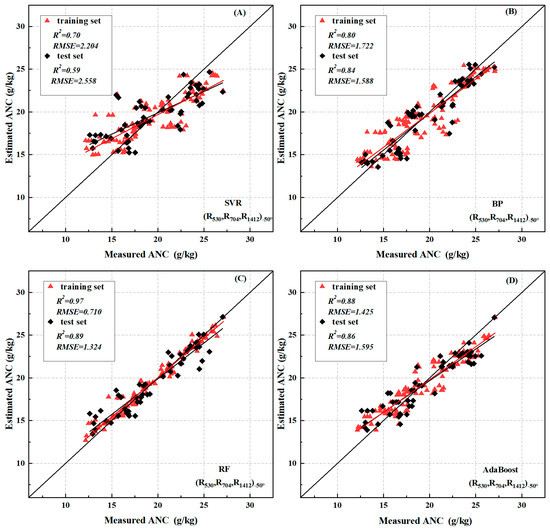
Figure 10.
Machine learning modeling in the 530 nm, 704 nm, and 1412 nm bands based on spectral index AINI−50° (n = 180, training set = 126, validation set = 54): (A) SVR, (B) BP, (C) RF, (D) AdaBoost.
In order to further examine the performance of the four machine learning methods, nitrogen estimation models are constructed based on spectral index PRI and AINI in the band under the optimal VZA. Figure 10, Figure 11 and Figure 12 are based on the spectral index AINI−50° based on 530 nm, 704 nm, and 1412 nm band machine learning modeling, based on spectral index PRI−20° 531 nm, 570 nm, band machine learning modeling, based on spectral index AINI−50° and PRI−20° 530 nm, 531 nm, 570 nm, 704 nm, 1412 nm band machine learning modeling, as can be seen from Figure 10, Figure 11 and Figure 12, The four machine learning models based on the AINI band are better than the ones based on the PRI band. Whether based on spectral index modeling or band modeling, the random forest method has the best modeling effect; the R2 of the training set reaches more than 0.97, and the RMSE is less than 0.819; the combination of the two improves the accuracy of the model.
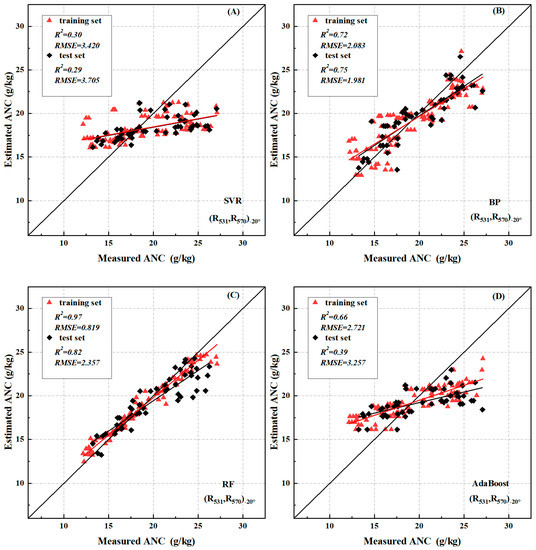
Figure 11.
Machine learning modeling in the 531 nm, 570 nm bands based on spectral index PRI−20° (n = 180, training set = 126, validation set = 54): (A) SVR, (B) BP, (C) RF, (D) AdaBoost.
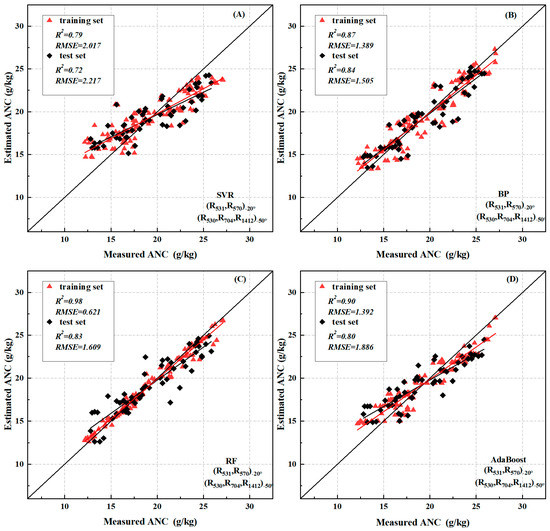
Figure 12.
Machine learning modeling based on the spectral index AINI−50°’s 530 nm, 704 nm, 1412 nm bands and PRI−20°’s 531 nm, 570 nm bands (n = 180, training set = 126, validation set = 54): (A) SVR, (B) BP, (C) RF, (D) AdaBoost.
4. Discussion
4.1. Effect of VZA on Canopy Reflectivity
In this study, we studied the variation of spectral reflectance of cotton canopy under different VZAs and the correlation between the spectral index and cotton ANC. The results show that the spectral reflectance in the backscatter direction was greater than that in the forward-scatter direction, and the two spectral indices (AINI, PRI) screened out achieved the optimal nitrogen estimation effect in the backward observation. This is because, in the backscatter region, the spectrometer probe and the sun are on the same side, the observation field of view mainly contains the direct radiation of the sun, and the vegetation itself is brighter, so the observed observation reflectance is also larger. When the spectrometer probe and the sun are on the opposite side (that is, in the forward-scattering direction), the observation field of view will receive information about the shadow part of the canopy that is not irradiated by solar radiation, resulting in low reflectance [44]. When estimating the cotton nitrogen content, backward observations obtained better results than forward observations, possibly due to the fact that backward observations are stronger than forward [11,45].
In addition, the VZA affects the proportion of the soil background or other information captured in the observation field of view, resulting in a different canopy reflectivity in cotton, and some researchers have pointed out that the difference in the target components significantly affects crop canopy reflectance [46,47]. Compared with the visible band, the near-infrared band shows a bigger difference in reflectivity under different VZAs, which is also demonstrated by Figure 4; this is caused by spatial heterogeneity of spectral properties in the field of view [48]. The fact that pigments are strongly absorbed in the visible region and abundant in healthy vegetation leads to the fact that the reflectance spectrum of plants is generally low and less variable in the visible region relative to near-infrared wavelengths [49].
4.2. The Spectral Index Estimates the Difference in ANC
In this study, the indices AINI, PRI, and PRIC were strongly correlated with nitrogen accumulation, and the correlation coefficient reached an average of more than 0.8. The bands constituting the above spectral indices were distributed in the green band and the red edge area, which is because the green band is more sensitive to plant nitrogen status. Previous studies have shown that the degree of blue shift at the red edge of vegetation is significantly related to the physiological characteristics of the vegetation canopy [50]. Red edge (700–760 nm) is a transition region with rapid changes in leaf reflectivity caused by strong pigment absorption in the red spectrum and leaf scattering in the near-infrared spectrum, and it has been found that the red edge is sensitive to crop canopy nitrogen [23]. The previous research illustrated the reliability of spectral information in the red-edged region, and the results of this study confirm that view. The better indices (AINI, PRI, PRIC, MTCI, and mSR705) include the wavelength of green light or the red−edge region.
Under non-lowest point observation, more canopy structure information can be obtained in the detection field of view, especially for cotton as a sunflower crop. The spectral data obtained in the backscattering direction will obtain more physiological information on cotton leaves, so the estimation of nitrogen concentration is better than nadir observation in a multi-angle detection [51]. At the same time, factors such as crop canopy distribution and soil background will estimate the spectral index [52]. The larger the VZA, the larger the proportion of crop information within the sensor’s field of view and the smaller the proportion of soil [10]. Therefore, AINI and PRIC have the strongest correlation with cotton ANC in larger VZAs. When making small VZA observations, the intensity and depth of light entering the crop canopy are relatively strong, the proportion of the scattering and reflection information captured increases, and the spectral index estimation ability will be improved, so the model accuracy is the highest when the index PRI is observed at −20°. Therefore, by selecting the appropriate spectral index, both the backward- and forward-scattering directions can obtain better estimation effects.
As PRI is an anisotropic spectral index, the canopy structure, soil background, and solar observation geometry all comprehensively affect its value [53]. The difference in nitrogen content estimated by the PRI in different VZAs is not directly driven by VZA but rather by changing the proportion of the contribution of the target components to canopy reflectance to produce indirect effects so that the PRI performance is relatively stable for different VZAs. The three-band index constructed in this study is also consistent and stable at all angles, which may be because the bands involve three relatively independent spectral regions (green light, the red edge region, and shortwave infrared), which reduces the interaction of information between bands. AINI is a spectral index that is constructed using band combination, which can enhance a certain characteristic or detail of vegetation so that the accuracy of the model is improved and its operation is relatively simple, making it more widely applicable in the monitoring of nitrogen accumulation. Although the study was conducted in the field, its estimated performance needs to be verified many times before it can be widely used. Therefore, in the next step, it is necessary to verify the different cultivation conditions of a variety of crops to prove the superior performance of multi-angle remote sensing based on the spectral index.
4.3. Future Applications and Limitations of Research
This study improves the retrieval accuracy of cotton canopy nitrogen to a certain extent and conducts multi-angle observations within a fixed time range to reduce the influence of the sun angle, effectively realizing accurate monitoring of cotton canopy nitrogen at different times of the day. Acquisition and application of multi-angle remote sensing data based on ground platforms can achieve more accurate results, but its low efficiency and limitation of measurement range limit its application in large-scale farmland [54]. UAV equipment has the advantages of high flexibility and low cost and can quickly and efficiently acquire data with higher spatial resolution [55,56,57]. For example, Lu et al. used the multi-angle images of UAV multi-spectral cameras, especially the multi-spectral images in the backsight direction, to help more accurately estimate the nitrogen concentration parameters of winter wheat, and the combination of multi-angle images and nadir view images also improved the estimation of nitrogen concentrations in winter wheat [48]. The rapid integration and development of various observation platforms provide data guarantees for multi-angle remote sensing. Compared with drones and satellite platforms, the VZA obtained by ground multi-angle observation equipment is more stable; the multi-angle remote sensing information of the ground, aviation, and space complement each other and can realize rapid and large-scale accurate monitoring of farmland information. As a result, the follow-up research results will be validated at the UAV scale, and large-scale accurate monitoring of cotton nitrogen can be achieved by combining the high maneuverability and flexibility of UAVs with the elimination of the influence of observation angles and sun angles.
Although the AINI-based cotton ANC estimation model has been established and has good estimation accuracy, it is limited by the low efficiency of ground remote sensing and the limitation of the measurement range, which limits its application in large-scale farmland. In addition, this study only focuses on the effect of VZA on the spectral index estimation of cotton nitrogen status and does not consider the underlying mechanisms of these influencing factors. This work only analyzed and validated AINI for cotton canopy, so additional quantitative field validation should be performed in the future to investigate the feasibility of using AINI for canopy nitrogen estimation for different crops and planting patterns to establish crop nitrogen estimation models common in different growing environments.
5. Conclusions
The timely and accurate estimation of canopy nitrogen levels is essential for crop growth monitoring and agricultural management. In this study, multi-angle remote sensing observations showed that nitrogen monitoring was sensitive to VZA and that off-nadir observation allows a more accurate estimate of cotton nitrogen content. We used the Relief−F algorithm to identify bands that are sensitive to nitrogen but not to VZA, and we created a nitrogen spectral index AINI = (R530 − R704)/(R1412 + R704) suitable for different VZA to estimate cotton canopy nitrogen. We studied (i) the variation of the spectral reflectance of the cotton canopy under different VZA conditions, (ii) the ability of the existing spectral index to estimate nitrogen concentration under different VZAs, and (iii) the construction of a cotton canopy nitrogen monitoring model. The following conclusions can be drawn from this work:
- (1)
- (2)
- The existing spectral indices selected in this study have obvious angular sensitivity to changes in the correlation between ANC, and the correlation coefficients in the zenith direction are smaller than those of off-nadir observations (Table 3).
- (3)
- RF models combining the −50° AINI index and the −20° PRI index can better predict the change of ANC in cotton (test set R2 = 0.98, RMSE = 0.590, validation set R2 = 0.85, RMSE = 1.532) (Figure 9).
Author Contributions
Conceptualization, X.Z. and M.Y.; methodology, X.Z. and M.Y.; validation, X.Z., M.Y., and L.M.; formal analysis, X.C. and X.Z.; investigation, X.Z., and C.Y.; resources, Z.Z. and X.L.; data curation, S.Q. and X.Z.; writing—original draft preparation, X.Z. and L.W.; writing—review and editing, X.Z., M.Y., X.C., and Z.Z.; funding acquisition, Z.Z. and X.L. All authors have read and agreed to the published version of the manuscript.
Funding
The study was supported by the National Natural Science Foundation of China, China (Grant No. 42061058), the National Key R&D Program of China (Grant No. 2022YFD2002401), “Strong Youth” Scientific and Technological Innovation Backbone Talent Plan of Xinjiang Production and Construction Corps (Grant No. 2022CB002-01).
Data Availability Statement
Not applicable.
Conflicts of Interest
The authors declare that the research was conducted in the absence of any commercial or financial relationships that could be construed as a potential conflict of interest.
References
- Zheng, J.; Song, X.; Yang, G.; Du, X.; Mei, X.; Yang, X. Remote sensing monitoring of rice and wheat canopy nitrogen: A review. Remote Sens. 2022, 14, 5712. [Google Scholar]
- Song, L.; Wang, L.; Yang, Z.; He, L.; Feng, Z.; Duan, J.; Feng, W.; Guo, T. Comparison of algorithms for monitoring wheat powdery mildew using multi-angular remote sensing data. Crop J. 2022, 10, 1312–1322. [Google Scholar]
- Bian, Z.; Roujean, J.L.; Fan, T.; Dong, Y.; Hu, T.; Cao, B.; Li, H.; Du, Y.; Xiao, Q.; Liu, Q. An angular normalization method for temperature vegetation dryness index (TVDI) in monitoring agricultural drought. Remote Sens. Environ. 2023, 284, 113330. [Google Scholar]
- He, L.; Song, X.; Feng, W.; Guo, B.; Zhang, Y.; Wang, Y.; Wang, C.; Guo, T. Improved remote sensing of leaf nitrogen concentration in winter wheat using multi-angular hyperspectral data. Remote Sens. Environ. 2016, 174, 122–133. [Google Scholar]
- Gao, F.; Jin, Y.; Schaaf, C.B.; Strahler, A.H. Bidirectional NDVI and atmospherically resistant BRDF inversion for vegetation canopy. IEEE Trans. Geosci. Remote Sensing. 2002, 40, 1269–1278. [Google Scholar]
- Chen, J.M.; Liu, J.; Leblanc, S.G.; Lacaze, R.; Roujean, J. Multi-angular optical remote sensing for assessing vegetation structure and carbon absorption. Remote Sens. Environ. 2003, 84, 516–525. [Google Scholar]
- Strahler, A.H.; Jupp, D.L. Modeling bidirectional reflectance of forests and woodlands using Boolean models and geometric optics. Remote Sens. Environ. 1990, 34, 153–166. [Google Scholar] [CrossRef]
- Kennedy, B.E.; King, D.J.; Duffe, J. Retrieval of Arctic Vegetation Biophysical and Biochemical Properties from CHRIS/PROBA Multi-Angle Imagery Using Empirical and Physical Modelling. Remote Sens. 2021, 13, 1830. [Google Scholar] [CrossRef]
- Chen, H.; Huang, W.; Li, W.; Niu, Z.; Zhang, L.; Xing, S. Estimation of LAI in winter wheat from multi-angular hyperspectral VNIR data: Effects of view angles and plant architecture. Remote Sens. 2018, 10, 1630. [Google Scholar] [CrossRef]
- Stagakis, S.; Markos, N.; Sykioti, O.; Kyparissis, A. Monitoring canopy biophysical and biochemical parameters in ecosystem scale using satellite hyperspectral imagery: An application on a Phlomis fruticosa Mediterranean ecosystem using multiangular CHRIS/PROBA observations. Remote Sens. Environ. 2010, 114, 977–994. [Google Scholar]
- Kong, W.; Huang, W.; Liu, J.; Chen, P.; Qin, Q.; Ye, H.; Peng, D.; Dong, Y.; Mortimer, A.H. Estimation of canopy carotenoid content of winter wheat using multi-angle hyperspectral data. Adv. Space Res. 2017, 60, 1988–2000. [Google Scholar]
- Roosjen, P.P.; Brede, B.; Suomalainen, J.M.; Bartholomeus, H.M.; Kooistra, L.; Clevers, J.G. Improved estimation of leaf area index and leaf chlorophyll content of a potato crop using multi-angle spectral data-potential of unmanned aerial vehicle imagery. Int. J. Appl. Earth Obs. Geoinf. 2018, 66, 14–26. [Google Scholar] [CrossRef]
- Li, W.; Sun, Z.; Lu, S.; Omasa, K. Estimation of the leaf chlorophyll content using multiangular spectral reflectance factor. Plant Cell Environ. 2019, 42, 3152–3165. [Google Scholar] [CrossRef]
- Yang, Q.; Huang, W.; Zhao, J.; Dong, L.; Huang, L.; Zhang, D.; Liu, L.; Yang, G.; Song, X. Effect of Canopy Geometry on Estimation of Leaf Area Index in Winter Wheat Using Multi-angle Spectrum. Int. J. Agric. Biol. 2013, 15, 1187–1192. [Google Scholar]
- Guo, B.; Zhu, Y.; Feng, W.; He, L.; Wu, Y.; Zhou, Y.; Ren, X.; Ma, Y. Remotely estimating aerial N uptake in winter wheat using red-edge area index from multi-angular hyperspectral data. Front. Plant Sci. 2018, 9, 675. [Google Scholar] [CrossRef]
- Wang, L.; Liao, Q.; Xu, X.; Li, Z.; Zhu, H. Estimating the vertical distribution of chlorophyll in winter wheat based on multi-angle hyperspectral data. Remote Sens. Lett. 2020, 11, 1032–1041. [Google Scholar]
- Jackson, R.D.; Teillet, P.M.; Slater, P.N.; Fedosejevs, G.; Jasinski, M.F.; Aase, J.K.; Moran, M.S. Bidirectional measurements of surface reflectance for view angle corrections of oblique imagery. Remote Sens. Environ. 1990, 32, 189–202. [Google Scholar]
- Kimes, D.S.; Newcomb, W.W.; Tucker, C.J.; Zonneveld, I.S.; Van Wijngaarden, W.; De Leeuw, J.; Epema, G.F. Directional reflectance factor distributions for cover types of Northern Africa. Remote Sens. Environ. 1985, 18, 1–19. [Google Scholar] [CrossRef]
- Ranjan, R.; Chopra, U.K.; Sahoo, R.N.; Singh, A.K.; Pradhan, S. Assessment of plant nitrogen stress in wheat (Triticum aestivum L.) through hyperspectral indices. Int. J. Remote Sens. 2012, 33, 6342–6360. [Google Scholar] [CrossRef]
- Yao, H.; Zhang, Y.; Yi, X.; Zhang, X.; Fan, D.; Chow, W.S.; Zhang, W. Diaheliotropic leaf movement enhances leaf photosynthetic capacity and photosynthetic light and nitrogen use efficiency via optimising nitrogen partitioning among photosynthetic components in cotton (Gossypium hirsutum L.). Plant Biol. 2018, 20, 213–222. [Google Scholar]
- Dumas, J. Procédés de l’analyse organique. Ann. Chim. Phys. 1831, 47, 198–205. [Google Scholar]
- Yang, M.; Huang, C.; Kang, X.; Qin, S.; Ma, L.; Wang, J.; Zhou, X.; Lv, X.; Zhang, Z. Early Monitoring of Cotton Verticillium Wilt by Leaf Multiple “Symptom” Characteristics. Remote Sens. 2022, 14, 5241. [Google Scholar]
- Li, F.; Miao, Y.; Feng, G.; Yuan, F.; Yue, S.; Gao, X.; Liu, Y.; Liu, B.; Ustin, S.L.; Chen, X. Improving estimation of summer maize nitrogen status with red edge-based spectral vegetation indices. Field Crop. Res. 2014, 157, 111–123. [Google Scholar]
- Evain, S.; Flexas, J.; Moya, I. A new instrument for passive remote sensing: 2. Measurement of leaf and canopy reflectance changes at 531 nm and their relationship with photosynthesis and chlorophyll fluorescence. Remote Sens. Environ. 2004, 91, 175–185. [Google Scholar] [CrossRef]
- Jordan, C.F. Derivation of leaf-area index from quality of light on the forest floor. Ecology 1969, 50, 663–666. [Google Scholar] [CrossRef]
- Rouse, J.W.; Haas, R.H.; Schell, J.A.; Deering, D.W. Monitoring Vegetation Systems in the Great Plains with Erts. NASA Spec. Publ. 1974, 351, 309. [Google Scholar]
- Huete, A.R. A soil-adjusted vegetation index (SAVI). Remote Sens. Environ. 1988, 25, 295–309. [Google Scholar] [CrossRef]
- Peñuelas, J.; Filella, I.; Gamon, J.A. Assessment of photosynthetic radiation—Use efficiency with spectral reflectance. New Phytol. 1995, 131, 291–296. [Google Scholar]
- Penuelas, J.; Baret, F.; Filella, I. Semi-empirical indices to assess carotenoids/chlorophyll a ratio from leaf spectral reflectance. Photosynthetica 1995, 31, 221–230. [Google Scholar]
- Gitelson, A.A.; Kaufman, Y.J.; Merzlyak, M.N. Use of a green channel in remote sensing of global vegetation from EOS-MODIS. Remote Sens. Environ. 1996, 58, 289–298. [Google Scholar]
- Rondeaux, G.; Steven, M.; Baret, F. Optimization of soil-adjusted vegetation indices. Remote Sens. Environ. 1996, 55, 95–107. [Google Scholar] [CrossRef]
- Daughtry, C.S.; Walthall, C.L.; Kim, M.S.; De Colstoun, E.B.; McMurtrey Iii, J.E. Estimating corn leaf chlorophyll concentration from leaf and canopy reflectance. Remote Sens. Environ. 2000, 74, 229–239. [Google Scholar]
- Schleicher, T.D.; Bausch, W.C.; Delgado, J.A.; Ayers, P.D. Evaluation and refinement of the nitrogen reflectance index (NRI) for site-specific fertilizer management. In Proceedings of the 2001 ASAE Annual Meeting: American Society of Agricultural and Biological Engineers, New Orleans, LA, USA, 23–27 June 1998; p. 1. [Google Scholar]
- Haboudane, D.; Miller, J.R.; Tremblay, N.; Zarco-Tejada, P.J.; Dextraze, L. Integrated narrow-band vegetation indices for prediction of crop chlorophyll content for application to precision agriculture. Remote Sens. Environ. 2002, 81, 416–426. [Google Scholar] [CrossRef]
- Marshak, A.; Knyazikhin, Y.; Davis, A.B.; Wiscombe, W.J.; Pilewskie, P. Cloud-vegetation interaction: Use of normalized difference cloud index for estimation of cloud optical thickness. Geophys. Res. Lett. 2000, 27, 1695–1698. [Google Scholar] [CrossRef]
- Peñuelas, J.; Gamon, J.A.; Fredeen, A.L.; Merino, J.; Field, C.B. Reflectance indices associated with physiological changes in nitrogen-and water-limited sunflower leaves. Remote Sens. Environ. 1994, 48, 135–146. [Google Scholar] [CrossRef]
- Gamon, J.A.; Penuelas, J.; Field, C.B. A narrow-waveband spectral index that tracks diurnal changes in photosynthetic efficiency. Remote Sens. Environ. 1992, 41, 35–44. [Google Scholar]
- Feng, W.; Guo, B.; Wang, Z.; He, L.; Song, X.; Wang, Y.; Guo, T. Measuring leaf nitrogen concentration in winter wheat using double-peak spectral reflection remote sensing data. Field Crop. Res. 2014, 159, 43–52. [Google Scholar] [CrossRef]
- Sims, D.A.; Gamon, J.A. Relationships between leaf pigment content and spectral reflectance across a wide range of species, leaf structures and developmental stages. Remote Sens. Environ. 2002, 81, 337–354. [Google Scholar]
- Crippen, R.E. Calculating the vegetation index faster. Remote Sens. Environ. 1990, 34, 71–73. [Google Scholar]
- Dash, J.; Curran, P.J. Evaluation of the MERIS terrestrial chlorophyll index (MTCI). Adv. Space Res. 2007, 39, 100–104. [Google Scholar] [CrossRef]
- Barnes, J.D.; Balaguer, L.; Manrique, E.; Elvira, S.; Davison, A.W. A reappraisal of the use of DMSO for the extraction and determination of chlorophylls a and b in lichens and higher plants. Environ. Exp. Bot. 1992, 32, 85–100. [Google Scholar] [CrossRef]
- Gitelson, A.A.; Viña, A.; Ciganda, V.; Rundquist, D.C.; Arkebauer, T.J. Remote estimation of canopy chlorophyll content in crops. Geophys. Res. Lett. 2005, 32. [Google Scholar] [CrossRef]
- Kimes, D.S. Dynamics of directional reflectance factor distributions for vegetation canopies. Appl. Optics. 1983, 22, 1364–1372. [Google Scholar]
- He, L.; Zhang, H.; Zhang, Y.; Song, X.; Feng, W.; Kang, G.; Wang, C.; Guo, T. Estimating canopy leaf nitrogen concentration in winter wheat based on multi-angular hyperspectral remote sensing. Eur. J. Agron. 2016, 73, 170–185. [Google Scholar] [CrossRef]
- Colwell, J.E. Vegetation canopy reflectance. Remote Sens. Environ. 1974, 3, 175–183. [Google Scholar] [CrossRef]
- Knyazikhin, Y.; Schull, M.A.; Stenberg, P.; Moettus, M.; Rautiainen, M.; Yang, Y.; Marshak, A.; Carmona, P.L.; Kaufmann, R.K.; Lewis, P. Hyperspectral remote sensing of foliar nitrogen content. Proc. Natl. Acad. Sci. USA 2012, 110, E185–E192. [Google Scholar] [CrossRef]
- Lu, N.; Wang, W.; Zhang, Q.; Li, D.; Yao, X.; Tian, Y.; Zhu, Y.; Cao, W.; Baret, F.; Liu, S. Estimation of nitrogen nutrition status in winter wheat from unmanned aerial vehicle based multi-angular multispectral imagery. Front. Plant Sci. 2019, 10, 1601. [Google Scholar]
- Asner, G.P. Biophysical and biochemical sources of variability in canopy reflectance. Remote Sens. Environ. 1998, 64, 234–253. [Google Scholar] [CrossRef]
- Raper, T.B.; Varco, J.J. Canopy-scale wavelength and vegetative index sensitivities to cotton growth parameters and nitrogen status. Precis. Agric. 2015, 16, 62–76. [Google Scholar]
- Schutt, J.B.; Kimes, D.S.; Newcomb, W.W. Effect of heliotropism on the bidirectional reflectance of irrigated cotton. Remote Sens. Environ. 1985, 17, 13–25. [Google Scholar] [CrossRef]
- Verrelst, J.; Schaepman, M.E.; Koetz, B.; Kneubühler, M. Angular sensitivity analysis of vegetation indices derived from CHRIS/PROBA data. Remote Sens. Environ. 2008, 112, 2341–2353. [Google Scholar] [CrossRef]
- Yang, P. Exploring the interrelated effects of soil background, canopy structure and sun-observer geometry on canopy photochemical reflectance index. Remote Sens. Environ. 2022, 279, 113133. [Google Scholar] [CrossRef]
- Song, X.; Xu, D.; He, L.; Feng, W.; Wang, Y.; Wang, Z.; Coburn, C.A.; Guo, T. Using multi-angle hyperspectral data to monitor canopy leaf nitrogen content of wheat. Precis. Agric. 2016, 17, 721–736. [Google Scholar] [CrossRef]
- Burkart, A.; Aasen, H.; Alonso, L.; Menz, G.; Bareth, G.; Rascher, U. Angular dependency of hyperspectral measurements over wheat characterized by a novel UAV based goniometer. Remote Sens. 2015, 7, 725–746. [Google Scholar]
- Roosjen, P.P.; Suomalainen, J.M.; Bartholomeus, H.M.; Kooistra, L.; Clevers, J.G. Mapping reflectance anisotropy of a potato canopy using aerial images acquired with an unmanned aerial vehicle. Remote Sens. 2017, 9, 417. [Google Scholar]
- Roosjen, P.P.; Suomalainen, J.M.; Bartholomeus, H.M.; Clevers, J.G. Hyperspectral reflectance anisotropy measurements using a pushbroom spectrometer on an unmanned aerial vehicle—Results for barley, winter wheat, and potato. Remote Sens. 2016, 8, 909. [Google Scholar] [CrossRef]
Disclaimer/Publisher’s Note: The statements, opinions and data contained in all publications are solely those of the individual author(s) and contributor(s) and not of MDPI and/or the editor(s). MDPI and/or the editor(s) disclaim responsibility for any injury to people or property resulting from any ideas, methods, instructions or products referred to in the content. |
© 2023 by the authors. Licensee MDPI, Basel, Switzerland. This article is an open access article distributed under the terms and conditions of the Creative Commons Attribution (CC BY) license (https://creativecommons.org/licenses/by/4.0/).