An Assessment of the Lancaster Sound Polynya Using Satellite Data 1979 to 2022
Abstract
1. Introduction
2. Materials and Methods
3. Results
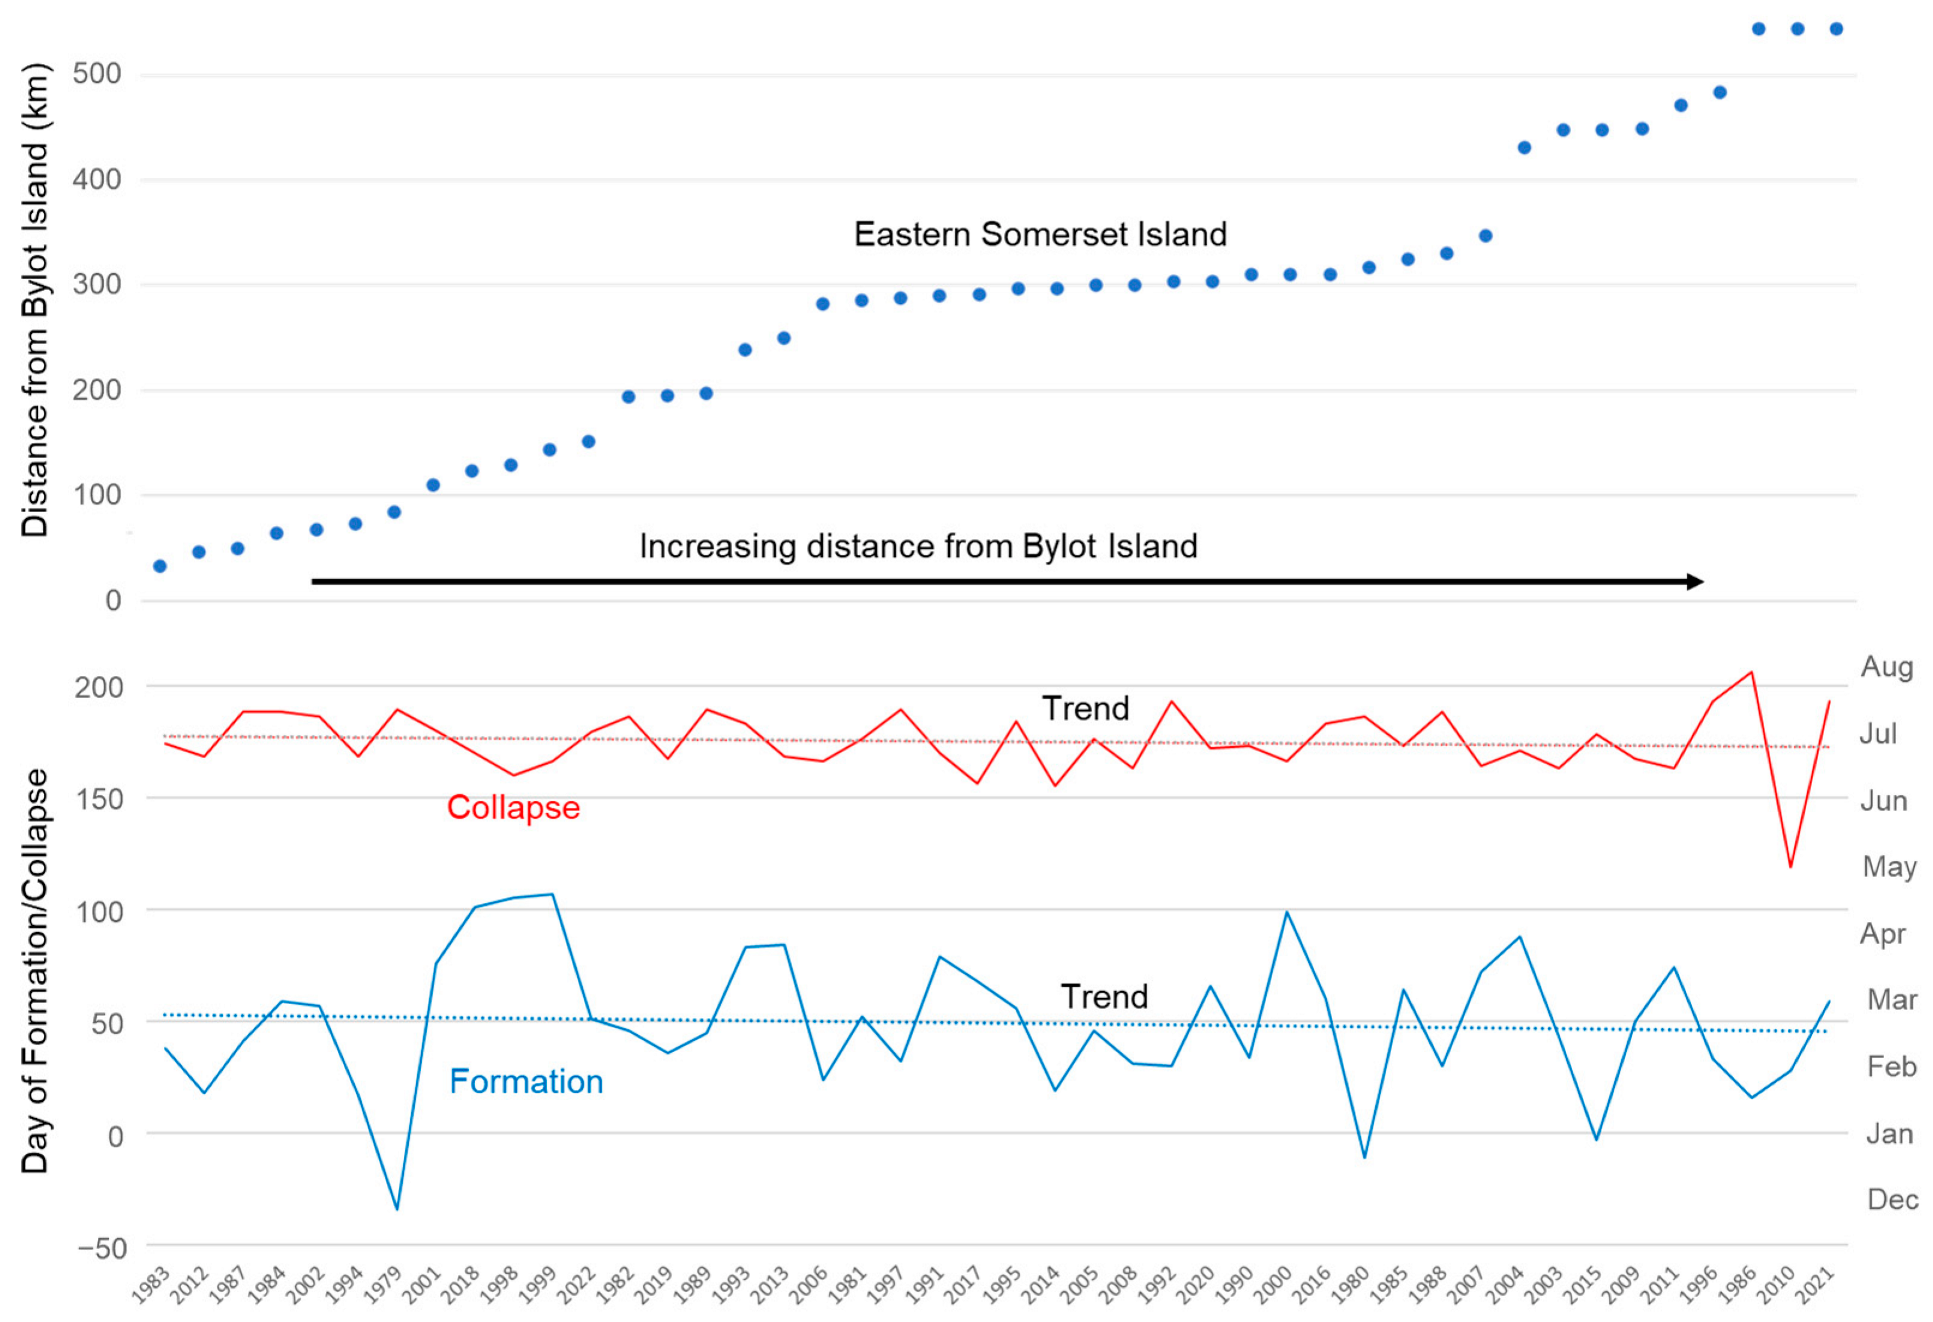
3.1. Location of Ice Arch 1979 to 2022
- Minimum Distance: 33 km (1983);
- Maximum Distance: 545 km (1986, 2010, 2021);
- Average Distance: 273 km (σ = 144 km);
- Linear Trend 1979 to 2022: Increase 214 km to 329 km (R2 = 0.0548, p-value = 0.1262).
3.2. Timing of Ice Arch Formation and Collapse
- Earliest Formation: 27 November (1979 season);
- Latest Formation: 17 April (1999);
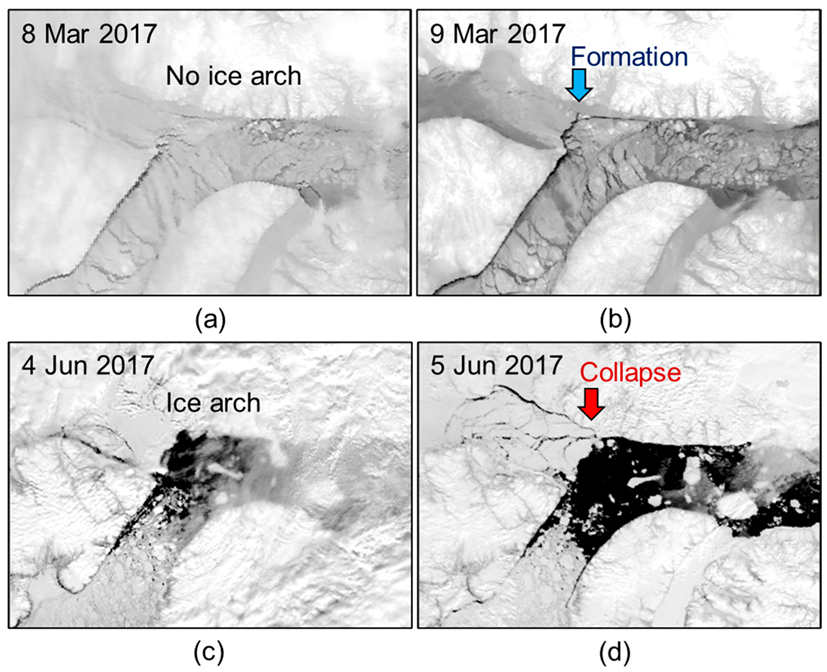
- Average: 18 February (σ = 36 Days);
- Trend: 5 February to 3 March: Increase of 26 days (R2 = 0.0631, p-value = 0.1000).
- Earliest Collapse: 29 April (2010);
- Latest Collapse: 25 July (1986);
- Average: 23 June (σ = 14 Days);
- Trend: 5 July to 13 June: Decrease of 22 days (R2 = 0.1898, p-value = 0.0031).
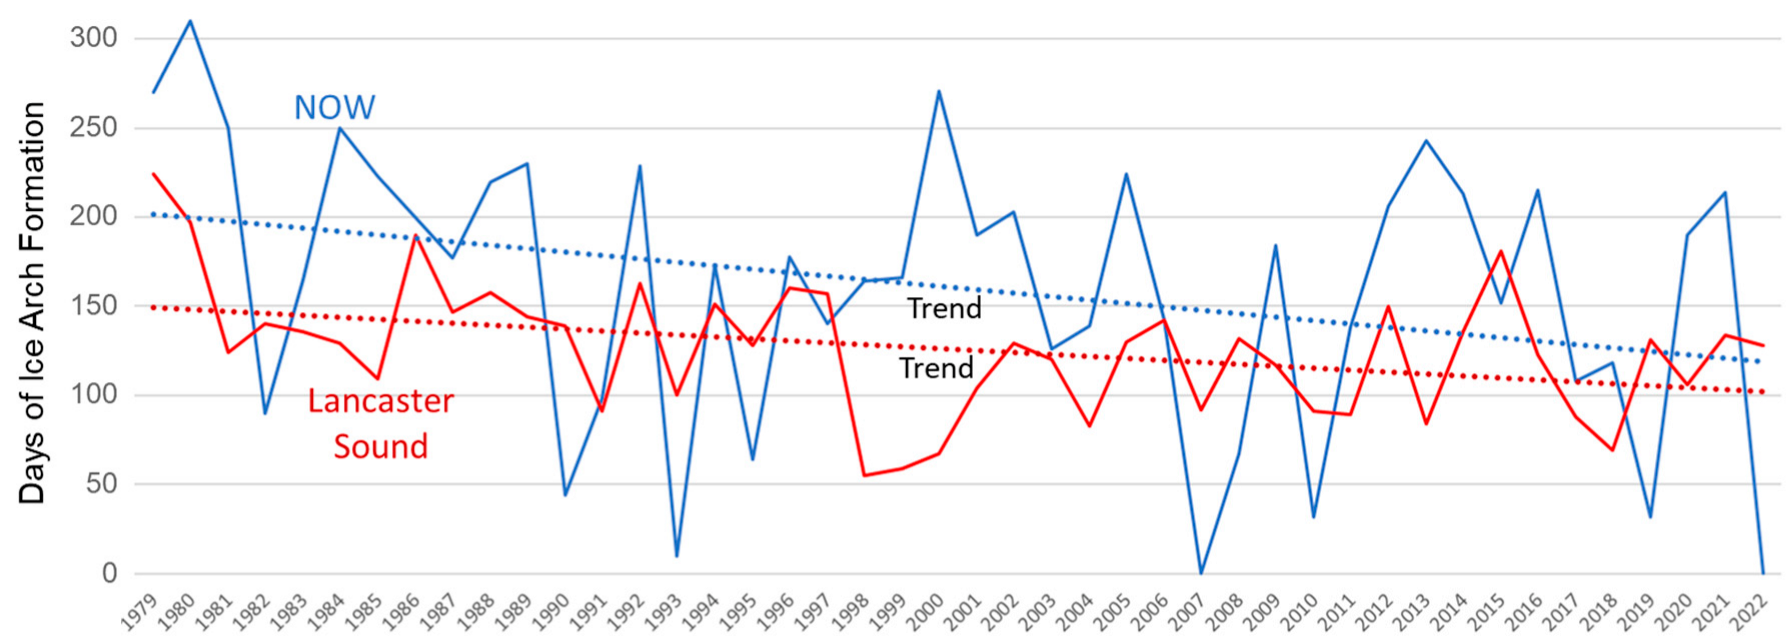
- Minimum Ice Arch Duration: 55 days;
- Maximum Ice Arch Duration: 223 days;
- Average: 126 days, σ = 36 days;
- Linear Trend: Decrease 150 days to 102 days (R2 = 0.1492, p-value = 0.0100).
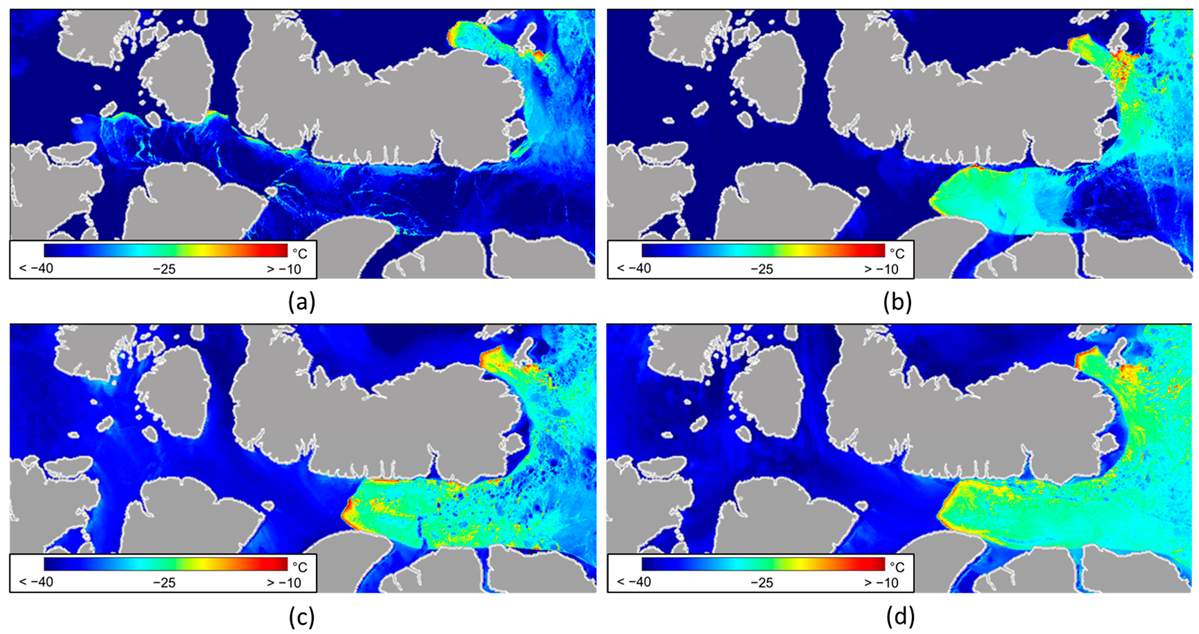
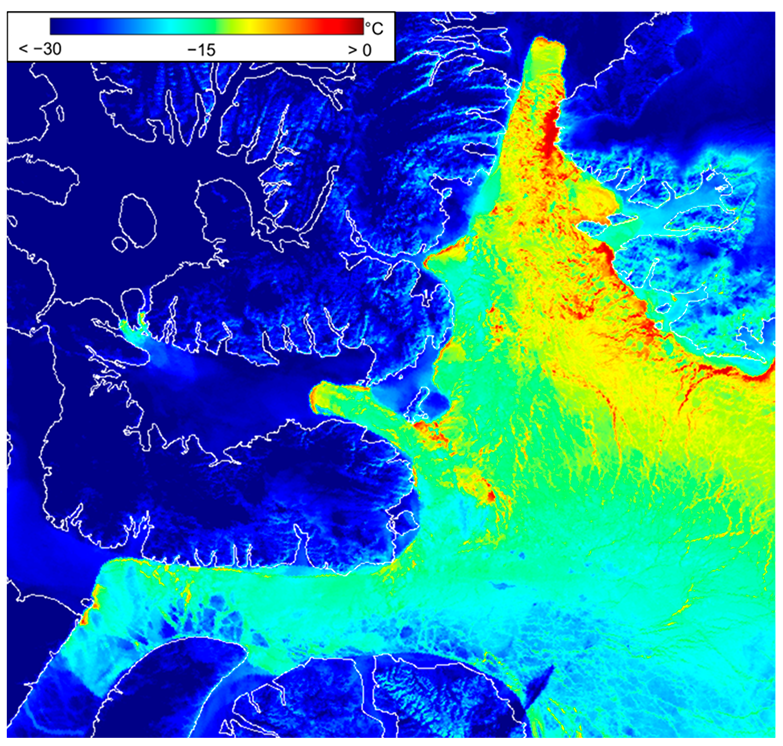
3.3. Sea and Ice Surface Temperatures
4. Discussion
4.1. Location and Duration of Ice Arch
4.2. Thermal Signature and Ice Concentration
4.3. Influence of Arctic Amplification and Comparison to the NOW
5. Conclusions
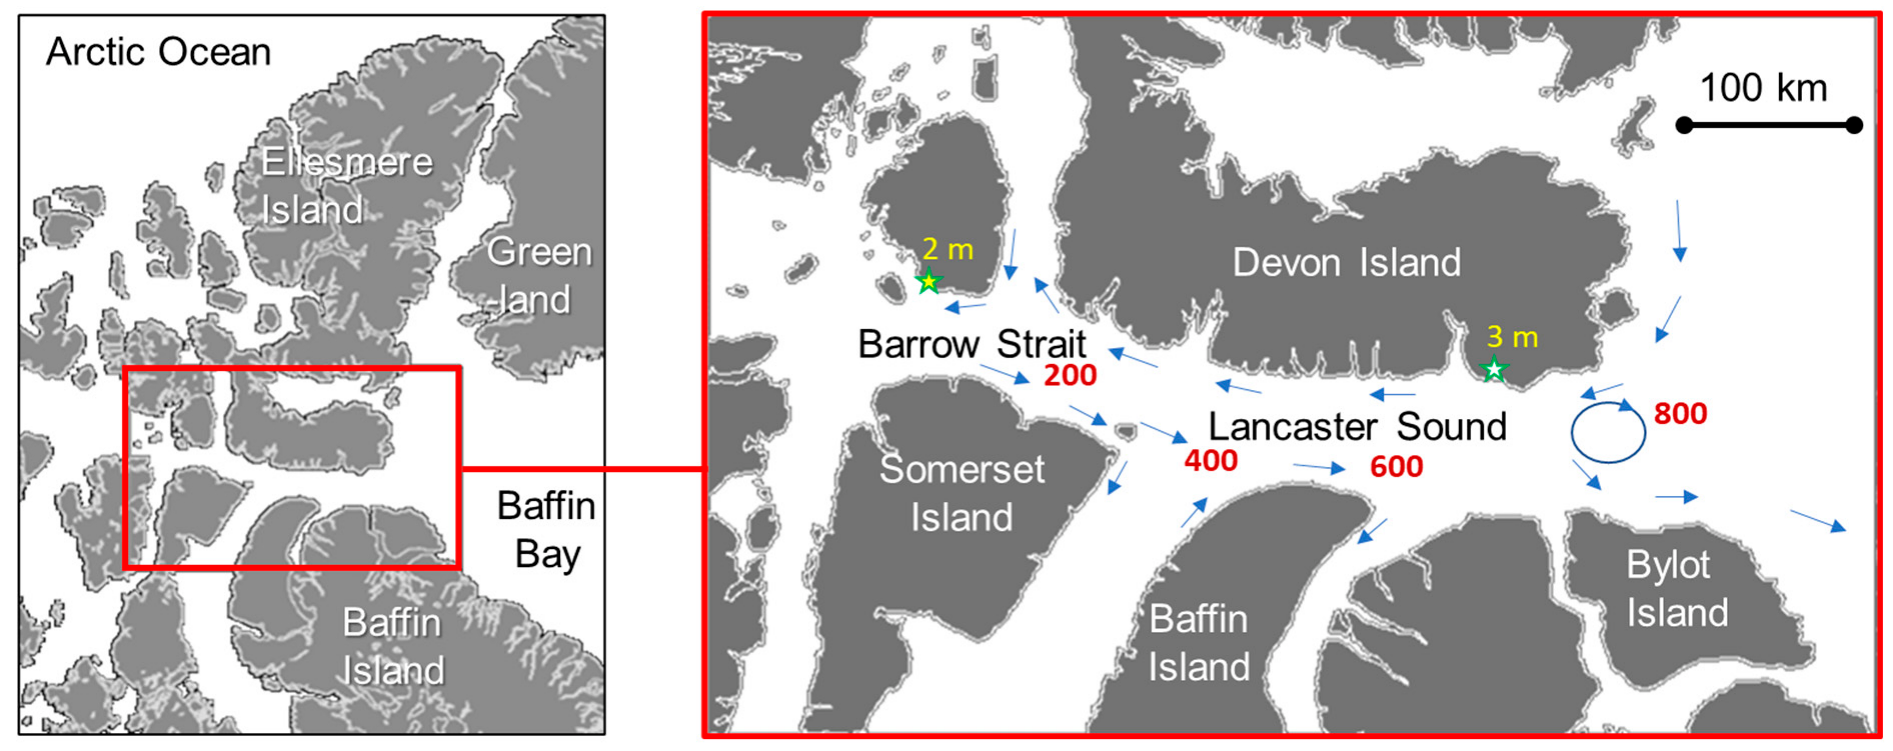
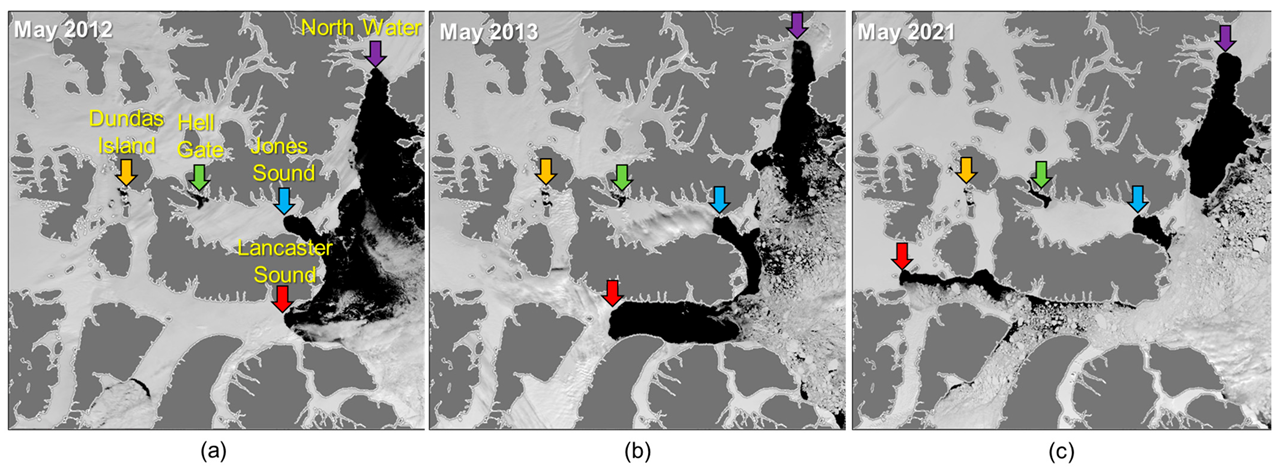
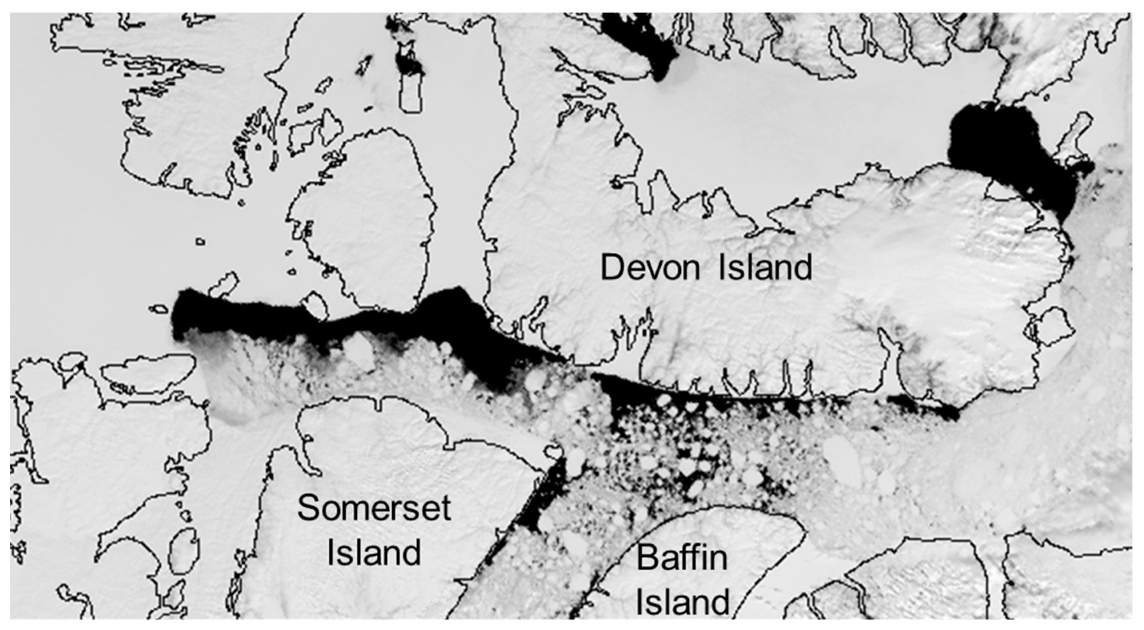
- The ice arch location demonstrates a high interannual variability with 512 km between the eastern and western extremes. Historically, the ice arch occurs at various locations along Lancaster Sound and Barrow Strait, but it has consolidated in the vicinity of eastern Somerset Island 15 times in the satellite record. The overall trend is for a westward movement of the ice arch of 115 km, which is statistically weak.
- Since Barrow Strait and Lancaster Sound generally freeze eastward until the ice arch forms, it is expected that ice arches further to the west should consolidate earlier; however, the data indicates that the ice arch location has no bearing on either the formation or collapse of the structure.
- Although highly variable, a linear trend from 1979 to 2022 shows a reduction of 48 days in ice arch duration. The shorter ice duration is attributable to earlier collapse dates over the entire span of the study and later formation dates, particularly from 1979 to 2000. The latter seems counterintuitive given the acceleration of Arctic amplification in the region since 2000.
Funding
Data Availability Statement
Conflicts of Interest
References
- Yao, T.; Tang, C.L. The formation and maintenance of the North Water Polynya. Atmos.-Ocean 2003, 41, 187–201. [Google Scholar] [CrossRef]
- Steffen, K. Warm Water Cells in the North Water, Northern Baffin Bay During Winter. J. Geophys. Res. 1985, 90, 9129–9136. [Google Scholar] [CrossRef]
- Darby, M.S.; Willmott, A.J.; Mysak, L.A. A Nonlinear Steady-State Model of the North Water Polynya, Baffin Bay. J. Phys. Oceanogr. 1994, 24, 1011–1020. [Google Scholar] [CrossRef]
- Mysak, L.A.; Huang, F. A Latent-and Sensible-Heat Polynya Model for the North Water, Northern Baffin Bay. J. Phys. Oceanogr. 1992, 22, 596–608. [Google Scholar] [CrossRef]
- Vincent, R.; Marsden, R. A Study of Tidal Influences in the North Water Polynya using Short Time Span Satellite Imagery. Arctic 2009, 61, 373–380. Available online: https://www.jstor.org/stable/40513224 (accessed on 27 December 2022). [CrossRef]
- Vincent, R.F. An Examination of the Non-Formation of the North Water Polynya Ice Arch. Remote Sens. 2020, 12, 2712. [Google Scholar] [CrossRef]
- Hannah, C.G.; Dupont, F.; Dunphy, M. Polynyas and Tidal Currents in the Canadian Arctic Archipelago. Arctic 2009, 62, 83–95. Available online: https://www.jstor.org/stable/40513267 (accessed on 27 December 2022). [CrossRef]
- Smith, S.D.; Muench, R.D.; Pease, C.H. Polynyas and leads: An overview of physical processes and environment. J. Geophys. Res. 1995, 95, 9461–9479. [Google Scholar] [CrossRef]
- Kalenitchenko, D.; Joli, N.; Potvin, M.; Tremblay, J.; Lovejoy, C. Biodiversity and Species Change in the Arctic Ocean: A View Through the Lens of Nares Strait. Front. Mar. Sci. 2019, 6, 479. [Google Scholar] [CrossRef]
- Karnovsky, N.J.; Hunt, G.L. Estimation of carbon flux to dovekies (Alle alle) in the North Water. Deep Sea Res. Part II Top. Stud. Oceanogr. 2002, 49, 5117–5130. [Google Scholar] [CrossRef]
- Marchese, C. Biodiversity hotspots: A shortcut for a more complicated concept. Glob. Ecol. Conserv. 2015, 3, 297–309. [Google Scholar] [CrossRef]
- Leblond, P.H. On the surface circulation in some channels of the Canadian Arctic Archipelago. Arctic 1980, 33, 189–197. Available online: https://www.jstor.org/stable/40509282 (accessed on 31 January 2023). [CrossRef]
- Government of Canada: Tides, Currents, and Water Levels. Available online: https://tides.gc.ca/en (accessed on 27 December 2022).
- Prinsenberg, S.J.; Hamilton, J. Monitoring the volume, freshwater and heat fluxes passing through Lancaster sound in the Canadian arctic archipelago. Atmos.-Ocean 2005, 43, 1–22. [Google Scholar] [CrossRef]
- Fissel, D.B.; Lemon, D.D.; Knight, D.N. An oceanographic survey of the Canadian Arctic Archipelago, March 1983. In Canadian Contract Report of Hydrography and Ocean Sciences; Fisheries and Oceans Canada: Ottawa, ON, Canada, 1984; p. 355. [Google Scholar]
- Welch, H.E.; Bergmann, M.A.; Siferd, T.D.; Martin, K.A.; Curtis, M.F.; Crawford, R.E.; Conover, R.J.; Hop, H. Energy flow through the marine ecosystem of the Lancaster Sound region, Arctic Canada. Arctic 1992, 45, 343–357. Available online: https://www.jstor.org/stable/40511483 (accessed on 27 December 2022). [CrossRef]
- Pieńkowski, A.J.; England, J.H.; Furze, M.F.A.; MacLean, B.; Blasco, S. The late Quaternary environmental evolution of marine Arctic Canada: Barrow Strait to Lancaster Sound. Quat. Sci. Rev. 2014, 91, 184–203. [Google Scholar] [CrossRef]
- Halliday, W.D.; Dawson, J.; Yurkowski, D.J.; Doniol-Valcroze, T.; Ferguson, S.H.; Gjerdrum, C.; Hussey, N.E.; Kochanowicz, Z.; Mallory, M.L.; Marcoux, M.; et al. Vessel risks to marine wildlife in the Tallurutiup Imanga National Marine Conservation Area and the eastern entrance to the Northwest Passage. Environ. Sci. Policy 2022, 127, 181–195. [Google Scholar] [CrossRef]
- Hibler, W.; Hutchings, J.; Ip, C. Sea-ice arching and multiple flow States of Arctic pack ice. Ann. Glaciol. 2006, 44, 339–344. [Google Scholar] [CrossRef]
- Lyu, H.; Huang, W.; Mahdianpari, M. A Meta-Analysis of Sea Ice Monitoring Using Spaceborne Polarimetric SAR: Advances in the Last Decade. IEEE J. Sel. Top. Appl. Earth Obs. Remote Sens. 2022, 15, 6158–6179. [Google Scholar] [CrossRef]
- Preußer, A.; Heinemann, G.; Schefczyk, L.; Willmes, S. A Model-Based Temperature Adjustment Scheme for Wintertime Sea-Ice Production Retrievals from MODIS. Remote Sens. 2022, 14, 2036. [Google Scholar] [CrossRef]
- Preußer, A.; Ohshima, K.I.; Iwamoto, K.; Willmes, S.; Heinemann, G. Retrieval of Wintertime sea ice Production in Arctic Polynyas Using Thermal Infrared and Passive Microwave Remote Sensing Data. J. Geophys. Res. Ocean. 2019, 124, 5503–5528. [Google Scholar] [CrossRef]
- Shen, X.; Zhang, J.; Zhang, X.; Meng, J.; Ke, C. Sea Ice Classification Using Cryosat-2 Altimeter Data by Optimal Classifier–Feature Assembly. IEEE Geosci. Remote Sens. Lett. 2017, 14, 1948–1952. [Google Scholar] [CrossRef]
- NOAA’s Comprehensive Large Array-Data Stewardship System. Available online: https://www.bou.class.noaa.gov/saa/products/welcome (accessed on 17 December 2022).
- Herman, G.; Goody, R. Formation and Persistence of Summertime Arctic Stratus Clouds. J. Atmos. Sci. 1976, 33, 1537–1553. [Google Scholar] [CrossRef]
- Vincent, R. The Case for a Single Channel Composite Arctic Sea Surface Temperature Algorithm. Remote. Sens. 2019, 11, 2393. [Google Scholar] [CrossRef]
- Vincent, R.F.; Marsden, R.F.; Minnett, P.J.; Buckley, J.R. Arctic waters and marginal ice zones: 2. An investigation of arctic atmospheric infrared absorption for advanced very high resolution radiometer sea surface temperature estimates. J. Geophys. Res. 2008, 113, C08044. [Google Scholar] [CrossRef]
- Nielsen-Englyst, P.; Høyer, J.L.; Madsen, K.S.; Tonboe, R.; Dybkjær, G.; Alerskans, E. In Situ Observed Relationships between Snow and Ice Surface Skin Temperatures and 2 m Air Temperatures in the Arctic. Cryosphere 2019, 13, 1005–1024. [Google Scholar] [CrossRef]
- Serreze, M.C.; Francis, J.A. The Arctic Amplification Debate. Clim. Chang. 2006, 76, 241–264. [Google Scholar] [CrossRef]
- Cohen, J.; Screen, J.A.; Furtado, J.C.; Barlow, M.; Whittleston, D.; Coumou, D.; Francis, J.; Dethloff, K.; Entekhabi, D.; Overland, J.; et al. Recent Arctic amplification and extreme mid-latitude weather. Nat. Geosci. 2014, 7, 627–637. [Google Scholar] [CrossRef]
- Kwok, R. Arctic sea ice thickness, volume, and multiyear ice coverage: Losses and coupled variability (1958–2018). Environ. Res. Lett. 2018, 13, 105005. [Google Scholar] [CrossRef]
- Korosov, A.A.; Rampal, P.; Pedersen, L.T.; Saldo, R.; Ye, Y.; Heygster, G.; Lavergne, T.; Aaboe, S.; Girard-Ardhuin, F. A new tracking algorithm for sea ice age distribution estimation. Cryosphere 2018, 12, 2073–2085. [Google Scholar] [CrossRef]
- Ballinger, T.J.; Overland, J.E.; Wang, M.; Bhatt, U.S.; Brettschneider, B.; Hanna, E.; Hanssen-Bauer, I.; Kim, S.-J.; Thoman, R.L.; Walsh, J.E. Surface Air Temperature; NOAA Technical Report OAR ARC; 21-02; National Oceanic and Atmospheric Administration: Washington, DC, USA, 2021. [CrossRef]
- Vincent, R.F. A Study of the North Water Polynya Ice Arch using Four Decades of Satellite Data. Sci. Rep. 2019, 9, 20278. [Google Scholar] [CrossRef]
- Tremblay, J.-É.; Gratton, Y.; Carmack, E.C.; Payne, C.D.; Price, N.M. Impact of the large-scale Arctic circulation and the North Water Polynya on nutrient inventories in Baffin Bay. J. Geophys. Res. 2002, 107, 26-1–26-14. [Google Scholar] [CrossRef]




| Satellite | Years Active | Satellite | Years Active |
|---|---|---|---|
| TIROS-N | 1978–1981 | NOAA-14 | 1994–2007 |
| NOAA-6 | 1979–1981 | NOAA-15 | 1998-Present |
| NOAA-7 | 1981–1986 | NOAA-16 | 2000–2014 |
| NOAA-8 | 1983–1985 | NOAA-17 | 2002–2013 |
| NOAA-9 | 1984–1998 | NOAA-18 | 2005–Present |
| NOAA-10 | 1986–2001 | MetOp-A | 2006–2021 |
| NOAA-11 | 1988–2004 | NOAA-19 | 2009–Present |
| NOAA-12 | 1998–2007 | MetOp-B | 2012–Present |
| NOAA-13 | 1993–1993 | MetOp-C | 2018–Present |
| Channel | Wavelength (um) | Description | Satellites |
|---|---|---|---|
| 1 | 0.58–0.68 | Visible | All satellites |
| 2 | 0.725–1.00 | Visible/Near infrared | All satellites |
| 3A | 1.58–1.64 | Near Infrared | NOAA-15 to -19 and MetOp series |
| 3B | 3.55–3.93 | Middle Infrared | NOAA-8 to -19 and MetOp series |
| 4 | 10.30–11.30 | Thermal Infrared | All satellites |
| 5 | 11.50–12.50 | Thermal Infrared | NOAA-8 to -19 and MetOp series |
Disclaimer/Publisher’s Note: The statements, opinions and data contained in all publications are solely those of the individual author(s) and contributor(s) and not of MDPI and/or the editor(s). MDPI and/or the editor(s) disclaim responsibility for any injury to people or property resulting from any ideas, methods, instructions or products referred to in the content. |
© 2023 by the author. Licensee MDPI, Basel, Switzerland. This article is an open access article distributed under the terms and conditions of the Creative Commons Attribution (CC BY) license (https://creativecommons.org/licenses/by/4.0/).
Share and Cite
Vincent, R.F. An Assessment of the Lancaster Sound Polynya Using Satellite Data 1979 to 2022. Remote Sens. 2023, 15, 954. https://doi.org/10.3390/rs15040954
Vincent RF. An Assessment of the Lancaster Sound Polynya Using Satellite Data 1979 to 2022. Remote Sensing. 2023; 15(4):954. https://doi.org/10.3390/rs15040954
Chicago/Turabian StyleVincent, R.F. 2023. "An Assessment of the Lancaster Sound Polynya Using Satellite Data 1979 to 2022" Remote Sensing 15, no. 4: 954. https://doi.org/10.3390/rs15040954
APA StyleVincent, R. F. (2023). An Assessment of the Lancaster Sound Polynya Using Satellite Data 1979 to 2022. Remote Sensing, 15(4), 954. https://doi.org/10.3390/rs15040954


