Article

Structural Nonlinear Damage Identification Method Based on the Kullback–Leibler Distance of Time Domain Model Residuals

School of Civil Engineering, Chongqing University, Chongqing 400045, China
*
Author to whom correspondence should be addressed.
Remote Sens. 2023, 15(4), 1135; https://doi.org/10.3390/rs15041135
Submission received: 18 January 2023 / Revised: 16 February 2023 / Accepted: 16 February 2023 / Published: 19 February 2023
(This article belongs to the Special Issue Remote Sensing in Structural Health Monitoring)

Abstract

:
Under external load excitation, damage such as breathing cracks and bolt loosening will cause structural time domain acceleration to have nonlinear features. To solve the problem of time domain nonlinear damage identification, a damage identification method based on the Kullback–Leibler (KL) distance of time domain model residuals is proposed in this paper. First, an autoregressive (AR) model order was selected using the autocorrelation function (ACF) and Akaike information criterion (AIC). Then, an AR model was obtained based on the structural acceleration response time series, and the AR model residual was extracted. Finally, the KL distance was used as a damage indicator to judge the structural damage source location. The effectiveness of the proposed method was verified by using a multi-story, multi-span stand model experiment and a simulated eight-story shear structure. The results show that the proposed structural nonlinear damage identification method can effectively distinguish the structural damage location of multi-degree-of-freedom shear structures and complex stand structures, and it is robust enough to detect environmental noise and small damage.

1. Introduction

Structural health monitoring (SHM) is a process for damage identification in civil systems [1], and SHM of civil structures during operation is a prerequisite for ensuring their safety and normal service. Traditional SHM is usually completed by manual inspection, which is time-consuming and prone to error [2]. The benefit of the SHM system is that it can replace conventional manual visual inspections to evaluate structural damage situations [3]. Currently, many automatic damage identification methods have been developed to replace manual inspection [4].
In general, the structural damage of systems includes material damage or geometric degradation. In the damage identification field, damage is usually assumed to be linear, i.e., the stiffness of the structure or structural components did not change before or after damage occurred. However, most damage in engineering structures is nonlinear [5,6]. Examples include crack edge contact and disengagement, which can lead to open and closed breathing-like phenomena and nonlinear responses in the system during vibration [7]; friction slip; and bolt looseness [8]. In other words, the stiffness of nonlinear damaged components will change during vibration processes.
Changes in structural physical parameters will cause changes in structural vibration features [9]. In general, for a structure subjected to environmental loads, extracting damage features from the structural vibration response is one of the most useful methods of damage inspection [3]. The frequency response function (FRF) is one of the classic models to describe the input–output relationship of structural dynamic systems. FRF contains a large amount of structural modal information, which can describe structural dynamic features accurately. The identification method based on FRF can effectively avoid the errors caused by the traditional method based on structural modal information. Prawin et al. [5] extended the describing function method to distinguish the damage in the initially healthy nonlinear system with limited measurements. The describing function method requires a complete FRF of the underlying linear system; a new model based on nonparametric principal component analysis (PCA) is adopted to overcome this requirement. Chomette [10] proposed a breathing crack recognition method based on the direct zeros estimation of higher-order FRF. This method identifies and locates breathing cracks by identifying the antiresonances of the system.
The finite element model updating method modifies the structural finite element model with the measured dynamic information of the structure and makes the structural dynamic characteristics consistent with the measured dynamic characteristics of the structure; then, damage identification is conducted by comparing finite model data with measured data. Zheng et al. [11] proposed a structural damage identification method based on a sensitivity analysis of power spectral density. This method first uses the pseudo-excitation method to acquire the response and power spectral density of the structure under stationary and random excitation, and then analyzes the sensitivity of the power spectral density. Finally, this method was used to identify the location of structural damage and damage level. Esfandiari [12] presented an approach to directly modify the parameters of the structural finite element model. This approach modifies the model parameters based on the measured structural frequency and mode shape data, and identifies structural damage by analyzing the sensitivity relationship between the damage modal information and damage coefficient. Mirzaee et al. [13] proposed an adjoint variable method for bridge damage identification. This method can identify a bridge’s bending stiffness from the acceleration response data. The calculated bridge bending stiffness was compared with the bridge bending stiffness in the healthy state for damage identification.
The time series analysis method is a signal analysis method for extracting the characteristics of a time series. Although this method already exists and is widely used in other fields such as economics and weather forecasting, the time series analysis method has been used in structural damage identification reports filed in recent years [3]. Damage identification methods based on time series can distinguish damage using only structural response data. Chen et al. [6] established an autoregressive moving average (ARMA) model for structural acceleration data, used vector space cosine similarity (VSCS) to improve the residual standard deviation damage indicator, and then used K-means cluster analysis and Bayes discriminant analysis to classify the improved VSCS. Zhu et al. [14] used a sparse regularization method to solve the underdetermined equations, and conducted a damage indicator sensitivity analysis on the autoregressive coefficients of the ARMA model. The research result shows that sparse regularization equations can accurately distinguish the damage characteristics in the acceleration data. Mei et al. [15] presented a detection method using an AR model and a pole-based optimal subpattern assignment (OSPA). The AR model was obtained according to the structural response data, and then the OSPA was used as a damage indicator for structural damage detection. However, the change of story mass during the operation of the structure may lead to misjudgment in damage identification. To identify changes in time series data features caused by changes in mass and stiffness of a shear structure, Ngoan et al. [16] presented a damage detection approach based on an ARMAX model and a structural motion equation; the researchers used the ARMAX model’s parameters to establish a stiffness indicator and a quality indicator to identify structural stiffness and quality changes, respectively.
Most damage identification methods require baseline data from when the structure was undamaged, so that it can be compared with the test data to determine the structural health status. However, many SHMs did not start when the structure was completed, so it is often difficult to obtain baseline data in practical applications. To solve this problem, many researchers have studied baseline-free damage identification methods. Prawin et al. [17] proposed a baseline-free detection approach for breathing crack identification using acceleration time history responses. This approach uses the Fourier power spectrum spatial curvature as the damage feature for breathing crack detection, and uses higher-order harmonics to detect damage. Voggu et al. [18] proposed a baseline-free and vibration-based approach for breathing crack identification. The damage characteristics at different damage levels were obtained using signal statistics, phase–plane information, harmonics, and so on. The experimental results verify the effectiveness of this method. Li et al. [4] proposed a signal segmental cross-correlation method for nonlinear detection. As an output-only and baseline-free method, damage detection is performed by defining a signal segment cross-correlation matrix and signal segment cross-correlation indicator. Experimental and numerical results verify the effectiveness and robustness of this method. Yang et al. proposed a comprehensive indirect method [19] and movable sensory system [20] to estimate the modal properties and element bending stiffness of a bridge. In order to detect initial breathing cracks, Cao et al. [21] proposed the concept of quadratic Teager–Kaiser energies (Q-TKEs) based on the phenomenon of the energy modulation effect (EME). Hidden higher harmonics in Q-TKEs can be significantly enhanced, and breathing cracks can be easily identified. The reliability of this approach was verified by experiments and finite element simulations. Yang et al. [22] proposed a local damage identification method for frame structure based on the approximate Metropolis-Hastings (AMH) algorithm and statistical moment. This method selects the fourth order displacement moment and the eighth order acceleration moment as the fusion index. And then the damage of frame structure was preliminarily evaluated by AMH algorithm. The probability density evolution method (PDEM) was used to analyze the uncertainty of the structural damage
In order to solve the problem of time domain nonlinear damage identification more efficiently, we present a structural nonlinear damage identification method based on the Kullback–Leibler (KL) distance of time domain model residuals. First, the proposed method uses the autocorrelation function (ACF) and Akaike information criterion (AIC) to choose the order of the AR model, and the AR model was established. Then the KL distance is used as the damage indicator to determine the location of structural damage sources. The numerical simulation and experimental results show that the proposed method can effectively detect the nonlinear damage of multi-degree-of-freedom shear structures and complex structures.

2. Basic theory of AR model

2.1. AR Model

The AR model is an effective time series model proposed by Yule. The AR model was first used in the field of economics, but it has also been used in the damage identification field. A p-order AR model can be denoted as AR (p), and its expression is given by:
y t = c + i = 1 p φ i y t i + ε t
where yt is the time series data at time t, yt-I is the time series data at time t-i, c is a constant, p is the order, φ i is the i-th parameters of the AR model, and ε t is the residual of the AR model.

2.2. Order Determination of AR Model

The AR model order is determined by the autocorrelation function (ACF) and the Akaike information criterion (AIC). The ACF of the AR model is expressed as:
λ ( p ) = i = 1 p φ i λ ( p i )
where λ ( p i ) and λ ( p ) comprise the ACF. The AR model order range is preliminarily selected according to the tail-off features of the ACF, and then the AR model order is determined according to the AIC. The AIC is expressed as [23]:
AIC = 2 In ( L ) + 2 m
where L expresses the likelihood function, and m expresses the number of estimated parameters. In Equation (3), the first item represents the accuracy of the time series model, and the second item represents the complexity of the time series model. Therefore, the model order corresponding to the minimum AIC can be considered as the optimal model order.

2.3. Parameter Estimation of AR Model

After the order of the AR model is determined, the Yule–Walker method is used to estimate the parameters of the AR model. Rewrite Equation (2) into the following form:
[ λ ( 0 ) λ ( 1 ) λ ( p 1 ) λ ( 1 ) λ ( 2 ) λ ( p 2 ) λ ( p 1 ) λ ( p 2 ) λ ( 0 ) ] [ φ 1 φ 2 φ p ] = [ λ ( 1 ) λ ( 2 ) λ ( p ) ]
Then the AR model parameters can be expressed as:
[ φ 1 φ 2 φ p ] = [ λ ( 0 ) λ ( 1 ) λ ( p 1 ) λ ( 1 ) λ ( 2 ) λ ( p 2 ) λ ( p 1 ) λ ( p 2 ) λ ( 0 ) ] 1 [ λ ( 1 ) λ ( 2 ) λ ( p ) ]
The parameter estimates of the AR model can be obtained by replacing the theoretical autocorrelation function with the sample autocorrelation function:
[ φ ^ 1 φ ^ 2 φ ^ p ] = [ λ ^ ( 0 ) λ ^ ( 1 ) λ ^ ( p 1 ) λ ^ ( 1 ) λ ^ ( 2 ) λ ^ ( p 2 ) λ ^ ( p 1 ) λ ^ ( p 2 ) λ ^ ( 0 ) ] 1 [ λ ^ ( 1 ) λ ^ ( 2 ) λ ^ ( p ) ]

3. Damage Identification Based on the KL Distance of Time Series Model Residual

3.1. Nonlinear Damage in Time Domain

Damage in actual structures usually has nonlinear features because of nonlinear stiffness and damping [5]. For example, bolt looseness and breathing cracks are two typical examples of nonlinear damage. Loosened bolts will cause changes in stiffness and damping of bolted joints, and will produce time domain nonlinear characteristics during vibration [24].
A structural component with a breathing crack will exhibit bilinear stiffness characteristics because of the opening and closing of a breathing crack under vibration [25], and the change of bilinear stiffness is a typical nonlinear process, so the measured acceleration of a structure with breathing cracks has nonlinear features in the time domain [26]. The bilinear stiffness is utilized to describe the nonlinear damage stiffness changes caused by breathing cracks in a multi-degree-of-freedom structure under external excitation [27]:
k i [ x i ( t ) ] = { k i   when   x i ( t ) x i 1 ( t ) 0 ( 1 α ) k i   when   x i ( t ) x i 1 ( t ) > 0   ( i = 1 , , n ;   x 0 ( t ) = 0 )
where k i ( x i ( t ) ) is the stiffness of i-th degree-of-freedom (DOF), ki is the stiffness when a breathing crack was closed, and α is the damaged factor when a breathing crack was opened. xi(t) and xi(t)(i ≠ 1) represent the displacement of i-th DOF and (i − 1)-th DOF at time t, respectively. In particular, when i = 1, xi−1(t) = x0(t) = 0.

3.2. Nonlinear Damage Identification Based on the SOVI

In this paper, the damage identification method proposed by Cheng et al. is compared with the proposed method. Cheng et al. [28] constructed the damage indicator SOVI based on the conditional heteroscedasticity series of the AR/ARCH model. It is assumed that the baseline state is the state when the structure is without damage, and the test state is the state when the structure is damaged. The SOVI expression is as follows:
SOVI = Var { σ t 2 t e s t } Var { σ t 2 r e f }
where σ t 2 t e s t and σ t 2 r e f are the conditional heteroscedasticity series of the test state and baseline state, respectively, and Var{} is the variance calculation.

3.3. Nonlinear Damage Identification Method Based on the KL Distance of the AR Model Residual

Since the damage identification method proposed by Cheng et al. [28] was difficult to use to identify nonlinear damage of multi-story and multi-span structures, this paper proposes a new nonlinear damage identification method based on the KL distance of the AR model residual. The residual of the time series refers to the difference between the real time series and the fitted time series, and the residual series carries useful information for damage identification [29]. Therefore, the KL distance of the AR model residual was regarded as the damage indicator in this paper, and structural damages were distinguished by this damage indicator.
The Kullback–Leibler (KL) distance is a special case of the Kullback distance, which was first proposed by S. Kullback and R. Leibler based on probability theory [30]. It is assumed that the baseline state is the status when a structure is undamaged, and the test state refers to the status when a structure has an unknown status. The baseline time series is denoted as {yt}ref, and the test time series is denoted as {yt}test. The AR model established by {yt}ref is denoted as {AR}ref, and the residual of the AR model is denoted as ε t r e f . The AR model established by {yt}test is denoted as {AR}test, and the residual of the AR model is denoted as ε t t e s t . Therefore, a new time series {yt}RT can be established by substituting {yt}test into {AR}ref model, and the residual of the model is denoted as ε t R T . The information feature difference between the baseline time series {yt}ref and the test time series {yt}test can be determined by calculating the KL distance:
D K L 2 = In Var { ε t r e f } Var { ε t t e s t } + Var { ε t R T } Var { ε t r e f } 1
where ε t R T is the model residual calculated from {AR}ref model and { y t } t e s t , ε t t e s t is the model residual calculated from {AR}test model and { y t } t e s t , ε t r e f is the model residual calculated from {AR}ref model and { y t } r e f , and Var{} is the variance calculation.

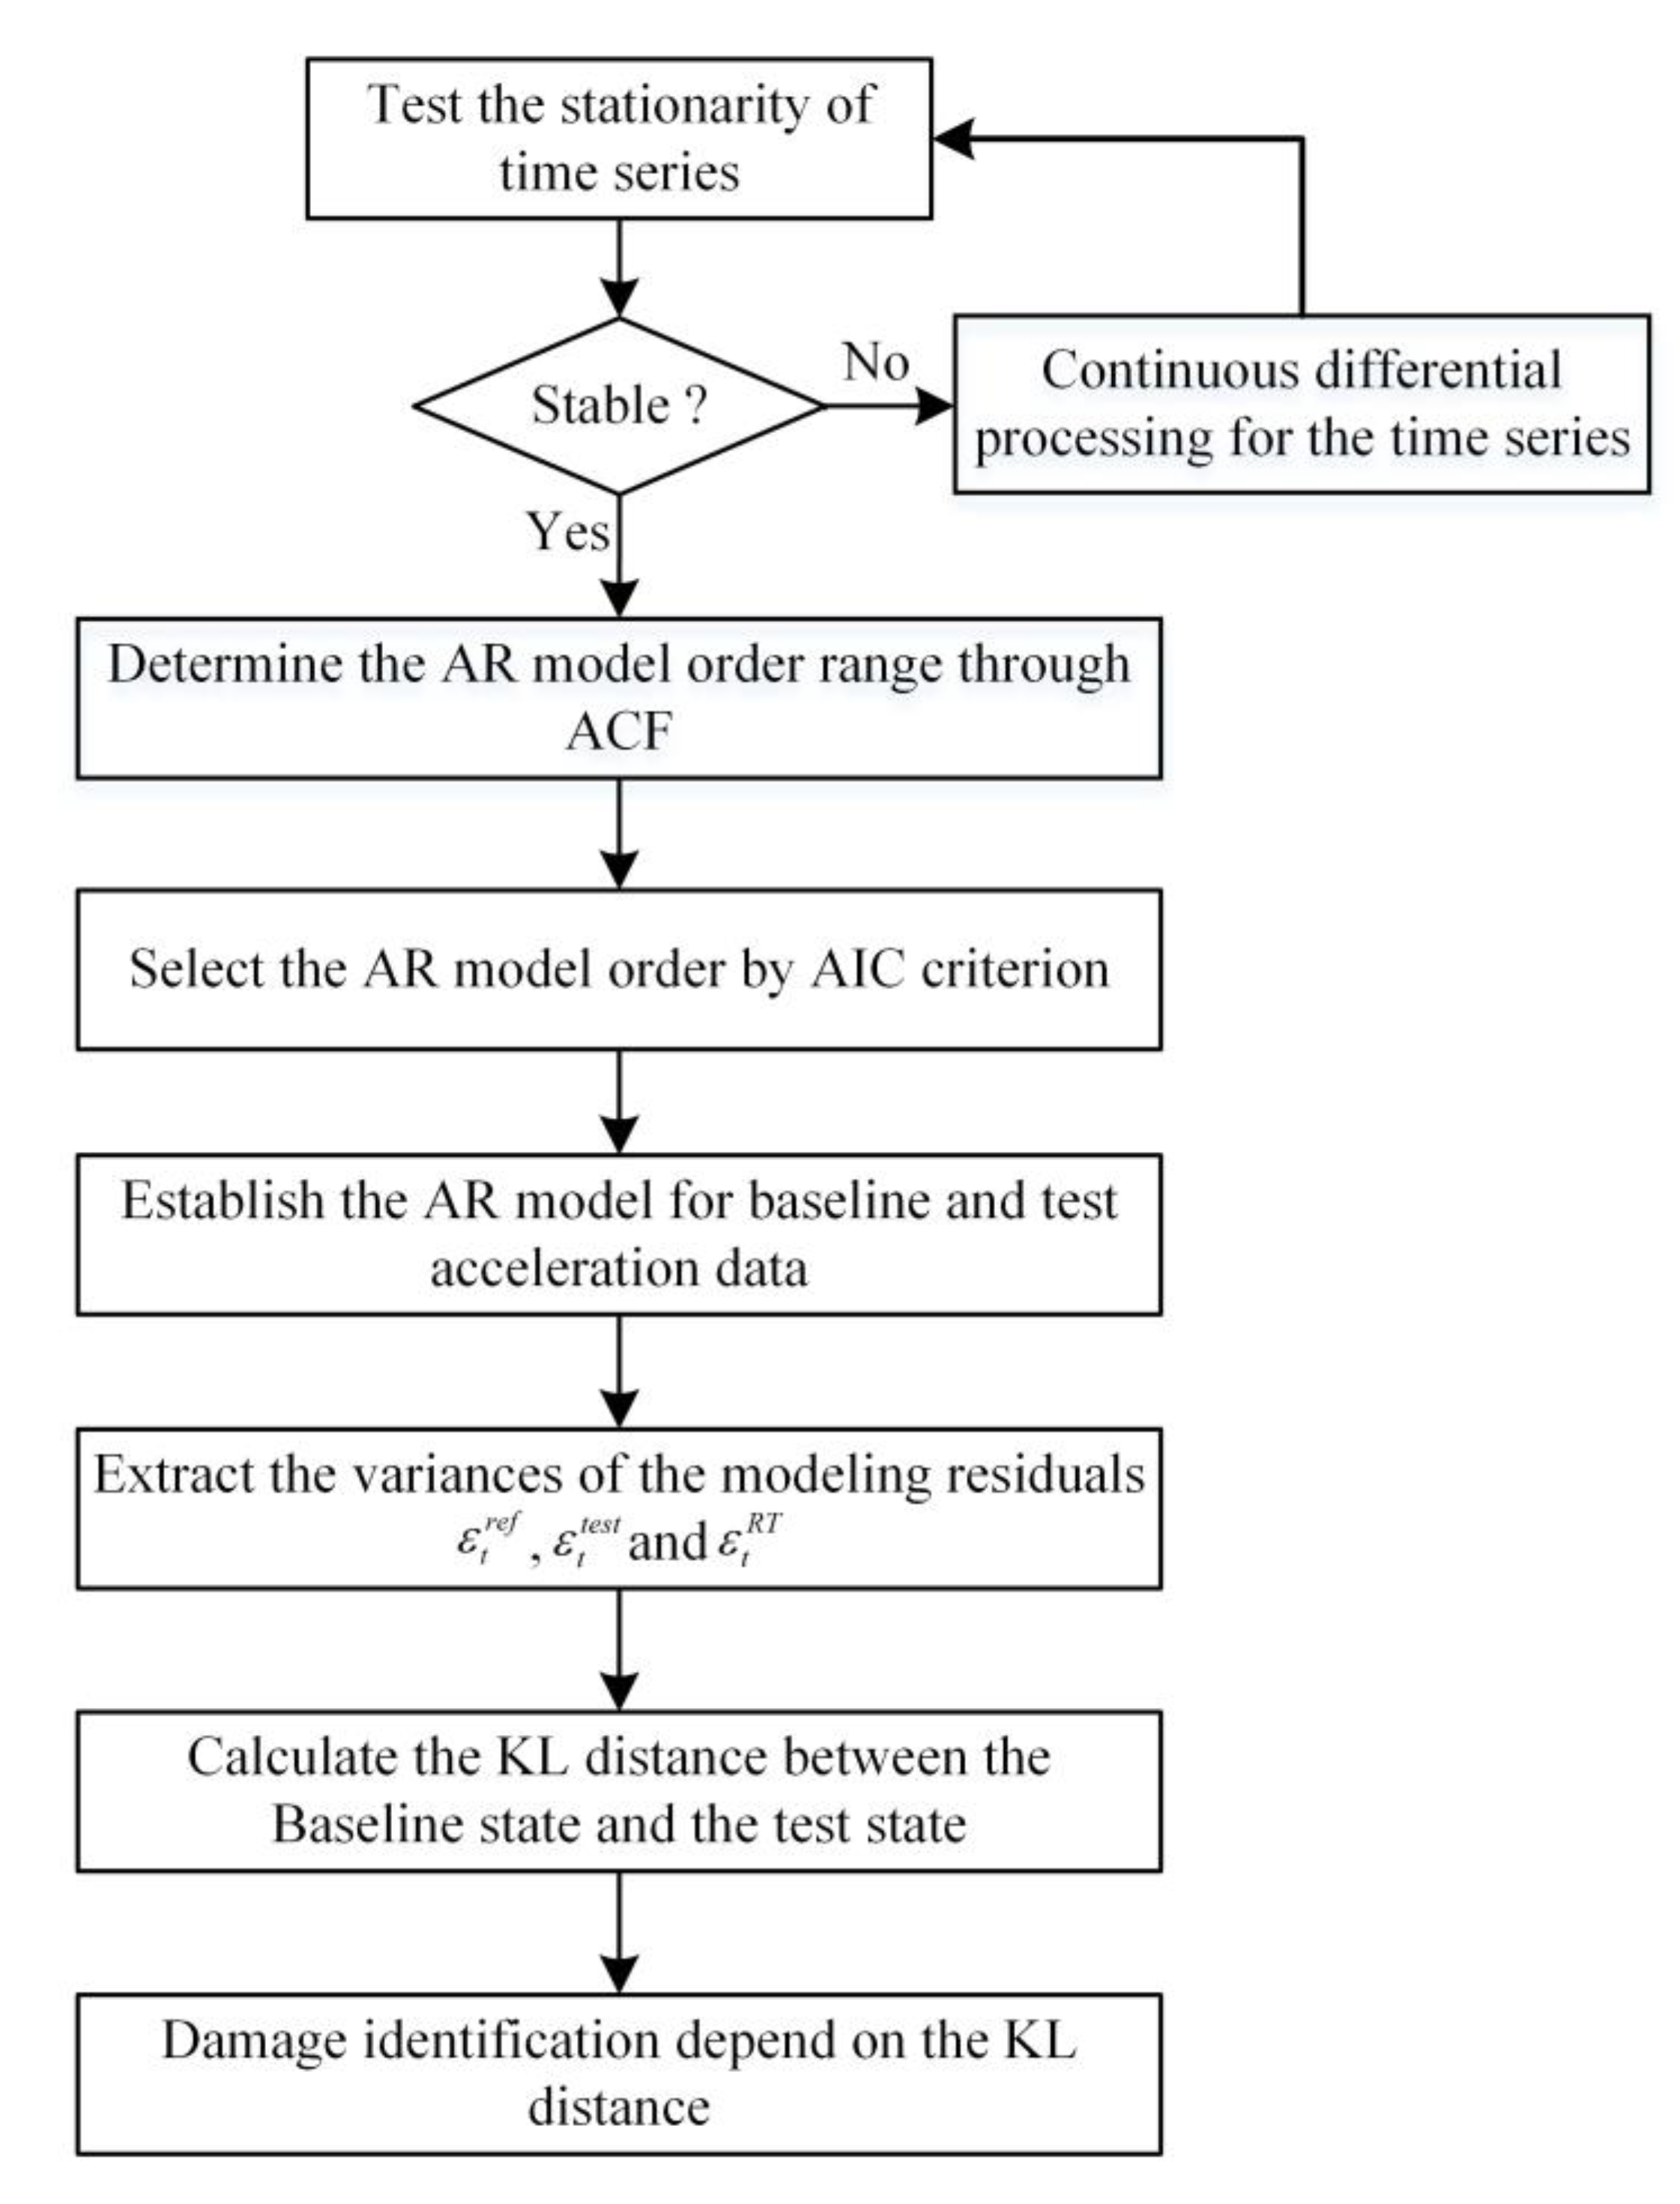
3.4. Process of Damage Identification Using the KL Distance of the AR Model Residual

These residual-based methods are based on the fact that a well-fitted model trained on undamaged data is not suitable to use to determine damage data. Thus, this paper divides the data into two states. The baseline state is the state when a structure is undamaged, and the test state is the state when a structure is damaged. A flow chart showing damage identification using the KL distance of the AR model residual appears in Figure 1, and the damage identification process is as follows:
Step 1: Collect the structural acceleration response data when the monitored structure is in the baseline state and in the test state, and perform the stationarity test for the collected data. If the stationarity test conditions are not met, then perform continuous difference processing until the structure meets the stationarity test’s conditions.
Step 2: Select the AR model order by ACF and AIC. Specifically, first determine the AR model order range through ACF, and then select the model order corresponding to the minimum AIC as the AR model order.
Step 3: Establish the AR model according to the baseline and the test time series, and then obtain the residuals series ε t r e f , ε t t e s t , and ε t R T .
Step 4: According to the residual series ε t r e f , ε t t e s t , and ε t R T , the KL distance between the baseline state and test state is calculated by Equation (9). Then identify the structural nonlinear damage location based on the KL distance.

4. Numerical Example

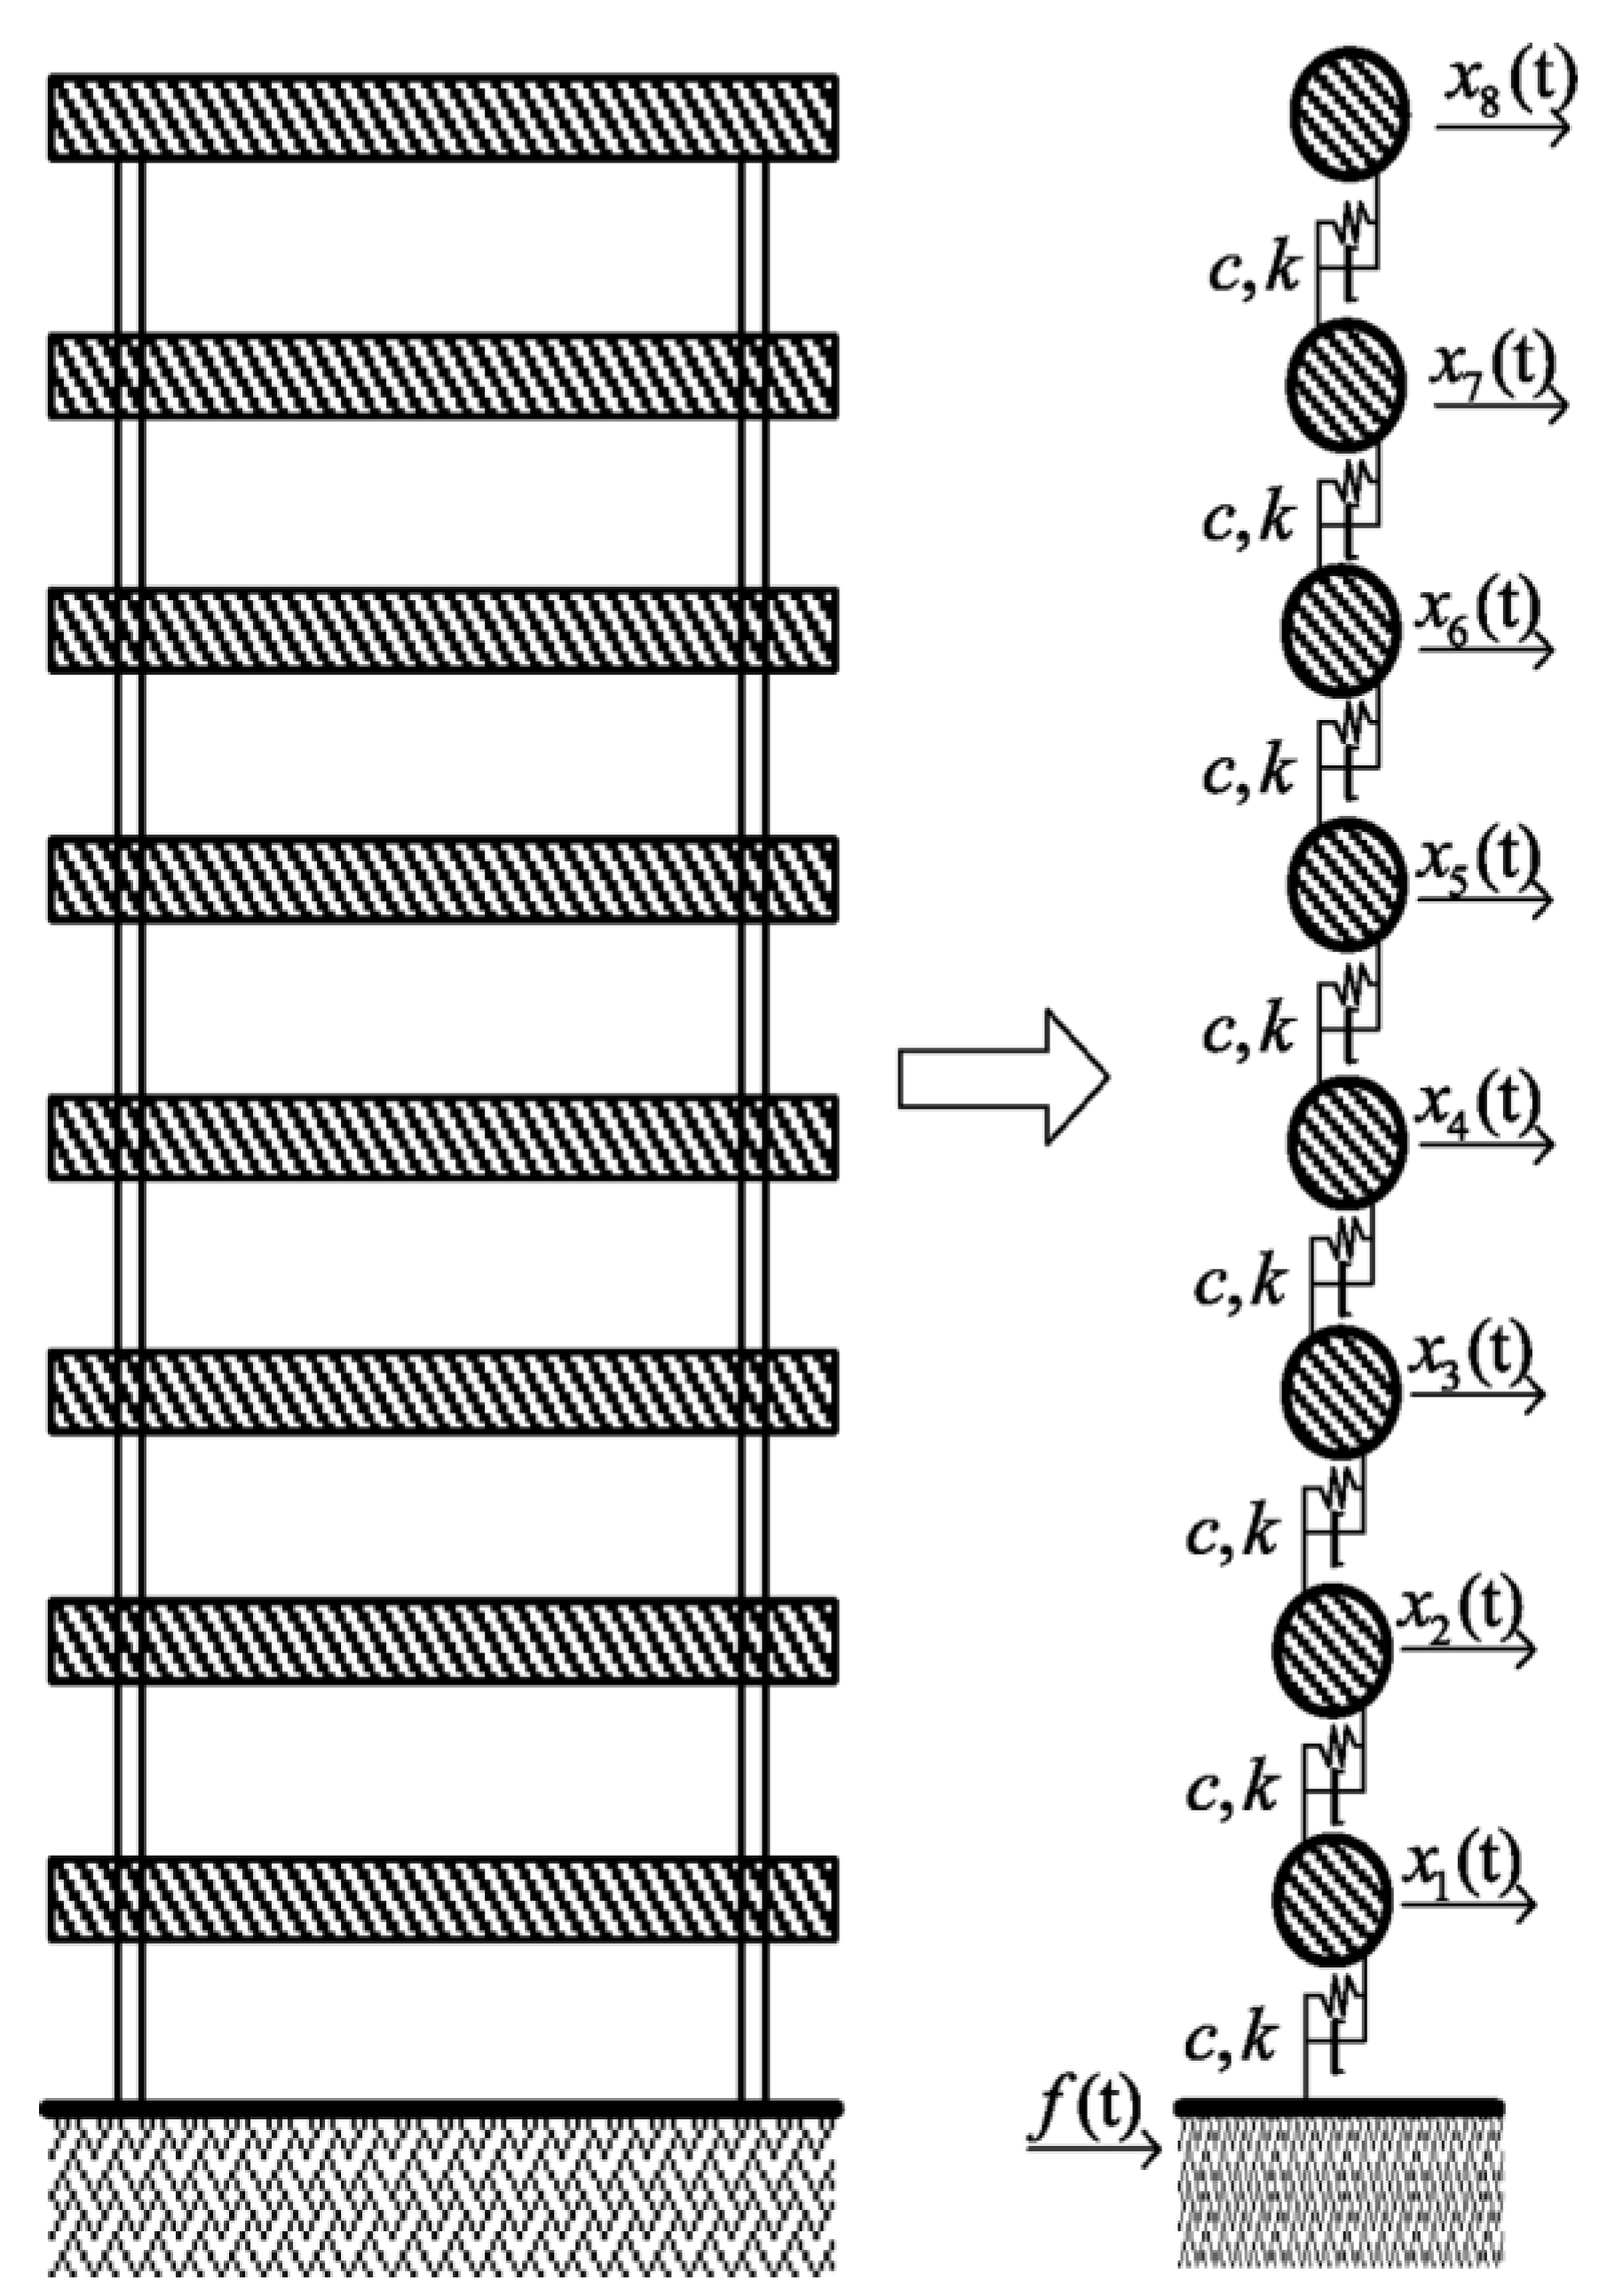
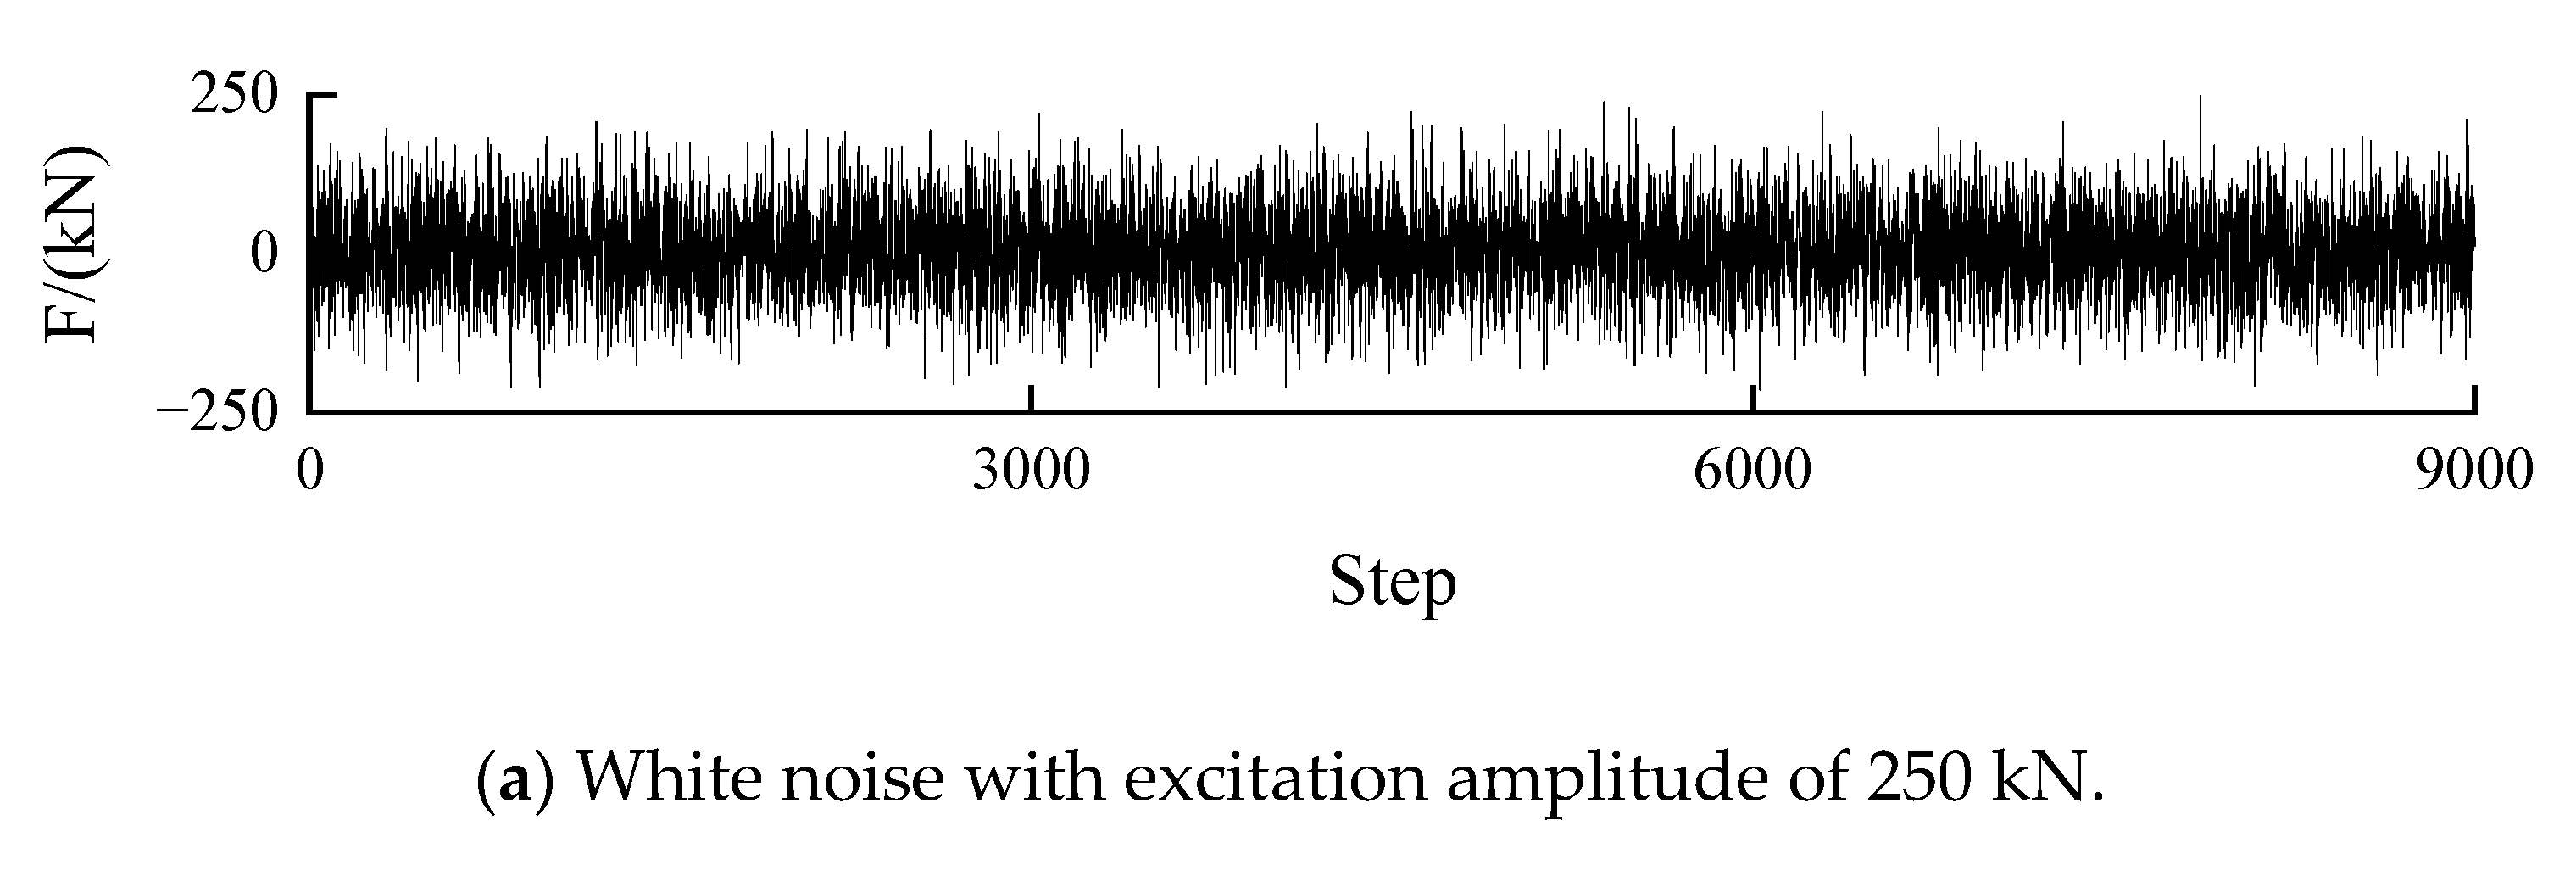
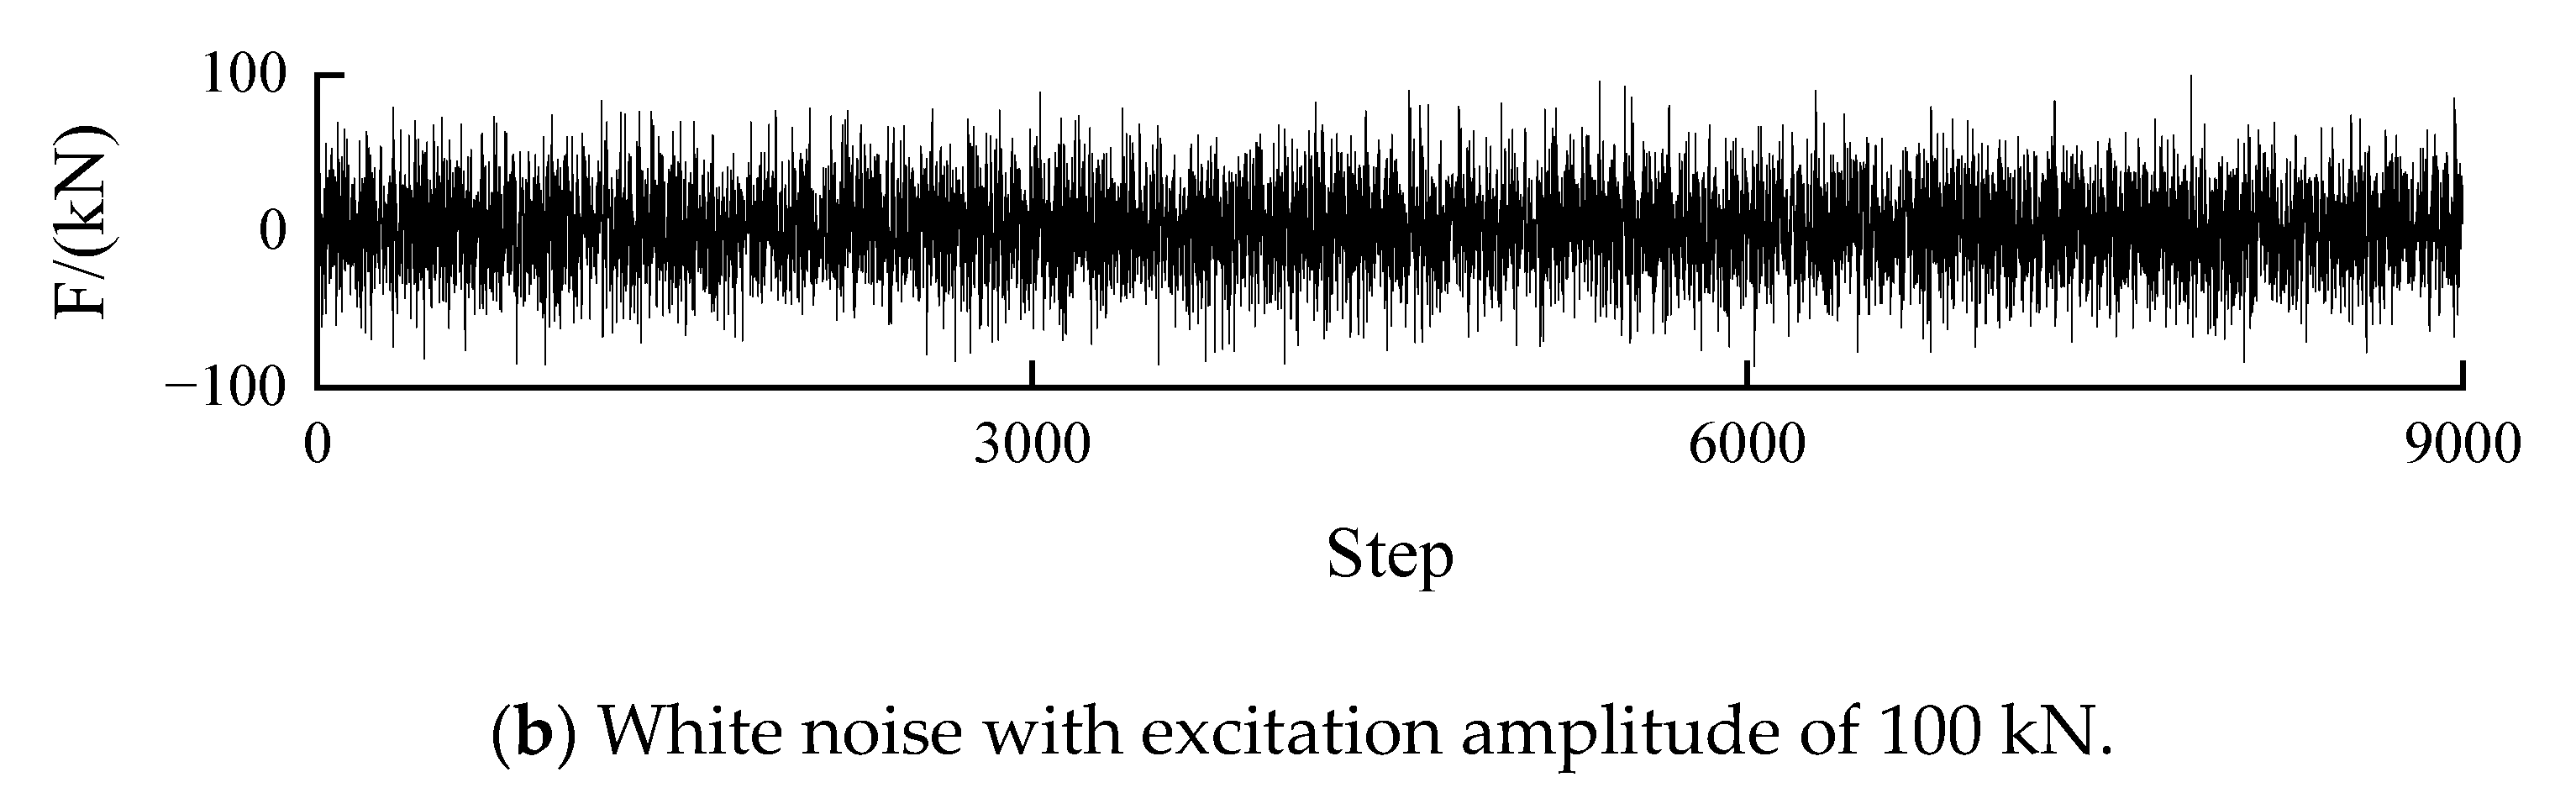
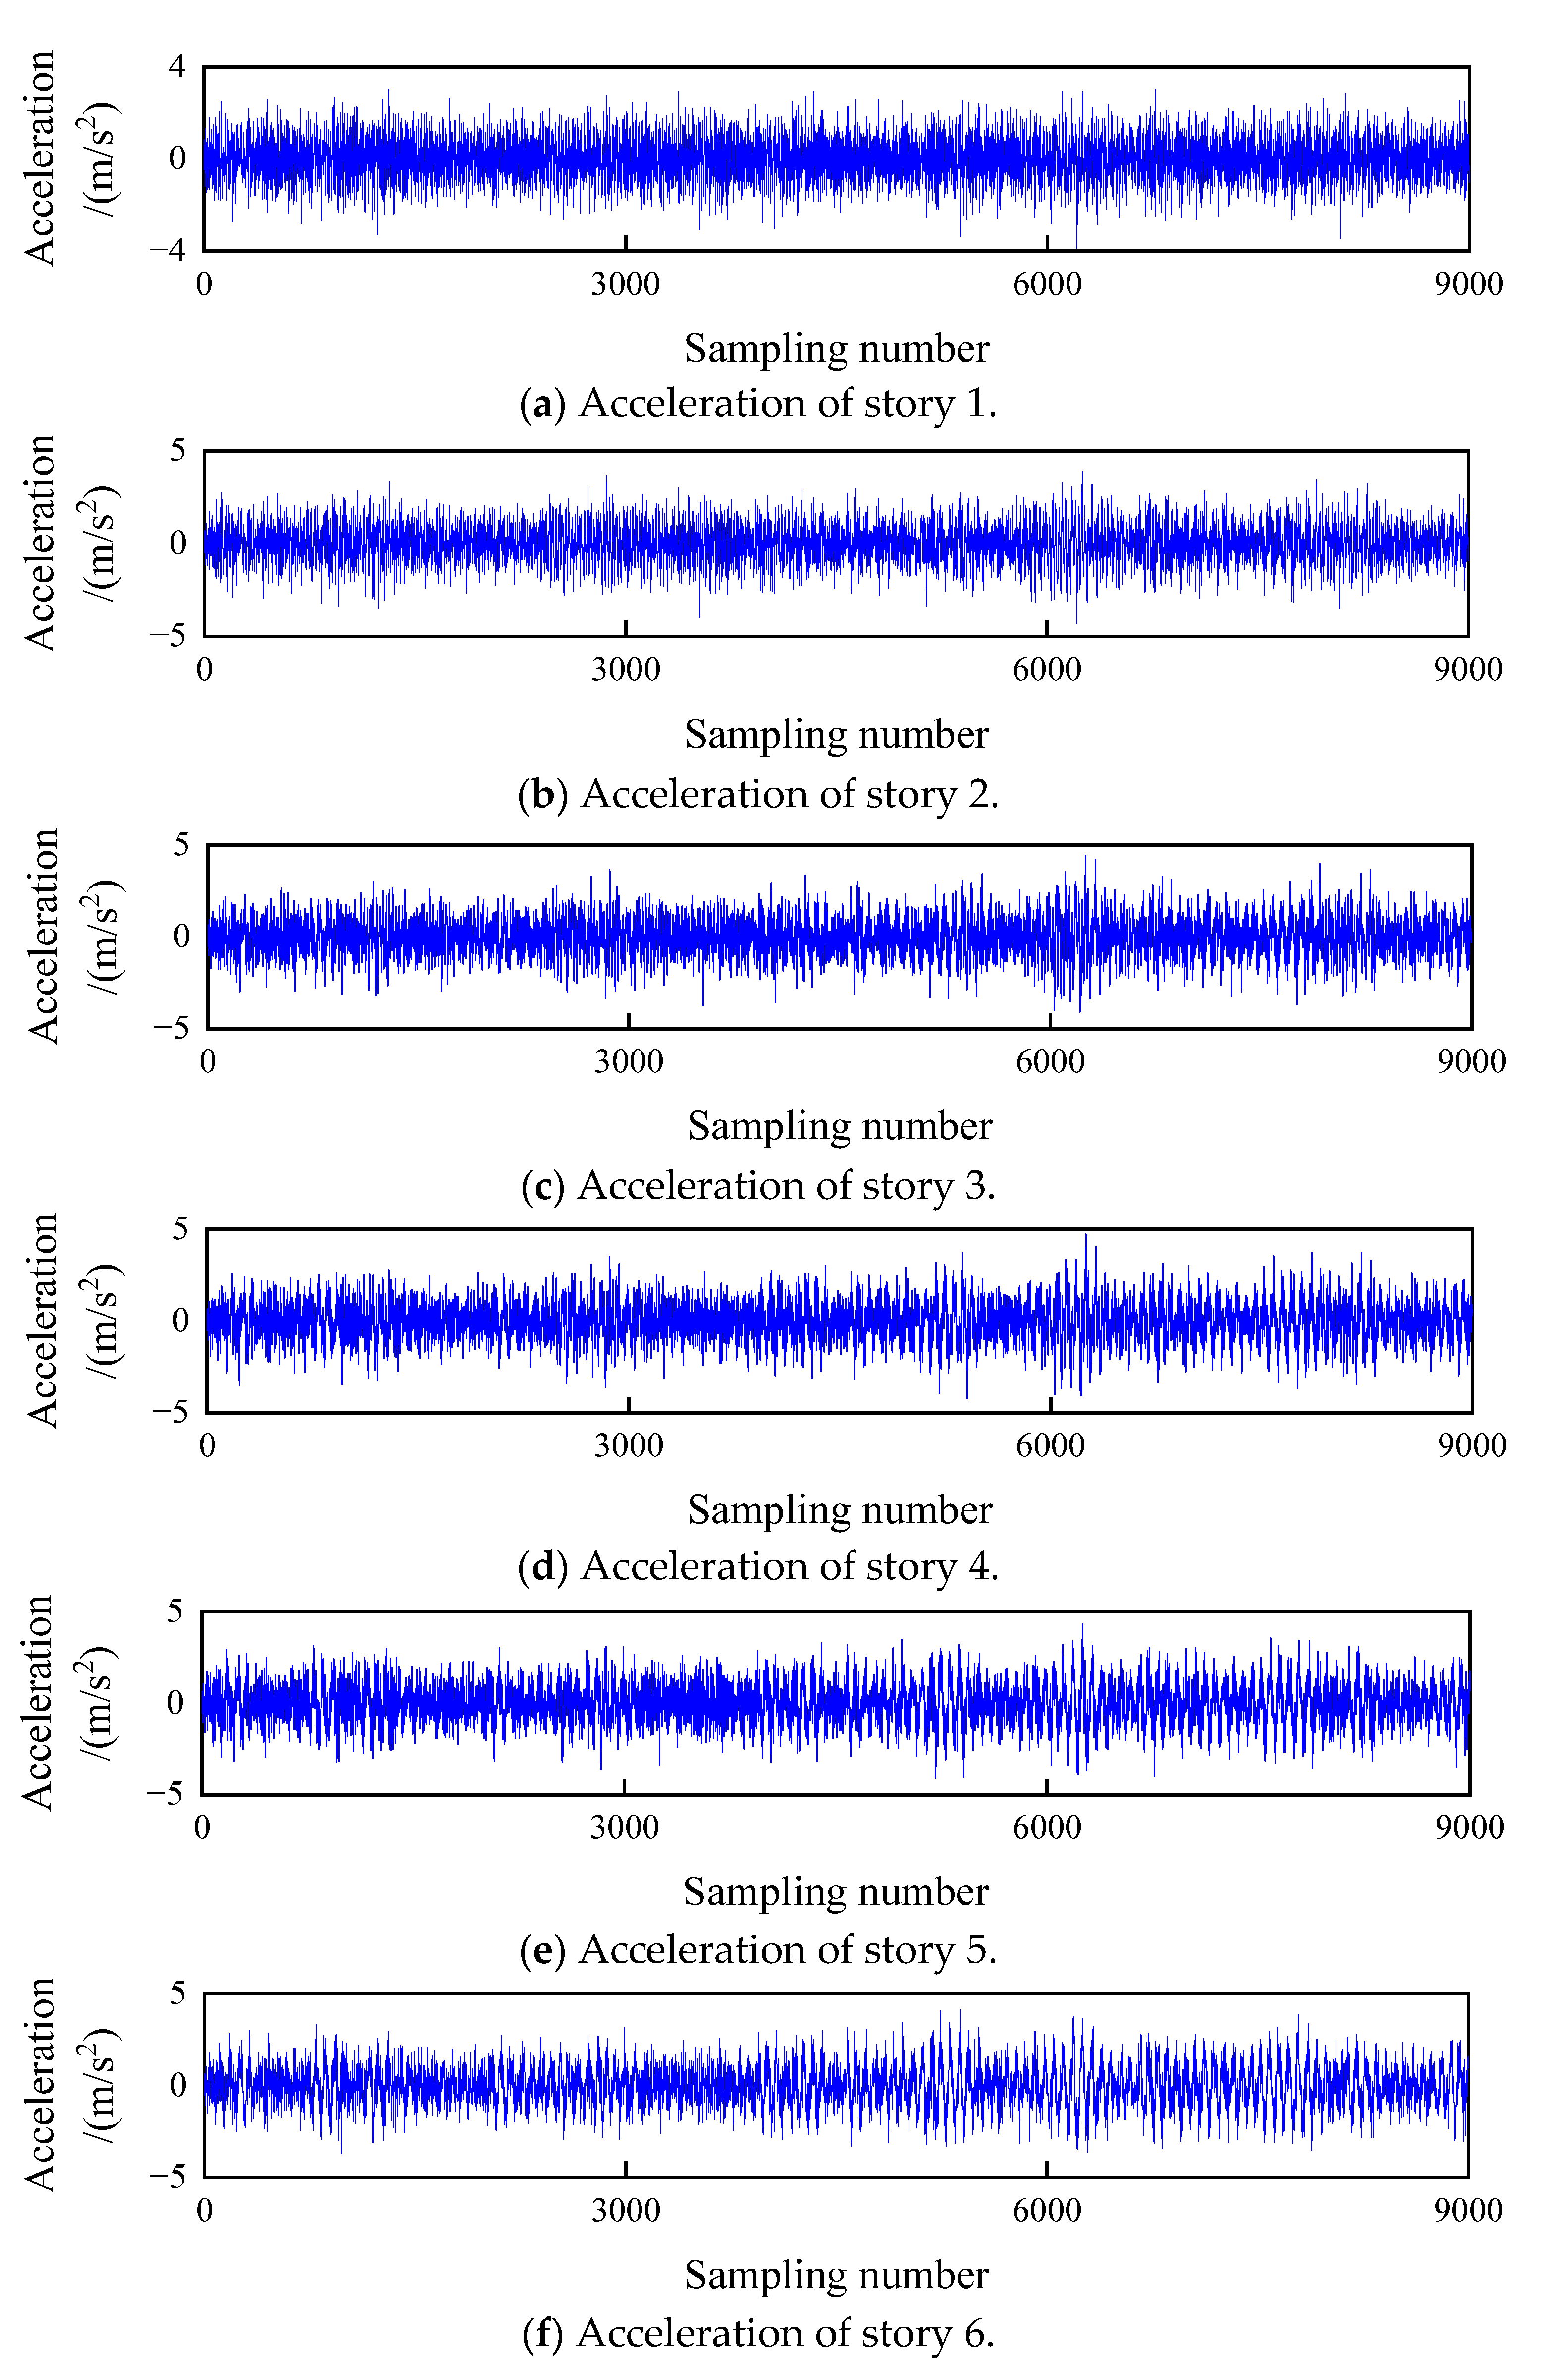
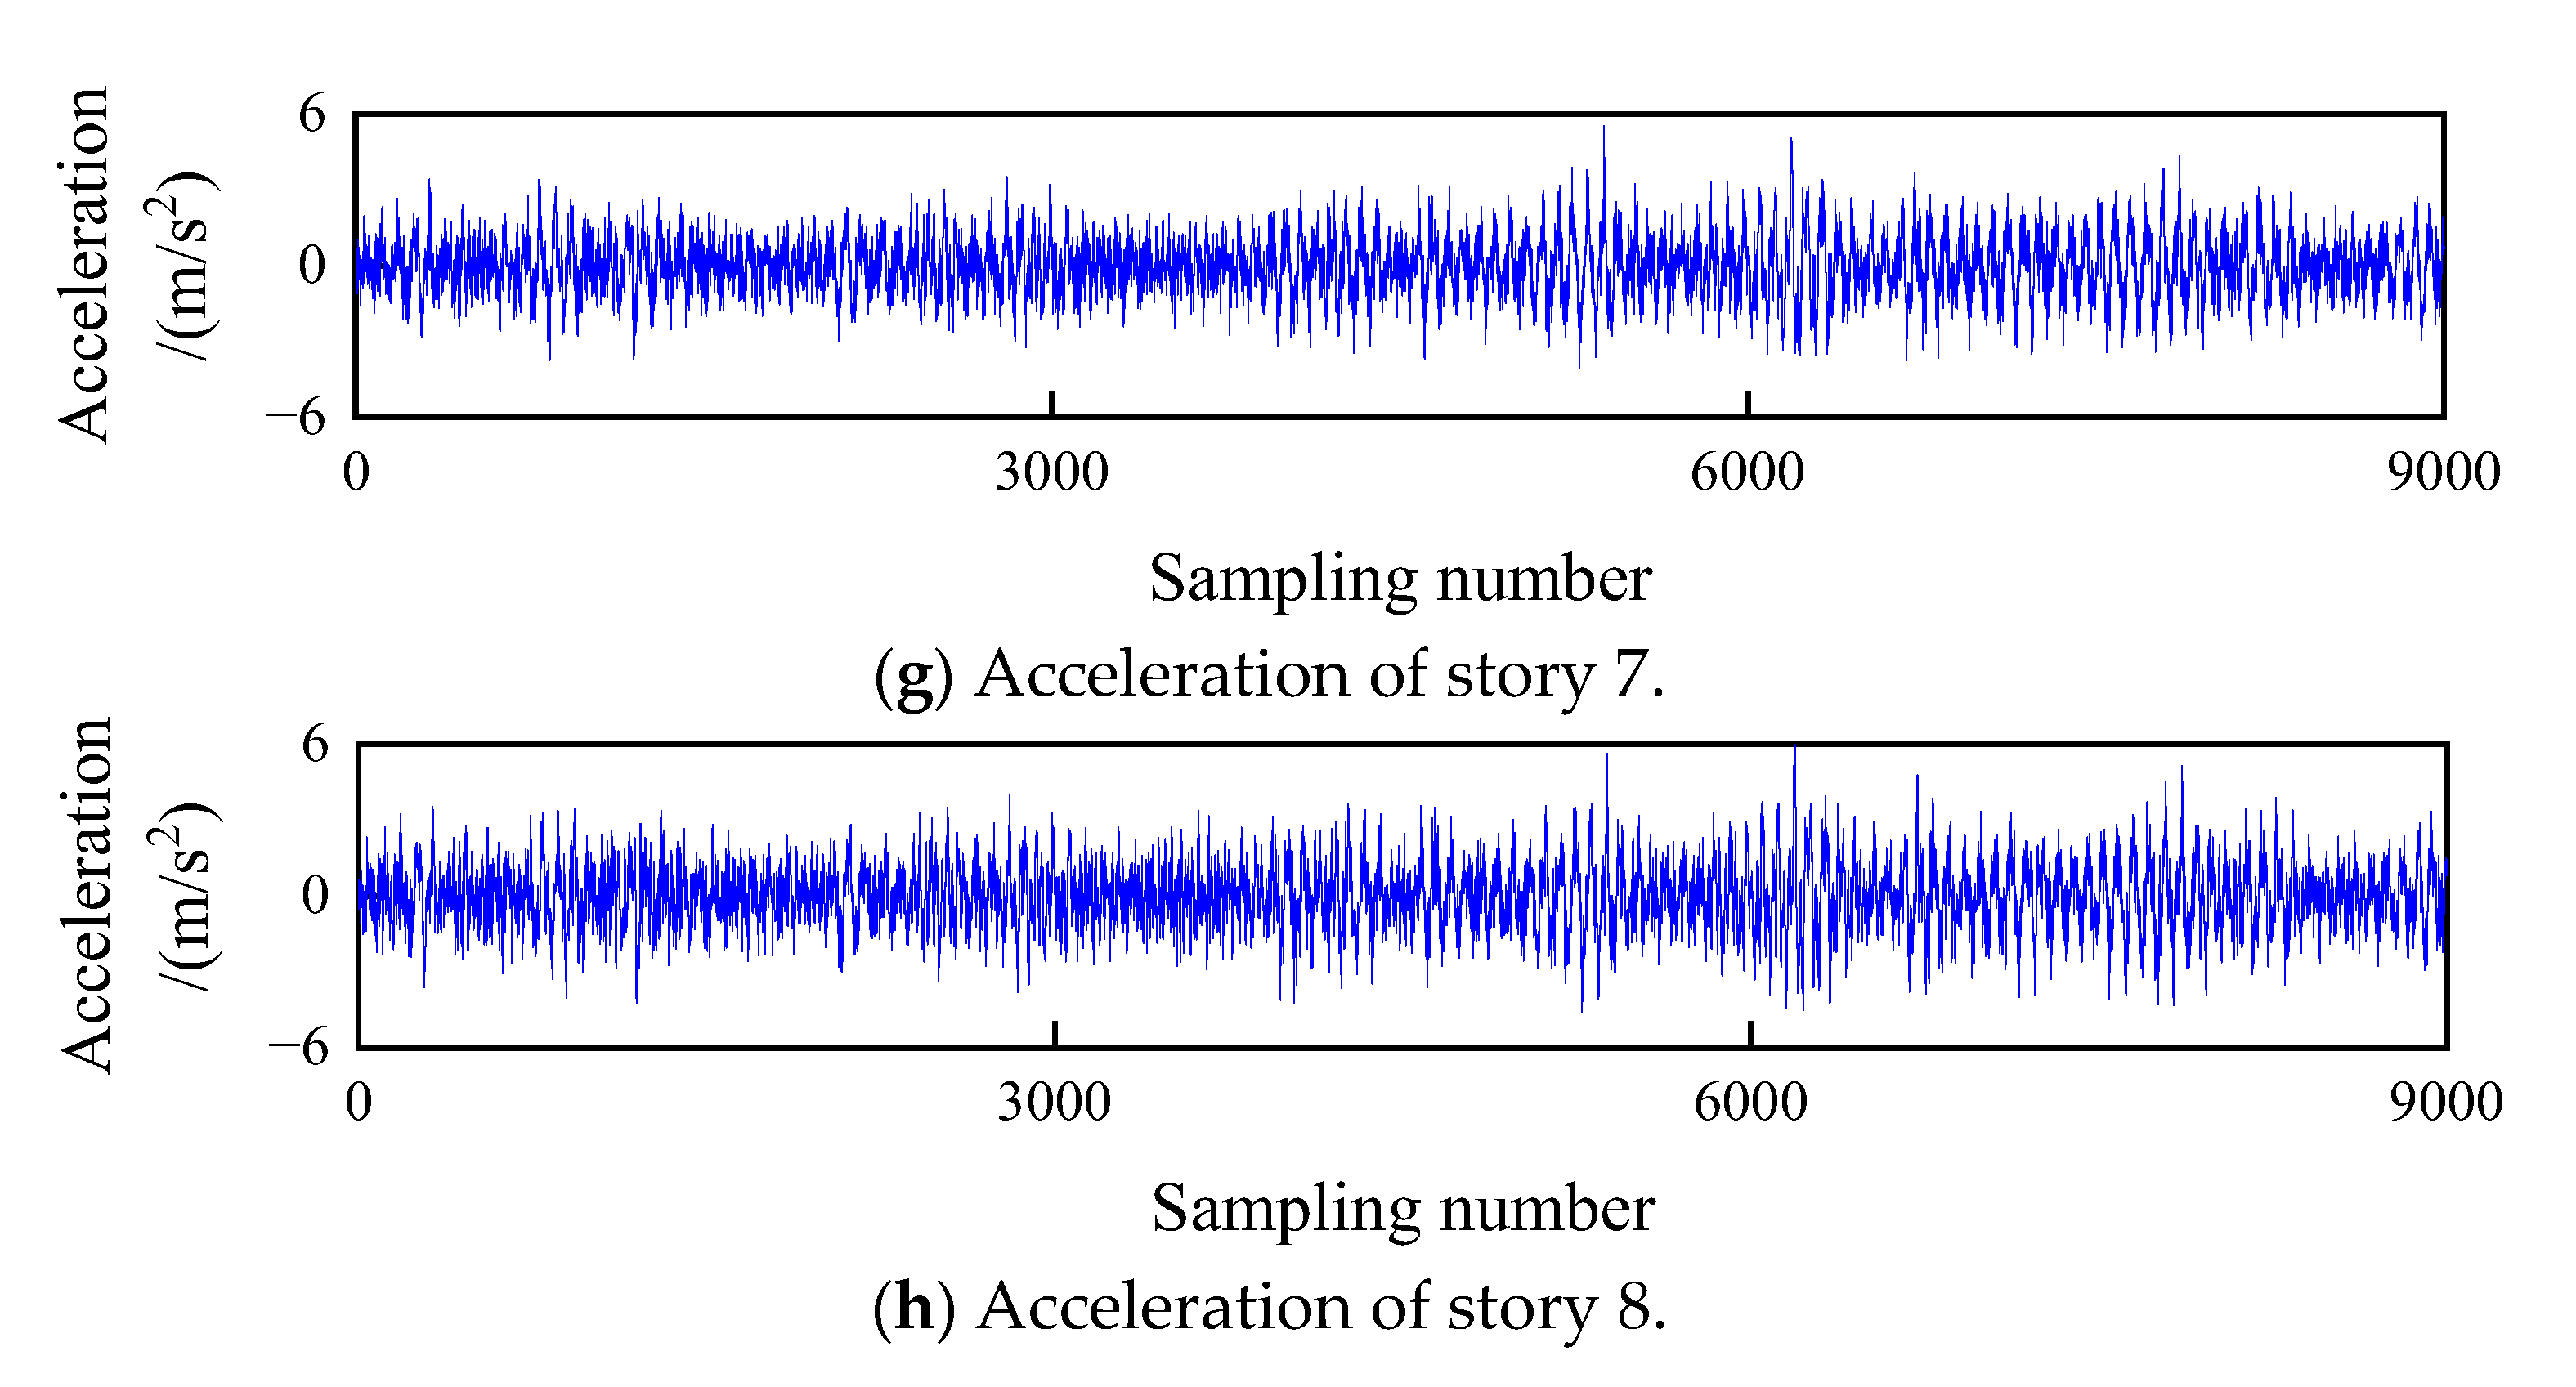
4.1. Simulation of Eight-Story Shear Building Model

Numerical simulations were carried out for an eight-story shear structure model with external excitation at the bottom, as shown in Figure 2. It was assumed that the mass of each story of the model was 100 kg, the shear stiffness of each story was 1 MN/m, and the structural damping ratio was 0.03. The identification results of structural nonlinear damage are generally related to the amplitude of the excitation load. Therefore, in this paper, two kinds of white noise with different amplitudes were used to excite the structure. The white noise as shown in Figure 3a was used for the loading of damage scenario 1 to damage scenario 16, and the white noise as shown in Figure 3b was used for the loading of damage scenario 17 to damage scenario 24. The resulting dynamic response was calculated by the Wilson-θ method, where the θ was taken as 1.4.
Nonlinear damage sources with bilinear stiffness were set in the structural model, the bilinear stiffness (see Equation (7)) was used to simulate the breathing cracks in columns between two adjacent stories, and the nonlinear elastic or plastic behaviors of the structure were not considered. As shown in Table 1, the 10% and 30% damage scenarios of the 1st –8th stories were simulated respectively. Due to space limitations, only a 30% damage level was considered for the damage scenario of 100 kN excitation amplitude. In order to simulate the noise disturbance in the actual acquisition, 5% white noise was considered in each acceleration response. The acceleration data with measurement noise is obtained by the following calculation:
{ y t } = { y t } + H { ω t }
where {yt} is the acceleration response with measurement noise, { y t } is the acceleration response without measurement noise, H is the level of measurement noise, and { ω t } is a random amount of white noise at the same level as the magnitude of { y t } .

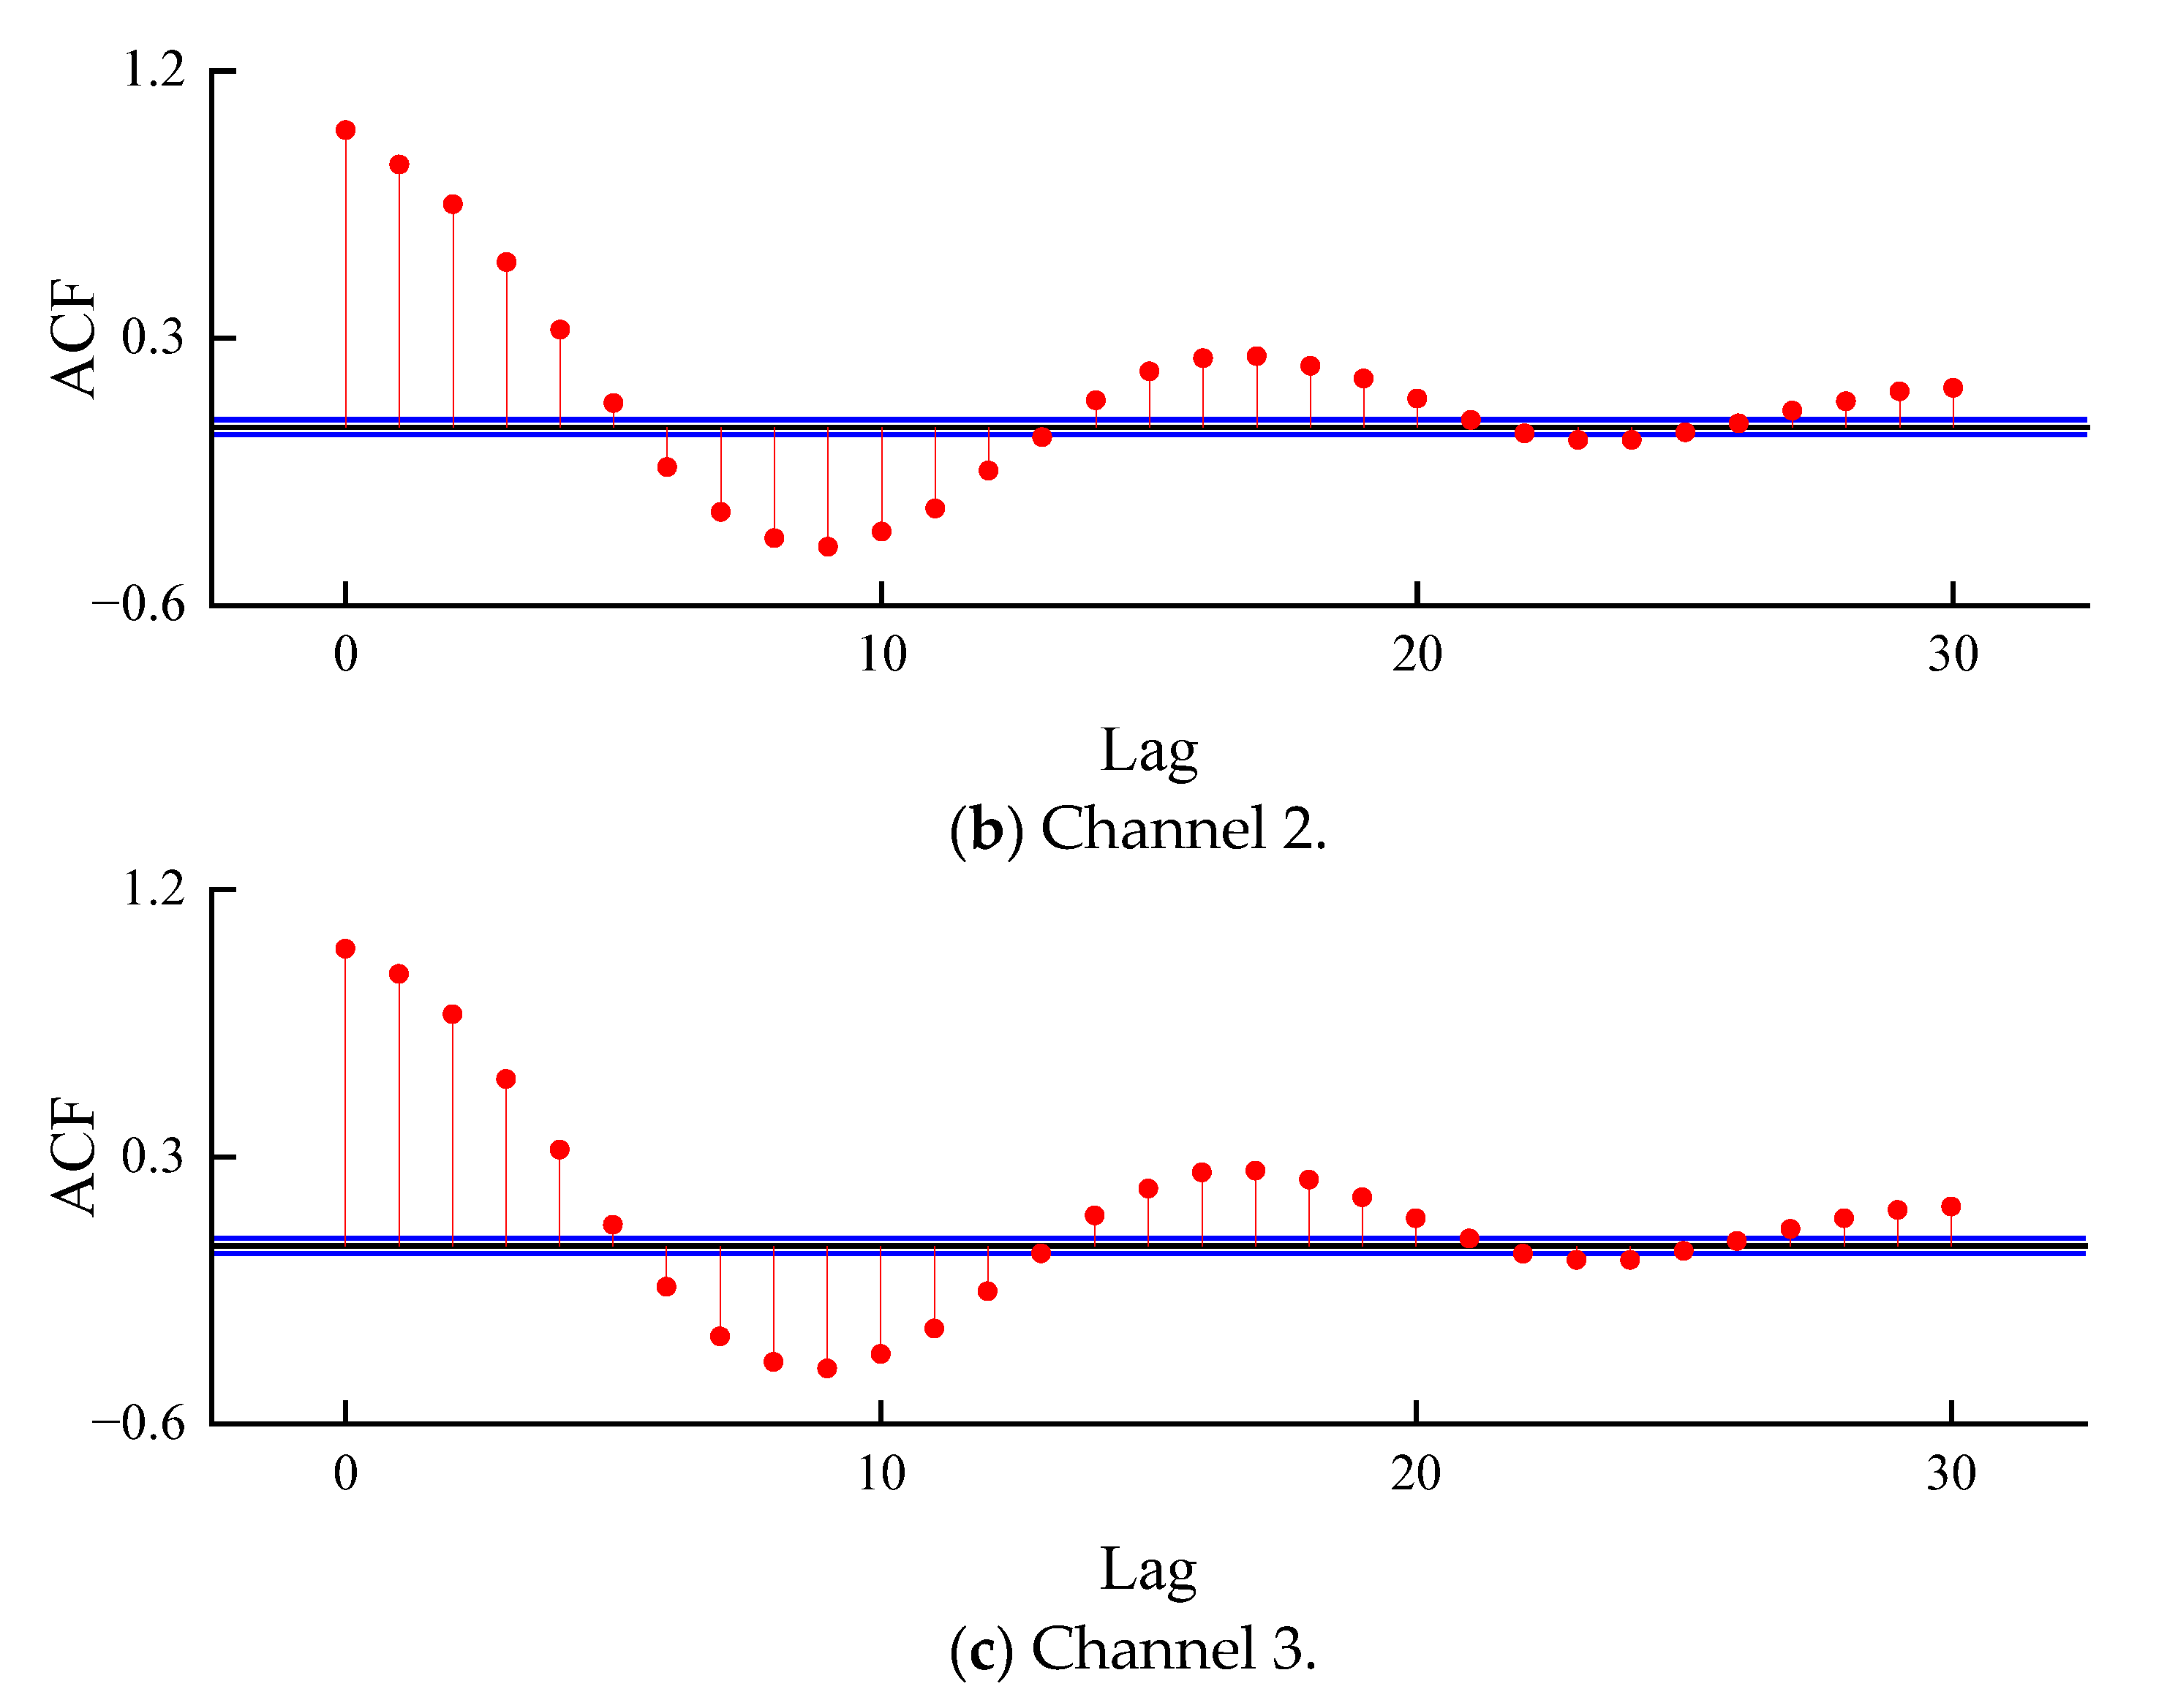
4.2. Establishment of AR Model

The structural acceleration data include 9000 data points. Acquire the acceleration data of the baseline state when the structure is without damage, The acceleration response curves under the baseline state with excitation amplitude of 250 kN are shown in Figure 4.
In this paper, ACF and AIC criteria were used to select the most appropriate AR model order. First, ACF was used to preliminarily select the AR model range, and then the model order corresponding to the smallest AIC was taken as the AR model order. The ACF curve of each channel under the baseline state is shown in Figure 5. The AR model order range was initially selected to be 10–25 according to the ACF curve, and finally the model order was selected to be 20 according to the AIC.

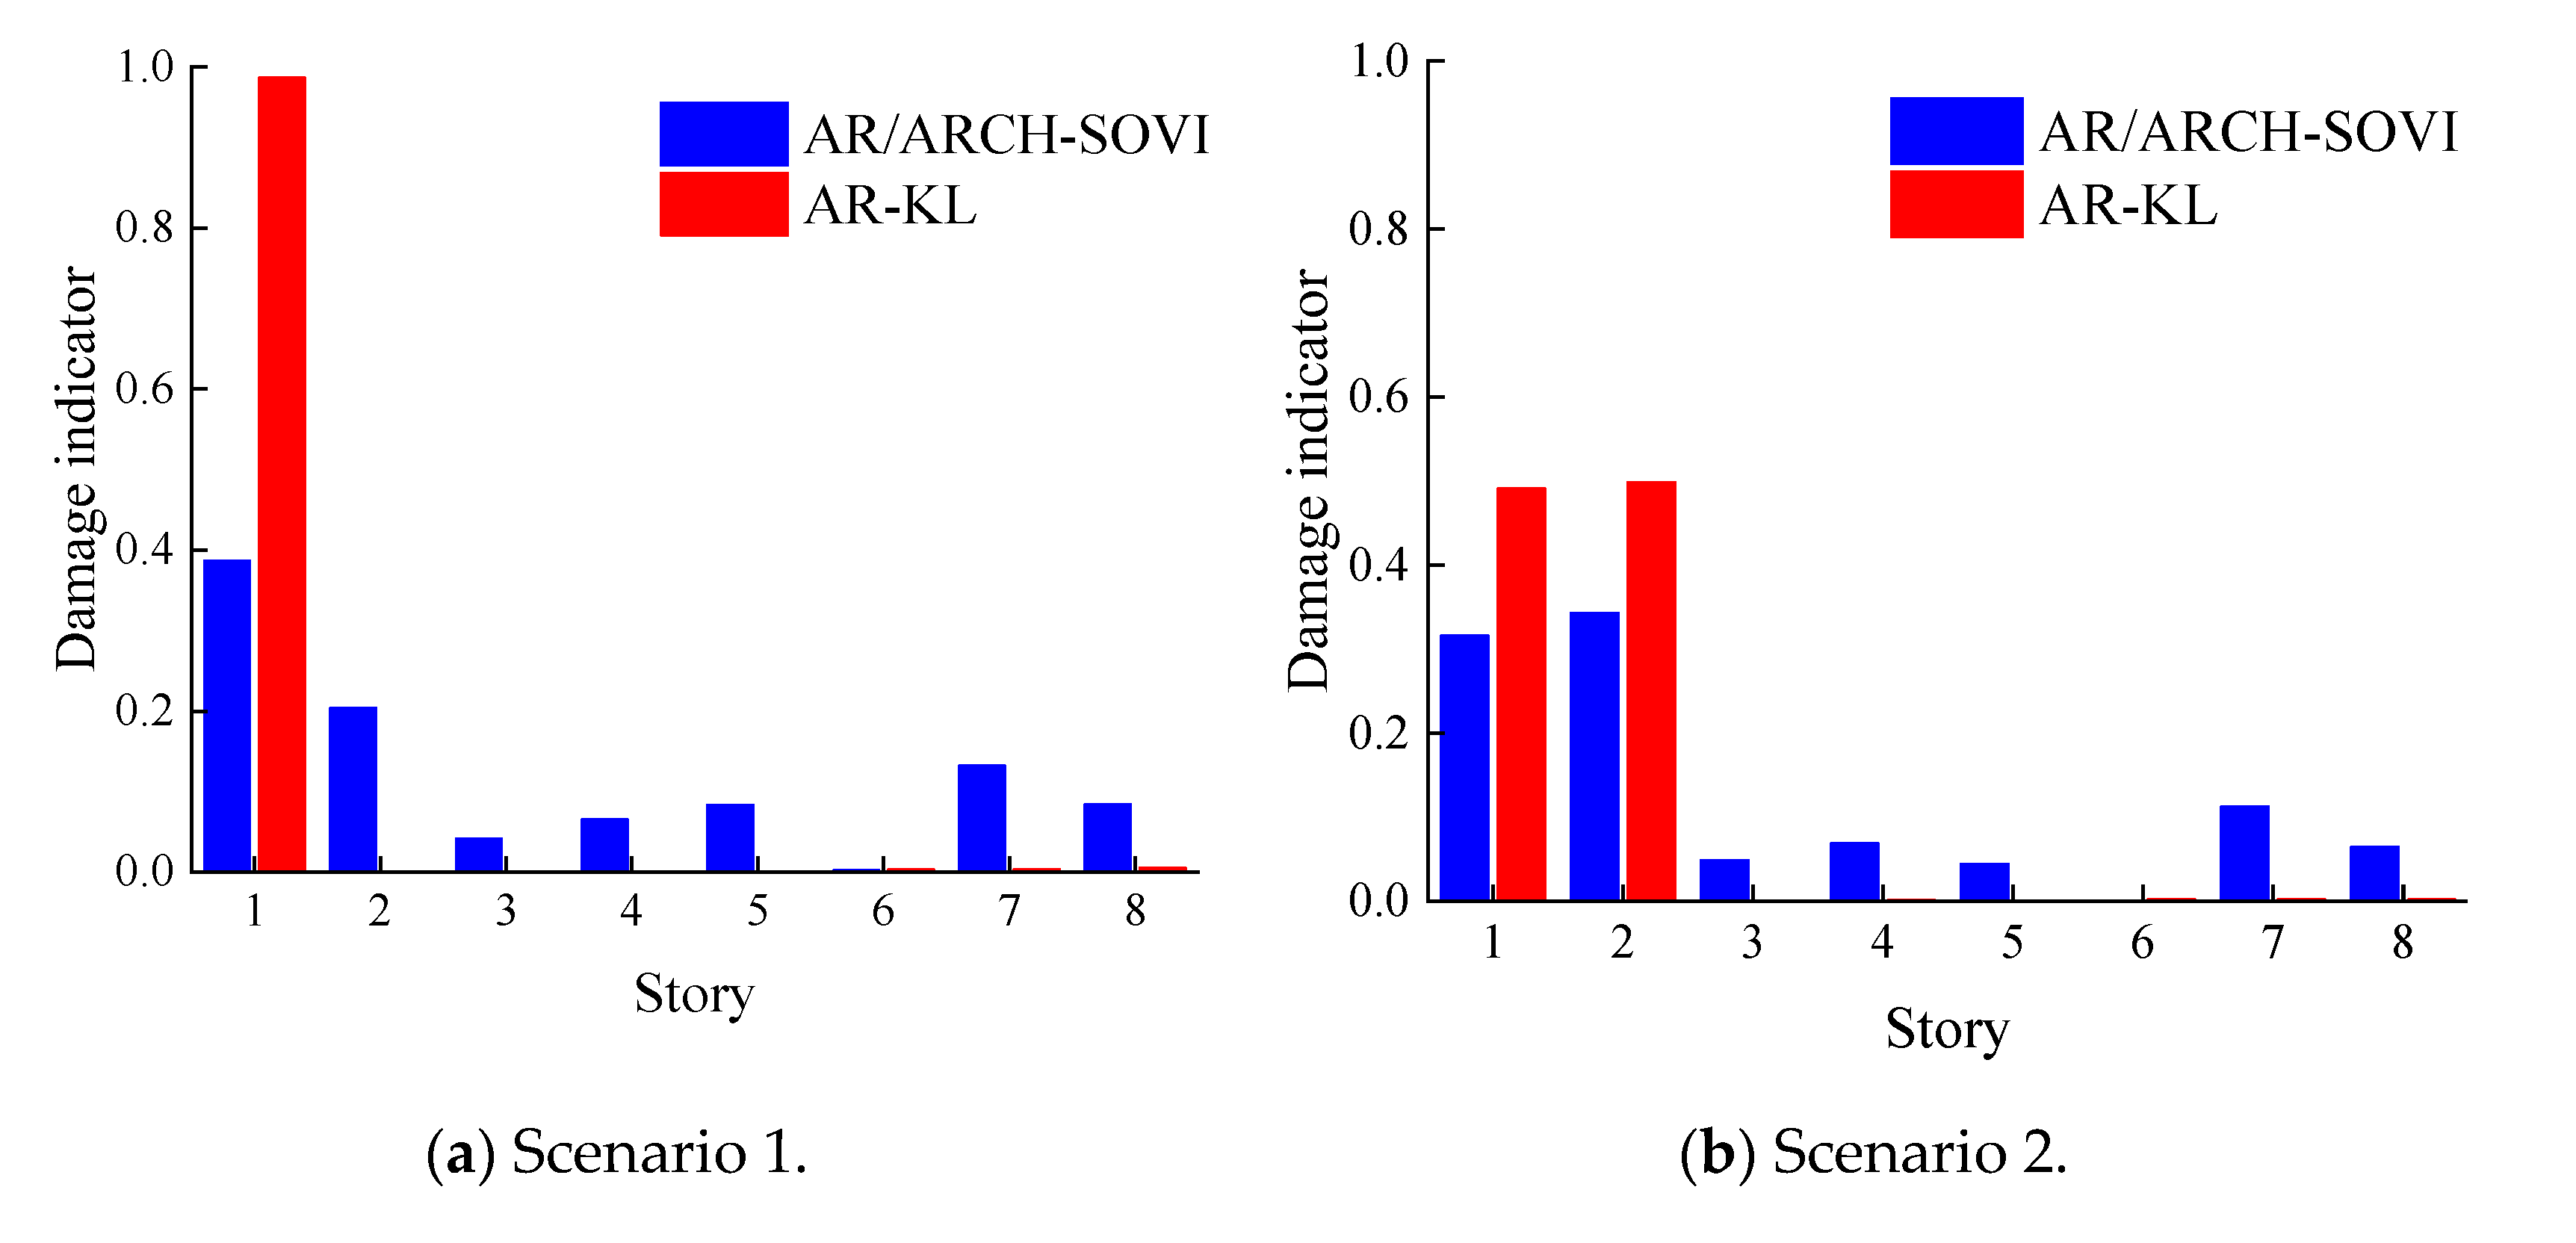
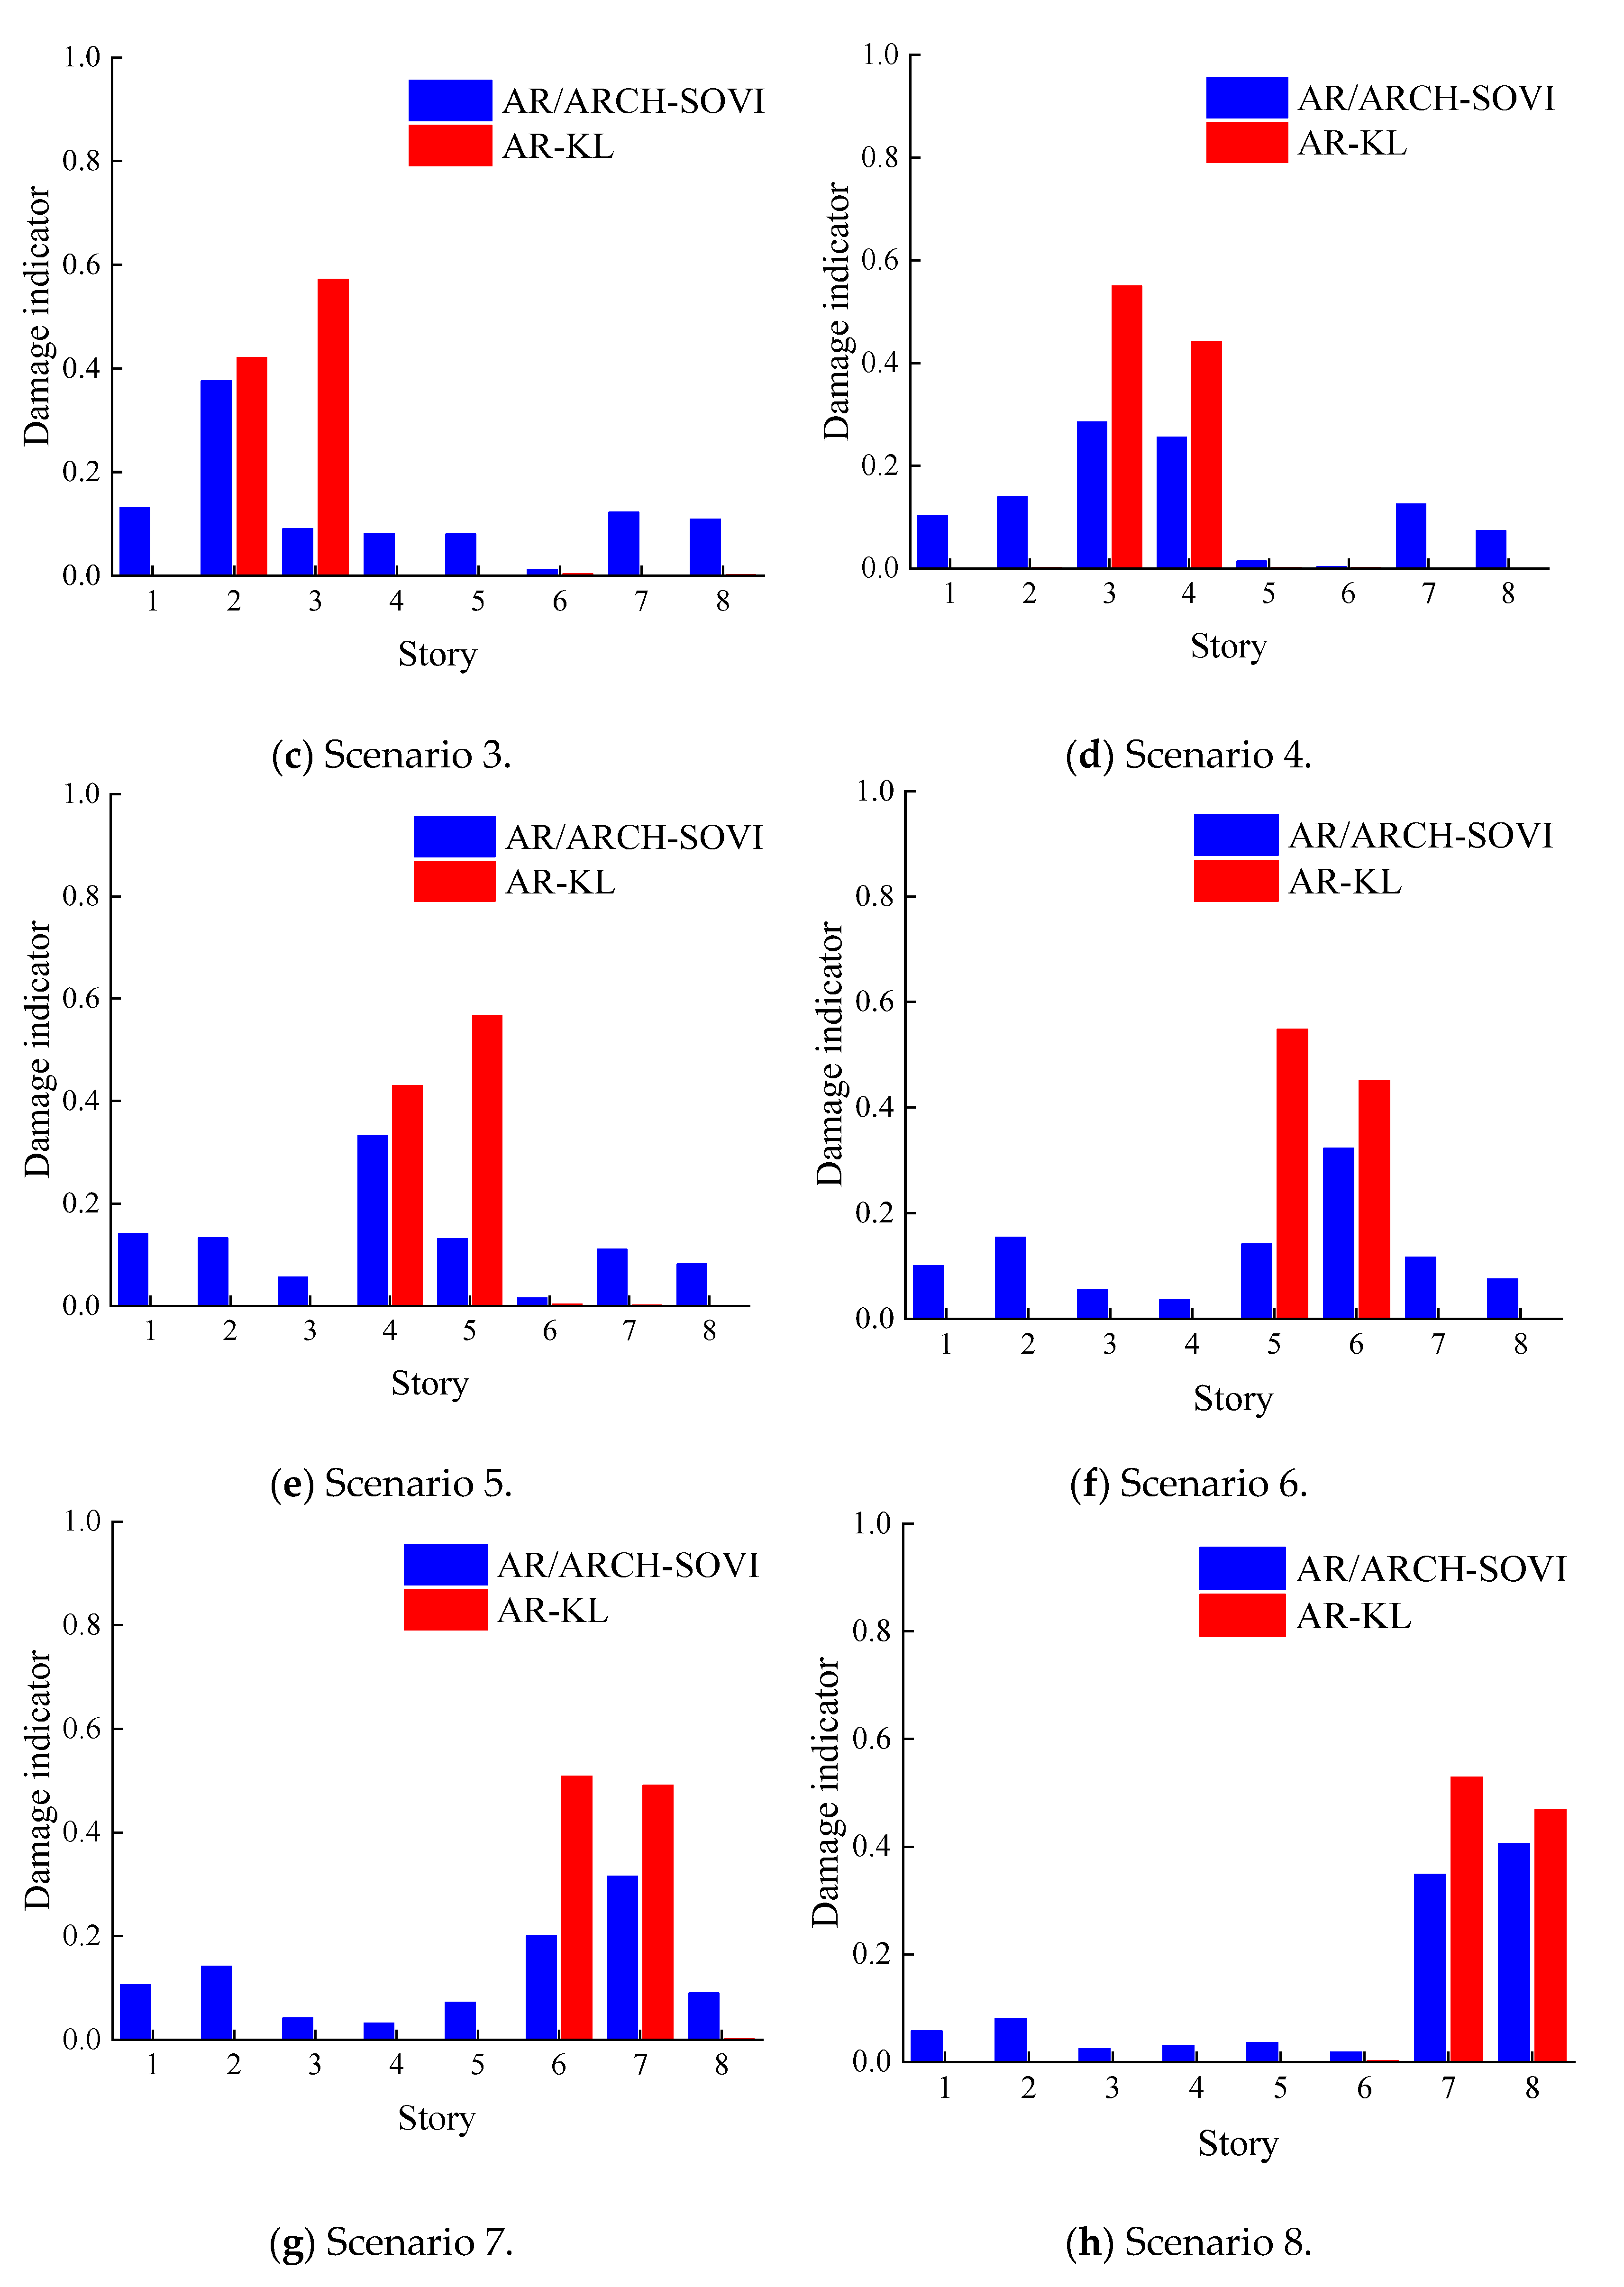
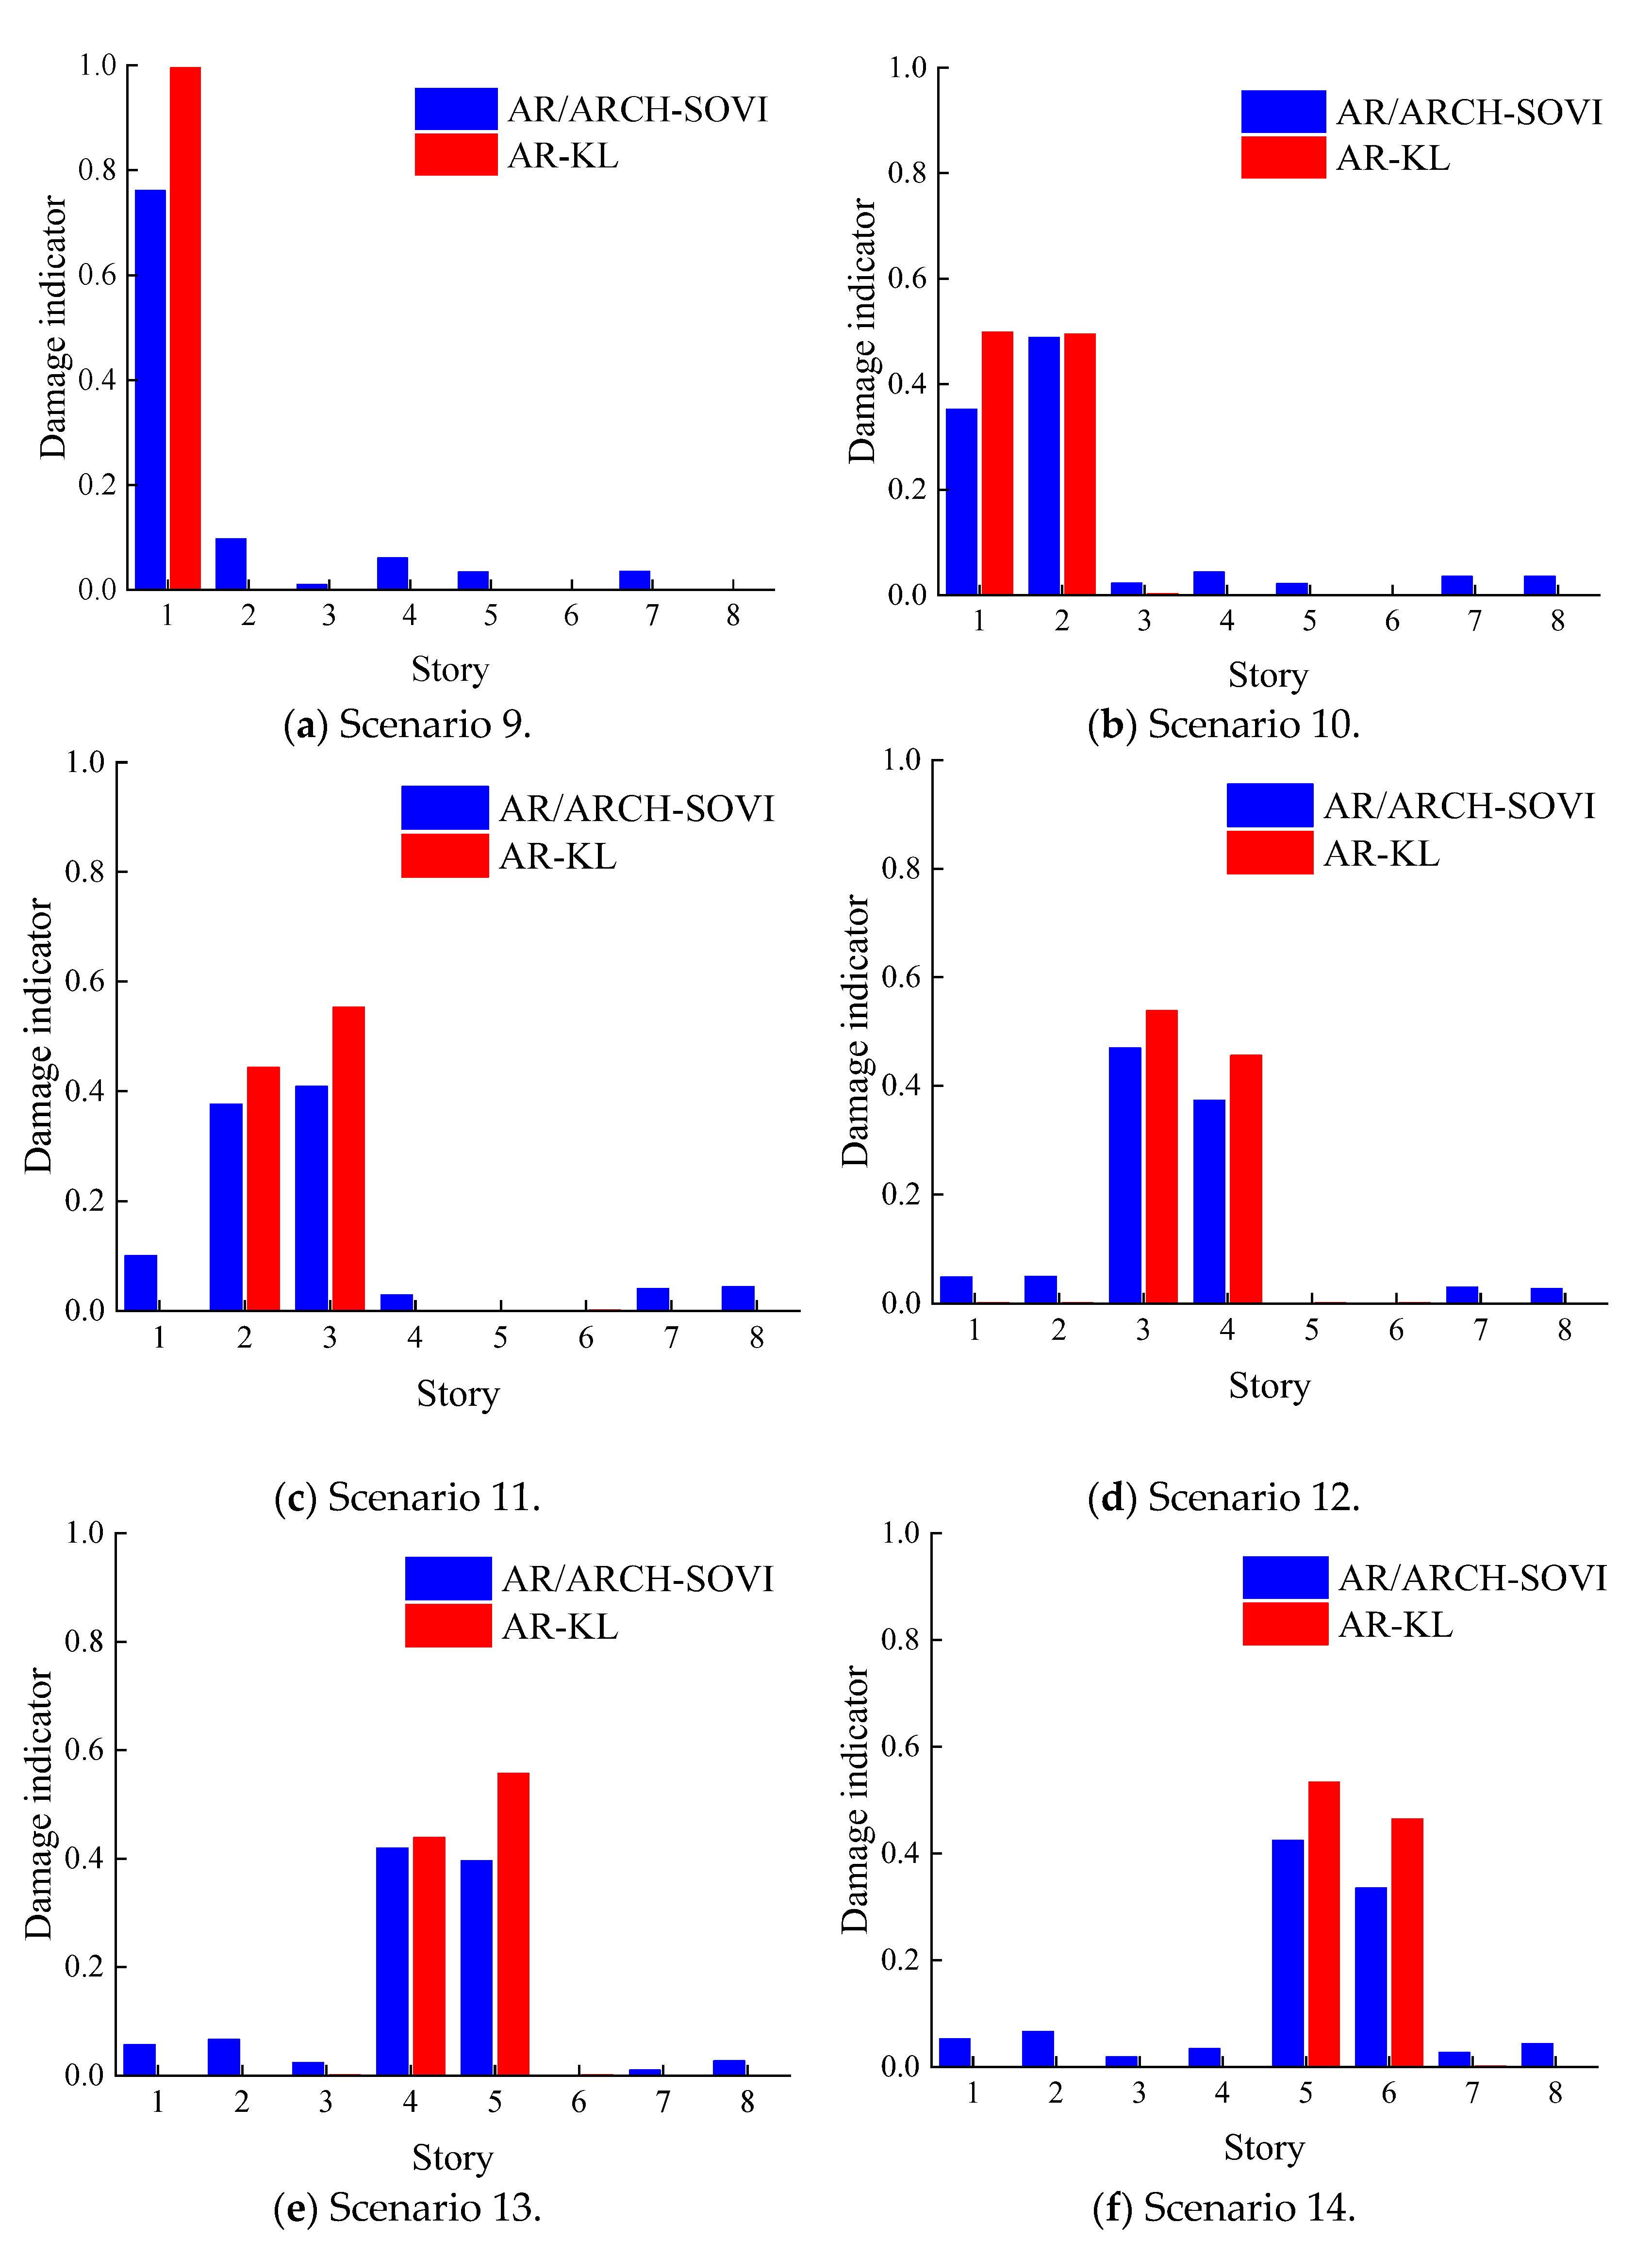
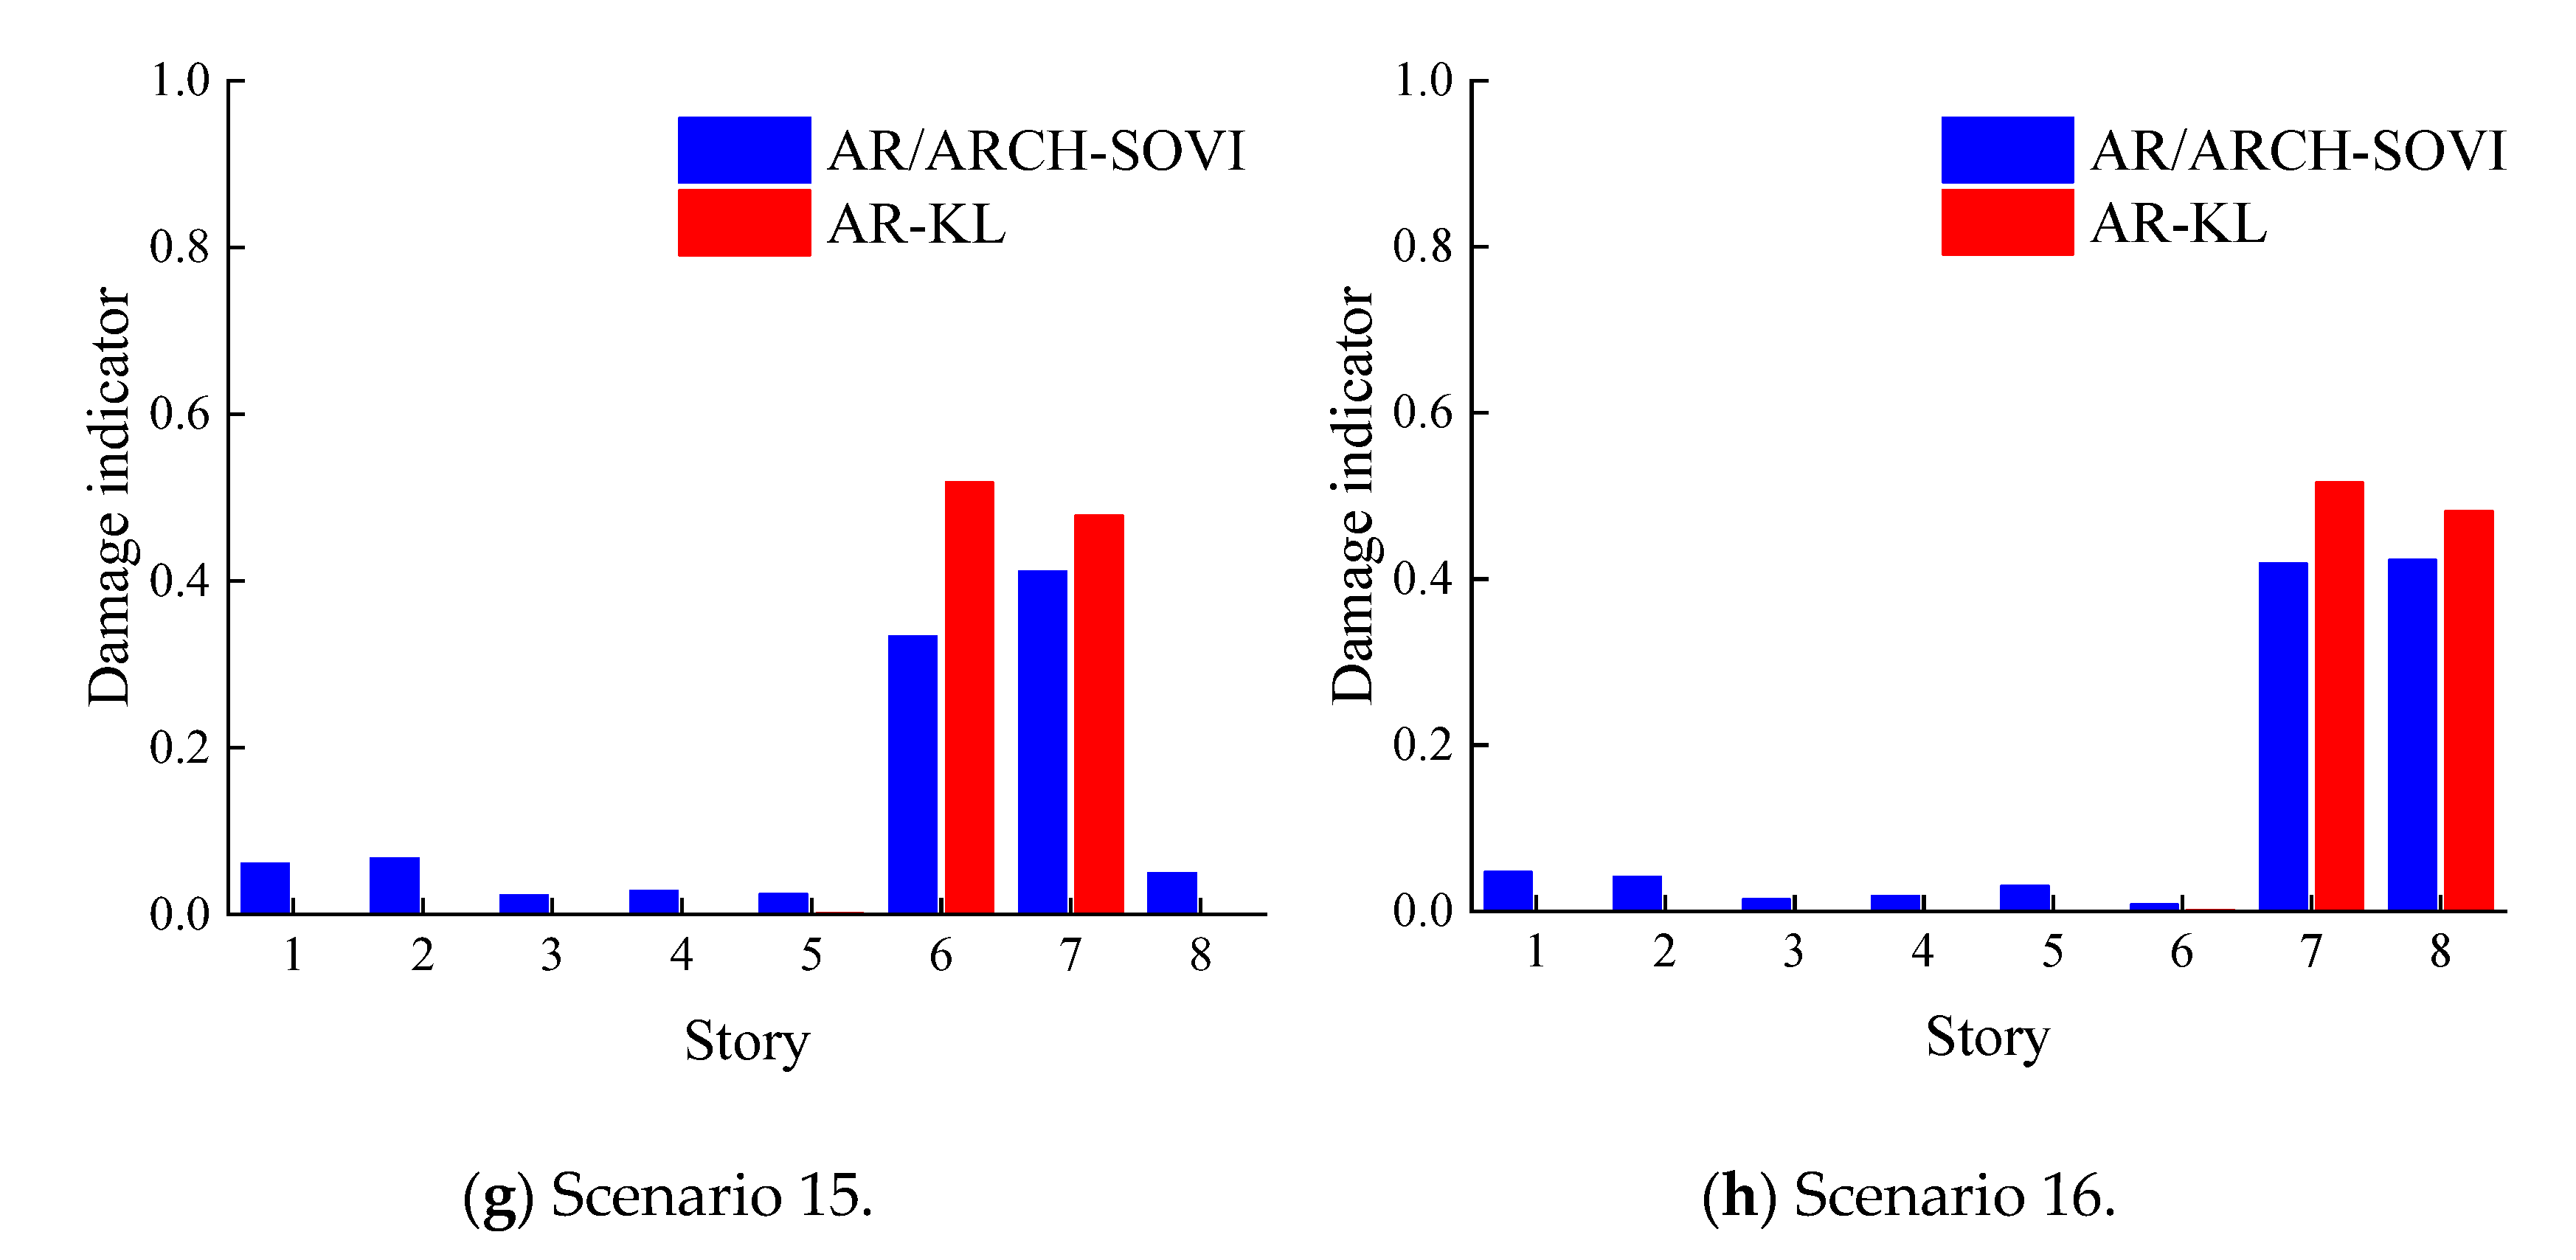
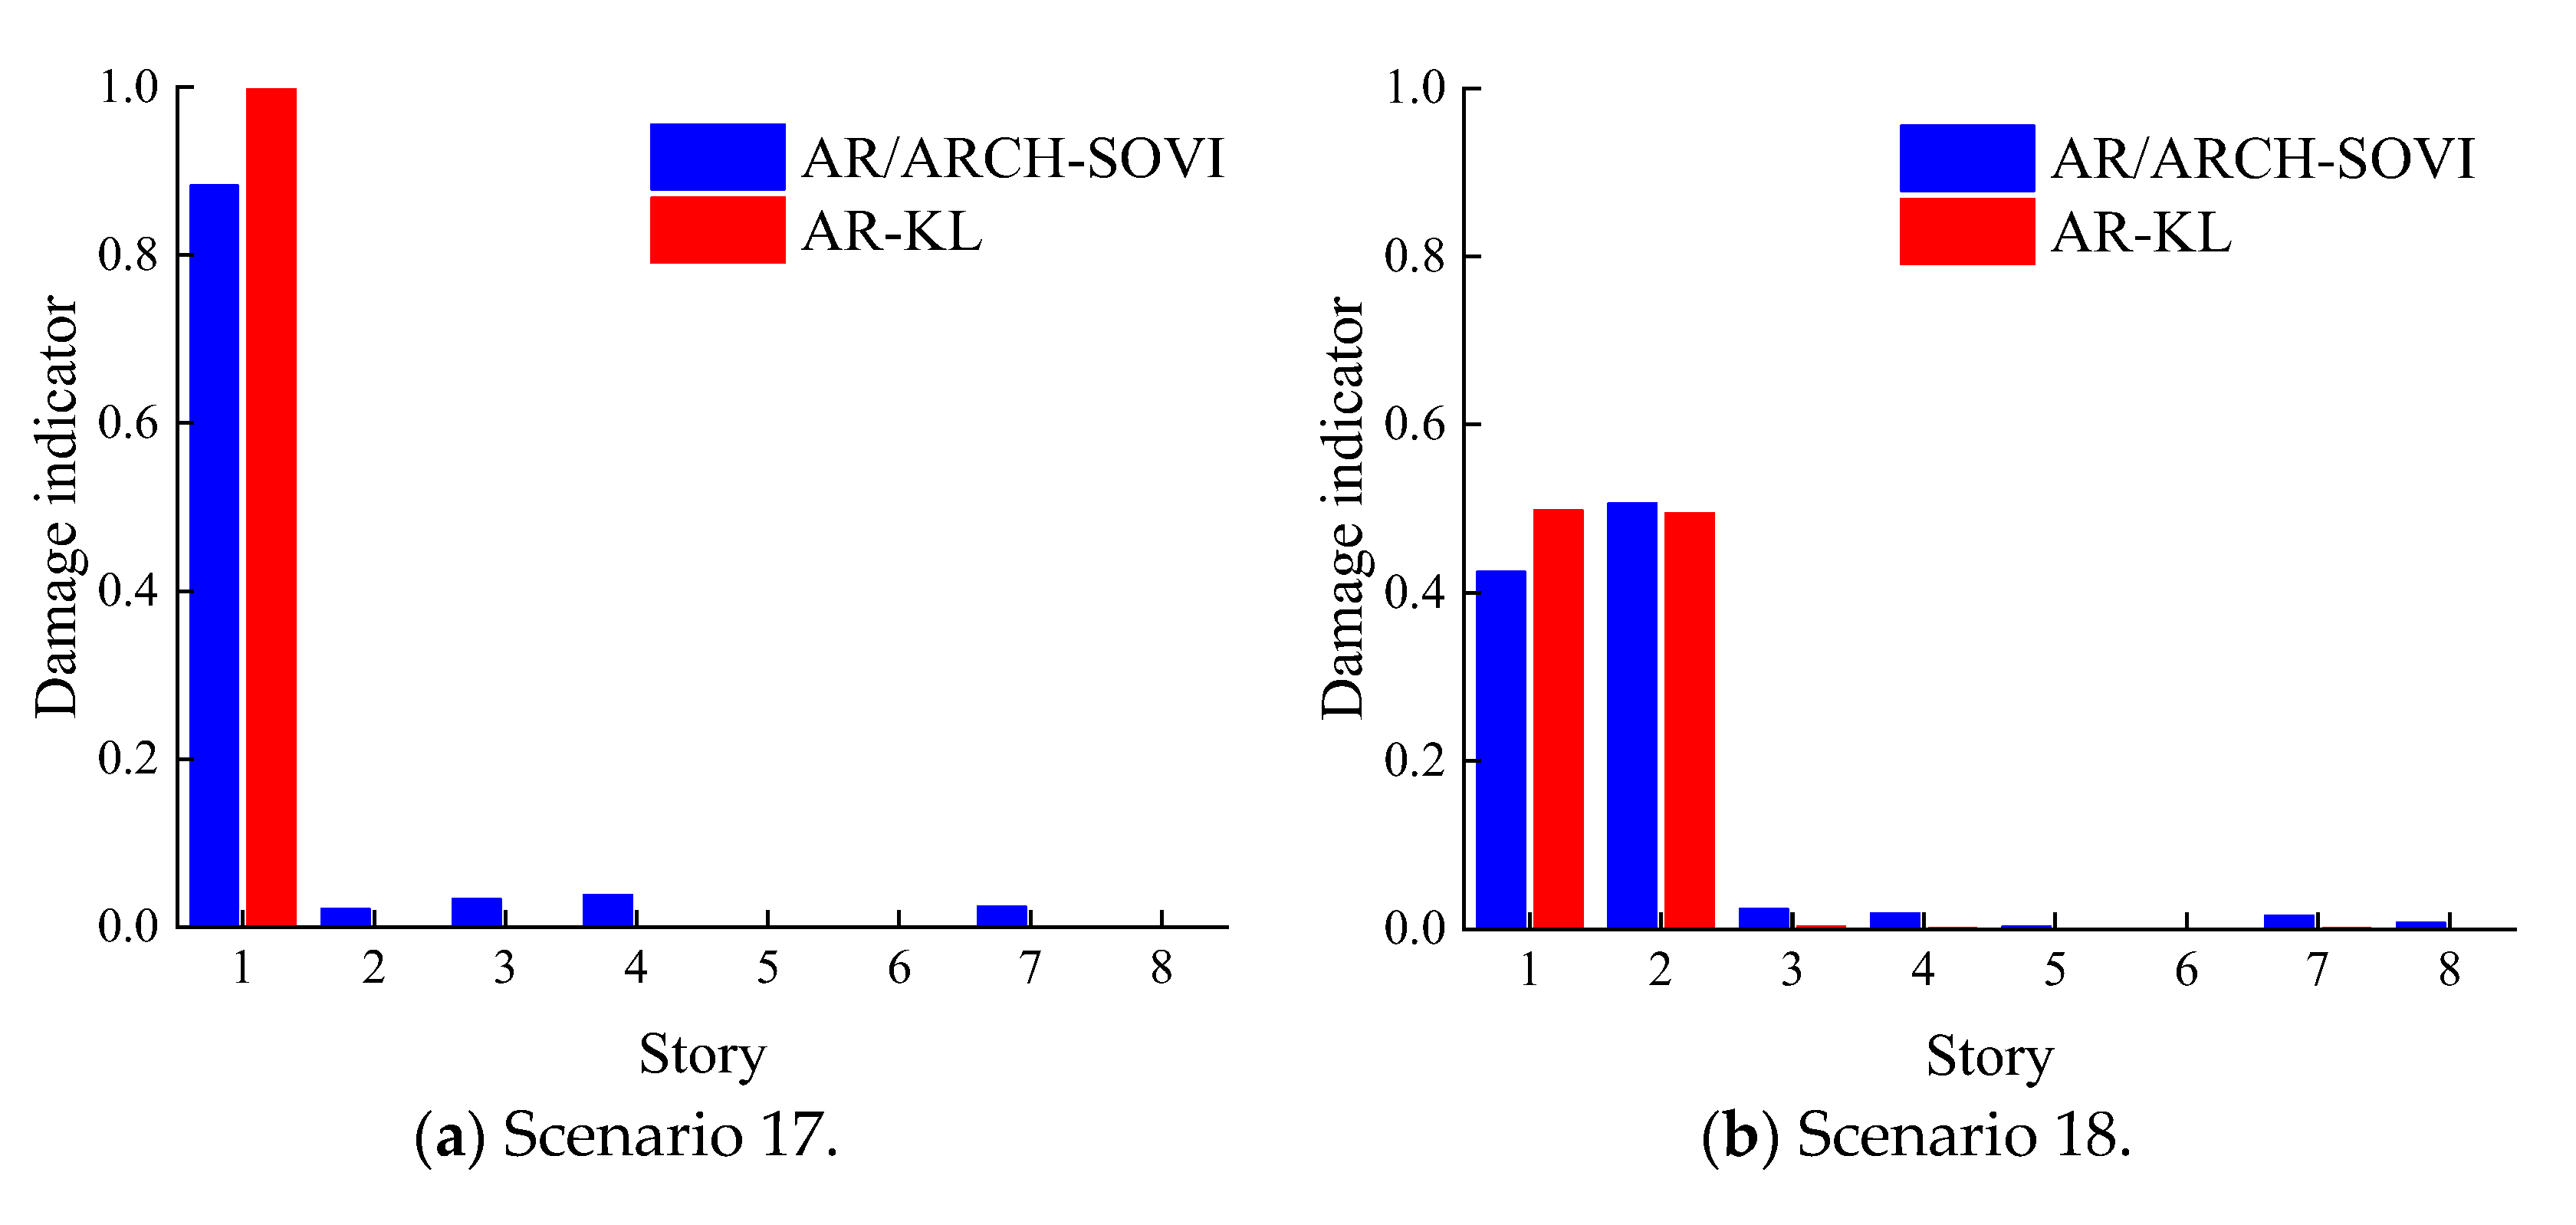
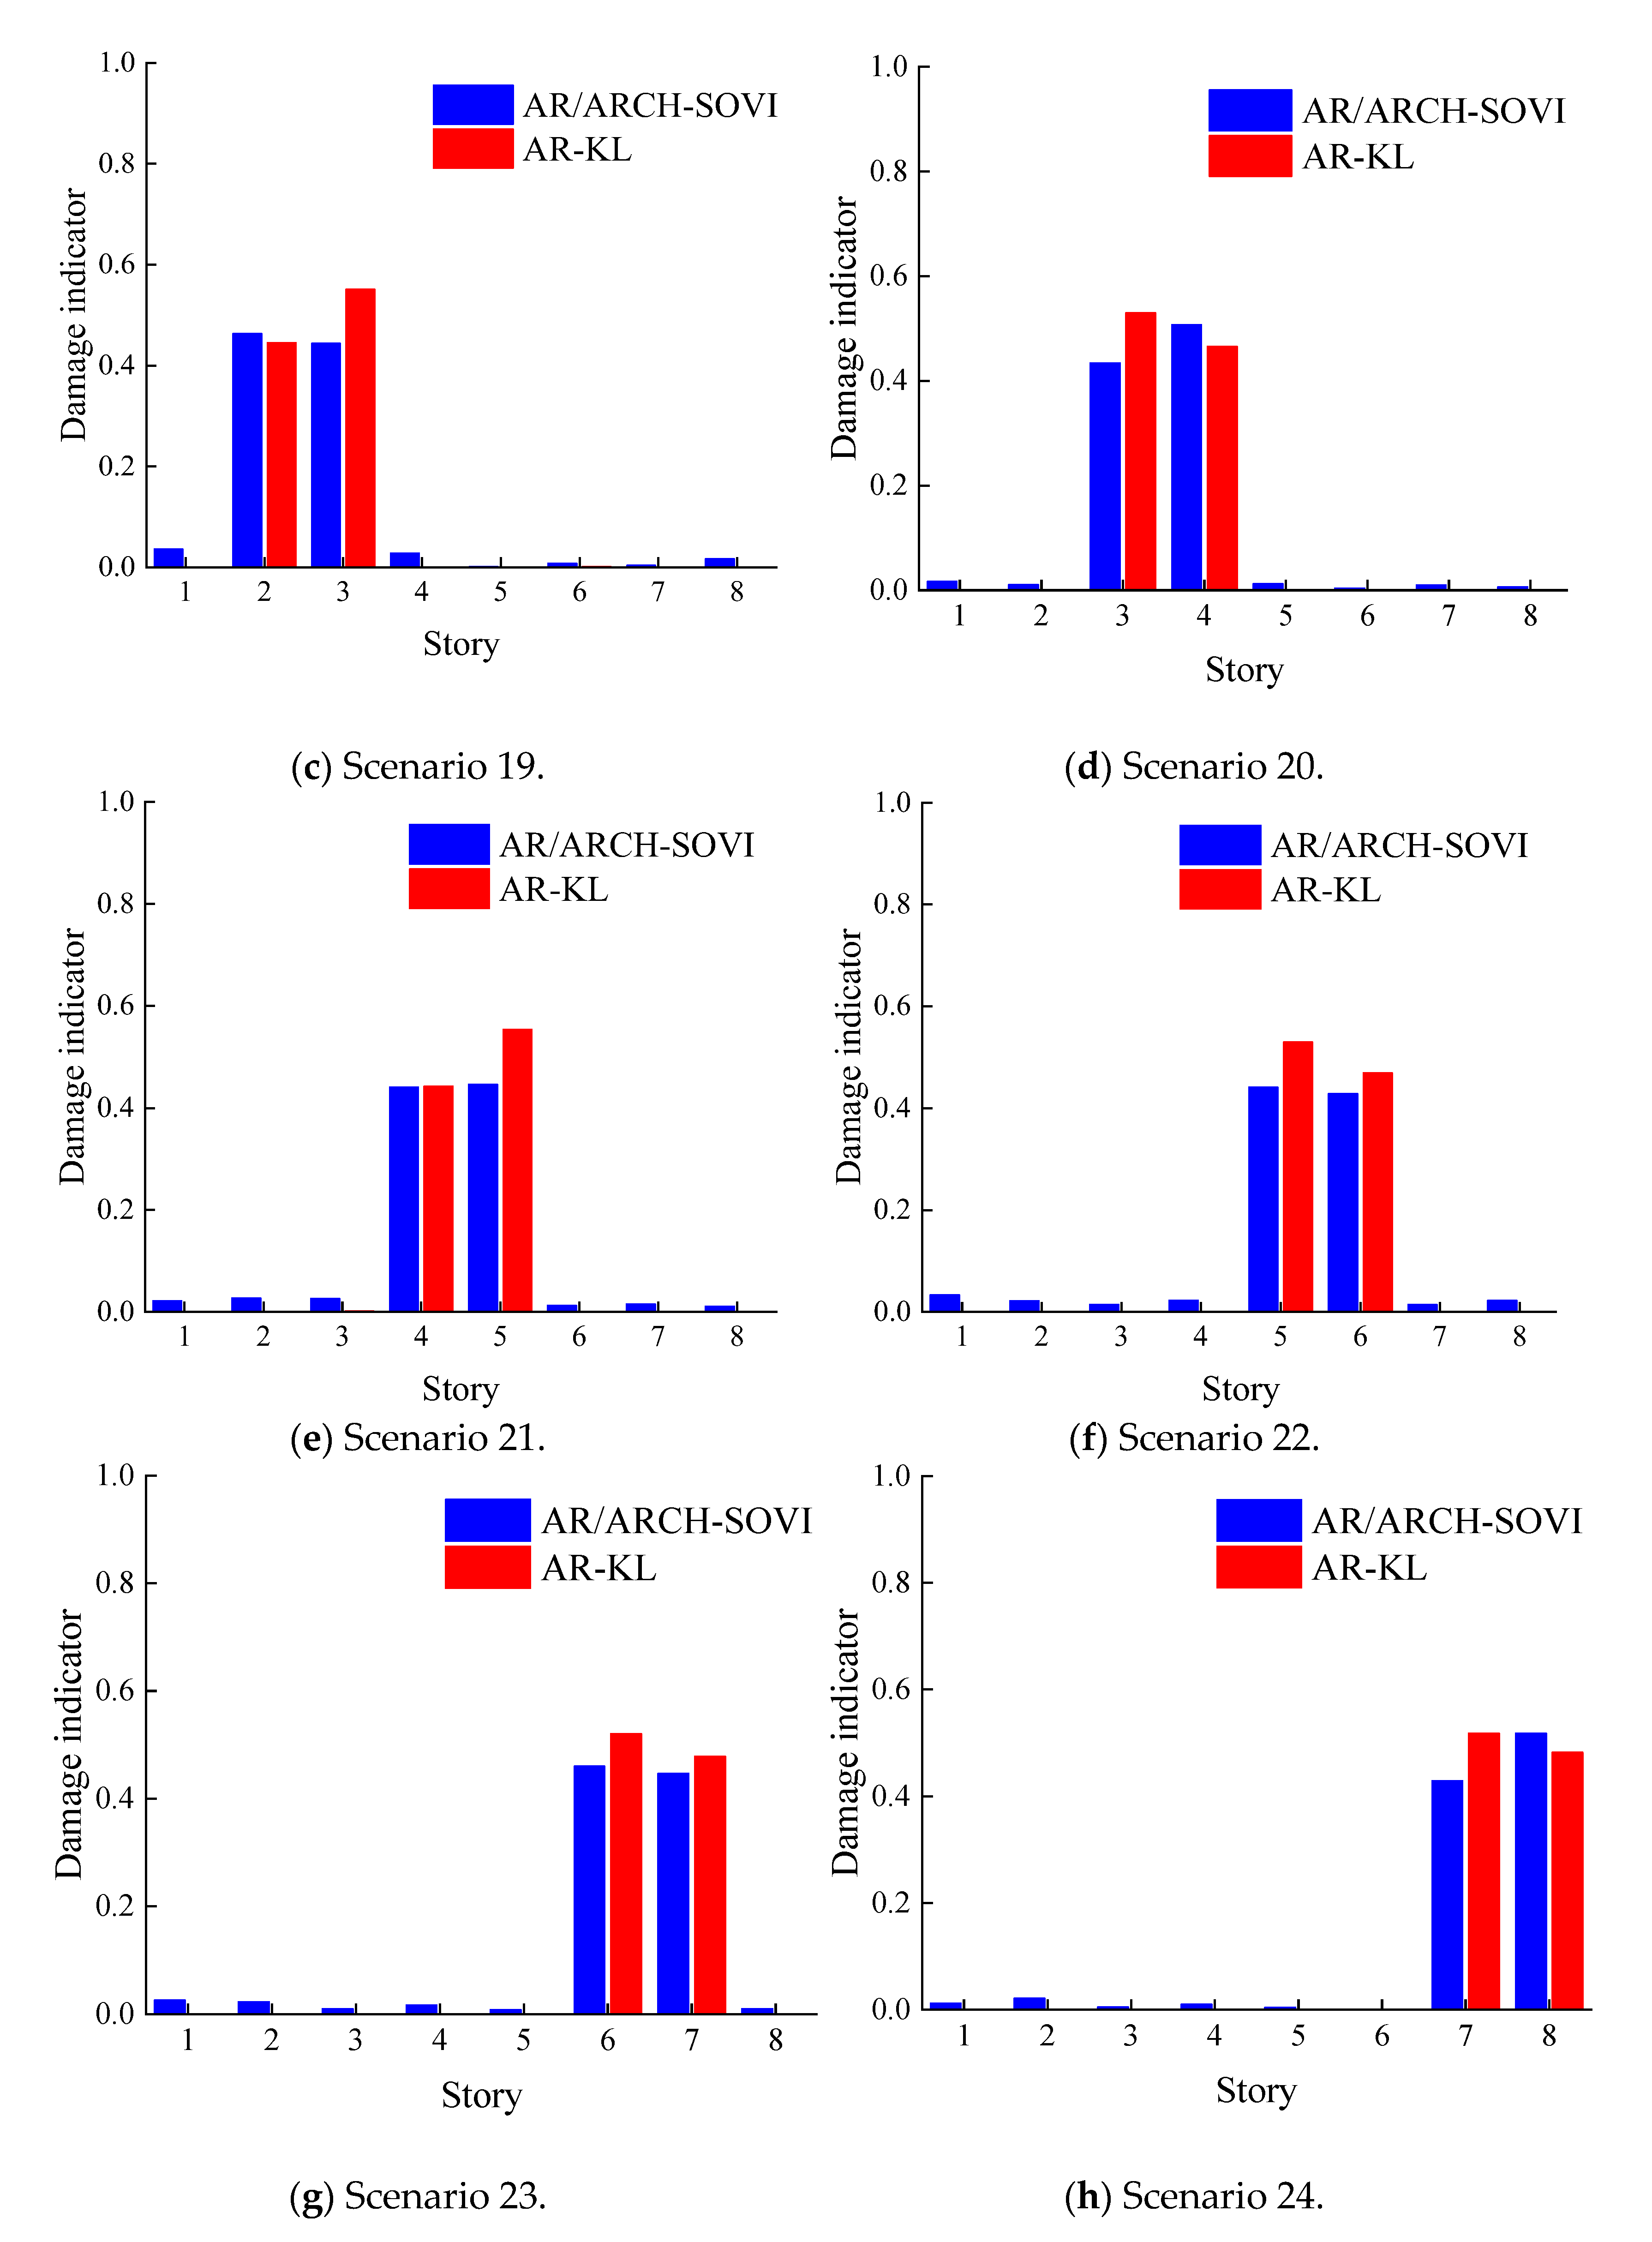
4.3. Nonlinear Damage Identification Results

After the AR model is established, the KL distance can be calculated according to the residuals of the AR model. The method based on SOVI [28] was used for comparison, the AR model order was taken as 30, and the ARCH part order was taken as 3. To compare the two methods, a dimensionless transformation method is suggested as follows:
v i = v i i = 1 n v i
where v i is the dimensionless expression of damage indicator, v i is the original value of the KL distance or the SOVI, and n is the number of damage indicators.
The AR-KL method is an identification method based on the substructure. This means that the KL distance corresponding to the damaged region calculated by the proposed methods should be the largest. For the structural model shown in Figure 2, when there is damage in the nth (n ≤ 8) story, the damage indicator of the nth story and the (n−1)th story is much larger than that of other stories. In particular, when there is damage in the 1st story, since the 0th story corresponds to the model base story, only the 1st story has the largest damage indicator.
The identification results of the scenario 1–8 is shown in Figure 6. Both the AR/ARCH-SOVI method and the AR-KL method can distinguish the damage location for the damage scenario with 10% stiffness reduction. However, the AR-KL method can distinguish the location of structural nonlinear damage more effectively than the AR/ARCH-SOVI method. The damage indicator of the damaged floor channel obtained by the AR-KL method was larger than other undamaged stories. Further, this method is beneficial in distinguishing the damage location quickly and accurately. In addition, when the 3rd story was damaged (Figure 6c), it was hard to accurately find the structural damage location using the calculation results from the AR/ARCH-SOVI method, but the damage location could be accurately determined using the identification results of the AR-KL method. Thus, the AR-KL method can distinguish structural damage with small damage levels more effectively than the AR/ARCH-SOVI method.
The identification results of scenarios 9–16 are shown in Figure 7. The damage location can be determined using the identification results of both methods. It should be noted that the indicator of the undamaged story obtained by the AR-KL method was lower than that of the AR/ARCH-SOVI method. This shows that the AR-KL method can identify structural damage more effectively than AR/ARCH-SOVI method with high damage level.
Damage scenarios 17–24 considered a 30% damage level under the excitation of 100 kN white noise amplitude, and the identification results are shown in Figure 8. It can be noted that the calculation results were similar to those of damage scenarios 9–17, that is, the identification results of both methods can distinguish the structural damage source location. Further, the indicator of the undamaged story obtained by the AR-KL method was less than that of the AR/ARCH-SOVI method. It is worth noting that compared with damage scenarios 9–17, the identification results of AR/ARCH-SOVI were better, while the identification results of the AR-KL method were almost unchanged. This shows that the AR-KL method is more robust under external excitations with different amplitudes.
Both the AR/ARCH-SOVI method and the AR-KL method can distinguish the bilinear stiffness damage of the eight-story shear model. Further, the AR-KL method can distinguish the damage in all levels damage effectively. The indicator of the damaged story obtained by the AR-KL method was larger than those of the undamaged stories. This shows that the AR-KL method is beneficial to detect and locate the structural nonlinear damage source accurately. In addition, the damage identification results of the AR-KL method hardly changed under external excitations with different amplitudes, which indicates that the AR-KL method is more robust than the AR/ARCH-SOVI method. Further, it is worth noting that the noise in actual engineering is generally 5% to 10%, and it is hard to distinguish damage caused by these low levels. In this paper, 5% of noise effects were considered in the eight-story shear model, and the minimum damage level of the bilinear stiffness damage that can be identified is 10%.

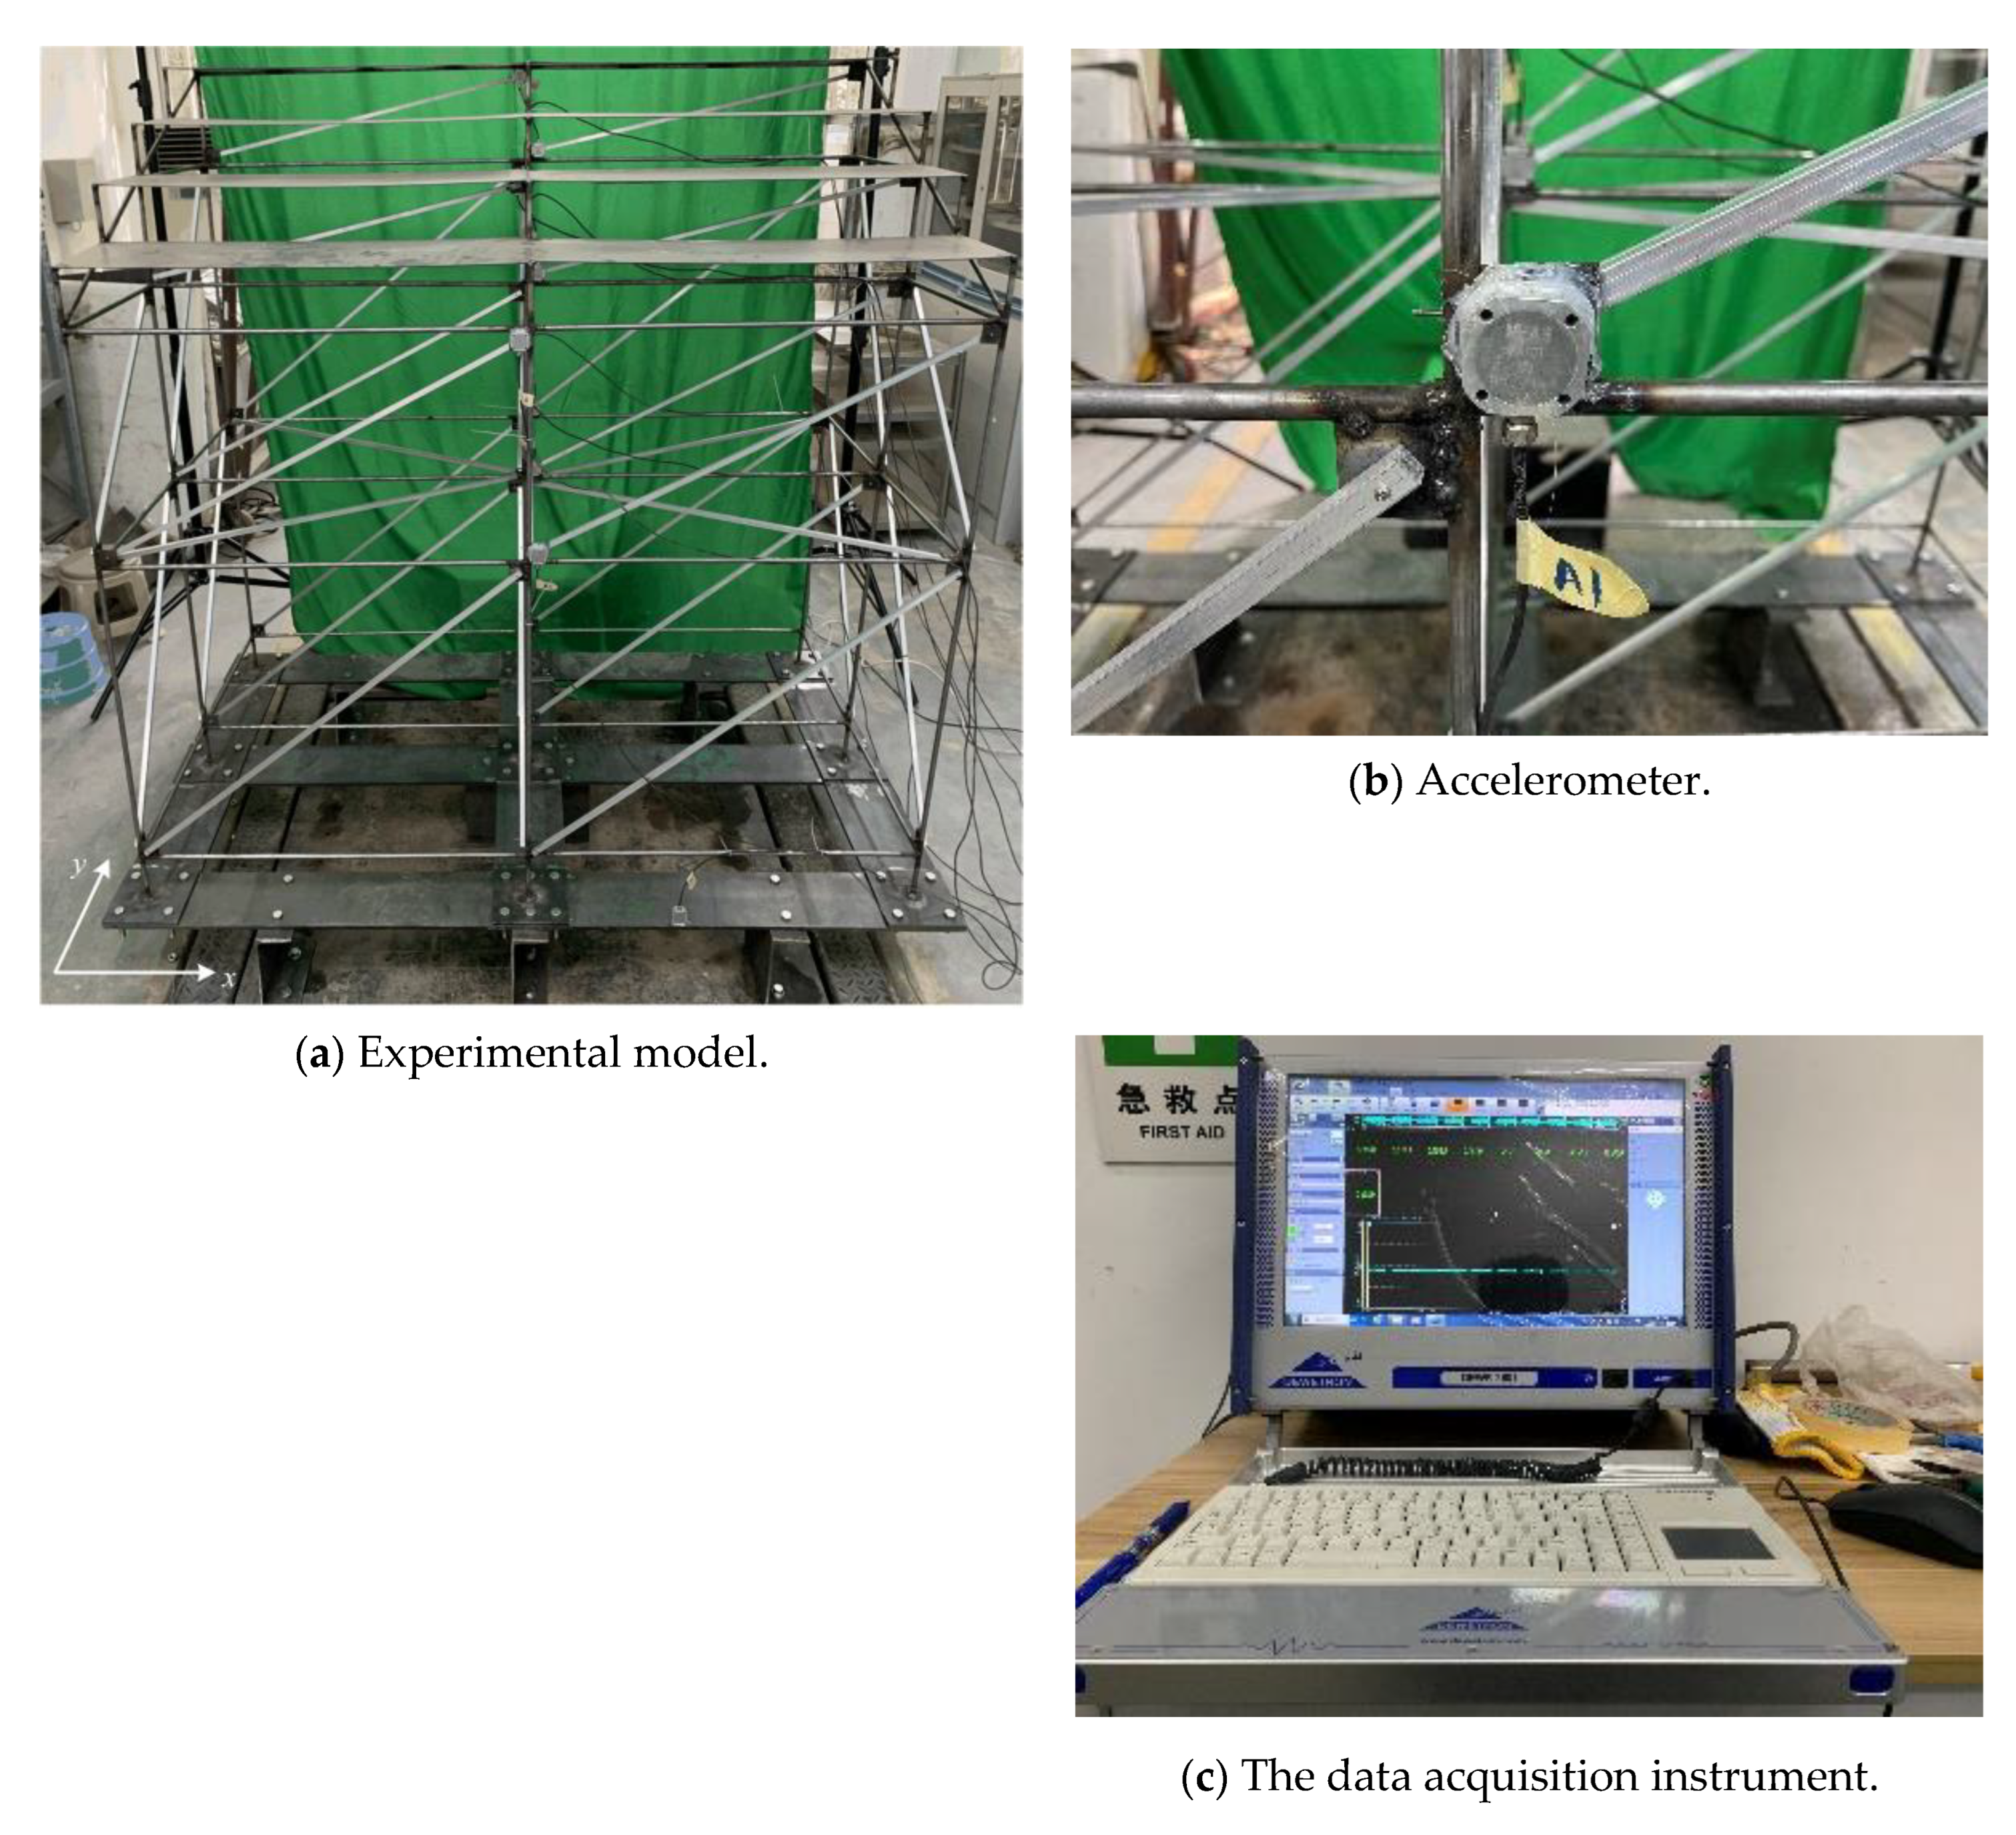
5. Experimental Study on the Stand Structure Model

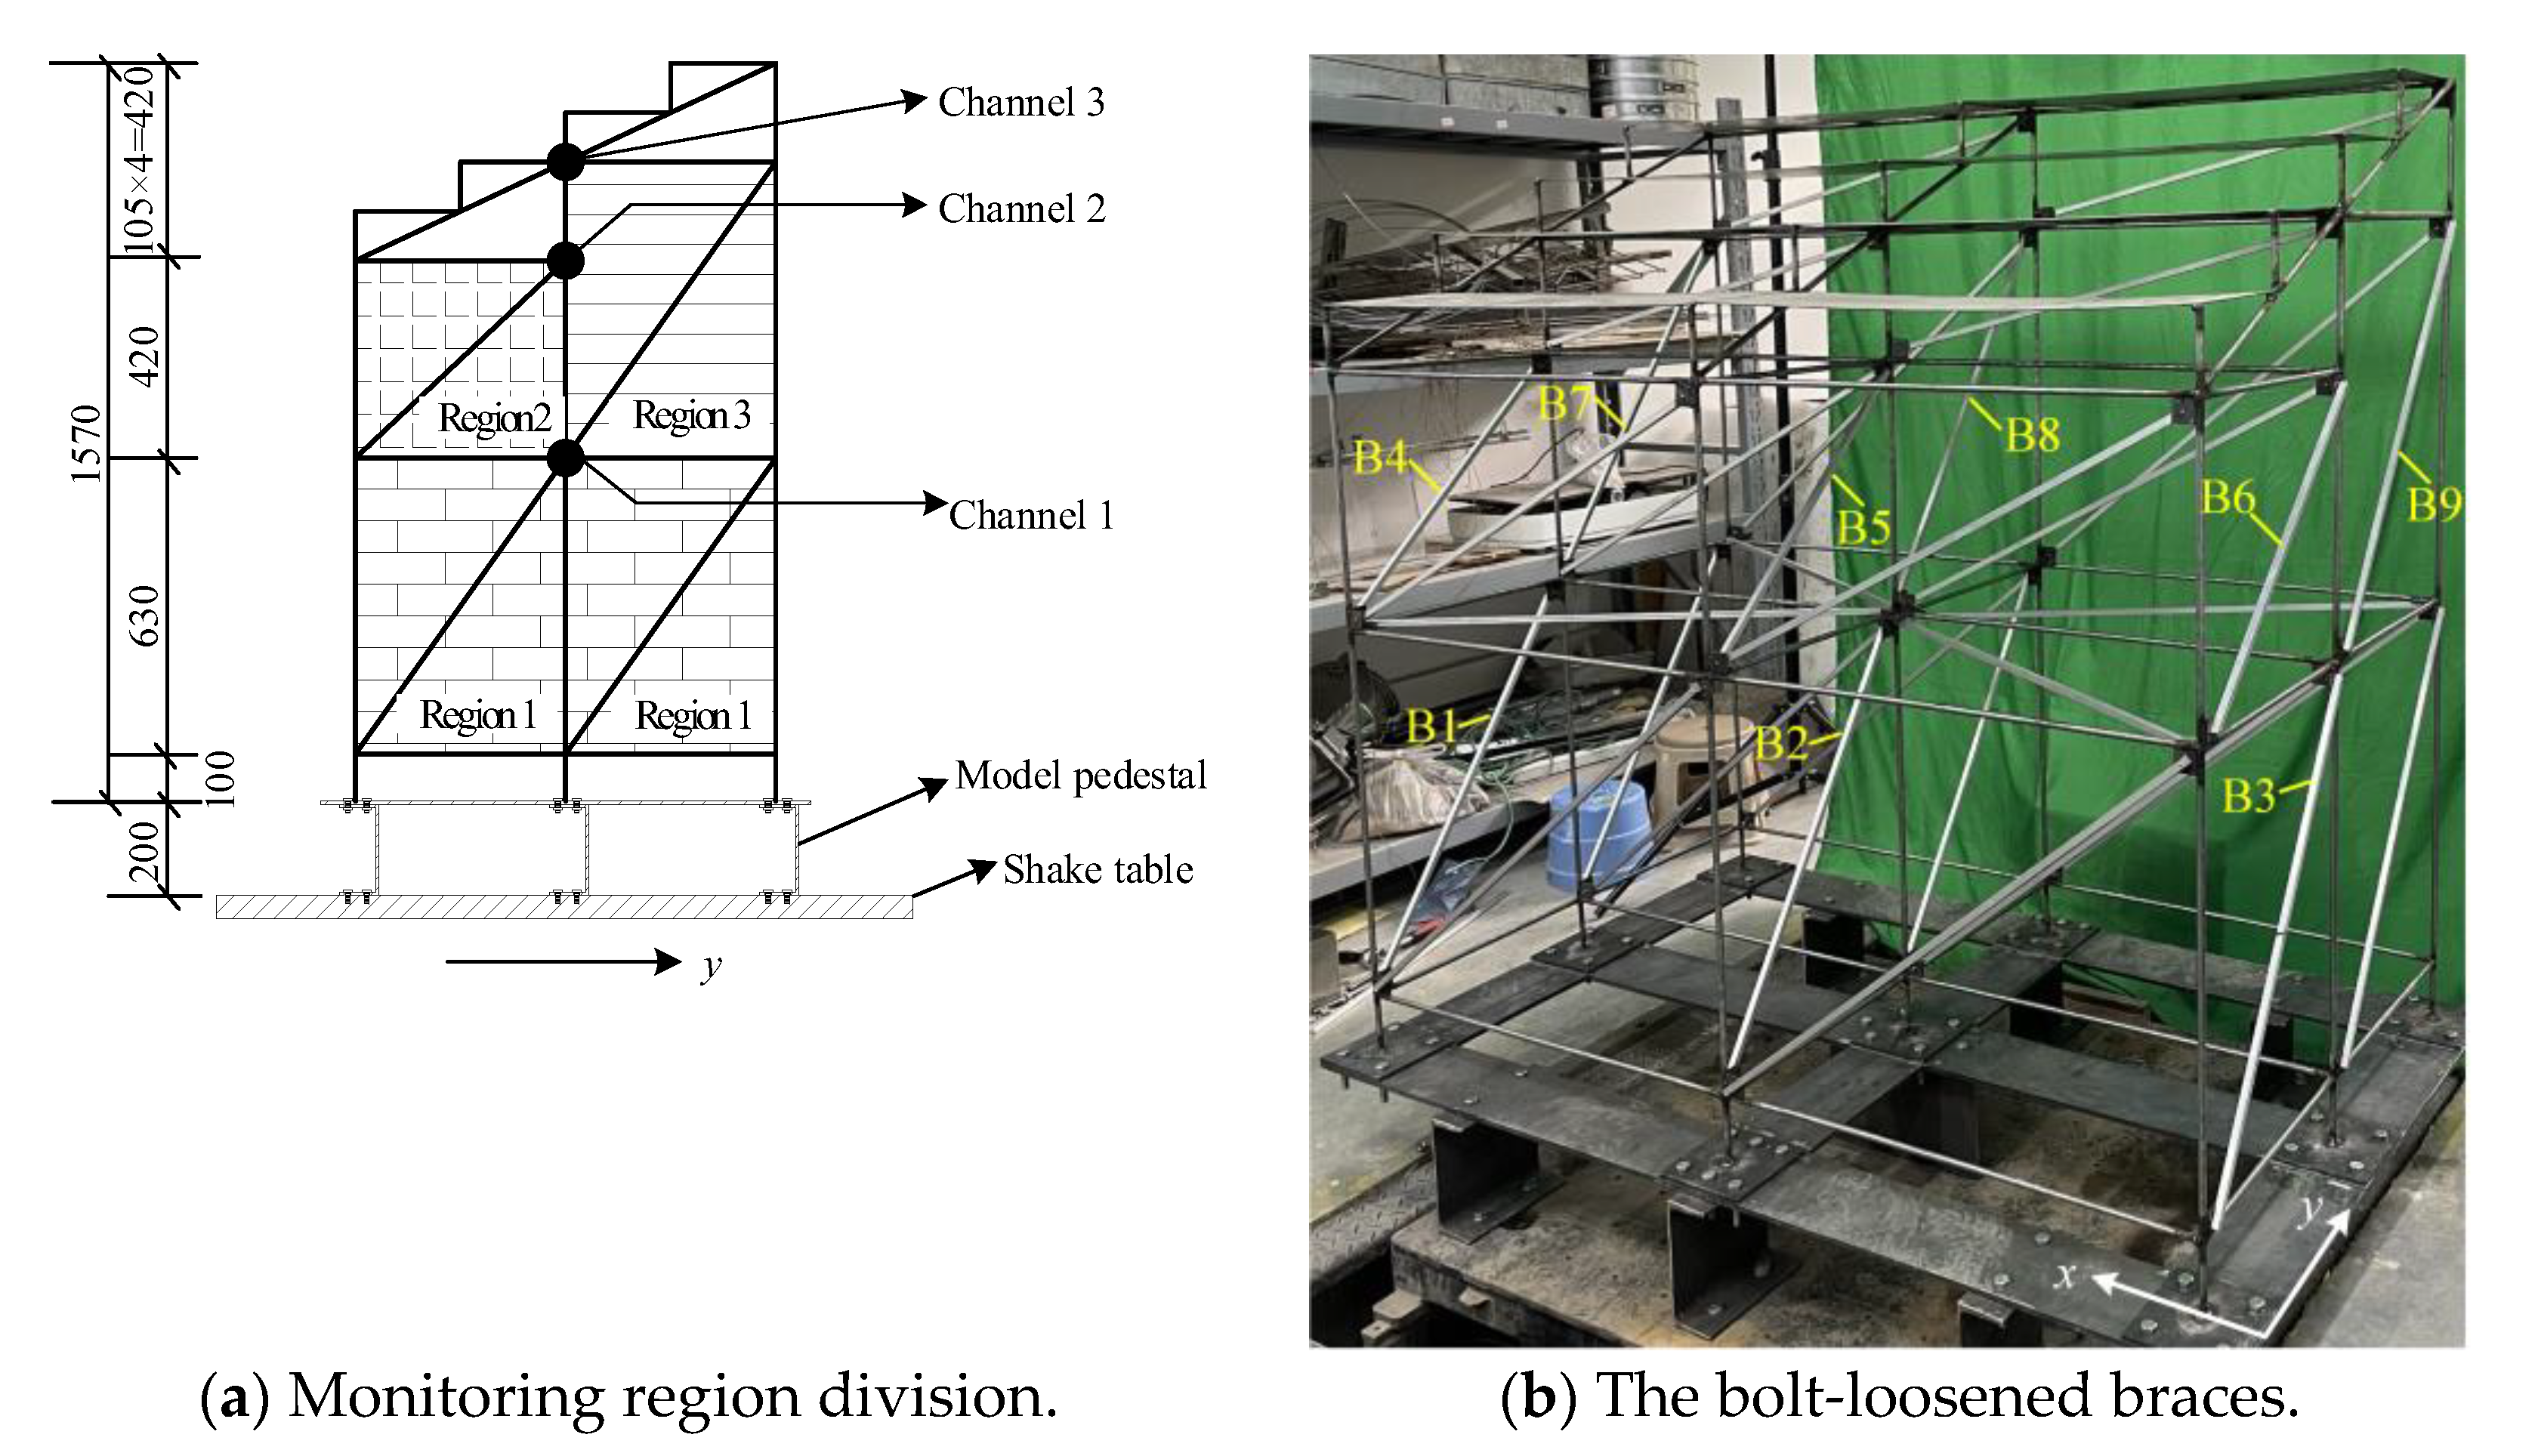
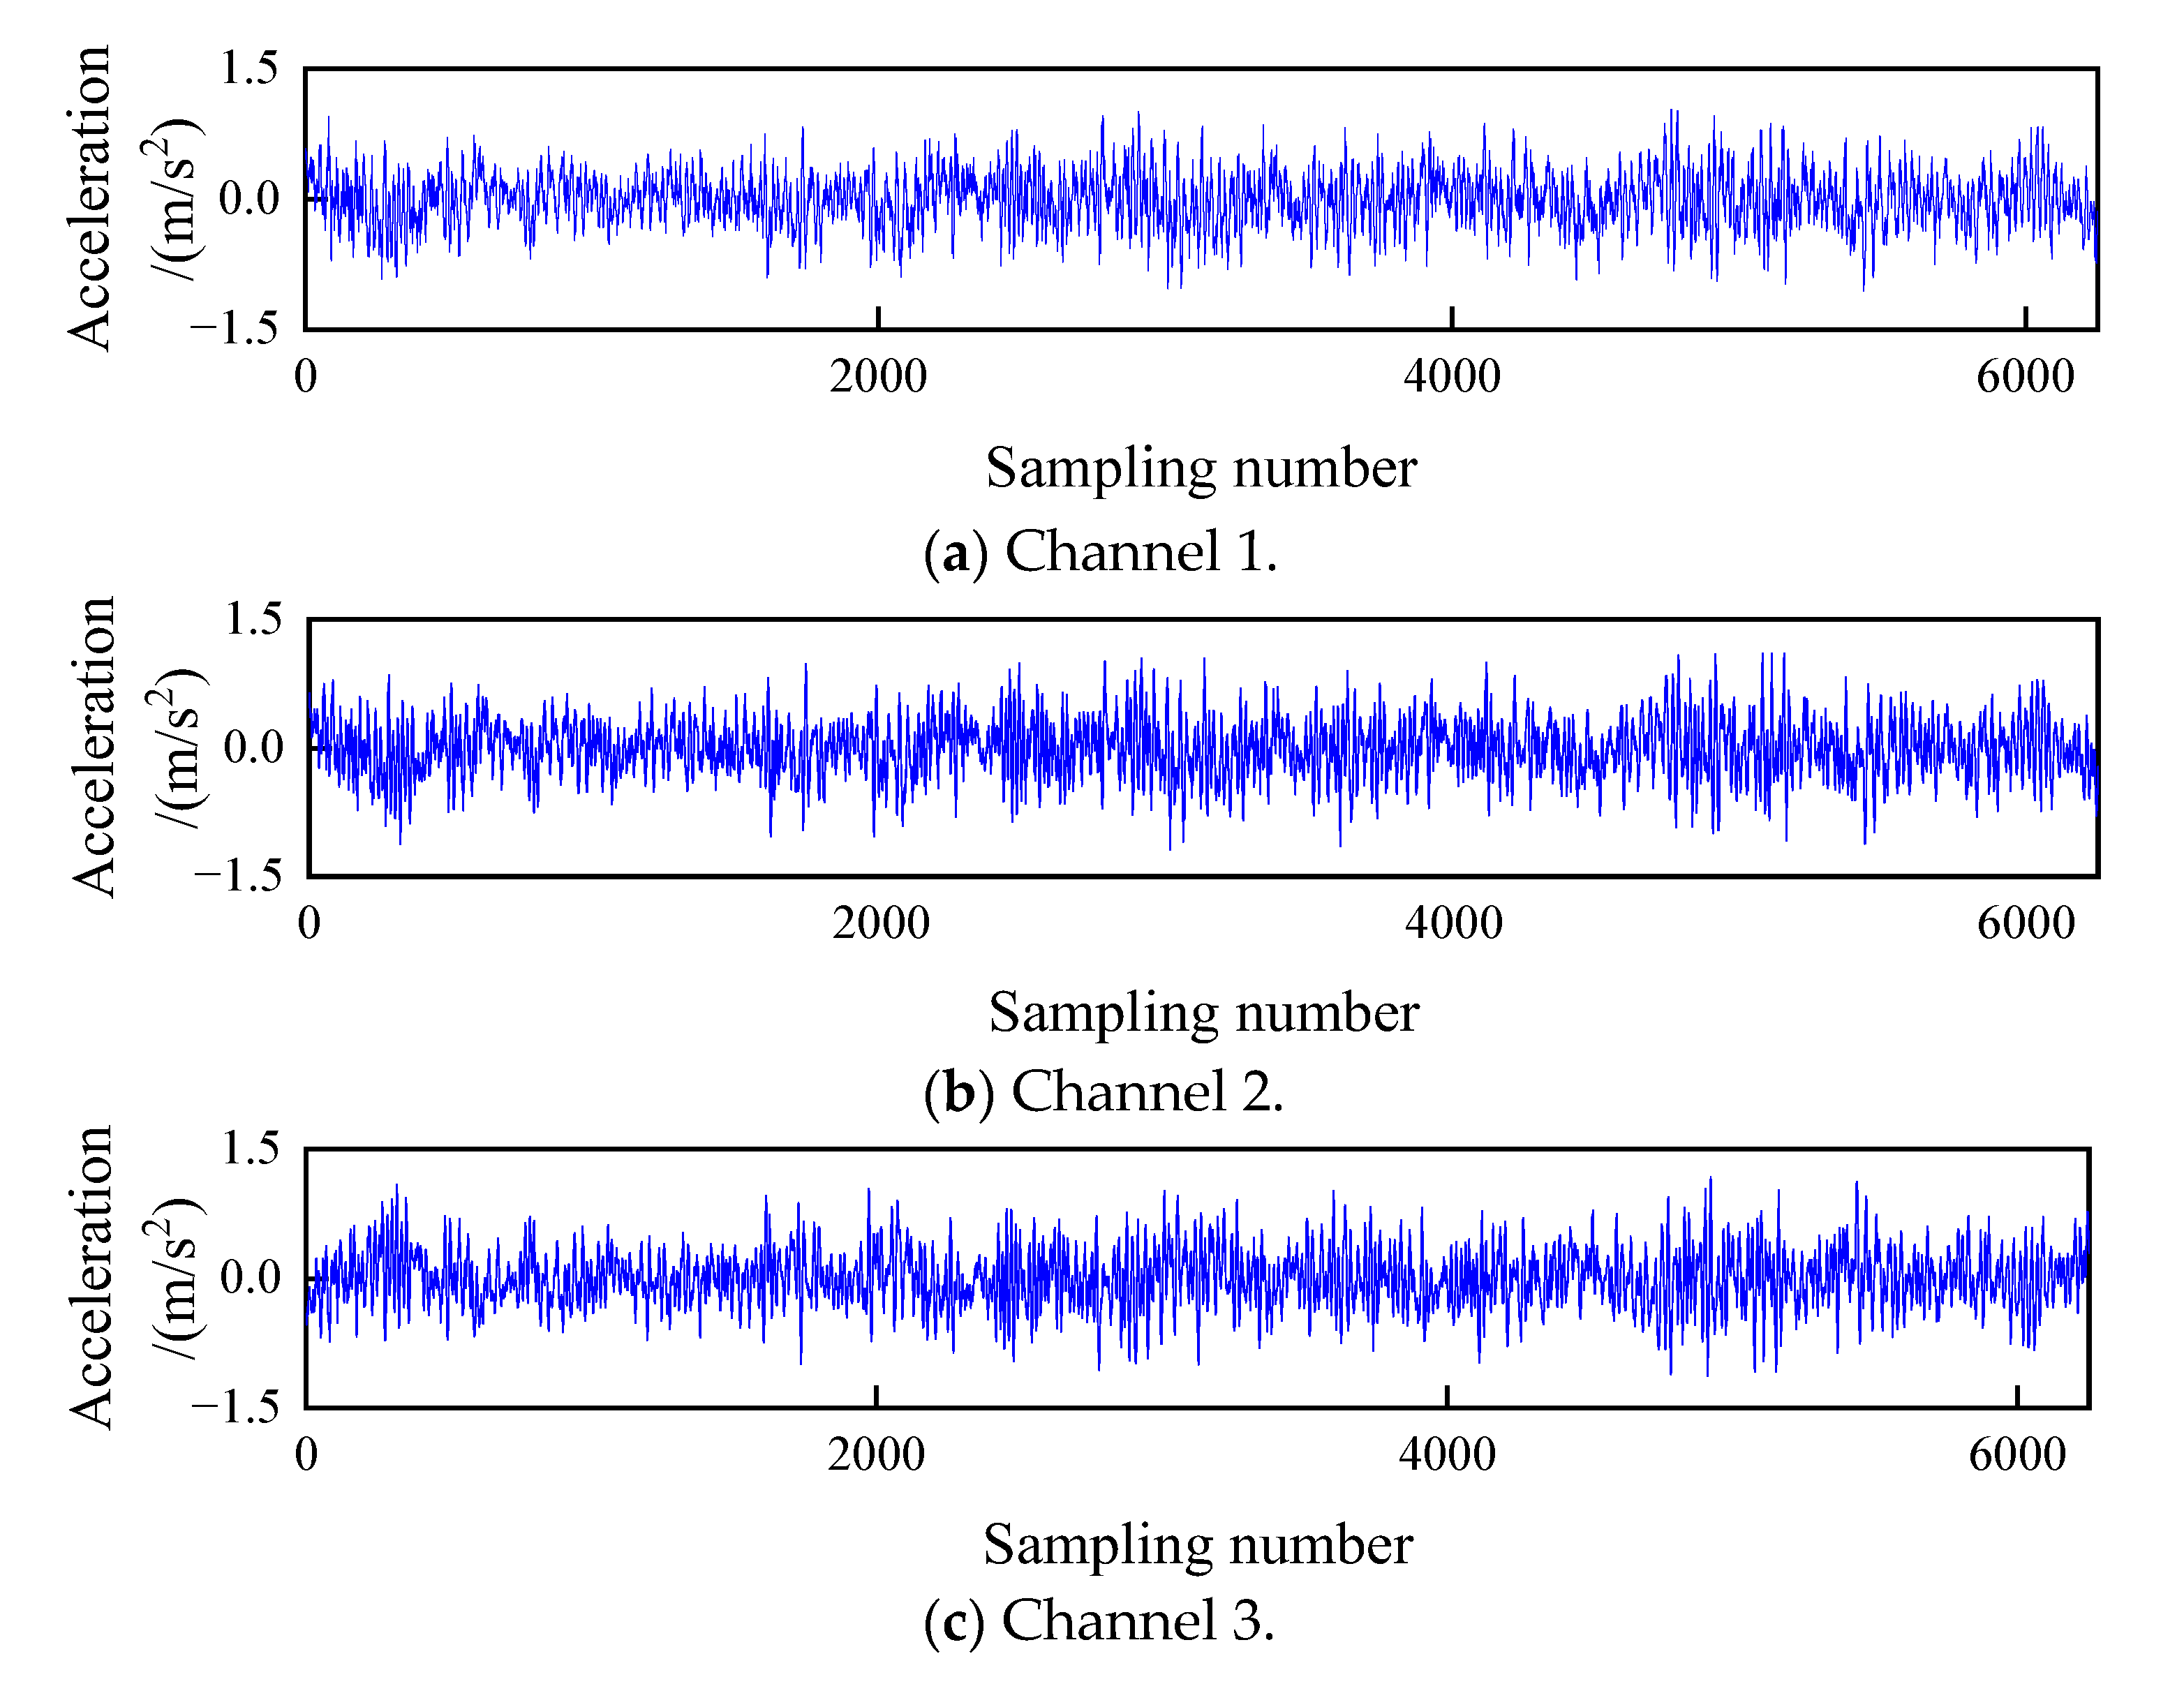
5.1. Introduction of the Stand Structure Model Experiment

Our experimental model was manufactured and tested in Chongqing University. The experiment was loaded by the shake table in the geotechnical laboratory of Chongqing University. The size of shake table is 1.2   m × 1.2   m , with the maximum payload of 1000 kg. The stand structure model experimental data are shown in Figure 9a. The experimental model has two spans along the x and y directions, and the model plane size is 1.53 m × 0.90 m ( x × y ). The height of the model is 1.57 m (Figure 10a). Since the plane size of the model is larger than the size of the shake table, a 200 mm high model rigid pedestal (Figure 9a) was designed to raise the experimental model. The main body of the experimental model was welded by steel pipe ( ϕ 10   mm × 2   mm ). The vertical and horizontal braces of the model were aluminum squares ( 10   mm × 10   mm ), and the braces were connected to the main body of the model using bolts.
A random excitation in y-direction was applied to the bottom of the model through the shake table, the excitation amplitude for every damage scenario was 0.1 g, and the excitation time was 30 s. As shown in Figure 10a, the experimental model was divided into three monitoring regions. Three FA101–5 g accelerometers (Figure 9b) were installed in the middle span of the model to measure the acceleration response of each region, and region 1–region 3 correspond to acquisition channel 1–channel 3 (Figure 10a). The acceleration response of the model was acquired by the data acquisition instrument shown in Figure 9c, and the acquisition frequency was 250 Hz.
A stand structure is usually composed of multiple components connected by bolts. During the operation of the structure, the bolts may loosen due to ambient vibration. The loosening bolts have an adverse impact on structural safety. Therefore, it is necessary to carry out damage monitoring of bolt loosening on a stand structure. In this paper, the bolt-looseness damage of y-direction braces was simulated, and the interfacial contact between loosened bolts and bolt holes resulted in nonlinear vibrational responses [31]. The damage scenarios of the stand structure model are shown as Table 2. The bolt-loosened braces numbers are shown in Figure 10b. Two different levels of nonlinear damage were considered for each monitoring region, i.e., a single brace or three braces had bolt-looseness nonlinear damage. When there was a single brace in the region with loosened bolts, the bolts at both ends of the middle span brace in the corresponding region were loosened. When there were three braces in the region with loosened bolts, the bolts at both ends of all the braces in the corresponding region were loosened.

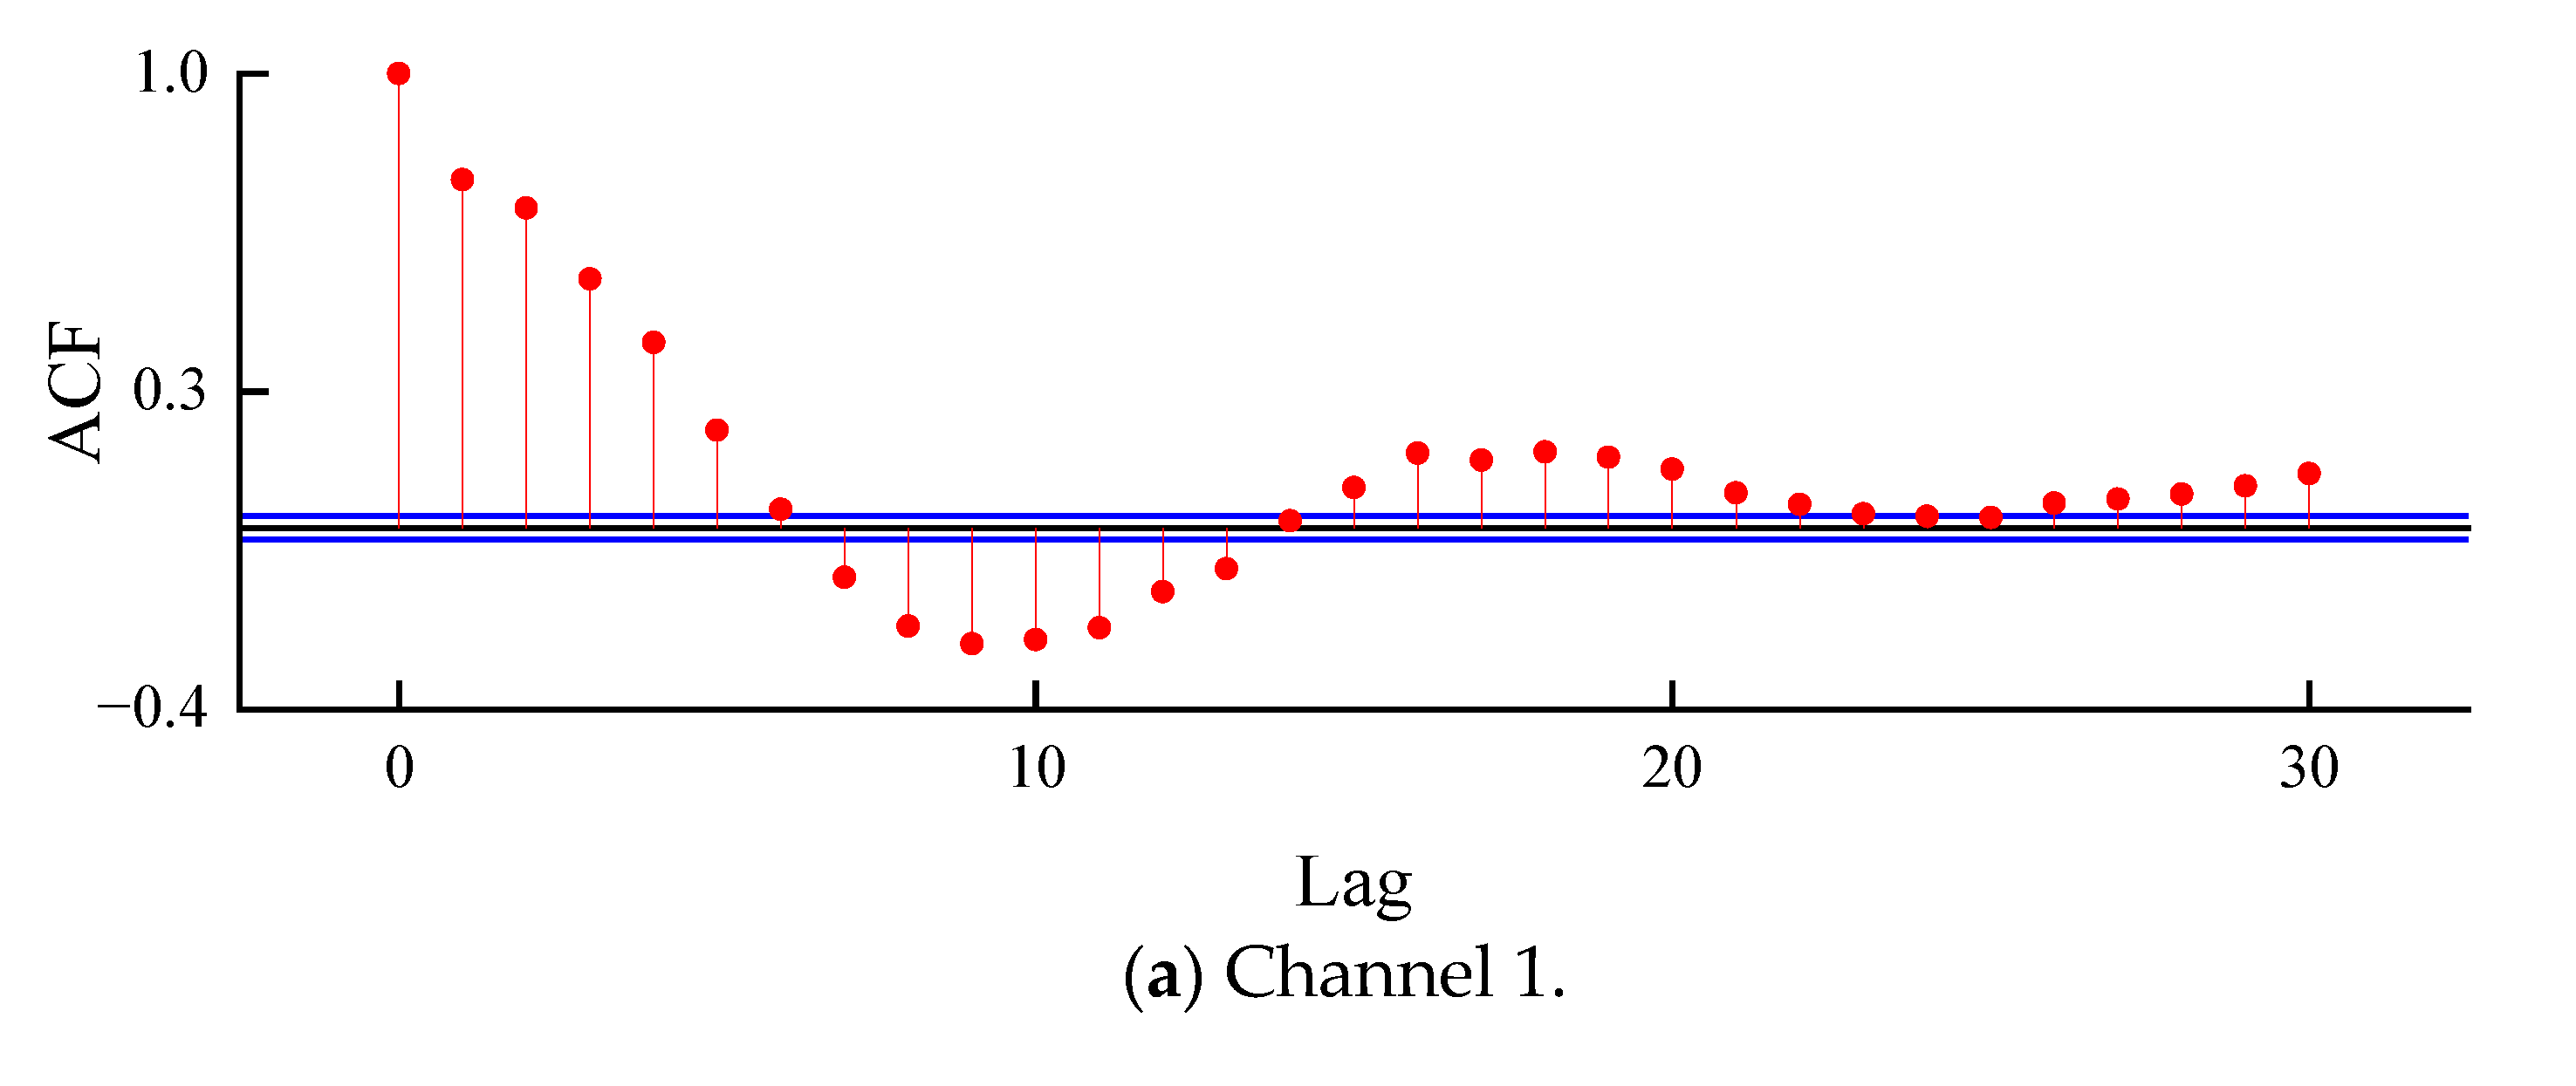
5.2. Modeling Analysis of AR Model

The acceleration acquisition frequency was 250 Hz, and each acquisition time was 30 s, that is, 7500 data points were collected each time. To avoid the effect of the shake impact, the first and last 625 data points were deleted. We collected the baseline acceleration time series data when the stand structure was undamaged, and the structural acceleration curve of channel 1–3 under baseline state is shown as Figure 11.
The ACF curve of each channel under the baseline state is shown in Figure 12. The AR model order range was initially selected to be 15–30 according to the ACF curve, and finally the AR model order was selected to be 15 according to the AIC criterion.

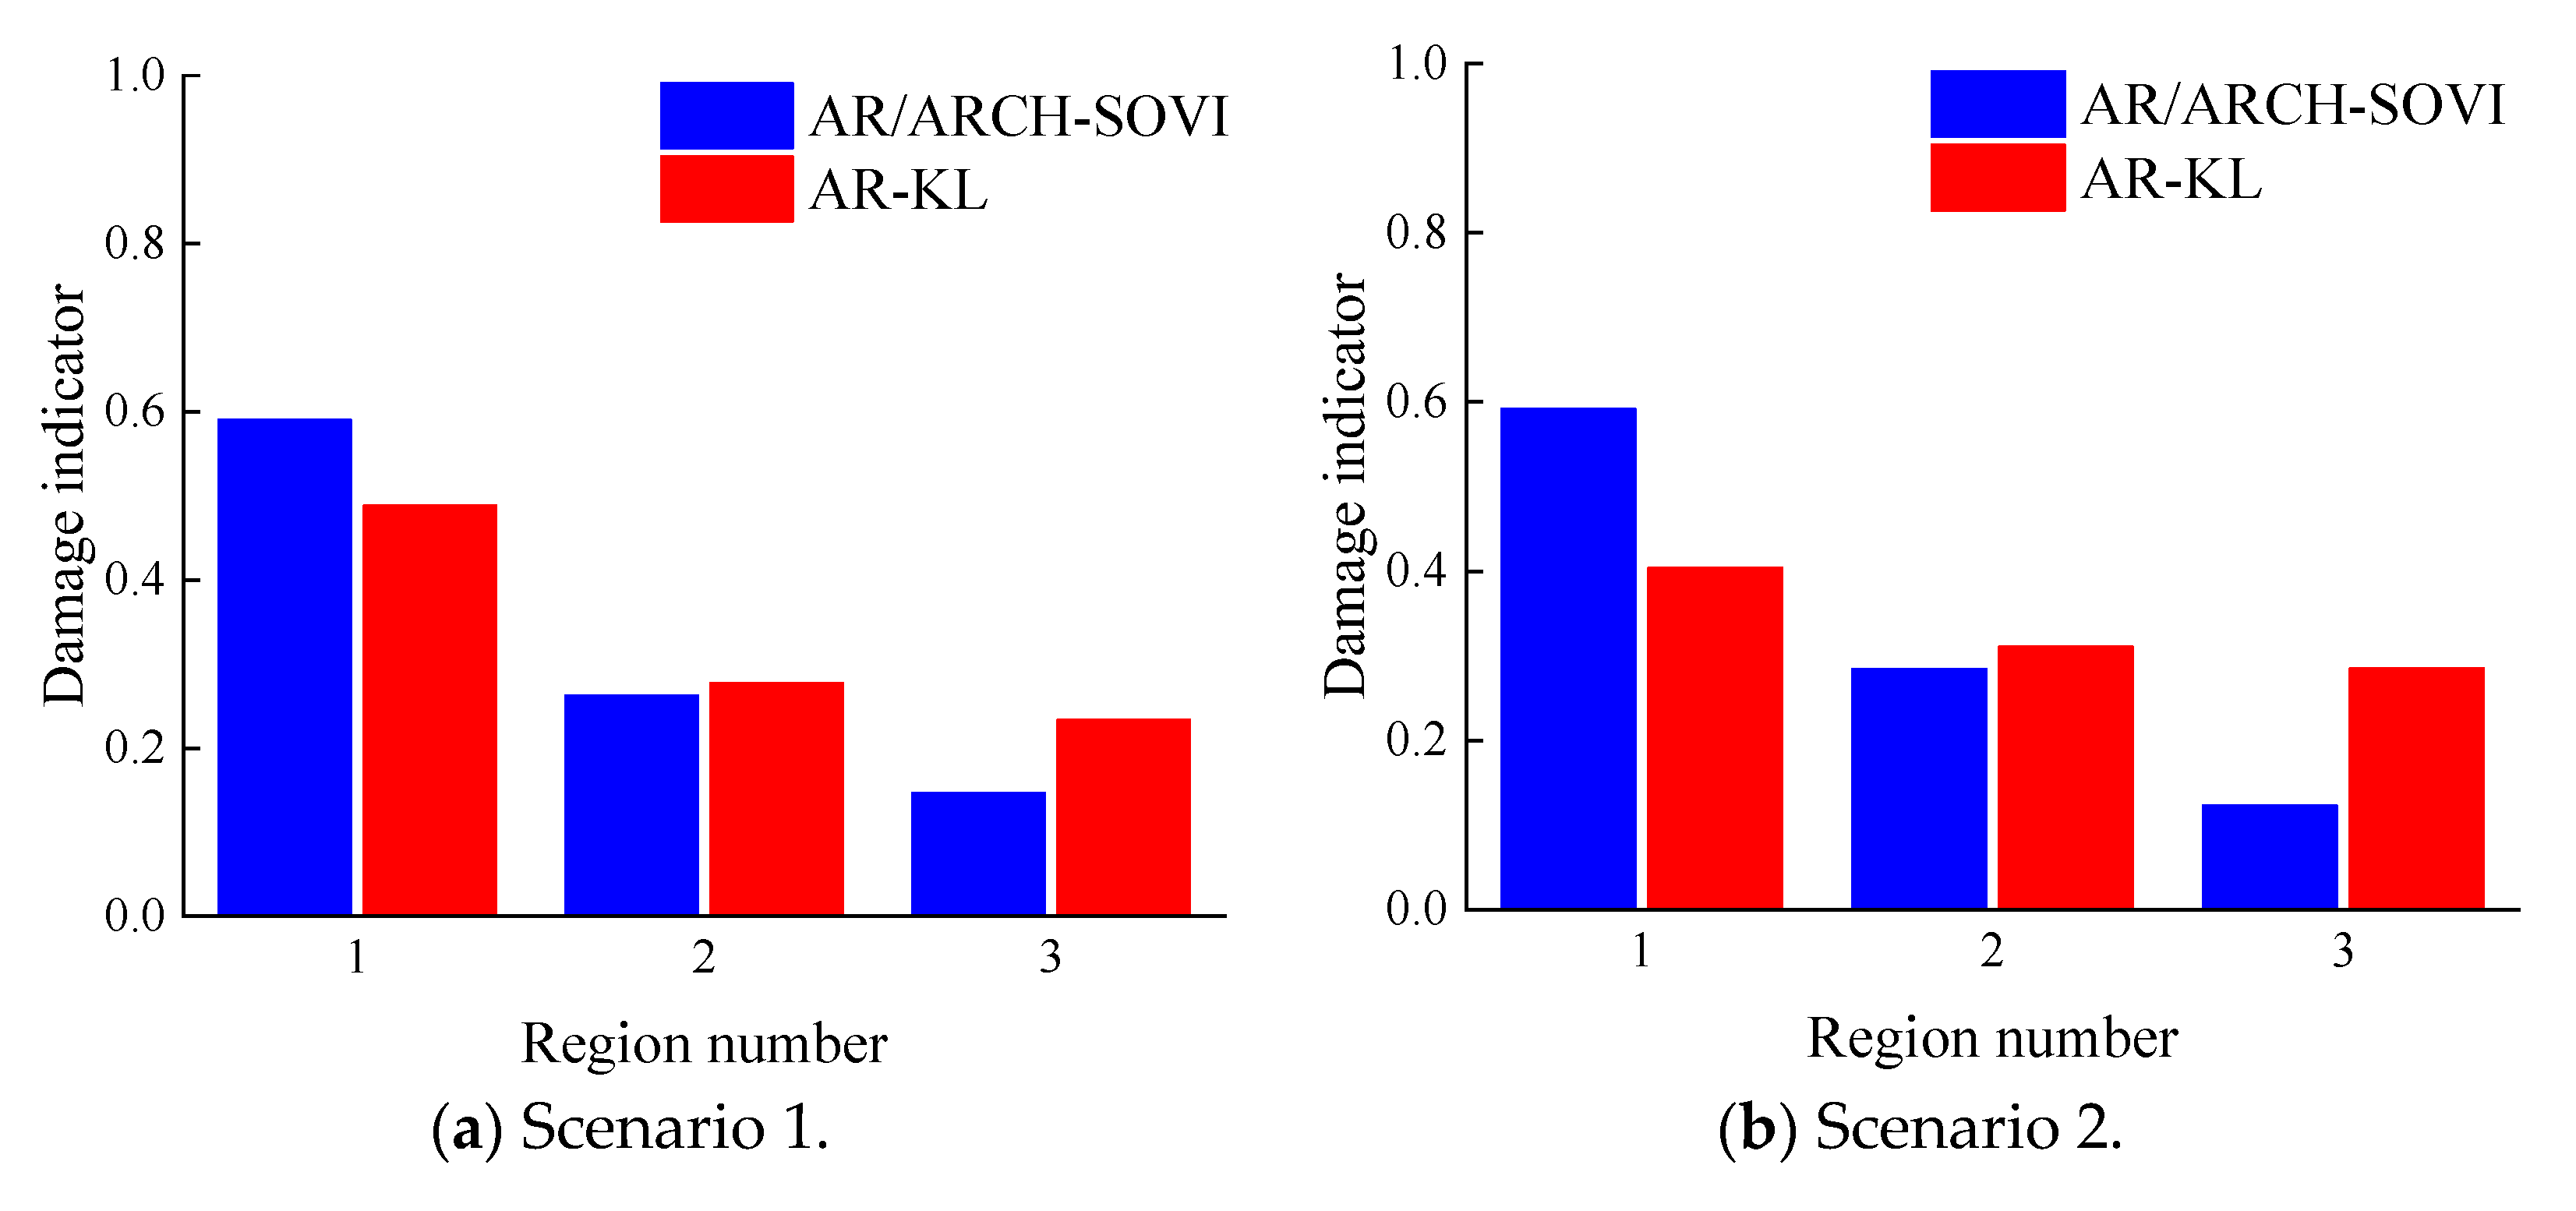
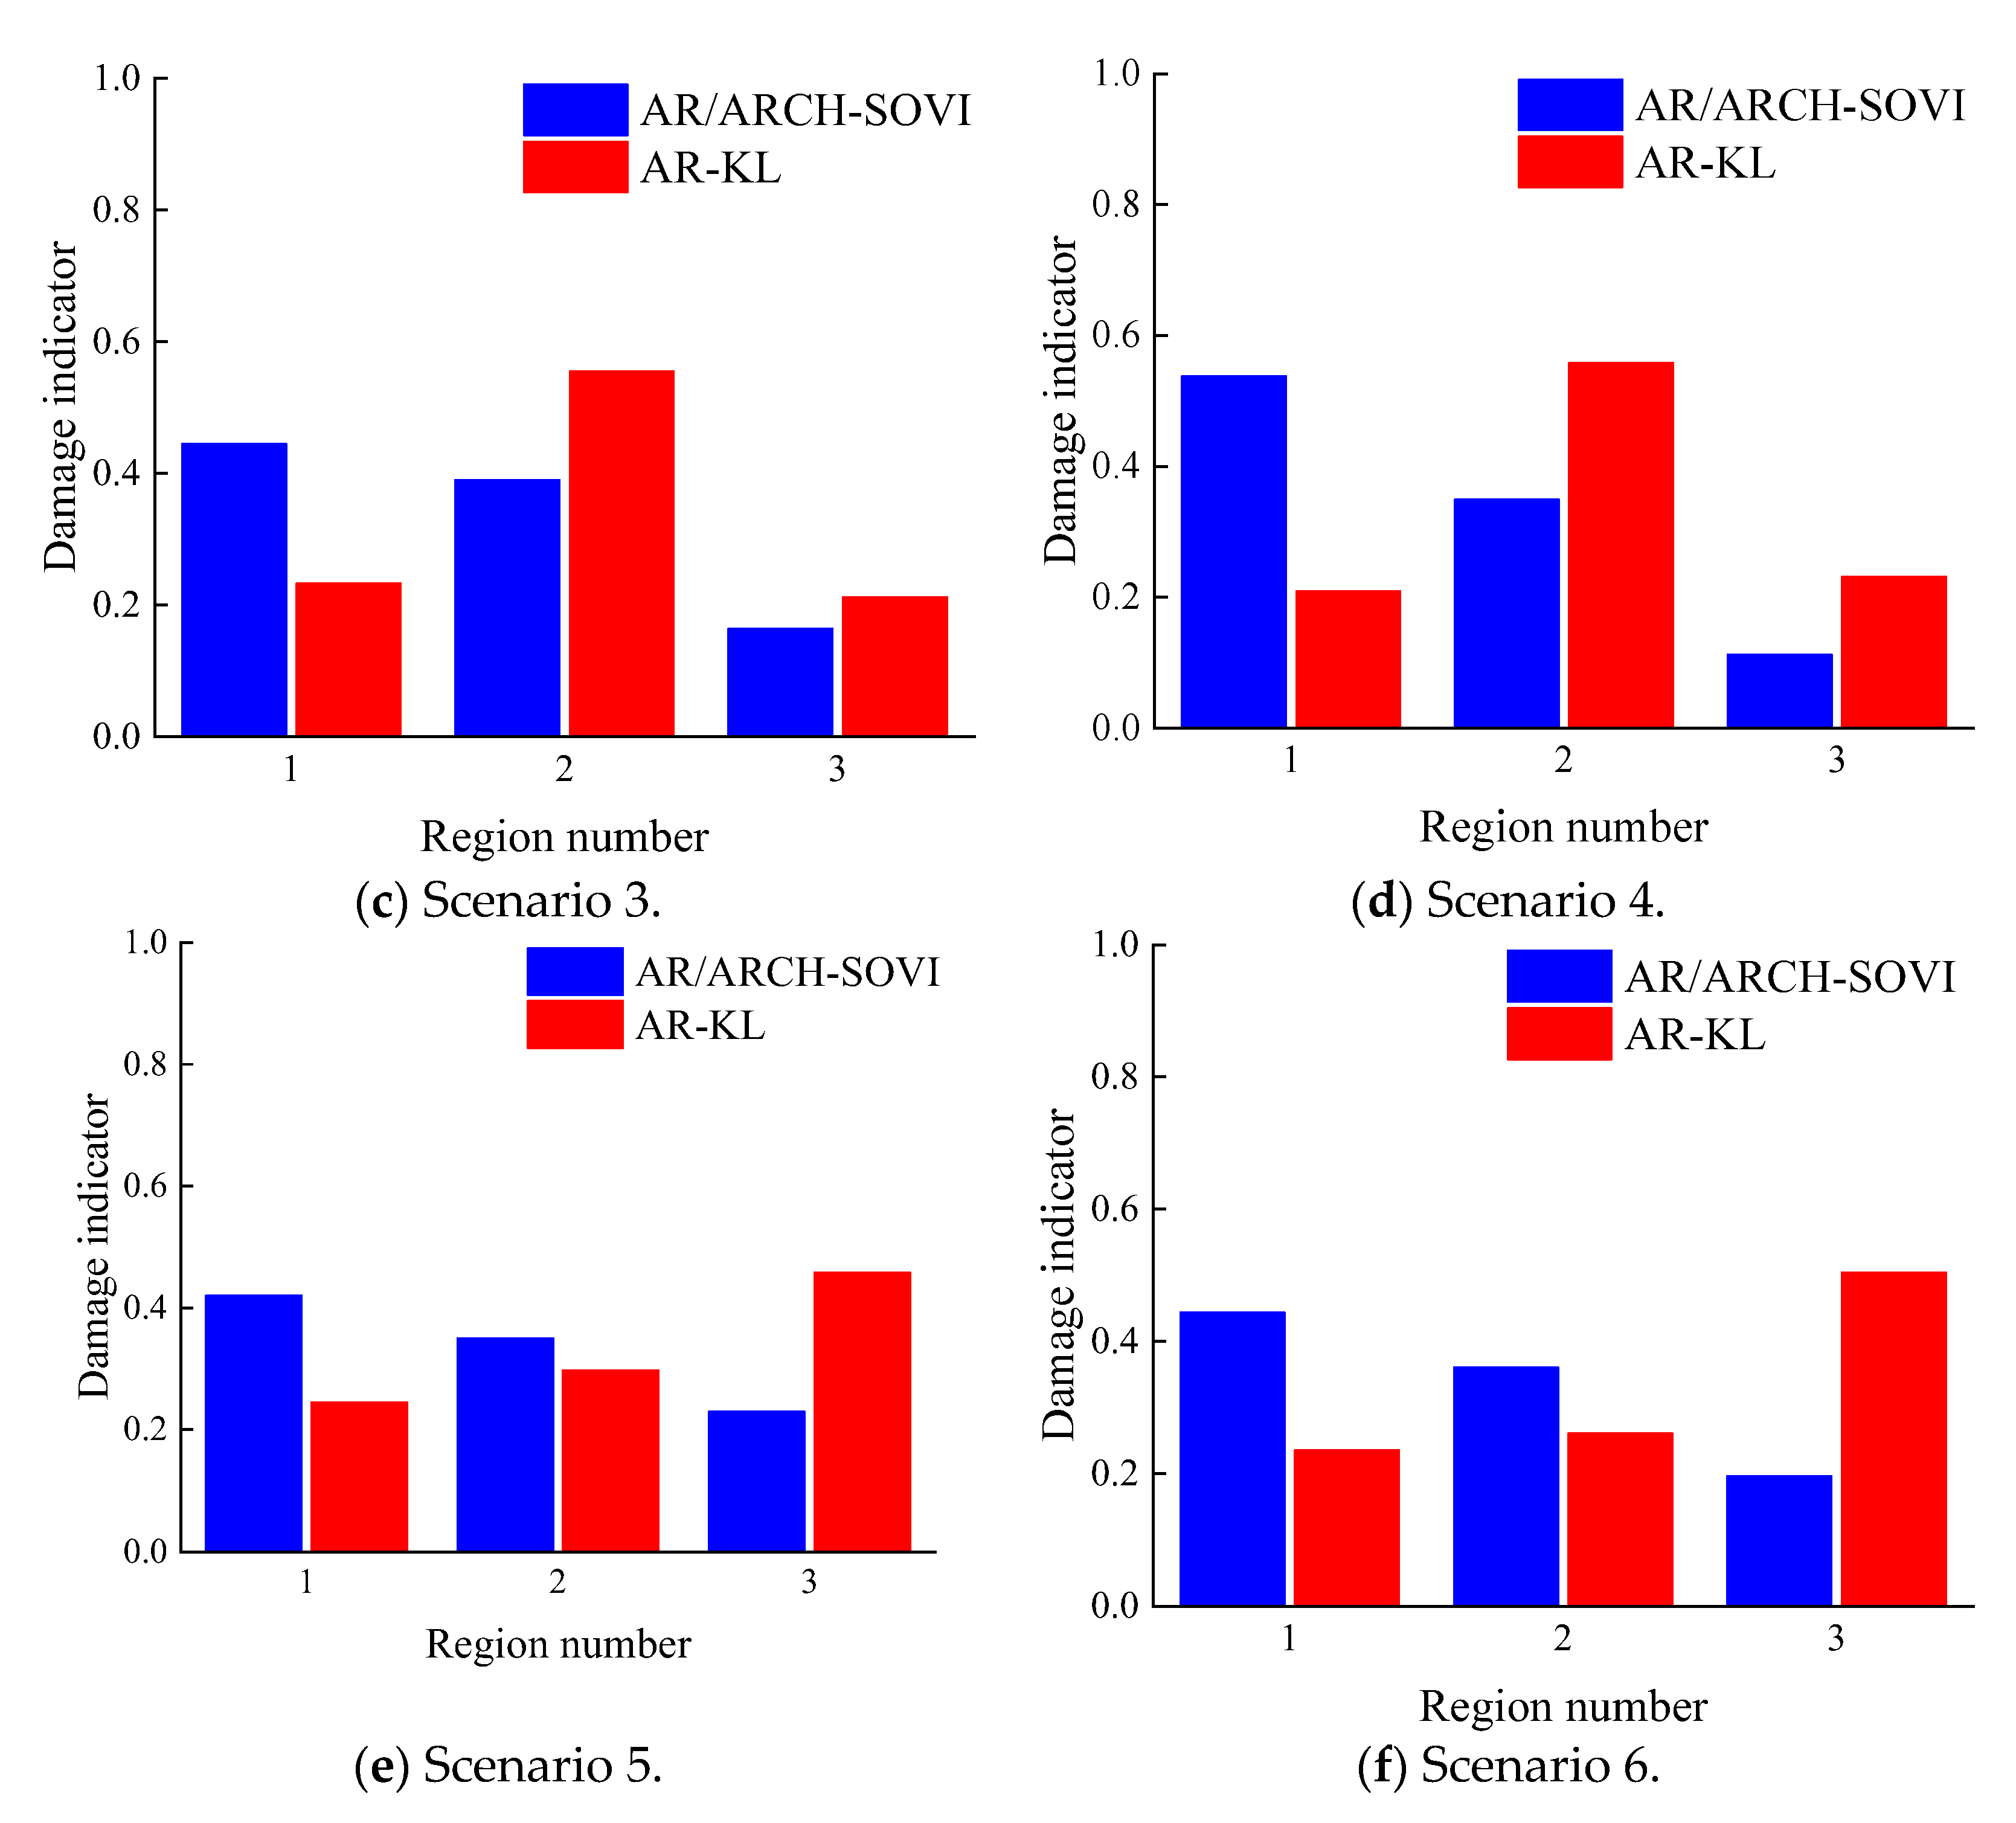
5.3. Damage Identification Results of the Stand Structure Model Experiment

The AR/ARCH-SOVI method [25] was used for comparison in this experiment. The order of the AR model was taken as 30, and the order of the ARCH part was taken as 6. Since The AR-KL method is based on the substructure, according to the accelerometer setup shown in Figure 10a, when an experimental model region was damaged, the KL distance of the damaged region calculated by proposed method should be the largest.
The identification results of the stand model experiment are shown in Figure 13. The damage indicators of region 1 calculated by the SOVI method were all the largest, that is, it was hard to judge the damage location using the calculation results of this method. However, the damage indicator of the damaged region calculated by the AR-KL method was the largest, that is, the AR-KL method could judge the structural damage location accurately. This shows that the AR-KL method is more suitable for complex structural damage identification than the AR/ARCH-SOVI method.
The stand structure model is a multi-story and multi-span complex structure. Based on its structural characteristics, it was divided into three monitoring regions (Figure 10a). From the identification results of the stand model experiment, it can be seen that the AR/ARCH-SOVI method was unable to accurately identify the damage source location due to the complexity of the structural response. However, the AR-KL method can distinguish the damage scenario in all regions. Therefore, the AR-KL method can effectively identify nonlinear damage in a complex stand structure. In addition, when using the proposed method for damage localization, the minimum required number of acceleration sensors is related to the division of monitoring substructures, and each monitoring substructure needs at least one acceleration sensor to collect its acceleration data.

6. Discussion

The damage identification method based on the KL distance indicator is proposed, and its effectiveness was verified by numerical simulation and experimental data. However, there are still some problems in the practical application of this method. Future research can be carried out from the following aspects.
This paper focuses on the scenario of the structure with a single source of damage, while there are usually multiple damage sources in practical engineering. Further, other types of structural nonlinear damage often occur in practical engineering. Therefore, the study of multiple damage sources and different nonlinear damage types should be carried out in the future. It is worth noting that it may be difficult to extract the damage features of multiple damage sources or other structural nonlinear damage types from the structural response time series information. Therefore, this method should be combined with other information-processing methods to extract the damage features of the structure, such as principal component analysis, a machine learning method, a frequency response function analysis method, and so on.
In this paper, research on the damage indicator threshold is not included, which means that it is necessary to judge the damage location by combining the results with prior information on the damage. However, prior information about damage is usually unavailable in practical engineering. Therefore, the research on damage indicator thresholds should be carried out in future research.

7. Conclusions

The structural nonlinear damage detection method based on the Kullback–Leibler distance of the AR model residual is proposed. Because the AR model is one of the simplest time series models, it is beneficial for improving the computational efficiency in engineering applications. Therefore, this method establishes an AR model for the structural acceleration response, and the KL distance is used as damage indicator for damage identification. The effectiveness of the proposed method was verified through a shear structure nonlinear damage numerical simulation and a stand model experiment. The main contribution of this paper is that the combination and application of the AR model and the KL model in civil structural nonlinear damage identification field for the first time. The main conclusions are as follows:
(1)
The proposed method is a damage identification method based on the substructure. The damage indicator of the damaged story is larger than the other stories, which can determine the structural damage location accurately.
(2)
The proposed method can accurately distinguish nonlinear damage of a multi-degree-of-freedom shear structure caused by bilinear stiffness changes. This method is robust enough to analyze environmental noise and small damage.
(3)
The proposed method can effectively find nonlinear damage in a multi-story and multi-span complex structure caused by bolt looseness, which is beneficial in practical applications.
(4)
In this paper, only a multi-degrees-of-freedom shear structure and a stand structure were used to verify the proposed method, and the nonlinear damage identification problem of more structural types should be considered in subsequent research.
(5)
This paper only considers the damage identification results of white noise conducted from the ground to the structure, and the damage identification results of excitation at different locations should be considered in subsequent research.

Author Contributions

Conceptualization, H.Z. and H.G.; methodology, H.Z.; software, H.Z.; validation, H.Z.; investigation, H.Z.; resources, H.G.; writing—original draft, H.Z.; writing—review & editing, H.Z. and H.G.; supervision, H.G.; funding acquisition, H.G. All authors have read and agreed to the published version of the manuscript.

Funding

This work was supported by the National Natural Science Foundation of China (Grant No. 52192663, 51578094).

Data Availability Statement

Not applicable.

Conflicts of Interest

The authors declare no conflict of interest.

References

  1. Worden, K.; Farrar, C.R.; Haywood, J.; Todd, M. A review of nonlinear dynamics applications to structural health monitoring. Struct. Control. Health Monit. 2008, 15, 540–567. [Google Scholar] [CrossRef]
  2. Adams, D.E.; Farrar, C.R. Classifying Linear and Nonlinear Structural Damage Using Frequency Domain ARX Models. Struct. Health Monit.-Int. J. 2002, 1, 185–201. [Google Scholar] [CrossRef]
  3. Lakshmi, K.; Keerthivas, M. Damage diagnosis of high-rise buildings under variable ambient conditions using subdomain approach. Inverse Probl. Sci. Eng. 2021, 29, 2579–2610. [Google Scholar] [CrossRef]
  4. Li, Y.; Sun, W.; Jiang, R.; Han, Y. Signal-segments cross-coherence method for nonlinear structural damage detection using free-vibration signals. Adv. Struct. Eng. 2020, 23, 1041–1054. [Google Scholar] [CrossRef]
  5. Prawin, J.; Rao, A.R.M. Damage detection in nonlinear systems using an improved describing function approach with limited instrumentation. Nonlinear Dyn. 2019, 96, 1447–1470. [Google Scholar] [CrossRef]
  6. Chen, L.; Yu, L.; Fu, J.; Ng, C.T. Nonlinear damage detection using linear ARMA models with classification algorithms. Smart Struct. Syst. 2020, 26, 23–33. [Google Scholar]
  7. Prawin, J.; Rama Mohan Rao, A. Vibration-based breathing crack identification using non-linear intermodulation components under noisy environment. Struct. Health Monit. 2019, 19, 86–104. [Google Scholar] [CrossRef]
  8. Li, Y.; Jiang, R.; Tapia, J.; Wang, S.; Sun, W. Structural damage identification based on short-time temporal coherence using free-vibration response signals. Measurement 2020, 151, 107209. [Google Scholar] [CrossRef]
  9. Xin, Y.; Li, J.; Hao, H. Damage Detection in Initially Nonlinear Structures Based on Variational Mode Decomposition. Int. J. Struct. Stab. Dyn. 2020, 20, 2042009. [Google Scholar] [CrossRef]
  10. Chomette, B. Nonlinear multiple breathing cracks detection using direct zeros estimation of higher-order frequency response function. Commun. Nonlinear Sci. Numer. Simul. 2020, 89, 105330. [Google Scholar] [CrossRef]
  11. Zheng, Z.D.; Lu, Z.R.; Chen, W.H.; Liu, J.K. Structural damage identification based on power spectral density sensitivity analysis of dynamic responses. Comput. Struct. 2015, 146, 176–184. [Google Scholar] [CrossRef]
  12. Esfandiari, A. An innovative sensitivity-based method for structural model updating using incomplete modal data. Struct. Control. Health Monit. 2017, 24, 1896–1905. [Google Scholar] [CrossRef]
  13. Mirzaee, A.; Shayanfar, M.; Abbasnia, R. Damage Detection of Bridges Using Vibration Data by Adjoint Variable Method. Shock. Vib. 2014, 2014, 698658. [Google Scholar] [CrossRef]
  14. Zhu, H.; Yu, H.; Gao, F.; Weng, S.; Sun, Y.; Hu, Q. Damage identification using time series analysis and sparse regularization. Struct. Control. Health Monit. 2020, 27, e2554. [Google Scholar] [CrossRef]
  15. Mei, L.; Li, H.; Zhou, Y.; Li, D.; Long, W.; Xing, F. Output-Only Damage Detection of Shear Building Structures Using an Autoregressive Model-Enhanced Optimal Subpattern Assignment Metric. Sensors 2020, 20, 2050. [Google Scholar] [CrossRef] [Green Version]
  16. Do, N.T.; Gül, M. A time series based damage detection method for obtaining separate mass and stiffness damage features of shear-type structures. Eng. Struct. 2020, 208, 109914. [Google Scholar] [CrossRef]
  17. Prawin, J.; Rama Mohan Rao, A. Reference-Free Breathing Crack Identification of Beam-Like Structures Using an Enhanced Spatial Fourier Power Spectrum with Exponential Weighting Functions. Int. J. Struct. Stab. Dyn. 2019, 19, 1950017. [Google Scholar] [CrossRef]
  18. Voggu, S.; Sasmal, S. Dynamic nonlinearities for identification of the breathing crack type damage in reinforced concrete bridges. Struct. Health Monit.-Int. J. 2021, 20, 339–359. [Google Scholar] [CrossRef]
  19. Yang, Y.; Lu, H.; Tan, X.; Chai, H.K.; Wang, R.; Zhang, Y. Fundamental mode shape estimation and element stiffness evaluation of girder bridges by using passing tractor-trailers. Mech. Syst. Signal Process. 2022, 169, 108746. [Google Scholar] [CrossRef]
  20. Yang, Y.; Lu, H.; Tan, X.; Wang, R.; Zhang, Y. Mode Shape Identification and Damage Detection of Bridge by Movable Sensory System. IEEE Trans. Intell. Transp. Syst. 2022, 24, 1299–1313. [Google Scholar] [CrossRef]
  21. Cao, M.; Lu, Q.; Su, Z.; Radzieński, M.; Xu, W.; Ostachowicz, W. A nonlinearity-sensitive approach for detection of “breathing” cracks relying on energy modulation effect. J. Sound Vib. 2022, 524, 116754. [Google Scholar] [CrossRef]
  22. Yang, Y.; Ling, Y.; Tan, X.; Wang, S.; Wang, R. Damage identification of frame structure based on approximate Metropolis–Hastings algorithm and probability density evolution method. Int. J. Struct. Stab. Dyn. 2022, 22, 2240014. [Google Scholar] [CrossRef]
  23. Akaike, H. Maximum Likelihood Identification of Gaussian Autoregressive Moving Average Models. Biometrika 1973, 60, 255–265. [Google Scholar] [CrossRef]
  24. Amerini, F.; Meo, M. Structural health monitoring of bolted joints using linear and nonlinear acoustic/ultrasound methods. Struct. Health Monit.-Int. J. 2011, 10, 659–672. [Google Scholar] [CrossRef]
  25. Prawin, J.; Rao, A.R.M. A method for detecting damage-induced nonlinearity in structures using weighting function augmented curvature approach. Struct. Health Monit.-Int. J. 2019, 18, 1154–1167. [Google Scholar] [CrossRef]
  26. Niu, Z.R. Two-step structural damage detection method for shear frame structures using FRF and Neumann series expansion. Mech. Syst. Signal Process. 2021, 149, 18. [Google Scholar] [CrossRef]
  27. Rébillat, M.; Hajrya, R.; Mechbal, N. Nonlinear structural damage detection based on cascade of Hammerstein models. Mech. Syst. Signal Process. 2014, 48, 247–259. [Google Scholar] [CrossRef] [Green Version]
  28. Cheng, J.J.; Guo, H.Y.; Wang, Y.S. Structural Nonlinear Damage Detection Method Using AR/ARCH Model. Int. J. Struct. Stab. Dyn. 2017, 17, 1750083. [Google Scholar] [CrossRef]
  29. Prawin, J.; Lakshmi, K.; Rao, A.R.M. A novel vibration based breathing crack localization technique using a single sensor measurement. Mech. Syst. Signal Process. 2019, 122, 117–138. [Google Scholar] [CrossRef]
  30. Kullback, S.; Leibler, R.A. On information and sufficiency. Ann. Math. Stat. 1951, 22, 79–86. [Google Scholar] [CrossRef]
  31. Xu, W.; Su, Z.; Radzieński, M.; Cao, M.; Ostachowicz, W. Nonlinear pseudo-force in a breathing crack to generate harmonics. J. Sound Vib. 2021, 492, 115734. [Google Scholar] [CrossRef]
Figure 1. Damage identification using the KL distance of the AR model residual.
Remotesensing 15 01135 g001
Figure 2. Simulation of eight-story shear structure model.
Remotesensing 15 01135 g002
Figure 3. White noise loading curves.
Remotesensing 15 01135 g003aRemotesensing 15 01135 g003b
Figure 4. Acceleration curves of baseline state with excitation amplitude of 250 kN.
Remotesensing 15 01135 g004aRemotesensing 15 01135 g004b
Figure 5. ACF curves of the baseline state with excitation amplitude of 250 kN.
Remotesensing 15 01135 g005
Figure 6. Damage identification results of damage scenarios 1–8.
Remotesensing 15 01135 g006aRemotesensing 15 01135 g006b
Figure 7. Damage identification results of damage scenarios 9–16.
Remotesensing 15 01135 g007aRemotesensing 15 01135 g007b
Figure 8. Damage identification results of damage scenarios 17–24.
Remotesensing 15 01135 g008aRemotesensing 15 01135 g008b
Figure 9. The stand structure experimental model.
Remotesensing 15 01135 g009
Figure 10. The region divisions and damaged brace locations in the experimental model.
Remotesensing 15 01135 g010
Figure 11. The acceleration curves of the baseline state.
Remotesensing 15 01135 g011
Figure 12. The ACF curves of the baseline state.
Remotesensing 15 01135 g012aRemotesensing 15 01135 g012b
Figure 13. The damage identification results of the stand structure model experiment.
Remotesensing 15 01135 g013aRemotesensing 15 01135 g013b
Table 1. Damage scenarios of 8-story shear structure.
Damage ScenariosDamage StoryDamage LevelExcitation Amplitude/(kn)
1110%250
2210%250
3310%250
4410%250
5510%250
6610%250
7710%250
8810%250
9130%250
10230%250
11330%250
12430%250
13530%250
14630%250
15730%250
16830%250
17130%100
18230%100
19330%100
20430%100
21530%100
22630%100
23730%100
24830%100
Table 2. The damage scenarios of the stand structure model.
Damage ScenarioDamaged RegionBolt-Loosened Braces Number
11B2
21B1, B2, B3
32B5
42B4, B5, B6
53B8
63B7, B8, B9
Disclaimer/Publisher’s Note: The statements, opinions and data contained in all publications are solely those of the individual author(s) and contributor(s) and not of MDPI and/or the editor(s). MDPI and/or the editor(s) disclaim responsibility for any injury to people or property resulting from any ideas, methods, instructions or products referred to in the content.

