Abstract
Global climate change affects biodiversity patterns, especially in arid and semi-arid regions such as the Mongolian plateau, one of the most ecologically fragile regions in the world. Three dynamic habitat indices (DHIs) were related to the productivity hypothesis and calculated based on FAPAR, including cumulative productivity ( indicates the availability of resources such as food supply and habitat in a year, representing available energy), minimum productivity ( indicates the limitations of food and habitat resources in a year, representing environmental stress), and seasonal productivity ( denotes the change in productivity in a year, representing environmental stability). In this paper, we investigated the distribution pattern of species richness on the Mongolian Plateau based on the productivity hypothesis. We constructed models of the richness of three species (mammals, birds, and amphibians) using DHIs and climate variables to explain patterns of species richness on the Mongolian Plateau. The results revealed that, on the Mongolian plateau, there is a relatively high correlation between DHIs and species richness, especially with (R = 0.59 for mammals, R = 0.73 for birds, and R = 0.58 for amphibians). There was a significant non-linear relationship between DHIs and species richness, as the model predictive power was significantly enhanced with GAM and RF. The inclusion of climate variables significantly improved the explanatory power of various models for the mammal, bird, and amphibian species richness on the Mongolian Plateau, with the best results for RF (0.89, 0.94, and 0.91, respectively). The influence of climate variables on species richness patterns in the importance ranking was higher than that of DHIs. Climate also has an influence on species richness. Vegetation productivity and climatic factors are good determinants of species richness on the Mongolian Plateau and should be carefully considered in future studies.
1. Introduction
Biodiversity change is considered an important indicator of ecosystem stability [1,2,3] and an important resource for maintaining the sustainable development of human society. In recent years, the international community has paid increasing attention to biodiversity conservation and taken active measures. A series of policies have been introduced and a series of international conventions jointly signed related to the protection of biodiversity, such as the Convention on Biological Diversity (CBD), the United Nations Environment Programme (UNEP), the World Climate Research Program (WCRP), etc. [4,5,6]. However, due to the intensification of human activities and global warming, the global loss of species is increasing at an unprecedented rate and has a trend toward further acceleration [7,8,9,10]. The International Union for Conservation of Nature (IUCN) [11] shows that 41% of amphibians, 27% of mammals, and 13% of birds are under threat, and more than 41,000 species are threatened with extinction. At the same time, global warming and extreme climate events [12] have further increased the risk of biodiversity loss, which will cause a cliff-edge decline in biodiversity, especially in areas with fragile ecological environments. Therefore, it is necessary and urgent to study species richness.
Biodiversity has an important impact on ecosystems at different geographical scales. However, for large-scale regions, traditional field biodiversity monitoring is no longer sufficient to address issues related to biodiversity conservation [13]. Vegetation products based on satellite remote sensing are powerful tools for global biodiversity assessment because of their non-destructive approach, low cost, greater operability, and greater spatial coverage [14,15], providing an effective and convenient method for studying biodiversity at different geographical scales [16]. Species richness observation based on remote sensing technology usually uses two approaches: direct monitoring, or indirect monitoring [15]. Direct monitoring necessitates extremely high spatial and spectral resolution remote sensing data, which is inconvenient for large regional-scale studies and expensive to evaluate [17,18]. In contrast, indirect monitoring requires lower spatial and spectral resolutions for remote sensing data. Although there are some uncertainties, it provides opportunities for large-scale species monitoring and is widely used regionally and even globally [19,20].
In general, vegetation provides food supplies, shelter, and nesting habitat for many animals, to meet their metabolic needs [21,22], and changes in its distribution and growth time are important for the existence and persistence of animal populations [23]. In recent years, remote sensing indices such as the normalized difference vegetation index (NDVI) [24] have been successfully linked to the species richness of plants and animals, by indicating available food and habitat resources [25,26,27,28]. A key indicator of vegetation productivity in satellite imagery is the predicted fraction of absorbed photosynthetically active radiation (FAPAR) intercepted by vegetation. This provides a more direct estimate of vegetation productivity, can be used to test productivity hypotheses, and provides a more directly relevant index for predicting species richness [23,29]. FAPAR is similar to green vegetation cover [30] and ranges from 0 (poor land) to 1 (high green cover), with higher FAPAR values indicating higher green cover, higher productivity, and higher plant diversity [31].
The FAPAR-based dynamic habitat indices (DHIs) [22] have been used to test the energy hypothesis [32], the environmental stress hypothesis [33], and the environmental stability hypothesis [34] for global biodiversity, and their validity has been verified in studies with actual measured biodiversity data [23,35,36,37]. The DHIs were originally proposed by Berry et al. to explore the relationship between habitat heterogeneity and biodiversity using FAPAR, and have been applied by Coops et al. in Canada, the United States, and Australia [23,35,36,37], demonstrating that the DHIs can be effective for monitoring and predicting biodiversity. Some researchers have also assessed the species richness of birds based on different MODIS vegetation product development DHIs and found that DHIs have a high explanatory power for predicting the species richness of breeding birds [38]. DHIs can effectively explain the species richness of amphibians, birds, and mammals on a global scale [39]. On a regional scale, the DHIs have shown good detection results for mammal and bird species richness in China [40,41], birds species richness in the tropics [42], and plant diversity in India [43].
The region of the Mongolian Plateau spans the forest–steppe–desert belt [44,45] and is one of the largest steppe ecosystems in the world, with a fragile ecological environment [46] that has an important impact on the global carbon cycle. In recent years, the ecological environment of the Mongolian plateau has been severely degraded by climate warming and the excessive development of animal husbandry [47], with increased desertification and frequent dust storms [48], triggering a decrease in biodiversity and a decline in species richness. Previous DHIs studies have focused on global or U.S.–Canadian regions, but there have been no studies on the Mongolian Plateau.
Our goal was to calculate dynamic habitat indices (DHIs) from GLASS, MODIS, and FAPAR, to assess their performance as a Mongolian Plateau species richness prediction model. We addressed the following research objectives: (1) to describe the relationship between DHIs and species richness, (2) to compare their performance in predicting species richness, and (3) to quantify their relative importance in influencing species richness in conjunction with climate variables.
2. Materials and Methods
2.1. Study Area
Figure 1 shows the geographical location and land cover types of the Mongolian Plateau. The Mongolian Plateau is located in the transition zone between the Gobi Desert in Central Asia and the coniferous forests of Siberia from south to north, covering an area of about 3.7 million square kilometers, with geographic coordinates from 37.46°N to 53.08°N and 87.4°E to 122.15°E. It includes the Inner Mongolia Autonomous Region of China (about 1.2 million km2), Mongolia (about 1.5 million km2), and the Russian region (about 1 million km2). It has a typical arid and semi-arid climate, with extremely cold winters and warm summers [44] and is very sensitive to changes in precipitation and temperature. The average annual precipitation varies from 50 mm in the southwestern Gobi Desert to 400 mm in the northeastern forests. The average annual temperature mainly depends on latitudinal variations (decreasing with increasing latitude). Based on MODIS land cover data [49] (Figure 1), it can be concluded that grassland, forest, and desert are the main ecosystem types in the Mongolian Plateau, accounting for 46.7%, 23.3%, and 17.17% of the total area, respectively.
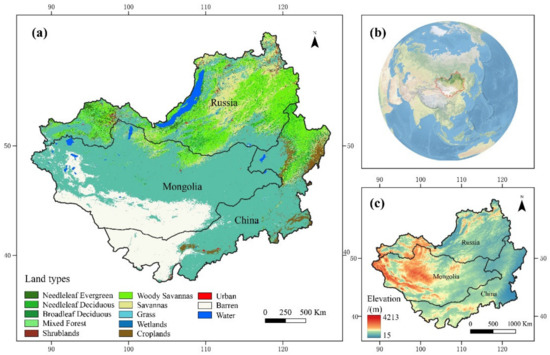
Figure 1.
Geographical location and land cover types of the Mongolian Plateau. (a) The land cover for the Mongolian Plateau; data were sourced from https://ladsweb.modaps.eosdis.nasa.gov/search/order/1/MCD12Q1--6 (accessed on 1 August 2022). (b) Location of the Mongolian Plateau in the world, (c) Mongolian Plateau elevation range; data were sourced from https://worldclim.org/data/worldclim21.html (accessed on 1 August 2022).
2.2. Data
2.2.1. GLASS MODIS FAPAR
DHIs can be developed using various vegetation indices including GPP, FAPAR, LAI, EVI, and NDVI. However, their ability to interpret species richness is variable. Among studies related to DHIs, the FAPAR-based DHIs best explained the extent of vegetation productivity and greening patterns and had the best correlation with species richness [38,39,43]. In order to analyze the spatial and temporal distribution characteristics of the DHIs on the Mongolian Plateau and their impact on species richness, the Global Land Surface Satellite (GLASS) data from the State Key Laboratory of Remote Sensing Science of Beijing Normal University, including light and effective radiation absorption ratio [50], were used in this study (Table 1). The data have a spatial resolution of 500 m and a time resolution of 8 days. We used a time series from 2001 to 2018.

Table 1.
Datasets used in this study.
2.2.2. Species Richness
Species richness data were selected from the 2018 global species maps produced by the Biodiversity Mapping website based on Census data [51,52] (Mammals, Amphibians of the International Union for Conservation of Nature, Birdlife International and birds of NatureServe). These layers have formed the basis for many previous studies of global biodiversity [51]. These range maps were converted to 10 × 10 km species richness maps by counting the number of species ranges overlapped by a given grid pixel (Table 1).
2.2.3. Climate Variables
In addition to the above variables based on remote sensing data, we obtained climatic data from Worldclim version 2.1, with a resolution of 21 km² [53]. The 19 BIOCLIM climate variables characterize temperature and water factors (Table 2). We used these variables to confirm that vegetation productivity was also influenced by climatic variables. Therefore, in our subsequent study, we selected three climatic variables, namely total annual precipitation, maximum temperature, and minimum temperature [42,54]. Maximum temperature becomes a limiting factor when it exceeds the physiological tolerance of a given species. The same is true for the minimum temperature. Annual precipitation affects the type of vegetation and thus the availability of habitat.

Table 2.
Introduction to the 19 BIOCLIM climate variables.
2.3. Methods
We used the GLASS MODIS FAPAR 500 m dataset from 2001 to 2018 to obtain the FAPAR covering the Mongolian Plateau. The preprocessing included Mosaic, projection, format conversion, and clipping. When aggregating into monthly scale, lakes and rivers with FAPAR values greater than 1 were excluded and monthly maxima were calculated using the maximum synthesis method, to eliminate the influence of cloud cover and other factors. Based on the maximum synthetic FAPAR data of each month, the mean method was used to obtain the annual FAPAR data of the study area from 2001 to 2018.
2.3.1. Calculation of Dynamic Habitat Indices (DHIs)
DHIs are composite indices, including yearly cumulative productivity (), minimum annual productivity (), and seasonal variation in productivity (). DHIs provide a good approximation of habitat conditions. provides the overall degree of landscape greenness index; a characterization of resource supply, such as the food supply and habitat; and indirectly explains the distribution of the species:
represents the limitations of food and habitat resources in a year and provides the minimum vegetation cover. It indicates the minimum productivity for each month of the year:
represents the coefficient of annual change in productivity, calculated as the coefficient of variation (the ratio of standard deviation to the annual mean). refers to a surrogate indicator of habitat quality related to the relationship with natural resources (such as food, water, and nutrients):
In these formulas, refers to the monthly maximum FAPAR, and indicates the 12 months of the year. refers to the standard deviation of FAPAR in a year. refers to the mean of FAPAR. The time period is from 2001 to 2018.
2.3.2. Statistical Analysis
Figure 2 showed the process of statistical analysis. We used Pearson correlation coefficients to correlate DHIs with species richness and generate binary density maps for visualization purposes. This method has been widely used to analyze the relationship between DHIs and species richness. We correlated each of the 19 BIO variables with the three DHIs components, to derive the relationship between climatic factors and DHIs and to determine whether climatic variables could complement the information that the DHIs could not reveal.
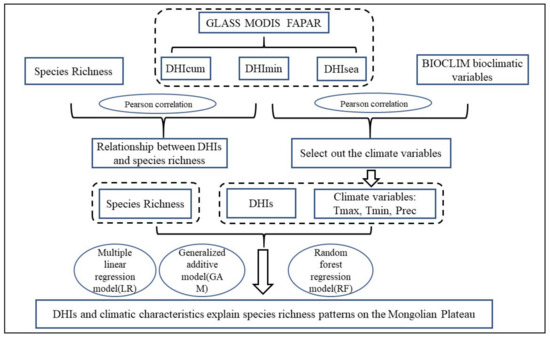
Figure 2.
Flowchart showing the data analysis procedure for the DHIs and species richness based on remote sensing products.
The variables are divided into two groups, DHIs (, , ), and DHIs + climate factors (, , , Prec, Tmax, Tmin). In order to evaluate and predict the relationship between these variables and species richness, and to identify the best species richness proxies, two groups were input into a multiple linear regression model (LR) [42], a generalized additive model (GAM) [55], and a random forest model (RF) [56].
In the RF, we divided the dataset into two sets: a training set (70%), and a test set (30%), in order to reduce the overfitting that occurs with machine learning methods and to derive the relationship between the predicted species richness and observed species richness. RF-based variable importance and partial dependence plots were derived to demonstrate the predictive power of the variables. Variable importance is measured using the percentage increase in mean square error, which increased when the variable improves the performance of the model. Partial dependence plots depict the response of species richness to successive changes in explanatory variables when other factors are held constant. Each plot graphically depicts how species richness responds to changes in each predictor variable independent of the other variables. Partial dependence plots can reveal the relationship between species richness and variables. These analyses were based on 23,533 valid pixel values for 10 × 10 km resampled DHIs and climate variables. The coefficient of determination R2 was used to assess the overall predictive power of the model at a 95% confidence interval.
3. Results
3.1. Distribution Patterns of DHIs
Figure 3 shows the spatial distribution of vegetation productivity on the Mongolian Plateau obtained using the FAPAR-based DHIs. and gradually decreased from the forest area in the east and north of the vegetation coverage to the central grassland area and the desert area in the southwest of Mongolia and Inner Mongolia. The change of is related to the change of vegetation (desert–grassland–forest). showed higher values in the regions characterized by higher seasonal change rates. displayed high values in the forest regions of northern Russia and eastern Inner Mongolia. The highest values were found in mixed and deciduous broadleaf forests in the Russian region and in the Great Khingan of Inner Mongolia, China. The lowest (less than 0.1) was found in the desert and grassland regions, and the relatively high in the northern forest region was due to the evergreen forest that grows there all year round.
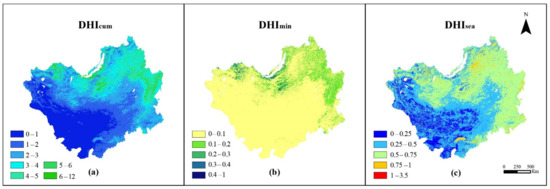
Figure 3.
Annual average spatial distribution of DHIs on the Mongolian Plateau from 2001 to 2018: (a) , (b) , (c) .
3.2. Geographic Distribution of Species Richness
The geographic distribution of species richness on the Mongolian Plateau based on field surveys in 2018, including mammals, birds, and amphibians, is shown in Figure 4 Mammal species richness on the Mongolian Plateau shows a decreasing trend from north to south (Figure 4a). Mammal species are much fewer in the desert areas of western Inner Mongolia and most abundant in western Russia. From the southern to northwestern part of the Mongolian Plateau, the bird species richness tends to increase (Figure 4b), showing a clear circular geographic distribution. In contrast, due to the arid and semi-arid climate, amphibian species are very scarce on the Mongolian Plateau, with a maximum of only seven species (Figure 4c). The distribution of amphibians in the eastern forest region of the Mongolian Plateau is somewhat greater compared to the western part, but the overall number is still very small. The areas with high species richness of mammals, birds, and amphibians are all distributed in areas with rich vegetation, while the desert areas have a lower variety of species. Overall, the species richness distribution patterns are not the same for the three animal groups. As expected, hotspots of mammalian species diversity are located in the northern mountainous areas, with higher species diversity than in the central and southern parts. The species richness patterns for birds show a clear latitudinal gradient, with the highest in the northwest and then decreasing southward.

Figure 4.
Distribution patterns of the species richness of different groups on the Mongolian Plateau: (a) mammal species richness, (b) bird, species richness, and (c) amphibian species richness.
3.3. DHIs and Species Richness
We used DHIs to investigate whether the species richness on the Mongolian Plateau could be substituted. Binary density plots and Pearson correlation coefficients can determine the relationship between species richness and DHIs (Figure 5). The results showed that there was a strong correlation between and all three species, and its correlation with species richness was significantly higher than that between and , especially for birds and mammals. Among them, reached 0.73 for birds richness, followed by mammals and amphibians (0.59 and 0.58, respectively), and the results all passed the significance test of p < 0.05. The lowest correlations were found between and mammals and birds (0.48, 0.62). With lower and slightly higher vegetation productivity, both and showed a higher density of mammal and bird species richness, as shown in Figure 5 (black colored).
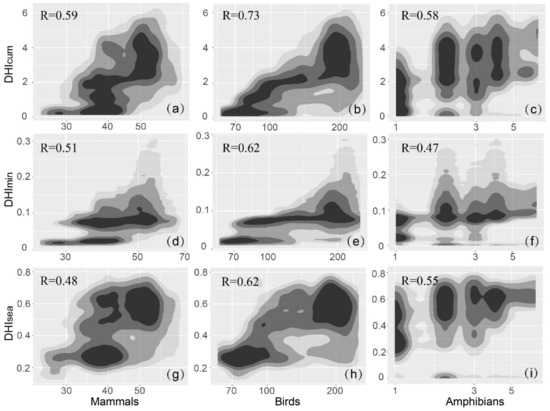
Figure 5.
The relationship between species richness and DHIs (2018) in terms of frequency distributions. with (a) mammals, (b) birds, and (c) amphibians. with (d) mammals, (e) birds, and (f) amphibians. with (g) mammals, (h) birds, and (i) amphibians. The darker the color, the higher the density. Black represents high density.
3.4. Interpretative Analysis of Species Richness Using DHIs
We constructed (x, y) mapping relationships between the DHIs of each grid and the annual mean of the corresponding BIOCLIM bioclimatic variables, and then went through all the grids to perform a Pearson correlation analysis. The aim was to understand the relationship between the DHIs and environmental information affecting species richness. The results showed (Figure 6) a moderately strong correlation between DHIs and bioclimatic variables, suggesting that the DHIs provide unique and complementary information that captures most of the environmental information in the bioclimatic variables. For , the correlations with precipitation-related BIOCLIM variables were generally strong, reaching 0.85 for annual precipitation, driest quarter precipitation, and warmest quarter precipitation (Bio12, Bio16, and Bio18), while the correlations of temperature-related BIOCLIM variables were slightly lower, with the highest correlation being −0.64 (Bio6, Bio9). and were closely correlated with precipitation (Bio13, Bio18) but not with temperature. This shows that climatic factors (temperature and precipitation) can effectively complement certain information that the DHIs cannot reveal.

Figure 6.
Correlations between the DHIs and 19 BIOCLIM climate variables, showing the relationship between the DHIs and environmental information that may influence species richness.
We selected annual cumulative precipitation (prec), annual maximum temperature (Tmax), and annual minimum temperature (Tmin) for the modeling and investigated the relationship between species richness and variables using LR, GAM, and RF. These variables were divided into two groups: DHIs (, , ), and DHIs + climate factors (, , , Prec, Tmax, Tmin).
The results (Table 3) revealed the following: Surprisingly, the performance of DHIs in predicting species richness using the three models was in the order LR < GAM < RF. This indicates that the relationship between DHIs and species richness is not a simple linear relationship. The relationship between the two is complex and non-linear. This is because the ecosystem response to climate is non-linear in nature in time and space. The overall prediction of all three models was improved with the addition of climate variables, indicating the influence of climate variables on predicting species richness. The models considering both DHIs and climate variables provided better predictions.

Table 3.
Simulation of species richness with DHIs, and climate variable model results using LR, GAM, and RF (The numbers in the table represent the R2 of the model at p < 0.05).
The LR results showed that the DHIs had the greatest explanatory power for birds (53.6%), followed by mammals (35.2%) and amphibians (35.7%). The addition of climate variables revealed that the explanatory power of the model increased for all three species, 71.7% for birds, and 50.9% and 68% for mammals and amphibians. The results of the GAM modeling of the DHIs showed an explanatory power of 67.8% for birds, and 53.5% and 51.2% for mammals and amphibians. In contrast, with the results including climate variables, the explanatory power exceeded 70% for all three species. The explanatory power increased to 82.1% for birds, 70.6% for mammals, and 79.5% for amphibians. For mammals, birds, and amphibians, the RF model considering the combination of DHIs and climate variables showed the highest explained variance (89.1%, 94.4%, and 91%, respectively). The correlation between the predicted and observed richness was tested (Figure 7) and passed the 0.95 significance level. The RF-based model was reliable. Therefore, DHIs and climate variables were selected for a variable importance ranking analysis and partial dependence plots, to obtain the relative importance of the effects of vegetation productivity and temperature precipitation characteristics on species richness patterns.
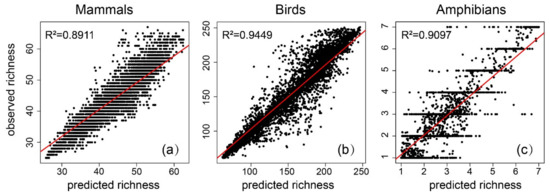
Figure 7.
The relationships between the observed richness and predicted richness, based on RF with both dynamic habitat indices (DHIs) and climate variables, of (a) mammals, (b) birds, and (c) amphibians.
The variable importance diagram explains the explanatory power of each predictor variable. As shown in Figure 8, the most important variable for predicting bird abundance on the Mongolian Plateau was maximum temperature, and the most important variable for mammal and amphibian abundance was precipitation. In particular, this implies that birds are more sensitive to changes in temperature over time, and mammals and amphibians are more sensitive to changes in precipitation. The DHIs were less important, with ranking highest in importance among the three.
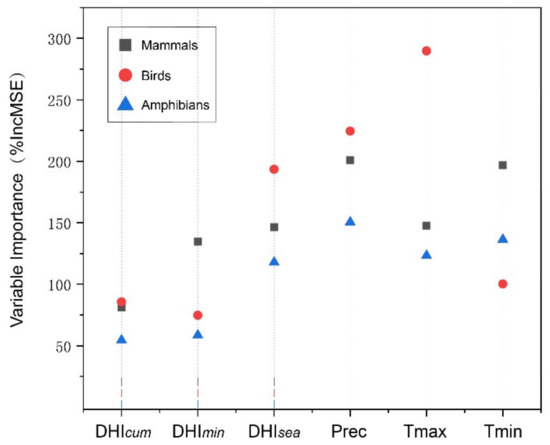
Figure 8.
Variable importance plots based on RF for mammals (square), birds (circle), and amphibians (triangle). The importance of a variable is measured by the percentage increase in the mean square error of each predictor variable in the RF, with higher values implying a greater importance.
Partial dependence plots can provide mechanisms to explain how species richness changes when variables change, and can also predict variables where the response curve is linear, monotonic, or more complex over a given range (Figure 9, Figure 10 and Figure 11). It is worth noting that for the three groups, there was no clear linear relationship between the variables and species richness. For the DHIs, species richness increased with increasing (and decreasing and ) for mammals, with increasing and (and decreasing ) for birds, and with increasing DHIs for amphibians. The response of the three species to precipitation was negatively correlated, then positively correlated, and finally asymptotic. However, the response to temperature was different. As the maximum temperature (minimum temperature) increased, both mammals and birds decreased (first increase then decrease), while amphibians increased (increase). This suggests that the three species also respond differently to climate variables.
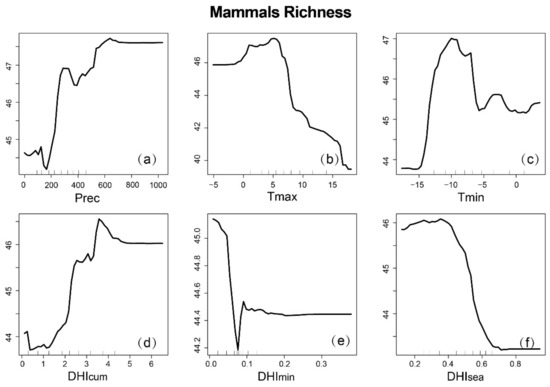
Figure 9.
Partial dependence map of mammal richness based on RF, depending on climatic variables and dynamic habitat indices (DHIs): (a) annual cumulative precipitation; (b) annual maximum temperature; (c) annual minimum temperature; (d) ; (e) ; (f) .
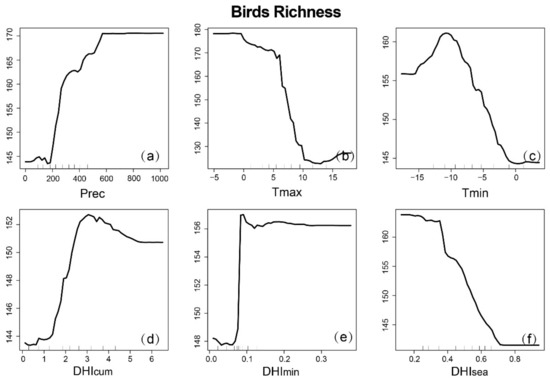
Figure 10.
Partial dependence map of bird richness based on RF, depending on climatic variables and dynamic habitat indices (DHIs): (a) annual cumulative precipitation; (b) annual maximum temperature; (c) annual minimum temperature; (d) ; (e) ; (f) .
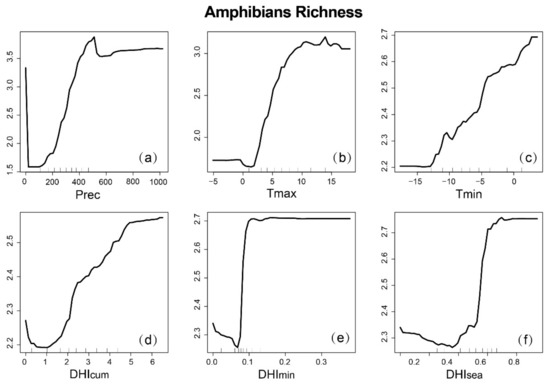
Figure 11.
Partial dependence map of amphibian richness based on RF, depending on climatic variables and dynamic habitat indices (DHIs): (a) annual cumulative precipitation; (b) annual maximum temperature; (c) annual minimum temperature; (d) ; (e) ; (f) .
4. Discussion
In this study, dynamic habitat indices (DHIs) of the Mongolian Plateau were derived based on the 500 m resolution GLASS MODIS FAPAR product. This reflects three productivity indices with implications for species richness (mammals, birds, amphibians), namely annual cumulative productivity (), annual minimum productivity (), and seasonal variation in productivity (). The DHIs exhibited clear distribution patterns on the Mongolian Plateau. All three DHIs were correlated with mammal, bird, and amphibian species richness on the Mongolian Plateau. This was consistent with three key hypotheses of biodiversity: the available energy hypothesis [57] (positive correlation between species richness and cumulative productivity), the environmental stress hypothesis [58] (positive correlation between species richness and minimum productivity), and the environmental stability hypothesis [59] (correlation between species richness and productivity variability). DHIs can provide a meaningful measure of the environmental drivers of biodiversity models. However, we found that combining data on climatic factors provided complementary information and greatly improved the explanatory power of different species richness patterns compared to using the DHIs alone.
Some areas were covered with forests of evergreen, semi-evergreen, and deciduous species and large areas of grasslands, where the was correspondingly larger. More importantly, due to the persistence of evergreen forests, greenness and productivity were high throughout the year, with little seasonal variation. Desert areas, however, are very sparsely vegetated year-round and their vegetation productivity is very low and almost seasonal. Vegetation productivity is highly correlated with vegetation type. Productivity was highest in areas with high vegetation cover, especially in areas covered by evergreen forests (e.g., parts of Russia and the Great Khingan of China), and areas with high annual cumulative productivity exhibited correspondingly high values of annual minimum productivity. In contrast, for areas where the land cover was grassland, the annual cumulative productivity was slightly lower than that of forests. However, due to the dry grass period from October to April each year and the low temperature, which affects the growth of herbaceous plants, the annual minimum productivity was no different from that of the desert. Therefore, can be used to distinguish forest from other land cover types. Higher values were observed in some northern regions with a high proportion of grasslands and arable land, while for central regions with large amounts of grasslands, the deficit was lower. This can be used to identify farmland.
Several studies have shown a strong relationship between DHIs and species richness at global and regional scales [31,36,39]. Higher levels of species richness are found in areas with higher productivity, more food resources, and better habitat conditions [40]. Our results suggest that is an effective explanatory variable for species richness on the Mongolian plateau, similarly to results found by others globally and regionally. There is a moderately strong correlation between DHIs and birds, mammals, and amphibians on the Mongolian plateau. The most important influence controlling for species richness on the Mongolian Plateau, with the introduction of DHIs only, was . It characterized the distribution and availability of food resources and the habitats limiting the number of animal species on the Mongolian Plateau. However, the overall species richness of amphibians on the Mongolian plateau is much lower than that of mammals and birds, and our results may not be accurate and therefore should only be used as a reference.
The relationship between variables and species richness is not simply linear, as ecosystem and climate dynamics are inherently nonlinear in time and space. Compared to LR, GAM and RF allow for a nonlinear relationship between variables and species, greatly improving the predictive performance of species richness models. Species richness is closely related to vegetation productivity, habitat, and climatic factors. Considering the influence of climate on vegetation productivity, we conducted a correlation analysis between DHIs and climate variables and found that all three components of DHIs were well correlated with climate variables. In contrast to productivity, climatic factors play a central role in driving large-scale plant and animal species richness gradients [60,61,62]. Therefore, for the integrated model of species richness, we combined the DHIs with other variables known to be correlated with species richness, such as temperature and precipitation. We expected that the unexplained component of species richness would be at least partially enriched by the additional variables. The inclusion of climate variables significantly improved the performance of the species model.
Climatic variables had a greater effect on mammal, bird, and amphibian species richness than vegetation productivity on the Mongolian Plateau. Temperature directly affects phenology, and bird levels are more closely related to temperature than productivity [56]. First, temperature limits species survival, growth, and reproduction, and limits the allocation of resources. Second, higher temperatures alter the migration patterns of birds [62]. For mammals and amphibians, the key factor controlling species richness is precipitation, as mammals and amphibians have adapted to temperature extremes, while precipitation limits resources and, thus, mammal populations.
5. Conclusions
Dynamic habitat indices (DHIs) calculated from FAPAR can be used to model biodiversity patterns, and we found that they generally had good explanatory power for species richness on the Mongolian Plateau. DHIs are well correlated to the species richness of mammals, birds, and amphibians. Their relationships fit well with the three productivity hypotheses. The combination of DHIs with climatic variables, such as precipitation and temperature, explains the variation in species richness from 35% to 94%. Moreover, they can provide an insight into the interpretation of species richness, especially for birds and mammals. We confirmed that the DHIs are best used in combination with climatic variables and can be a good proxy for species richness on the Mongolian Plateau.
However, the scarcity and possible uncertainty regarding amphibians make the results obtained not entirely convincing. Due to the climatic sensitivity of the Mongolian Plateau and the widespread loss of habitat and biodiversity caused by global climate change on the Mongolian Plateau, there is a growing need for valid and accurate data and methods to support conservation efforts for the Mongolian Plateau ecology. Our findings highlight the importance of monitoring climate change and vegetation productivity on the Mongolian Plateau for biodiversity conservation. This approach could be considered when studying biodiversity conservation on the Mongolian plateau, especially in the context of increased climate change.
Author Contributions
Conceptualization, Y.L. (Yingbin Liu) and Y.Y.; methodology, Y.L. (Yingbin Liu) and X.C.; software, Y.L. (Yingbin Liu) and X.Y.; writing-original draft preparation, Y.L. (Yingbin Liu); writing-review and editing, X.C. and Y.L. (Yangxiaoyue Liu); visualization, Y.L. (Yingbin Liu); supervision, Y.Y.; project administration, Y.Y.; funding acquisition, Y.Y. All authors have read and agreed to the published version of the manuscript.
Funding
This research was funded by Comprehensive Investigation of Resources and Environmental Elements of The Mongolian Plateau (2019FY102001); Comprehensive Disaster Risk Assessment and Prevention of the Second Comprehensive Scientific Investigation of the Qinghai-Tibet Plateau (2019QZKK0906); Chinese Academy of Sciences Network Security and Informatization Special Project (CAS-WX2021SF-0106-03); National Earth System Science Data Sharing Infrastructure (2005DKA32300); The 14th Five-year Informatization Plan of Chinese Academy of Sciences (WX145XQ07-11); Branch Center Project of Geography, Resources and Ecology of Knowledge Center for Chinese Engineering Sciences and Technology (CKCEST-2021-2-10).
Data Availability Statement
The data presented in this study are available on request from the corresponding author.
Acknowledgments
Comments and suggestions from anonymous reviewers, the Academic Editor, and the Editor are greatly appreciated.
Conflicts of Interest
The authors declare no conflict of interest.
References
- Hooper, D.U.; Chapin Iii, F.S.; Ewel, J.J.; Hector, A.; Inchausti, P.; Lavorel, S.; Lawton, J.H.; Lodge, D.M.; Loreau, M.; Naeem, S.; et al. Effects of Biodiversity on Ecosystem Functioning: A Consensus of Current Knowledge. Ecol. Monogr. 2005, 75, 3–35. [Google Scholar] [CrossRef]
- Loreau, M.; Naeem, S.; Inchausti, P.; Bengtsson, J.; Grime, J.P.; Hector, A.; Hooper, D.U.; Huston, M.A.; Raffaelli, D.; Schmid, B.; et al. Biodiversity and Ecosystem Functioning: Current Knowledge and Future Challenges. Science 2001, 294, 804–808. [Google Scholar] [CrossRef] [PubMed]
- Chapin Iii, F.S.; Zavaleta, E.S.; Eviner, V.T.; Naylor, R.L.; Vitousek, P.M.; Reynolds, H.L.; Hooper, D.U.; Lavorel, S.; Sala, O.E.; Hobbie, S.E.; et al. Consequences of changing biodiversity. Nature 2000, 405, 234–242. [Google Scholar] [CrossRef] [PubMed]
- Han, X.; Young, B.E.; Gill, M.J.; Hamilton, H.; Vergara, S.G. Data on Indicators used in Southeast Asian nations’ 4th and 5th National Reports to the Convention on Biological Diversity. Data Brief 2020, 31, 105705. [Google Scholar] [CrossRef] [PubMed]
- Ferreira, M.A.; Barrio Froján, C.; Gunn, V.; Johnson, D.E. A role for UNEP’s Regional Seas Programme under the post-2020 global biodiversity framework. Mar. Policy 2022, 136, 104930. [Google Scholar] [CrossRef]
- Sillmann, J.; Thorarinsdottir, T.; Keenlyside, N.; Schaller, N.; Alexander, L.V.; Hegerl, G.; Seneviratne, S.I.; Vautard, R.; Zhang, X.; Zwiers, F.W. Understanding, modeling and predicting weather and climate extremes: Challenges and opportunities. Weather Clim. Extrem. 2017, 18, 65–74. [Google Scholar] [CrossRef]
- Myers, N.; Mittermeier, R.A.; Mittermeier, C.G.; da Fonseca, G.A.B.; Kent, J. Biodiversity hotspots for conservation priorities. Nature 2000, 403, 853–858. [Google Scholar] [CrossRef]
- Pimm, S.L.; Jenkins, C.N.; Abell, R.; Brooks, T.M.; Gittleman, J.L.; Joppa, L.N.; Raven, P.H.; Roberts, C.M.; Sexton, J.O. The biodiversity of species and their rates of extinction, distribution, and protection. Science 2014, 344, 1246752. [Google Scholar] [CrossRef]
- Sala, O.E.; Stuart Chapin, F.; Iii, N.; Armesto, J.J.; Berlow, E.; Bloomfield, J.; Dirzo, R.; Huber-Sanwald, E.; Huenneke, L.F.; Jackson, R.B.; et al. Global Biodiversity Scenarios for the Year 2100. Science 2000, 287, 1770–1774. [Google Scholar] [CrossRef]
- Zhang, S.; Zhou, Y.; Yu, R.; Xu, X.; Xu, M.; Li, G.; Wang, W.; Yang, Y. China’s biodiversity conservation in the process of implementing the sustainable development goals (SDGs). J. Clean. Prod. 2022, 338, 130595. [Google Scholar] [CrossRef]
- IUCN. The IUCN Red List of Threatened Species. Available online: https://www.iucnredlist.org/en (accessed on 1 August 2022).
- D’Amen, M.; Bombi, P. Global warming and biodiversity: Evidence of climate-linked amphibian declines in Italy. Biol. Conserv. 2009, 142, 3060–3067. [Google Scholar] [CrossRef]
- Erdelen, W.R. Shaping the Fate of Life on Earth: The Post-2020 Global Biodiversity Framework. Glob. Policy 2020, 11, 347–359. [Google Scholar] [CrossRef]
- Nagendra, H. Using remote sensing to assess biodiversity. Int. J. Remote Sens. 2001, 22, 2377–2400. [Google Scholar] [CrossRef]
- Turner, W.; Spector, S.; Gardiner, N.; Fladeland, M.; Sterling, E.; Steininger, M. Remote sensing for biodiversity science and conservation. Trends Ecol. Evol. 2003, 18, 306–314. [Google Scholar] [CrossRef]
- Zarnetske, P.L.; Read, Q.D.; Record, S.; Gaddis, K.D.; Pau, S.; Hobi, M.L.; Malone, S.L.; Costanza, J.; Dahlin, K.M.; Latimer, A.M.; et al. Towards connecting biodiversity and geodiversity across scales with satellite remote sensing. Glob. Ecol. Biogeogr. 2019, 28, 548–556. [Google Scholar] [CrossRef] [PubMed]
- Dietz, H.; Steinlein, T. Determination of plant species cover by means of image analysis. J. Veg. Sci. 1996, 7, 131–136. [Google Scholar] [CrossRef]
- Ehrlich, D.; Estes, J.; Scepan, J. Improving crop type determination using satellite imagery: A study for the Regione del Veneto, Italy. Geocarto Int. 1990, 5, 35–47. [Google Scholar] [CrossRef]
- Duro, D.C.; Coops, N.C.; Wulder, M.A.; Han, T. Development of a large area biodiversity monitoring system driven by remote sensing. Prog. Phys. Geogr. 2007, 31, 235–260. [Google Scholar] [CrossRef]
- Pettorelli, N.; Laurance, W.F.; O’Brien, T.G.; Wegmann, M.; Nagendra, H.; Turner, W. Satellite remote sensing for applied ecologists: Opportunities and challenges. J. Appl. Ecol. 2014, 51, 839–848. [Google Scholar] [CrossRef]
- Olff, H.; Ritchie, M.E.; Prins, H.H.T. Global environmental controls of diversity in large herbivores. Nature 2002, 415, 901–904. [Google Scholar] [CrossRef]
- Berry, S.; Mackey, B.; Brown, T. Potential applications of remotely sensed vegetation greenness to habitat analysis and the conservation of dispersive fauna. Pac. Conserv. Biol. 2007, 13, 120–127. [Google Scholar] [CrossRef]
- Coops, N.C.; Wulder, M.A.; Duro, D.C.; Han, T.; Berry, S. The development of a Canadian dynamic habitat index using multi-temporal satellite estimates of canopy light absorbance. Ecol. Indic. 2008, 8, 754–766. [Google Scholar] [CrossRef]
- Tucker, C.J. Red and photographic infrared linear combinations for monitoring vegetation. Remote Sens. Environ. 1979, 8, 127–150. [Google Scholar] [CrossRef]
- Bawa, K.; Rose, J.; Ganeshaiah, K.N.; Barve, N.; Kiran, M.C.; Umashaanker, R. Assessing Biodiversity from Space: An Example from the Western Ghats, India. Conserv. Ecol. 2002, 6, 1–5. [Google Scholar] [CrossRef]
- Buckley, L.B.; Hurlbert, A.H.; Jetz, W. Broad-scale ecological implications of ectothermy and endothermy in changing environments. Glob. Ecol. Biogeogr. 2012, 21, 873–885. [Google Scholar] [CrossRef]
- Seto, K.C.; Fleishman, E.; Fay, J.P.; Betrus, C.J. Linking spatial patterns of birds and butterfly species richness with Landsat TM derived NDVI. Int. J. Remote Sens. 2004, 25, 4309–4324. [Google Scholar] [CrossRef]
- McFarland, T.M.; Van Riper, C.; Johnson, G.E. Evaluation of NDVI to assess avian abundance and richness along the upper San Pedro River. J. Arid Environ. 2012, 77, 45–53. [Google Scholar] [CrossRef]
- Nightingale, J.M.; Coops, N.C.; Waring, R.H.; Hargrove, W.W. Comparison of MODIS gross primary production estimates for forests across the U.S.A. with those generated by a simple process model, 3-PGS. Remote Sens. Environ. 2007, 109, 500–509. [Google Scholar] [CrossRef]
- Asner, G.P.; Braswell, B.H.; Schimel, D.S.; Wessman, C.A. Ecological Research Needs from Multiangle Remote Sensing Data. Remote Sens. Environ. 1998, 63, 155–165. [Google Scholar] [CrossRef]
- Coops, N.C.; Wulder, M.A.; Iwanicka, D. Demonstration of a satellite-based index to monitor habitat at continental-scales. Ecol. Indic. 2009, 9, 948–958. [Google Scholar] [CrossRef]
- Wright, D. Species-Energy Theory: An Extension of Species-Area Theory. Oikos 1983, 41, 496. [Google Scholar] [CrossRef]
- Currie, D.J.; Mittelbach, G.G.; Cornell, H.V.; Field, R.; Guégan, J.F.; Hawkins, B.A.; Kaufman, D.M.; Kerr, J.T.; Oberdorff, T.; O’Brien, E.; et al. Predictions and tests of climate-based hypotheses of broad-scale variation in taxonomic richness. Ecol. Lett. 2004, 7, 1121–1134. [Google Scholar] [CrossRef]
- Klopfer, P.H.; MacArthur, R.H. Niche Size and Faunal Diversity. Am. Nat. 1960, 94, 293–300. [Google Scholar] [CrossRef]
- Mackey, B.; Bryan, J.; Randall, L. Australia’s Dynamic Habitat Template 2003. 2004. Available online: http://hdl.handle.net/1885/41959 (accessed on 13 February 2023).
- Coops, N.C.; Waring, R.H.; Wulder, M.A.; Pidgeon, A.M.; Radeloff, V.C. Birds diversity: A predictable function of satellite-derived estimates of seasonal variation in canopy light absorbance across the United States. J. Biogeogr. 2009, 36, 905–918. [Google Scholar] [CrossRef]
- Nelson, T.A.; Coops, N.C.; Wulder, M.A.; Perez, L.; Fitterer, J.; Powers, R.; Fontana, F. Predicting Climate Change Impacts to the Canadian Boreal Forest. Diversity 2014, 6, 133–157. [Google Scholar] [CrossRef]
- Hobi, M.L.; Dubinin, M.; Graham, C.H.; Coops, N.C.; Clayton, M.K.; Pidgeon, A.M.; Radeloff, V.C. A comparison of Dynamic Habitat Indices derived from different MODIS products as predictors of avian species richness. Remote Sens. Environ. 2017, 195, 142–152. [Google Scholar] [CrossRef]
- Radeloff, V.C.; Dubinin, M.; Coops, N.C.; Allen, A.M.; Brooks, T.M.; Clayton, M.K.; Costa, G.C.; Graham, C.H.; Helmers, D.P.; Ives, A.R.; et al. The Dynamic Habitat Indices (DHIs) from MODIS and global biodiversity. Remote Sens. Environ. 2019, 222, 204–214. [Google Scholar] [CrossRef]
- Zhang, C.; Cai, D.; Guo, S.; Guan, Y.; Fraedrich, K.; Nie, Y.; Liu, X.; Bian, X. Spatial-Temporal Dynamics of China’s Terrestrial Biodiversity: A Dynamic Habitat Index Diagnostic. Remote Sens. 2016, 8, 227. [Google Scholar] [CrossRef]
- Zhu, L.; Guo, Y. Remotely Sensed Winter Habitat Indices Improve the Explanation of Broad-Scale Patterns of Mammal and Birds Species Richness in China. Remote Sens. 2022, 14, 794. [Google Scholar] [CrossRef]
- Suttidate, N.; Hobi, M.L.; Pidgeon, A.M.; Round, P.D.; Coops, N.C.; Helmers, D.P.; Keuler, N.S.; Dubinin, M.; Bateman, B.L.; Radeloff, V.C. Tropical birds species richness is strongly associated with patterns of primary productivity captured by the Dynamic Habitat Indices. Remote Sens. Environ. 2019, 232, 111306. [Google Scholar] [CrossRef]
- Mahanand, S.; Behera, M.D.; Roy, P.S.; Kumar, P.; Barik, S.K.; Srivastava, P.K. Satellite Based Fraction of Absorbed Photosynthetically Active Radiation Is Congruent with Plant Diversity in India. Remote Sens. 2021, 13, 159. [Google Scholar] [CrossRef]
- Angerer, J.; Han, G.; Fujisaki, I.; Havstad, K. Climate change and ecosystems of Asia with emphasis on inner Mongolia and Mongolia. Rangelands 2008, 30, 46–51. [Google Scholar] [CrossRef]
- Chen, J.; John, R.; Sun, G.; Fan, P.; Henebry, G.M.; Fernández-Giménez, M.E.; Zhang, Y.; Park, H.; Tian, L.; Groisman, P.; et al. Prospects for the sustainability of social-ecological systems (SES) on the Mongolian plateau: Five critical issues. Environ. Res. Lett. 2018, 13, 123004. [Google Scholar] [CrossRef]
- Qi, J.; Chen, J.; Wan, S.; Ai, L. Understanding the coupled natural and human systems in Dryland East Asia. Environ. Res. Lett. 2012, 7, 015202. [Google Scholar] [CrossRef]
- Chen, H.; Shao, L.; Zhao, M.; Zhang, X.; Zhang, D. Grassland conservation programs, vegetation rehabilitation and spatial dependency in Inner Mongolia, China. Land Use Policy 2017, 64, 429–439. [Google Scholar] [CrossRef]
- Tan, M.; Li, X. Does the Green Great Wall effectively decrease dust storm intensity in China? A study based on NOAA NDVI and weather station data. Land Use Policy 2015, 43, 42–47. [Google Scholar] [CrossRef]
- Friedl, M.A.; Sulla-Menashe, D.; Tan, B.; Schneider, A.; Ramankutty, N.; Sibley, A.; Huang, X. MODIS Collection 5 global land cover: Algorithm refinements and characterization of new datasets. Remote Sens. Environ. 2010, 114, 168–182. [Google Scholar] [CrossRef]
- Xiao, Z.; Liang, S.; Sun, R.; Wang, J.; Jiang, B. Estimating the fraction of absorbed photosynthetically active radiation from the MODIS data based GLASS leaf area index product. Remote Sens. Environ. 2015, 171, 105–117. [Google Scholar] [CrossRef]
- Jenkins, C.N.; Pimm, S.L.; Joppa, L.N. Global patterns of terrestrial vertebrate diversity and conservation. Proc. Natl. Acad. Sci. USA 2013, 110, E2602–E2610. [Google Scholar] [CrossRef]
- Brasil, L.S.; Silverio, D.V.; Cabette, H.S.R.; Batista, J.D.; Vieira, T.B.; Dias-Silva, K.; Oliveira-Junior, J.M.B.d.; Carvalho, F.G.d.; Calvão, L.B.; Macedo, M.N.; et al. Net primary productivity and seasonality of temperature and precipitation are predictors of the species richness of the Damselflies in the Amazon. Basic Appl. Ecol. 2019, 35, 45–53. [Google Scholar] [CrossRef]
- Hijmans, R.J.; Cameron, S.E.; Parra, J.L.; Jones, P.G.; Jarvis, A. Very high resolution interpolated climate surfaces for global land areas. Int. J. Climatol. 2005, 25, 1965–1978. [Google Scholar] [CrossRef]
- Sheldon, K.S.; Tewksbury, J.J. The impact of seasonality in temperature on thermal tolerance and elevational range size. Ecology 2014, 95, 2134–2143. [Google Scholar] [CrossRef]
- Coops, N.C.; Bolton, D.K.; Hobi, M.L.; Radeloff, V.C. Untangling multiple species richness hypothesis globally using remote sensing habitat indices. Ecol. Indic. 2019, 107, 105567. [Google Scholar] [CrossRef]
- Zhang, C.; Li, L.; Guan, Y.; Cai, D.; Chen, H.; Bian, X.; Guo, S. Impacts of vegetation properties and temperature characteristics on species richness patterns in drylands: Case study from Xinjiang. Ecol. Indic. 2021, 133, 108417. [Google Scholar] [CrossRef]
- Tews, J.; Brose, U.; Grimm, V.; Tielbörger, K.; Wichmann, M.C.; Schwager, M.; Jeltsch, F. Animal species diversity driven by habitat heterogeneity/diversity: The importance of keystone structures. J. Biogeogr. 2004, 31, 79–92. [Google Scholar] [CrossRef]
- Mason, N.W.H.; Mouillot, D.; Lee, W.G.; Wilson, J.B. Functional richness, functional evenness and functional divergence: The primary components of functional diversity. Oikos 2005, 111, 112–118. [Google Scholar] [CrossRef]
- Williams, S.E.; Middleton, J. Climatic seasonality, resource bottlenecks, and abundance of rainforest birdss: Implications for global climate change. Divers. Distrib. 2008, 14, 69–77. [Google Scholar] [CrossRef]
- Lasmar, C.J.; Rosa, C.; Queiroz, A.C.M.; Nunes, C.A.; Imata, M.M.G.; Alves, G.P.; Nascimento, G.B.; Ázara, L.N.; Vieira, L.; Louzada, J.; et al. Temperature and productivity distinctly affect the species richness of ectothermic and endothermic multitrophic guilds along a tropical elevational gradient. Oecologia 2021, 197, 243–257. [Google Scholar] [CrossRef]
- Hawkins, B.A.; Field, R.; Cornell, H.V.; Currie, D.J.; Guégan, J.-F.; Kaufman, D.M.; Kerr, J.T.; Mittelbach, G.G.; Oberdorff, T.; O’Brien, E.M.; et al. Energy, Water, and Broad-Scale Geographic Patterns of Species Richness. Ecology 2003, 84, 3105–3117. [Google Scholar] [CrossRef]
- Mimiller-Rushing, A.J.; Lloyd-Evans, T.L.; Primack, R.B.; Satzinger, P. Bird migration times, climate change, and changing population sizes. Glob. Change Biol. 2008, 14, 1959–1972. [Google Scholar] [CrossRef]
Disclaimer/Publisher’s Note: The statements, opinions and data contained in all publications are solely those of the individual author(s) and contributor(s) and not of MDPI and/or the editor(s). MDPI and/or the editor(s) disclaim responsibility for any injury to people or property resulting from any ideas, methods, instructions or products referred to in the content. |
© 2023 by the authors. Licensee MDPI, Basel, Switzerland. This article is an open access article distributed under the terms and conditions of the Creative Commons Attribution (CC BY) license (https://creativecommons.org/licenses/by/4.0/).