Abstract
The idea of a walkable city refers to the extent to which the built environment encourages people to walk by establishing comfortable pedestrian routes, which allows people to connect to numerous services with reasonable effort and time. Walkability is currently regarded as a “good to know about” rather than a “must-have” factor for sustainable development. A combination of walkability with a standard design strategy, such as generative design, may result in a more efficient way of planning a walkable city. Interestingly, the sole indicator taken into account for walkability in the generative design domain is “distance to amenities”, while in reality, other parameters, such as the comfort factor, could also influence walkability. Therefore, in this research, we developed a workflow based on the generative design, which considers the comfort dimension in combination with distance to amenities and street-level greeneries. We also included the human perspective, given that walkability is always personal. This research successfully generated three different scenarios of walkability-optimal urban plans, where the highest walkability is 82.43 (very walkable). Furthermore, the baseline scenario of two different locations also aligns with people’s perspectives when compared. In addition, we found that the inclusion of a temporal dimension, enhanced 3D-related indicators, and constraints should benefit future research.
1. Introduction
1.1. Background
Pedestrian-friendly settings are crucial for developing healthy and productive communities. This might be accomplished by increasing walkability within the urban setting through a more consistent and strategic placement of amenities, such as improved transportation options [1]. Higher walkability between neighbourhoods and their facilities may minimise the demand for private vehicles, resulting in fewer carbon emissions and lowering people’s health risks associated with a lack of activities [2,3]. Furthermore, allocating a strategic location for amenities may promote walkability since individuals can easily access a range of essential amenities nearby. As a result, it reduces their reliance on autos, improves liveability, and implies a lower BMI by lowering people’s reliance on automobiles [4]. People are more inclined to drive private cars in many metropolitan cities worldwide, such as Amsterdam, London, Cairo, Istanbul, Jakarta, and Sofia (Bulgaria), which produces high particulate matter concentrations [5,6,7]. As a response, the Sofia municipality intends to encourage walkability to address the air pollution problem. This enhances the idea of a walkable city that fits perfectly with Sofia’s Green City Action Plan initiatives.
Urban planning is a fundamental discipline that allows for improving walkability through sustainable urban development planning. It governs and regulates cities’ physical development and expansion in general [8,9]. Although walkability has the capacity to be an essential factor that influences urban design, presently, it is primarily used for design assessment rather than as a design goal [10]. Given this restricted implementation, walkability is more of a “good to know about” than a “must-have” benchmark for urban design. Walkability should be included in the general process of urban design to overcome this problem.
The generative approach has become increasingly popular recently among urban designers. In generative design, optimisation techniques are combined with essential parametric models to create near-optimum solutions corresponding to predetermined criteria [11]. By producing several near-optimum solutions, generative design may serve as a digital twin platform for discussions among stakeholders to assist them in making smarter decisions [12]. Considering the walkability-optimal design, a generative design algorithm can also be used. However, at this point, the generative design algorithm for walkability only includes one leading indicator: the distance to amenities [13,14]. In this case, amenities referred to locations where individuals might be doing errands, such as a school, an office, a park, a grocery store, and a retail store. People would feel more convenience if the amenities were closer to them since they could conduct their errands in a reasonable amount of time and effort [15,16].
Recent studies have shown that the idea of a walkable city should take comfort into account, including “distances” as one of its aspects [17]. People’s perception of a location’s walkability may be influenced by providing a sense of comfort and may even encourage them to walk further. Street-level greenery is one of the most common indicators of comfort. Since they provide shade and greenery, street-level greeneries play a significant role in walkable environments, improving people’s willingness to walk by offering aesthetic appeal and a sense of comfort [18]. Thus, combining street-level greenery and distance to amenities indicators to represent comfort should better represent walkability.
Walkability is also highly personal aside from being shaped by its built environment. Daily routines and cultural backgrounds could therefore shape how someone recognises their ability to walk and how they behave. Furthermore, while analysing walkability, several indicators are often included, such as connectivity, street-level greeneries, sun shade, noise level, and density. Nevertheless, it is practically hard to generalise which indicator is more relevant to people. It has also been shown that persons from various backgrounds have differing perceptions of walkability [19].
In conclusion, designing a walkable city should include quantitative analysis and the human perspective. Furthermore, this research aims to produce walkability-optimal urban plans by developing a workflow for strategically placing amenities and street-level greenery, which also considers the human perspective. In addition, this research would contribute to the walkable city planning process based on generative design, comfort dimension, and qualitative aspects by developing multiple scenarios to assist the decision-making process.
Furthermore, the research is organised as follows: A literature review and problem analysis of the walkability assessment in the prior research are the first steps considered in this research to identify the research gap and walkability assessment method. Alongside the workflow creation, this research evaluates how the distance to amenities and street-level greenery may be integrated with human viewpoint input on the generative design domain. The validation of the workflow is required through the implementation of the proposed workflow in the study area (Krastova Vada) and generating walkability-optimal urban plans. The human perspective is considered by carrying out a walkability preference survey among Sofia citizens, and the result is incorporated within the workflow. Additionally, the proposed workflow is also implemented in a different location within the “Lozenets” district in order to compare this research’s preliminary walkability score with the walking experiences of the people there.
1.2. Literature Review
The use of the index has been demonstrated in previous walkability assessments. Different components (design, diversity, and density) have been combined to define a neighbourhood’s “walkability level” in the process of measuring walkability. For example, Frank et al. (2010) assessed walkability by developing a walkability score comprised of four components: residential density, retail floor area ratio, intersection density, and land-use mix [20]. Other criteria and combinations were also used to create the walkability index; for example, (1) Glazier et al. (2014) measured walkability in Toronto, Canada, using population density, housing density, roadway connectivity, and retail locations and services within a 10 min walk of census tract centroids, and (2) Deng et al. (2020) also developed a synthetic walkability index based on a computational framework using open-source data that is effectively applied in a metropolitan area with small cities [21,22]. Walkscore (available at www.walkscore.com, accessed on 21 January 2022) is another widely used index for assessing walkability [23]. Walkscore is a North American walkability metric that employs Dijkstra’s method. It is a rating that acknowledges and rewards actions at the building and street level by determining the quickest path to amenities from residential areas and the street network’s availability [13].
Most of the walkability assessments stated above are performed in the GIS domain. Despite that, some academics also tried integrating walkability assessments into the mainstream design process termed generative design. Integrating walkability with generative design should be advantageous. Because generative design may present numerous scenarios based on analysing near-optimal alternatives, it can serve as a conversation tool for stakeholders in the decision-making process. However, the fundamental restriction of walkability in the generative design is the restricted use of indicators to describe walkability. To the best of our knowledge, it is simply based on one criterion: distance to amenities.
Koo et al. (2022) estimated walkability based on comfort using the GIS approach. The goal is to discover the link between walkability and comfort factors such as street-level greenery, the availability of street furniture, and noise using “Walkscore” data. As a result, “comfort” impacts people’s overall judgments of walkability, thereby potentially contributing to their walking activity. They also found that incorporating street-level indicators (e.g., street-level greeneries) and macroscale (e.g., density, distance to amenities) variables would provide a more comprehensive representation of walkability. This finding can provide clear direction on, for example, tree ordinances, and transit planning can be used to promote more walkable environments [17]. This research, however, did not provide us with how their findings can develop into alternative scenarios for stakeholders. Walkability evaluations are also conducted within the qualitative area. Researchers are driven to evaluate walkability from a human standpoint. People’s perceived walkability may be influenced by factors other than the physical environment, such as their daily activities, cultural background, and even the behaviour of their neighbours [24]. Similarly, Arvidsson (2012) revealed that persons from diverse cultural origins and urban environments had varying opinions of walkability, demonstrating the need to include human perspectives in walkability evaluation [19].
In summary, it can be stated that walkability assessment implements the index approach while being restricted to the distance to amenities in the generative design area. Furthermore, walkability evaluation may be performed using the “comfort” factor, and the human viewpoint is vital in walkability assessment.
2. Materials and Method
2.1. Study Area and Data Description
The city of Sofia is chosen for this research because it is a typical and heavily urbanised capital city with a preponderant use of automobile transportation. The focus is on one of the newest neighbourhoods, Krastova Vada, where many challenges have arisen due to the construction of new residential buildings without considering other infrastructure. Construction of single-family dwellings, gated communities, and, to a lesser degree, industrial and commercial structures is growing more and more prominent in the Krastova Vada sector. In the following years, the development of essential highways, particularly Todor Kableshkov Boulevard from the Gotse Delchev quarter to the Vitosha quarter, will significantly improve the transportation infrastructure. Given this quarter’s substantial growth, careful planning is essential to connect the built environment with the Green City Action Plan [25].
As shown in Table 1, the type of data used in this research are vector and images identified as necessary based on our literature review (see Section 1.2). These data were obtained from cadaster and remote sensing.

Table 1.
Data description.
2.2. Proposed Workflow
This section outlines the proposed workflow for the strategic placement of amenities and street-level urban greenery, including a human perspective through a planned walkability survey. The critical components of the proposed workflow are shown in Figure 1.
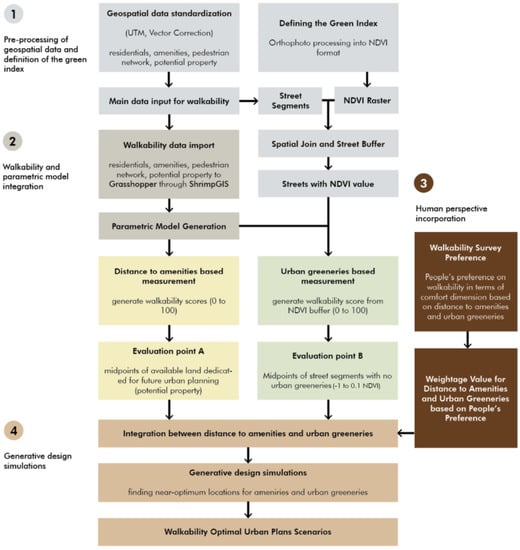
Figure 1.
Overview of the proposed workflow.
2.2.1. Preprocessing of Geospatial Data and Definition of Green Index
The preprocessing of the geospatial data was necessary to prepare data for application by data filtering (remove null values and unnecessary attributes), transform the shapefiles coordinate system into WGS84, and correct the vectors (remove incorrect overlapping lines). Street networks (pedestrian street vectors in the neighbourhood), residential buildings, amenities, and the Normalized Different Vegetation Index (NDVI) along the street were established to quantify walkability based on comfort. The NDVI is a remote-sensing-derived objective indicator of relative overall greenness associated with vegetation cover. It determines green quality and intensity by measuring the difference between the near-infrared light (part of the electromagnetic spectrum vegetation reflects) and the red light (part of the EM vegetation absorbs) in healthy plants. Thus, NDVI along the street was used to represent the street-level greenery. The category of amenities was defined to include grocery stores, food vendors (restaurants, cafés, and bars), schools (for education), offices, parks, health facilities, retail stores (for clothing, hardware, music, and books), sports clubs, movie theatres, libraries, and public transportation hubs.
The calculated NDVI is the foundation for the green index. The orthophoto image is used to calculate NDVI according to Formula (1)
where
- IR = the spectrum in the near-infrared section;
- R = the spectrum in the red section.
To construct the street with an NDVI score, the obtained NDVI raster is spatially joined with a 4 m buffer of street segments from the pedestrian network. Since the aim was to evaluate the greenery along the pedestrian street, the 4 m buffer of the pedestrian network was selected to represent the length of tree coverage along the pedestrian network [26]. The general area of the pedestrian network was included in this buffer.
2.2.2. Walkability and Parametric Model
The data input was imported (see Table 1 and Section 2.2.1) to the parametric modelling software (Grasshopper) and the data were processed in compliance with the walkability analysis requirements (same coordinate system, no null values, no topological error), the data input from the earlier step was used to construct the parametric model (e.g., polylines to brep). The distance to amenities and street-level greeneries were utilised as indicators to generate the parametric model. Two walkability scores were first derived based on these two indicators, respectively. The score is calculated from the indicator of the distance to amenities between 0 and 100 (a higher score means higher walkability). The walkability score was developed with evaluation point A based on the distance to amenities. The midpoint of the available land committed to future urban development was designated as evaluation point A. For the generative design algorithm, evaluation point A represents available land that will be analysed and chosen as the future location of strategic amenity placement.
In order to prevent fallacies, the distance to amenities is calculated independently depending on each category of amenities. For instance, if all amenities are considered simultaneously, a particular residential building may have a high walkability score despite being only close to parks and far from other amenities such as grocers or schools. Combining these different amenities was necessary to create the baseline walkability score. A weighted values formula was utilised based on each amenity’s importance. The importance of amenities may be perceived differently based on the locality; thus, this second part of the workflow also incorporated the human perspective (see Section 2.3.2).
The walkability score of street-level greenery indicators derived from the NDVI ranges from 0 to 100. After that, the walkability score based on street-level greeneries was developed with evaluation point B. The midpoints of the street segments with little to no greenery constitute evaluation point B (−1 to 0.1 NDVI). In order to strategically allocate street-level greenery for a generative design algorithm, evaluation point B is required.
2.2.3. Integration of Indicators and Human Perspective
Considering that the urban street-level greenery and distance to amenities serve as walkability indicators in this research, their integration was crucial. Currently, the approach to quantify comfort based on combining indicators by their weighted average yields Formula (2) [15].
where
- WI = integrated walkability score;
- WF1 = distance to amenities values;
- WF2 = street-level greeneries values;
- NF1 = weighted value for distance to amenities;
- NF2 = weighted value for street-level greeneries.
This method has several drawbacks: (1) In diverse contextual settings, it is nearly difficult to tell which indicator is more significant than the other, and (2) walkability is heavily influenced by personal preference and societal practices. We are unaware of other solutions that may integrate various walkability indicators based on comfort to address these limitations. Despite the limits of the integration method, the human perspective is seen to be highly important in walkability; thus, it must be considered. Therefore, we performed a walking preference survey to obtain people’s preferences to establish the weighted values for each indicator in the formula. Four primary points should be included in the workflow as essential information from the survey: (1) the people’s residential location, (2) the people’s daily walking experience, (3) the perceived importance between distance to amenities and street-level greeneries that is based on people, and (4) the people’s perceived importance between various categories of amenities.
People’s perceived walking experiences are essential because they qualitatively indicate the state of the underlying “walkability level” in their neighbourhood; hence, a crosstabulation between walking experience and residential location is performed. Thus, from the locals’ perspective, we might be able to determine how walkable each residential neighbourhood is at the moment. The suggested workflow does utilise this information as a validation tool to verify whether it resembles the actual condition. A walkable neighbourhood should also encourage people to walk by having a pedestrian street that offers them a pleasant walking experience.
2.2.4. Generative Urban Design
The parametric model and optimisation were the two critical parts of the generative design. In order to produce near-optimum solutions for the strategic placement of amenities and street-level greenery, generative design algorithms are based on integrating both indicators (distance to amenities and street-level greenery). The walkability score, generated from both indicators, was the objective function. There has to be a parametric model component to compose a walkability score based on indicators. When a generative design algorithm is used to create walkability-optimal urban designs to reflect the optimisation component, the algorithm should be able to propose multiple alternatives, such as placements for amenities and the placement of street-level greeneries.
The near-optimum solutions in the generative design are produced by an optimisation component that consists of a sequence of “the fittest selection” (see Figure 2). Creating populations of solutions was the first step in the optimisation process. In our situation, the population of solutions refers to a set of solutions produced by computing the accessible options and pairings of evaluation points A and B as the decision variables. The population of solutions from the previous section is estimated to meet specific objective functions in the following section entitled “estimating objective functions”. These solutions were then graded in order of best to worst. Therefore, based on our objective functions, the fittest solutions were chosen and designated as the “near-optimum solution”. Lists of near-optimal solutions represent the stakeholders’ options for developing and implementing walkability-optimal urban plans.
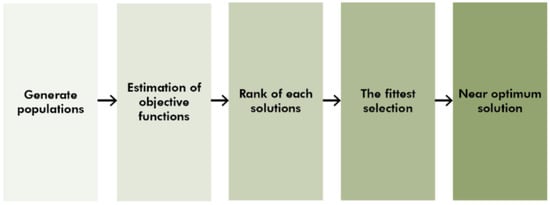
Figure 2.
Optimisation approach.
In this research, a near-optimal location for amenities and street-level greenery was discovered using the generative design algorithm, which took into account the prior input of evaluation point A, evaluation point B, and the integrated walkability score (see Figure 3). This is further elaborated on in Section 2.3.4 and Section 2.3.5.
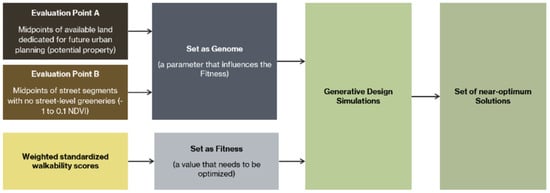
Figure 3.
Generative design algorithm workflow.
2.3. Workflow Implementation
2.3.1. The Initiation of a Parametric Model
The essential geographical input data for walkability were loaded into the Grasshopper as the parametric modelling program using a ShrimpGIS plug-in (available in Food4Rhino). The complete Grasshopper workflow is available in Appendix A. The residential buildings, amenities, and potential property were represented as polygons once the geospatial data with the *.shp format were imported into Grasshopper and transformed to a *.brep (boundary representation) format. Lines were used to illustrate the pedestrian network, which was later transformed into polylines. For buildings, it is crucial to provide a Z-unit (height) to create the 3D buildings based on the converted geometries and geospatial data attributes.
2.3.2. The Distance to Amenities Indicator
The shortest distance was calculated by factoring in the distances among nodes between the starting places and the objective. The beginning point for this study was the closest point to residential buildings on the street, and the main objective was the point closest to amenities, as illustrated in Figure 4 below. The residential midpoints, pedestrian network, and amenity midpoints were the three key data inputs explicitly required for the distance to amenities indicator. The data were combined into the ShortestWalk plug-ins to run the A* algorithm and identify the shortest distances between each residential building and amenities after establishing the beginning point and the primary objective with a street network. A* algorithm is an extension of Dijkstra’s algorithm that searches the shortest path from a given starting node in a network to the objective node using a heuristic function [13]. The ShortestWalk should also contain an empty evaluation point A (midpoints of potential lands for future urban development) that is utilised for the generative design algorithm.
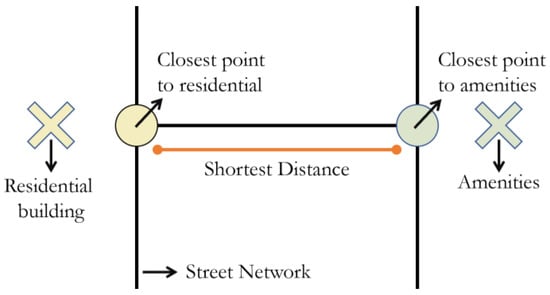
Figure 4.
Overview of shortest distance calculation.
Once the shortest distances have been determined, standardisation should be performed to provide a range of values from 0 to 100 with the addition of reward and punishment. If the distance is less than 400 m, a straight 100 score is awarded, indicating that it takes less than 5 min to walk there. In contrast, if the distance is more significant than 2400 m, an instant 0 score is provided, indicating that it takes more than 30 min to walk there. The amenities were calculated separately based on their category because each category of amenities had a distinct weight in the eyes of the public. The walking preference survey, which includes amenities preference, was performed and implemented (see Section 3.1.3).
2.3.3. Street-Level Greeneries Indicator
The workflow for the street-level greeneries indicator began with the normalisation process of NDVI on the generated streets with the NDVI score data. The presence of greenery and walkability were discovered to have a nonlinear connection. At 0.4 NDVI, the correlation between greenery and walkability was at its peak; it then began to decline until 0.6 NDVI. This research’s NDVI normalisation process separated the NDVI into four classes, as shown in Table 2.

Table 2.
NDVI classification.
The penalty was established in the fourth class because walkability is adversely correlated with an NDVI value of more than 0.6. In suburban regions, which frequently have poor walkability, there is a negative correlation between walkability and denser street-level greeneries (>0.6), and greater crime rates are observed in places with denser street-level greeneries (about 0.8 NDVI) [27].
2.3.4. Unification of Distance to Amenities and Street-Level Greeneries with the Human Perspective
To account for people’s preferences among the indicators of the comfort dimension, a value of 0.55 was weighted to the distance to amenities, and a value of 0.45 was weighted to the street-level greenery, as detailed in Section 3.1.2. Formula (2) in Section 2.2.3 serves as the foundation for integrating the indicators. The integration of the distance to amenities, street-level greeneries, and human perspective results in a baseline walkability score of 56.93. According to the Walkscore.com® categorisation, this walkability score falls into the “Somewhat Walkable” category, indicating that certain errands may be completed on foot [28].
2.3.5. Generative Urban Design Algorithm
The generative design algorithm workflow considered the input of evaluation point A and evaluation point B, as well as the unification of the walkability score based on the preceding method, to select a site for the placement of amenities and street-level greenery (see Section 2.3.2 and Section 2.3.3). Fitness and Genome served as the inputs for generative design algorithm, especially in Grasshopper. Fitness served as the primary objective function aim to obtain in the form of an optimal value. Genome simultaneously served as the decision variable in the form of fitness-related characteristics. Given that they are the midpoints of land that are eligible to function as a location for amenities or street-level greenery, evaluation points A and B served as the Genome in this study. The placement of amenities or street-level greenery ought to be capable of altering the walkability score by yielding different results for each location. The integrated walkability score also functioned as the fitness score since the research goal is to have the maximum walkability score, which signifies an improvement in walkability to develop walkability-optimal urban planning.
Two hundred locations in the Krastova Vada can be used for amenities, serving as evaluation point A. In total, 66 street segments can be used to establish street-level greenery, which serves as evaluation point B. Three distinct situations, as shown in Figure 5, comprise the optimisation process in the generative design algorithm:
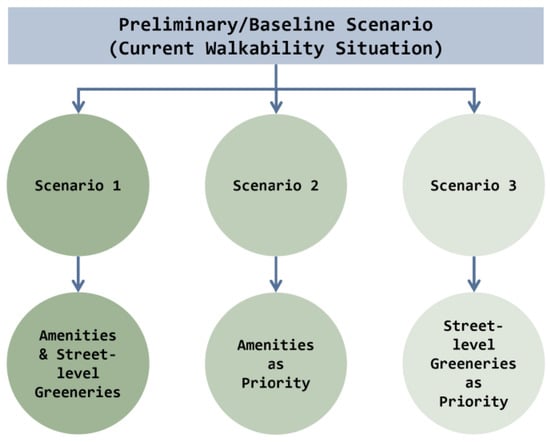
Figure 5.
Walkability scenarios.
- Identify seven places for amenities that correspond to the seven amenity types, then seven different street segments for street-level greenery that correspond to the selected amenities (scenario 1).
- Identify seven locations for amenities and four street segments for street-level greenery when implementing amenities is more advantageous to the stakeholders (scenario 2).
- Identify four locations for amenities, then seven street segments for street-level greenery, in the event the stakeholders are more in favour of greenery (scenario 3).
Although more specialised scenarios should have been further implemented based on a discussion with the stakeholders, we could not do so due to the time limitation. Nevertheless, these three scenarios should prove that implementing the generative design algorithm in the walkability domain can assist the decision-making process.
Following factorial Equation (3) to determine the number of solutions that may be implemented, there could be around 2.3 × 10¹² options if just seven places for the placement of amenities are used. In addition, there might be around 778,789,440 different outcomes for a situation where seven street segments are established to place street-level greenery. In this wide range of possible solutions, the generative design will inevitably be beneficial when creating walkability-optimal urban plans.
where
- nCr = number of possible combinations;
- n! = total number of items;
- r! = number of items being chosen.
3. Results
3.1. Walking Preference Result
In 4 weeks, the walking preference survey successfully obtained information from 55 respondents, and the respondent age group distribution is available in Appendix B. The four primary points of the survey are mentioned in Section 2.2.3, while the full version of the survey on walking preferences is available in Appendix C.
3.1.1. Walking Experience and Residential Location
According to Table 3, the Ovcha Kupel (1.80% of respondents) had the most unpleasant walking experiences, with a 0 (worst experience) score. Ovcha Kupel’s residential area is reportedly far from the city centre and amenities. The Studentski district, populated mainly by students without access to private transportation, has the most outstanding walking experience (6.6), with 9.10% of respondents. Additionally, respondents from Vitosha (21.80%) and Izgrev (12.70%), the top two districts, said that their walking experiences were 5.42 (neutral-to-good) and 6.57 (good), respectively. In comparison to other districts, these two are noted for being closer to the city centre, having amenities close by, and having adequate pedestrian infrastructure.

Table 3.
People’s average walking experience for each residential quarter.
3.1.2. Walking Preference
As shown in the survey results in Table 4, respondents considered the distance to amenities seemingly higher (7.94) than the distance to street-level greenery (7.6). As a consequence, in comparison to street-level greenery, the distance to amenities is considered to be a more meaningful indicator of the comfort dimension. Al Shammas and Escobar’s study (2019), which similarly sent a questionnaire to specialists in walkability to assess several walkability parameters, likewise arrived at the same conclusion. Conforming to the study, the value of accessibility was 7.94, and the relevance of shade (greenery) was 6.80 [11]. Therefore, as a practical matter, the weighting of the distance to amenities indicator should be somewhat more significant in the overall condition than that of the street-level greeneries. To accommodate people’s preferences, a weighted value of 0.45 was assigned to street-level greenery, and a weighted value of 0.55 was assigned to the distance to facilities.

Table 4.
The importance of each indicator from people’s perceptive.
However, it was discovered when more specific questions were asked (such as how many minutes are you willing to walk within dense street-level greeneries) that a longer distance to amenities indicates that street-level greeneries are more essential. Contrarily, fewer street-level greeneries appear to suggest that shorter distances to amenities are more essential. People are willing to walk for 11 to 30 min when there is moderate street-level greenery (880 m to 2400 m). When there are fewer green spaces, people will only walk for a maximum of 20 min (1600 m), but when there are more dense urban green spaces, people will walk for up to 30 min (>2400 m). Although some people’s willingness to walk overlaps, it is nevertheless important to note that denser street-level greenery increases their willingness to walk for extended periods. Street-level greenery is one of the crucial elements in increasing people’s willingness to walk. This information could be provided to the government, stakeholders, and the Sofia Green City Action Plan board. Pun-Cheng and So (2019) also discovered that pedestrians’ perceptions of greenery as a comfort-related element are crucial. As a result, the research recommended that policymakers consider enhanced greenery in pedestrian walkways [29].
3.1.3. Amenities’ Preference
The distance to amenities is intended to be calculated separately, as indicated in Section 2.3.2. The base walkability score is calculated by allocating a weight to each amenity according to its significance. Every location has a distinct perception of specific amenities’ importance. Thus, this proposed workflow takes that into account, which resulted in gathering people’s preferences in the survey concerning several types of amenities included in the research. A weighted value was allocated to each amenity category, as seen in Table 5, by considering the average and median perceived importance by survey respondents. The medical centre obtained the lowest relevance among the other categories, with an average of 5.33 and a median of 5, giving it the lowest weighted value in comparison with the other categories, which were given the highest weighted values since they obtained the highest importance, such as public transportation (AVG: 7.42, MED: 8) and the park (AVG: 7.62, MED: 8). As for the industrial category, office, and school, they were given the same average value because of the little difference in their averages, which indicates the same perceived significance.

Table 5.
Category of amenities’ perceived importance.
3.2. Generated Scenarios Based on Workflow Implementation
The implementation of the generative design algorithm, covered in Section 2.3.5, allowed for the generation of numerous amenities and street-level greenery locations, raising the neighbourhood walkability score. If one indicator is more favourable, applying several scenarios in the generative design algorithm should produce various options. Suppose their core scenario has features the stakeholders are unwilling to compromise on, in that case, they might explore these alternatives or possibly come to a compromise (e.g., having to trim or grow new trees). The generative design algorithm displays multiple near-optimal solutions in Table 6 based on the specified scenarios. The stakeholders can organise a conversation based on these prospective scenarios to choose the best alternative to be implemented according to their aims and interests to improve the neighbourhood’s walkability.

Table 6.
Different scenarios based on generative design algorithm.
Figure 6, Figure 7, Figure 8 and Figure 9 present the walkability score 3D maps of the baseline, scenario 1, scenario 2, and scenario 3. The baseline 3D scenario, as seen in Figure 6, is the initial walkability score of the study area where most of the residential buildings are visualised within the average walkability score, corresponding to its walkability score (56.93 out of 100). Residential buildings shifted into the range of high walkability scores after the thoughtful placement of amenities, and street-level greenery was implemented (Figure 7, Figure 8 and Figure 9), which corresponds to their walkability score (see Table 6). In addition, Figure 10 presents the 3D map of amenities to show the different categories of amenities in the neighbourhood since Figure 6, Figure 7, Figure 8 and Figure 9 present the amenities as one category to avoid confusion.
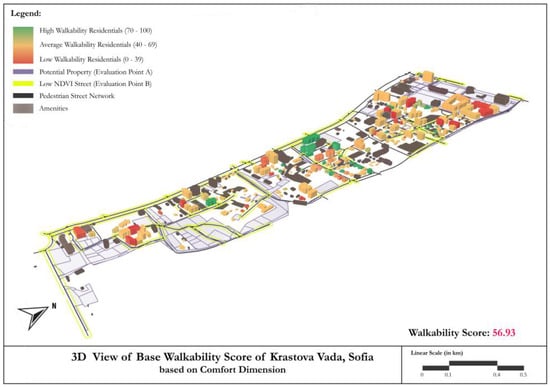
Figure 6.
Base walkability map of Krastova Vada, Sofia.
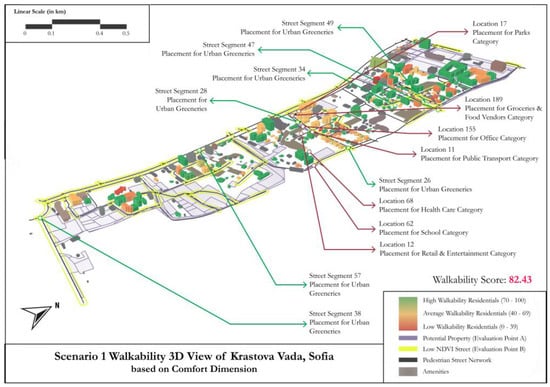
Figure 7.
Scenario 1 Walkability Map Krastova Vada, Sofia.
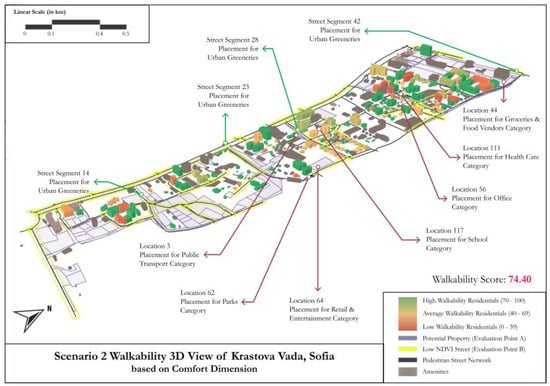
Figure 8.
Scenario 2 Walkability Map of Krastova Vada, Sofia.
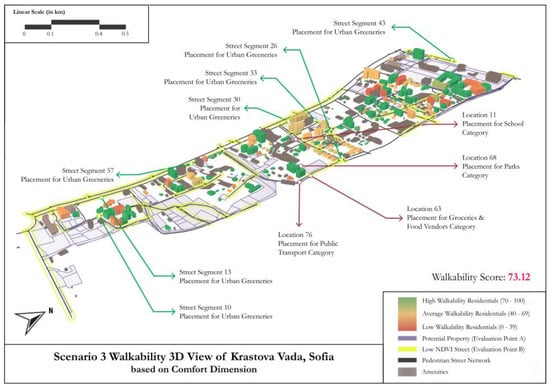
Figure 9.
Scenario 3 Walkability Map Krastova Vada, Sofia.
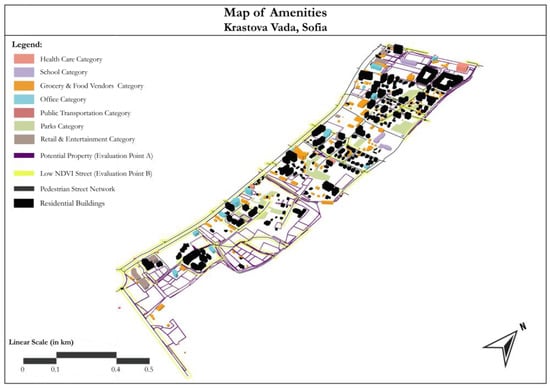
Figure 10.
Map of Amenities, Krastova Vada, Sofia.
3.3. Scenario Comparison
Table 6 above demonstrates that scenario 1 has the highest walkability score. This is most likely to happen given that more locations and street segments are developed in this scenario than in other scenarios, courtesy of the placement of seven amenities and seven street-level greeneries. Compared to scenario 3, which has the lowest walkability score, scenario 2 has the second-highest walkability score. Considering amenities are assigned more weight than street-level greenery, scenario 2 may have received a better score since scenario 3 favours more street-level greeneries. In contrast, scenario 2 gives more placement of amenities.
Furthermore, each suggested location or street portion contains elements that may be investigated further throughout the decision-making process. The stakeholders may discuss trading the walkability score for specific neighbourhoods or street features that better fit their objectives and regulations. For instance, scenario 1’s office (Location 155) is placed on a vacant lot with much vegetation. At the same time, the chosen sit of scenario 2’s office (Location 56) is an empty lot devoid of any vegetation (dry area). Therefore, to proceed with scenario 2, which has a lower walkability score, the stakeholders must swap the walkability score for carbon storage to maintain the carbon storage within that vegetation.
3.4. Workflow Validation
The walkability level of a neighbourhood is now reflected in people’s walking experience ratings. The data from the walking experience may be helpful as a validation tool. To guarantee the dependability of the proposed workflow, validation is crucial. The Lozenets district was selected for validation since it is close to Krastova Vada, with a larger geographical area and is an upmarket and densely populated neighbourhood surrounded by public parks. The proposed workflow implementation in Lozenets resulted in a preliminary walkability score of 61.79, which falls into the “Somewhat Walkable” category. Figure 11 provides a 3D map of the Lozenets district with its base walkability score. Despite the fact that some of the residential buildings are clearly in the high walkability category, the bulk of the residential buildings on this figure are in the average walkability level. This image represents the Lozenets base walkability score (61.79 out of 100).
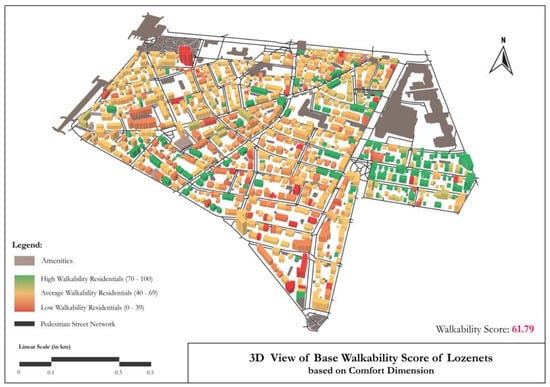
Figure 11.
Base walkability map of Lozenets, Sofia.
The base walkability score for the two neighbourhoods is shown in Table 7, and it aligns with the walkability score derived from people’s actual walking experiences. The variations in these walkability ratings, however, can be the result of people’s small overestimations or underestimations of the occurring walkability of their neighbourhood. There could also be another indicator influencing how people perceive walkability that this research did not include. Additionally, the survey’s unequal distribution of the age groups might be another factor contributing to these disparities since people in different age groups may have different walking behaviours. Despite that, all walkability ratings fall into the same category of “Somewhat Walkable” despite these minor variations. In conclusion, the proposed workflow seems to align with how people genuinely experience walking based on how it is implemented in the second neighbourhood.

Table 7.
Comparison between people’s walking experience and proposed workflow walkability score.
4. Discussion
The generative design approach to quantify walkability presented in the previous papers [13,14] is only based on a quantitative approach, which considers the distance to amenities. It would be feasible to incorporate another indicator for the comfort dimension into the workflow, representing a more comprehensive definition of walkability to be added later. In contrast, this research presented a generative design approach for walkability based on the comfort dimension, which also considers street-level greeneries and distance to amenities. This shows that the proposed workflow works multidimensionally and opens an opportunity to include additional indicators in the future. It is necessary to ensure that the optimal value of the included indicator is known, which is one of the primary reasons for integrating distance to amenities and street-level greeneries as comfort dimensions. In addition to the generative design approach, other indicators that reflect the comfort dimension have been employed in previous research, including noise, shade, street furniture, and building ratio [15,30]. However, the optimum values of these indicators related to walkability have not yet been identified.
The consideration of the human perspective is also a highlight of this research’s proposed workflow, which also represents the local context, to address the personal aspect of walkability, as walking behaviour depends on a person’s cultural background, geographical area, and personal preferences. The walking preference survey reveals whether people prefer shorter distances or more densely vegetated areas for their overall comfort. In comparison to other research, including a qualitative walkability assessment might have a more considerable influence than not doing so. It is also beneficial to consider and comprehend the existing walkability situation from a human standpoint [24,31]. When this procedure is applied to another site, the weightage value still has to be updated to accommodate the local population’s behaviour. The walking preference survey should continue to be performed continuously.
The adoption of the proposed workflow also demonstrates that the placement of amenities and street-level greeneries increased the walkability score, hence increasing the neighbourhood’s walkability. The generation of near-optimum scenarios out of a million possibilities also demonstrates the potential of the proposed workflow, which is the primary objective of this study, and the introduction of generative design into the urban planning process as a conversation tool for policymakers, stakeholders, and other parties concerned. The proposed workflow has proven to be more efficient compared to the walkability study without a generative design approach and implementation and with limited scenarios. However, more discussions with stakeholders are required to define constraints to develop more credible scenarios that better depict the actual circumstance. It is also important to note that strategic planning of a location for various kinds of amenities and areas for street-level greeneries’ installation is required to boost a neighbourhood’s walkability. Therefore, the contribution of this research is that the proposed workflow has the ability to generate near-optimum scenarios out of a million possibilities to assist in the decision-making process by considering the qualitative and quantitative aspects of walkability that are not presented in the previous research.
Additionally, the 3D model performs better when compared to the 2D outputs. When adding the location of amenities and street-level greeneries to the model, the evident change is presented through the colour of residential buildings (e.g., from orange to green) in the 3D view of each scenario, compared to the base walkability map. It becomes clear that the proposed workflow’s implementation in this situation contributed to the improvement in walkability through the generative design algorithm. Furthermore, as indicated in Table 7, the workflow’s baseline walkability score and walking experience of the workflow are compared. Differences in walkability scores might be explained by people’s minor overestimation or underestimation of their neighbourhood’s current walkability level (main study area: 56.93 and second neighbourhood: 61.79, compared to 60 for Lozenet’s walking experience). Even if there are some minor discrepancies, all walkability scores still fall into the same category of “Somewhat Walkable”. In conclusion, based on its implementation in the second neighbourhood, the proposed workflow matches people’s walking experiences.
5. Conclusions
As a result, the presented approach demonstrates that walkability may be more than merely a “good to know about” assessment method. It can also be beneficial as a “must-have” design generation. The implementation of the proposed workflow reveals that the placement of amenities and street-level greenery contributes to improving the walkability score, which can be read as enhancing the neighbourhood’s walkability. A new range of walkability assessments in the domain of generative design have also been successfully produced by incorporating human perspective and street-level greenery.
The various scenarios created also demonstrate the potential of the proposed workflow, which serves as the primary objective of this research, and the inclusion of generative design in the urban planning process as a discussion instrument for the policymakers, stakeholders, and other parties involved. In order to develop more credible scenarios that more accurately reflect the actual circumstance, further engagement with stakeholders is necessary to identify constraints. Making scenarios that satisfy the stakeholders’ interests and adhere to Sofia’s building code regulation involves carefully establishing constraints. It is also crucial to recognise that strategic planning of a location for various amenities and locations to install street-level greenery is required to improve a neighbourhood’s walkability.
In addition, we found that the inclusion of a temporal dimension, enhanced 3D-related indicators, and constraints should benefit future research. We suggest that future research incorporates an extra dimension of several seasons or times of the day since the proposed workflow is multidimensional but is only based on a single season (summer) and excludes a difference in the time of day. To improve the proposed workflow’s representation of walkability, it is crucial to model a more genuine scene by including seasons or the time of day. At the same time, enhanced 3D-related indicators make it feasible to assess walkability by measuring and simulating the 3D factor, not only limited to the 2D factor, such as shade coverage or the street-to-building ratio. Last but not least, additional discussions must be held with stakeholders to decide the kind of constraint that can be implemented. Selecting a pertinent constraint ought to create walkability scenarios that are more precise and realistic.
Author Contributions
Conceptualisation, D.K.; M.K. (Mila Koeva); F.V.; D.P.A.; and M.K. (Monika Kuffer); methodology, D.K.; M.K. (Mila Koeva); F.V.; and D.P.A.; formal analysis, D.K.; M.K. (Mila Koeva); F.V.; and D.P.A.; writing—original draft preparation D.K.; final version review D.K.; M.K. (Mila Koeva); F.V.; D.P.A.; and M.K. (Monika Kuffer). All authors have read and agreed to the published version of the manuscript.
Funding
This research work was supported by the GATE project, funded by the Horizon 2020 WIDESPREAD-2018-2020 TEAMING Phase 2 programme under grant agreement no. 857155, by Operational Programme Science and Education for Smart Growth under Grant Agreement no. BG05M2OP001-1.003-0002-C01.
Data Availability Statement
The municipal enterprise Sofiaplan, which is in charge of the spatial and strategic planning for the Sofia Municipality and GIS-Sofia, provided the data for the research. The GATE Institute of Sofia University exclusively and confidentially uses the data for research purposes such as those in this research.
Conflicts of Interest
The authors declare no conflict of interest.
Appendix A
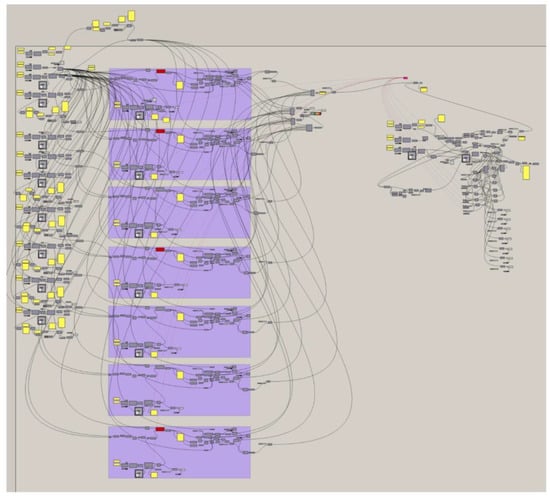
Figure A1.
Workflow implementation in Grasshopper.
Appendix B
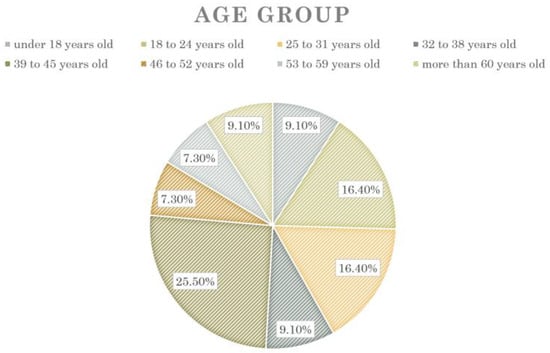
Figure A2.
Respondents’ age group distribution.
Appendix C
Walking Preference Survey of Sofia (Translated to Bulgarian version).
Opening:
My name is Dewi Kumalasari, and I have a master’s degree in urban planning and management from the University of Twente, the Netherlands. My dissertation is related to developing a methodology for moving in an urban environment. I am conducting this study to determine the importance of the distance to urban services and public access sites and the presence of greenery in pedestrian areas when choosing a way to move the citizens of Sofia.
The questionnaire will take only 5 min of your time. The entry of personal data is not required, and the answers received will not be shared with third parties. I appreciate your time and help, which will help me provide added value to my thesis.
Part 1: Introduction
Pedestrian walkability determines the extent to which the urban environment provides comfortable and safe movement for citizens, connecting them with various urban services and public facilities such as shopping and medical centres, schools and kindergartens, parks, tourist sites and more.
- Please indicate your usual way of getting around in Sofia
Walking
Cycling
Personal Car
Public Transport or Metro
Shared Car or Taxi
Others:
- 2.
- Please rate how comfortable you feel when walking (for example, if the footpath is too narrow, the walking experience is not good)
(0 to 10), where: 0 = worst experience, 10 = best experience
- 3.
- What age group do you belong to?
Under 18 years old
18 to 24 years old
25 to 31 years old
32 to 38 years old
39 to 45 years old
46 to 52 years old
53 to 59 years old
Over 60 years old
- 4.
- In which area of Sofia do you live?
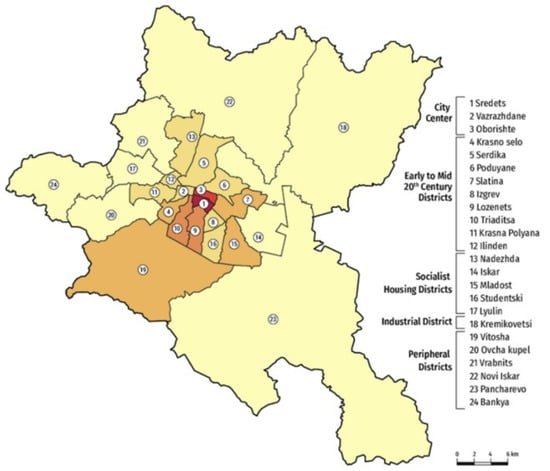
Figure A3.
Districts map of Sofia.
Part 2: Walking Preferences
When it comes to walking, what do you think is the importance of each of the following factors on a scale from 0 (Not important) to 10 (Very important).
Note: When it comes to walking, what do you think is the importance of each of the following factors on a scale from 0 (Not important) to 10 (Very important).
Note: The distance to city service and/or public access facility (e.g., school, office, park, grocery store, shopping centre) is the time it takes to reach them from your home. Urban greenery is a factor influencing the choice of walking, which is determined by the presence of greenery around you, which implies natural shade, better comfort and visual perception.
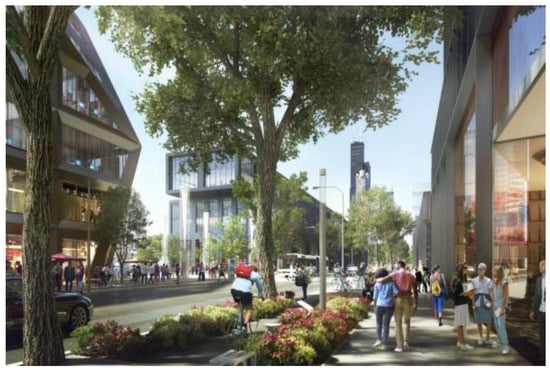
Figure A4.
Pedestrian illustration.
- How important is the distance to the place you want to reach when deciding whether to walk?
- 0
- (Not Important) to 10 (Very Important)
- 2.
- How important is the presence of greenery on the chosen walking route when deciding whether to walk?
- 0
- (Not Important) to 10 (Very Important)
- 3.
- How many minutes do you tend to walk to the place you want with less greenery?
Less than 5 min
5 to 10 min
11 to 20 min
21 to 30 min
More than 30 min
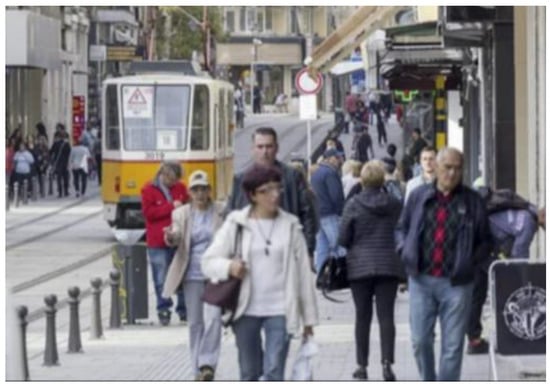
Figure A5.
Pedestrian with less greenery.
- 4.
- How many minutes do you tend to walk to the place you want in the presence of greenery?
Less than 5 min.
5 to 10 min
11 to 20 min
21 to 30 min
More than 30 min
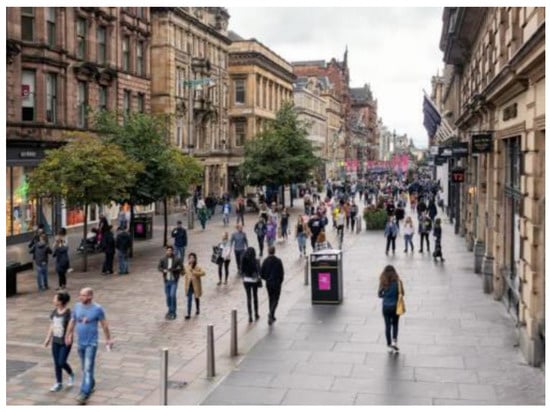
Figure A6.
Pedestrian with average greenery.
- 5.
- How many minutes do you tend to walk to the place you want in the presence of lots of greenery?
Less than 5 min
5 to 10 min
11 to 20 min
21 to 30 min
More than 30 min
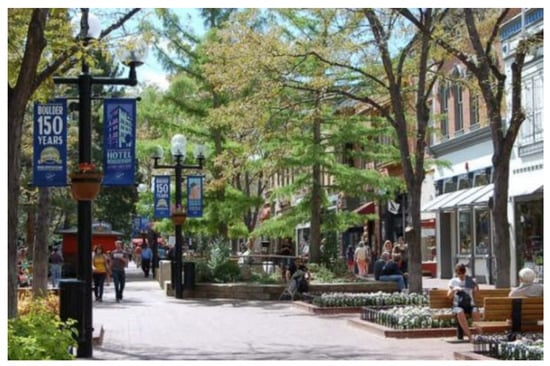
Figure A7.
Pedestrian with lots of greenery.
Part 3: Importance of accessibility to urban services and public access sites on foot
When choosing a walking route, the extent to which accessibility to each of the following public access sites influences your decision: (1) Grocery store, food supplier, restaurant; (2) School or office; (3) Park; (4) Medical centre; (5) Shopping centre; (6) Public transport/metro stop.
- Grocery store, food supplier, restaurant
- 0
- (Not Important) to 10 (Very Important)
- 2.
- School or Office
- 0
- (Not Important) to 10 (Very Important)
- 3.
- Park
- 0
- (Not Important) to 10 (Very Important)
- 4.
- Medical Center
- 0
- (Not Important) to 10 (Very Important)
- 5.
- Shopping Center
- 0
- (Not Important) to 10 (Very Important)
- 6.
- Public Transport/Metro
- 0
- (Not Important) to 10 (Very Important)
Closing:
Thank you for your participation!
Please leave a contact email if you would like to share more on the topic in the form of an interview.
References
- Zhang, X.; Mu, L. The perceived importance and objective measurement of walkability in the built environment rating. Environ. Plan. B Urban Anal. City Sci. 2020, 47, 1655–1671. [Google Scholar] [CrossRef]
- Erickson, L.E.; Jennings, M. Energy, Transportation, Air Quality, Climate Change, Health Nexus: Sustainable Energy is Good for Our Health. AIMS Public Health 2017, 4, 47–61. [Google Scholar] [CrossRef] [PubMed]
- Landrigan, P.J. Air pollution and health. Lancet Public Health 2017, 2, 4–5. [Google Scholar] [CrossRef]
- Baobeid, A.; Koç, M.; Al-Ghamdi, S.G. Walkability and Its Relationships With Health, Sustainability, and Livability: Elements of Physical Environment and Evaluation Frameworks. Front. Built Environ. 2021, 7. [Google Scholar] [CrossRef]
- Masoumi, H. Home-Based urban commute and Non-commute trip generation in Less-Studied Contexts: Evidence from Cairo, Istanbul, and Tehran. Case Stud. Transp. Policy 2022, 10, 130–144. [Google Scholar] [CrossRef]
- van Kampen, J.; Knapen, L.; van de Mei, R.; Pauwels, E.; Dugundji, E. Yearly Development of Car Ownership in Urban and Rural Environments. Procedia Comput. Sci. 2022, 201, 101–108. [Google Scholar] [CrossRef]
- Belgiawan, P.; Schmocker, J.; Fujii, S. Mass Effect and Car Ownership Motivations of Students in Jakarta and Bandung, Indonesia. In Proceedings of the 47th Japan Society of Civil Engineers Infrastructure Planning Conference, Hiroshima, Japan, 4–6 September 2013. [Google Scholar]
- Fainstein, S.S. Planning Theory and the City. J. Plan. Educ. Res. 2005, 25, 121–130. [Google Scholar] [CrossRef]
- Islam, S. Traditional urban planning approaches and sustainable city. Open House Int. 2011, 36, 15–23. [Google Scholar] [CrossRef]
- Masoumzadeh, S.; Pendar, H. Walking as a medium of comprehending contextual assets of historical urban fabrics. Urban Res. Pract. 2019, 14, 50–72. [Google Scholar] [CrossRef]
- Krish, S. A practical generative design method. Comput.-Aided Des. 2011, 43, 88–100. [Google Scholar] [CrossRef]
- Zhang, Y.; Liu, C. Parametric modeling for form-based planning in dense urban environments. Sustainability 2019, 11, 1–14. [Google Scholar] [CrossRef]
- Jakubiec, J.A.; Reinhart, C.F.; Dogan, T.; Rakha, T.; Sang, A. UMI-An urban simulation environment for building energy use, daylighting and walkability. In Proceedings of the Building Simulation, Chambery, France, 26–28 August 2013; pp. 476–483. [Google Scholar]
- Cichocka, J. Generative design optimisation in urban planning–walkability-optimised city concept. Architectures 2015, 1, 119–128. [Google Scholar]
- Al Shammas, T.; Escobar, F. Comfort and Time-Based Walkability Index Design: A GIS-Based Proposal. Int. J. Environ. Res. Public Health 2019, 16, 2850. [Google Scholar] [CrossRef]
- Irafany, S.A.; Wunas, S.; Trisutomo, S.; Akil, A.; Arifin, M.; Rasyid, A.R. Walkability index based on pedestrian needs in the Losari beach area of Makassar city. Indian J. Forensic Med. Toxicol. 2020, 14, 7936–7947. [Google Scholar] [CrossRef]
- Koo, B.W.; Guhathakurta, S.; Botchwey, N. How are Neighborhood and Street-Level Walkability Factors Associated with Walking Behaviors? A Big Data Approach Using Street View Images. Environ. Behav. 2022, 54, 211–241. [Google Scholar] [CrossRef]
- Ulmer, J.M.; Wolf, K.L.; Backman, D.R.; Tretheway, R.L.; Blain, C.J.; O’Neil-Dunne, J.P.; Frank, L.D. Multiple health benefits of urban tree canopy: The mounting evidence for a green prescription. Health Place 2016, 42, 54–62. [Google Scholar] [CrossRef]
- Arvidsson, D.; Kawakami, N.; Ohlsson, H.; Sundquist, K. Physical activity and concordance between objective and perceived walkability. Med. Sci. Sport. Exerc. 2012, 44, 280–287. [Google Scholar] [CrossRef]
- Frank, L.D.; Sallis, J.F.; Saelens, B.E.; Leary, L.; Cain, L.; Conway, T.L.; Hess, P.M. The development of a walkability index: Application to the Neighborhood Quality of Life Study. Br. J. Sport. Med. 2010, 44, 924–933. [Google Scholar] [CrossRef]
- Glazier, R.H.; Creatore, M.I.; Weyman, J.T.; Fazli, G.; Matheson, F.I.; Kaufman-Shriqui, V. Correction: Density, Destinations or Both? A Comparison of Measures of Walkability in Relation to Transportation Behaviors. Obesity and Diabetes in Toronto, Canada. PLoS ONE 2014, 9, e91485. [Google Scholar] [CrossRef]
- Deng, C.; Dong, X.; Wang, H.; Lin, W.; Wen, H.; Frazier, J.; Ho, H.C.; Holmes, L. A Data-Driven Framework for Walkability Measurement with Open Data: A Case Study of Triple Cities, New York. ISPRS Int. J. Geogr. Inf. 2020, 9, 36. [Google Scholar] [CrossRef]
- Habibian, M.; Hosseinzadeh, A. Walkability index across trip purposes. Sustain. Cities Soc. 2018, 42, 216–225. [Google Scholar] [CrossRef]
- Battista, G.A.; Manaugh, K. Generating walkability from pedestrians’ perspectives using a qualitative GIS method. Travel Behav. Soc. 2019, 17, 1–7. [Google Scholar] [CrossRef]
- Municipality of Sofia; ARUP; European Bank for Reconstruction and Development. The Green City Action Plan; EBRD Green Cities: Sofia, Bulgaria, 2020. [Google Scholar]
- Teshnehdel, S.; Akbari, H.; di Giuseppe, E.; Brown, R.D. Effect of tree cover and tree species on microclimate and pedestrian comfort in a residential district in Iran. Build. Environ. 2020, 178, 106899. [Google Scholar] [CrossRef]
- Shuvo, F.K.; Mazumdar, S.; Labib, S.M. Walkability and greenness do not walk together: Investigating associations between greenness and walkability in a large metropolitan city context. Int. J. Environ. Res. Public Health 2021, 18, 4429. [Google Scholar] [CrossRef]
- Walk Score. Walkscore®: Drive Less. Live More. 2013. Available online: www.walkscore.com (accessed on 21 October 2021).
- Pun-Cheng, L.S.C.; So, C.W.Y. A comparative analysis of perceived and actual walking behaviour in varying land use and time. J. Locat. Based Serv. 2019, 13, 53–72. [Google Scholar] [CrossRef]
- Galal, O.M.; Sailor, D.J.; Mahmoud, H. The impact of urban form on outdoor thermal comfort in hot arid environments during daylight hours, case study: New Aswan. Build. Environ. 2020, 184, 107222. [Google Scholar] [CrossRef]
- Raswol, L.M. Qualitative Assessment for Walkability: Duhok University Campus as a Case Study. IOP Conf. Ser. Mater. Sci. Eng. 2020, 978, 012001. [Google Scholar] [CrossRef]
Disclaimer/Publisher’s Note: The statements, opinions and data contained in all publications are solely those of the individual author(s) and contributor(s) and not of MDPI and/or the editor(s). MDPI and/or the editor(s) disclaim responsibility for any injury to people or property resulting from any ideas, methods, instructions or products referred to in the content. |
© 2023 by the authors. Licensee MDPI, Basel, Switzerland. This article is an open access article distributed under the terms and conditions of the Creative Commons Attribution (CC BY) license (https://creativecommons.org/licenses/by/4.0/).