Article

NPP Variability Associated with Natural and Anthropogenic Factors in the Tropic of Cancer Transect, China

1
School of Culture Tourism and Geography, Guangdong University of Finance and Economics, Guangzhou 510320, China
2
Southern Marine Science and Engineering Guangdong Laboratory (Guangzhou), Guangzhou 511458, China
3
School of Geography and Remote Sensing, Guangzhou University, Guangzhou 510006, China
*
Author to whom correspondence should be addressed.
Remote Sens. 2023, 15(4), 1091; https://doi.org/10.3390/rs15041091
Submission received: 1 January 2023 / Revised: 14 February 2023 / Accepted: 14 February 2023 / Published: 16 February 2023

Abstract

:
The regions near the Tropic of Cancer are a latitudinal geographical zone with typical climatic, topographic, and human landscape features. It is necessary to explore the region’s net primary productivity (NPP) dynamics as it combines complex topography, various vegetation types, and intense human activities. The study sets the transect near the Tropic of Cancer (TCT) and uses the Carnegie–Ames–Stanford (CASA) model to estimate the NPP from 2000 to 2020. After using the RESTREND method, the paper calculates and compares the relative contributions of climate variability and anthropogenic activities to NPP changes. Finally, the geographical detector (Geodetector) model is applied to evaluate how anthropogenic and natural factors affect spatial distribution patterns and NPP changes. The results indicated that the average annual NPP is 820.39 gC·m−2·yr−1 during the 21 years. In addition, when the NPP varies, it increases over the entire study area, with a slope of 4.81 gC·m−2·yr−1, particularly in the western region. Across the entire research area, 63.39% and 77.44% of the total pixels positively contribute to climate variability and human activities in NPP, with a contribution of 0.90 and 3.91 gC·m−2·yr−1, respectively. Within the western, central, and eastern regions, anthropogenic activities have a stronger impact on NPP than climate variability, particularly pronounced in the eastern region. Furthermore, vegetation cover is the dominant factor in the spatial patterns and NPP trends across the TCT and the three regions. In contrast, climate factors are shown to be less influential in NPP distribution than in the western region. The results also demonstrated that the effect of population density and the GDP on NPP gradually rises. Two-factor interaction is much larger than any individual factor, with the dominant interaction factor being vegetation cover with climatic factors. Lastly, the findings revealed that anthropogenic activities positively promote NPP accumulation across the TCT, thus highlighting the importance of human activity-led ecological restoration and ecological protection measures that contribute to regional carbon sequestration and carbon balance.

1. Introduction

Terrestrial ecosystems serve as essential life support systems for human beings’ survival and sustainable development. As a significant component and core cycle of terrestrial ecosystems, vegetation notably influences the global energy cycle and the biochemical cycle of materials. It also plays a vital role in reducing the rise in greenhouse gases, such as CO2 concentration. Net primary productivity (NPP) represents the amount of organic matter accumulated by green plants per unit area and per unit of time. In other words, it is an indicator of the amount of organic carbon fixed by photosynthesis and subtracted from the amount used by the plants’ respiration [1]. As a component of the surface carbon cycle, the NPP is utilized to determine ecosystem carbon sources/sinks, regulate biological processes, and establish a carbon balance [2]. Therefore, quantitative estimations of the NPP are essential for assessing carbon sequestration and cycling, as well as further understanding changes in the structure and function of the ecosystem.
Natural factors, particularly climate variables and anthropogenic factors, are the most important for substantially altering ecosystem structures, functions, and services [3,4]. Previous studies on vegetation dynamics and NPP changes indicated that human involvement and climate factors can impact vegetation ecosystems, threatening or benefiting them [5]. Climate variability affects NPP variations by altering soil photosynthesis, respiration, and organic carbon decomposition [6]. Over a more extended period, it can even alter the potential vegetation type in the area [7]. Hydrothermal factors, such as temperature (Tem), precipitation (Pre), solar radiation (SR), and topography, have been recognized as critical climatic drivers of natural ecosystem processes. Their influence is visible on a regional and global level due to their effect on the pattern and vegetation productivity [8,9,10]. However, factors controlling for NPP differ across regions and ecosystems [11]. For instance, in the Amazon rainforest, SR is the primary factor that causes the NPP to increase [12], while reduced Pre and drought are responsible for decreasing carbon emissions in South American rainforests [13]. In Northeast China and the Tibetan Plateau, Tem is defined as the main limiting factor for NPP variability [14]. Interannual NPP variability is controlled by Tem in humid and subhumid areas, while Pre is the dominant factor in some arid and semiarid regions [15]. Natural vegetation in the northern and western mountains in Beijing is affected by Tem, while crops in the plains are influenced by Pre, and vegetation in the transition area is affected by SR [16]. Moreover, the topography is also an essential factor influencing the environment in addition to vegetation heterogeneity patterns, which affect other environmental variables by controlling hydrothermal and soil conditions, and then exerting an impact on regional vegetation patterns [17,18,19]. Even though NPP variability is highly sensitive to climate variability, the mechanisms involved in this process are complicated [20,21].
Evidence has shown that human-induced factors, especially urban sprawl and changes in vegetation structure, are additional drivers of ecosystem productivity change. Specifically, these factors influence soil quality, water, heat, and carbon balances of regional ecosystems, biogeochemical cycles, and hydrological systems [20,22,23]. Furthermore, the urbanization process is always accompanied by economic and population urbanization, which often triggers an increase in demand for construction land. Urbanization also changes the GDP and industrial structure, ultimately affecting vegetation dynamics and NPP [23]. Previous studies have suggested that anthropogenic activities frequently negatively affect the NPP [24,25,26]. Positive greening efforts like afforestation, ecological restoration, and conversion directly increase vegetation coverage (VC) and promote ecosystem resilience to disturbance, thereby improving productivity [27]. However, both beneficial and detrimental effects commonly coexist in human-influenced ecosystems, especially in areas under active ecological restoration and development [28]. Even though current explorations of NPP changes have primarily focused on natural factors (e.g., climate variables and geographic environmental factors) and human-induced factors, comparisons between factors and combinations of variables are still lacking. Additionally, most studies only used correlation or regression statistics, with a relatively weak quantitative attribution of multi-factor effects and their interaction. Moreover, it is crucial to distinguish and quantify the relative influences of natural factors and anthropogenic activities on NPP due to their complex mechanisms. Many methods and models have been developed to isolate the relative influences, such as the residual comparison method, scenario simulation method, RESTREN model, etc., and are widely used [6,29,30,31]. Furthermore, a typical sensitive environment or terrestrial transect is ideal for studying natural factors and human-induced impacts on vegetation dynamics [24,25]. For example, the area near the Tropic of Cancer (23°26′N) in China has a monsoon climate, distinct dry–wet and elevation (Ele) gradients, and an abundance of biomass. It is also one of the most densely populated and economically developed areas, with research hotspots, such as forest biomass, i.e., vegetation productivity, situated near these areas [6,19,26,32]. However, few studies have quantified the relative impacts of natural factors and anthropogenic activities on vegetation productivity in the regions around the Tropic of Cancer. Therefore, the univariate effects and bivariate interactions of different influencing factors on spatial heterogeneity and NPP changes must be further explored. By designing the transect, this study aims to investigate the influence of natural and anthropogenic factors on the NPP in areas near the Tropic of Cancer. The objectives are to (1) simulate the NPP for 2000–2020 using the Carnegie–Ames–Stanford Approach (CASA) model and analyze the dynamics of the NPP over the past 21 years; (2) identify the relative and combined effects of climate variability and anthropogenic activities on the NPP; and (3) assess and compare the determinant power of single factor and multi-factor interactions on NPP.

2. Materials and Methods
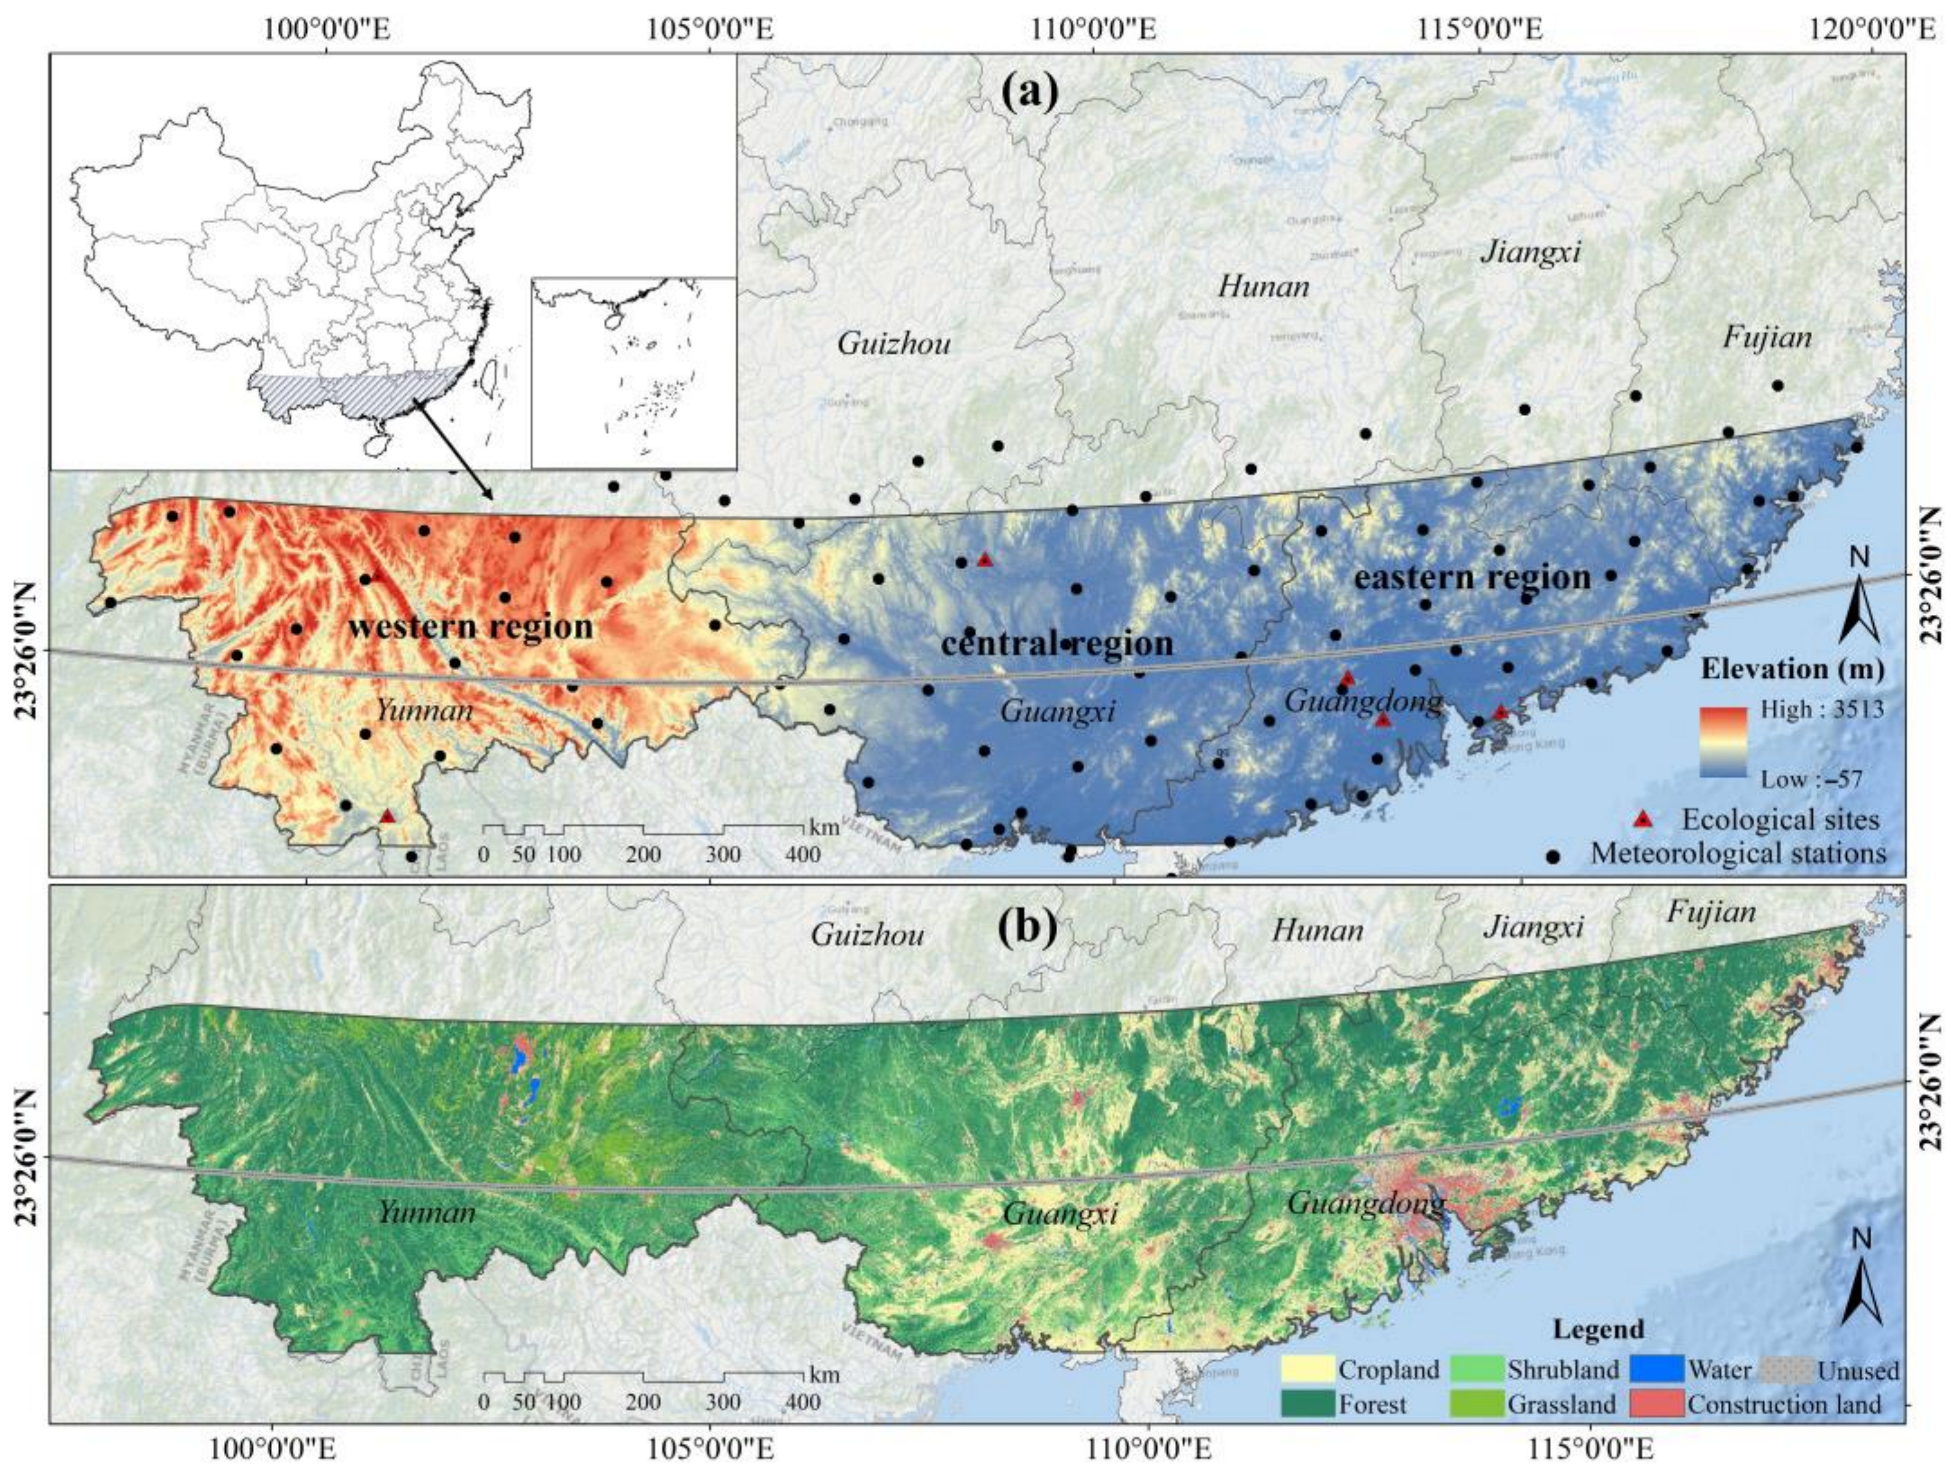
2.1. Study Area

The Tropic of Cancer (23°26′N) represents an imaginary latitude line with multi-disciplinary climatic characteristics. The areas intersected by this region are mostly desert, island, and steppe ecosystems. Due to the typical subtropical monsoon climate, the region around the Tropic of Cancer in China (e.g., Yunnan, Guangxi, Guangdong, Fujian, and Taiwan) is dominated by plains and hills with diverse vegetation and plentiful natural resources [33]. Furthermore, Chinese areas near the Tropic of Cancer are among the most densely populated and economically developed regions, in which frequent human activities have created a more fragile and sensitive environment [19,26]. The monsoon climate has created an abundance of hydrothermal resources, products, and vegetation biomass, but has also caused severe natural disasters, including typhoons, heavy rain, and heat waves. In sum, Chinese areas near the Tropic of Cancer are both sensitive and significantly affected by climate variability and human activities.
This study takes the Tropic of Cancer in China as the center line (Figure 1) to set a transect, namely the Tropic of Cancer transect (TCT). This transect extends 2100 km from east to west, with a latitude range of 21°30′–25°30′N, and a north–south range of 400 km. The Taiwan province is excluded from this research due to a lack of data. The transect includes southern Yunnan Province, most of the Guangxi and Guangdong Provinces, and a few areas of the Fujian Province. It is predominantly comprised of mountains and plains, with Ele ranging from −57 m to 3513 m (Figure 1a). Dominated by a subtropical monsoon climate, the study area has a mean annual Pre of 1490 mm and a mean annual Tem of 19.3 °C. Thus, there is effectively no climatological winter. The land cover includes forest and cropland (Figure 1b). To better analyze the impact of natural and anthropogenic factors on NPP, the TCT is divided into three regions, i.e., the western, central, and eastern regions, based on topographic features and administrative boundaries. The western region predominantly belongs to Yunnan Province and is dominated by mountains, basins, and hills. It has a typical regional landscape with an abundance of biocenosis types. The second, i.e., the central region, is situated in the central parts of Guangxi Province in the transition zone between the Yunnan-Guizhou Plateau and the southeast coastal hills. The complex topography and prominent karst landforms characterize it. The central region is also rich in zonal vegetation types. Lastly, the eastern region envelops the majority of areas in Guangdong Province, as well as parts of Fujian Province. The area is surrounded by hills and plains and has a relatively dense population, a developed economy, and cultural leisure tourism.

2.2. Datasets and Processing

In order to simulate large-scale NPP, this study downloaded time-series MODIS-NDVI data (MOD13Q1) from 2000 to 2020 at a spatial resolution of 250 m from NASA’s Land Processes Distributed Active Archive Center (LP DAAC) (accessed on 1 December 2021). Using the maximum value composite method [34], the paper generated monthly NDVI while effectively minimizing cloud contamination, atmospheric effects, and solar zenith angle effects. Moreover, VC can be calculated using the dimididate pixel model based on the NDVI data [35].
This research applied the Global Land Cover fine classification system at 30 m resolution (GCL-FCS30) to recognize land cover types in the TCT. This dataset was constructed by fusing high-quality training data from the GSPECLib (Global Spatial Temporal Spectra Library) with Landsat time series imagery within the Google Earth Engine computing platform for 1985–2020 [36,37]. The paper obtained four phases of GCL-FCS 30 m data from 2000 to 2020 in five-year intervals (i.e., 2000, 2005, 2010, 2015, and 2020) from the Aerospace Information Research Institute of the Chinese Academy of Sciences (http://www.aircas.cas.cn/ (accessed on 1 January 2022)). The overall classification accuracy was 82.5%, with a Kappa coefficient of 0.784. To control the CASA model, the original 30 land cover types were reclassified into seven primary and eleven sub-classes, namely forest (including evergreen broad-leaf forest, evergreen needle-leaf forest, deciduous broad-leaf forest, deciduous needle-leaf forest, and mixed forest), grassland, shrubland, cropland, water, construction land, and unused land. The land cover data were resampled to 250 m resolution to match the MODIS NDVI data.
The paper downloaded a 90 m resolution DEM dataset from Geospatial Data Cloud (http://www.gscloud.cn/ (accessed on 1 February 2022)) and then derived the slope (Slo) from the DEM. Based on data collected from 88 standard meteorological stations in the TCT and surrounding areas (Figure 1a), the monthly mean Tem, total Pre, and total sunlight duration from 2000 to 2020 were derived. The meteorological data were provided by the Chinese National Metrological Information Center/China Meteorological Administration (NMIC/CMA) (accessed on 1 December 2021). Based on meteorological data at the sites and DEM, the monthly meteorological rasters were generated using kriging spatial interpolation at a spatial resolution of 250 m for the entire study area. The paper obtained the annual population density (Pop) and GDP at 1000 m resolution from the Resource and Environment Science and Data Center (https://www.resdc.cn/ (accessed on 1 February 2022)) for the period 2000–2020. The above data were resampled to a resolution of 250 m. In addition, the paper also obtained 47 field observations of biomass data from six sites from the National Data Center for Ecological Sciences (http://www.nesdc.org.cn/ (accessed on 1 December 2021)) and other previously published studies that covered the time range from 2000 to 2015 [38,39,40,41,42].

2.3. Driving Factors

In addition to climate variability, topography (e.g., Ele and Slo) also influences vegetation distribution by affecting climatic factors (e.g., Tem, Pre, and SR) [17,18,43]. Furthermore, socio-economic development and population growth may either directly or indirectly produce significantly different spatial patterns and change the NPP by altering the structure and functions of natural ecosystems [42,44]. Therefore, this paper selected a total of eight driving factors related to climate, topography, and human activities to determine the NPP responses associated with natural (three climatic variables and two topographic factors) and anthropogenic explanatory variables (Table 1). It should be noted that all eight driving factors for the years 2000, 2010, and 2020 were selected to examine the effects of natural and anthropogenic factors on the spatial pattern and heterogeneity of NPP for the three representative years. The change slopes of six factors involving climatic and anthropogenic factors for the period 2000–2020, combined with two topographic factors, were chosen to analyze the impacts of natural and anthropogenic factors on the NPP change trend.

2.4. NPP Estimation and Validation

The CASA model, developed according to light use efficiency (LUE) and driven by remote sensing data and climate data [45,46], was employed to calculate the NPP from 2000 to 2020. Within the CASA model, the NPP is the product of the absorbed photosynthetic active radiation (APAR) (MJ·m−2) and the utilization efficiency (ε) (gC·MJ·m−1) of vegetation on APAR that reaches the surface [45]:
NPP (x, t) = APAR (x, t) × ε (x, t)
where NPP (x, t) (gC·m−2) is the NPP fixed at a grid cell x in month t, while ε (x, t) is the actual LUE (gC·MJ·m−1). Next, APAR (x, t) and ε (x, t) are calculated as [47]:
APAR (x, t) = SR (x, t) × FPAR (x, t) × 0.5
ε (x, t) = T1 (x, t) × T2 (x, t) × W (x, t) × εmax
where SR (x, t) is the total solar radiation (MJ·m−2) of pixel x over time t, while FPAR (x, t) is the fraction of photosynthetically active radiation absorbed by the vegetation canopy, which is determined by the NDVI [48]. The 0.5 value represents the ratio of the active SR to the total SR used by vegetation. Moreover, T1 (x, t) and T2 (x, t) are the Tem stress coefficients that reflect the LUE reduction caused by the Tem factor [45,46]. The notion W (x, t) is the moisture stress coefficient, representing the influence of vegetation water conditions. Finally, εmax is the maximum LUE that must be simulated for different vegetation types.
The value of εmax differs across situations and is mainly influenced by Tem, water availability, and soil type [49]. According to the results of [26], a simulated forest NPP based on the average εmax values proposed by [50,51] is closer to the field NPP. Therefore, this paper selected the average εmax values simulated by [50,51] for land cover types. The εmax values for the evergreen broad-leaf forest, evergreen needle-leaf forest, deciduous broad-leaf forest, deciduous needle-leaf forest, mixed forest, cropland, shrubland, and grassland were 0.808, 0.378, 0.585, 0.434, 0.461, 0.502, 0.389, 0.482, and 0.482, respectively. A more detailed description of this model is given in [52].
The performance of the CASA model needs to be assessed. This study acquired field-observed biomass data from six field observations and research stations, further complementing the findings of other previously published studies [38,39,40,41,42]. The biomass was converted to NPP with the following equations [53]:
NPPi = NPPa + NPPu
NPPa = Bioa × 0.475
NPPu = 0.25 + NPPa × 0.0009 × Biou × 0.6
where NPPi is the NPP value of site i, while NPPa and NPPu, Bioa, and Biou are the above-ground and under-ground NPP and biomass, respectively.

2.5. NPP Trend Analysis

The Mann–Kendall (M-K) method, commonly utilized to examine long-time series trends with non-normal data [49,54], was applied to calculate the NPP trends from 2000 to 2020. In addition, the M-K test statistic Z is approximately normally distributed when the sample size is greater than 8 [55]. A positive Z indicates an increasing trend and vice versa. The M-K and the Theil–Sen median slope are calculated according to the following equation [56]:
S = i = 1 n 1 j = i + 1 n s g n ( x j x i )
where n is the number of data points, while xi and xj are data values in time series i and j (j > i), respectively. Lastly, sgn(xjxi) is the sign function:
sgn ( x j x i ) = { 1 ,   i f   x j x i > 0 0 ,   i f   x j x i = 0 1 ,   i f   x j x i < 0
The variance is computed as:
Var ( S ) =   n ( n 1 ) ( 2 n + 5 ) i = 1 m t i ( t i 1 ) ( 2 t i + 5 ) 18
where n is the number of data points, m is the number of tied groups, and ti is the number of ties of extent i. A tied group is a set of sample data with the same value. When the sample size n > 8, the standard normal test statistic Z is calculated using Equation (10):
Z = { S 1 V a r ( S ) ,   i f   S > 0 0 ,   i f   S = 0 S + 1 V a r ( S ) ,   i f   S < 0
For determining the trend’s slope in a sample with N pairs of data, the Theil–Sen median slope estimator is calculated as Equation (11):
β i = M e d i a n ( x n x m n m ) for   i = 1 , ,   N ,
where xn and xm are the data values at times n and m (n > m), respectively.

2.6. Contributions of Climate Variability and Human Activities to NPP Change

This paper proposes the multivariate regression method RESTREND to measure the impacts of climatic factors (Tem, Pre, and SR) and human activities on NPP changes. This method was first applied to hydrodynamics by McCuen in 1974 [57] and is now employed to examine the effects of driving factors of vegetation dynamics [58,59]. The RESTREND method can be expressed as follows:
θ s l o p e = C ( t e m ) + C ( p r e ) + C ( s r ) + U F = ( N P P t e m ) × ( t e m n ) + ( N P P p r e ) × ( p r e n ) + ( N P P s o l ) × ( s r n ) + U F
where θ s l o p e is the interannual NPP variability from 2000 to 2020. Moreover, C(tem), C(pre), and C(sr) are the contributions of Tem, Pre, and SR to the interannual NPP variation rate. n is the number of years. C(tem) can be calculated as ( N P P / t e m ) and   ( t e m / n ) , which denote the slope of the linear regression line between NPP and Tem, and the slope of the linear regression line between Tem and n, respectively. The calculation of C(pre) and C(sr) is similar to C(tem). Lastly, UF represents the residual between NPP variability and the climatic factors’ contribution. Both human activities and other factors are included in UF. This paper assumes that human factors, including economy, population, and land cover change, are the dominant influence of UF.
Moreover, the partial least squares (PLS) regression method was used to explore the partial correlations between climatic variables (i.e., Tem, Pre, and SR) and the NPP [60].

2.7. Geographical Detector Analysis

Even though the multivariate regression method can better compare the positive and negative impacts of climate variability and anthropogenic activities on the NPP, it cannot measure the effects of independent factors and two-factor interactions on the NPP. To better explore the relationship between multiple factors and the NPP, this study evaluates the explanatory power of independent factors and two factors’ interactions on the spatial heterogeneity and change of NPP by employing a geographical detector (Geodetector). The Geodetector is a geographic statistical technique proposed by Wang et al. [61,62] for identifying spatial anisotropy and its underlying causes. It includes four modules: factor detector, interaction detector, risk detector, and ecological detector. The Geodetector is used in this study with the assumption that the spatial trends and patterns of the NPP resemble their potential driving forces. The paper uses both the factor detector and the interactive detector to examine the spatial heterogeneity in the NPP, determine the effect of the independent variable on dependent ones, and understand the interaction and effect of different independent variables on the spatial distribution of the NPP. The factor detector is measured by the q-value. The formula for q is as follows:
q = 1 h = 1 L N h σ h 2 N σ 2 = 1 S S W S S T ,   S S W = h = 1 L N h σ h 2 ,   SST = N σ 2
where h is the stratification or classification of the variable Y or factor X (1, …, L). Next, Nh and N are the number of units in layer h and the entire region, while σ h 2 and σ 2 are the variances of the Y value for layer h and the entire region. Moreover, SSW and SST are the sum of squares and the total sum of squares, respectively. Lastly, the range of q values is [0, 1], in which case a higher q value indicates a greater contribution of driving factors to the NPP.
Interaction detection evaluates a combined effect of two individual factors on the NPP, i.e., whether the interaction of factors X1 and X2 ( q ( X 1   X 2 ) ) enhances the explanatory power or whether their effects on the NPP are independent. The model classifies the relationship between the two factors into the following types:
q ( X 1   X 2 ) > ( q ( X 1 ) + q ( X 2 ) )   N o n l i n e a r e n h a n c e q ( X 1   X 2 ) = ( q ( X 1 ) + q ( X 2 ) )   I n d e p e n d e n t q ( X 1   X 2 ) > M a x   ( q ( X 1 ) , q ( X 2 ) )   B i e n h a n c e M i n   ( q ( X 1 ) , q ( X 2 ) ) < q ( X 1   X 2 ) < M a x ( q ( X 1 ) ,   q ( X 2 ) )   U n i w e a k e n q ( X 1   X 2 ) < M i n ( q ( X 1 ) , q ( X 2 ) )   N o n l i n e a r w e a k e n  
where the symbol ’   ’ is the interaction between X1 and X2, q(X1) and q(X2) are the explanatory power of X1 and X2, respectively. q(X1     X2) is the explanatory power of the interaction between X1 and X2. Max (q(X1), q(X2)) and Min (q(X1), q(X2)) are the maximum or minimum value in both X1 and X2, respectively.

3. Results

3.1. Validation of NPP Estimation

The paper uses field-measured NPP values to validate the CASA model results. The comparison found a significant (p < 0.001) correlation between field-observed results and the CASA-modeled NPP (n = 47, R2 = 0.75, Figure 2), with an MAE and RMSE of 231.06 and 252.33 gC·m−2, respectively. This suggests that the simulated NPP values are reliable for further analysis.

3.2. Spatial Patterns and Trends of NPP

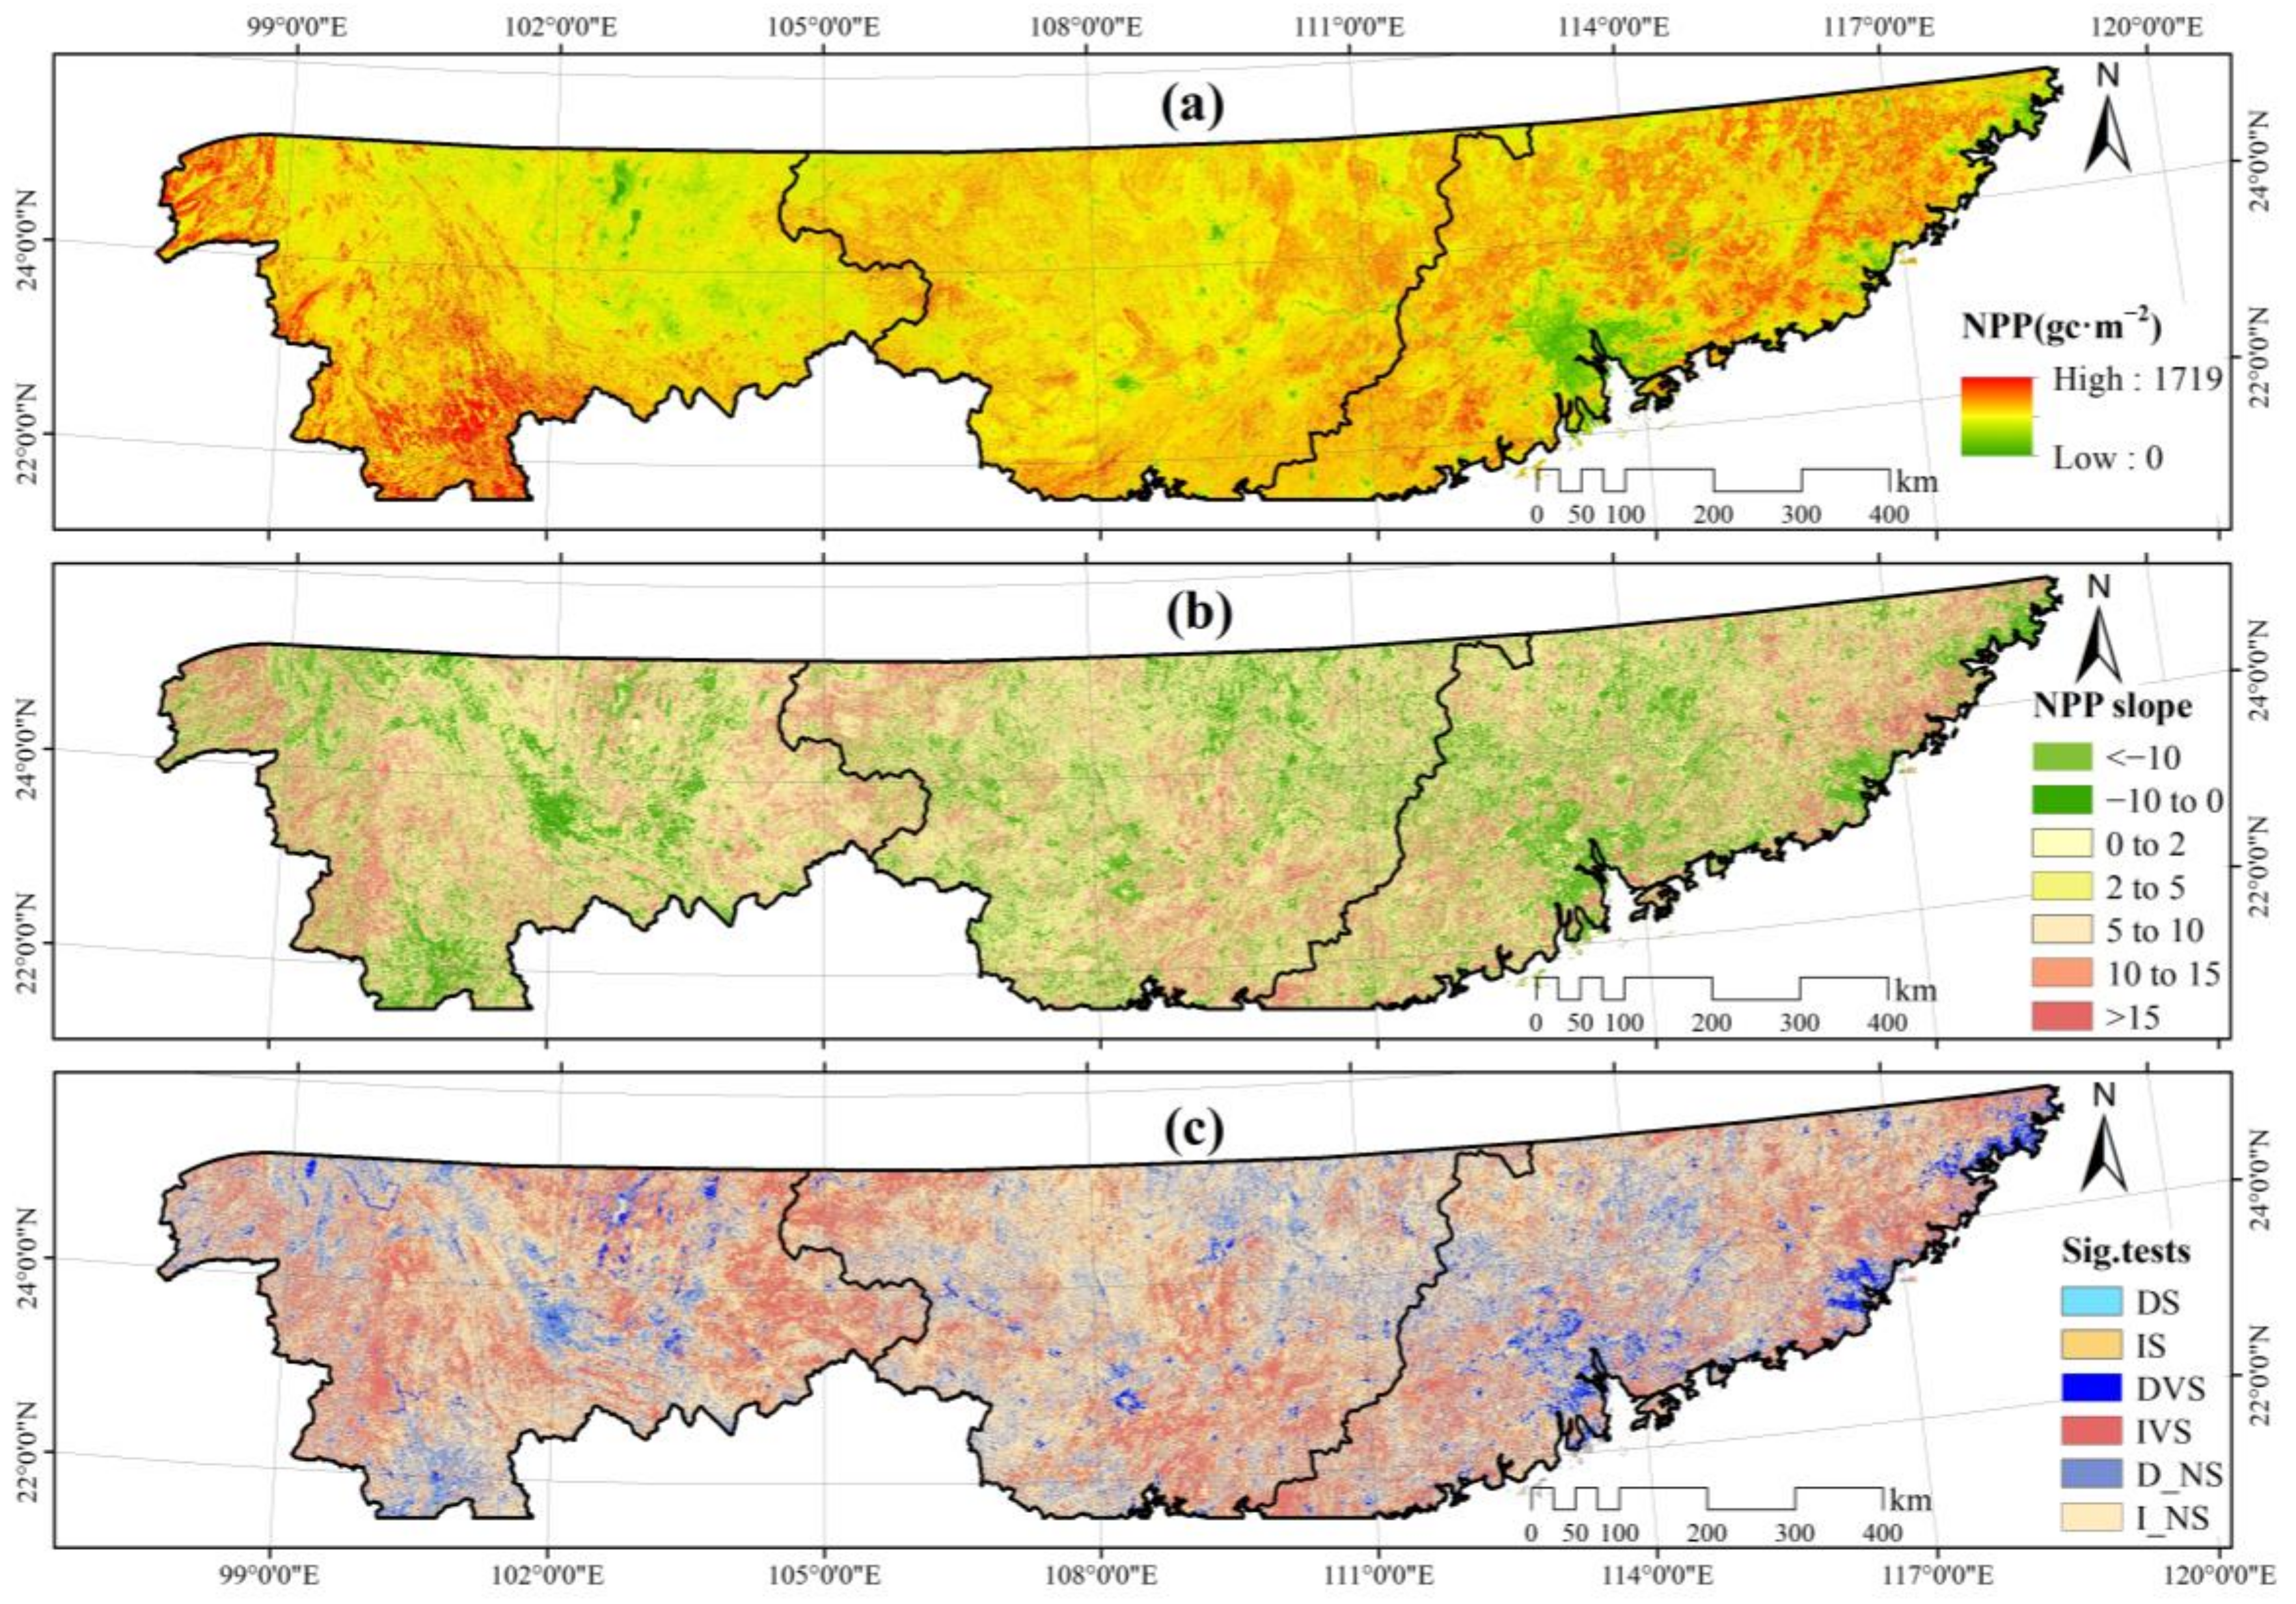
3.2.1. Spatial Patterns of NPP

The spatial patterns and trend changes in the NPP between 2000 and 2020 are given in Figure 3. The estimated mean NPP increases from 2000 to 2020. The mean NPP during the period of 2000–2020 is 820.39 gC·m−2·yr−1, and the total NPP is 533.35 Gg·C·yr−1 (1 Tg = 1012 g). The mean annual NPP for 21 years is characterized by a distinct geographic heterogeneity, increasing from west to east (Figure 3a). The lowest NPP values occur in the northwest and eastern coastal areas, especially in the urban agglomeration, such as the Guangdong-Hong Kong-Macao Greater Bar Area (GBA) and the West Side of the Straits, with NPP values of less than 150 gC·m−2·yr−1 in these areas. Conversely, the highest values (more than 1500.00 gC·m−2·yr−1) are found in the western and eastern parts of the TCT. The spatial NPP patterns in the western, central, and eastern regions differ due to land cover types, topographic and geographic characteristics, climatic conditions, and human activities. For instance, the highest average annual NPP is measured in the eastern region with 826.82 gC·m−2·yr−1 due to rich forest resources and high VC. The values decrease from east to west and from south to north as a low NPP occurs in the south-central and eastern coastal areas, where urban belts are distributed with numerous impervious surfaces. The difference in the mean NPP between the western and the central region is small (both around 820 gC·m−2·yr−1), while the spatial distribution of the NPP is heterogeneous. The average NPP in the western region increases from northeast to southwest. Low NPP values are found mainly in the high mountain regions, with an average value of less than 500 gC·m−2·yr−1, while high values are found in the low Ele areas, with an average value greater than 1500 gC·m−2·yr−1. Lastly, low values in the central region are concentrated in the middle around karst landforms, which have fragile ecological conditions and are mostly less than 800 gC·m−2·yr−1. In contrast, high values (greater than 1100 gC·m−2·yr−1) surround central and non-karst regions.

3.2.2. Temporal Trends in NPP

The temporal trend of the annual NPP and significance tests across the entire region are analyzed at the pixel level, with the results shown in Figure 3b,c. During the research period (2000–2020), more than 73% of the pixels indicated a nonsignificant (p > 0.05) increasing NPP with an average slope of 4.81 gC·m−2·yr−1. The pixels are predominantly distributed in the west, south, and northeast TCT. On the other hand, pixels show a decreasing NPP that accounts for 26.20% of all pixels and are concentrated in the central and northeastern areas. Lastly, regions with nonsignificant (p > 0.05) NPP trends account for 55.87%, with a sporadic distribution. About 15.02% and 23.36% of the pixels show a significant (p < 0.05) and very significant increase (p < 0.01). These pixels are distributed in the west and south TCT. Only 5.77% of the pixels showed significant (p < 0.05) and a very significant decrease (p < 0.01), which are concentrated in urban distribution areas. Significant NPP increase occurs in the western region with an average slope of 5.46 gC·m−2·yr−1. This is followed by the central and eastern regions, with 4.67 and 4.34 gC·m−2·yr−1, respectively. Furthermore, the percentage of pixels with nonsignificant trends (p > 0.05) ranges from 53% to 59%, with areas with a significant increasing trend being much larger than those with a decreasing one in all three regions. This is most notable in the western TCT, where 42.09% of the pixels showed a significant (p < 0.05) increase in NPP, while only 4.57% of the pixels show a significant (p < 0.05) decrease.

3.3. Relative Contributions of Climate Variability and Anthropogenic Activities to NPP Dynamics

3.3.1. Correlations between NPP and Climatic Factors

This paper performs a partial correlation analysis between the three main climatic factors (annual mean Tem, total Pre, and total SR) and the annual NPP across the TCT from 2000 to 2020 (Figure 4a–c). Tem, Pre, and SR all tended to positively impact the NPP in most areas, with average coefficients of 0.101, 0.197, and 0.218, respectively. Around 66.11% of pixels have positive correlations between NPP and Tem, mostly distributed in east and southwest TCT. In contrast, the negative correlations are scattered across the southeastern coastal areas, central, and northeastern TCT. About 79% of pixels have a positive correlation between NPP and Pre and SR; these pixels are concentrated in central areas, with a small proportion found in the east and the southwestern TCT. Furthermore, the correlations between the NPP and the three climate factors are nonsignificant in more than 80% of pixels, indicating that NPP is not particularly sensitive to the effects of climate variability in most areas. This is because the research area belongs to the subtropical region characterized by relatively high annual Tem and abundant rainfall. There is a positive correlation between NPP and Tem in all three regions for the NPP response to climatic variables. It is concentrated in the western and eastern parts of the western region, southern and northeastern parts of the central region, and eastern parts of the eastern region. In addition, the NPP is also sensitive to Pre, as more than 70% of pixels in all three regions are positively correlated with Pre. Especially in the central region, about 91.51% and 23.74% of the total pixels have a positive and significant (p < 0.05) positive correlation between NPP and Pre, respectively. Regarding the response of NPP to SR, more than 60% of the total pixels of each region have a positive coefficient with NPP, but this correlation is not significant.

3.3.2. Contributions of Climate Variability and Anthropogenic Activities to NPP Variability

The paper isolates the total contributions of climate variability and anthropogenic activities to NPP change, as shown in Figure 5. Over 73% of pixels during the research period showed that the NPP increases under the isolated effects of climate variability and anthropogenic activities, with higher trends under anthropogenic activities than under climate change. The interannual NPP variation is measured at 4.81 gC·m−2·yr−1, of which 0.90 gC·m−2·yr−1 is contributed to climate variability and 3.91 gC·m−2·yr−1 to human activities. Pixels with a positive contribution between climate variability and NPP account for 63.39%. They are observed in the central-northern and southwestern parts of the TCT, while a negative response is found in the western and eastern parts. Moreover, 77.44% of pixels indicate a positive contribution of human activities to NPP. These pixels are distributed in most areas of the TCT, while those with negative contributions are found in the central, southeast, and western parts.
The contributions to climate variability and anthropogenic activities differ across the three regions. Namely, climate variability positively contributes to NPP in all three regions, with average values between 0.29 and 1.68 gC·m−2·yr−1. In comparison, the positive contribution of anthropogenic activities is far greater in the three regions, with average values ranging from 3.78 to 4.05 gC·m−2·yr−1. This indicates that climate variability and anthropogenic activities benefit vegetation and contribute NPP accumulation. In particular, the favorable effects of anthropogenic activities on NPP change in the eastern region are much greater than in the other two regions, while the contribution of climate variability is smaller than in the other two regions. These results may be explained by the topographical differences and intensity of human activity across regions.

3.4. Influence of Natural and Anthropogenic Factors on NPP

3.4.1. Independent Effects of Different Factors on NPP

The paper uses eight dominant factors (Table 1) to calculate the determinant power (q) of natural and human activities on the spatial pattern of NPP in 2000, 2010, and 2020 across the entire research area and different regions of the TCT. Furthermore, eight dominant factors, including the Ele, Slo, and annual change of the other six factors were used to determine the explanatory power of NPP change from 2000 to 2020. The result reveals that the VC was the dominant factor across the entire study area in 2000, 2010, and 2020 (Table 2). This means that the VC has the strongest determinant power and that the average q value of VC (0.634) was much larger than that of other factors. The mean q values of Ele, Pop, GDP, and Slo are 0.335, 0.323, 0.297, and 0.263, respectively, with relatively small differences between the factors. The q-values for the three are relatively small, with the average values ranging from 0.08 to 0.11. This points to the fact that they have a smaller influence on the spatial heterogeneity of the NPP and the differences in their influences are small. Moreover, the paper finds that the q values of VC, Pop, and GDP increased from 2000 to 2020, while the q values of Tem and Pre decreased, indicating that the determinant power of anthropogenic factors is gradually increasing and thus becoming a dominant influence on the spatial distribution of NPP.
Even though VC has a dominant influence on the spatial NPP pattern in the western, central, and eastern regions, its q values differ greatly, with average values of 0.589, 0.477, and 0.842, respectively. These values are much larger than other factors, suggesting that vegetation dynamics influence NPP’s spatial pattern and heterogeneity more than other factors, especially in areas with a high intensity of human activities. Furthermore, the paper finds that the spatial pattern of the NPP is not controlled by a single factor across regions. For example, in addition to VC, the NPP in western and central regions is susceptible to climatic and topographic factors, while the NPP in the eastern region is influenced by Pop, GDP, and topographical factors. In addition, the sub-dominant factors differ through the years, mainly because each factor either has its regional differences or evolves.
The paper also explores the determinant power of topographic factors and the slope of the other six factors on the trend of NPP during the period of 2000–2020. The results are shown in Table 2. Across the entire research area, the change in VC has the greatest determinant power on the NPP, with a q value of 0.196. It is followed by Ele (0.088), while the differences between Tem change, Pre change, and Slo change are relatively small. In comparison, SR (q = 0.029), Pop (q = 0.017), and GDP (q = 0.006) changes have less influence on NPP change. Notably, the influence of the three climatic factors on NPP trends differs significantly across the study area of the three regions. For example, the effect of Tem change on NPP trend is relatively large across the study area and in the eastern region, while SR and Pre are largest in the western and central regions, respectively. In addition, within the three regions, VC change is the dominant factor influencing NPP change. It has the greatest determinant power in the eastern region, with a q value of 0.486. Furthermore, climate variability also has a great influence on NPP change in the western and central regions. For example, Pre (q = 0.275) and Tem (q = 0.143), and SR (q = 0.198), and Pre (q = 0.106), are the subdominant factors in these two regions. However, the impact of Ele (q = 0.174), Slo (q = 0.120), and GDP change (q = 0.090) are more prominent than climate variability, suggesting a significant spatial heterogeneity of influencing factors between 2000 and 2020. This may be due to each region’s different topographical, geomorphological, and socio-economic characteristics.

3.4.2. Interactive Effects of Factors on NPP

This paper uses the interaction detector to determine the interaction effect of natural and anthropogenic factors on the NPP spatial pattern. The q-value of the two-factor interaction appears to be much larger than those of any individual factor. Moreover, the interaction of two influencing factors is also found to be either bivariate enhanced or nonlinear enhanced (Figure 6). This suggests that two interacting factors may enhance the explanatory power of NPP spatial differentiation. The dominant interaction factors of the three representative years are ranked according to their q values. This ranking shows that the two factors with the largest dominant interaction are a combination of the single dominant factor and another influencing factor in the corresponding year, i.e., the combination of VC and another factor. For instance, in 2000, the dominant interaction factor in the NPP spatial pattern was found to be a VC with Tem, with a q value of 0.719. On the other hand, in both 2010 and 2020, VC with SR is the primary determinant, with a q value of 0.749 and 0.803, respectively. Furthermore, the determinant power of combined anthropogenic factors is more significant than the interaction effect between three climate factors in all three examined years. In addition, the q value of the interaction between human activity factors shows a significant increase from 2000 to 2020, indicating that the influence of human activities on NPP is gradually increasing.
The interaction between VC and other factors maximized the q value in all three regions in 2000, 2010, and 2020. However, it is most pronounced in the eastern region, indicating that the spatial differentiation of NPP in this region is impacted by the spatial pattern of vegetation, which is, in turn, influenced by other factors. In addition to the interaction of VC with other factors, a relatively strong effect of the interaction between climatic and topographical factors is observed in all three regions in both 2000 and 2010. However, the interaction effect of human factors with climatic and topographic factors takes on a sub-dominant role in 2020. For example, the interaction of Pop with Pre in the western region (q = 0.632), GDP with SR (q = 0.483), and Ele (q = 0.755) in the central and eastern regions, respectively, are much more subdominant in 2020 than the interaction of climatic with topographic factors. Furthermore, the interaction of the GDP and Pop with natural factors in the eastern region significantly increases from 2000 to 2020. Notably, the interaction effect of the GDP with Pre, Ele, Slo, Pop, and Tem increases by 0.094, 0.057, 0.049, 0.047, and 0.043, respectively. In addition, the interaction effect of Pop with climatic and topographical factors increases from 0.005 to 0.101 between 2000 and 2020, implying that there are complex interactions between anthropogenic factors on the one hand and climatic and topographical factors on the other. In addition, these results also suggest that the complexity of these interactions enhances the control of anthropogenic factors on the NPP.
When examining the interaction effect of natural and anthropogenic factors, the paper finds that the interaction between VC and other factors has a stronger effect on NPP changes than interactions between other factors. For instance, in the whole study area, central and eastern regions, the interaction between VC and SR is the primary factor influencing changes in NPP, with q values of 0.355, 0.426, and 0.599, respectively. However, in the western region, the interaction between VC and Pre has the most determinant power, with a q value of 0.506. Furthermore, in the TCT and its three regions, the interactions of climatic with topographic factors also have a relatively strong influence on NPP change. This suggests that climate variability combined with topographic factors enhances their control of NPP change. Nevertheless, the q values of the GDP and Pop slope with climate variability and topographic factors are still relatively small, demonstrating that their interactions are less influential on NPP change.

4. Discussion

4.1. Spatial Heterogeneity and Trends in NPP

In general, the spatial pattern of the annual NPP increases from west to east, with visible signs of both spatial heterogeneity and territorial diversity. This pattern can be the result of hydrothermal conditions caused by the climatic gradient, differences in geological and topographical conditions from west to east, as well as other factors, including significant disparities in urban development, population size, and degree of economic development (Figure 7), especially in the urbanized areas [23,44,63]. For example, the mean NPP in the western region decreases significantly from the west to the east and south to the north. This decrease is directly related to different elevations and vegetation types. Furthermore, the longitudinal range–gorge region, characterized by mountains and incised valleys, exhibits a “corridor-barrier” phenomenon caused by energy transportation and human activities, producing spatial differences in the NPP. The paper also observes a relatively lower NPP in mountainous areas and a higher NPP in the low-Ele areas (Figure 3a). In addition, the NPP shows a high-density distribution of low values between 1000 and 2000 m (Figure 7a), suggesting that altitude has a substantial nonlinear negative correlation with NPP within a specific altitude range, which is also consistent with previous research [64,65]. These results are most likely attributable to the western region’s being high altitude and having an abundance of valleys and rugged topography. The region’s elevation produces a variety of vegetation habitats and vegetation types at different elevation range in Yunnan Province by influencing factors such as water–heat combination and soil type. The elevation level also forms the vertical zonal differentiation of vegetation in mountainous areas, thus causing discrepancies in the vertical distribution pattern of NPP.
The NPP increases in the central region from the center to the west, east, and south. It exhibits high around and low in the middle, which is consistent with the topographic features of the region. In general, the Guangxi topography is characterized by high altitude in the northwest and low altitude in the southeast. The region is also surrounded by mountains, with typical karst landforms and mid-altitude mountainous terrain, which contribute to the relatively high values of NPP around the central region (Figure 7a). Furthermore, the typical karst landscape (mainly concentrated in the northeastern and southwestern areas of the region) is also the main factor influencing the spatial heterogeneity of the NPP. Previous studies confirmed that vegetation growth is subjected to the impact of karst landforms because of ecological fragility (soil erosion and desertification), resulting in weaker vegetation productivity than in non-karst areas [32,66]. In the eastern region, the NPP has a spatial distribution pattern of high in the east and low in the south-central areas. Such a pattern is the result of terrain conditions and human activities. The topography of Guangdong Province is characterized by northern mountains, western and eastern hills, and central plains, which are favorable for forestry development in mid-altitude areas (Figure 7a). Moreover, as low-elevation areas promote the development of agriculture and urban construction, economic and population growth will increase the demand for ecological land, causing stress on vegetation cover and decreasing NPP and carbon stocks, especially in urban areas and agglomeration, such as GBA. In other words, economic and population growth are unfavorable to vegetation NPP accumulation (Figure 7b,c), consistent with Peng et al. [23].
The temporal NPP trends are spatially heterogeneous and rise by 4.81 gC·m−2·yr−1 overall. The NPP increases are concentrated in the western, south-central, and eastern areas, while the decreases occur in the east-central, west-central, and eastern coastal areas (Figure 3b). Such a pattern indicates high variability caused by heterogeneities in climatic conditions, topography, land cover, population distribution, and urban development. For example, this paper indicates that NPP change trends across the research area decrease from west to east, displaying significant latitudinal and zonal characteristics. The most notable decreases are observed in the eastern region (Figure 3b,c), with the reduced NPP most related to urbanization, land use and land cover change (LULCC) [23,44,63]. Furthermore, Jiang et al. [26,63] confirmed that LULCC resulted from urban sprawl and the decline of vegetation carbon sequestration ability in Guangdong Province, most notably in the GBA. In comparison, the NPP rises in the western and central regions because high Ele and Slo areas are often less disturbed by human interference [32]. In addition, the NPP trends also increase in the western and southern parts of the western and central regions (Figure 3b). The suitable environmental conditions result from both favorable climate conditions and human efforts. For instance, moderate Pre, combined with increasing Tem and cumulative Pre, promotes vegetation biomass accumulation [20,58,67]. Furthermore, since the implementing a series of Ecological Restoration Projects (ERPs) in Yunnan and Guangxi Province, vegetation has increased in most karst areas of southwestern China [54,68], which is, in turn, beneficial for NPP accumulation.

4.2. Contribution of Climate Variability and Anthropogenic Activities to NPP

Climate variability is a critical factor affecting vegetation conditions, patterns, and NPP dynamics of biomes at a regional scale [14,69,70]. Previous research has shown that Tem, Pre, and SR are the most significant climatic factors influencing vegetation growth [28,30]. This paper found that the effects of the three climate variables on the NPP variability are significantly different (Figure 4). In general, positive correlations between NPP and Tem, Pre, and SR, are notable across most areas of the TCT, as all have more than 58% of pixels with a non-significant positive correlation. A negative correlation between Tem, Pre, and SR and NPP is observed in the north-central, southeastern, northwestern, and western TCT. This pattern is caused by the abundance of forests and monsoons, which brought significant Pre to the eastern and western regions, allowing the vegetation to make use of soil moisture. However, Pre increases also reduce SR exposure in plants [58,71], resulting in a lesser absorption of photosynthetically active radiation and an improvement in vegetation biomass [72]. In addition, the impact of climate conditions on the NPP is complicated in areas with large elevation variability because the local topography affects the spatial variability of climate variables and soil–water movement [18,64]. For instance, as the elevation rises, the temperature decreases, weakening the updraft and causing less precipitation (Figure 8). The combined effect of the above factors changes the vegetation communities and soil types from bottom to top, causing the NPP to present prominent vertical zonality. The paper demonstrated that the average NPP is greater than 900 gC∙m−2∙yr−1 when the Ele is lower than 1000 m in the western region but less than 500 gC∙m−2∙yr−1 when the Ele is higher than 2000 m (Figure 7a). Thus, elevation appears to affect climate variability by influencing Tem and Pre and consequently forming topography–climate interactions that affect the NPP. In addition, the impact of climatic drought on NPP is also related to topography [64] and should be investigated further.
As the two most important factors affecting NPP change, the impacts of climate variability and anthropogenic activities from 2000 to 2020 are spatially heterogeneous across the entire research area. As shown in Figure 5, the differences are explained by the inconsistent spatial variability in climate variables and anthropogenic activities. Namely, climate conditions across the research area and three regions are favorable to vegetation carbon storage (with average contribution rates of 0.29−1.68 gC·m−2·yr−1), with the percentage of pixels benefiting the NPP accumulation of 10.14−26.94% and having adverse effects on the 11.19−15.21% of the pixels. In comparison, anthropogenic activities are more favorable to NPP change across the entire research area (with an average contribution rate of 3.92 gC·m−2·yr−1), but their impact is differentiated within the three regions. This pattern in the three regions is related to economic and population development (Figure 7b,c), urbanization degree, and environmental protection measures. For example, ecological protection projects and ecological immigration in the karst areas of Southwest China create favorable conditions for vegetation NPP cumulation [73]. Numerous studies have reported greening trends in the karst areas of Southwest China [66,74,75]. In other words, ecological engineering and other human endeavors have promoted VC [59] and NPP improvement [73]. Regarding the negative impact of human activities, approximately 9.9% of pixels are detrimental to the NPP and most concentrated in the eastern region’s central and eastern coastal areas (Figure 5). Such a pattern can result from highly urbanized development, which causes declines in natural ecosystems, ecosystem environmental quality, and VC [76]. Related studies have confirmed that the reduction in vegetated areas and total NPP caused by urban expansion are the dominant manifestations of anthropogenic ecological destruction, which should be responsible for NPP reduction [30,63]. In addition, this study also observed the detrimental effects of human activities on vegetation productivity in the western and central regions. Even though climate variability leads to a decrease in NPP in both regions (12.11% and 15.21% of the pixels, respectively), topographic features, especially karst, also contribute to the decrease in NPP. Therefore, more ERPs should be made in fragile (i.e., the karst areas of northwest Guangxi) and highly urbanized areas (i.e., urban agglomeration areas) to compensate for the negative impacts of human disturbances.

4.3. Influences of Natural and Anthropogenic Factors on Spatial Patterns and Changes of NPP

Even though climate variability and anthropogenic activities are the two main factors influencing vegetation NPP, the comprehensive influence of climate conditions and anthropogenic factors is complicated, especially in areas with large Ele variability or high urbanization rates. Since local topography tends to affect the spatial variability of climatic variables and soil-water movement [17,18,64], Tem and Pre are often influenced by topography, thus interacting with Slo and Ele to affect the spatial pattern of NPP. Furthermore, anthropogenic activities represent a comprehensive index encompassing land cover change, population density, and economic development, which are all critical for vegetation dynamics [23,44].
In order to determine the explanatory power of natural and anthropogenic factors on the NPP spatial patterns and trends, this paper uses Tem, Pre, SR, Ele, Slo, Pop, GDP, and VC that reflect both natural conditions and anthropogenic activities. In general, VC is the determining factor influencing NPP spatial distribution across the entire study area and its three regions in 2000, 2010, and 2020. This is because VC is one of the most significant indicators of vegetation growth and production, meaning that areas with a high VC value are often accompanied by high photosynthetic efficiency, better vegetation growth, and high biomass [77]. In other words, the NPP and VC are intrinsically correlated within a certain ecosystem or region [78]. Moreover, implementing a series of large-scale ecological projects in Southern China has led to a significant increase in VC [43,66,79], thus directly contributing to NPP accumulation in the study area and its three regions. In addition to VC, topographic and socio-economic factors also greatly affect the NPP more than climatic factors (Table 2). Namely, even though the influence of climatic variables is more extensive, vegetation dynamics are less affected by them due to good hydrothermal conditions. However, the topography varies greatly, causing the western region to be fragmented with complex undulations and the central region to be characterized by karst topography, so Ele and Slo become the critical constraints on the spatial heterogeneity of vegetation across the study area. Therefore, topographic differences are also the reason for the variability in the subdominant control factors of the NPP spatial distribution across the three regions.
Regarding the NPP change from 2000 to 2020, VC change is also the most responsible for the NPP change across the entire research area. However, the q value still varies widely across the three regions, with the highest value occurring in the eastern one. Such a pattern may result from a more developed economy and relatively high Pop in the eastern region, resulting in a strong influence on land structure changes, especially vegetation structure. On the other hand, the topography in the western and central regions is characterized by high-altitude mountains and mounds, with relatively small VC change. Here, both Ele and Slo have a great influence on NPP distribution, which make the q value of VC lower in these regions. Furthermore, the subdominant factors vary significantly across regions. Pre and Tem, and SR and Pre are the subdominant factors in the western and central regions, while the impacts of Ele and Slo are more prominent in the eastern region (Table 2). This can result from a decreasing Pre trend in the western region and an increasing SR trend in the central region, possibly altering the hydrothermal environment and thus influencing the NPP trend [80]. However, topography, especially Ele, was more influential on vegetation dynamics in the eastern region.
In 2000, 2010, and 2020, the dominant interactive factors are characterized by the interaction between VC and climate variables (Figure 6), suggesting that the interaction of climate conditions and LULCC is decisive in the vegetation’s status and evolution vegetation ecosystem [81,82]. However, excluding the effect of VC, the dominant interactive factor across different regions changed significantly from 2000 to 2020. Namely, it changes from climatic variables with geographic factors to GDP and Pop with climatic and geographic factors. This shift indicates that anthropogenic activities become increasingly crucial to NPP distribution over the research period, particularly for the NPP trend. In addition, the effect of the interaction of anthropogenic factors is most prominent in the eastern region, which is consistent with the RESTREND method results.

4.4. Limitations and Uncertainties in NPP Estimates

The CASA model estimated the NPP under the key influencing factors, and the accuracy of the NPP estimation is crucial for quantifying the ecosystem’s carbon source and sink potential [83], particularly in areas with diverse vegetation resources, climatic resources, and ecological types [71]. This paper strictly operates the input factors within the model. The validation of the simulation results demonstrated that the CASA-modeled NPP results correlate highly with field observations, meaning that the simulated results are reliable in the TCT. However, there are still uncertainties in the NPP estimation due to the input data (e.g., vegetation classification, classification accuracy, data source differences, and limited meteorological stations in areas with Ele greater than 2000 m), parameters (e.g., εmax), and model structure. Furthermore, there are disparities between the spatial resolutions of the MODIS-NDVI and that of the meteorological data, which provide inaccurate atmospheric conditions at scales consistent with land surface heterogeneities [84]. Even though the paper reduces the consequent errors by resampling from the original Sinusoidal Projection, further adjustments and higher-resolution data are needed. In addition, although 47 field observations are sufficient for validation, the field values are collected from six observation stations with an uneven geographical distribution, which may have influenced the validation results. More than 90% of the field observations fall below the simulated NPP values (Figure 2), mainly attributed to differences between the remote sensing spatial resolution and the measured ground data sample size. For instance, while a single 250 × 250 m pixel may include numerous land cover types and encompass complex surface reflectance, the field observation quadrats contain only an individual vegetation type (areas are mostly 100 or 900 m2). Therefore, model parameter optimization, further field observations, and high spatial resolutions are needed for future simulation and validation.
Additionally, the RESTREND method is applied to analyze the influence of climate variability and human activities on the NPP. However, this method fails to account for complex interactions between multiple factors and reduces the nonlinear relationship between vegetation dynamics and influencing factors to a linear one [85,86], thus affecting result accuracy. Therefore, the effects of human–climate interactions require further analysis. Moreover, this paper selects only eight representative factors to evaluate the impact of natural and anthropogenic factors on NPP dynamics. However, the factors influencing the NPP are diverse, especially in the three regions. Thus, other factors not considered in this paper can affect the NPP, such as CO2 concentration, soil moisture, biological conditions, N deposition, forest age, vegetation phenology, droughts, pests, and plant diseases. Even though previous studies have shown that the impact of the above factors is relatively weak [87,88], their interaction with other factors should be considered in future work.

5. Conclusions

This paper determines the NPP in the TCT based on the CASA model. It then quantifies and isolates the influences of climatic variability and human activities on NPP variability across the TCT from 2000 to 2020. Lastly, the paper selects eight factors using the Geodetector to explore the impacts of independent factors and two-factor interactions on NPP spatial patterns and trends. The results showed that the spatial pattern of annual NPP increased from west to east and displayed an increasing trend for most of the study area. The NPP’s interannual variation was positively affected by climate variability and anthropogenic activities. NPP responded positively to Tem, Pre, and SR across the study area. In addition, anthropogenic activities contributed considerably more significantly to the NPP than climate variability in the western, central, and eastern regions. Regarding the effects of different factors on NPP, VC was the dominant factor in determining the spatial pattern and trend of NPP across TCT and the three regions. Conversely, climatic variables had the smallest explanatory power, except for topography in the western region and socio-economic factors, which were subdominant in the eastern region. The combined effect of the two-factor interaction on NPP was greater than that of the one factor. Namely, the interaction of human activities with natural factors was notably enhanced between 2000 and 2020. In addition, the interaction between VC and climate variability had a dominant influence on the NPP trend.

Author Contributions

Conceptualization, methodology, writing—original draft preparation, review, and editing, Y.W.; revision, supervision, funding acquisition, Z.W. All authors have read and agreed to the published version of the manuscript.

Funding

This research was funded by the National Natural Science Foundation of China (No. 61806059), the Key Special project for Introduced Talents Team of Southern Marine Science and Engineering Guangdong Laboratory (No. GML2019ZD0301), and NSFC-Guangdong Joint Foundation Key Project (No. U1901219).

Data Availability Statement

The MODIS-NDVI data are available from LAADS (Level-1 and Atmosphere Archive & Distribution System) DAAC (Distributed Active Archive Center) (https://ladsweb.modaps.eosdis.nasa.gov/ (accessed on 1 December 2021)), the land cover data are available from the Aerospace Information Research Institute of the Chinese Academy of Sciences (http://www.aircas.cas.cn/ (accessed on 1 January 2022)), the meteorological data are available from the Chinese National Metrological Information Center/China Meteorological Administration (NMIC/CMA) (http://data.cma.cn/ (accessed on 1 December 2021)), the DEM data are available from Geospatial Data Cloud (http://www.gscloud.cn/ (accessed on 1 February 2022)), the GDP and population density data are available from the Resource and Environment Science and Data Center (https://www.resdc.cn/ (accessed on 1 February 2022)), and the field-observed biomass data are available from the National Data Center for Ecological Sciences (http://www.nesdc.org.cn/ (accessed on 1 December 2021)).

Conflicts of Interest

The authors declare no conflict of interest.

References

  1. Field, C.B.; Behrenfeld, M.J.; Randerson, J.T.; Falkowski, P. Primary Production of the Biosphere: Integrating Terrestrial and Oceanic Components. Science 1998, 281, 237–240. [Google Scholar] [CrossRef] [PubMed] [Green Version]
  2. Gao, Q.Z.; Li, Y.; Wan, Y.F.; Qin, X.B.; Jiang, C.; Wang, Z.; Liu, Y.H. Dynamics of Alpine Grassland NPP and Its Response to Climate Change in Northern Tibet. Clim. Chang. 2009, 97, 515–528. [Google Scholar] [CrossRef]
  3. Foley, J.A.; DeFries, R.; Asner, G.P.; Barford, C.; Bonan, G. Global Consequences of Land Use. Science 2005, 309, 570–574. [Google Scholar] [CrossRef] [Green Version]
  4. Stevens-Rumann, C.S.; Kemp, K.B.; Higuera, P.E.; Harvey, B.J.; Rother, M.T.; Donato, D.C.; Morgan, P.; Veblen, T.T. Evidence for Declining Forest Resilience to Wildfires under Climate Change. Ecol. Lett. 2018, 21, 243–252. [Google Scholar] [CrossRef] [PubMed]
  5. Cheng, F.C.; Zhang, H.; Fan, W.J.; Harris, B. Image Recognition Technology Based on Deep Learning. Wirel. Pers. Commun. 2018, 102, 1917–1933. [Google Scholar] [CrossRef]
  6. Pei, F.S.; Li, X.; Liu, X.P.; Lao, C.H.; Xia, G.R. Exploring the Response of Net Primary Productivity Variations to Urban Expansion and Climate Change: A Scenario Analysis for Guangdong Province in China. J. Environ. Manag. 2015, 150, 92–102. [Google Scholar] [CrossRef]
  7. Woodward, F.I. Climate and Plant Distribution; Cambridge University Press: Cambridge, UK, 1987. [Google Scholar]
  8. Fang, J.Y.; Chen, A.P.; Peng, C.H.; Zhao, S.; Ci, L. Changes in Forest Biomass Carbon Storage in China between 1949 and 1998. Science 2001, 292, 2320–2322. [Google Scholar] [CrossRef]
  9. Li, Y.L.; Zhang, P.X.; Wang, C.K.; Liu, Y.; Zhao, Q.G. Changes of Vegetation Net Primary Productivity and Its Driving Factors from 2000 to 2011 in Guangxi, China. Acta Ecol. Sin. 2014, 34, 5220–5228. [Google Scholar]
  10. Guo, B.; Zang, W.; Yang, F.; Han, B.; Chen, S.; Liu, Y.; Yang, X.; He, T.; Chen, X.; Liu, C.; et al. Spatial and Temporal Change Patterns of Net Primary Productivity and Its Response to Climate Change in the Qinghai-Tibet Plateau of China from 2000 to 2015. J. Arid Land 2020, 12, 1–17. [Google Scholar] [CrossRef] [Green Version]
  11. Whitlock, C.; Bartlein, P.J. Vegetation and Climate Change in Northwest America during the Past 125kyr. Nature 1997, 388, 57–60. [Google Scholar] [CrossRef]
  12. Nemani, R.R.; Keeling, C.D.; Hashimoto, H.; Jolly, W.M.; Piper, S.C.; Tucker, C.J.; Myneni, R.B.; Running, S.W. Climate-Driven Increases in Global Terrestrial Net Primary Production from 1982 to 1999. Science 2003, 300, 1560–1563. [Google Scholar] [CrossRef] [PubMed] [Green Version]
  13. Potter, C.; Klooster, S.; Genovese, V. Net Primary Production of Terrestrial Ecosystems from 2000 to 2009. Clim. Chang. 2012, 115, 365–378. [Google Scholar] [CrossRef] [Green Version]
  14. Zhu, W.Q.; Pan, Y.Z.; Yang, X.Q.; Song, G.B. Comprehensive Analysis of the Impact of Climatic Changes on Chinese Terrestrial Net Primary Productivity. Chin. Sci. Bull. 2007, 52, 3253–3260. [Google Scholar] [CrossRef]
  15. Liang, W.; Yang, Y.T.; Fan, D.M.; Guan, H.; Zhang, T.; Long, D.; Zhou, Y.; Bai, D. Analysis of Spatial and Temporal Patterns of Net Primary Production and Their Climate Controls in China from 1982 to 2010. Agric. For. Meteorol. 2015, 204, 22–36. [Google Scholar] [CrossRef]
  16. Yin, K.; Tian, Y.C.; Yuan, C.; Zhang, F.F.; Yuan, Q.Z.; Hua, L.Z. NPP Spatial and Temporal Pattern of Vegetation in Beijing and Its Factors Explanation Based CASA Model. Remote Sens. Land Resour. 2015, 27, 133–139. [Google Scholar]
  17. Gao, Q.Z.; Wan, Y.F.; Li, Y.; Guo, Y.Q.; Ganjurjav; Qin, X.B.; Jiang, C.; Wang, Z.; Wang, B.S. Effects of Topography and Human Activity on the Net Primary Productivity (NPP) of Alpine Grassland in Northern Tibet from 1981 to 2004. Int. J. Remote Sens. 2013, 34, 2057–2069. [Google Scholar] [CrossRef]
  18. Chen, X.F.; Chen, J.M.; An, S.Q.; Ju, W.M. Effects of Topography on Simulated Net Primary Productivity at Landscape Scale. J. Environ. Manag. 2007, 85, 585–596. [Google Scholar] [CrossRef] [PubMed]
  19. Guo, B.; Zang, W.Q.; Luo, W. Spatial-Temporal Shifts of Ecological Vulnerability of Karst Mountain Ecosystem-Impacts of Global Change and Anthropogenic Interference. Sci. Total Environ. 2020, 741, 140256. [Google Scholar] [CrossRef]
  20. Liang, L.; Zhao, S.; Qin, Z.; He, K.; Chen, C.; Luo, Y.; Zhou, X. Drought Change Trend Using MODIS TVDI and Its Relationship with Climate Factors in China from 2001 to 2010. J. Integr. Agric. 2014, 13, 1501–1508. [Google Scholar] [CrossRef]
  21. Gu, F.X.; Zhang, Y.D.; Huang, M.; Tao, B.; Liu, Z.J.; Hao, M.; Guo, R.; Guo, R. Climate-Driven Uncertainties in Modeling Terrestrial Ecosystem Net Primary Productivity in China. Agric. For. Meteorol. 2017, 246, 123–132. [Google Scholar] [CrossRef]
  22. Wen, Z.; Wu, S.; Chen, J.; Lü, M. NDVI Indicated Long-Term Interannual Changes in Vegetation Activities and Their Responses to Climatic and Anthropogenic Factors in the Three Gorges Reservoir Region, China. Sci. Total Environ. 2017, 574, 947–959. [Google Scholar] [CrossRef]
  23. Peng, J.; Shen, H.; Wu, W.; Liu, Y.; Wang, Y. Net Primary Productivity (NPP) Dynamics and Associated Urbanization Driving Forces in Metropolitan Areas: A Case Study in Beijing City, China. Landsc. Ecol. 2016, 31, 1077–1092. [Google Scholar] [CrossRef]
  24. Zhang, Y.; Zhang, C.; Wang, Z.Q.; Chen, Y.Z.; Gang, C.C.; An, R.; Li, J.L. Vegetation Dynamics and Its Driving Forces from Climate Change and Human Activities in the Three-River Source Region, China from 1982 to 2012. Sci. Total Environ. 2016, 563–564, 210–220. [Google Scholar] [CrossRef]
  25. Mao, D.H.; Wang, Z.M.; Wu, C.S.; Song, K.S.; Ren, C.Y. Examining Forest Net Primary Productivity Dynamics and Driving Forces in Northeastern China during 1982-2010. Chin. Geogr. Sci. 2014, 24, 631–646. [Google Scholar] [CrossRef] [Green Version]
  26. Jiang, C.; Wu, Z.F.; Cheng, J.; Yu, Q.; Rao, X.Q. Impacts of Urbanization on Net Primary Productivity in the Pearl River Delta, China. Int. J. Plant Prod. 2015, 9, 581–598. [Google Scholar]
  27. Qu, S.; Wang, L.C.; Lin, A.W.; Zhu, H.J.; Yuan, M.X. What Drives the Vegetation Restoration in Yangtze River Basin, China: Climate Change or Anthropogenic Factors? Ecol. Indic. 2018, 90, 438–450. [Google Scholar] [CrossRef]
  28. Teng, M.J.; Zeng, L.X.; Hu, W.J.; Wang, P.C.; Yan, Z.G.; He, W.; Zhang, Y.; Huang, Z.L.; Xiao, W.F. The Impacts of Climate Changes and Human Activities on Net Primary Productivity Vary across an Ecotone Zone in Northwest China. Sci. Total Environ. 2020, 714, 136691. [Google Scholar] [CrossRef]
  29. Liu, X.; Liang, X.; Li, X.; Xu, X.; Ou, J.; Chen, Y.; Li, S.; Wang, S.; Pei, F. A Future Land Use Simulation Model (FLUS) for Simulating Multiple Land Use Scenarios by Coupling Human and Natural Effects. Landsc. Urban Plan. 2017, 168, 94–116. [Google Scholar] [CrossRef]
  30. Wu, Y.Y.; Luo, Z.H.; Wu, Z.F. The Different Impacts of Climate Variability and Human Activities on NPP in the Guangdong–Hong Kong–Macao Greater Bay Area. Remote Sens. 2022, 14, 2929. [Google Scholar] [CrossRef]
  31. Wu, Y.Y.; Luo, Z.H.; Wu, Z.F. Net Primary Productivity Dynamics and Driving Forces in Guangzhou City, China. Appl. Ecol. Environ. Res. 2018, 16, 6667–6690. [Google Scholar] [CrossRef]
  32. Zhou, A.P.; Xiang, W.S.; Yao, Y.F.; Huang, F.Z.; LI, X.K. Analyzing Variation Characteristics of Vegetation Net Primary Productivity (NPP) in Guangxi. Guihaia 2014, 34, 622–628. [Google Scholar]
  33. Bhattacharya, R.; Roy, R.; Das, R. Diversity and Distribution of Local Birds beside the Tropic of Cancer. Int. J. Environ. Sci. 2013, 3, 1321–1329. [Google Scholar] [CrossRef]
  34. Holben, B.N. Characteristics of Maximum-Value Composite Images from Temporal AVHRR Data. Int. J. Remote Sens. 1986, 7, 1417–1434. [Google Scholar] [CrossRef]
  35. Gong, Z.; Zhao, S.; Gu, J. Correlation Analysis between Vegetation Coverage and Climate Drought Conditions in North China during 2001–2013. J. Geogr. Sci. 2017, 27, 143–160. [Google Scholar] [CrossRef]
  36. Zhang, X.; Liu, L.Y.; Wu, C.S.; Chen, X.D.; Gao, Y.; Xie, S.; Zhang, B. Development of a Global 30 m Impervious Surface Map Using Multisource and Multitemporal Remote Sensing Datasets with the Google Earth Engine Platform. Earth Syst. Sci. Data 2020, 12, 1625–1648. [Google Scholar] [CrossRef]
  37. Zhang, X.; Liu, L.Y.; Chen, X.D.; Gao, Y.; Xie, S.; Mi, J. GLC_FCS30: Global Land-Cover Product with Fine Classification System at 30 m Using Time-Series Landsat Imagery. Earth Syst. Sci. Data 2021, 13, 2753–2776. [Google Scholar] [CrossRef]
  38. Zhang, L.P. Characteristics of CO2 Flux in a Chinses Fire Plantations Ecosystem in Huitong Country, Hunan Province. Masters’s Thesis, Central South University of Forestry & Technology, Changsha, China, 2010. [Google Scholar]
  39. Tan, Z.H.; Zhang, Y.P.; Schaefer, D.; Yu, G.R.; Liang, N.; Song, Q.H. An Old-Growth Subtropical Asian Evergreen Forest as a Large Carbon Sink. Atmos. Environ. 2011, 45, 1548–1554. [Google Scholar] [CrossRef]
  40. Zhao, Z.H. A Study on Carbon Flux between Chinese Fire Plantations and Atmosphere in Subtropical Belts. Ph.D. Thesis, Central South University of Forestry & Technology, Changsha, China, 2011. [Google Scholar]
  41. Sun, C.J. Study of CO2 Flux above Urban Green Space in Pearl River Delta. Master’s Thesis, Nanjing University of Information Science & Technology, Nanjing, China, 2012. [Google Scholar]
  42. Yu, G.R.; Zhu, X.J.; Fu, Y.L.; He, H.L.; Wang, Q.F.; Wen, X.-F.; Li, X.-R.; Zhang, L.M.; Zhang, L.; Su, W.; et al. Spatial Patterns and Climate Drivers of Carbon Fluxes in Terrestrial Ecosystems of China. Glob. Chang. Biol. 2013, 19, 798–810. [Google Scholar] [CrossRef]
  43. Zhou, W.S.; Zhang, C.T.; Zhou, Z.P. Correction of the Relationship between Altitude and Latitude of Vegetation Distribution. Sci. Sin. Vitae 2021, 51, 334–345. [Google Scholar] [CrossRef]
  44. Wu, Y.Y.; Wu, Z.F.; Liu, X.N. Dynamic Changes of Net Primary Productivity and Associated Urban Growth Driving Forces in Guangzhou City, China. Environ. Manag. 2020, 65, 758–773. [Google Scholar] [CrossRef]
  45. Potter, C.S.; Randerson, J.T.; Field, C.B.; Matson, P.A.; Vitousek, P.M.; Mooney, H.A.; Klooster, S.A. Terrestrial Ecosystem Production: A Process Model Based on Global Satellite and Surface Data. Glob. Biogeochem. Cycles 1993, 7, 811–841. [Google Scholar] [CrossRef]
  46. Field, C.B.; Randerson, J.T.; Malmström, C.M. Global Net Primary Production: Combining Ecology and Remote Sensing. Remote Sens. Environ. 1995, 51, 74–88. [Google Scholar] [CrossRef] [Green Version]
  47. Piao, S.L.; Fang, J.Y.; Zhou, L.M.; Zhu, B.; Tan, K.; Tao, S. Changes in Vegetation Net Primary Productivity from 1982 to 1999 in China. Glob. Biogeochem. Cycles 2005, 19, 1605–1622. [Google Scholar] [CrossRef] [Green Version]
  48. Ruimy, A.; Saugier, B.; Dedieu, G. Methodology for the Estimation of Terrestrial Net Primary Production from Remotely Sensed Data. J. Geophys. Res. 1994, 99, 5263. [Google Scholar] [CrossRef]
  49. Prince, S.D. A Model of Regional Primary Production for Use with Coarse Resolution Satellite Data. Int. J. Remote Sens. 1991, 12, 1313–1330. [Google Scholar] [CrossRef]
  50. Zhu, W.Q.; Pan, Y.Z.; He, H.; Yu, D.Y.; Hu, H.B. Simulation of Maximum Light Use Efficiency for Some Typical Vegetation Types in China. Chin. Sci. Bull. 2006, 51, 457–463. [Google Scholar] [CrossRef]
  51. Lin, P.L.; Brunsell, N. Assessing Regional Climate and Local Landcover Impacts on Vegetation with Remote Sensing. Remote Sens. 2013, 5, 4347–4369. [Google Scholar] [CrossRef] [Green Version]
  52. Yu, D.Y.; Shi, P.J.; Shao, H.B.; Zhu, W.Q.; Pan, Y.Z. Modelling Net Primary Productivity of Terrestrial Ecosystems in East Asia Based on an Improved CASA Ecosystem Model. Int. J. Remote Sens. 2009, 30, 4851–4866. [Google Scholar] [CrossRef]
  53. Gill, R.A.; Kelly, R.H.; Parton, W.J.; Day, K.A.; Jackson, R.B.; Morgan, J.A.; Scurlock, J.M.O.; Tieszen, L.L.; Castle, J.V.; Ojima, D.S. Using Simple Environmental Variables to Estimate Below-Ground Productivity in Grasslands. Glob. Ecol. Biogeogr 2002, 11, 79–86. [Google Scholar] [CrossRef]
  54. Wang, J.; Wang, K.L.; Zhang, M.Y.; Zhang, C.H. Impacts of Climate Change and Human Activities on Vegetation Cover in Hilly Southern China. Ecol. Eng. 2015, 81, 451–461. [Google Scholar] [CrossRef]
  55. Neeti, N.; Eastman, J.R. A Contextual Mann-Kendall Approach for the Assessment of Trend Significance in Image Time Series. Trans. GIS 2011, 15, 599–611. [Google Scholar] [CrossRef]
  56. Kendall, M.G. Rank Correlation Methods; Griffin: London, UK, 1975. [Google Scholar]
  57. McCuen, R.H. A Sensitivity and Error Analysis of Procedures Used for Estimating Evaporation. J. Am. Water Resour. Assoc. 1974, 10, 486–497. [Google Scholar] [CrossRef]
  58. Ge, W.Y.; Deng, L.Q.; Wang, F.; Han, J.Q. Quantifying the Contributions of Human Activities and Climate Change to Vegetation Net Primary Productivity Dynamics in China from 2001 to 2016. Sci. Total Environ. 2021, 773, 145648. [Google Scholar] [CrossRef] [PubMed]
  59. Tong, X.W.; Wang, K.L.; Yue, Y.M.; Brandt, M.; Liu, B.; Zhang, C.H.; Liao, C.J.; Fensholt, R. Quantifying the Effectiveness of Ecological Restoration Projects on Long-Term Vegetation Dynamics in the Karst Regions of Southwest China. Int. J. Appl. Earth Obs. Geoinf. 2017, 54, 105–113. [Google Scholar] [CrossRef] [Green Version]
  60. Luedeling, E.; Gassner, A. Partial Least Squares Regression for Analyzing Walnut Phenology in California. Agric. For. Meteorol. 2012, 158–159, 43–52. [Google Scholar] [CrossRef]
  61. Wang, J.F.; Xu, C.D. Geodetector: Principle and Prospective. Dili Xuebao/Acta Geogr. Sin. 2017, 72, 116–134. [Google Scholar] [CrossRef]
  62. Wang, J.F.; Li, X.H.; Christakos, G.; Liao, Y.L.; Zhang, T.; Gu, X.; Zheng, X.Y. Geographical Detectors-Based Health Risk Assessment and Its Application in the Neural Tube Defects Study of the Heshun Region, China. Int. J. Geogr. Inf. Sci. 2010, 24, 107–127. [Google Scholar] [CrossRef]
  63. Jiang, C.; Wu, Z.F.; Jiong, C.; Qian, L.X. Analyzing the Effects of Land Cover Change on Vegetation Net Primary Productivity in Guangdong Province. J. Nat. Resour. 2016, 31, 961–972. [Google Scholar]
  64. Guan, X.B.; Shen, H.F.; Member, S.; Li, X.H.; Gan, W.X. Climate Control on Net Primary Productivity in the Complicated Mountainous Area: A Case Study of Yunnan, China. IEEE J. Sel. Top. Appl. Earth Obs. Remote Sens. 2018, 11, 4637–4648. [Google Scholar] [CrossRef]
  65. Wang, S.Y.; Hu, W.Y. Remote Sensing Estimation of Net Primary Productivity of Vegetation (NPP) in Yunnan Province Based on CASA Model. Yunnan Geogr. Environ. Res. 2019, 31, 71–78. [Google Scholar]
  66. Chen, W.; Bai, S.; Zhao, H.M.; Han, X.R.; Li, L.H. Spatiotemporal Analysis and Potential Impact Factors of Vegetation Variation in the Karst Region of Southwest China. Environ. Sci. Pollut. Res. 2021, 28, 61258–61273. [Google Scholar] [CrossRef] [PubMed]
  67. Zhang, Y.L.; Song, C.H.; Zhang, K.R.; Cheng, X.L.; Zhang, Q.F. Spatial-Temporal Variability of Terrestrial Vegetation Productivity in the Yangtze River Basin during 2000–2009. J. Plant Ecol. 2014, 7, 10–23. [Google Scholar] [CrossRef] [Green Version]
  68. Tong, X.W.; Wang, K.L.; Brandt, M.; Yue, Y.M.; Liao, C.J.; Fensholt, R. Assessing Future Vegetation Trends and Restoration Prospects in the Karst Regions of Southwest China. Remote Sens. 2016, 8, 357. [Google Scholar] [CrossRef] [Green Version]
  69. Ma, J.; Weng, B.; Bi, W.X.; Xu, D.; Xu, T.; Yan, D.M. Impact of Climate Change on the Growth of Typical Crops in Karst Areas: A Case Study of Guizhou Province. Adv. Meteorol. 2019, 2019, 1401402. [Google Scholar] [CrossRef]
  70. Qu, S.; Wang, L.C.; Lin, A.W.; Yu, D.Q.; Yuan, M.X.; Li, C.A. Distinguishing the Impacts of Climate Change and Anthropogenic Factors on Vegetation Dynamics in the Yangtze River Basin, China. Ecol. Indic. 2020, 108, 105724. [Google Scholar] [CrossRef]
  71. Liu, S.; Wang, B.; Zhang, J.; Cai, D.; Tian, G.; Zhang, G. Predicting the Seasonal NDVI Change by GIS Geostatistical Analyst and Study on Driver Factors of NDVI Change in Hainan Island, China. J. Geosci. Environ. Prot. 2016, 04, 92–100. [Google Scholar] [CrossRef] [Green Version]
  72. Piao, S.L.; Fang, J.Y.; Chen, A.P. Seasonal Dynamics of Terrestrial Net Primary Production in Response to Climate Changes in China. Acta Bot. Sin. 2003, 45, 269–275. [Google Scholar]
  73. Zhang, Y.L.; Song, C.H.; Zhang, K.R.; Cheng, X.L.; Band, L.E.; Zhang, Q.F. Effects of Land Use/Land Cover and Climate Changes on Terrestrial Net Primary Productivity in the Yangtze River Basin, China, from 2001 to 2010. J. Geophys. Res. Biogeosci. 2014, 119, 1092–1109. [Google Scholar] [CrossRef]
  74. Zhang, Y. A Time-Series Approach to Detect Urbanized Areas Using Biophysical Indicators and Landsat Satellite Imagery. IEEE J. Sel. Top. Appl. Earth Obs. Remote Sens. 2021, 14, 9210–9222. [Google Scholar] [CrossRef]
  75. Zhao, S.; Wu, X.Q.; Zhou, J.X.; Pereira, P. Spatiotemporal Tradeoffs and Synergies in Vegetation Vitality and Poverty Transition in Rocky Desertification Area. Sci. Total Environ. 2021, 752, 141770. [Google Scholar] [CrossRef]
  76. Wen, X.D.; Luo, Z.H.; Fu, L.G. Effects of Climate and Land Use Change on NPP in Guangdong- Hong Kong-Macao Greater Bay Area. Guangxi Sci. 2021, 28, 290–300. (In Chinese) [Google Scholar]
  77. Ren, Y.M.; Zhou, T.G.; Li, H.Z. Research on the Urban Ecological Environment Pattern in the Main Urban Area of Chongqing Based on Remote Sensing and POI Data. Prog. Geophys. 2021, 36, 766–778. [Google Scholar]
  78. Chen, Y.Z.; Chen, L.Y.; Cheng, Y.; Ju, W.M.; Chen, H.Y.H.; Ruan, H.H. Afforestation Promotes the Enhancement of Forest LAI and NPP in China. For. Ecol. Manag. 2020, 462, 117990. [Google Scholar] [CrossRef]
  79. Zhang, M.Y.; Wang, K.L.; Liu, H.Y.; Wang, J.; Yue, Y.M. Impacts of Ecological Restoration on Vegetation Carbon Storage in the Typical Karst Region of Northwest Guangxi, China. Chin. J. Ecol. 2014, 33, 2288–2295. [Google Scholar] [CrossRef]
  80. Zhang, X.M.; Yue, Y.M.; Tong, X.W.; Wang, K.; Qi, X.K.; Deng, C.X.; Brandt, M. Eco-Engineering Controls Vegetation Trends in Southwest China Karst. Sci. Total Environ. 2021, 770, 145160. [Google Scholar] [CrossRef]
  81. Chen, S.T.; Guo, B.; Zhang, R.; Zang, W.Q.; Wei, C.X.; Wu, H.W.; Yang, X.; Zhen, X.Y.; Li, X.; Zhang, D.F.; et al. Quantitatively Determine the Dominant Driving Factors of the Spatial—Temporal Changes of Vegetation NPP in the Hengduan Mountain Area during 2000–2015. J. Mt. Sci. 2021, 18, 427–445. [Google Scholar] [CrossRef]
  82. Yin, L.; Dai, E.; Zheng, D.; Wang, Y.; Ma, L.; Tong, M. What Drives the Vegetation Dynamics in the Hengduan Mountain Region, Southwest China: Climate Change or Human Activity? Ecol. Indic. 2020, 112, 106013. [Google Scholar] [CrossRef]
  83. Zhao, M.; Running, S.W. Drought-Induced Reduction in Global Terrestrial Net Primary Production from 2000 through 2009. Science 2010, 329, 940–943. [Google Scholar] [CrossRef] [Green Version]
  84. Garbulsky, M.F.; Peñuelas, J.; Papale, D.; Ardö, J.; Goulden, M.L.; Kiely, G.; Richardson, A.D.; Rotenberg, E.; Veenendaal, E.M.; Filella, I. Patterns and Controls of the Variability of Radiation Use Efficiency and Primary Productivity across Terrestrial Ecosystems. Glob. Ecol. Biogeogr. 2010, 19, 253–267. [Google Scholar] [CrossRef]
  85. Chen, T.; Tang, G.; Yuan, Y.; Guo, H.; Xu, Z.; Jiang, G.; Chen, X. Unraveling the Relative Impacts of Climate Change and Human Activities on Grassland Productivity in Central Asia over Last Three Decades. Sci. Total Environ. 2020, 743, 140649. [Google Scholar] [CrossRef]
  86. Jiang, H.; Xu, X.; Guan, M.; Wang, L.; Huang, Y.; Jiang, Y. Determining the Contributions of Climate Change and Human Activities to Vegetation Dynamics in Agro-Pastural Transitional Zone of Northern China from 2000 to 2015. Sci. Total Environ. 2020, 718, 134871. [Google Scholar] [CrossRef] [PubMed]
  87. Zhao, F.; Zhang, J.Y.; Liu, S.Y.; Wang, Z.Y.; Wang, L.H.; Gu, H.T.; Li, W.L. Assessing the Dividing Line between Warm Temperate and Subtropical Zones Based on the Zonality Discussion on Multi-Dimensional Response of Net Primary Productivity to Climate Change in the Qinling-Daba Mountains. Acta Ecol. Sin. 2021, 41, 57–68. [Google Scholar]
  88. Sui, X.H.; Zhou, G.S.; Zhuang, Q.L. Sensitivity of Carbon Budget to Historical Climate Variability and Atmospheric CO2 Concentration in Temperate Grassland Ecosystems in China. Clim. Chang. 2013, 117, 259–272. [Google Scholar] [CrossRef]
Figure 1. Location of the Tropic of Cancer transect. (a) Elevation, meteorological stations, and ecological sites, and (b) land cover in 2000.
Remotesensing 15 01091 g001
Figure 2. Comparison between the simulated NPP from the CASA model and the field-observed NPP in the TCT.
Remotesensing 15 01091 g002
Figure 3. (a) Spatial patterns of mean NPP, (b) NPP change trends during the period 2000–2020, and (c) slope significance tests of NPP trends in the TCT. DS and DVS denote a significant (0.01< p ≤ 0.05) and very significant (p ≤ 0.01) decrease, respectively; IS and IVS denote a significant (0.01< p ≤ 0.05) and very significant (p ≤ 0.01) increase, respectively; and D_NS and I_NS denote a non-significant (p > 0.05) decrease or increase.
Remotesensing 15 01091 g003
Figure 4. Partial correlations between NPP and (a) Tem, (b) Pre, and (c) SR.
Remotesensing 15 01091 g004
Figure 5. (a) Effects of climate variability and anthropogenic activities on NPP in the TCT and the three regions and (b) the corresponding percentage contribution. Cli_positive effects and Cli_negative effects, UF_positive effects and UF_negative effects represent positive and negative effects of climate variability and anthropogenic activities on NPP, respectively.
Remotesensing 15 01091 g005aRemotesensing 15 01091 g005b
Figure 6. Interaction effect between natural and anthropogenic factors on NPP in 2000, 2010, and 2020, and NPP change trend in the TCT and three regions from 2000 to 2020.
Remotesensing 15 01091 g006
Figure 7. Correlation between mean NPP and (a) Ele, (b) GDP, and (c) Pop in the three regions.
Remotesensing 15 01091 g007
Figure 8. Average annual Tem and total Pre at different elevations.
Remotesensing 15 01091 g008
Table 1. Description of driving factors of NPP spatial pattern and change trend.
FactorsIndexesMeaningsAbbreviationRepresentative Years/Period
Natural factors Temperatureclimate variablesTem2000, 2010, 2020/2000–2020
PrecipitationPre
Solar radiationSR
ElevationTopographical factorsEle
SlopeSlo
Anthropogenic factorsPopulation densityPopulation distributionPop2000, 2010, 2020/2000–2020
GDPRegional economic situation and development levelGDP
Vegetation coverageStatus and richness of vegetationVC
Table 2. Determinant power of eight factors on the spatial pattern of NPP in 2000, 2010, and 2020 and on the NPP change trend from 2000 to 2020.
Year/PeriodStudy Area and SubregionsTemPreSREleSloPopGDPVC
2000TCT0.120 0.094 0.103 0.257 0.367 0.306 0.237 0.604
western region0.415 0.340 0.474 0.178 0.264 0.413 0.142 0.684
central region0.102 0.025 0.017 0.311 0.320 0.296 0.275 0.501
eastern region0.132 0.076 0.042 0.540 0.613 0.536 0.514 0.826
2010TCT0.081 0.086 0.117 0.214 0.276 0.296 0.295 0.646
western region0.352 0.092 0.509 0.206 0.151 0.370 0.165 0.591
central region0.173 0.211 0.062 0.060 0.074 0.137 0.160 0.440
eastern region0.173 0.060 0.142 0.416 0.522 0.489 0.544 0.829
2020TCT0.062 0.084 0.110 0.317 0.362 0.366 0.359 0.650
western region0.238 0.174 0.438 0.236 0.122 0.383 0.173 0.493
central region0.120 0.125 0.056 0.171 0.139 0.209 0.279 0.491
eastern region0.131 0.051 0.142 0.538 0.631 0.577 0.583 0.872
NPP change trend from 2000 to 2020TCT0.059 0.029 0.058 0.058 0.088 0.017 0.006 0.196
western region0.143 0.008 0.275 0.091 0.036 0.027 0.004 0.266
central region0.074 0.198 0.106 0.034 0.034 0.010 0.007 0.238
eastern region0.073 0.062 0.067 0.120 0.174 0.025 0.009 0.486
Disclaimer/Publisher’s Note: The statements, opinions and data contained in all publications are solely those of the individual author(s) and contributor(s) and not of MDPI and/or the editor(s). MDPI and/or the editor(s) disclaim responsibility for any injury to people or property resulting from any ideas, methods, instructions or products referred to in the content.

