Abstract
In this study, we compare the data of the advanced geostationary radiation imager (AGRI) on board the FY-4B and the advanced meteorological imager (AMI) on board the GK-2A, in terms of overall data, different reflectivity/brightness temperature intervals, different regions, and different underlying surfaces. The results show that the AGRI and AMI data are generally consistent; the mean biases for reflectivity channels show a range of 0.50% to 1.69%, with channel VIR004 being exceptionally good, while brightness temperature (TB) differences in the IR channels ranging from 0.11 to 0.57 K, with channel IR120 being the most accurate. The reflectivity of the AGRI is higher than that of the AMI in terms of mean bias. The dispersion of the reflectivity difference between the AGRI and AMI is smaller at the short-wavelength channels than that at the longer-wavelength channels. The TB data observed by the AGRI are higher than those of AMI at conditions above 310 K. In the case of observing the same target, the difference in infrared brightness temperature due to the random noise signal is small. The differences between the two sensors can be considerably reduced by revising mean biases. In the following studies of quantitative product algorithms, the characteristics of sensor data need to be further analyzed in detail.
1. Introduction
Geostationary satellite data plays an essential role in monitoring wildfires, catastrophic weather, dust weather, and haze weather, with its advantage of all-weather and high-timeliness observations [1,2,3,4]. Global geostationary satellites are continuously updated. The new-generation geostationary satellites, the Fengyun-4B (FY-4B) from China and the Geo-Kompsat-2A (GK-2A) from Korea are both available to serve the China region. The main payloads, the advanced geostationary radiation imager (AGRI) for the FY-4B and the advanced meteorological imager (AMI) for the GK-2A, have similar instrument functions and performances. Combining the same quantitative products from the two satellites can better satisfy the growing demand for quantitative product applications [5]. Thus, continuous and long-term observation data are obtained, which is essential for studying the changes and trends of the Earth’s environment, weather forecasting, and climate change monitoring. However, since the quantitative products (such as land and sea surface temperature) highly depend on the radiation response characteristics of instrument channel data, it is of great significance to improve the application services of the AGRI and AMI data while analyzing and comparing the differences in radiation response characteristics of the two instrument data.
The FY-4B satellite was successfully launched on 3 June 2021 [6]; it is the first operational satellite of the Chinese second-generation geostationary meteorological satellite series. It is fixed at 133.0°E to conduct operational services. The AGRI on board the FY-4B has 15 channels. Compared with the FY-4A, the FY-4B/AGRI adds a water vapor channel and adjusts the spectra of some channels to improve refined observations. The spatial resolution of the AGRI is 0.5–4 km, and the temporal resolution for full-disk observation is 15 min. The GK-2A is a new-generation Earth observation satellite from Korea; it was launched on 5 December 2018 and fixed at 128.2°E [7,8,9]. The GK-2A satellite carries a new AMI, whose main parameters are similar to those of the Japanese geostationary meteorological satellite Himawari-8 [10]. The spectral range of AMI is 0.47–13.3 µm, covering the visible, short-wave infrared (IR), mid-wave IR, and long-wave IR spectral bands. The AMI has 16 channels, with maximum spatial resolutions of 500 m at the visible channel and 2 km at the IR channel, and a temporal resolution of 10 min.
Regarding the radiometric calibration of the two remote sensors, Dohyeong et al. [11] compared the IR channel data of the Himawari-8/Advanced Himawari Imager (AHI) with that of the GK-2A/AMI. The results indicated that the brightness temperature (TB) data at each IR channel are quite similar between the Himawari-8/AHI and the GK-2A/AMI, with mean biases of less than 0.1 K and without noticeable diurnal variation in biases. Liang et al. [12] compared the consistency of bright temperature data between AHI, VIIRS, and MODIS, five AHI bands are found to be low relative to the VIIRS and MODIS. Yu et al. [13] compared AHI and NPP/VIIRS data and found that they were in good agreement. The global space-based inter-calibration system has studied the radiometric calibration of geostationary satellite data through transfer calibration [14,15] and has given the correction results of radiometric calibration coefficients. However, even if a high-precision radiometric calibration is completed, the observed values from different remote sensors are naturally different [16,17], even for the same target. This is due to the coupling effect between the reflectivity (emissivity) curve of a target and the spectral response function (SRF) of a channel.
In terms of methods to compare the differences in remote sensor data, Chen [18], Tang [19], and Hu et al. [20] used the simultaneous sub-satellite observation data from polar-orbiting satellites to analyze the differences in TB data, observation time, etc. Hewison [21] and Huang [22] analyzed the differences in data from different remote sensors by using indicators such as mean bias (Bias), root mean square error (RMSE), and correlation coefficient (R). Referring to these mature data preprocessing methods and mathematical indicators, we evaluate the differences in the radiation response characteristics between the AGRI and AMI in this study by using the near-simultaneous and co-located observation data from the FY-4B and GK-2A. Based on the analysis of the overall samples and the consistency of the eight matched channels of the AGRI and AMI, the consistency and dispersion of the two sensor data are further analyzed in the three aspects of reflectivity/TB intervals, spatial area, and the underlying surface. We will start with a general cross-comparison of comprehensive data and deduct possible bias corrections. We will also compare the results for different areas in China, as well as a focused study on different underlying surfaces.
2. Instrument and Channel Descriptions
The AGRI is carried on board the FY-4B geostationary meteorological satellite and has six solar reflectance bands and nine IR bands, with spatial resolutions of 500 m for one channel, 1000 m for two channels, 2000 m for four channels, and 4000 m for eight channels. The AMI has six reflectivity channels with spatial resolutions of 500 m for one channel, 1000 m for three channels, and 2000 m for two channels. In addition, the AMI has 10 IR channels with a spatial resolution of 2000 m. The instrument parameters of the FY-4B/AGRI and GK-2A/AMI are shown in Table 1.

Table 1.
Instrument parameters of the AGRI and AMI.
Considering the remote sensing observation data required for typical quantitative products, such as fire detection, we mainly focused on eight typical channels in this study, as shown in Table 2. Among them, VIR004, NR008, NR013, NR016, IR038 (H), IR038 (L), IR108, and IR120 represent the bands with central wavelengths of 0.47 µm, 0.83/0.86 µm, 1.37/1.38 µm, 1.61/1.63 µm, 3.75 H/3.8 µm, 3.75 L/3.8 µm, 10.8/10.5 µm, 12.0/12.3 µm, respectively. The SRF of each channel is shown in Figure 1. By analyzing the SRFs, it can be found that the wavelength positions of the two sensors are similar. However, the wavelength centers and bandwidths are slightly different. When the spectral curves of the ground objects are coupled, the reflectivity or TB at the same channel displays differences.
Table 2.
Central wavelengths and resolution of FY-4B/AGRI and GK-2A/AMI matched channels.
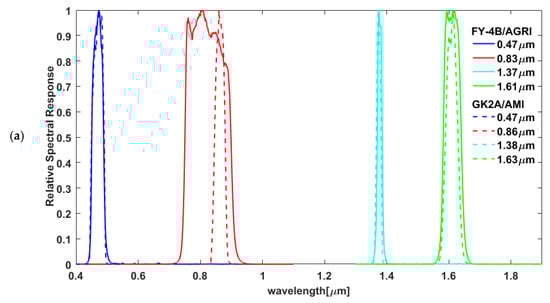
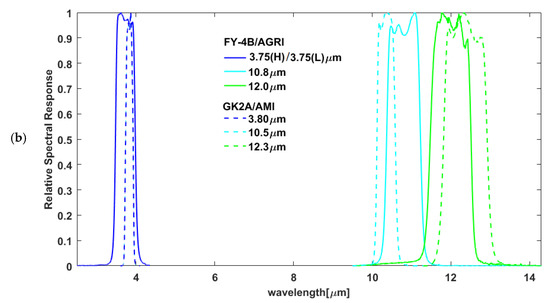
Figure 1.
Spectral response functions of the (a) reflectivity channels and (b) IR channels corresponding to the FY-4B/AGRI and GK-2A/AMI.
3. Cross-Comparison Method
3.1. Data Processing
Considering the differences in observation time and spatial resolution of the two remote sensor data and in order to effectively compare the matched sample points, the AGRI and AMI channel data need to be processed, including spatial resolution matching, uniformity control, and noise suppression.
- In terms of spatial resolution matching, the original channel images are uniformly projected onto a 0.02° grid with equal latitudes and longitudes by using the nearest-neighbor interpolation method, and the differences in data are quantitatively compared at this resolution.
- For uniformity control, if the standard deviations of the TB values at a point and its eight adjacent points exceed 3 K, or the standard deviations of the reflectivity at the above points exceed 0.1, the data at the point and its eight adjacent points are removed.where and represent the standard deviations of the TB data and the reflectivity data within a spatial window of 3 × 3, respectively.
- Regarding noise suppression, since the spatial positioning of the two sensors is difficult to be entirely consistent, there are some positioning biases, which may cause the uncertainty of comparison. In order to reduce the comparison uncertainty due to spatial positioning bias, we need to smooth the 0.02° grid data by taking the average value of the values at a point and its eight adjacent points as the data at this point.where represents the smoothed TB data, the average of the TB data within the spatial window of 3 × 3, the smoothed reflectivity data, and the average of the reflectivity data within the spatial window of 3 × 3.
3.2. Statistical Analysis
In this study, the statistical indicators, Bias, RMSE, and R, are selected for statistical analysis. Among them, the mean bias is used to examine the systematic differences between the two remote sensor data, the RMSE is applied to evaluate the dispersion of the data, and the R is utilized to investigate the consistency of the data. The statistical indicators are calculated as follows (Equations (3)–(5)).
where represents the channel data of the FY-4B/AGRI, the channel data of the GK-2A/AMI, n the number of AGRI and AMI matched sample points, and the covariance of and . In addition, and denote the variances of and , respectively.
4. Results and Discussion
4.1. Comparative Analysis of the Overall Data
The data at each channel of the AGRI and AMI are compared and statistically analyzed by using the above cross-comparison method. AGRI data and AMI data from 8 March and 23 March 2022 (the time is from 4:30 to 6:30 UTC) were analyzed in the domain (14°N to 54°N and 70°E to 135°E). Figure 2 shows the scatter plot of the data at each channel of the AGRI and AMI. It can be found that the distribution of the matched points is relatively clustered, and the dynamic range covered by the sample points is wide, which can basically reflect the radiation response of the remote sensors to the energy reflected/emitted from the main object.
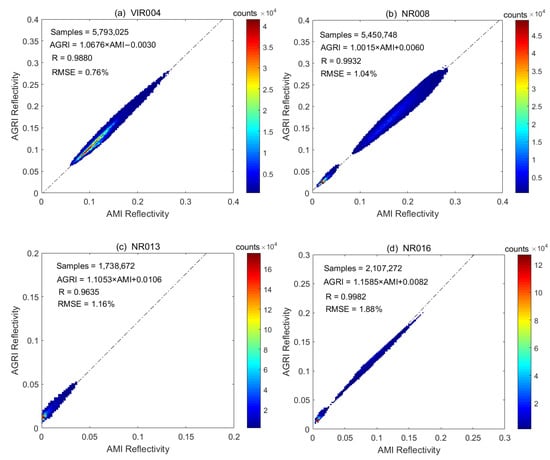
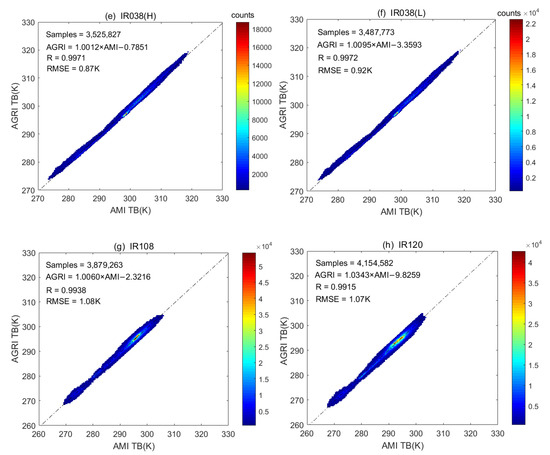
Figure 2.
Scatter plot of the data at each channel of the AGRI and AMI. The different colors indicate the aggregation of data points. For (a) VIR004, (b) NR008, (c) NR013, (d) NR016, (e) IR038 (H), (f) IR038 (L), (g) IR108, and (h) IR120.
Table 3 shows the statistical results of the data at each matched channel, i.e., the linear regression equations, mean biases, RMSE values, and R values. The results suggest that the R values at each channel are above 0.96, and the slopes of the fitting lines are between 1.0012 and 1.1585, close to 1, indicating that the observation data of the AGRI and AMI are in good agreement.
Table 3.
Comparison of the data at the matched channels between the FY-4B/AGRI and GK-2A/AMI. “Bias” denotes the mean bias, “RMSE” represents the root mean square error, and “R” indicates the correlation coefficient.
The data at channel VIR004 have the smallest mean bias and RMSE among the solar reflectivity channels, namely the mean bias of 0.50% and the RMSE of 0.76% (less than 1%). The data at channel NR016 have the largest mean bias of 1.69% and RMSE value of 1.88%. The reflectivity of the AGRI is higher than that of the AMI in terms of mean bias. The dispersion of the reflectivity difference between the AGRI and AMI is smaller at the short-wavelength channels than that at the longer-wavelength channels.
Except for channel IR120, the mean biases at IR channels are less than 0, indicating that the observed TB values of the AGRI are systematically lower than those of the AMI by about 0.5 K. The RMSE values at IR channels are between 0.87 K and 1.08 K, which are reasonable since the radiometric calibration accuracy is between 0.5 K and 0.7 K. When the AGRI and AMI observe the same target, the TB difference caused by the random noise signal is small. The spectral corrections of the two remote sensors were not performed. Correcting the SRF difference mainly uses the convolution of the ground radiation spectrum with SRF. It is difficult to quantitatively estimate the effect of the spectral response on the observed values when the ground target is unknown. Thus, it may be the one reason for the discrepancies.
Figure 3 displays the statistical results of the reflectivity/TB frequency at each channel of the FY-4B/AGRI and GK-2A/AMI. The results indicate that the frequency at each channel of the two remote sensors shows a similar dynamic distribution, with relatively consistent trends. However, there are some channels with certain offsets. Specifically, channels VIR004, NR008, IR108, and IR120 have the closest frequency distributions, with small offsets, suggesting that the data from the AGRI and AMI have a good consistency. Compared with the AMI data, the distribution of the AGRI pixels at channels NR013 and NR016 shows a rightward shift, indicating that the observations of the AGRI are higher than those of the AMI, which is consistent with the results in Table 3. The distribution differences of channel NR013 are relatively significant, with the peak of AGRI at 0.02, and AMI at 0.0. This indicates that the reflectance of AMI is low and most of the data are close to 0. This is consistent with the properties of the water vapor absorption channel (1.37 µm), the signal from the bottom of the atmosphere to the land surface has no reflected energy entering the incoming pupil of the remote sensor because the energy is absorbed by water vapor. The peak of AGRI appears around 0.02, it is possible that the dark current meter value of the instrument is not cleanly rejected. There is also a case that the AMI’s dark current meter value is deducted too much. So the cause of this phenomenon may be caused by the difference in the values of the dark current meter.
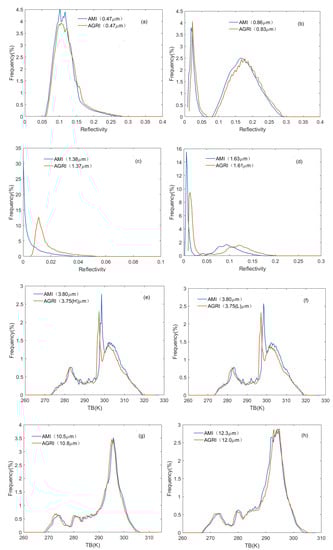
Figure 3.
Pixel frequency statistics at each AGRI (red line) and AMI (blue lines) channel. For (a) VIR004, (b) NR008, (c) NR013, (d) NR016, (e) IR038 (H), (f) IR038 (L), (g) IR108, and (h) IR120.
The distribution of the AGRI pixels at channels IR038 (H) and IR038 (L) shows a leftward shift compared with the AMI data, especially for the TB at the middle part of the dynamic range. The frequency distribution has a high consistency at the two ends of the dynamic range. This result suggests that the observations of the AGRI are lower than those of the AMI in the middle part of the dynamic range, and they are relatively consistent at the two ends of the dynamic range. Therefore, the statistical results of frequency distribution indicate that the differences in the observations between the two remote sensors vary with the reflected/emitted energy intervals. A more detailed analysis will be carried out in the following section.
The violin plot is used to analyze the bias distribution of the AGRI and AMI sample data (AGRI data minus AMI data), as shown in Figure 4. Overall, the bias distribution for each channel data shows a single-peaked feature (except for channel NR016), and it is relatively concentrated. The reflectance biases for the shortwave channels (VIR004 and NR008) are smaller than those for the longwave channels (NR013 and NR016), and biases are greater than 0. For the IR channels, most of the biases are less than 0 (except for IR120). The biases are mainly distributed between the 10th and 90th percentiles, and the median values of the biases for each channel data are 0.44%, 0.59%, 1.1%, 1.62%, −0.48 K, −0.59 K, −0.57 K, and 0.08 K. Since the median is a robust estimation, it is more robust to outlier noise in the sample. The median and mean values of the mean biases are relatively consistent, indicating that there are few extreme samples, and the samples of the AGRI and AMI have a relatively high matching degree.
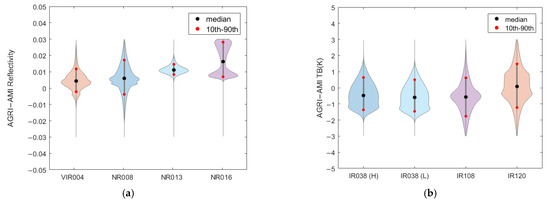
Figure 4.
Violin plot of the biases of the (a) reflectivity and (b) TB between the FY-4B/AGRI and GK-2A/AMI channel data. The “10th” and “90th” represent the 10th and 90th percentiles, respectively.
In terms of the reflectivity channels, the biases for channel VIR004 data between −0.2% and 1.2% account for 80% of the total number, and 80% of the biases for channel NR008 data are between −0.39% and 1.71%. Similarly, the bias ranges for the data at channels NR013 and NR016 are 0.83–1.47% and 0.70–2.81%, respectively. For the IR channels, the distribution pattern of the biases is relatively similar for each channel, with the main range being from −1.77 to 1.49 K. This result indicates that the radiometric response performance of IR channels is relatively consistent.
The overall results of the sample confirm that the channel settings of the two remote sensors are highly similar. For the same observed target, the same result should be observed theoretically. Meanwhile, the good consistency of the observations from the AGRI and AMI also indicates that the radiometric calibration accuracy of the two remote sensors is high, and the systematic biases caused by the radiometric calibration are not large.
4.2. Comparative Analysis of Different Reflectivity or Brightness Temperature Data
After analyzing the overall differences between the samples, we further investigated the differences between the AGRI and AMI data in different reflectivity/TB intervals in this section.
As shown in Figure 5, the distribution of the biases for different reflectivity/TB intervals at the AGRI and AMI channels indicates that at the solar reflectivity channels, the biases of the reflectivity data are mainly distributed in the range of 0–0.3. Except for channel NR013, the biases for different reflectivity intervals at the remaining channels are mostly greater than 0 and tend to increase with the reflectivity. The bias distributions at channels VIR004 and NR008 are relatively close, with ranges being from 0.25% to 1.53% and 0.45% to 1.06%, respectively, which are noticeably smaller than those at channel NR016 (biases of 0.88–2.77%). In addition, the biases of the data at channel NR013 show a large difference compared with the others, mainly because channel NR013 is a water vapor absorption channel. Except for the target high clouds, which are brighter, other targets exhibit lower brightness due to the solar radiation absorption of atmospheric water vapor. Channel NR013 data is mainly concentrated between 0 and 0.05. Since the sample size with the range of 0.05–0.3 is extremely small, it is not statistically significant and not analyzed here.
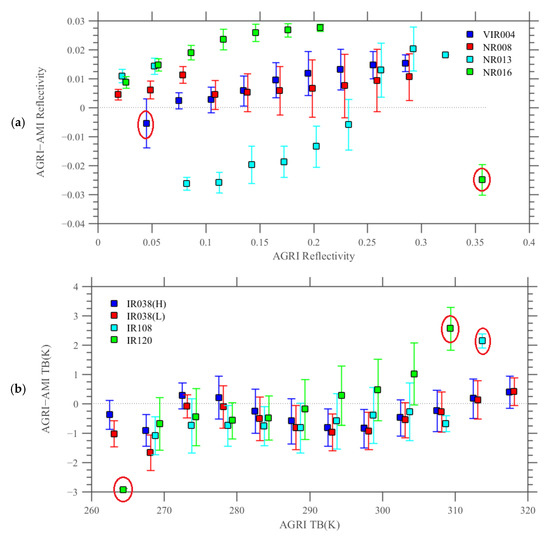
Figure 5.
Biases for different (a) reflectivity and (b) TB intervals at the AGRI and AMI channels. The sample points in the red circle are not considered because they are too few and not representative.
At IR channels, the TB data are mainly distributed in the range of 275–315 K, and the bias distribution of the TB displays different characteristics from that of the reflectivity. The bias distribution characteristics of the reflectivity are similar at channels IR038 (H), IR038 (L), and IR108, showing that the mean biases fluctuate with the TB variation, with small dispersion. The mean biases are relatively small for the TB data of 275–305 K and larger for the TB data of about 290 K (biases ranging from −0.98 to 0.28 K). The mean biases of the data at channel IR120 are distributed from −0.68 to 1.02 K, which decrease and then increase with the increasing TB. The biases of the TB of 270–290 K are negative, and those of the TB of 290–310 K are positive, suggesting that the TB observed by the AGRI is lower than that observed by the AMI under lower-temperature conditions and higher than that observed by the AMI under higher-temperature conditions.
Figure 6 presents the RMSE distribution for different reflectivity/TB intervals. For solar reflectivity channels, the RMSE increases with the reflectivity except for channel NR013. However, there are statistical anomalies in individual intervals due to their excessively few samples. The matched points at channel VIR004 are mainly distributed in the reflectivity range of 0.06–0.15, accounting for 82.97% of the total matched points. The RMSE value is small for the reflectivity of about 0.06, which is 0.37%. At channel NR008, the RMSE is relatively small for the reflectivity of about 0.03, which is 0.49%, and the RMSE is relatively large for the reflectivity of about 0.27, which is 1.43%. At channel NR016, a small RMSE of 0.90% appears for the reflectivity of about 0.03, accounting for 46.75% of the total matched points.
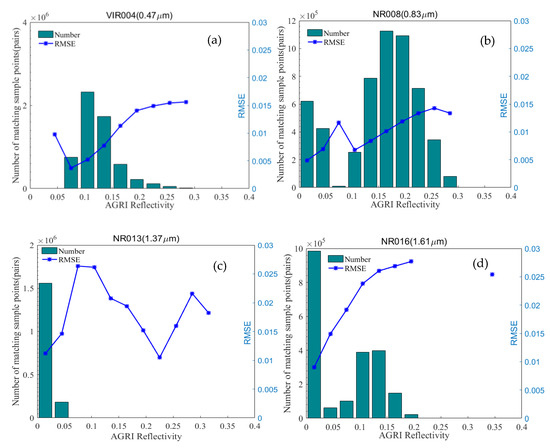
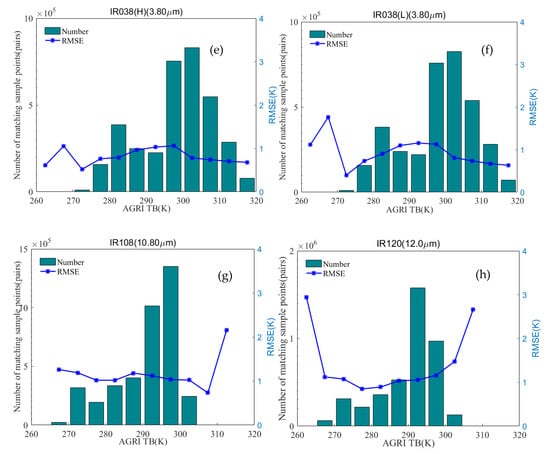
Figure 6.
Distributions of matched sample size (green bars) of the AGRI and AMI channel data and the RMSE values (blue dotted lines). For (a) VIR004, (b) NR008, (c) NR013, (d) NR016, (e) IR038 (H), (f) IR038 (L), (g) IR108, and (h) IR120.
Regarding the IR channels, the RMSE values at channels IR038 (H) and IR038 (L) increase and then decrease with the increasing TB, and the RMSE values of the TB of 270–320 K are 0.52–1.06 K at channel IR038 (H) and 0.40–1.16 K at channel IR038 (L). The RMSE values at channels IR108 and IR120 show a weak change trend in different TB intervals, which is about 1 K for the TB of 270–305 K.
For the solar reflectivity channels, the mean biases gradually increase with the reflectivity, which can be appropriately revised by the linear regression equations in Table 3. The RMSE increase indicates the gradual increase in random errors in the signal. This phenomenon is in accordance with the hardware characteristic of the photosensitive components of remote sensors in solar reflectivity bands, i.e., the random errors in the response signal gradually increase as the incident energy increases and finally reaches the equilibrium value.
At the IR channels, the mean biases fluctuate somewhat with the increasing TB. However, the fluctuation amplitude is small relative to the total mean bias, which can be appropriately revised by the mean biases in Table 3. The RMSE values fluctuate with the increasing TB. Similarly, the fluctuation amplitude is small relative to the total RMSE.
4.3. Comparative Analysis in Different Regions
4.3.1. Study Regions
In order to carefully analyze the influences of different regions on the consistency of the AGRI and AMI channel data, we divide the China region into five typical representative regions in this study according to geographical locations. These five study regions are Northeast China (A), Northwest China (B), the Huang-Huai region (C), South China (D), and Southwest China (E), as shown in Figure 7. The detailed latitudes and longitudes of the study regions are shown in Table 4.
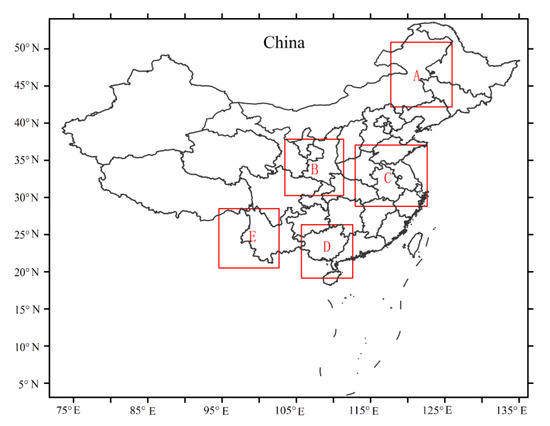
Figure 7.
Distributions of five typical representative regions. Red boxes indicate the extent of each study region. “A”–”E” represent “Northeast China”, “Northwest China”, ” Huang-Huai region”, “South China”, and “Southwest China” respectively.
Table 4.
Latitudes and longitudes of the study regions.
4.3.2. Comparative Analysis in Different Regions
Figure 8 displays the bias comparisons of the AGRI and AMI channel data in different regions. The results indicate that for the solar reflectivity channels, the mean biases of the reflectivity in each region are greater than 0. Among them, the mean biases of the reflectivity at channel NR016 are higher than those of the other three channels in each region, which is consistent with the bias distribution of the reflectivity of the overall samples. In terms of data dispersion in different regions, channels VIR004 and NR013 have a relatively concentrated data distribution, while the data distributions for channels NR008 and NR016 are relatively dispersed. The mean biases of the reflectivity at channels VIR004 and NR008 in the five study regions show a decreasing trend, followed by A, B, C, D, and E. The mean bias of the reflectivity at channel NR016 reaches a maximum value of 2.6% in region B and a minimum value of 1.5% in region E. Generally, the mean bias of the reflectivity at the three solar reflectivity channels is smaller in region E than that in the other regions. The mean bias of the reflectivity at channel NR013 varies less with regions, showing sensitivity to regions. Except for channel NR013, the mean biases at each channel are higher in region A than those in the other regions (except for channel NR016), and the mean biases at each channel are lower in region E than those in the other regions.
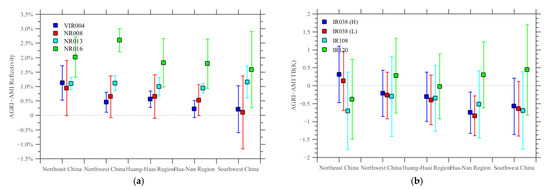
Figure 8.
Comparative analysis of the biases of the (a) reflectivity and (b) TB at the AGRI and AMI channels in different regions.
In terms of the two IR channels, IR038 (H) and IR038 (L), the mean biases of the TB are relatively close in different regions, with the largest in region A, similar values in regions B and C, and the smallest in regions D and E. The mean biases of the TB at channel IR108 are between −0.3 K and −0.7 K in different regions, which are not sensitive to the region. Comparatively, the mean biases at channel IR120 are positive in regions B, D, and E (0.3–0.5 K), and they are negative in regions A (about −0.4 K) and C (about −0.02 K). The mean biases of the TB at the split-window channels, IR108 and IR120, vary with regions, and the difference in the TB biases between channels IR108 and IR120 varies greatly.
The comparison results of the RMSE of the reflectivity and TB at each channel are shown in Figure 9. The results indicate that the RMSE values at the reflectivity channels are small in region D, ranging from 0.37% to 1.98%, while those are relatively large in regions A and E, ranging from 0.84% to 2.14%. For the RMSE comparison at the IR channels, the RMSE values are between 0.68 K and 1.33 K in different regions. The RMSE values of the TB in regions B and C are relatively small, ranging from 0.68 to 1.15 K, while the RMSE values of the TB in region E are larger, with values of 0.98–1.33 K.
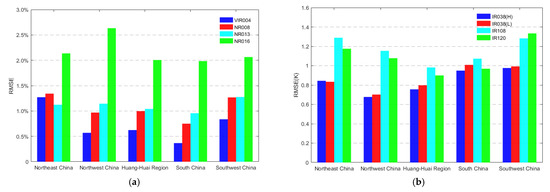
Figure 9.
Comparative analysis of RMSE values of the (a) reflectivity and (b) TB at the AGRI and AMI channels in different regions.
The RMSE indicates the dispersion degree of the data and includes the contribution of the mean bias. Thus, the RMSE values at channel NR016 are higher in all regions. In subsequent quantitative applications, at the channels with higher RMSE values, the correction of mean bias is beneficial to reduce the influence caused by the inconsistency of radiation response characteristics between the two remote sensors.
4.4. Comparative Analysis of Different Underlying Surfaces
Since different underlying surfaces have different effects on the observations at each channel, we further analyze the influences of different underlying surfaces on the consistency of the AGRI and AMI data. In this study, four underlying surface types, forest, water, cropland, and cloud, are selected for the comparative analysis according to the global land cover product with a fine classification system at 30 m in 2020 (GLC_FCS30-2020).
The comparisons of the reflectivity biases of AGRI and AMI data in different underlying surfaces (Figure 10) indicate that at all solar reflectivity channels, the mean biases of the reflectivity are greater than 0, indicating that the reflectivity observations of AGRI are generally higher than those of the AMI. On the water surface, the mean reflectivity biases are small and concentrated at all solar reflectivity channels, indicating that the reflectivity observations of the AGRI and AMI are relatively consistent on the water surface. In the cloud region, the mean reflectivity biases are large and scattered at all channels, which suggests that the observations of the cloud reflectivity from the AGRI are higher than those of the AMI. It should be noted that the average reflectivity from the AGRI is higher than that of the AMI at channel NR016 in forest and cropland regions, with an average value of 2.5%. The reflectivity of vegetation in the NIR band is higher than that in the visible band. The situation that the mean reflectivity bias of vegetation in the NIR band is markedly larger than that in the visible band requires further research on the influence of the coupling of the channel spectral response and reflectivity curve on the observations.
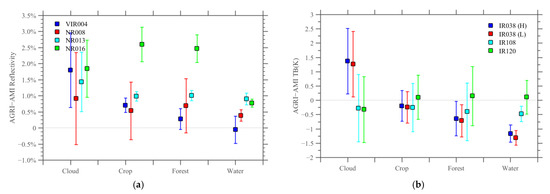
Figure 10.
Comparative analysis of the biases of the (a) reflectivity and (b) TB at the AGRI and AMI channels in different underlying surfaces.
At the IR channels IR038 (H) and IR038 (L), the mean TB biases are about 1.5 K when the observed target is a cloud system, indicating that the TB observations of the AGRI are higher than those of the AMI in these two IR channels. However, on the water surface, the TB of the AGRI at the two IR channels is about 1.5 K lower than that of the AMI. The mean TB biases at the two split-window channels IR108 and IR120 vary little with the different underlying surfaces, ranging from −0.5 to 0.2 K. In the comparison of IR038 data in cloud areas, some factors can lead to poor results. The height of the cloud top is unknown, and the cloud position will be slightly different when the same cloud is observed from different observation angles (satellite zenith angle and satellite azimuth angle). This factor leads to cloud pixels on the same latitude and longitude grid points that are not exactly matched, thus making the comparison data more scattered and increasing the value of the STD.
The comparisons of the RMSE of AGRI and AMI data in different underlying surfaces (Figure 11) show that at all solar reflectivity channels, the reflectivity RMSE values in different underlying surfaces range from 0.42% to 2.65%. The reflectivity RMSE is smaller on the water surface but larger in the cloud region, which is because the reflectivity of the water surface is low and uniform, while clouds have high reflectivity and complex structure texture. The reflectivity RMSE values in the forest and cropland regions are similar, about 1% at channels VIR004, NR008, and NR013 and approximately 2.5% at channel NR016. Combined with Figure 10a, it can be seen that the reflectivity RMSE values at channel NR016 contain the contribution of mean biases, and these biases are relatively concentrated. Therefore, the difference in the observations between the two remote sensors on the vegetation surface can be reduced by revising mean biases.
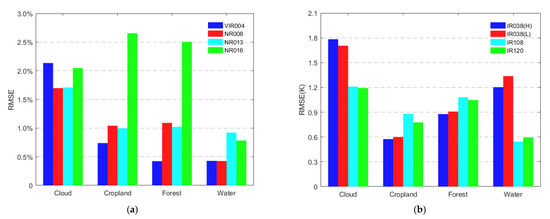
Figure 11.
Comparative analysis of RMSE values of the (a) reflectivity and (b) TB at the AGRI and AMI channels in different underlying surfaces.
For the IR channels, the two split-window channels, IR108 and IR120, have relatively consistent observations when the underlying surface is water, and the RMSE values of the TB are about 0.5 K. The RMSE values of the TB are about 0.9–1.2 K when the underlying surface is a non-water region. The RMSE values of the TB at channels IR038 (H) and IR038 (L) are about 1.8 K when the observed target is a cloud system, obviously higher than those at the two split-window channels. Combined with Figure 10b, it can be found that the data aggregation at the four IR channels is similar. Thus, the RMSE values at two channels IR038 (H) and IR038 (L) can be reduced to the same level as those of the split-window channels by revising mean biases. The RMSE at channels IR038 (H) and IR038 (L) on the water surface can reach 1.2 K. Referring to Figure 10b, the RMSE values at channels IR038 (H) and IR038 (L) are mainly contributed by the mean biases, and the dispersion degree of the data itself is lower than that at the split-window channels. Therefore, the difference in the observations between the two remote sensors can be considerably reduced by using the method of revising mean biases.
5. Conclusions
In order to improve the application services of geostationary meteorological satellites in China, we analyzed the relevant channel data of the FY-4B/AGRI and GK-2A/AMI for typical applications, such as fire point identification, and we evaluated the differences in the radiation response characteristics of the two remote sensors for the reflectivity and TB.
In general, the observations of the AGRI and AMI are in good agreement, with R values of more than 0.96 and RMSE values of less than 1.88%/1.08 K. The radiometric calibration accuracy of the two remote sensors is high, and the systematic bias caused by the radiometric calibration is not large. The reflectivity of the AGRI is higher than that of the AMI in terms of mean bias, reflectivities from the shortwave channels show a range of 0.50% to 1.69%, with channel VIR004 being exceptionally good with values of 0.50%. The dispersion of the reflectivity difference between the AGRI and AMI at the short-wavelength (0.41–0.96 µm) channels is smaller than that at the longer-wavelength (1.35–1.68 µm) channels. The mean biases in the IR channels range from 0.11 to 0.57 K, with channel IR120 being the most accurate with 0.11 K. The TB data observed by the AGRI are higher than those of AMI at conditions above 310 K. The mean biases of the NR013 channel are large (about 1.5%) and scattered when the observed target is a cloud; this is due to the fact that the NR013 channel contains information about the absorption of water vapor in the clouds, which are constantly changing. In the case of observing the same target, the difference in the TB due to the random noise signal is small.
Using multiple geostationary satellite products can improve the capability of quantitative remote sensing services. In this research, the differences in the radiation response characteristics of the two remote sensors are analyzed by comparing the FY-4B/AGRI and GK-2A/AMI data. The results indicate that these differences present different characteristics with changes in spatial regions, underlying surface types, and reflected/emitted energy. The analysis suggests that the data differences between the two remote sensors can be remarkably reduced by revising mean biases. However, considering the demand for refined services, in the subsequent development and improvement of quantitative product algorithms, and the fusion of multi-source quantitative products, it is necessary to further analyze and investigate data characteristics in detail for specific situations of applications, such as regions and underlying surface types. In particular, the effect of differences in the SRFs combined with the spectral curve of a specific target on quantitative products needs to be studied.
Author Contributions
Conceptualization, J.C. and L.X.; methodology, L.X., J.C., R.W. and S.W.; validation, J.C., R.W., L.X. and L.C.; investigation, J.C., S.W. and Z.X.; data curation, S.W. and Z.X.; writing—original draft preparation, L.X.; writing—review and editing, R.W. All authors have read and agreed to the published version of the manuscript.
Funding
This research was funded by the National Key R&D Program of China (grant number 2021YFC3000300).
Conflicts of Interest
The authors declare no conflict of interest.
References
- Chen, J.; Zheng, W.; Liu, C. Application of grassland fire monitoring based on Himawari-8 geostationary meteorological satellite data. J. Nat. Disasters 2017, 26, 197–204. [Google Scholar] [CrossRef]
- Chen, J.; Zheng, W.; Wu, S.; Liu, C.; Yan, H. Fire Monitoring Algorithm and Its Application on the Geo-Kompsat-2A Geostationary Meteorological Satellite. Remote Sens. 2022, 14, 2655. [Google Scholar] [CrossRef]
- Wang, X.; Tang, S.-H.; Cao, Z.-Q. Capability and latest progress of tropical cyclone monitoring over the Belt and Road area by FENGYUN meteorological satellites. J. Mar. Meteorol. 2020, 40, 10–18. [Google Scholar] [CrossRef]
- Gao, L.; Chen, L.; Li, J.; Li, C.-C.; Zhu, L. An improved dark target method for aerosol optical depth retrieval over China from Himawari-8. Atmos. Res. 2021, 250, 105399. [Google Scholar] [CrossRef]
- Roy, D.P.; Kovalskyy, V.; Zhang, H.K.; Vermote, E.F.; Yan, L.; Kumar, S.S.; Egorov, A. Characterization of Landsat-7 to Landsat-8 reflective wavelength and normalized difference vegetation index continuity. Remote Sens. Environ. 2016, 185, 57–70. [Google Scholar] [CrossRef]
- Zhang, P.; Xian, D.; Ke, L. Watching astronomy to observe time change—Exploring Fengyun Meteorological Satellites. Sci. Cult. Pop. Nat. 2021, 4, 8. [Google Scholar]
- Jang, J.-C.; Sohn, E.-H.; Park, K.-H. Estimating Hourly Surface Solar Irradiance from GK2A/AMI Data Using Machine Learning Approach around Korea. Remote Sens. 2022, 14, 1840. [Google Scholar] [CrossRef]
- Chung, S.-R.; Ahn, M.-H.; Han, K.-S.; Lee, K.-T.; Shin, D.-B. Meteorological Products of Geo-KOMPSAT 2A(GK2A) Satellite. Asia Pac. J. Atmos. Sci. 2020, 56, 185. [Google Scholar] [CrossRef]
- Choi, Y.-Y.; Suh, M.-S. Development of a Land Surface Temperature Retrieval Algorithm from GK2A/AMI. Remote Sens. 2020, 12, 3050. [Google Scholar] [CrossRef]
- Bessho, K.; Date, K.; Hayashi, M.; Ikeda, A.; Imai, T.; Inoue, H.; Yoshida, R. An introduction to Himawari-8/9-Japan’s new-generation geostationary meteorological satellites. J. Meteorol. Soc. Jpn. 2016, 94, 151–183. [Google Scholar] [CrossRef]
- Kim, D.; Gu, M.; Oh, T.-H.; Kim, E.-K.; Yang, H.-J. Introduction of the Advanced Meteorological Imager of Geo-Kompsat-2a: In-Orbit Tests and Performance Validation. Remote Sens. 2021, 13, 1303. [Google Scholar] [CrossRef]
- Liang, X.-M.; Ignatov, A.; Kramar, M.; Yu, F.-F. Preliminary Inter-Comparison between AHI, VIIRS and MODIS Clear-Sky Ocean Radiances for Accurate SST Retrievals. Remote Sens. 2016, 8, 203. [Google Scholar] [CrossRef]
- Yu, F.-F.; Wu, X.-Q. Radiometric Inter-Calibration between Himawari-8 AHI and S-NPP VIIRS for the Solar Reflective Bands. Remote Sens. 2016, 8, 165. [Google Scholar] [CrossRef]
- Wang, L.; Han, Y.; Jin, X.; Chen, Y.; Tremblay, D.-A. Radiometric consistency assessment of hyperspectral infrared sounders. Atmos. Meas. Tech. 2015, 8, 4831–4844. [Google Scholar] [CrossRef]
- He, X.-W.; Xu, N.; Feng, X.-H.; Hu, X.-Q.; Xu, H.-L.; Peng, Y. Assessing Radiometric Calibration of FY-4A/AGRI Thermal Infrared Channels Using CrIS and IASI. IEEE Trans. Geosci. Remote Sens. 2022, 60, 1–12. [Google Scholar] [CrossRef]
- Xie, L.-N.; Wu, S.; Chen, J.; Zheng, W.; Yan, H.; Xu, Z.-M. Cross-Comparison of channel parameters between FY-3E/MERSI-LL and Himawari-8/AHI in China. Int. J. Remote Sens. 2022, 43, 4663–4681. [Google Scholar] [CrossRef]
- Hu, Y.-H.; Zhang, Y.; Lin, Y.; Li, X.-M.; Dou, C.-Y.; Jia, G.-S.; Si, Y.-D.; Zhang, L.-J. Evaluation of the Radiometric Calibration of FY4A-AGRI Thermal Infrared Data Using Lake Qinghai. IEEE Trans. Geosci. Remote Sens. 2021, 59, 8040–8050. [Google Scholar] [CrossRef]
- Chen, J.; Wu, S.-L. Comparison Analysis between MWRI and AMSR-E Brightness Temperature Data over the Polar Region Ice Sheet. Remote Sens. Technol. Appl. 2014, 29, 752–760. [Google Scholar] [CrossRef]
- Tang, X.-T.; Chen, H.-H.; Guan, L.; Li, L.-L. Inter-calibration of FY-3B/MWRI and GCOM-W1/AMSR-2 brightness temperature over the Arctic. J. Remote Sens. 2020, 24, 1032–1044. [Google Scholar] [CrossRef]
- Hu, T.-X.; Zhao, T.-J.; Shi, J.-C.; Gu, J.-Z. Inter-calibration of AMSR-E and AMSR2 Brightness Temperature. Remote Sens. Technol. Appl. 2016, 31, 919–924. [Google Scholar] [CrossRef]
- Hewison, T.-J.; Wu, X.-Q.; Yu, F.-F.; Tahara, Y.; Hu, X.-Q.; Kim, D.; Koenig, M. GSICS inter-calibration of infrared channels of geostationary imagers using Metop/IASI. IEEEE Geosci. Remote Sens. 2013, 51, 1160–1170. [Google Scholar] [CrossRef]
- Huang, Q.; Wang, R.-M.; Xiang, J.-Y.; Qin, G.-H. Spatial and temporal applicability of three precipitation products in the Yalong River basin. J. China Hydrol. 2020, 40, 14–21. [Google Scholar] [CrossRef]
Disclaimer/Publisher’s Note: The statements, opinions and data contained in all publications are solely those of the individual author(s) and contributor(s) and not of MDPI and/or the editor(s). MDPI and/or the editor(s) disclaim responsibility for any injury to people or property resulting from any ideas, methods, instructions or products referred to in the content. |
© 2023 by the authors. Licensee MDPI, Basel, Switzerland. This article is an open access article distributed under the terms and conditions of the Creative Commons Attribution (CC BY) license (https://creativecommons.org/licenses/by/4.0/).