Article

Characterizing Spring Phenological Changes of the Land Surface across the Conterminous United States from 2001 to 2021

School of Geography and Planning, Sun Yat-sen University, Guangzhou 510275, China
*
Author to whom correspondence should be addressed.
Remote Sens. 2023, 15(3), 737; https://doi.org/10.3390/rs15030737
Submission received: 30 November 2022 / Revised: 16 January 2023 / Accepted: 25 January 2023 / Published: 27 January 2023
(This article belongs to the Section Ecological Remote Sensing)

Abstract

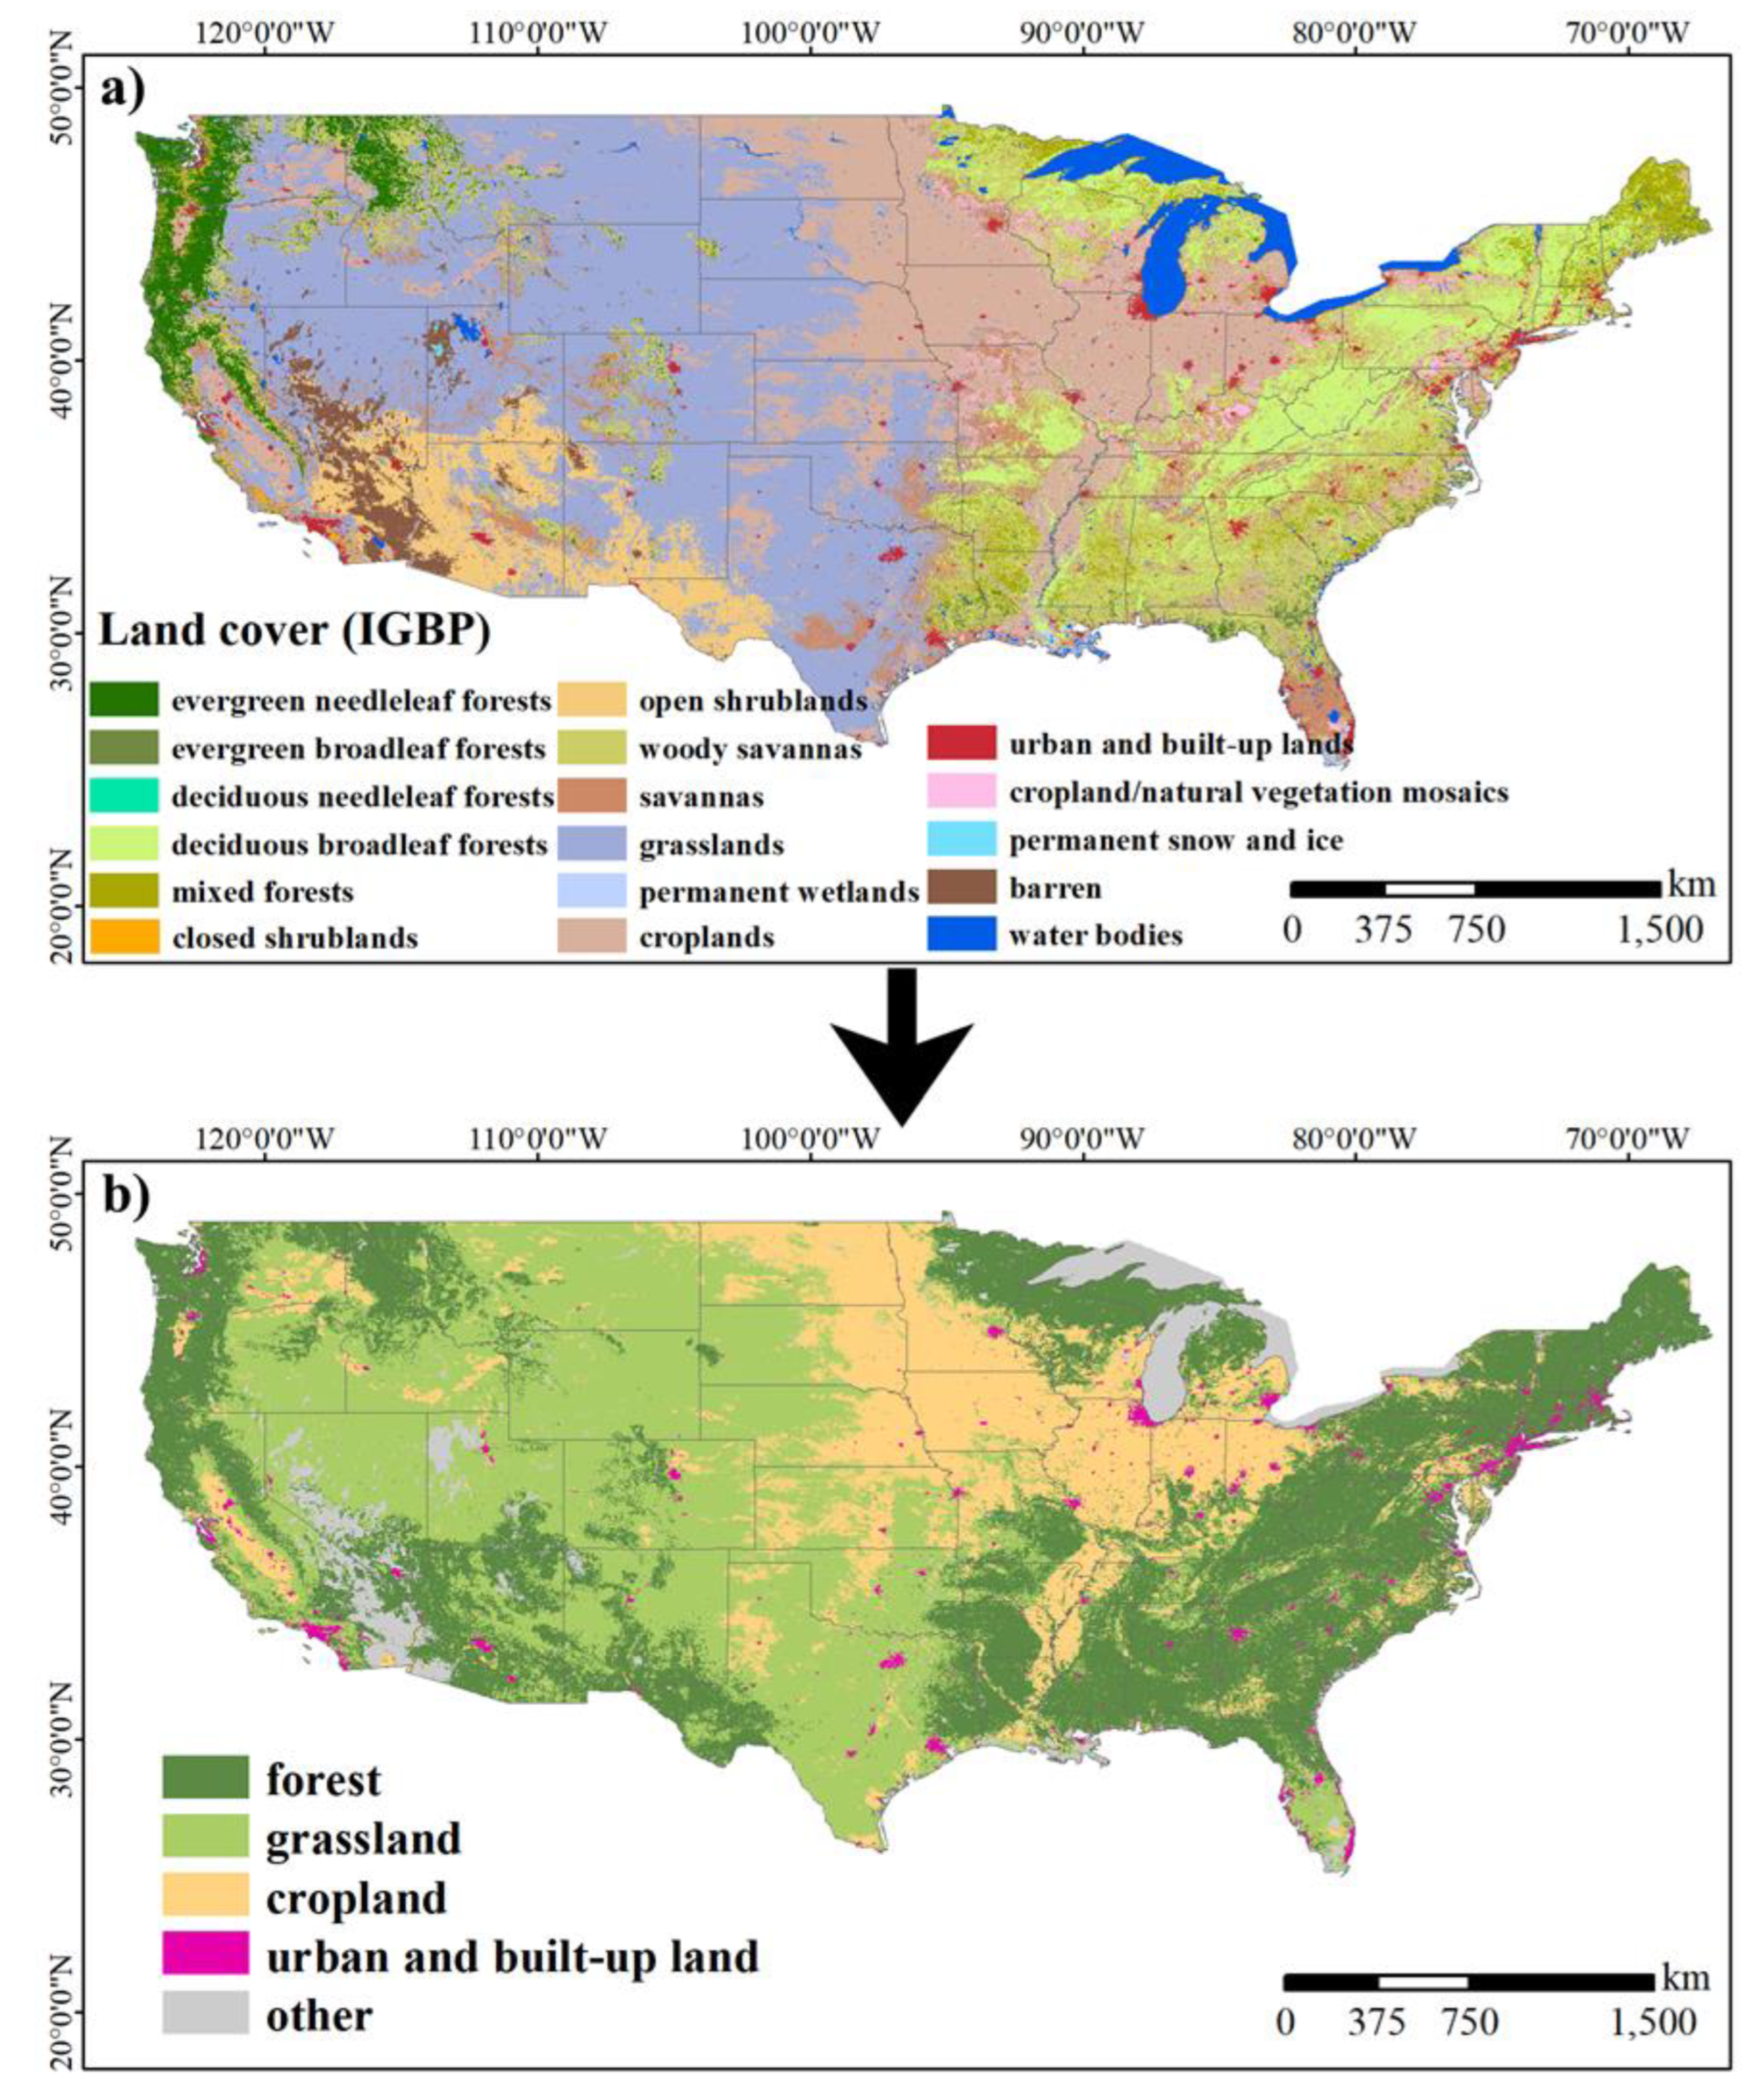
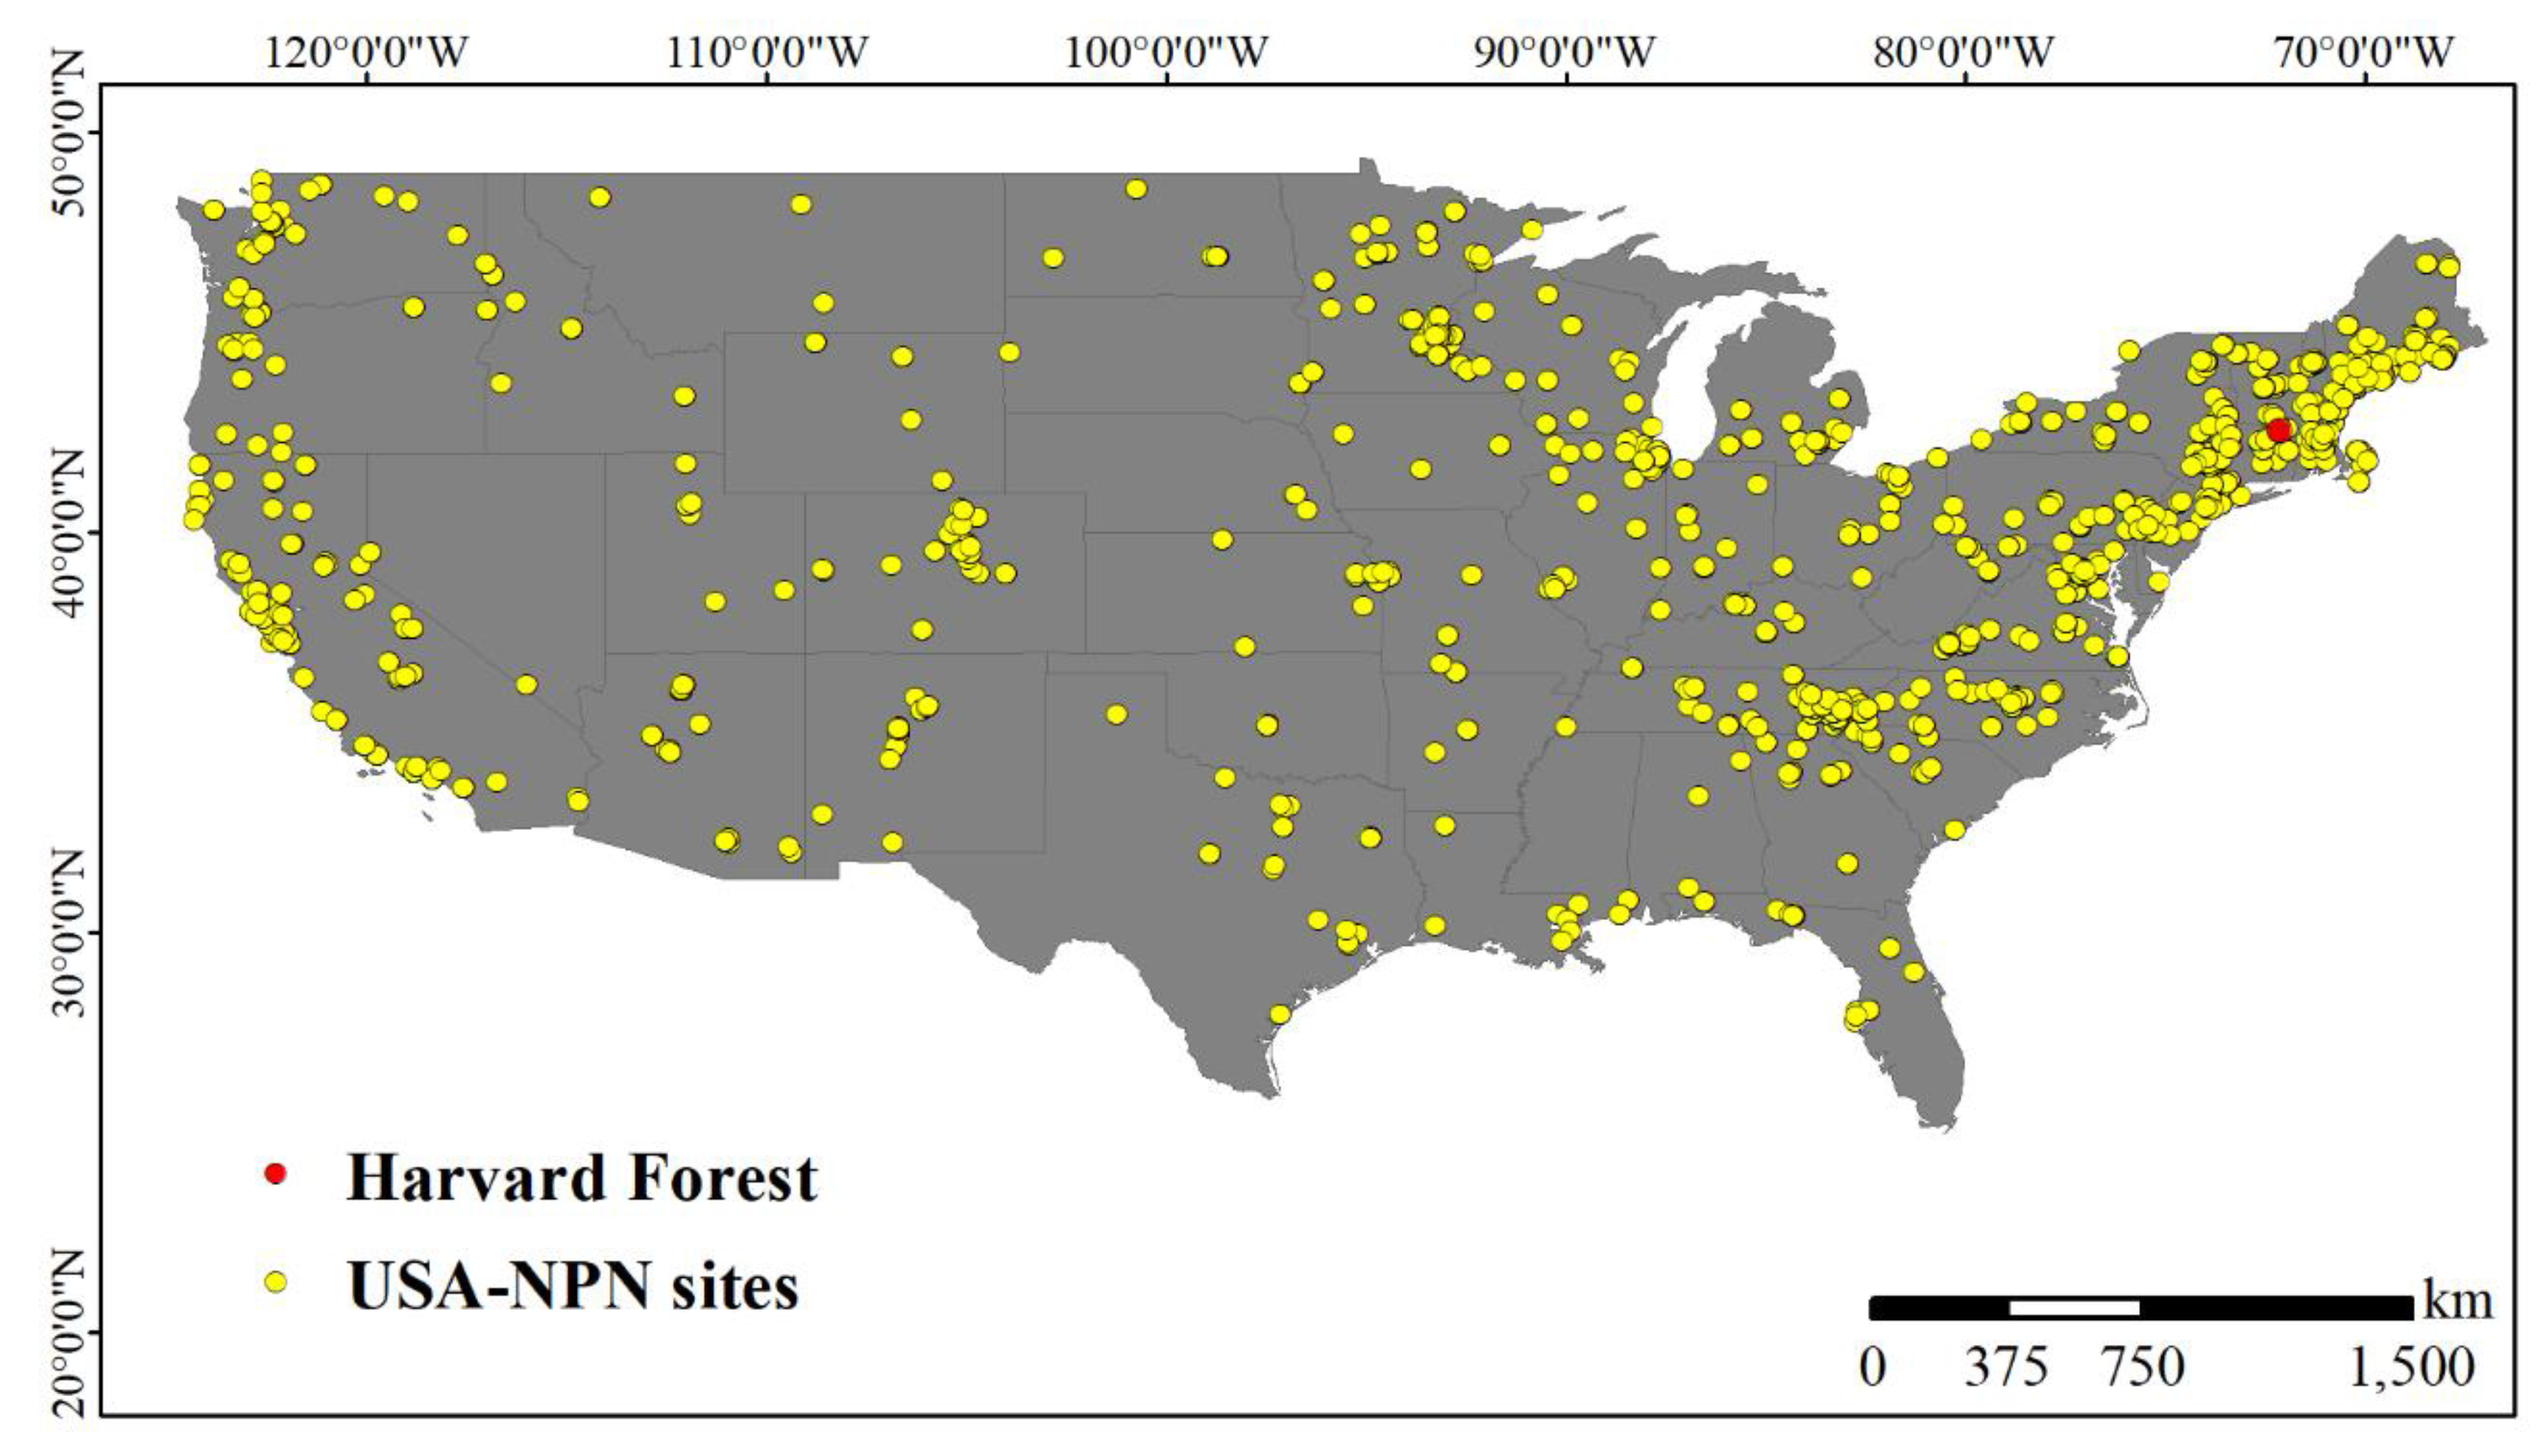
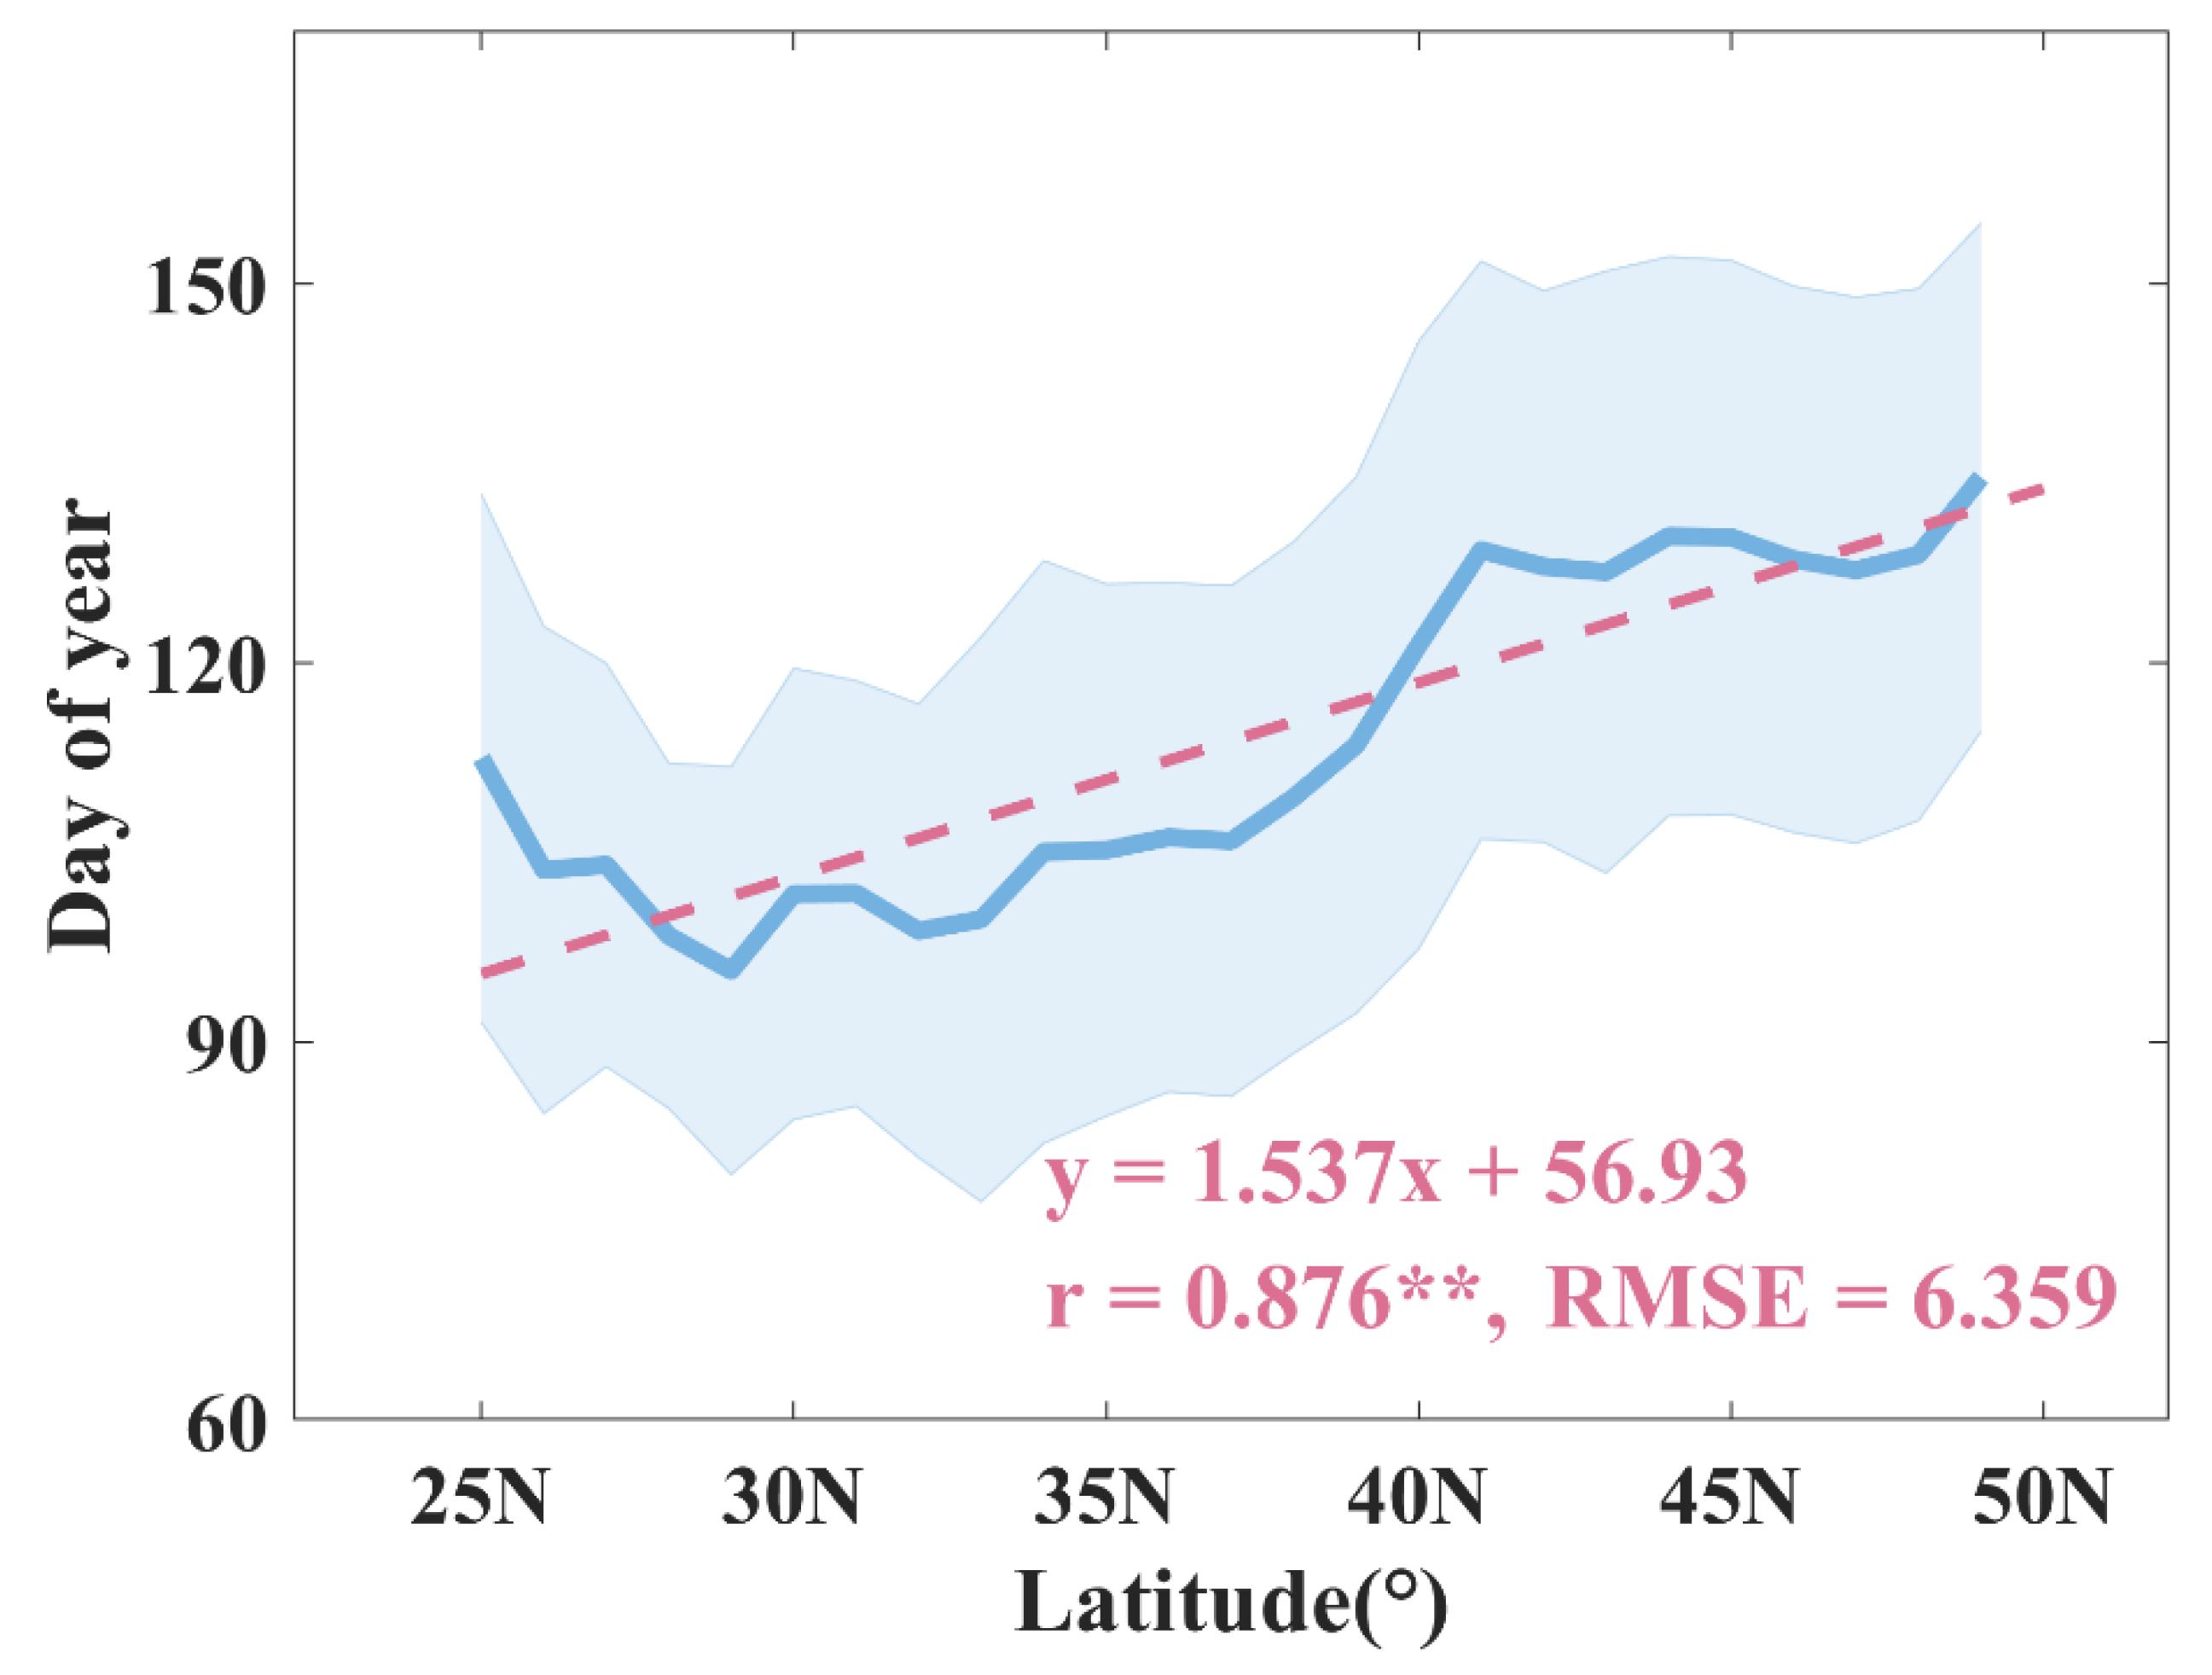
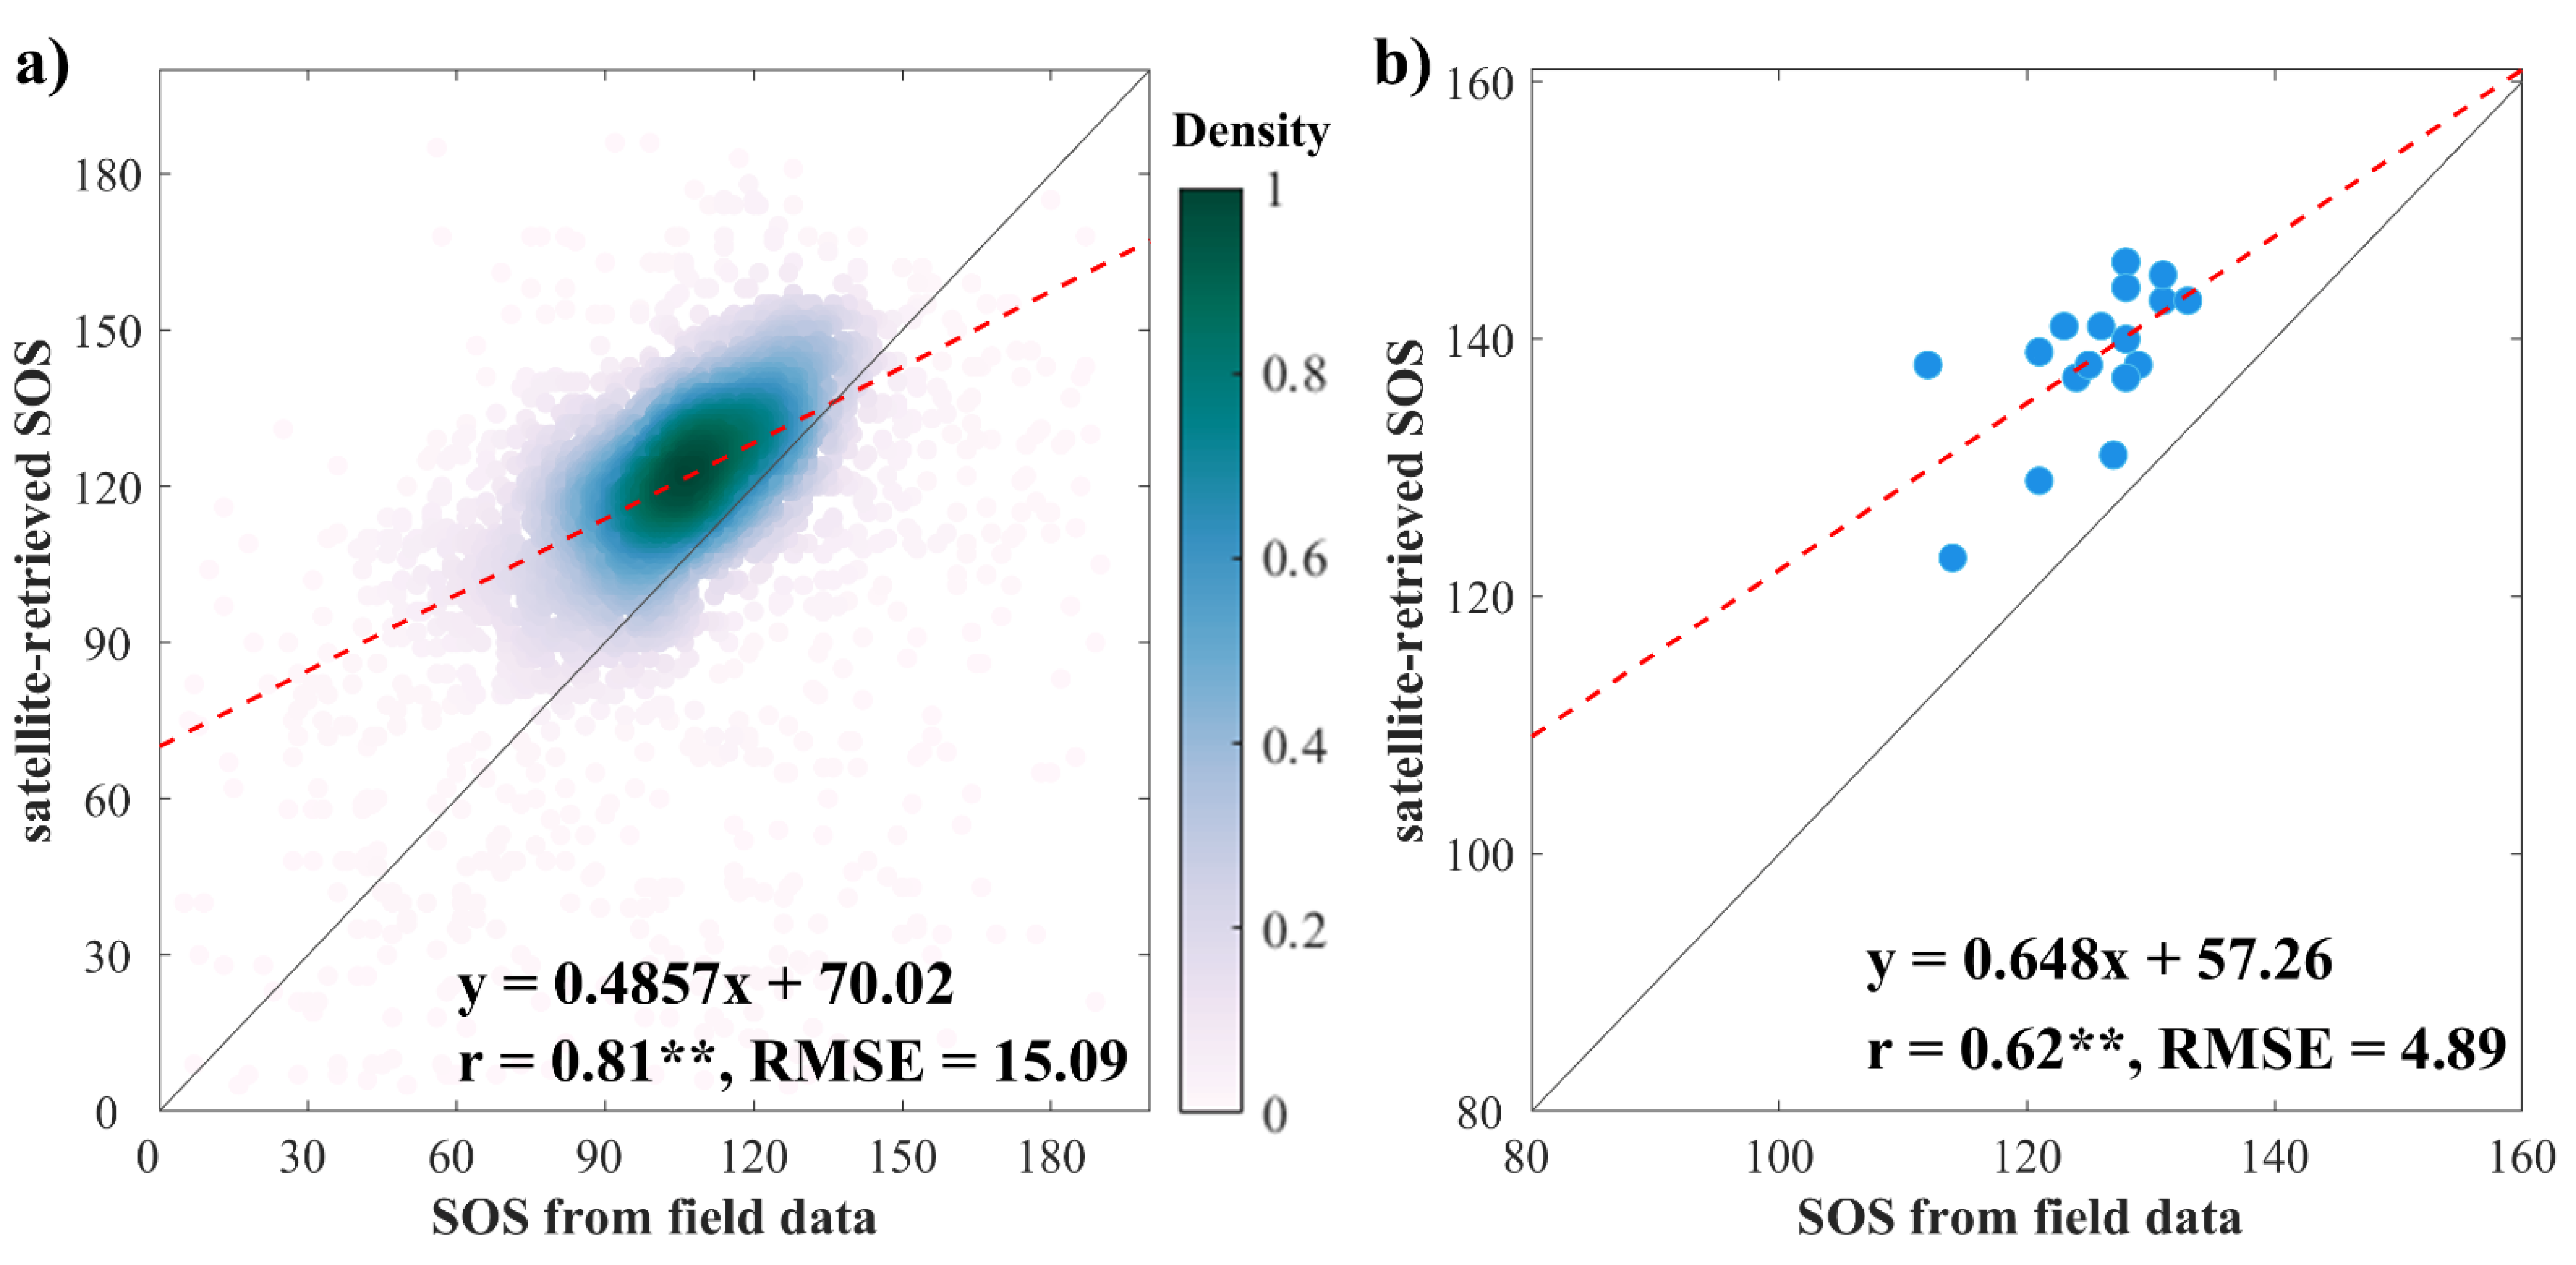
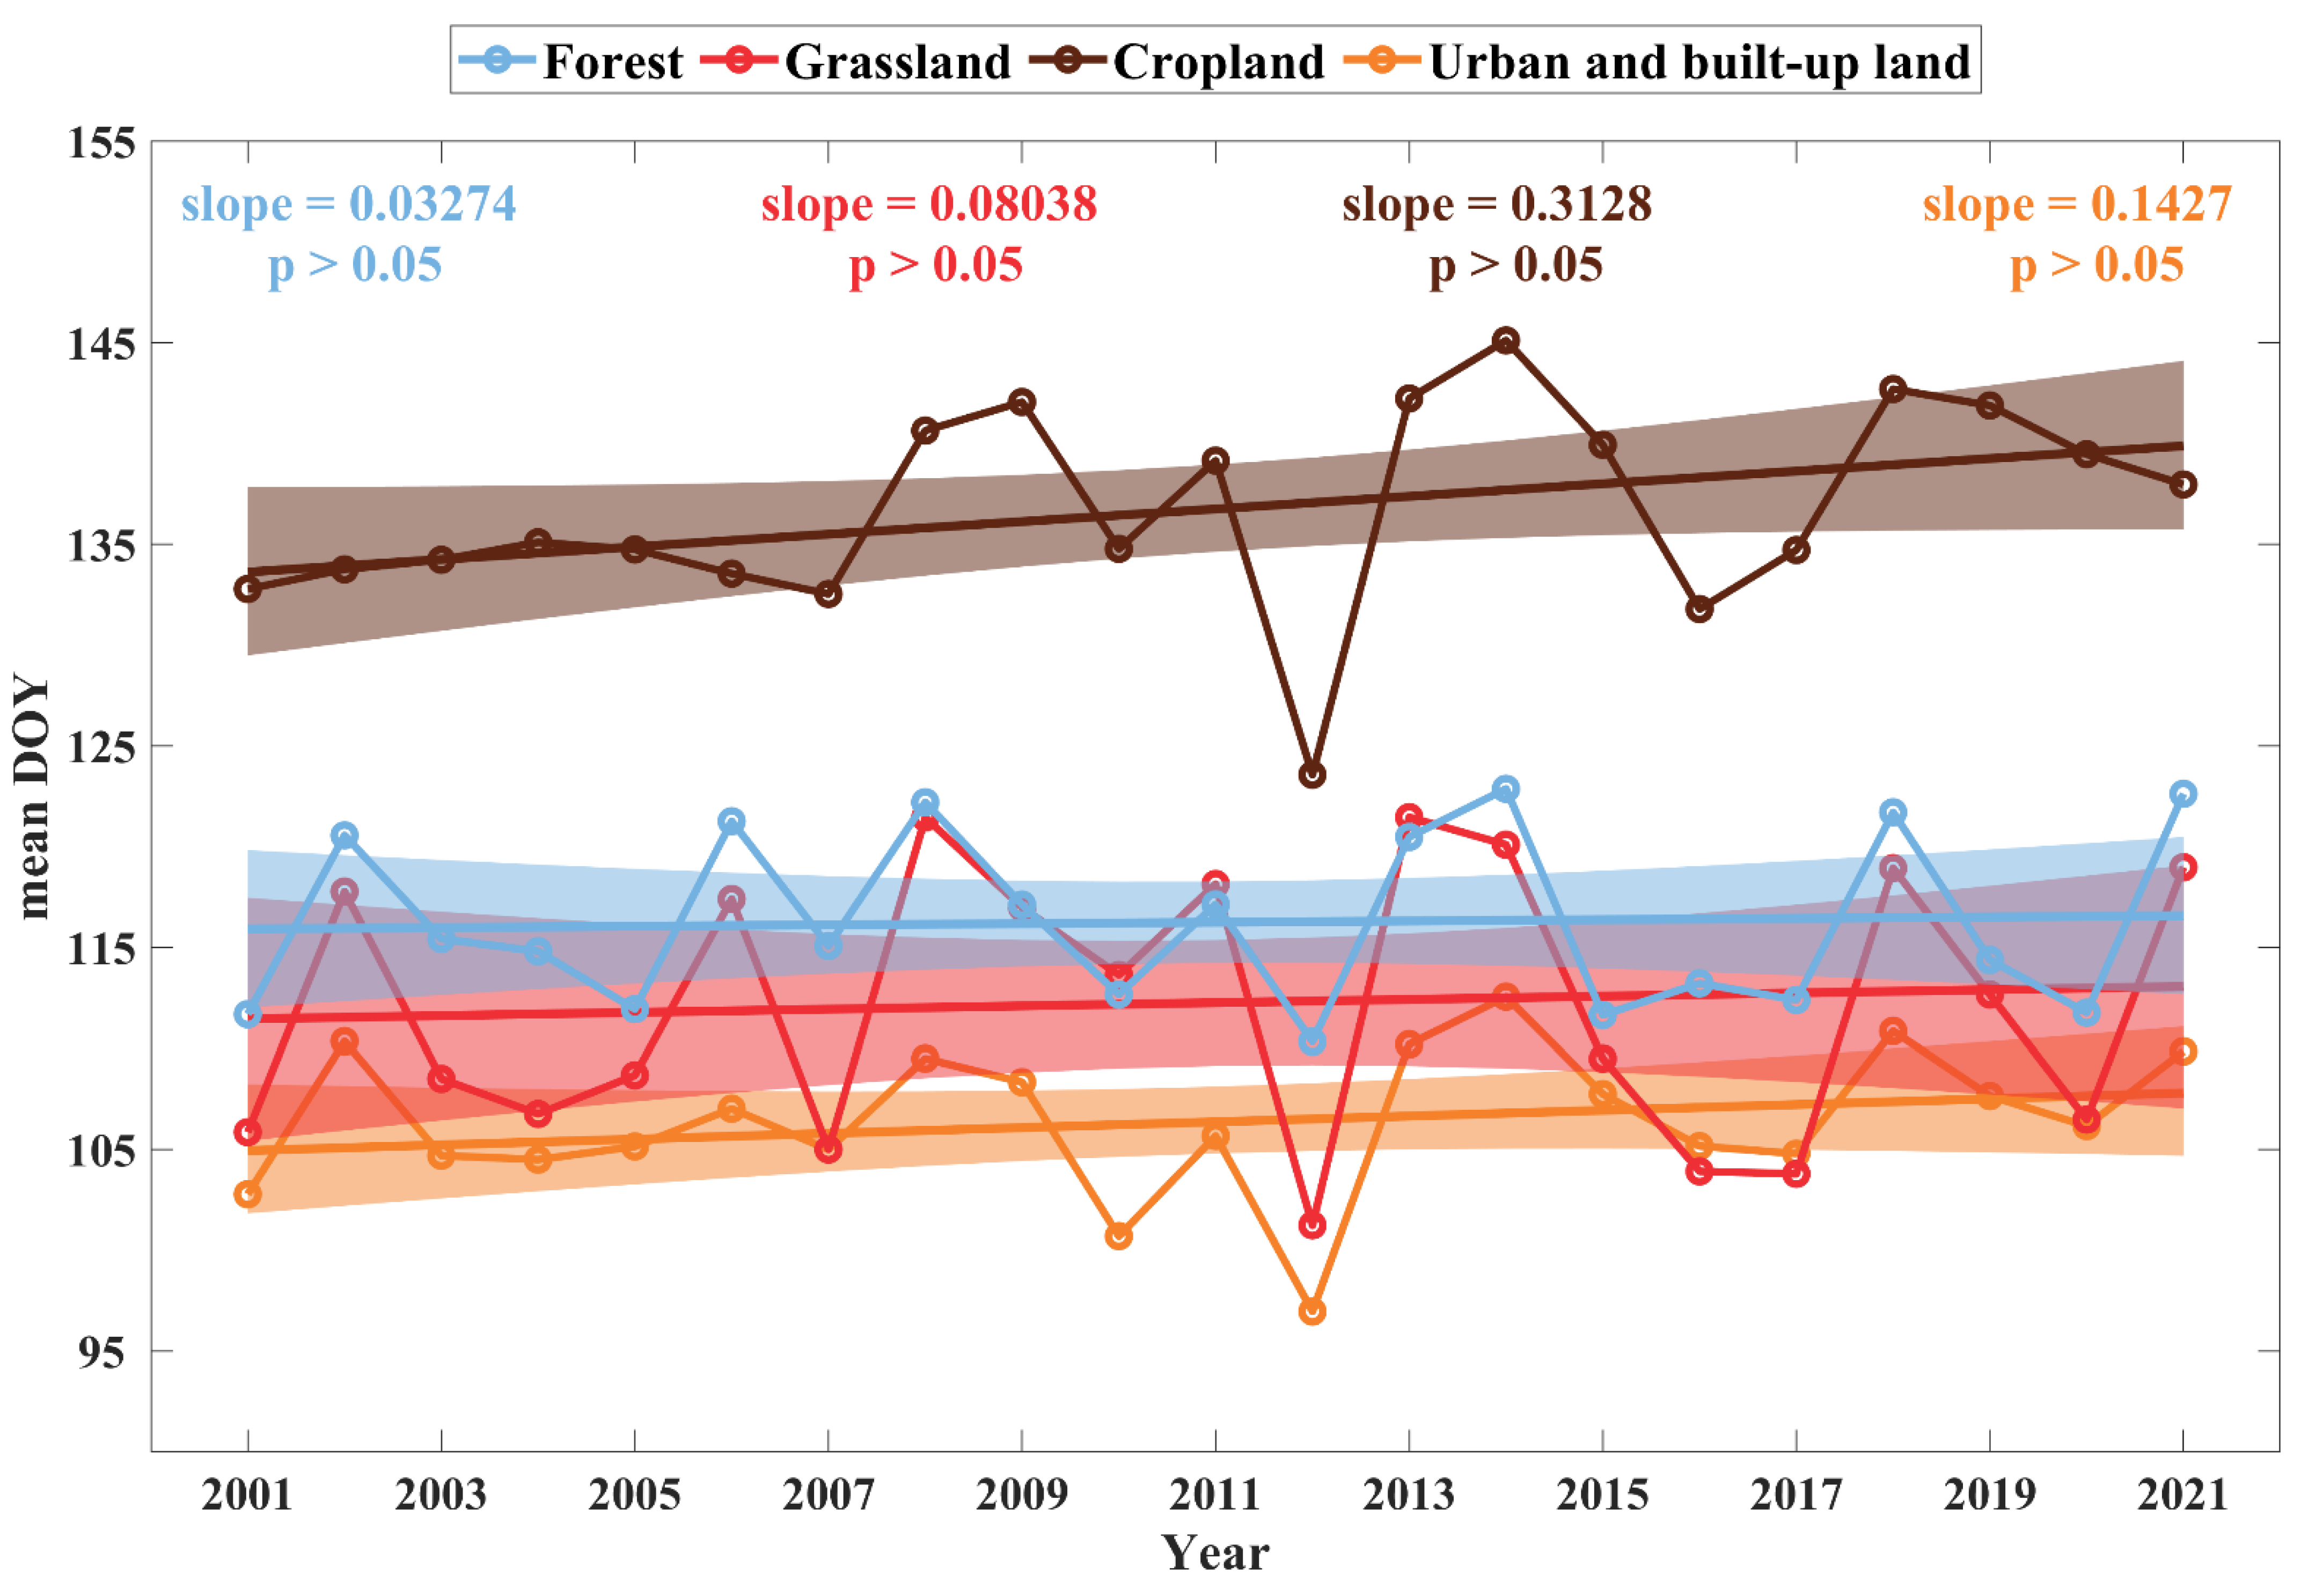
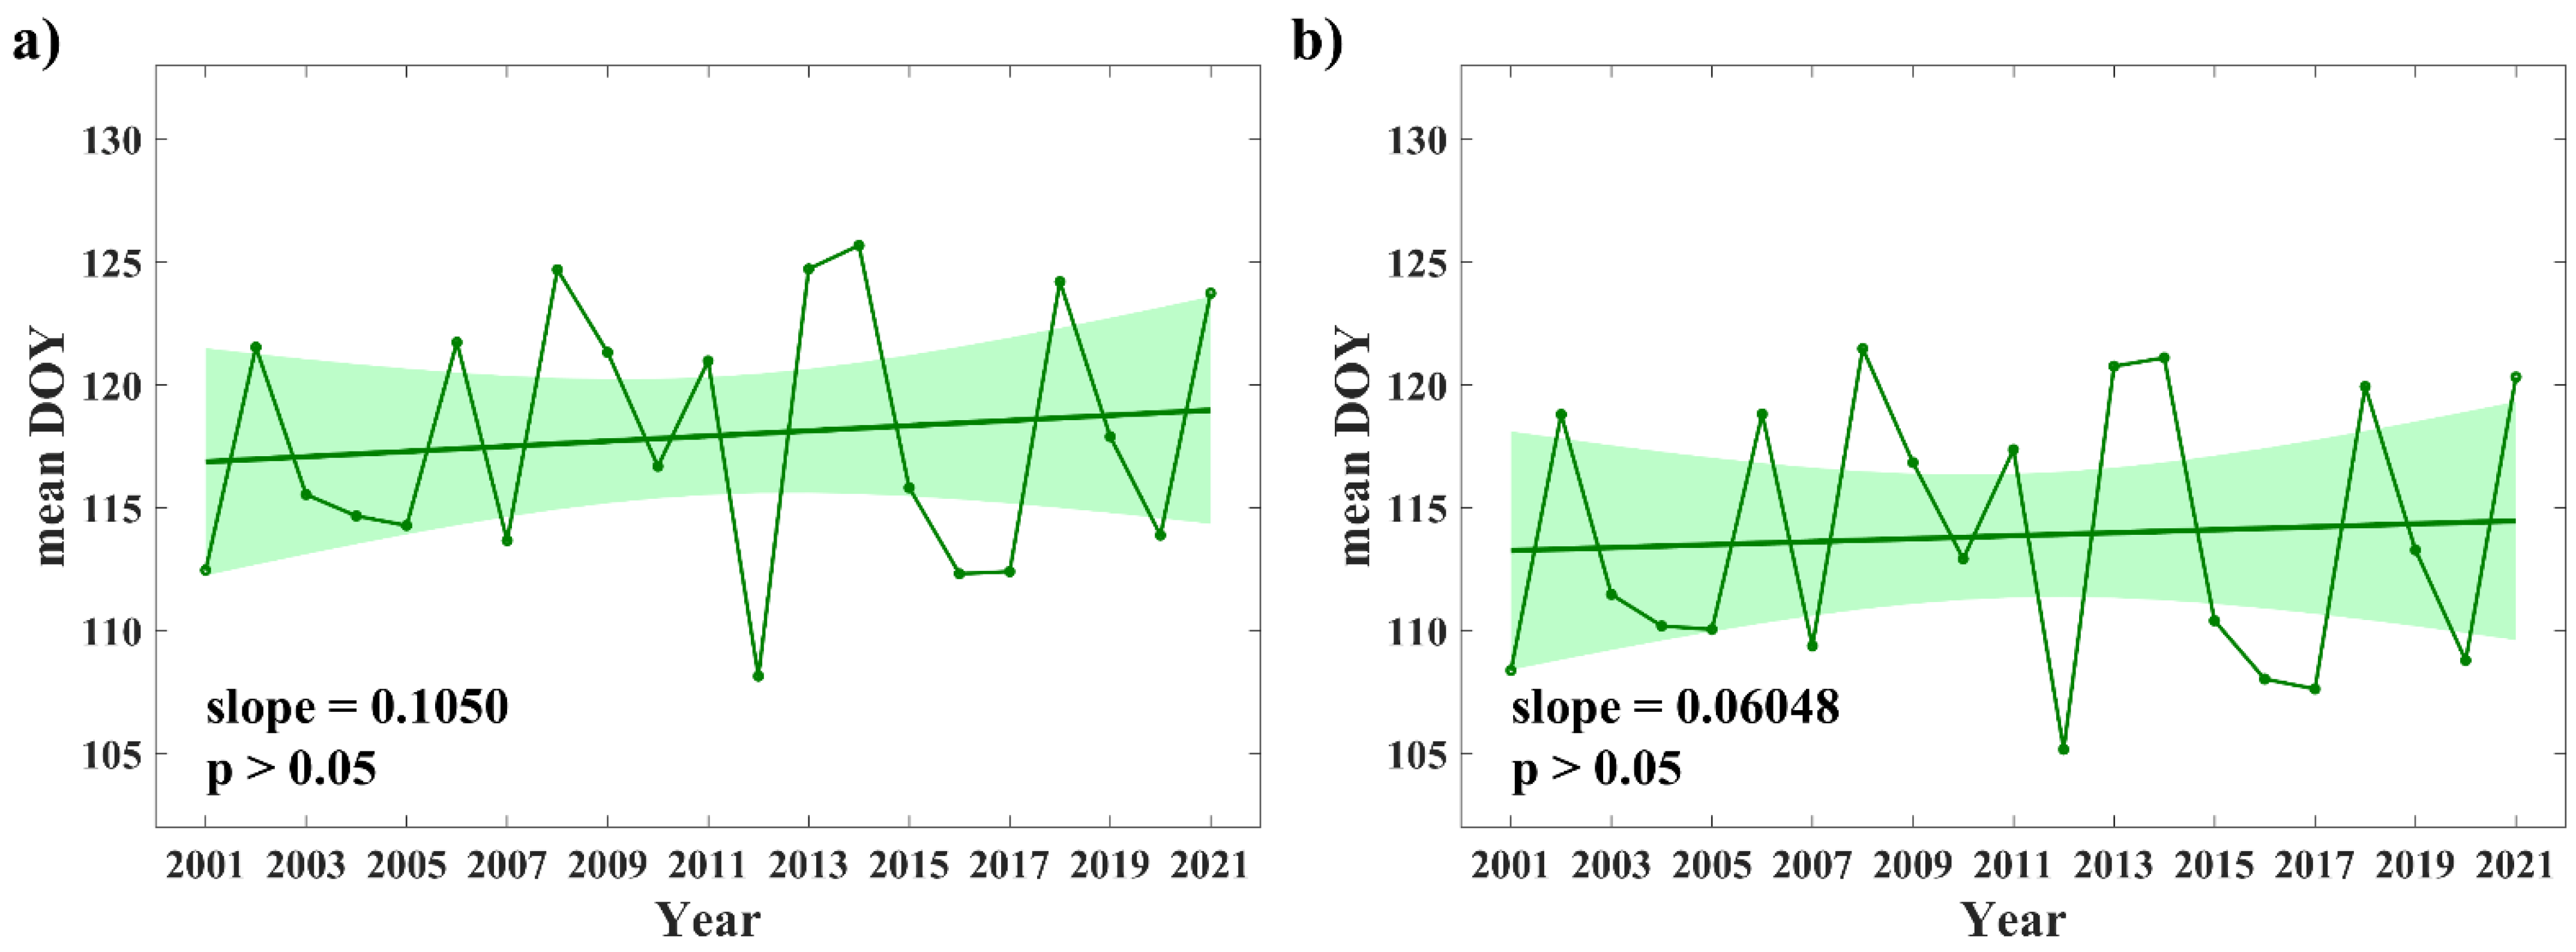
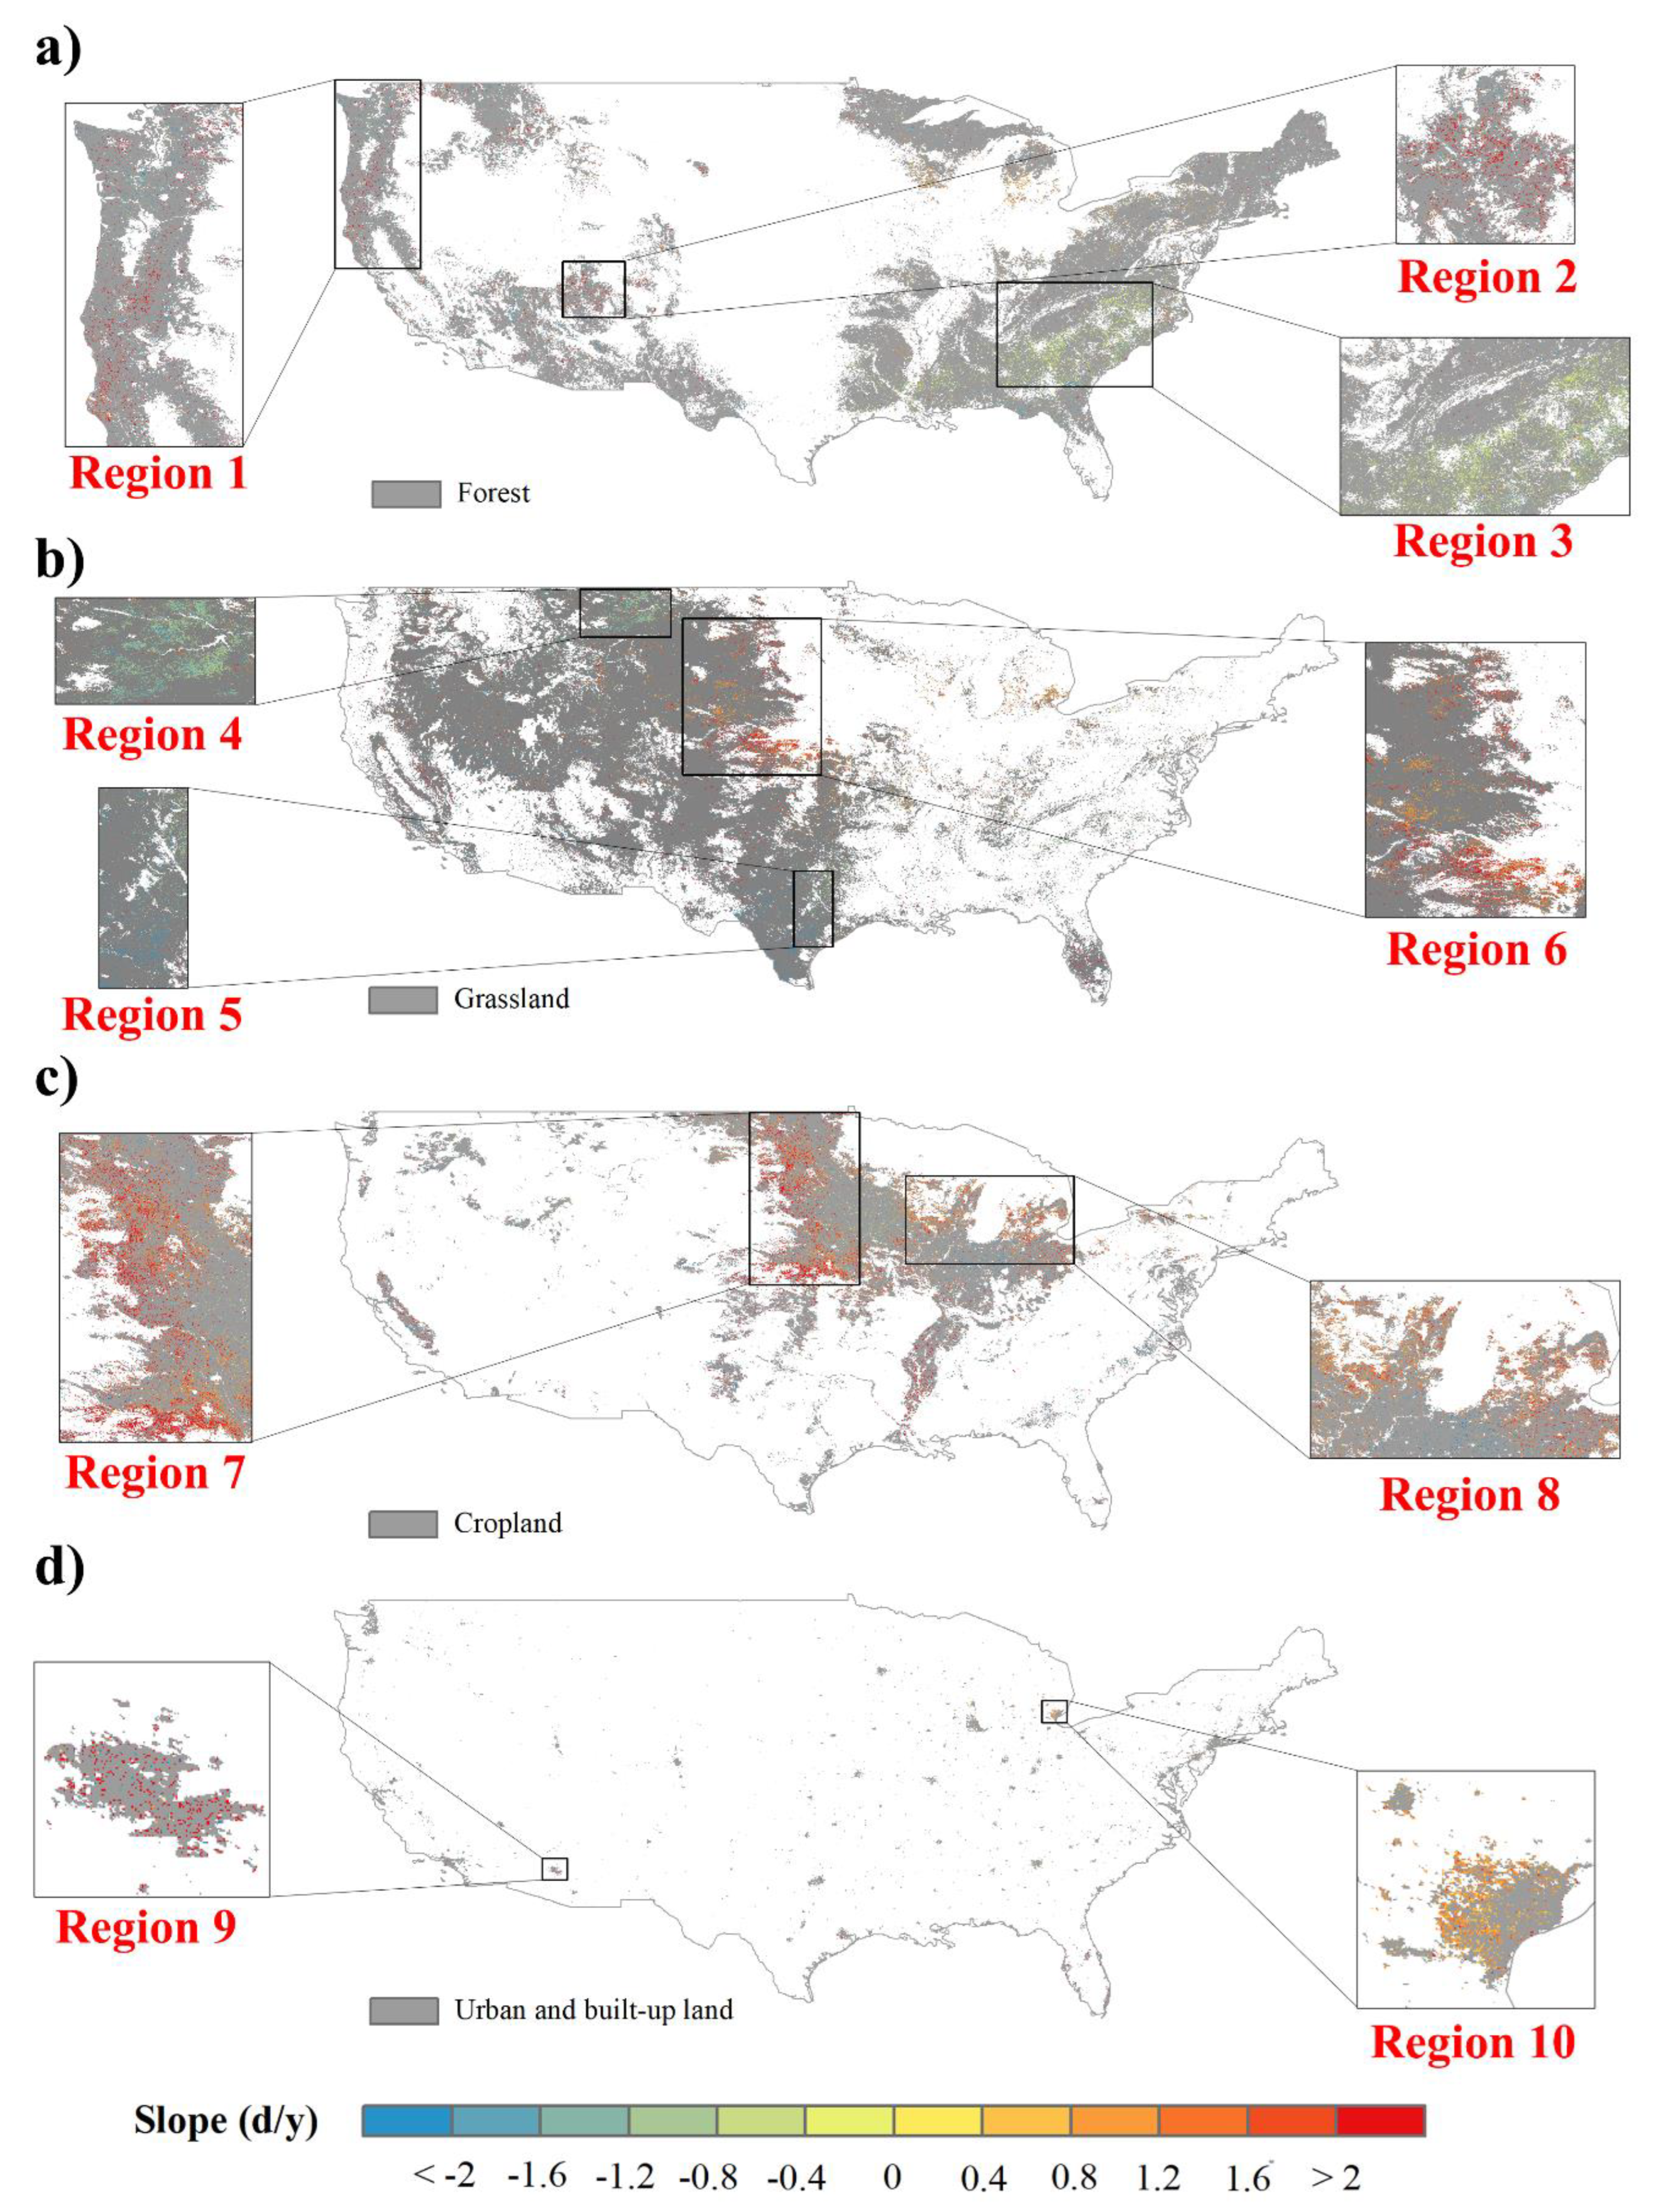
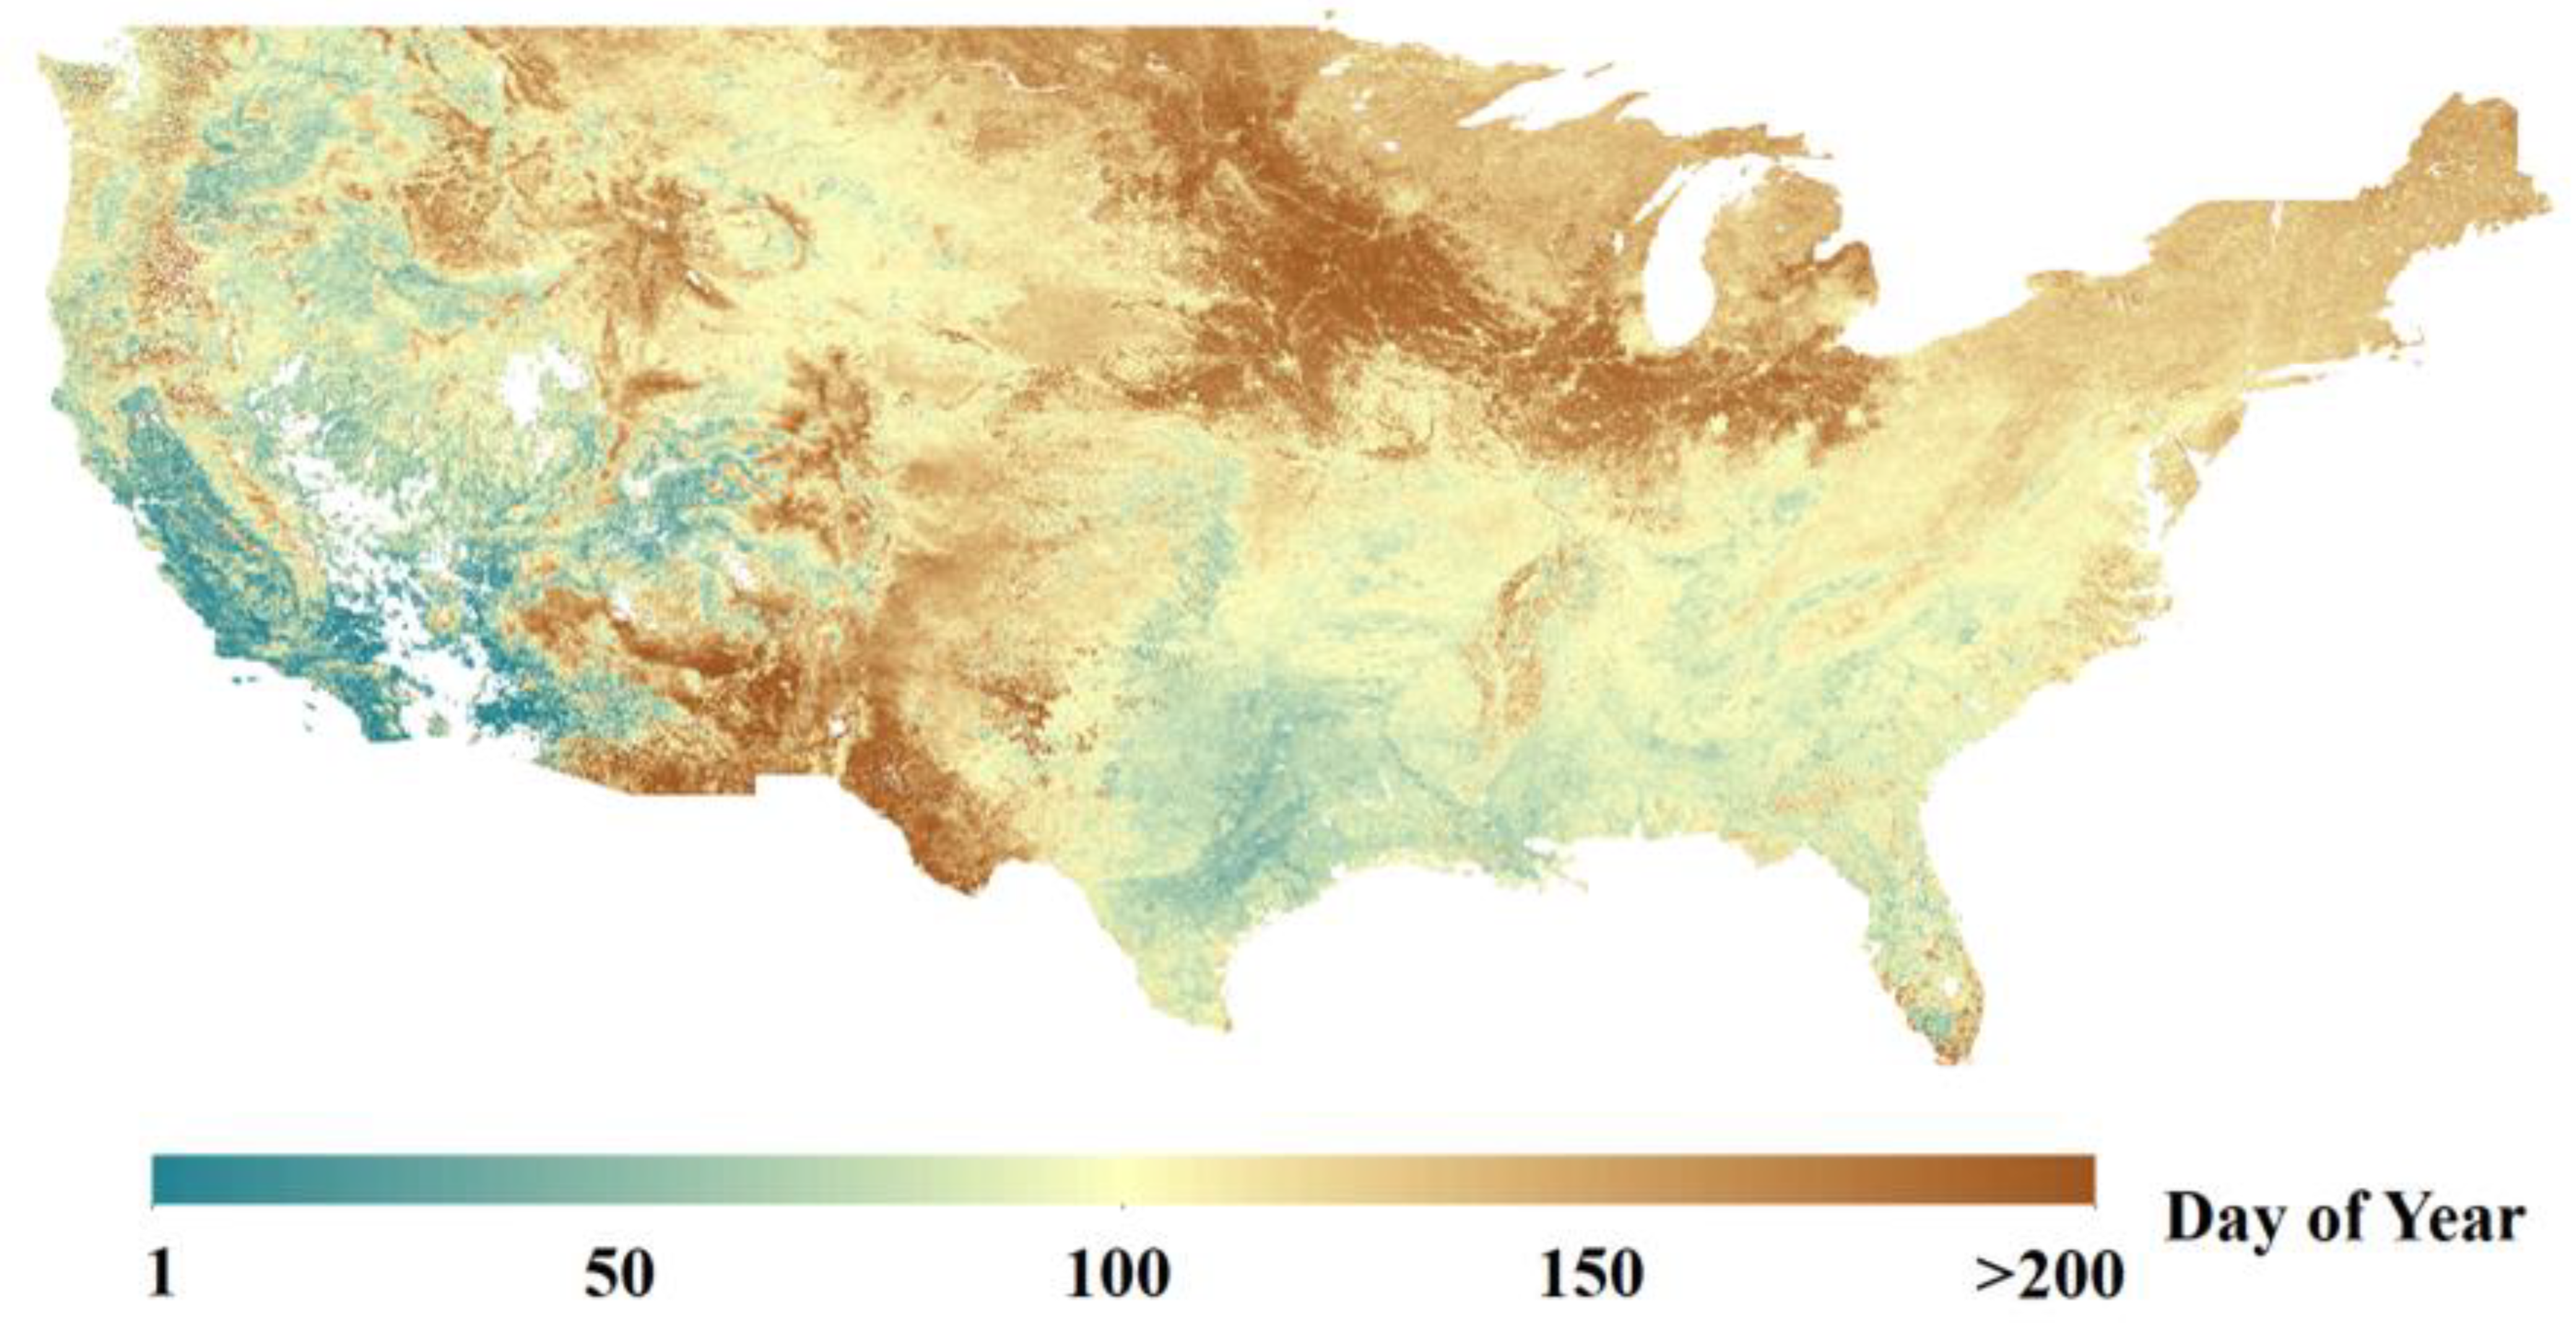
Monitoring land surface phenology plays a fundamental role in quantifying the impact of climate change on terrestrial ecosystems. Shifts in land surface spring phenology have become a hot spot in the field of global climate change research. While numerous studies have used satellite data to capture the interannual variation of the start of the growing season (SOS), the understanding of spatiotemporal performances of SOS needs to be enhanced. In this study, we retrieved the annual SOS from the Moderate Resolution Imaging Spectroradiometer (MODIS) two-band enhanced vegetation index (EVI2) time series in the conterminous United States from 2001 to 2021, and explored the spatial and temporal patterns of SOS and its trend characteristics in different land cover types. The performance of the satellite-derived SOS was evaluated using the USA National Phenology Network (USA-NPN) and Harvard Forest data. The results revealed that SOS exhibited a significantly delayed trend of 1.537 days/degree (p < 0.01) with increasing latitude. The timing of the satellite-derived SOS was significantly and positively correlated with the in-situ data. Despite the fact that the overall trends were not significant from 2001 to 2021, the SOS and its interannual variability exhibited a wide range of variation across land cover types. The earliest SOS occurred in urban and built-up land areas, while the latest occurred in cropland areas. In addition, mixed trends in SOS were observed in sporadic areas of different land cover types. Our results found that (1) warming hiatus slows the advance of land surface spring phenology across the conterminous United States under climate change, and (2) large-scale land surface spring phenology trends extraction should consider the potential effects of different land cover types. To improve our understanding of climate change, we need to continuously monitor and analyze the dynamics of the land surface spring phenology.
Keywords: spring phenology; in-situ data; the start of growing season (SOS); temporal trends; remote sensing; land cover types spring phenology; in-situ data; the start of growing season (SOS); temporal trends; remote sensing; land cover types