Technical Note

Study of the Cn2 Model through the New Dimensionless Temperature Structure Function near the Sea Surface in the South China Sea

1
Key Laboratory of Atmospheric Optics, Anhui Institute of Optics and Fine Mechanics, Hefei Institutes of Physical Science, Chinese Academy of Sciences, Hefei 230031, China
2
Science Island Branch of Graduate School, University of Science and Technology of China, Hefei 230026, China
3
Advanced Laser Technology Laboratory of Anhui Province, Hefei 230037, China
*
Author to whom correspondence should be addressed.
Remote Sens. 2023, 15(3), 631; https://doi.org/10.3390/rs15030631
Submission received: 30 November 2022 / Revised: 16 January 2023 / Accepted: 18 January 2023 / Published: 20 January 2023

Abstract

:
The refractive index structure constant C n 2 near the ocean surface is an important parameter for studying atmospheric optical turbulence over the ocean. The measured refractive index structure constant and meteorological parameters, such as temperature and three-dimensional wind speed, near the sea surface on the South China Sea during the period from January to November 2020 were analyzed. On the basis of Monin–Obukhov similarity theory, the dimensionless temperature structure parameter function f T near the sea surface was established, and a new parameterized model of the near-sea surface was proposed. The new model improved the error of the widely used model proposed by Wyngaard in 1973 (W73) and better reproduced the daily variation in the measured C n 2 . Further analysis of the seasonal applicability of the new model indicated that the correlation coefficients between the estimated and measured C n 2 in the spring, summer, autumn, and winter were 0.94, 0.94, 0.95, and 0.89, respectively, and the root mean square errors were 0.32, 0.41, 0.46, and 0.40 m−2/3, respectively. Compared with the C n 2 estimated by the W73 model, the correlation coefficient of C n 2 estimated by the new model and measured by the micro-thermometer increased by 0.05–0.27 and the root mean square error decreased by 0.04–0.56. The improved f T demonstrated higher accuracy than the existing models, which can lay a foundation for estimating turbulence parameters in different sea areas.

1. Introduction

Atmospheric turbulence [1] is the main form of motion in the atmospheric boundary layer. When a laser beam propagates through the atmosphere, atmospheric turbulence influences it, producing beam broadening and scintillation [2,3,4,5,6]. The atmospheric refractive index structure constant C n 2 is an essential parameter reflecting the influence of turbulence on the light field during the transmission process. It is typically used to characterize the intensity of atmospheric optical turbulence.
The surface layer, the lowest part of the atmospheric boundary layer, is directly influenced by the underlying surface and has a large diurnal variation in meteorological elements. Monin–Obukhov similarity theory (MOST) is an important theoretical method that describes near-surface turbulence characteristics [7] by establishing universal function relationships between the surface-layer scaling parameters and the stability parameter ξ = z / L [8] (z is the measuring height and L is the Monin–Obukhov length). Since the 1970s, scholars have conducted numerous experiments, explored the universal functions of the scaling parameters and stability, and applied the findings to flux measurement [9,10,11,12], near-surface turbulence parameters [13], and atmospheric structure constants [14,15] under different underlying surface conditions.
As early as 1971, Businger et al. [16] demonstrated that MOST can be applied to homogeneous atmospheric boundary layers. In the same year, Wyngaard [17] proposed a semi-empirical theory of near-surface wind speed, temperature, stability, and C n 2 using the 1968 boundary layer experimental data of the Kansas Plain obtained by the US Air Force Research Laboratory (AFCRL). The theory, based on MOST, established a semi-empirical similarity function f T of stability and C T 2 and then combined this with meteorological elements to indirectly obtain C n 2 . In 1973, Wyngaard adjusted the dimensionless temperature structure function f T [18] under unstable conditions and offered a new model (the W73 model). Yuan et al. [19] analyzed surface-layer meteorological and optical turbulence parameters over a grassland-underlying surface and then estimated the C n 2 using the W73 model. The results indicated that the empirical relationship basically satisfied grassland- and suburban-underlying surfaces. In 1988, Andreas used the same method to estimate C n 2 over snow and sea ice [20] from meteorological data. The main difference is that he corrected the parameters of the W73 model and adjusted the Von Karman constant from 0.35 to 0.4. In 1993, de Bruin et al. analyzed the meteorological data set obtained at the plain of La Crau, France, in June 1987. The results demonstrated that MOST can be applied to standard deviations of wind speed and temperature. They proposed a new dimensionless temperature structure function. The expression under unstable conditions was marginally different from the previous ones; the most significant difference was that it was considered a constant [21] under stable conditions. Dan Li conducted a near-surface turbulence study on lake and glacier surfaces [22] in Geneva, Switzerland; the differences in the proposed parameterization functions were mainly manifested in stable conditions. Clearly, considerable efforts have been made in previous studies to estimate C n 2 for different underlying surfaces. The existing dimensionless functions can be directly applied to specific underlying surfaces and new functions need to be identified in other conditions. The above temperature structure models proposed by Wyngaard, Andreas, de Bruin, and Dan Li (referred to as W73, A88, dB93, and DL12, respectively) have consistent functional forms; the differences are the values of the parameters under unstable conditions. In general, the proposed functions are considerably different under stable conditions, and a universally applicable function has not been obtained.
Another important application of MOST is measuring flux and estimating C n 2 using a large-aperture scintillator (LAS) based on a light intensity scintillation method. An LAS typically includes two parts: a transmitting device and a receiving device. The measurement principle is that the transmitting device emits a beam influenced by atmospheric temperature, humidity, and pressure fluctuations and the receiving device receives the beam. The measured C n 2 is frequently used to characterize the intensity of the atmospheric turbulence. The surface-layer sensible heat flux is then calculated from C T 2 on the basis of MOST and the empirical dimensionless temperature structure function. In 1992, Thiermann [23] used the experimental data obtained by means of an LAS in the northern plains of Germany to observe surface-layer turbulence using the above method and proposed a new f T model (see Table 1 and Table 2). Braam [24] analyzed the double-layer data of a 3 m- and 60 m-high tower located on a ranch in the western Netherlands, compared the C T 2 measured using a three-dimensional ultrasonic anemometer, and estimated the result by means of an LAS. The results confirmed that the existing models are not applicable in the morning and evening. In 2020, Wang et al. [25] analyzed the LAS data measured on an urban-underlying surface in Nanjing, China, and compared, by means of a remote sensing method, the differences in turbulence characteristics of different underlying surfaces, such as grasslands, farmland, and cities. It is important to select the appropriate dimensionless function f T to ensure accurately estimated C n 2 using an LAS.
The functions f T discussed above are primarily based on plains, glaciers, and grasslands. Whether these are applicable to the near-sea surface of the South China Sea remains to be studied. Owing to the special geographical location of the South China Sea and the limitations of the marine environment and observation conditions, it is difficult to obtain marine data near the sea surface. Studying the turbulence characteristics of the ocean-underlying surface remains a challenge in terms of observation and model construction.
In this study, we verify and improve the dimensionless temperature structure function f T under stable and unstable conditions using measured data (e.g., three-dimensional wind speed, temperature, and humidity) near the sea surface of the South China Sea on the basis of MOST. Then, we establish a new model suitable for the South China Sea and compare the seasonal and diurnal variation characteristics of C n 2 estimated by the evaluation model. It is beneficial to further study the influence of atmospheric turbulence on laser measurements and improve the accuracy of measuring turbulence flux over the ocean by understanding the variation law of C n 2 and constructing a suitable f T near the sea surface.

2. Methods and Data

2.1. Observation Site and Instruments

In this study, we used near-surface observation data of an island in the South China Sea (16°50′N, 112°51′E, altitude of 41 m) from January to November 2020 to study the dimensionless temperature structure function f T and the method of estimating C n 2 near the sea surface in the South China Sea. The observation site has a tropical marine monsoon climate with sufficient sunshine, abundant rainfall, high temperature, humidity, and salinity throughout the year. The measuring instruments were set at a height of 2 m and included a three-dimensional ultrasonic anemometer (CSAT3, sampling frequency 20 Hz) [26,27], an automatic weather station (WXT536, sampling frequency 0.2 Hz) [28], and a micro-thermometer (sampling frequency 0.2 Hz) [29,30,31,32]. Figure 1 shows the placement of these instruments, with the horizontal bar above the sea surface.
An ultrasonic anemometer has the advantages of a short response time and high precision [33,34]. It measures the time of ultrasonic wave transmission within a certain distance on three non-orthogonal axes and uses the functional relationship between sound velocity, temperature, and humidity to output parameters, such as horizontal and vertical wind speed components and ultrasonic virtual temperature. We calculated the near-surface turbulence-scaling parameters u * , T * , and ξ (Section 2.2) and C T 2   using the three-dimensional wind speed measured by the CSAT3. The automatic weather station and the micro-thermometer monitored the relative humidity, the atmospheric temperature, the pressure, and the refractive index structure constant. The meteorological parameters measured by the WXT536 were used to convert between C T 2 and C n 2 . The micro-thermometer measured C n 2 by measuring C T 2 through a due-point measurement. The measured C n 2 was compared with the estimated values. According to Kolmogorov local homogeneous isotropic turbulence theory, the temperature structure constant is defined as [35]:
C T 2 = D T ( r ) / r 2 3 = < [ T ( x ) T ( x + r ) ] 2 > / r 2 3
where T represents temperature, x and r are position vectors, and C T 2 can be obtained by measuring air temperature difference between two points with a micro-thermometer. The distance between the two measurement points was 1 m, which is in the inertial range of several millimeters to several meters of near-surface turbulence. We can assume that the above 2/3 law is always satisfied. There is a simple relationship between the atmospheric refractive index structure constant C n 2 and the temperature structure constant C T 2 [36]:
C n 2 = ( 79 × 10 6 P T 2 ) 2 C T 2
In this equation, the atmospheric pressure P is in hPa and the air temperature T is in K.

2.2. Model of Parametric C n 2 near the Surface

The following empirical relationship exists between the atmospheric temperature structure constant C T 2 and the stability parameter ξ = z / L [17]:
f T ( ξ ) = C T 2 z 2 3 T * 2 = C T 2 z 2 3 w T ¯ 2
The left-hand side of the equation is a parameterized temperature structure function related only to the stability dimensionless parameter ξ and the right-hand side is the C T 2 parameterized from data measured by the experiment, where z is the measurement height (based on the height of the sensor from the underlying surface in the experiment; z = 2 m in this study). The dimensionless stability parameter can be expressed as:
ξ = z L = z k g T * u * 2 T ¯ = z k g Q u * 3 T ¯
where L is the Monin–Obukhov length [37]. The dimensionless scaling parameter of wind speed u * = [ u w ¯ 2 + v w ¯ 2 ] 1 / 4 , also known as the friction velocity, can be calculated directly from the measured data. The dimensionless scaling parameter of the temperature T * can be expressed as:
T * = w T ¯ u *
where T and w are the temperature fluctuation and the wind velocity fluctuation in the vertical direction, respectively. Q = w T ¯ is the kinematic heat flux; k is the Von Karman constant, which is 0.4 in this study; g is the acceleration of gravity; T ¯ is the mean value of each set of temperature data; and Q is the heat flux. Normalized L is the dimensionless parameter ξ , which characterizes the atmospheric stability of the boundary layer. The heat in the surface layer is transmitted upward during the day ( ξ < 0 ), when the atmosphere is in an unstable state. Conversely, the atmosphere is stable and the heat flux is negative at night ( ξ > 0 ). When ξ = 0 , the atmosphere is neutral.
After obtaining the dimensionless parameter ξ from Equations (4) and (5), the temperature structure constant C T 2 can be obtained using Equation (3) and the atmospheric refractive index structure constant C n 2 can be obtained using Equation (2). Regarding the similarity function on the left-hand side in Equation (3), the common models include W73, A88, dB93, and DL12 and the Theirmann and Grassl model from 1992 (T and G92). Table 1 and Table 2 list the function expressions and parameters of these models under unstable and stable conditions, respectively.
The prediction accuracy of the parameterized C n 2 model near the surface depends mainly on the dimensionless temperature structure parameter function f T . Therefore, we first used the measured wind speed and temperature data to obtain the turbulence-scaling parameters u * , T * , and ξ . The similarity function f T over the South China Sea was studied in combination with the measured C T 2 data. Next, we obtained a suitable model of the parameterized C n 2 near the sea surface for the South China Sea area.

2.3. Calculation Method of Turbulence-Scaling Parameters

Calculating the turbulence characteristic parameters u * and T * involves turbulence flux u w ¯ , v w ¯ , and w T ¯ . The methods for obtaining the turbulence flux include the aerodynamic, Bowen ratio, and eddy covariance methods. In this study, we chose the eddy covariance method, which is the most direct method for observing turbulent flux and calculating the turbulent-scaling parameters [38,39,40,41]. The eddy covariance method has relatively matured over time and is suitable for calculating water vapor flux and heat flux on different underlying surfaces. Data quality control [42] is an important factor for reducing the error of the eddy covariance method. Zhou [43] processed and evaluated the original data of Yongxing Island using the eddy covariance method. These results indicated that a series of correction operations can reduce the error and increase the accuracy of the results.
We used a three-dimensional ultrasonic anemometer to measure the three-dimensional wind speed and virtual temperature component with a frequency of 20 Hz and used the eddy covariance method to calculate the covariance to obtain the characteristic parameters of wind speed u * and temperature T * and then obtain the turbulent flux. The average data processing time was 10 min. Pulsation was calculated using the equation below
x = x x ¯
where x represents the pulsation of the parameters, x ¯ represents the mean value of the corresponding parameters, and x represents the measured value. Commonly, x includes the three-dimensional wind speed u, v, w, and the air temperature T.
Before calculating the turbulence characteristic parameters, the original data were preprocessed as follows. (1) We verified that the data were continuous, that is, complete. If any data were missing, we carried out specific repair or discard operations. (2) We moved the outliers, that is, removed values beyond the normal range. Here, we used the Grubbs rule [44], that is, if the mean of a group of data exceeds n times its standard deviation (n = 4 in this study), it is considered as an outlier and removed and the adjacent data are interpolated.
Next, we further corrected the data [45]. As shown in Figure 2, first, we corrected the virtual temperature T s , that is, the three-dimensional sonic anemometer data that measure the virtual temperature related to the air humidity, which requires correction using T s = T ( 1 + 0.51 q ) , where q is the specific humidity of the air. Second, we corrected the tilt. The eddy covariance method assumes that the mean value of the vertical wind speed is zero ( w ¯ = 0 ) at a certain time. However, it is typically difficult to obtain actual observations. Therefore, tilt correction is necessary to make the mean value of the vertical wind speed zero to eliminate the error caused by tilt. In this study, we selected the secondary coordinate rotation method [46,47]. After that, we obtained the pulsation of temperature and wind based on the Reynolds convention [48]. Finally, the turbulence-scaling parameters were estimated using Equations (3)–(5).
We evaluated the reliability of C n 2 estimated by the new model using the correlation coefficient (r) and the root mean square error (RMSE) in Section 3. The expressions are defined as:
r = i = 0 N ( X i X ¯ ) ( Y i Y ¯ ) i = 0 N ( X i X ¯ ) 2 i = 0 N ( Y i Y ¯ ) 2
R M S E = 1 N i = 0 N ( Y i X i ) 2
where X i is the individual log 10 ( C n 2 ) value measured by the micro-thermometer, X ¯ represents the average value of X i , Y i is the individual log 10 ( C n 2 ) value estimated by different dimensionless functions at the same time, Y ¯ represents the average value of Y i , and N is the number of samples.

3. Results and Discussion

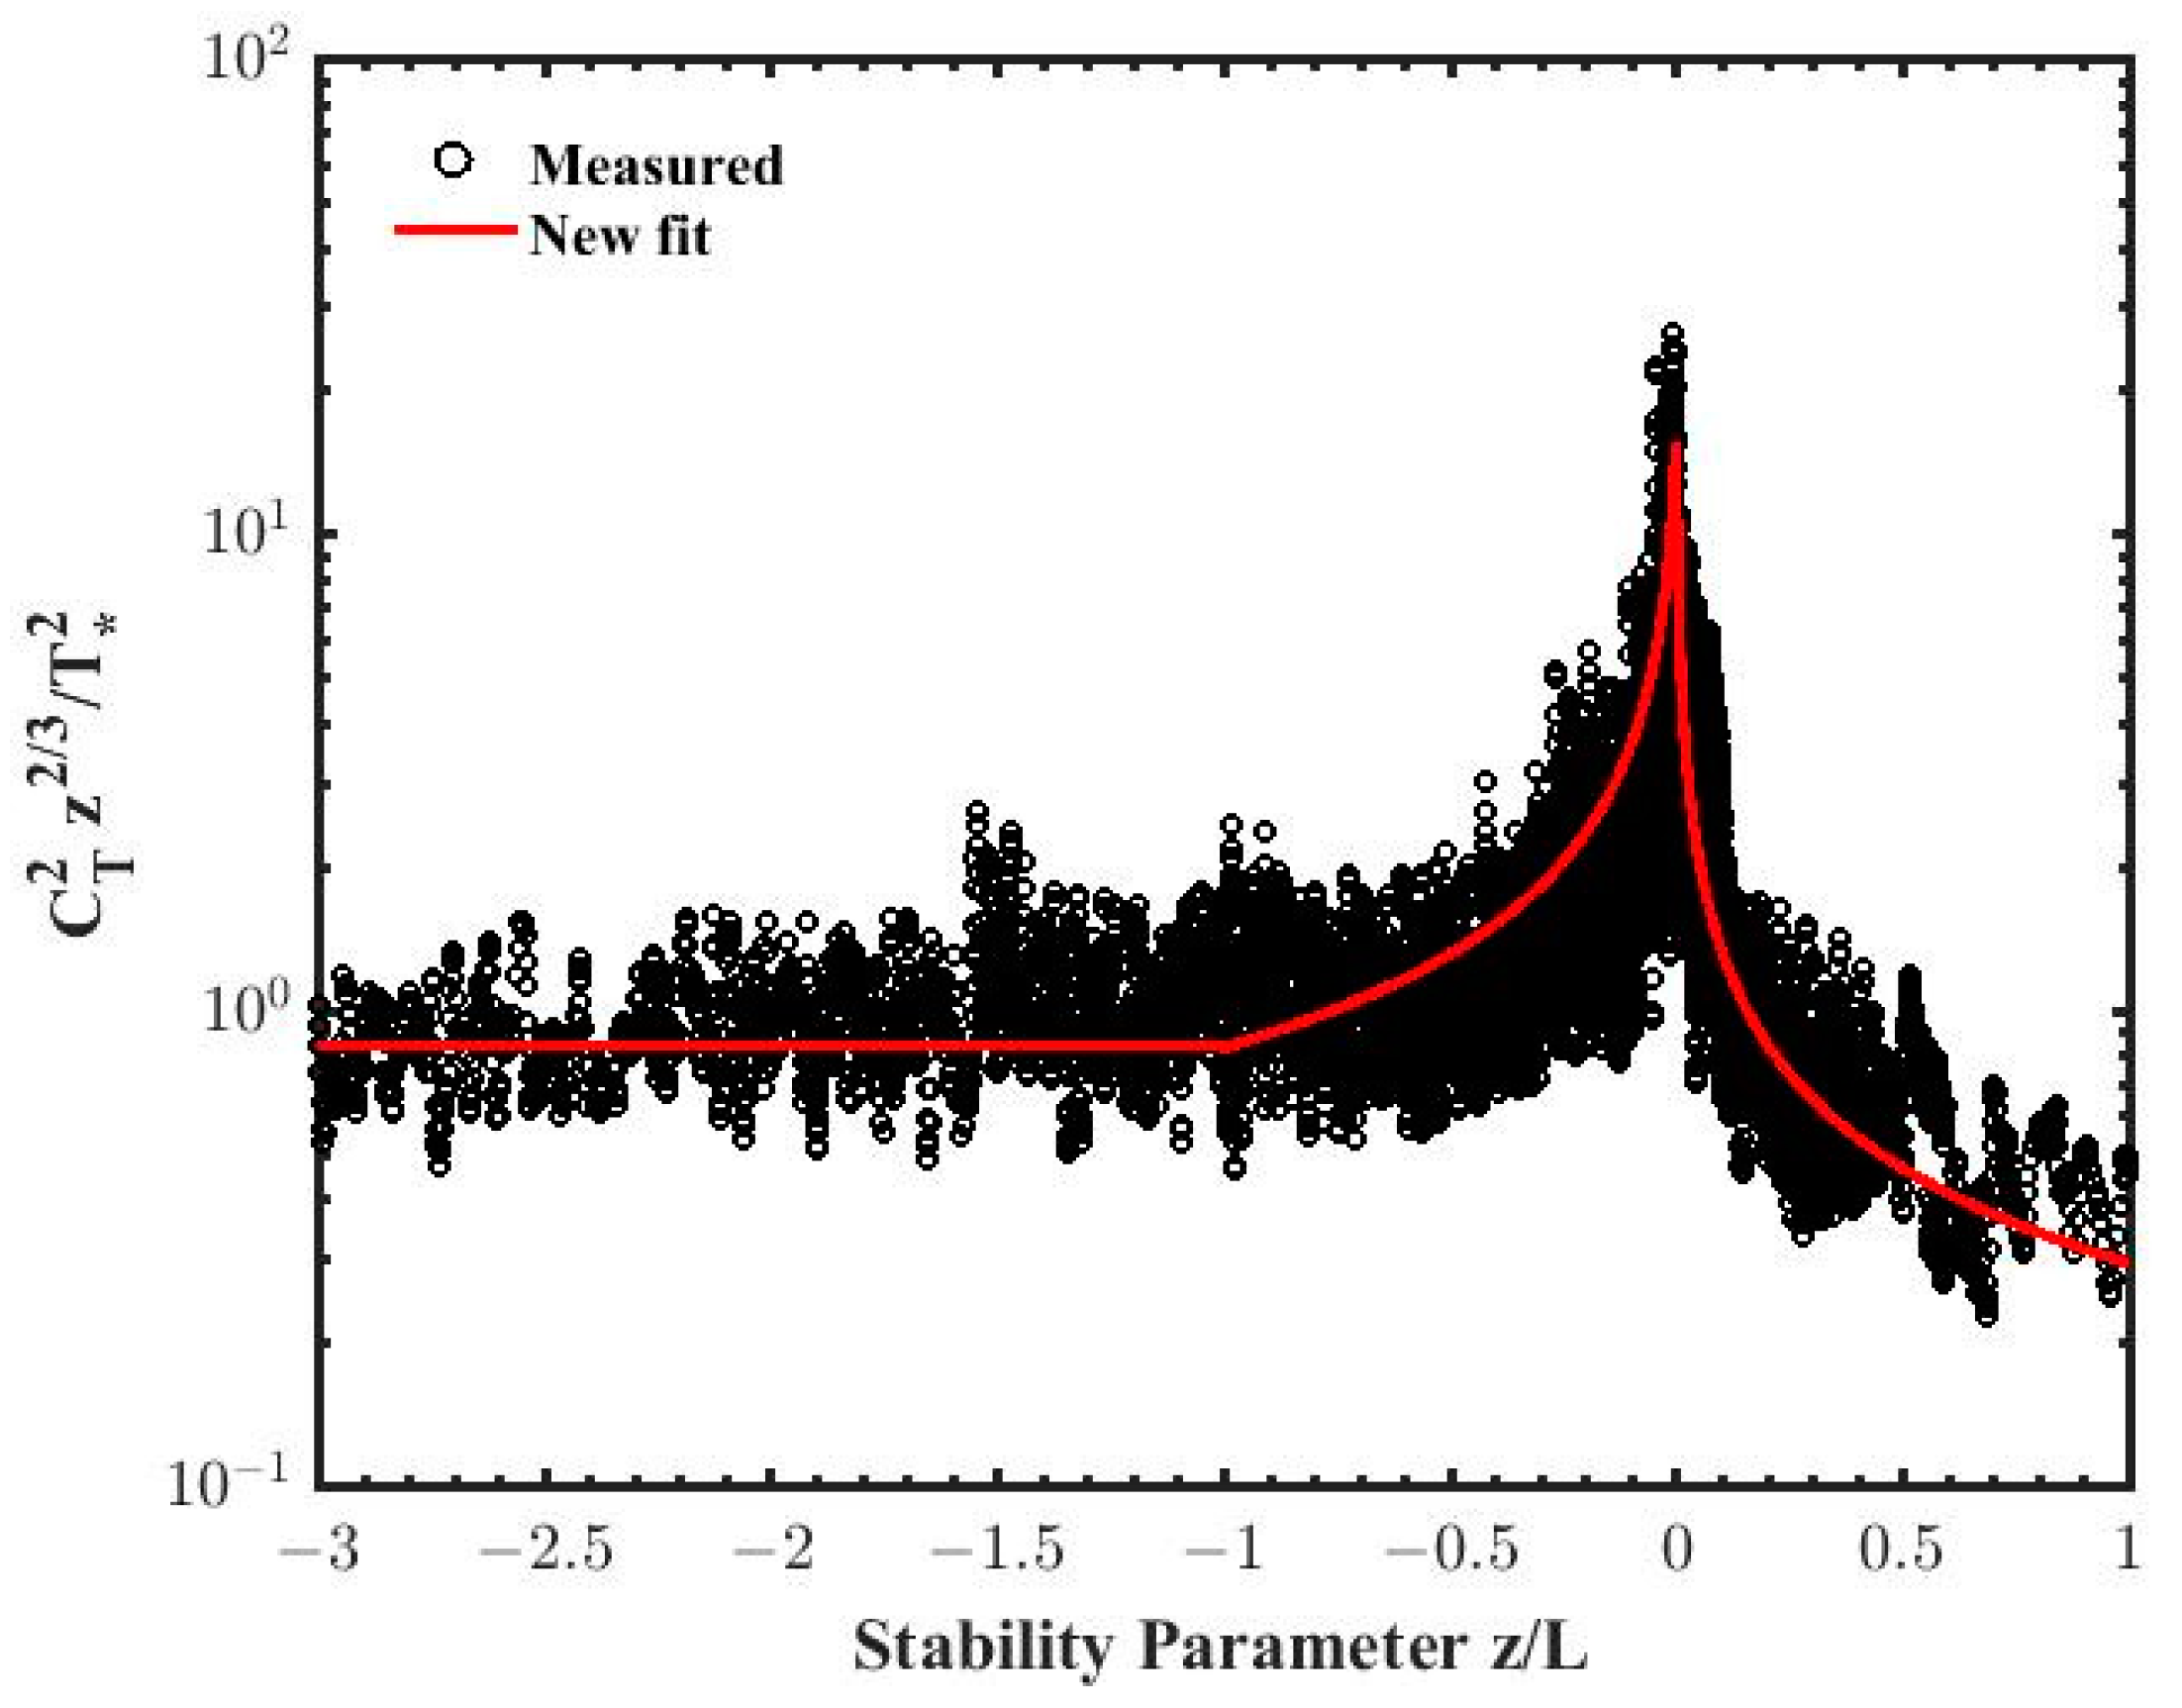
To obtain the dimensionless temperature structure function near the sea surface in the South China Sea, we used the measured wind speed and temperature data from January to November 2020 and Equations (4) and (5) to obtain turbulence-scaling parameters u * and T * and the stability parameter ξ . We then calculated dimensionless C T 2 using Equation (3) and fitted the dimensionless temperature structure function. In Figure 3, we can observe the variation in the dimensionless temperature structure function f T in terms of the stability parameter ξ = z / L . The hollow black dots are f T values computed from the measured data, and the solid red line is the fitted curve of the new function (Equation (10)). Under stable conditions ( ξ > 0 ), there were fewer scatter points when ξ > 1 . Hence, we only studied the interval 3 < ξ < 1 where the data were concentrated. Combining several similarity functions, we used the same function expression (Equation (9)) to fit the measured data under unstable and stable conditions:
f T ( ξ ) = a ( 1 b ξ ) 2 3
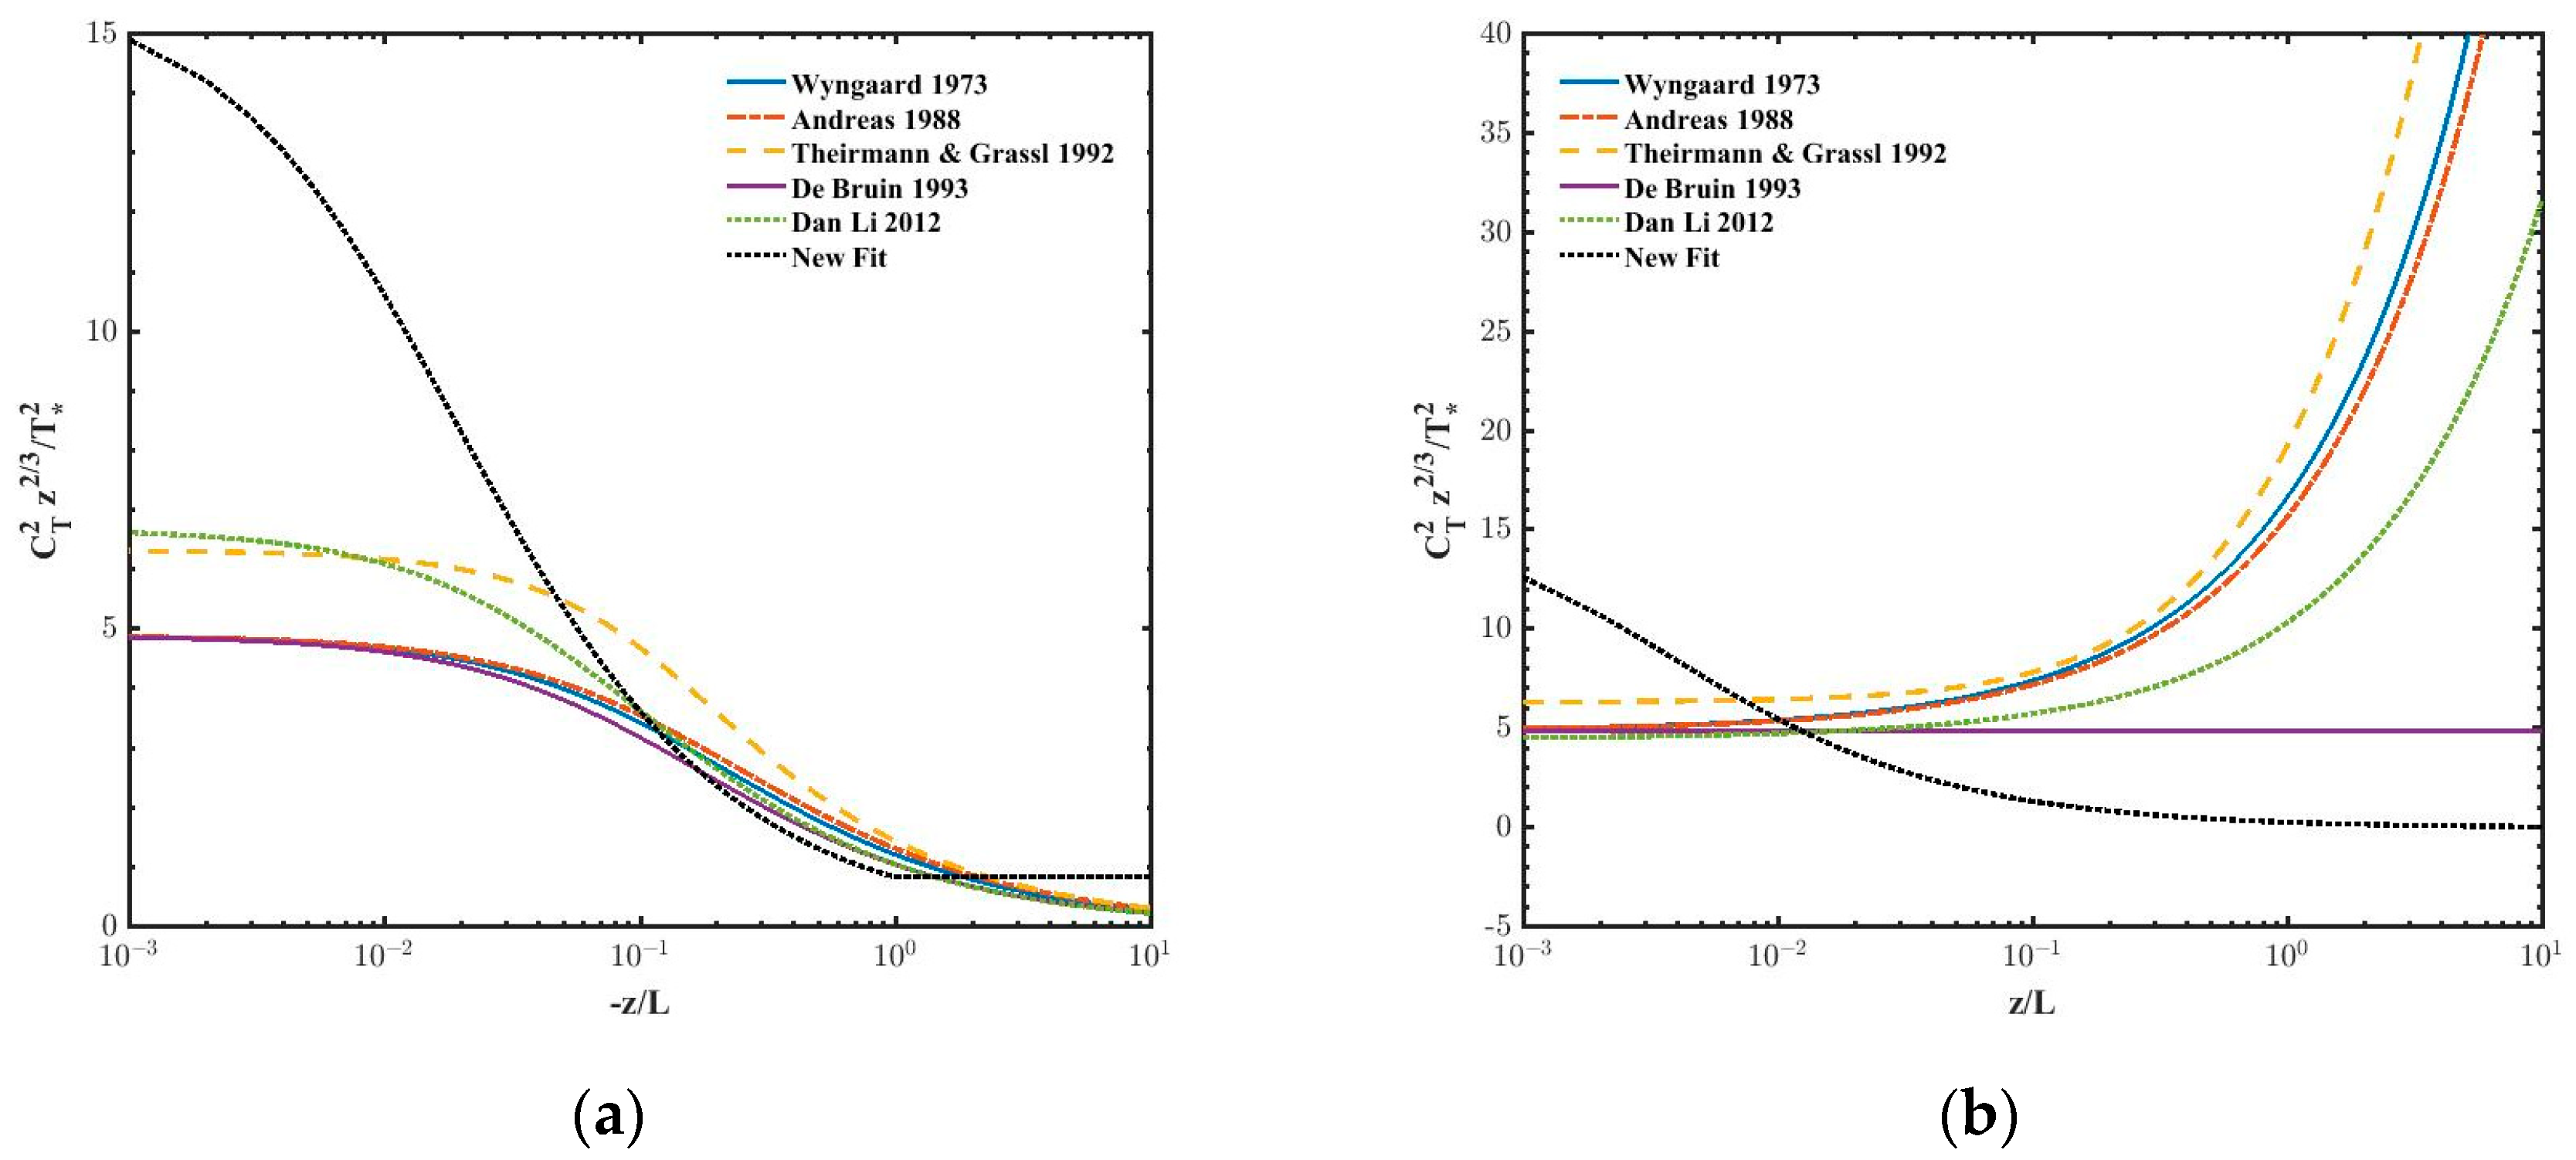
Under unstable conditions ( ξ < 0 ), we improved the function similar to the results of previous studies, where the function values gradually decreased with increasing instability | ξ | . The difference is that when the atmosphere is very unstable ( ξ < 1 ), the measured f T results have a weak relationship with stability. Therefore, we used a piecewise function to describe the temperature similarity function near the sea surface of the South China Sea under unstable conditions. The parameterized function value of ξ < 1 was described by a constant. As indicated in Figure 4, under unstable conditions (that is, | L | > z = 2 m ), the values of previous empirical functions decreased, approaching 0, compared to our measured data, which appear as black dots in Figure 3 and were close to the results of the W73 model but more consistent with a constant.
As for the unstable conditions, Liu studied the near-surface turbulence data of the second Tibetan Plateau Meteorological Science Experiment and found that f T did not satisfy the 2/3-power relationship [49]. After several attempts, we found that it is difficult to fit f T using the previous expressions with the 2/3 law under stable conditions. However, the dependence of f T upon ξ to the −2/3 power fit the data better. It is worth mentioning that the closer it is to neutral conditions, the greater the value of f T . The expression for the new function is as follows:
f T ( ξ ) = {             0.85             ,   ξ 1 15.7 ( 1 79.5 ξ ) 2 3 , 1 ξ 0 15.7 ( 1 + 382.3 ξ ) 2 3 ,   ξ 0
Figure 4 displays the new function (Equation (10)) and the other similarity functions (Table 1 and Table 2) mentioned above with ξ , and Figure 4a,b correspond to the unstable and stable conditions, respectively. The dotted black line is the new fitted function and the solid blue line is a typical W73 model proposed by Wyngaard in 1973. The dotted red, dotted yellow, solid purple, and dotted green lines represent the A88, T and G92, DB93, and DL12 models, respectively. Table 1 and Table 2 present the specific values of the function models and parameters. As indicated in Figure 4a, under unstable conditions ( ξ < 0 ), these temperature similarity function models exhibited the same change trends: the parameterized C T 2 decreased with increased instability. Under weakly unstable and near-neutral conditions ( ξ < 0.01 ), the parameter a in the expression dominated the function. The maximum parameter a corresponding to the new model in this range was 15.7 and the line was at the top. The lines of the W73 and A88 models coincide, and the value of parameter a was 4.9. When 0.01 < ξ < 1 , the difference among the functions decreased. In general, under the condition of ξ < 1 , the values of previous empirical functions were marginally overestimated compared to the new function. As for the very unstable conditions ( ξ > 1 ), the functions gradually stabilized, and the new function described the values in the form of a constant. It can be concluded that, under very unstable conditions, the improved new function is similar to the existing empirical functions. However, the function value is the greatest while it is close to neutral conditions.
As indicated in Figure 4b, under stable conditions, the four f T values of W73, A88, T and G92, and DL12 increased with increasing ξ , whereas the expression of model DB93 was a constant. Combined with Figure 3, the measured f T was primarily concentrated in 0 < ξ < 1 . The new function tended to be steady in ξ > 1 , the shape of the line being similar to that of the DB93 model. However, the values were typically smaller. The most significant difference between the new function and other functions is that the function decreased with the increase in ξ under near-neutral and stable conditions. This phenomenon has also appeared in other experiments. When Guo et al. [50] analyzed the applicability of MOST using LAS data, they found that the traditional function models also did not satisfy the measured values. Frederickson [51] proposed a new f T over an ocean surface and then improved the accuracy of estimating C n 2 combined with the bulk model. Later, when studying the calculation model of ocean atmospheric turbulence, Li proposed a new function suitable for the Yellow Sea of China based on Frederickson’s model; the results indicated that the new function was more consistent with the stability −2/3 power [52]. Under near-neutral conditions, the new function value was considerably higher than the previous functions. MOST and traditional functions may not be applicable owing to the insufficient development of nighttime turbulence. It can be observed from Equations (3) and (4) that f T and ξ depend on the friction velocity u * and heat flux Q, although with different exponents and trends. C T 2 changed minimally, and the smaller the ξ value (closer to 0), the greater the u * value. Conversely, the greater the Q value (based on Equation (3)), the greater the f T value, which is the reason for the large value of f T under near-neutral conditions from the perspective of function expression.
The improved function demonstrated that under stable conditions, the relationship between f T and ξ was a −2/3 exponent rather than the traditional 2/3 relationship. The possible reasons for this phenomenon are as follows: The traditional MOST is suitable for the case of a constant flux layer and | ξ | < 1 ~ 2 m, and the underlying surface is horizontally homogeneous. The height of the constant flux layer of the stable boundary layer over the ocean we studied decreased with increased stability, and the situation of the ocean-underlying surface was more complicated, leading to the failure of the traditional functions. Under stable conditions at night, the airflow is obviously intermittent due to the influence of mesoscale motions [53] and the turbulence is non-stationary, which limits the application of MOST under stable conditions [54]. The stability of the boundary layer at night increases with the Richardson numbers, and the development of turbulence is restrained. Therefore, it might be related to the Richardson numbers. In summary, the stable boundary layer had unique mesoscale motion characteristics, which can also influence the applicability of traditional functions. Considering the limited amount of data in this study, the reasons will be discussed in further research.
We integrated the data from January to November 2020 and retained the continuous and complete data on sunny days. On the basis of the above method, we used the existing empirical functions and the new function to estimate C n 2 and evaluate the reliability between estimated and measured C n 2 using the correlation coefficient and the root mean square error in four seasons. Table 3 presents the r and RMSE values of log 10 ( C n 2 ) between models and measurement. All models demonstrated acceptable correlation for winter, spring, and summer, where the correlation coefficient was greater than 0.80. The new function increased the correlation coefficient between the estimation and the measurement to more than 0.90. It is worth noting that the parameterization C T 2 of the DB93 model under stable conditions was a constant and the correlation coefficient between the estimated and measured results was 0.78 in autumn. The form of the new function under stable conditions was also significantly different from the other models, and the correlation coefficient between the estimated and measured values increased to 0.89. The correlation coefficients of the other models were all less than 0.70. Comparing the functional expressions under stable and unstable conditions, the difference can be considered to be mainly caused by the expression under stable conditions. In general, by comparing the new function with the previous functions, the correlation between the estimated and measured values improved to different degrees and the error was also reduced.
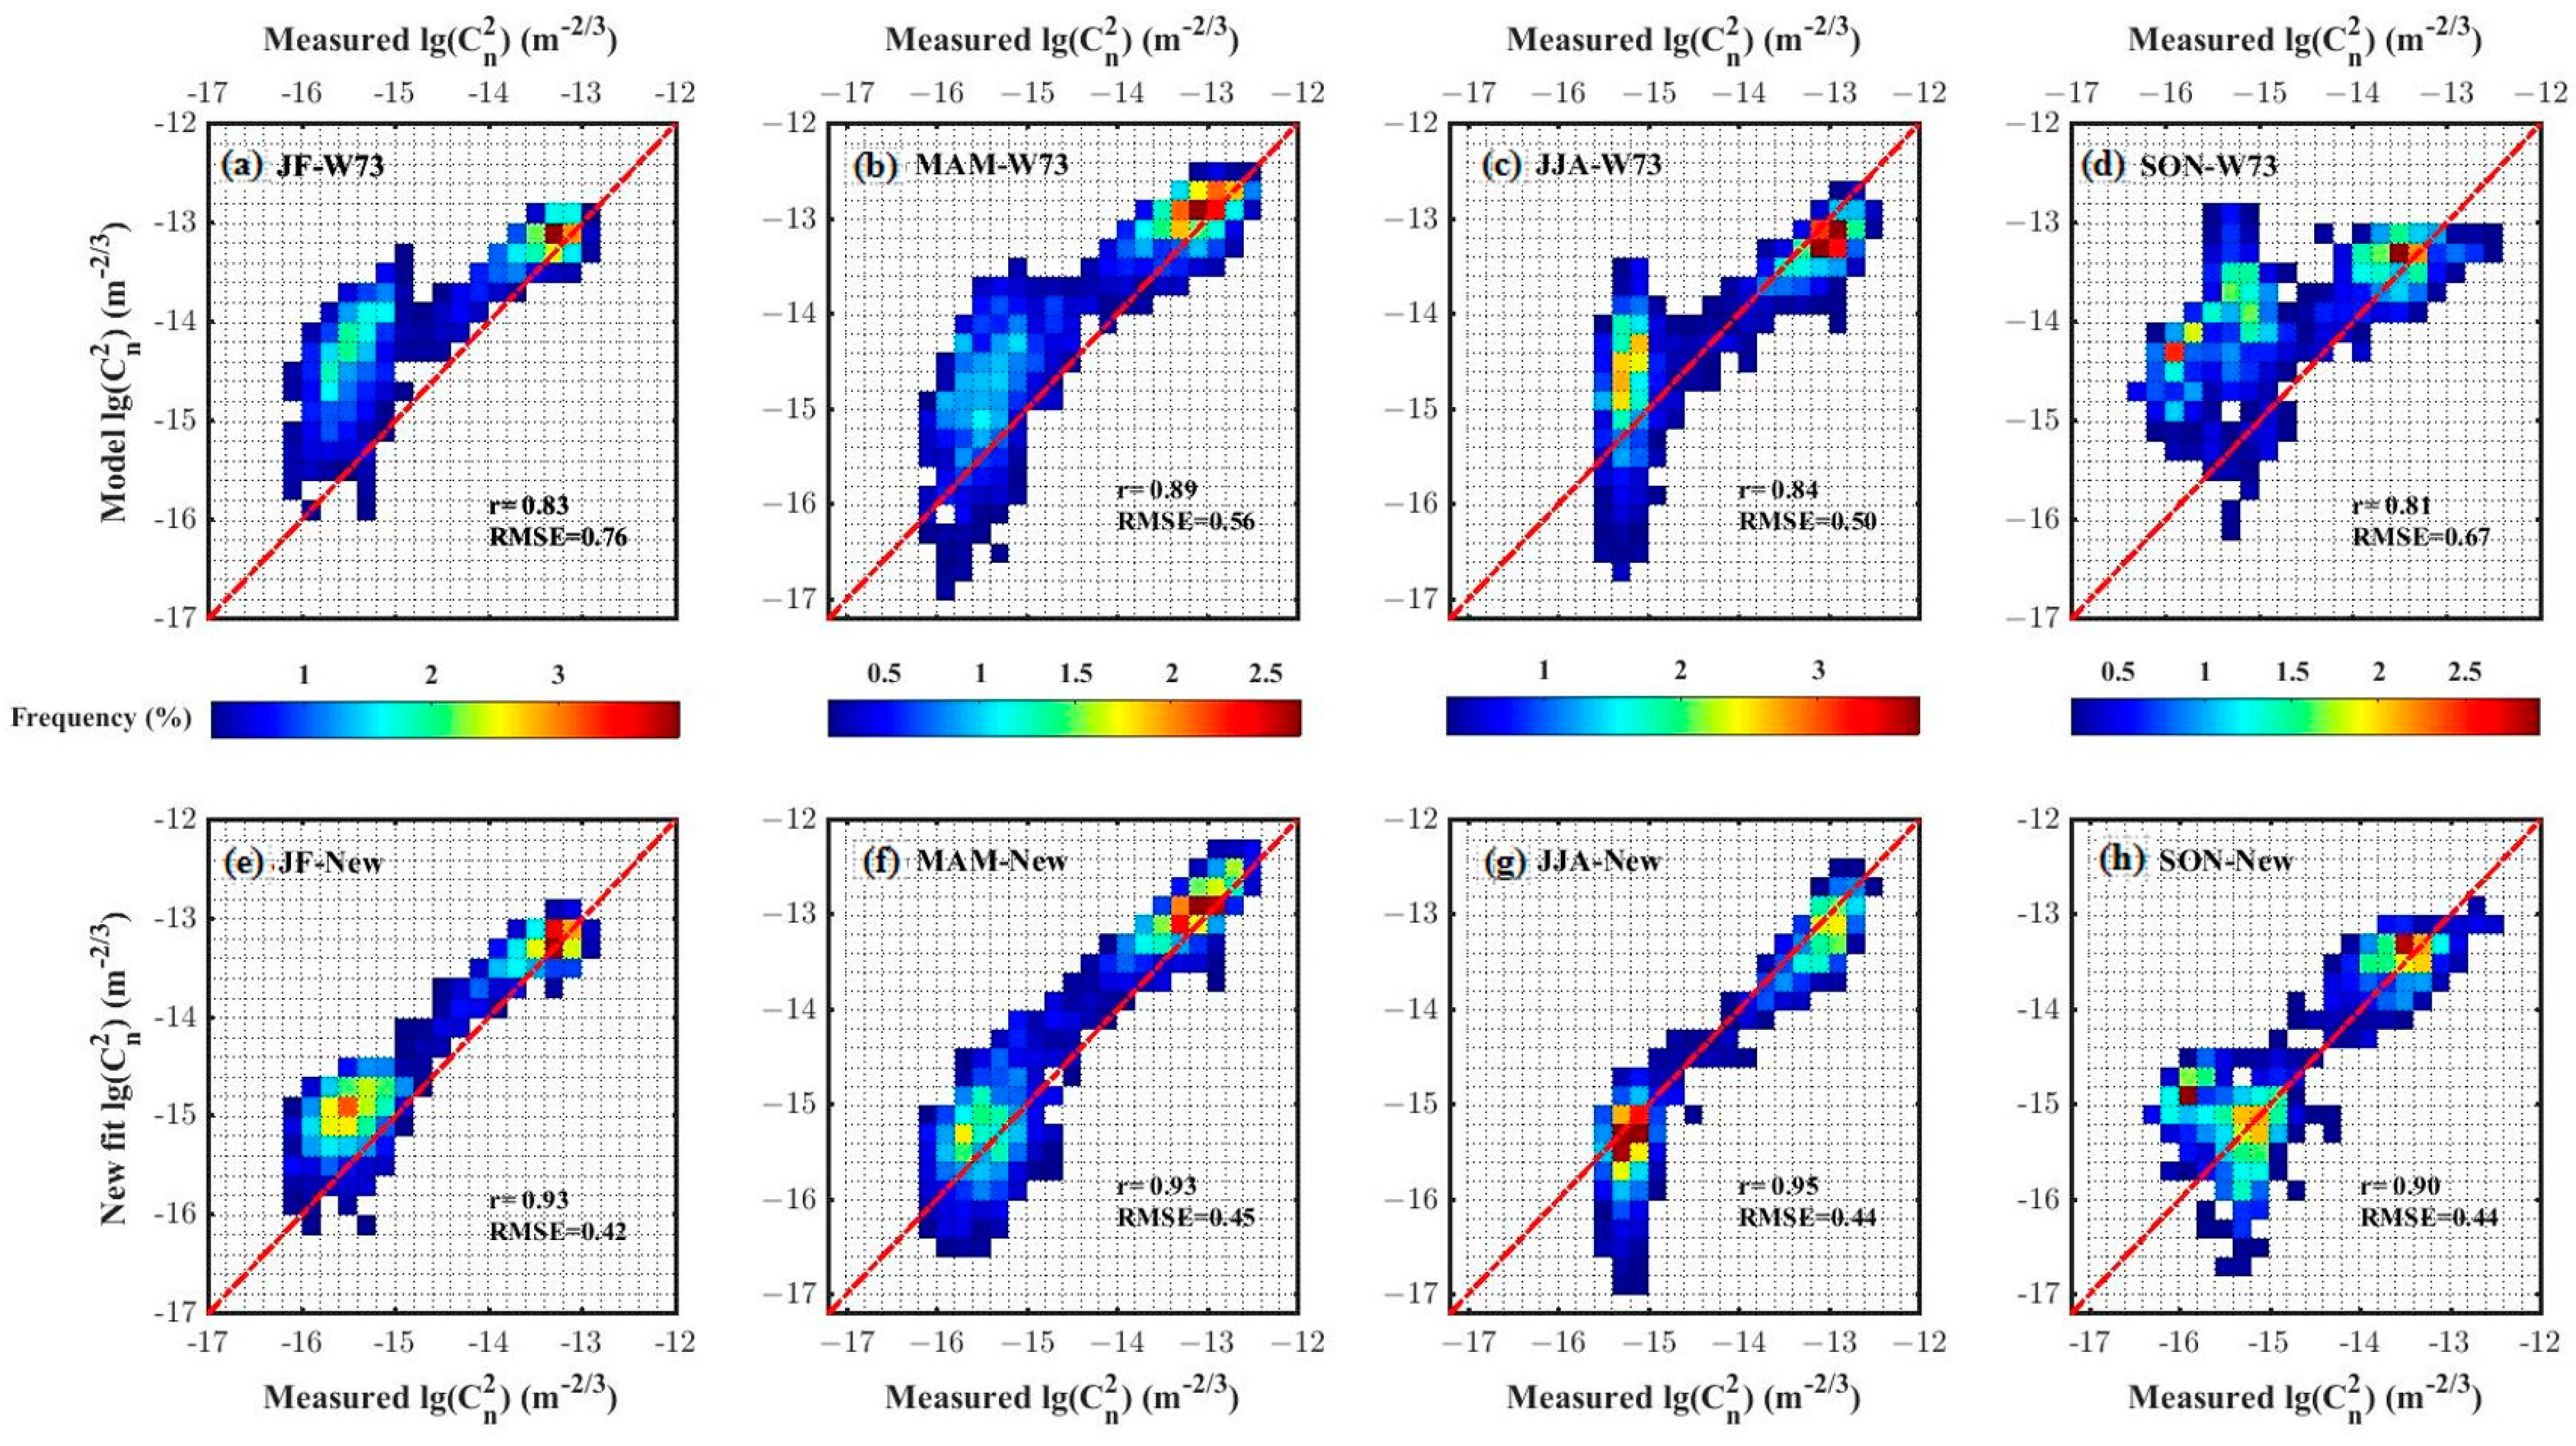
In this study, combined with Equations (2) and (3), the C n 2 was estimated using the previous empirical functions and the new function. Taking the commonly used W73 model as an example, as indicated in Figure 5, the horizontal axis represents the C n 2 measured by the micro-thermometer and the vertical axis represents the results estimated by two models. Figure 5a–d displays the results estimated by the W73 model in the four seasons of winter, spring, summer, and autumn, respectively. Figure 5e–h shows the results estimated using the new function. It can be observed from Figure 5a–d that the values estimated by the W73 model were greater than the measured values, especially when the turbulence intensity was weak. The difference between the estimated and measured values in autumn (Figure 5d) was clearly greater; the correlation coefficient was 0.62. However, the correlation coefficient of the other three seasons was more than 80%, which verifies the feasibility of the method to estimate C n 2 . Compared with Figure 5a–d, Figure 5e–h are more concentrated on both sides of the y = x imaginary line, and the values of the RMSE are also reduced. The difference between the models and the measurements reduced, and the estimation accuracy improved. The improved function in winter (Figure 5a,e) increased the correlation between the model and measured values from 0.83 to 0.94, and the RMSE decreased by 0.44. The correlation coefficient in spring (Figure 5b,f) increased from 0.89 to 0.94. The correlation coefficients in summer (Figure 5c,g) and autumn (Figure 5d,h) increased by 0.11 and 0.27, respectively; the RMSE also decreased. The correlation coefficient between the estimated and measured values of the improved function in different seasons significantly improved, and the estimation accuracy also improved to varying degrees. Therefore, the improved function demonstrates superior consistency with the observed data, particularly when turbulence intensity is weak; that is, the effect of improvement is more significant under stable conditions. In other words, the new function indicates acceptable applicability to the South China Sea near the sea surface in all four seasons.
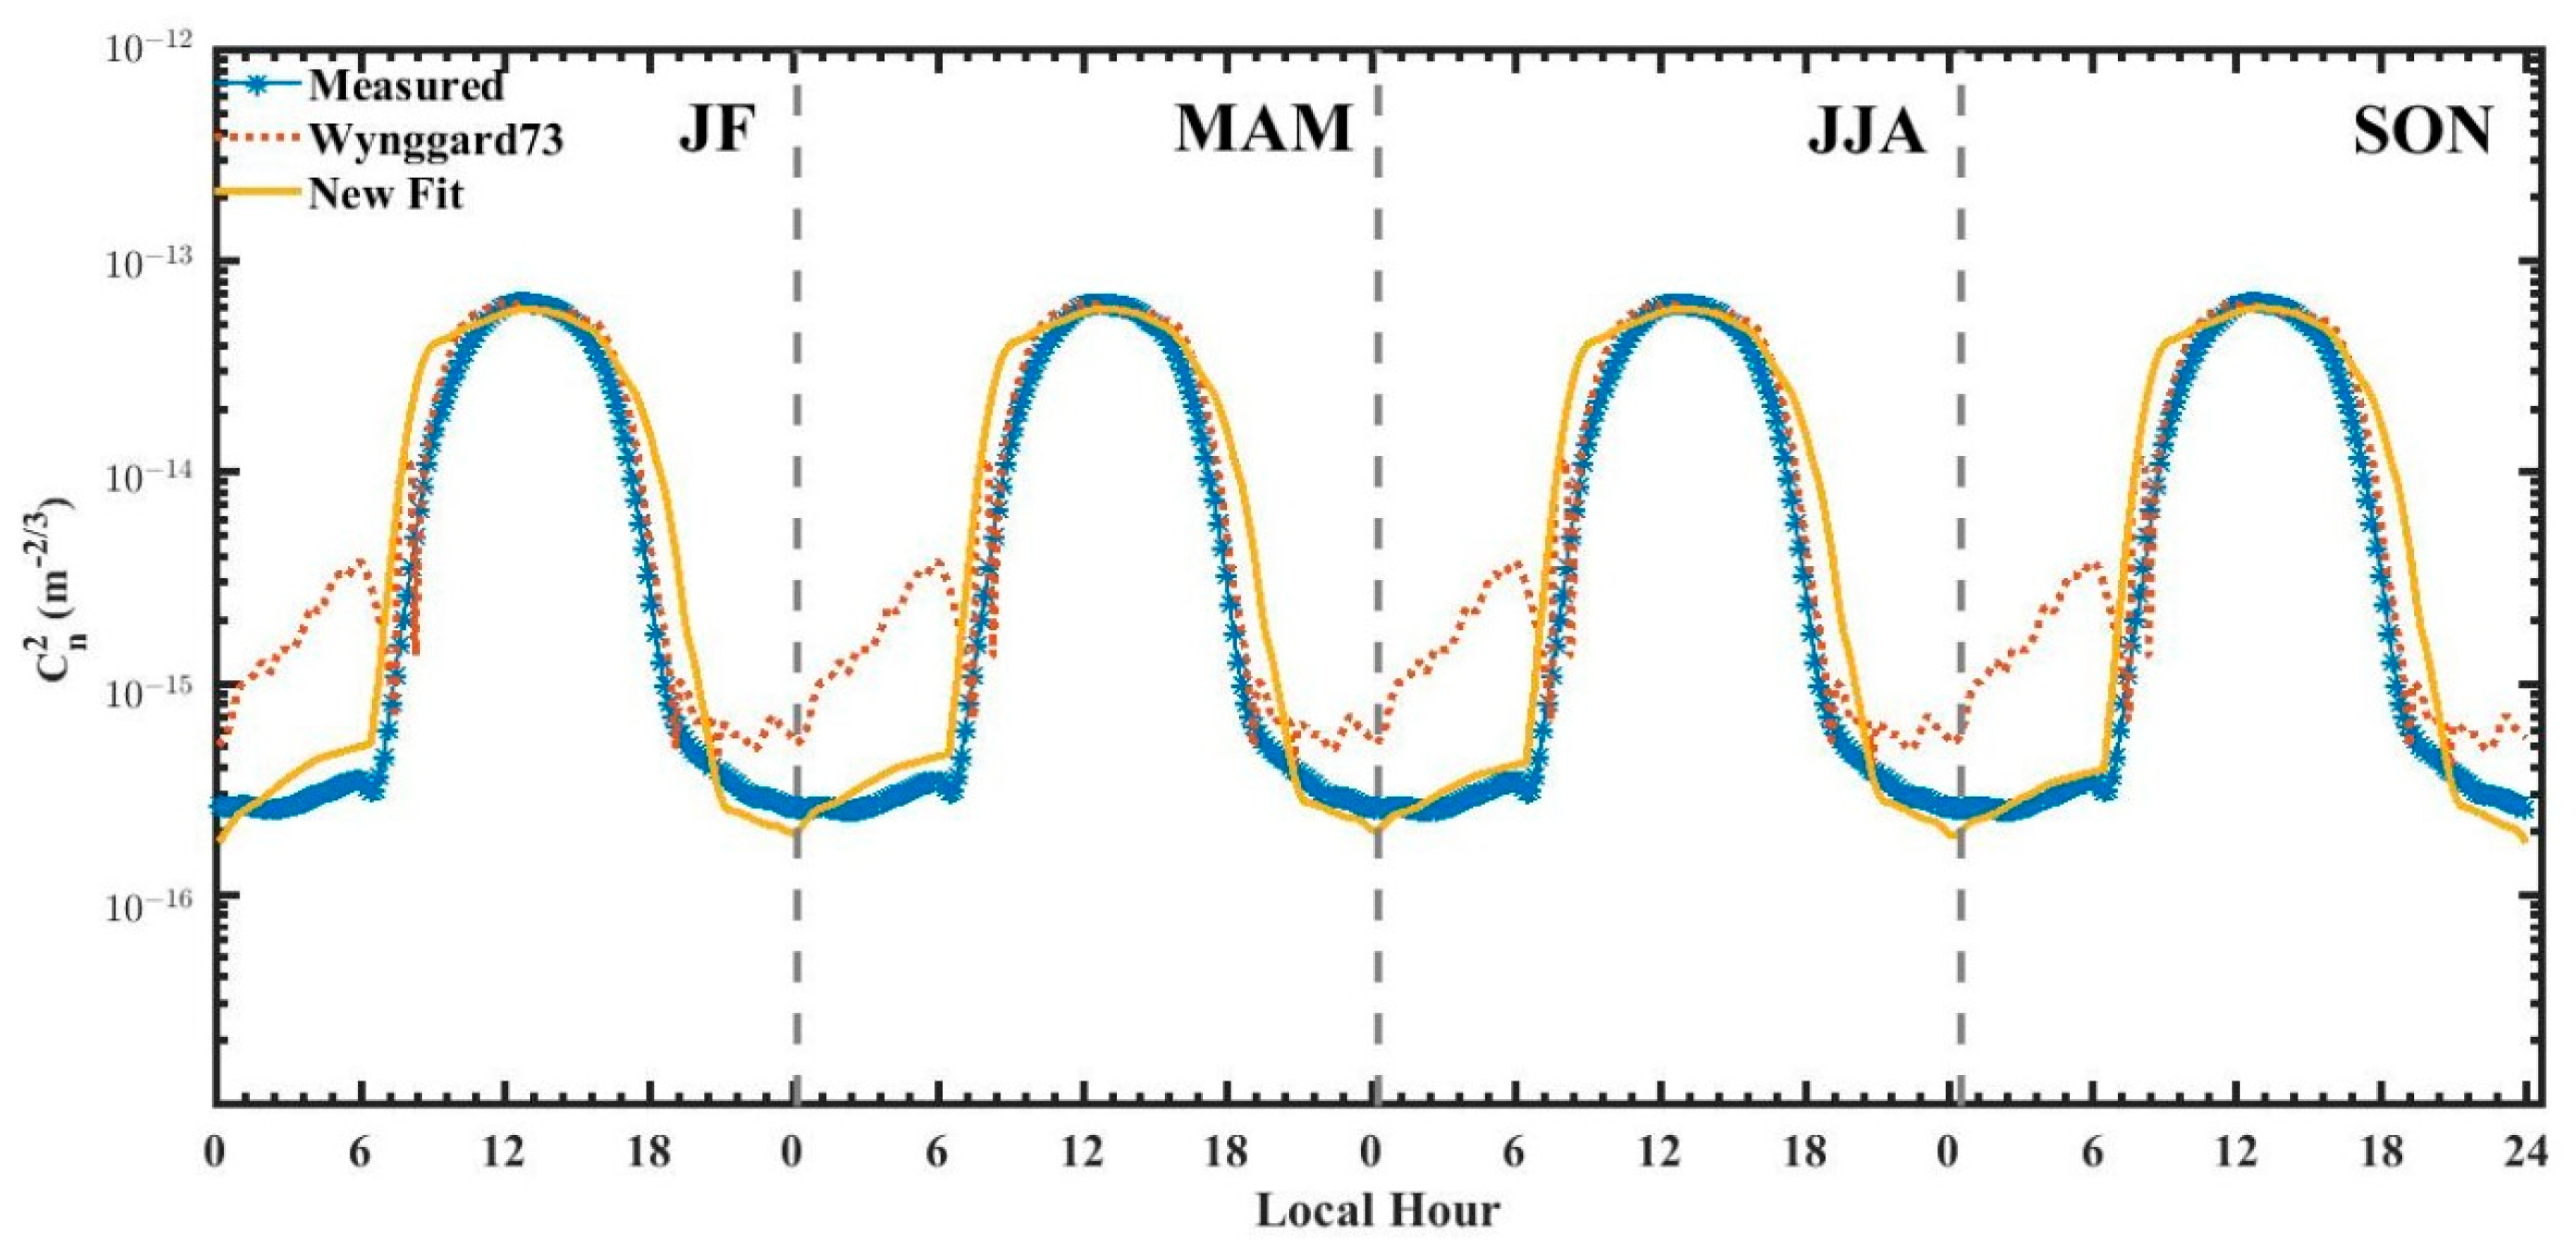
To further verify the applicability of the new function to the sea area, we analyzed diurnal variation by season. Comparing the diurnal variation using the typical W73 model and the new function (Equation (10)) combined with Equations (2)–(5)), the C n 2 was estimated and compared with that measured using the micro-thermometer. Figure 6 displays this seasonally averaged diurnal variation comparison of the C n 2 values. The blue asterisk indicates the C n 2 measured by the micro-thermometer. The seasonal temperature difference was small, and seasonal differences were not easily apparent in this sea area. There are clear diurnal variations: during the day, the atmosphere is unstable, the surface temperature is higher than the atmospheric temperature, the heat travels upward, and the turbulence is intense; however, at night, the atmosphere is in a stable state, the heat propagates downward through turbulence, and the turbulence intensity and fluctuation are small. The dotted red line represents the estimated C n 2 based on the W73 model. The measured and estimated turbulence intensities are in a range 10−16–10−13. In this study, we proved that the method used is feasible for estimating C n 2 because of the consistency of the measured and estimated diurnal variation characteristics. The daytime turbulence developed sufficiently and the estimated values were in acceptable agreement with the measured values. However, the atmosphere was stable at night and the estimated values were discrete from the measured values. Previous functions could no longer be applicable to this sea area. As for the transition times of turbulence, they generally correspond to near-neutral conditions. Because of the large specific heat capacity of the ocean region, the temperature near the sea surface changes slowly. Hence, the transition times of turbulence cannot be observed clearly [55]. The C n 2 values estimated by the new f T (indicated by the solid yellow line) are consistent with the measured characteristics under unstable conditions during the daytime, and the values are also consistent. The deviation between the estimated and measured C n 2 was considerably smaller than that of the W73 model, particularly under stable conditions. This corresponds to Figure 4b, where the value of the W73 model is larger than that of the new function under stable conditions. Therefore, the improved new function can be considered to be more suitable for estimating turbulence intensity in this sea area compared to the existing empirical functions.
Curley et al. indicated that [56] the refractive index structure constant in the atmospheric boundary layer reduced under widespread cloudy conditions. Compared with the clear boundary layer, the cloud-topped boundary layer needs to consider the interaction between the boundary layer and the cloud, which involves the long-wave radiation cooling of the cloud top and the entrainment process of the boundary layer top [57,58,59] and directly maintains the radiation energy balance, turbulent flux, and turbulent kinetic energy in the boundary layer. Therefore, for a deeper study of the turbulent structure in the cloud-topped boundary layer, it is essential to observe the physical characteristics of clouds.

4. Conclusions

In this study, we obtained a new dimensionless temperature structure function suitable for the South China Sea based on MOST using measured three-dimensional wind speed and meteorological data combined with the eddy covariance method. We used the new improved function to estimate the atmospheric refractive index structure constant and compared it with the measured values of a microthermal meter. The following conclusions were drawn: We selected a simple expression that can reflect the variation to fit the measured data and obtained a new function, as displayed in Equation (10), by analyzing the existing different forms of the dimensionless temperature structure function, f T . Under weakly unstable and near-neutral conditions, the new function was consistent with the common function form; however, the magnitude was bigger and the change was faster. Under very unstable conditions, the expression of the new function was improved to a constant. Under stable conditions, we proposed a new function form, whose change trend was considerably different from the previous functions.
To verify the applicability of the new function, we analyzed it by season. The results indicated that the correlation between the values estimated by the model and the measured values in each season were improved to varying degrees and the correlation coefficient r of the three seasons was more than 0.90. The decrease in the RMSE between the values estimated by the new model and the measured values also indicates that the difference between the two sets of values was smaller, the accuracy was higher, and the new model was more suitable for this sea area. Finally, we found that the daily variations in the values estimated by the model and the measured C n 2 were consistent and the difference between the measured and estimated values was small when the turbulence intensity was strong under an unstable station while these two were discrete when the atmosphere was stable. Comparing the values estimated by the new function with those by the W73 model, we found that the new function was more consistent with the measured values in the diurnal variation characteristics, especially under stable conditions, where the deviation was reduced and the coincidence was higher.
In this study, the method for estimating the atmospheric refractive index structure parameter C n 2 based on MOST combined with meteorological data demonstrated high reliability. The improved dimensionless temperature structure function f T for the South China Sea significantly improved the accuracy of C n 2 estimation and the correlation between the estimated and measured values, thus, providing a new similarity function for C n 2 measured by LAS. The new function also provides new ideas and lays the foundation for exploring the characteristics of atmospheric turbulence in the surrounding sea areas of China. However, it is not known whether this method has wide applicability to datasets of different sea conditions or different measurement systems. Owing to the limitations of the currently available data, we must perform more experiments to further test and verify them.

Author Contributions

F.W.: methodology, software, formal analysis, writing—original draft preparation. K.Z.: funding acquisition, investigation, writing—review and editing. G.S., Q.L. and X.L.: investigation, data curation. T.L.: funding acquisition, writing—review and editing, formal analysis, conceptualization. All authors have read and agreed to the published version of the manuscript.

Funding

This research was funded by the National Natural Science Foundation of China, Grant No. 41875041, Anhui Provincial Natural Science Foundation, Grant No. 2008085J19, the Foundation of Advanced Laser Technology Laboratory of Anhui Province, Grant No. AHL2021QN01, and the HFIPS Director’s Fund, Grant No. YZJJ2023QN07.

Data Availability Statement

In this section, the data underlying this article cannot be shared publicly due to the confidentiality requirements of the project in the study.

Acknowledgments

The authors sincerely acknowledge the editors’ and reviewers’ efforts in improving the manuscript.

Conflicts of Interest

The authors declare no conflict of interest.

References

  1. Sheng, P.; Mao, J. Atmospheric Physics; Peking University Press: Beijing, China, 2013; p. 222. [Google Scholar]
  2. Andrews, L.C.; Philips, R.L.; Hopen, C.Y. Laser Beam Scintillation with Applications; SPIE: Bellingham, WA, USA, 2001; pp. 201–204. [Google Scholar]
  3. Yang, Q.K.; Wu, X.Q.; Luo, T.; Qing, C.; Yuan, R.M.; Su, C.D.; Xu, C.S.; Wu, Y.; Ma, X.B.; Wang, Z.Y. Forecasting surface-layer optical turbulence above the Tibetan Plateau using the WRF model. Opt. Laser Technol. 2022, 153, 6. [Google Scholar] [CrossRef]
  4. Hu, Y.; Chen, J.; Lu, S. From the Clasic Theory of Turbulence to the Nonequilibrium Thermodynamic Theory of Atmospheric Turbulence. Plateau Meteorol. 2012, 31, 1–27. [Google Scholar]
  5. Toselli, I.; Gladysz, S. Adaptive optics correction of scintillation for oceanic turbulence-affected laser beams. In Proceedings of the Conference on Environmental Effects on Light Propagation and Adaptive Systems, Berlin, Germany, 12–13 September 2018. [Google Scholar]
  6. Baykal, Y.; Gercekcioglu, H. Multimode laser beam scintillations in strong atmospheric turbulence. Appl. Phys. B-Lasers Opt. 2019, 125, 6. [Google Scholar] [CrossRef]
  7. Monin, A.S.; Obukhov, A.M. Basic laws of turbulent mixing in the ground layer of the atmosphere (osnovne zakonomernosti turbulentnogo peremeshivaniya v prizemnom sloe atmosfery). Doki Akad Nauk Sssr 1954, 24, 163–187. [Google Scholar]
  8. Foken, T. 50 years of the Monin-Obukhov similarity theory. Bound.-Layer Meteor. 2006, 119, 431–447. [Google Scholar] [CrossRef]
  9. Hill, R.J.; Ochs, G.R.; Wilson, J.J. Measuring surface-layer fluxes of heat and momentum using optical scintillation. Bound.-Layer Meteor. 1992, 58, 391–408. [Google Scholar] [CrossRef]
  10. Chehbouni, A.; Watts, C.; Lagouarde, J.P.; Kerr, Y.H.; Rodriguez, J.C.; Bonnefond, J.M.; Santiago, F.; Dedieu, G.; Goodrich, D.C.; Unkrich, C. Estimation of heat and momentum fluxes over complex terrain using a large aperture scintillometer. Agric. For. Meteorol. 2000, 105, 215–226. [Google Scholar] [CrossRef] [Green Version]
  11. Moene, A.F.; Meijninger, W.; Hartogensis, O.K.; Kohsiek, W.; Debruin, H. A Review of the Relationships Describing the Signal of a Large Aperture Scintillometer; Wageningen Universiteit: Wageningen, The Netherlands, 2004; Available online: https://www.researchgate.net/publication/40123688_A_review_of_the_relationships_describing_the_signal_of_a_Large_Aperture_Scintillometer (accessed on 29 November 2022).
  12. Bai, J.; Liu, S.; Ding, X. Temporal-spatial characteristics analysis of area-averaged sensible heat fluxes by large aperture scintillometer over Hai River Basin. Adv. Earth Sci. 2010, 25, 1187–1198. [Google Scholar]
  13. Niu, S.; Zhao, L.; Lu, C.; Yang, J.; Wang, J.; Wang, W. Observational evidence for the Monin-Obukhov similarity under all stability conditions. Adv. Atmos. Sci. 2012, 29, 285–294. [Google Scholar] [CrossRef]
  14. Andreas, E.L. Estimating Cn2 over snow and sea ice from meteorological data. J. Opt. Soc. Am. A 1988, 5, 481–495. [Google Scholar] [CrossRef] [Green Version]
  15. Cai, J.; Wu, X.; Li, X.; Huang, H.; Qing, C. Estimation model of atmospheric optical turbulence and its similarity functions. High Power Laser Part. Beams (China) 2016, 28, 1–5. [Google Scholar]
  16. Businger, J.A.; Wyngaard, J.C.; Izumi, Y.; Bradley, E.F. Flux-profile relationships in the atmospheric surface layer. J. Atmos. Sci. 1971, 28, 181–189. [Google Scholar] [CrossRef]
  17. Wyngaard, J.C.; Izumi, Y.; Collins, J.; Stuart, A. Behavior of the refractive-index-structure parameter near the ground*. J. Opt. Soc. Am. 1971, 61, 1646–1650. [Google Scholar] [CrossRef]
  18. Wyngaard, J.C. On Surface Layer Turbulence.Workshop on Micrometeorology; American Meteorological Society: Boston, MA, USA, 1973; pp. 101–149. [Google Scholar]
  19. Yuan, R.; Zeng, Z.; Ma, C. Estimation Optical Turbulence by Meteorology Factors. Chin. J. Quantum Electron. 2001, 18, 87–91. [Google Scholar]
  20. Andreas, E.L. Atmospheric stability from scintillation measurements. Appl. Optics 1988, 27, 2241–2246. [Google Scholar] [CrossRef] [PubMed]
  21. Bruin, H.A.R.; Kohsiek, W.; Hurk, B.J.J.M. A verification of some methods to determine the fluxes of momentum, sensible heat, and water vapour using standard deviation and structure parameter of scalar meteorological quantities. Bound.-Layer Meteor. 1993, 63, 231–257. [Google Scholar] [CrossRef]
  22. Li, D.; Bou-Zeid, E.; Henk, A.R.; Bruin, D. Monin-Obukhov similarity functions for the structure parameters of temperature and humidity. Bound.-Layer Meteorol. 2012, 145, 45–67. [Google Scholar] [CrossRef]
  23. Thiermann, V.; Grassl, H. The measurement of turbulent surface-layer fluxes by use of bichromatic scintillation. Bound.-Layer Meteor. 1992, 58, 367–389. [Google Scholar] [CrossRef]
  24. Braam, M.; Bosveld, F.C.; Moene, A.F. On Monin–Obukhov scaling in and above the atmospheric surface layer: The complexities of elevated scintillometer measurements. Bound.-Layer Meteorol. 2012, 144, 157–177. [Google Scholar] [CrossRef] [Green Version]
  25. Wang, L.; Hu, N.; Wang, Y.; Wang, L.; Zhao, X.; Liu, S. Comparative analysis of sensible heat flux observed by large aperture scintillometer and eddy-covariance system in Nanjing. Chin. J. Ecol. 2020, 39, 315–325. [Google Scholar]
  26. Ding, X.B.; Zou, Y.F.; Li, C.Y.; Jian, W. Study of the Ultrasonic Three-Dimensional Wind Speed Measurement Methods Based on the Phase Difference. In Proceedings of the 2016 Sixth International Conference on Instrumentation & Measurement, Computer, Communication and Control (IMCCC), Harbin, China, 21–23 July 2016. [Google Scholar]
  27. Zhou, X.; Yang, Q.; Zhen, X.; Li, Y.; Hao, G.; Shen, H.; Gao, T.; Sun, Y.; Ning, Z. Recovery of the three-dimensional wind and sonic temperature data from a physically deformed sonic anemometer. Atmos. Meas. Tech. 2018, 11, 5981–6002. [Google Scholar] [CrossRef] [Green Version]
  28. Ma, Y.M.; Hu, Z.Y.; Xie, Z.P.; Ma, W.Q.; Wang, B.B.; Chen, X.L.; Li, M.S.; Zhong, L.; Sun, F.L.; Gu, L.L.; et al. A long-term (2005-2016) dataset of hourly integrated land-atmosphere interaction observations on the Tibetan Plateau. Earth Syst. Sci. Data 2020, 12, 2937–2957. [Google Scholar] [CrossRef]
  29. Xiao, L.; Weng, N.; Ma, C. Embedded micro-thermal meter. 2004. [Google Scholar]
  30. Weng, N.; Xiao, L.; Gong, Z. Refractive index structure constant profile and the average model. J. Atmos. Environ. Opt. 2007, 2, 16–22. [Google Scholar]
  31. Qing, C.; Wu, X.Q.; Huang, H.H.; Tian, Q.G.; Zhu, W.Y.; Rao, R.Z.; Li, X.B. Estimating the surface layer refractive index structure constant over snow and sea ice using Monin-Obukhov similarity theory with a mesoscale atmospheric model. Opt. Express 2016, 24, 20424–20436. [Google Scholar] [CrossRef]
  32. Zhang, K.; Wu, Y.; Wang, F.F.; Li, X.B.; Cui, S.C.; Zhang, Z.H.; Wu, X.Q.; Weng, N.Q.; Luo, T.; Huang, Y.B. Characteristics of the vertical structure of the atmospheric turbulence in the Tibetan Plateau. Sci. China-Earth Sci. 2022, 65, 1368–1378. [Google Scholar] [CrossRef]
  33. Nosov, V.; Lukin, V.; Nosov, E.; Torgaev, A.; Bogushevich, A. Measurement of Atmospheric Turbulence Characteristics by the Ultrasonic Anemometers and the Calibration Processes. Atmosphere 2019, 10, 460. [Google Scholar] [CrossRef] [Green Version]
  34. Shikhovtsev, A.; Kovadlo, P.; Lukin, V.; Nosov, V.; Kiselev, A.; Kolobov, D.; Kopylov, E.; Shikhovtsev, M.; Avdeev, F. Statistics of the Optical Turbulence from the Micrometeorological Measurements at the Baykal Astrophysical Observatory Site. Atmosphere 2019, 10, 661. [Google Scholar] [CrossRef]
  35. Tatarski, V.I. Wave Propagation in a Turbulent Medium; Courier Dover: Mineola, NY, USA, 1961. [Google Scholar]
  36. Frehlich, R.; Sharman, R.; Vandenberghe, F.; Yu, W.; Jumper, G. Estimates of Cn2 from numerical weather prediction model output and comparison with thermosonde data. J. Appl. Meteorol. Climatol. 2009, 49, 1742–1755. [Google Scholar] [CrossRef]
  37. Friehe, C.A. Estimation of the refractive-index temperature structure parameter over the ocean. Appl. Optics 1977, 16, 334–340. [Google Scholar] [CrossRef]
  38. Li, Y.; Xu, D. A method for calculating U* from data measured by a ship-borne supersonic anemometer. Period. Ocean. Univ. China 2006, 13–19. Available online: https://www.cnki.com.cn/Article/CJFDTotal-QDHY2006S2002.htm (accessed on 29 November 2022).
  39. Wang, J.; Duan, Z.; Yao, X.; Gao, H. Correction of ship-based turbulent wind velocity and characterization of turbulence in the Northwest Pacific. J. Trop. Oceanogr. 2013, 32, 9–15. [Google Scholar]
  40. Duan, Z.; Gao, H.; Gao, Z. The moving ship-based eddy covariance measurement of atmospheric turbulence in the North Yellow Sea. Period. Ocean. Univ. China 2014, 44, 81–88. [Google Scholar] [CrossRef]
  41. Meng, X.; Liu, H.; Du, Q.; Liu, Y.; Xu, L. Factors controlling the latent and sensible heat fluxes over Erhai Lake under different atmospheric surface layer stability conditions. Atmos. Ocean. Sci. Lett. 2020, 13, 400–406. [Google Scholar] [CrossRef]
  42. Webb, E.K.; Pearman, G.I.; Leuning, R. Correction of flux measurements for density effects due to heat and water-vapor transfer. Q. J. R. Meteorol. Soc. 1980, 106, 85–100. [Google Scholar] [CrossRef]
  43. Zhou, F.; Zhang, R.; Shi, R.; He, Y.; Chen, J.; Wang, D.; Xie, Q. A study of data processing and quality assessment of the eddy convariance system off Yongxing Island. J. Trop. Oceanogr. 2017, 36, 48–59. [Google Scholar]
  44. Zhang, H. Basis of Atmospheric Turbulence; Peking University Press: Beijing, China, 2014. [Google Scholar]
  45. Liu, Y.; Li, S.; Lu, S.; Ao, Y.; Gao, Y. Comparison of flux correction methods for eddy-covariance measurement. Plateau Meteorol. 2013, 32, 1704–1711. [Google Scholar]
  46. Wang, J.; Wang, W.; Ao, Y.; Sun, F.; Wang, S. Turbulence flux measurements under complicated conditions. Adv. Earth Sci. 2007, 22, 791–797. [Google Scholar]
  47. Vickers, D.; Mahrt, L. Quality Control and Flux Sampling Problems for Tower and Aircraft Data. J. Atmos. Ocean. Technol. 1997, 14, 514–526. [Google Scholar] [CrossRef]
  48. Tunick, A. Statistical analysis of optical turbulence intensity over a 2.33 km propagation path. Opt. Express 2007, 15, 3619–3628. [Google Scholar] [CrossRef]
  49. Liu, H.; Hong, Z. Turbulent characteristics in the surface layer over gerze area in the Tibetan Plateau. Chin. J. Atmos. Sci. 2000, 24, 289–300. [Google Scholar]
  50. Guo, W.; Liu, S.; Liu, S.; Xu, Z. Analysis on the Applicability of similarity theory in large aperure scintillometer obeservation. Plateau Meteorol. 2013, 32, 944–955. [Google Scholar]
  51. Frederickson, P.A.; Hammel, S.; Tsintikidis, D. Improving bulk Cn2 models for over-ocean applications through new determinations of the dimensionless temperature structure parameter. In Proceedings of SPIE–The International Society for Optical Engineering; SPIE: Bellingham, WA, USA, 2007; p. 6708. [Google Scholar]
  52. Li, Y.; Huang, X.; Yu, J.; Zhao, Y. Comparison and improvement of the atmospheric optical turbulence model in near sea surface. Acta Opt. Sin. 2012, 32, 6. [Google Scholar]
  53. Liang, J.; Zhang, L.; Bao, J.; Zhao, S.; Huagn, J.; Zhang, W. Turbulence Influenced by Mesoscale Motions in the Stable Boundary Layer over Complex Terrain of the Loess Plateau. Chin. J. Atmos. Sci. 2013, 37, 113–123. [Google Scholar]
  54. Mahrt, L.; Thomas, C.K.; Prueger, J.H. Space-time structure of mesoscale motions in the stable boundary layer. Q. J. R. Meteorol. Soc. 2009, 135, 67–75. [Google Scholar] [CrossRef]
  55. Qing, C.; Wu, X.; Li, X.; Zhu, W.; Qiao, C.; Rao, R.; Mei, H. Use of weather research and forecasting model outputs to obtain near-surface refractive index structure constant over the ocean. Opt. Express 2016, 24, 13303–13315. [Google Scholar] [CrossRef]
  56. Curley, M.J.; Peterson, B.H.; Wang, J.C.; Sarkisov, S.S.; Sarkisov, S.S.; Edlin, G.R.; Snow, R.A.; Rushing, J.F. Statistical analysis of cloud-cover mitigation of optical turbulence in the boundary layer. Opt. Express 2006, 14, 8929–8946. [Google Scholar] [CrossRef]
  57. van Meijgaard, E.; van Ulden, A.P. A first order mixing-condensation scheme for nocturnal stratocumulus. Atmos. Res. 1998, 45, 253–273. [Google Scholar] [CrossRef]
  58. Siebert, H.; Szodry, K.E.; Egerer, U.; Wehner, B.; Henning, S.; Chevalier, K.; Lückerath, J.; Welz, O.; Weinhold, K.; Lauermann, F. Observations of Aerosol, Cloud, Turbulence, and Radiation Properties at the Top of the Marine Boundary Layer over the Eastern North Atlantic Ocean: The ACORES Campaign. Am. Meteorol. Soc. 2021, 102, E123–E147. [Google Scholar] [CrossRef]
  59. Sun, W.Q.; Li, J.; Wang, B. Reducing the biases in shortwave cloud radiative forcing in tropical and subtropical regions from the perspective of boundary layer processes. Sci. China-Earth Sci. 2016, 59, 1427–1439. [Google Scholar] [CrossRef]
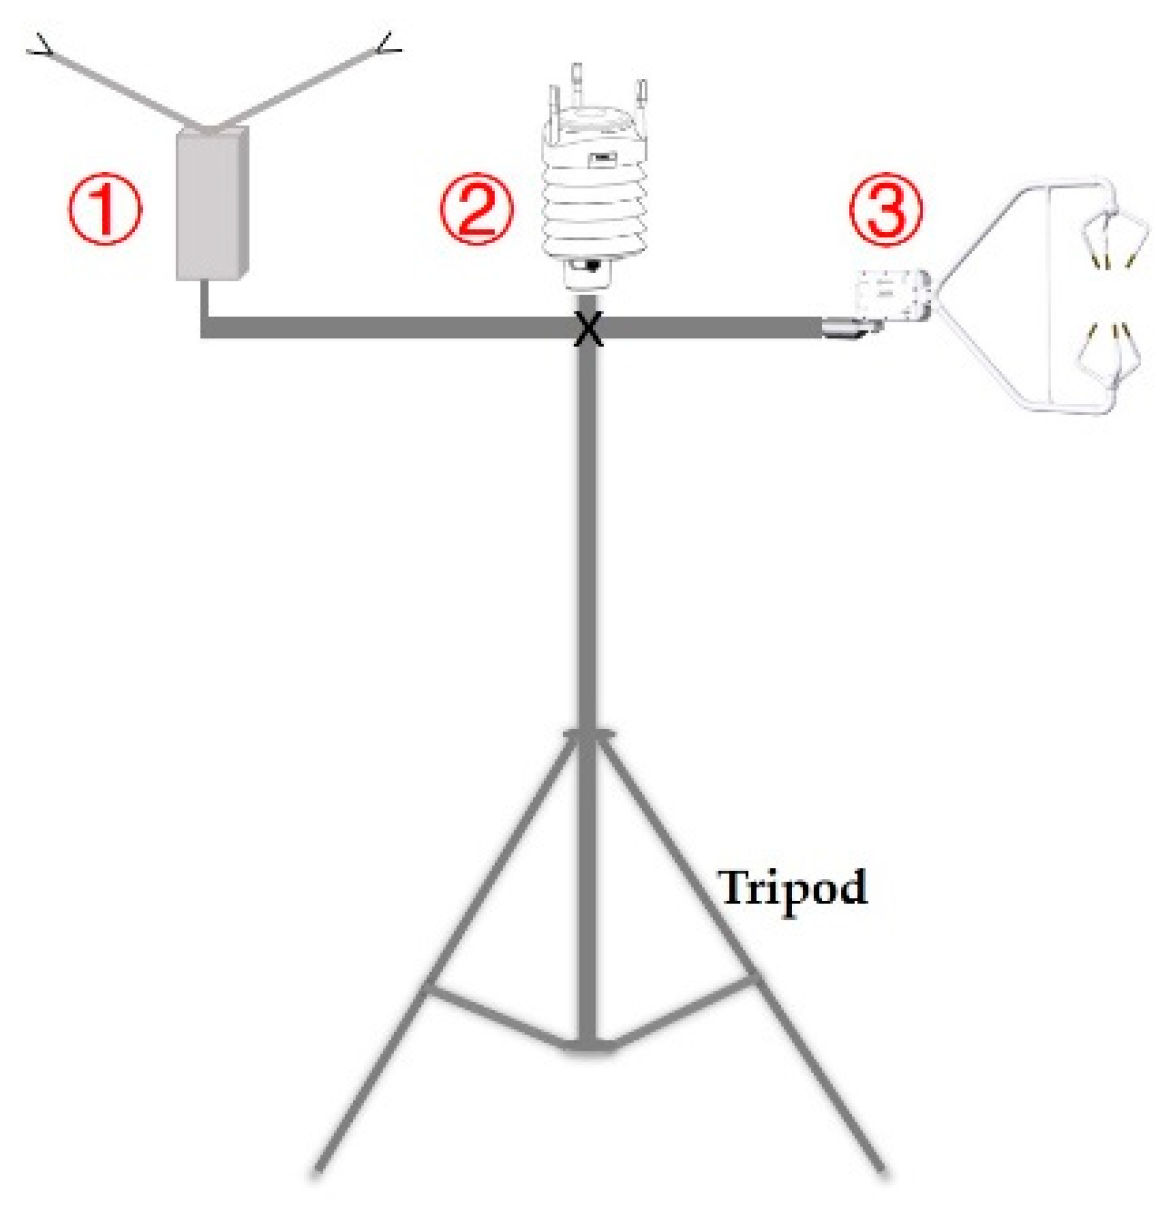
Figure 1. Diagram of the observation instruments above the sea surface: ① a micro-thermometer, ② an automatic weather station (WXT536), and ③ a three-dimensional ultrasonic anemometer (CSAT3).
Remotesensing 15 00631 g001
Figure 2. Flow chart of the turbulence-scale-parameter calculation process.
Remotesensing 15 00631 g002
Figure 3. Dimensionless temperature structure function f T versus the stability parameter ξ = z / L .
Remotesensing 15 00631 g003
Figure 4. Comparison of several dimensionless temperature structure parameter functions: (a) unstable conditions ( ξ < 0 ); (b) stable conditions ( ξ > 0 ).
Remotesensing 15 00631 g004
Figure 5. Comparison of measured and estimated log 10 ( C n 2 ) of previous models and the new function in different seasons: (ad) log 10 ( C n 2 ) estimated by the W73 model; (eh) log 10 ( C n 2 ) estimated by the new function.
Remotesensing 15 00631 g005
Figure 6. Comparison of diurnal variation between measured and model-estimated log 10 ( C n 2 ) values.
Remotesensing 15 00631 g006
Table 1. Expressions for similarity functions under unstable conditions ( ξ < 0 ).
FormulaabModel
f T ( ξ ) = a ( 1 - b ξ ) - 2 / 3 4.97Wyngaard (1973)
4.96.1Andreas (1988)
4.99De Bruin (1993)
6.714.9Dan Li (2012)
f T ( ξ ) = 6.34 ( 1 a ξ + b ξ 2 ) 1 / 3 775T and G (1992)
Table 2. Expressions for similarity functions under stable conditions ( ξ > 0 ).
Formula abModel
f T ( ξ ) = a ( 1 + b ξ 2 / 3 ) 4.92.4Wyngaard (1973)
4.92.2Andreas (1988)
4.90De Bruin (1993)
6.71.3Dan Li (2012)
f T ( ξ ) = 6.34 ( 1 + a ξ + b ξ 2 ) 1 / 3 720T and G (1992)
Table 3. Correlation coefficient ( r ) and the root mean square error (RMSE) between measured and estimated log 10 ( C n 2 ) results of different models in four seasons.
JF (Winter)MAM (Spring)JJA (Summer)SON (Autumn)
r RMSE r RMSE r RMSE r RMSE
Wyngaard 730.830.760.890.560.840.500.620.96
Andreas 880.840.760.900.560.850.490.640.94
Theirmann 920.850.820.890.600.850.490.631.00
De Bruin 930.870.650.900.500.890.450.780.73
Dan Li 120.850.700.900.530.860.470.680.86
New fit0.940.320.940.410.950.460.890.40
Disclaimer/Publisher’s Note: The statements, opinions and data contained in all publications are solely those of the individual author(s) and contributor(s) and not of MDPI and/or the editor(s). MDPI and/or the editor(s) disclaim responsibility for any injury to people or property resulting from any ideas, methods, instructions or products referred to in the content.