Article

Long-Term Measurements of the Atmospheric Boundary Layer Height in Central Amazonia Using Remote Sensing Instruments

by
Carla Maria Alves Souza
1,2,
Cléo Quaresma Dias-Júnior
1,2,*,
Flávio Augusto F. D’Oliveira
1,
Hardiney Santos Martins
1,
Rayonil Gomes Carneiro
3,
Bruno Takeshi Tanaka Portela
2 and
Gilberto Fisch
3,4
1
Department of Physics, Federal Institute of Pará (IFPA), Av. Almirante Barroso, Belém 66093-020, PA, Brazil
2
National Institute of Amazonian Research (INPA-CLIAMB), Av. André Araújo, Manaus 69067-375, AM, Brazil
3
National Institute for Space Research (INPE), Av. dos Astronautas, São José dos Campos 12227-010, SP, Brazil
4
Agricultural Science Division, Faculty of Agronomy, University of Taubaté (UNITAU), Estrada Municipal José Luís Cembraneli, Taubaté 12080-000, SP, Brazil
*
Author to whom correspondence should be addressed.
Remote Sens. 2023, 15(13), 3261; https://doi.org/10.3390/rs15133261
Submission received: 21 April 2023 / Revised: 25 May 2023 / Accepted: 8 June 2023 / Published: 25 June 2023

Abstract

:
The height (zi) of the Atmospheric Boundary Layer (ABL) is a fundamental parameter for several areas of knowledge, especially for weather and climate forecasting, pollutant dispersion and air quality. In this work, we used data from a remote sensing instrument (ceilometer), located at the experimental site of the Amazon Tall Tower Observatory (ATTO) in the Central Amazonia rainforest, in order to obtain the height of the ABL. Data used were obtained from 2014 to 2020, with the exception of the year 2017. The results showed that the zi average varies from year to year (interannual variability) and the average of the maximum zi values (zi_max) was approximately 1400 ± 277 m, occurring at 15:00 local time. In addition, it was found that these maximum heights are higher in the dry season and during El Niño years (about 1741 ± 242 m) and they are lower during the wet period and in La Niña years (1263 ± 229 m). Taking into account all the years investigated, the month with the highest zi_max value is September (1710 ± 253 m), and the month with the lowest value is May (1108 ± 152 m). Finally, it was observed that the growth rate of the ABL during the early hours after sunrise varies from month to month (intraseasonal variability), reaching its maximum values in September and October (about 210 ± 53 m h 1 and 217 ± 59 m h 1 , respectively) and minimum values in April and July (approximately 159 ± 48 m h 1 and 159 ± 50 m h 1 , respectively). It is concluded that the values of zi in Central Amazonia are influenced by several seasonal factors (temperature, cloud cover, turbulent heat flux, etc.) which gives it a wide variability in terms of heights and growth rates. Additionally, a linear regression was proposed in order to model the maximum zi value as a function of its growth rate from 08:00 LT (Local Time) up to 10:00 LT. The results showed a good correlation compared with the experimental values.

1. Introduction

The Atmospheric Boundary Layer (ABL) is the lowest portion of the atmosphere, and it is in contact with the Earth’s surface, being influenced by its conditions [1]. Additionally, the ABL’s height (zi) is variable in time and space, due to the influence of the surface in the lower atmosphere through the partition of energy [2]. The ABL’s daily cycle acts in response to surface heating from incident solar radiation; thus, there is a convective phase during the day, named the Convective Boundary Layer (CBL), and another stable phase at night, called the Nocturnal Boundary Layer (NBL), which is formed in response to surface cooling. During this daily cycle, the ABL presents variations in the vertical profiles of temperature, moisture, wind speed and other variables, due to atmospheric turbulence and convective processes. This takes place in a three-dimensional and chaotic way, in vertical scales from millimeters to the depth of the ABL, between 1 and 2 km [3]. Furthermore, zi is also influenced by topography, meteorological conditions and changes in type and amount of vegetation cover through the energy partition at the surface.
The variable zi is an important parameter in micrometeorology, because the processes of energy, momentum and matter exchanges between the surface and the Earth’s atmosphere are influenced by it. In addition, zi is directly associated with the size of the most energetic vortices present in the local flow [4], that is, zi is a scaling parameter that directly contributes to the understanding of vertical transport between the surface and the atmosphere. The most energetic vortices correspond to the thickness of the ABL and, consequently, to the vertical mixing capacity of pollutants and other quantities [5,6].
The estimation of zi can be performed using experimental measurements [7,8,9,10], satellite measurements [11], or reanalysis data, such as ERA5 [12,13]. Experimentally, zi can be estimated using in situ data (radiosondes) or remote sensing instruments such as doppler LIDAR, SODAR and ceilometer [14]. For example, in the past measurements of zi were usually obtained during field campaigns, i.e., over a short period of time and in a specific location. However, recently, the scientific community has more frequently used remote sensing instruments, such as the ceilometer, to obtain new results [14,15,16,17,18]. These instruments have the advantage of performing high frequency measurements over long periods, providing a more realistic pattern of the ABL, as the use of radiosonde is very expensive for long periods of data collection.
In the Amazon region, previous work [12,14,19,20] described the time evolution of the ABL. These studies were carried out for short periods of time (similar to [19,20]) using radiosondes. Recently, Dias-Junior et al. [12] compared zi values obtained via ERA5 with experimental data made via radiosonde, ceilometer and SODAR. They observed that ERA5 overestimates or underestimates the ABL height for different regions of Amazonia, and thus, proposed a correction to ERA5 in order to better represent the diurnal cycle of zi in central Amazonia. Carneiro and Fisch [14] used 2 years of data (extracted from GoAmazon 2014/5 Project) using different instruments (radiosondes, ceilometer, remote sensing instruments) and showed that significant differences (interannual scale) exist in the boundary layer heights. They found that the maximum height of the ABL was 1180 m in the wet season and 1590 m for the dry season, and that the remote sensing instruments were consistent with the in situ measurements. The work of Carneiro and Fisch [14] was carried out over an area which has a mixed type of vegetation (63% tropical forest, 17% pastures and 20% water).
In this work, a longer period (6 years) of measurements (ceilometer) were analyzed in an area which is mostly covered (more than 95%) by pristine tropical forest in the ATTO (Amazon Tall Tower Observatory) site [21,22]. In addition, the high temporal time resolution (1 observation each 16 s) allowed us to estimate in detail the variability of the ABL height.
From these datasets, we implemented a long-term study aiming to analyze the variability of the daily cycle, annual cycle, growth rates at early morning (dzi/dt), maximum daily values (zi_max) and seasonality of zi (dry season vs. wet season) in Central Amazonia. It is known that the value of the zi_max is an important parameter for different research fields, for example, micrometeorology, atmospheric chemistry, and for performing simulations of pollutant dispersion. However, the zi_max value is not always available, because instruments that perform this measurement (radiosonde, ceilometer, etc.) would be required. In addition, in this work we show that there is a direct relationship between dzi/dt and zi_max. The dzi/dt can be determined by micrometeorology tall towers (for example, the ATTO site), through the profile of heat and momentum turbulent fluxes [1,23]. Therefore, with towers, it would be possible to estimate zi_max. So, this parameter can be linked to the air above (meteorological/physical aspects) with the chemical species within the vegetation.

2. Methodology

2.1. Experimental Site

We used data from the ATTO experimental site (www.attoproject.org, accessed on 20 April 2023), located in central Amazonia (Figure 1b,c), in a region of primary tropical forest (02 08 44.69 S, 59 00 17.44 W, 140 m asl) approximately 150 km northeast of the city of Manaus, in the Uatumã Sustainable Development Reserve [21,22]. In the Amazon, the climate is directly linked to the rainfall regimes, presenting a wet season (February to May) and a dry season (August to October). This distribution of rainfall and amount of moisture play a very important role in the partition of energy between latent and sensible heat fluxes that modulates the atmospheric convection [24].

2.2. Data

The zi values were monitored using a model CHM15k ceilometer (Lufft, Fellbach, Germany) installed at the ATTO experimental site (Figure 1a). Backscatter profile data were collected from 2014 to 2020, with the exception of the year 2017 when the ceilometer was not operational (Table 1). With the backscatter profiles, it was possible to obtain the height of the ABL every 5 min, totalling 288 zi values daily. Some collected days were not used in the analyses because the ABL cycle showed non-standard behavior, for example, zi maxima (zi_max) above 3 km [12] and days with high percentages of missing data, for example 2016 with 56.25% (Table 1).
Ceilometers use LIDAR-type remote sensing techniques in the near-infrared wavelength (between 900 and 1100 nm). LIDAR measurements depend on aerosol concentrations in the atmosphere, which, in turn, backscatter the LIDAR emissions. The intensity of the backscattering depends mainly on the concentrations of particles in the air, but also on their reflection properties, which are related, for example, to moisture content. Therefore, the ceilometer is also useful for the three-dimensional mapping of aerosols for remote sensing of pollutants in the atmosphere, and industrial and natural emissions. In the ABL, the aerosol concentration is high compared with that of the free atmosphere above. This contrast is the basis for detecting zi measured by LIDAR [25]. This instrument has advantages over the radiosonde, because it performs measurements at “high frequency on temporal scale” for a long period. However, it has the disadvantage of a high financial cost and can sometimes present ambiguous results [26].
In addition to zi, ceilometers can also measure the height of the cloud base, from the recovery of the particle backscattering coefficient. The amount of backscattered light is detected at a high temporal resolution (16 s), with a vertical resolution of 15 m, maximum height of approximately 10 km and maximum sensitivity of 100 m [27,28]. The ceilometer is a powerful instrument for tracking zi during its entire cycle (diurnal and nocturnal). The uncertainty derived from the ceilometer was estimated to be in the range of 100 m (for the humid regions) and 200 m (for dry areas) [14,26].

2.3. Methods

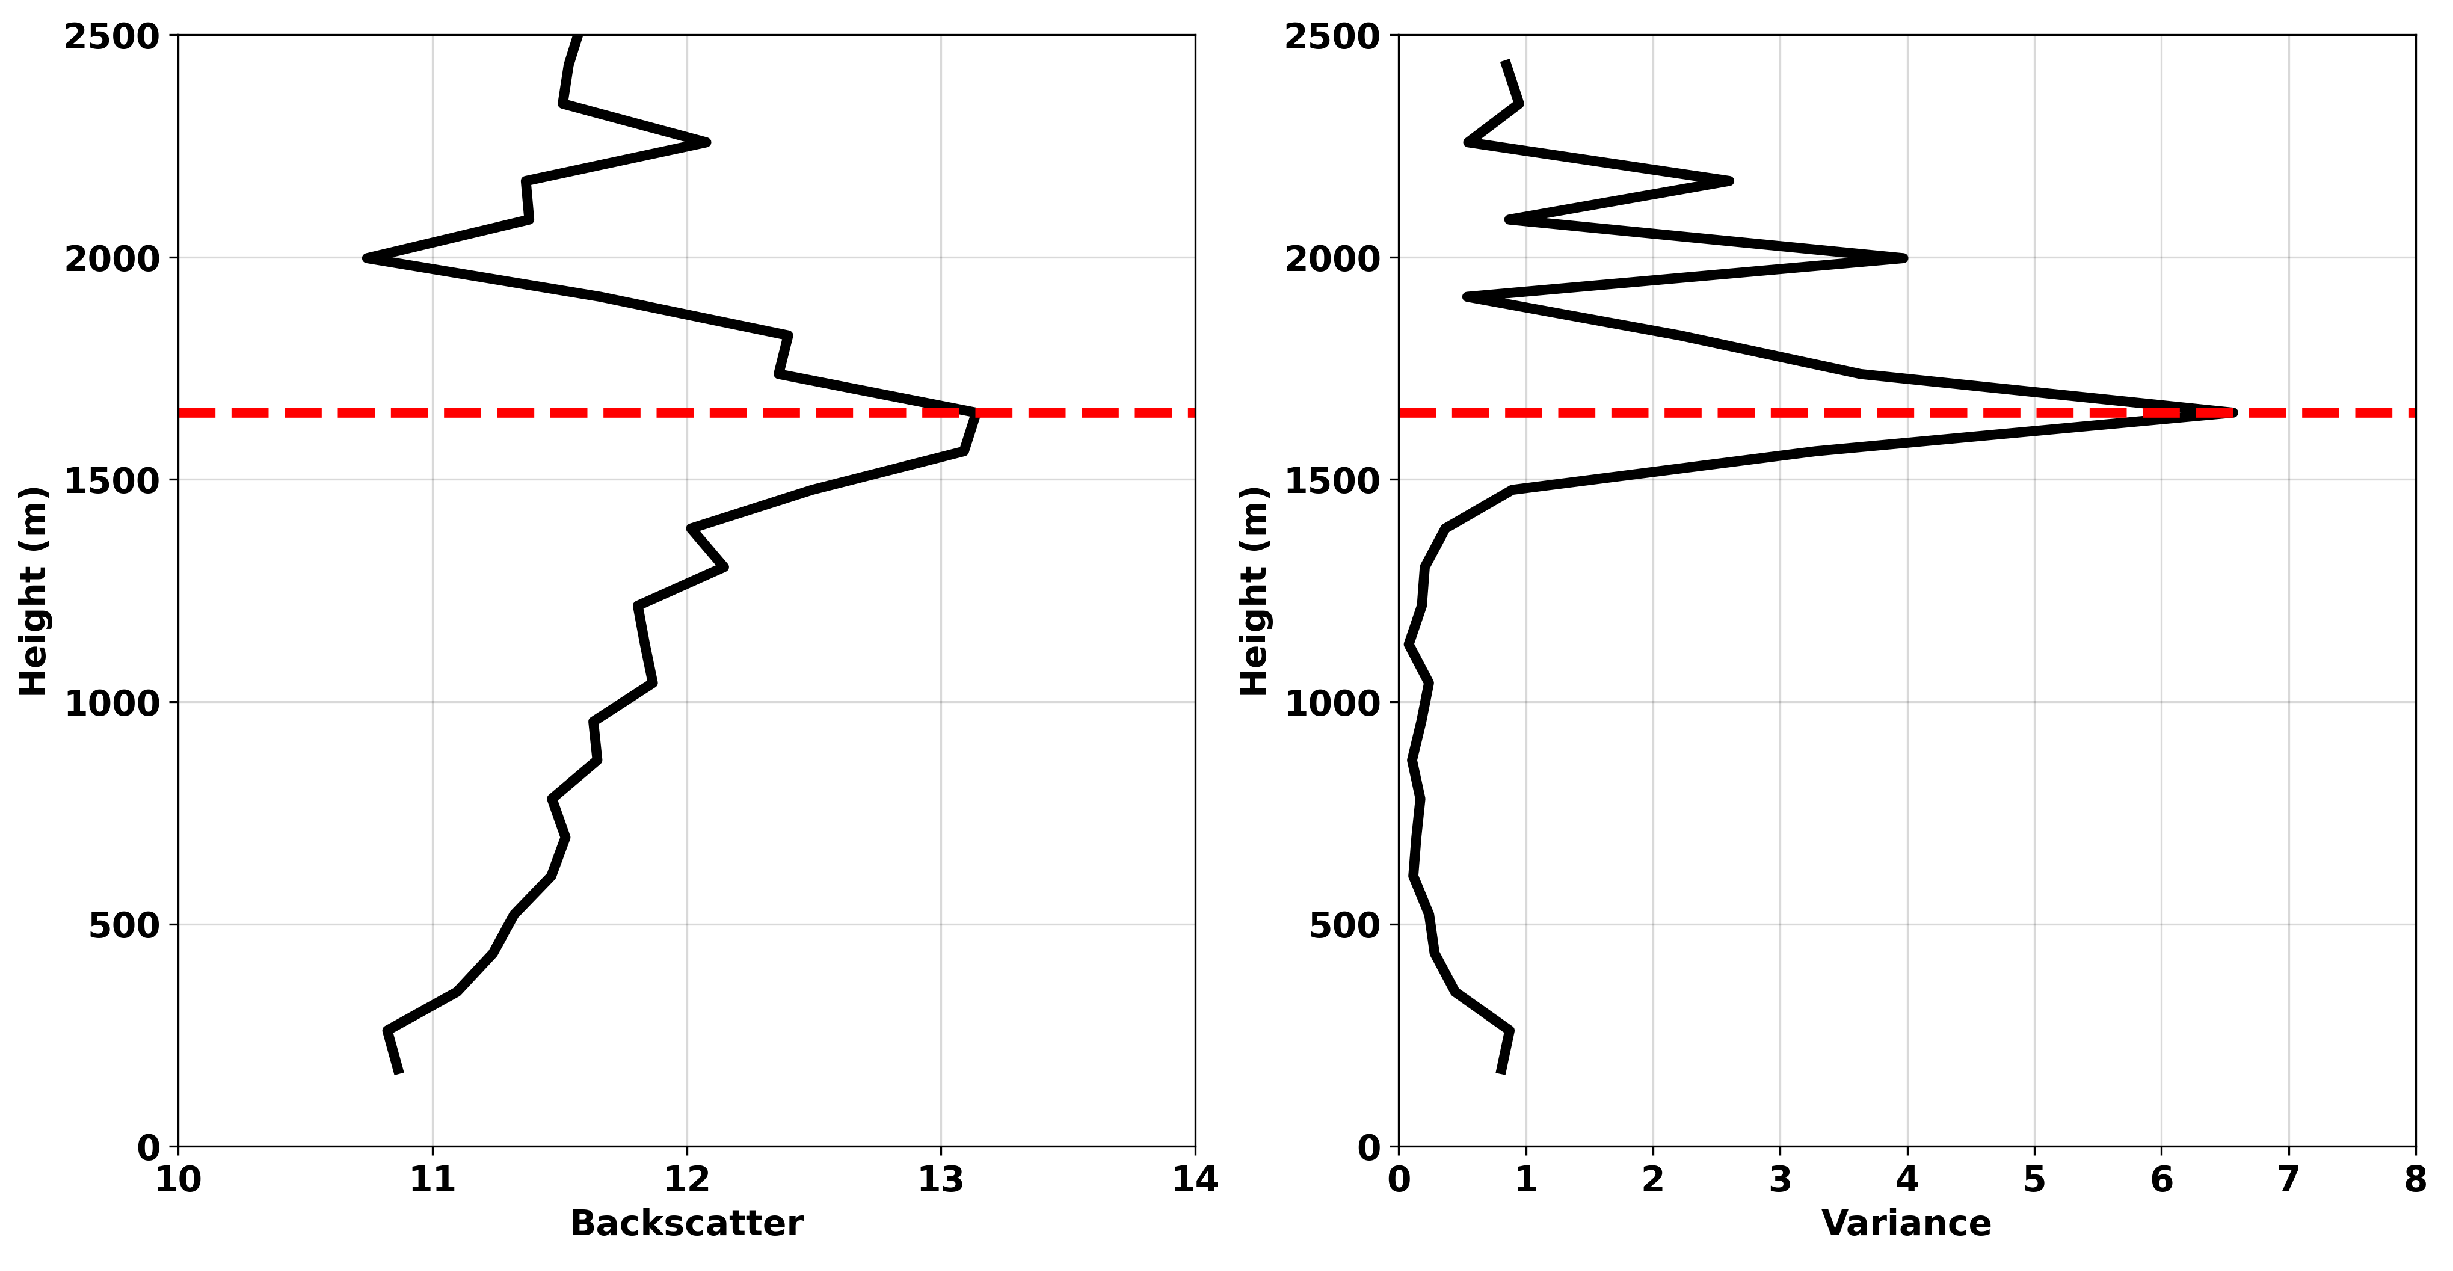
Initially, zi values were estimated using vertical backscatter (BS) profiles, similar to the process performed by Caicedo et al. [29]. The BS profiles were collected every 16 s and, due to low signal-to-noise ratio and noise-generated artifacts, 5 min time averages were applied to the vertical BS profiles. The estimation of zi took place through a semi-automatic algorithm developed using the same methodology described by Caicedo et al. [29] in order to analyze the variance of the vertical BS profile from surface to 2500 m height. The variance V, as a function of height z, was then calculated from each 5 min average BS profile using the following formula: V ( z ) = [ R ( z ) m R ] 2 where R ( z ) is BS signal at height z, and m R is the vertical averaged profile from the nearest surface height (15 m) to 2500 m height. The zi value was identified as the height of maximum variance in each profile (Figure 2). In addition, the times when precipitation occurred were also identified in the daily visual profiles, and then the zi data during these events were disregarded.
After identifying the zi values, we removed outlier values that were outside a range considered appropriate for the Amazon region (i.e., heights higher than 2.5 km during daytime) [30]. It is worth stating that the NBL heights can be overestimated, as the instrument can mistake the residual layer for the top of the ABL [14]. Those values were also disregarded.
The next step was to estimate the ABL growth rate in the early morning (Tx). This calculation was performed with the data collected between 08:00 and 10:00 LT. This interval was selected because it is observed that there is an approximately linear growth during this ABL phase (see Figure 3), after the NBL is completely eroded [30]. In the next step, we performed a visual inspection of all the daily cycles of the ABL height. We removed from our analyses all days where the zi values did not show steady growth in the period from 08:00 to 10:00 LT. The presence of shallow clouds, fog, or high aerosol concentrations may be some of the explanations for the non-steady ABL growth in the early morning hours. Thus, the growth rate was calculated as:
T x = d z i d t ( m h 1 )

3. Results and Discussion

3.1. Average ABL Daily Cycle

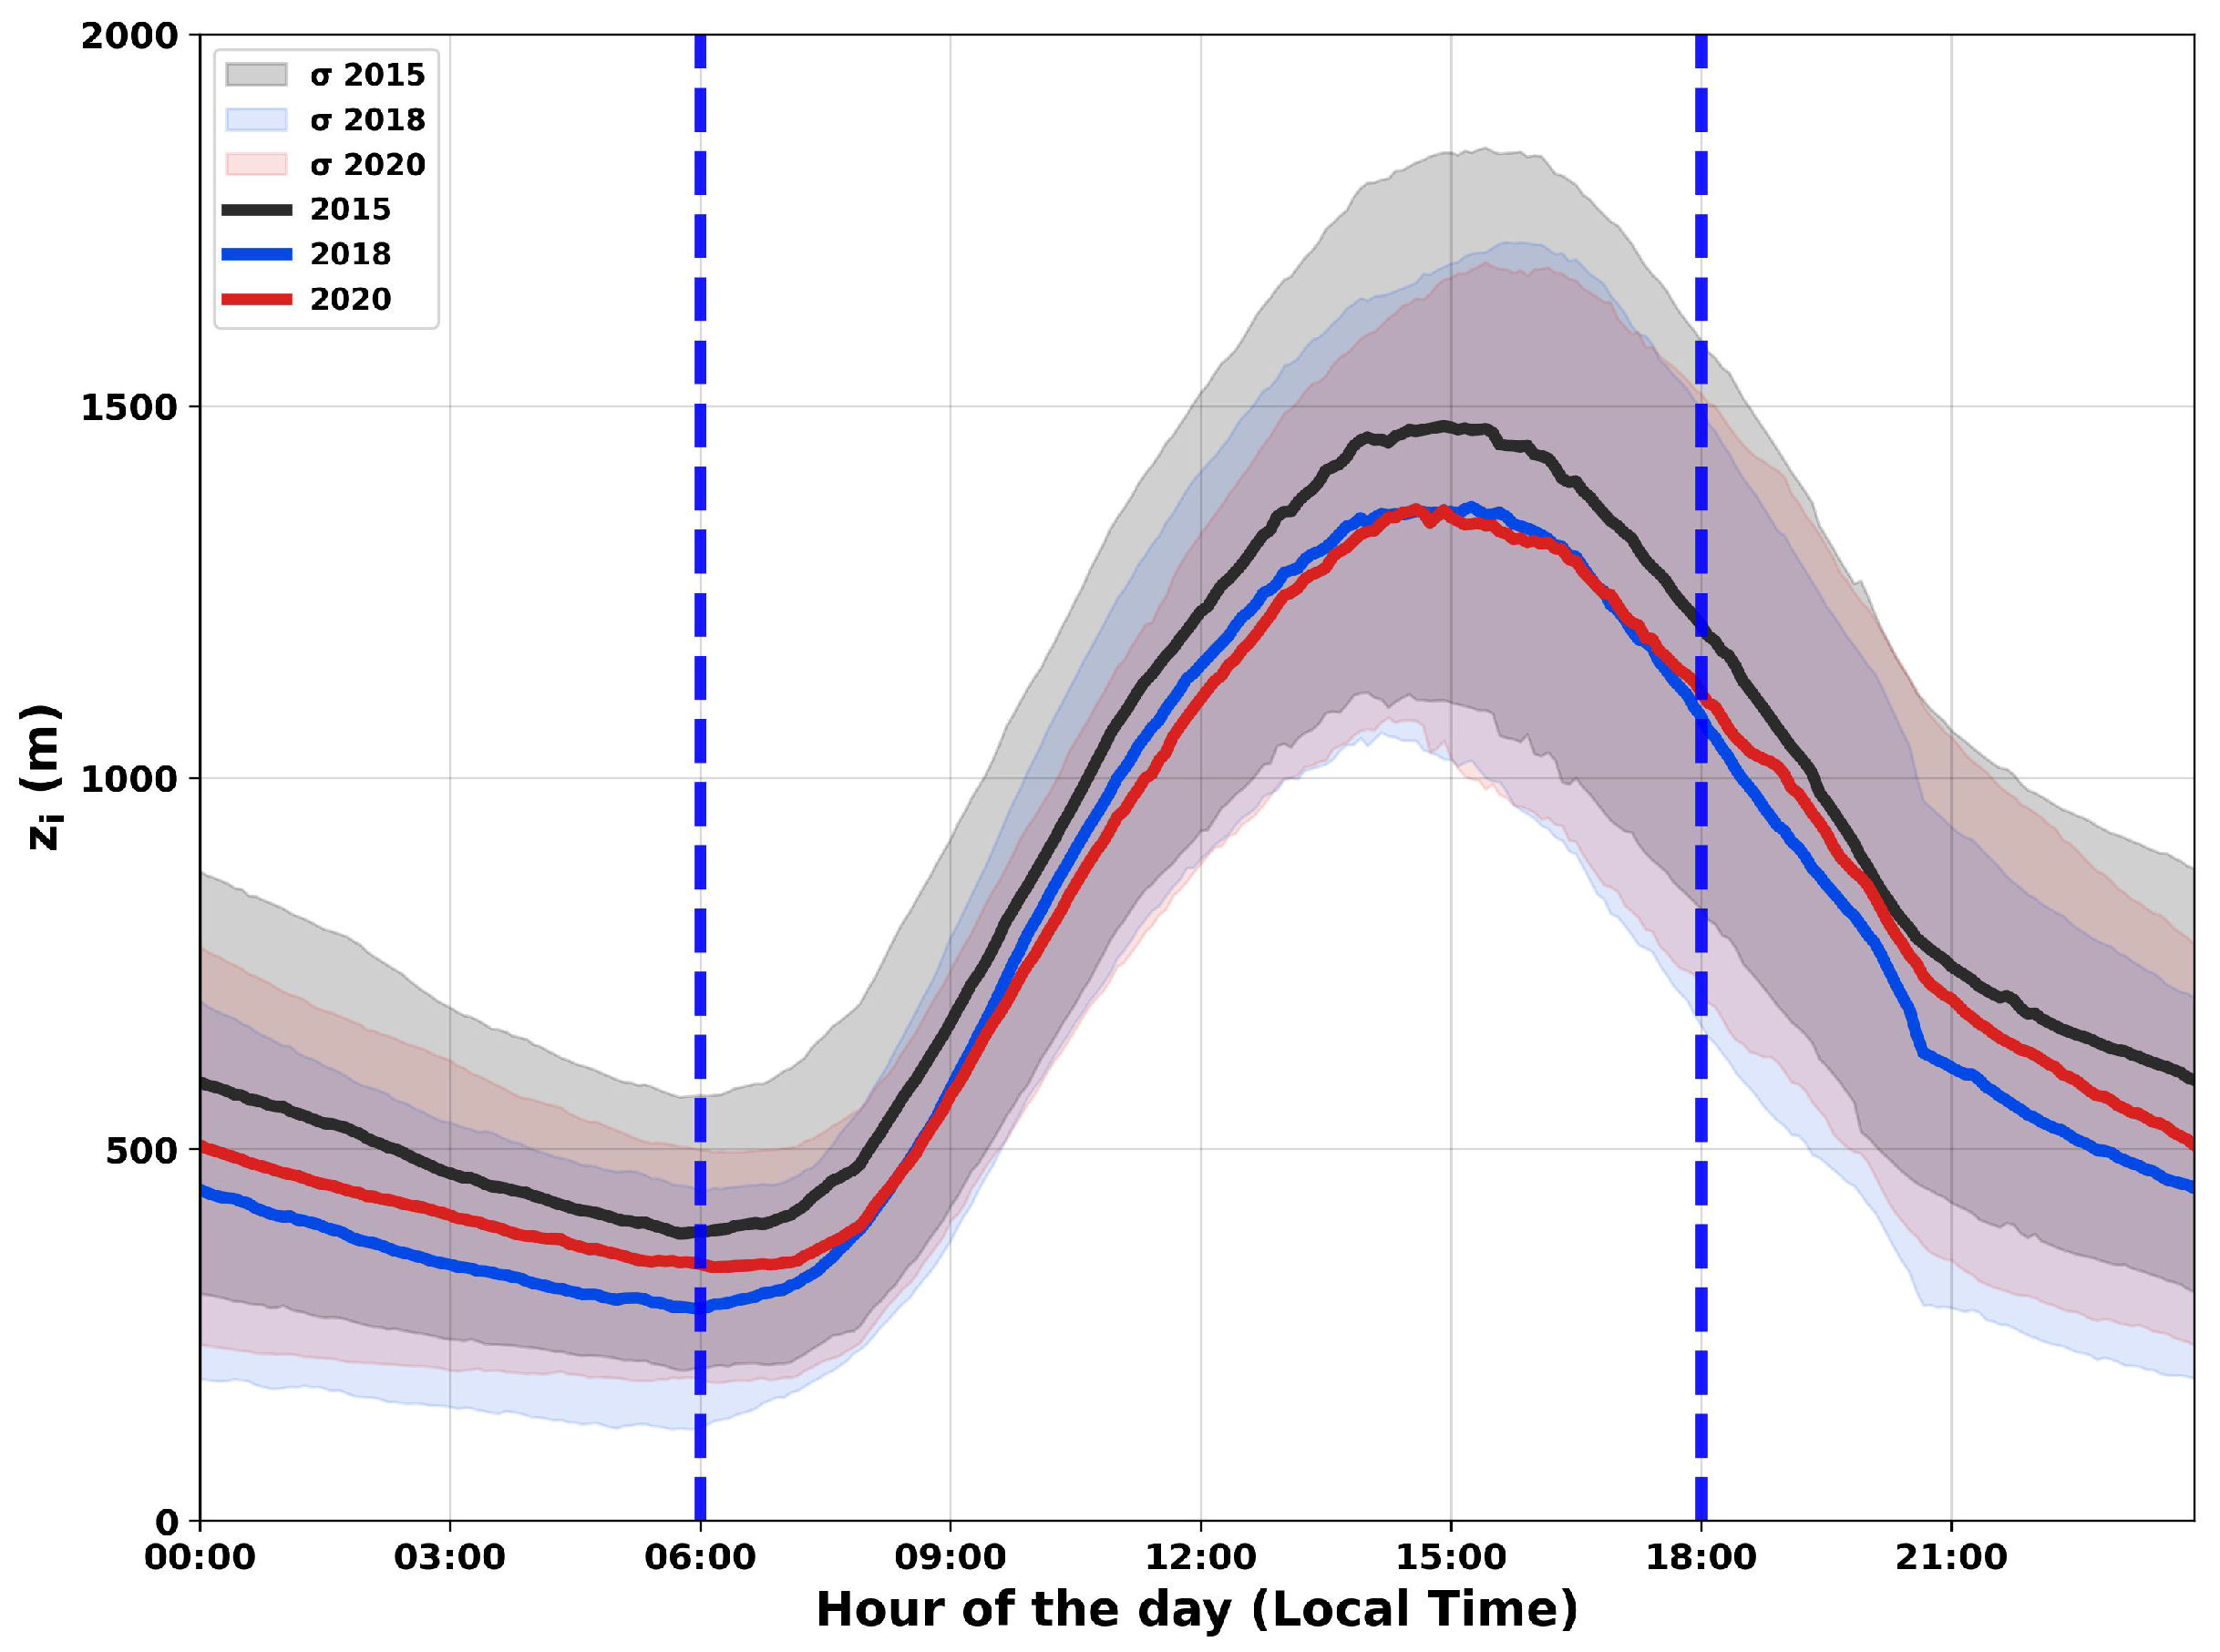
Figure 4 shows the average daily cycle of the ABL for a dataset constructed with the years 2015, 2018, and 2020, as they have more than 70% of data available. The years 2014, 2016, and 2019 were not used in this analysis because they did not have data in both seasons (see Table 1). It can be seen that during night time (from 18:00 to approximately 06:00 LT of the following day) there is a decrease in zi. This behavior is expected, because in this period nocturnal conditions predominate, i.e., a stable boundary layer, in which the intensity of turbulence decreases. This phase begins with the inversion of sensible heat flux near sunset, approximately 30 min prior to sunset for Amazonian conditions [14]. Additionally, in Figure 4, from 07:00 LT until approximately 16:00 LT, a sharp growth in ABL is observed. The maximum height of the ABL (mean value of zi_max is around 1400 ± 227 m) occurs around 15:00 LT. This growth begins just after dawn, due to the warming of the ground and the erosion of the NBL, and consequently the intensification of the sensible heat flux from the ground to the atmosphere, which leads to the growth of the ABL [30]. Between 14:00 and 16:00 LT (late afternoon times), the growth rate of the ABL is almost absent, and the zi is stationary.
There are also differences (associated with both depth and its variability) between the ABL heights during the observed years. For example, in the year 2015 (black line), the zi mean heights are higher compared to the years 2018 and 2020. This fact should be associated with the El Niño effect that occurred in 2015 [31,32], whose main effect in Amazonia is to reduce the amount of clouds and consequently rainfall in the region, causing the intensification of sensible heat flux at the surface [33]. During the El Niño period, there is an inhibition of cloud formation and rainfall in the region. The result is a higher incidence of solar radiation at the surface, and consequently, a deeper ABL [12].
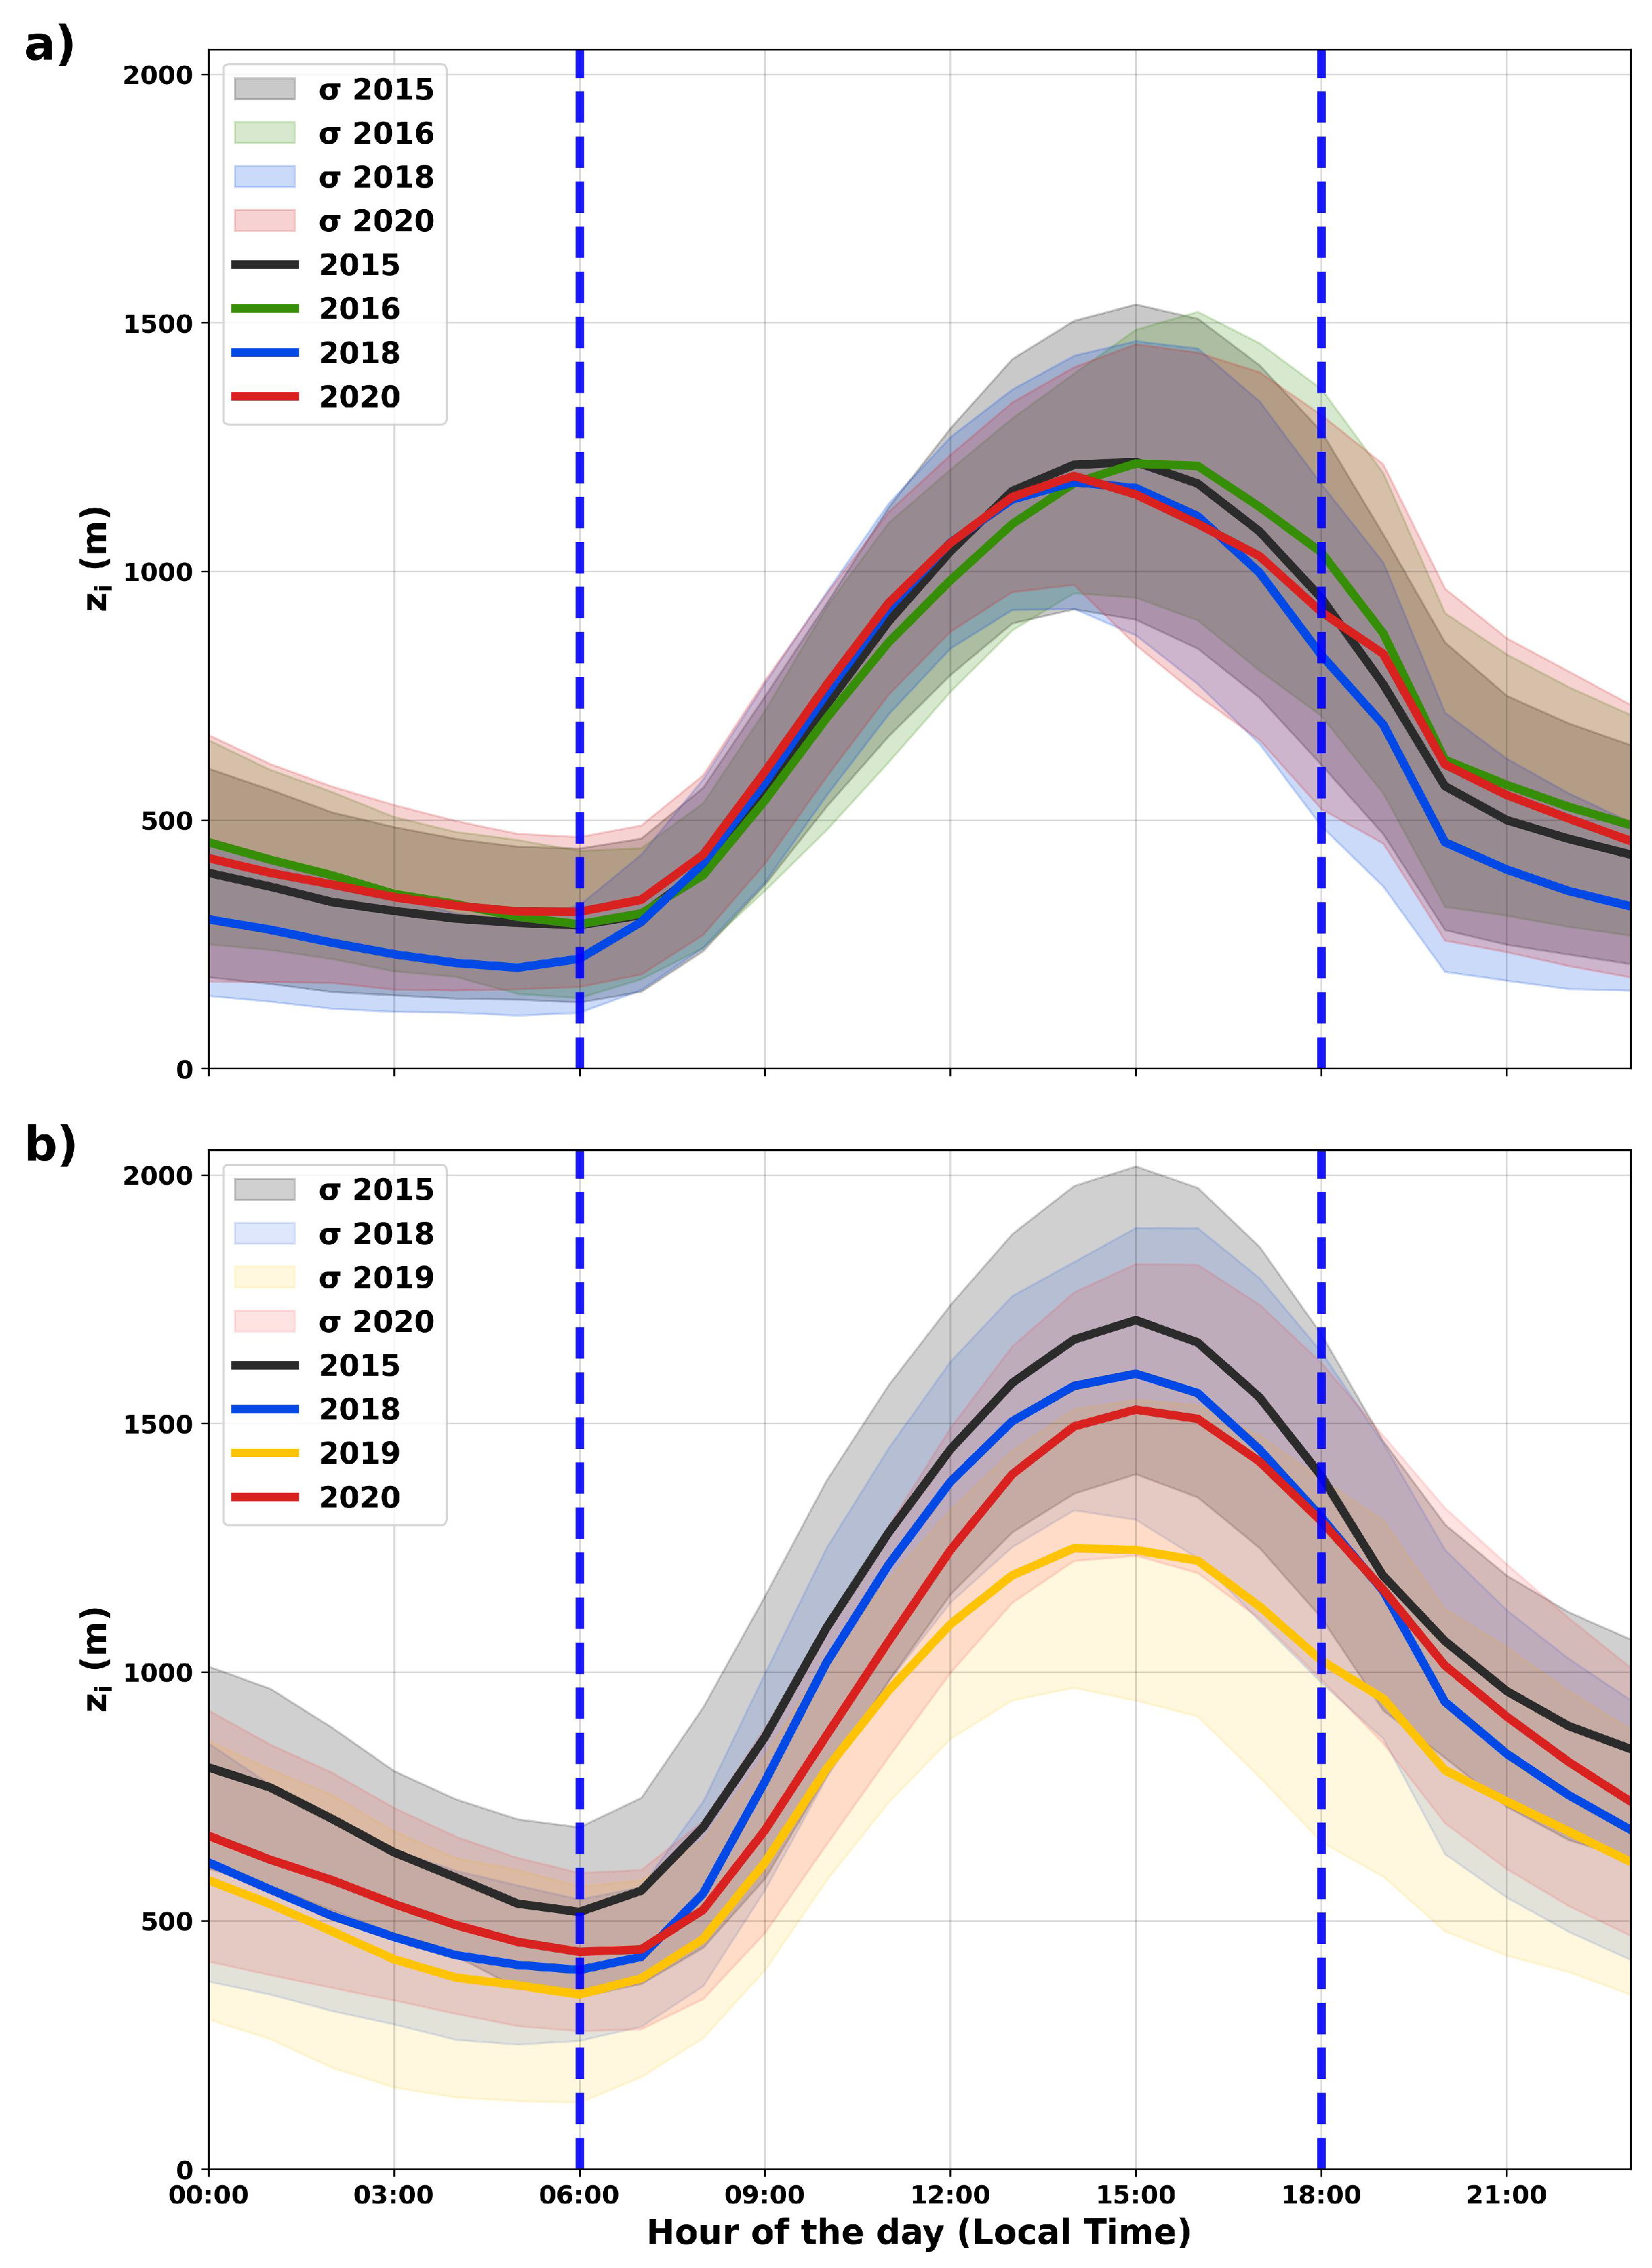
Figure 5 shows the average daily cycles of zi for the wet (Figure 5a) and dry periods (Figure 5b). This dataset is different from Figure 4, as it may include additional data collected during wet or dry periods (Table 1). It can be observed that, during the wet season, there is practically no difference between the values of zi_max between the El Niño and La Niña years (approximately 1280 ± 240 m). For the dry period, the zi_max values were around 1741 ± 242 m for the El Niño year, while in the La Niña year this value was 1580 ± 275 m. Notice that the values measured during the dry season were greater than the values during the wet season, which corroborates with Carneiro and Fisch [14] for another experimental site in central Amazonia.
It is well known that in the Amazon’s wet season, the humidity is higher than in the dry season, as well as the cloud cover present in the atmosphere. These factors reduce the direct incidence of solar radiation on the surface, contributing to the reduction of heat flux and, consequently, a lower height of the ABL. However, in the dry period the process is reversed, i.e., the lower presence of clouds in the atmosphere favors higher solar incidence and consequently results in an increase in the height of the ABL [14]. Moreover, according to Carneiro et al. [30], in the dry season, the sensible heat flux becomes positive earlier (1 h) than in the wet season, and the minimum height of the ABL during night time is higher than in the wet period. Therefore, it is believed that these factors lead to the generation of larger, stronger and more energetic eddies that will be associated with higher zi values in the dry season.

3.2. Monthly ABL Maximum Heights and Growth Rates

Figure 6 shows the box plots of the maximum heights (Figure 6a) and growth rates (Equation (1)) (Figure 6b) of the ABL from the years 2014 to 2020, respectively. It can be seen that the zi_max values occur in September (approximately 1710 ± 253 m). In addition, it is also observed that the month of May presents the lowest height (approximately 1108 ± 152 m). It is possible to observe that the growth rate (Figure 6b) reaches the highest average values in September and October (about 210 ± 53 m h 1 and 217 ± 59 m h 1 , respectively). The lowest ABL growth rates occur in April (159 ± 48 m h 1 ) and July (159 ± 50 m h 1 ). Those months correspond to the peaks of the dry and wet seasons. Carneiro et al. [30] also showed that the maximum temperature for the region of Manaus (a distance of 150 km from the ATTO site) occurs in September and the minimum in April; this shows a good correlation for solar radiation, air temperature, sensible heat fluxes, clouds, rain and ABL heights. These results strengthen the relationship between the maximum temperature achieved, probably associated with the strong sensible heat flux and consequently with the convective plumes, and the maximum height and growth rates of the ABL. It is believed that the reverse is also true for the wet season, with lower temperatures, less thermal convection, etc.
Figure 7 shows the values of the maximum height of the ABL (zi_max) as a function of the ABL growth rate, obtained using Equation (1). As already mentioned, the years 2015, 2018, and 2020 were selected for these annual analyses because they present data for the whole year (Table 1). It can be seen that there is a direct relationship between the growth rate and maximum height of the ABL. In 2015, there was a considerable dispersion of maximum zi values around 2000 m. It is important to consider that this year had a strong El Niño event, which contributed to higher ABL heights, which may be responsible for the larger variability as observed in Figure 4. The two extremes observed were the 2015 and 2020 linear regression adjustments. Note that 2015 presents the lowest intercept coefficient (733 m), and the highest slope coefficient of 4.19 h (Equation (2) and Table 2). For these situations (El Niño), the ABL starts its growth stage with a smaller height; however, it presents a high growth rate, which results in greater heights compared with other years. In 2020, the opposite behavior occurs; the fitting line presents the highest intercept coefficient (925 m) and the lowest slope (2.75 h) (Equation (4) and Table 2). This may be associated with the La Niña phenomenon that occurred in this year. It is known that in La Niña years, the Amazon region is covered by a greater amount of clouds and rain, resulting in a lower incidence of solar radiation on the surface, which could lead to the later onset of the positive heat flux [14], and consequently lower zi values. In the year 2018, a neutral year, the value of the intercept coefficient was 886 m and the slope was 2.77 h (Equation (3) and Table 2). The dashed gray line (Equation (5)) corresponds to the linear regression for the three years together (2015, 2018 and 2020). In summary, the equations derived (2)–(5) are presented below.
z i _ m a x ( m ) = 4.19 d z i d t + 733
z i _ m a x ( m ) = 2.77 d z i d t + 886
z i _ m a x ( m ) = 2.75 d z i d t + 925
z i _ m a x ( m ) = 3.09 d z i d t + 1078
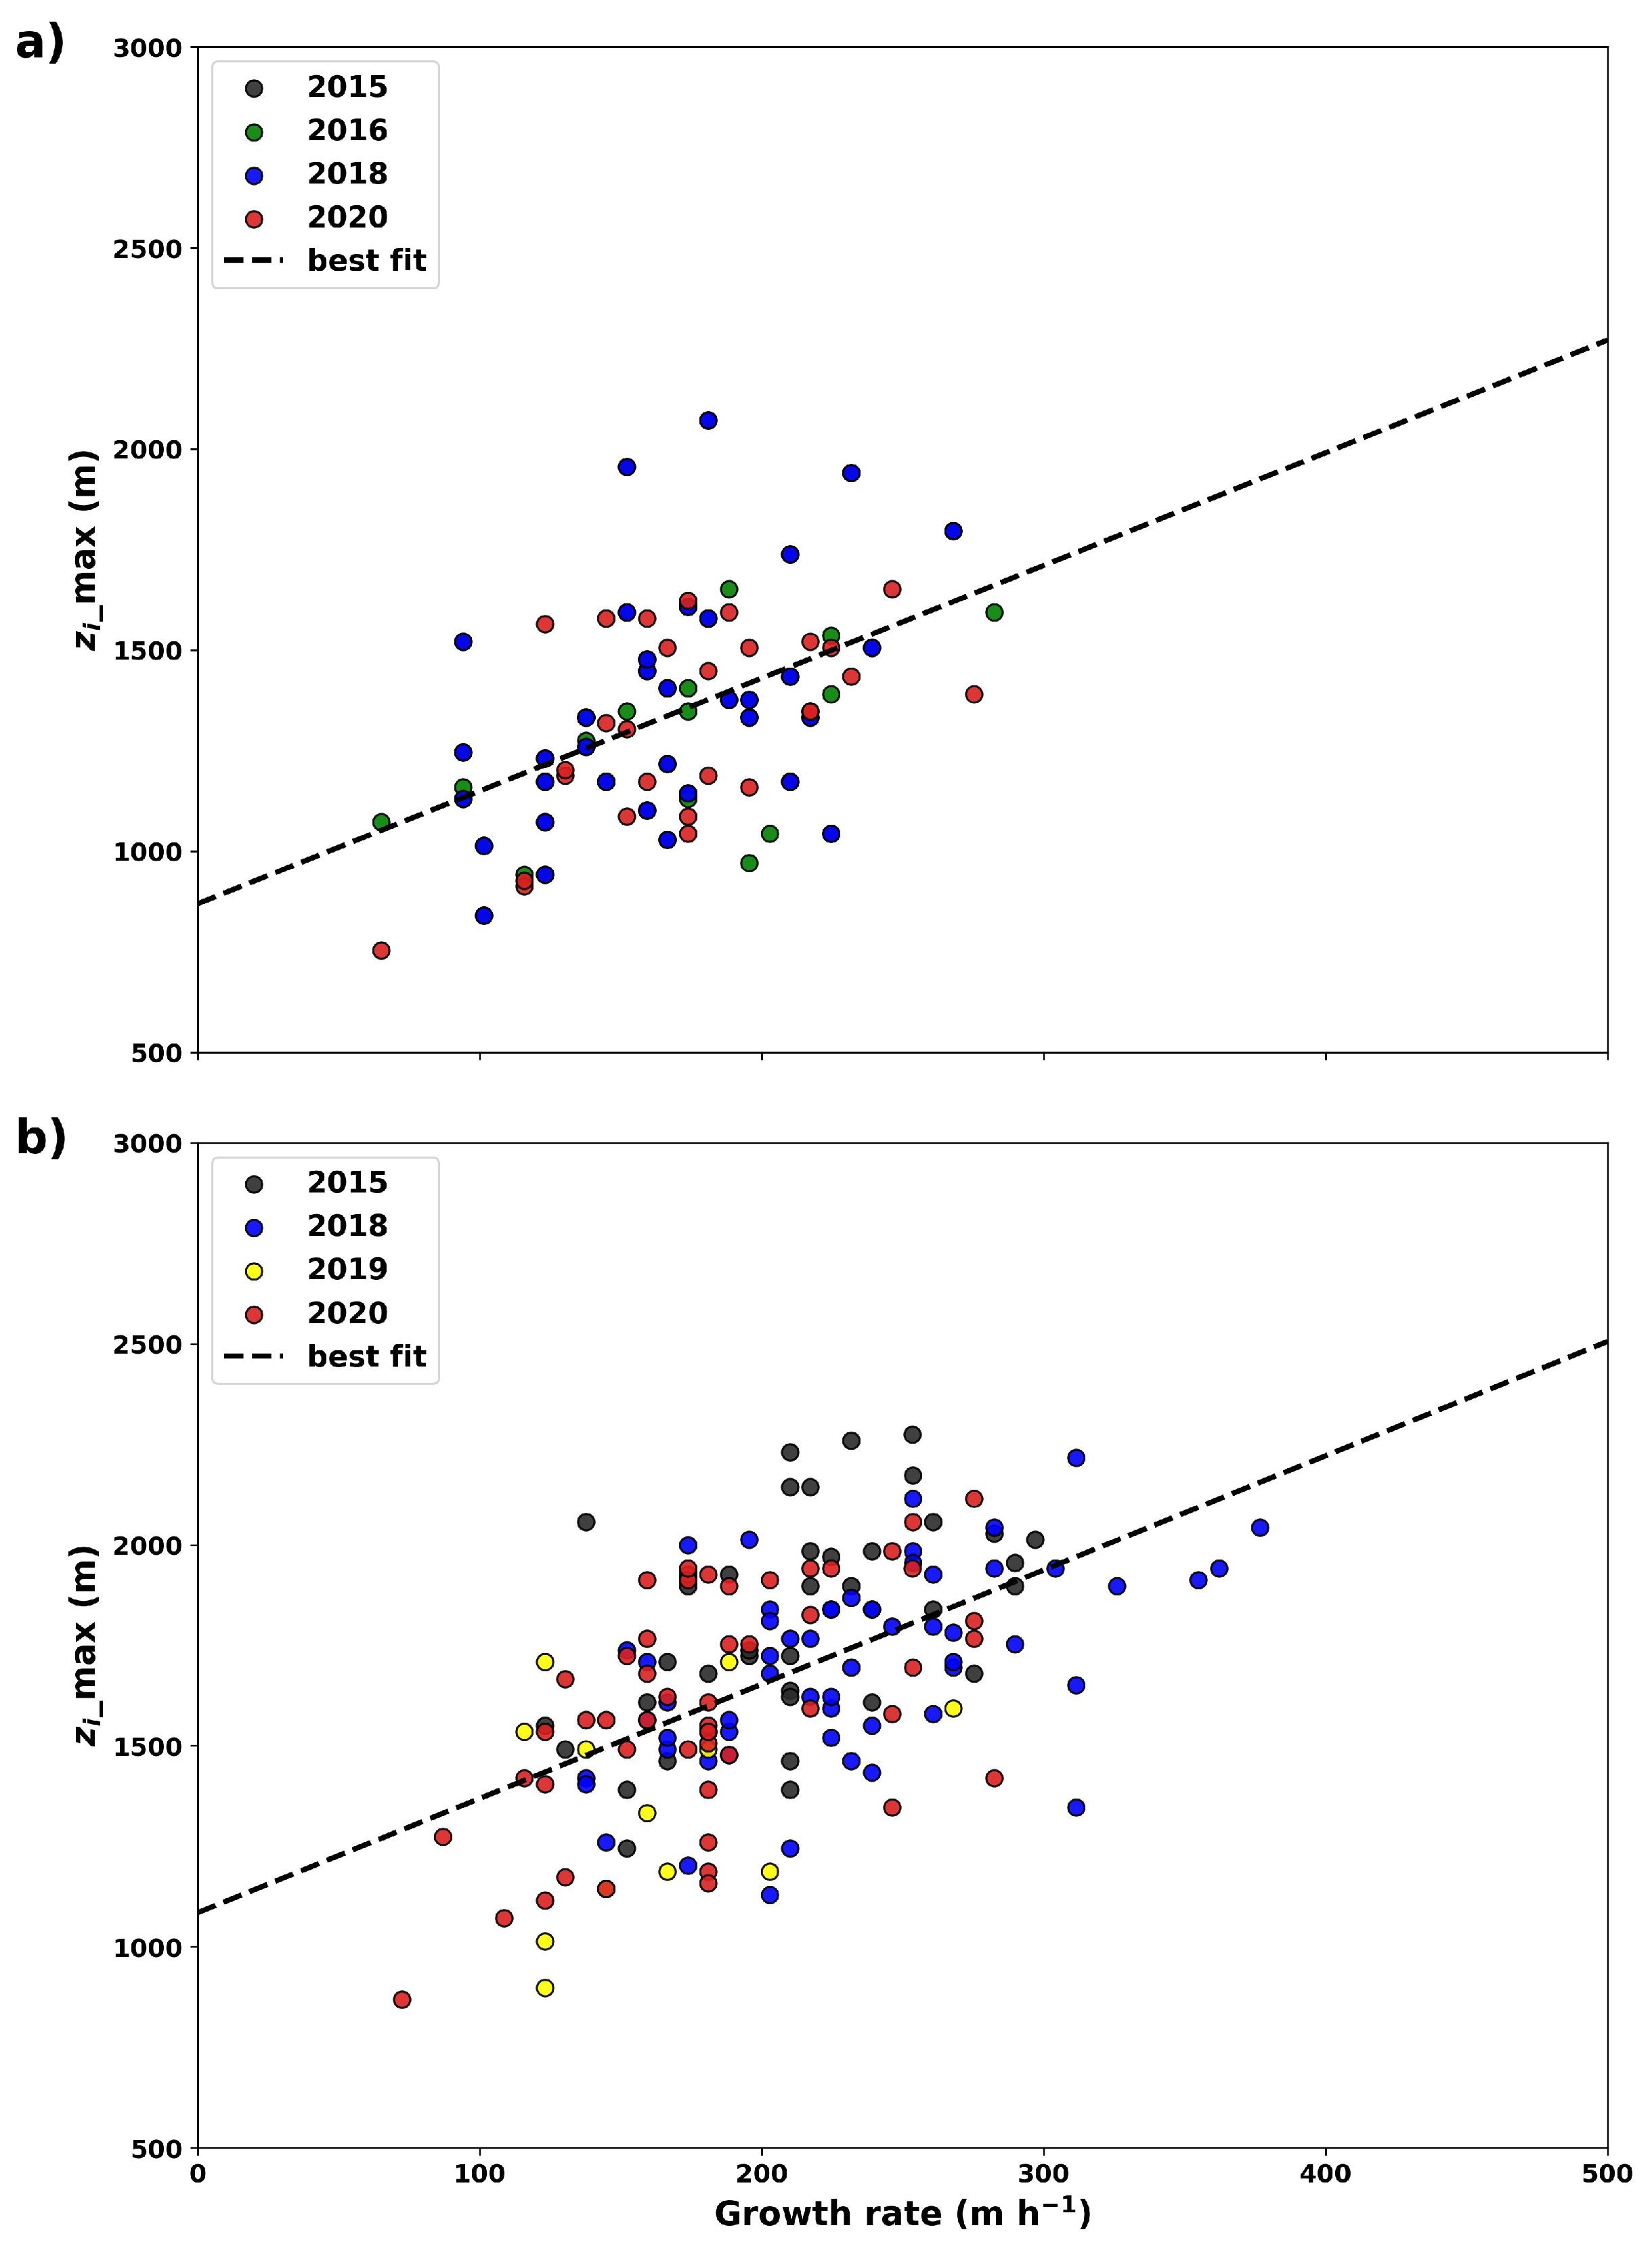
Figure 8a,b are similar to Figure 7 but also show the relationship between maximum height and growth rate of the ABL for the wet and dry seasons, respectively. The seasonal dataset used has more data than the previous one used for annual analysis (Table 2). As already mentioned, ABL has greater heights in the dry season compared to the wet season (Figure 5a,b). In Figure 8b, the best fit lines have higher coefficients, both intercept and slope (1085 and 2.84), compared with the lines in Figure 8a (869 and 2.65). It is interesting to note that the points for 2015 have a steeper slope in the dry season, which indicates a high growth rate. This may be associated with the El Niño phenomenon that occurred in this year, producing a very strong dry season.
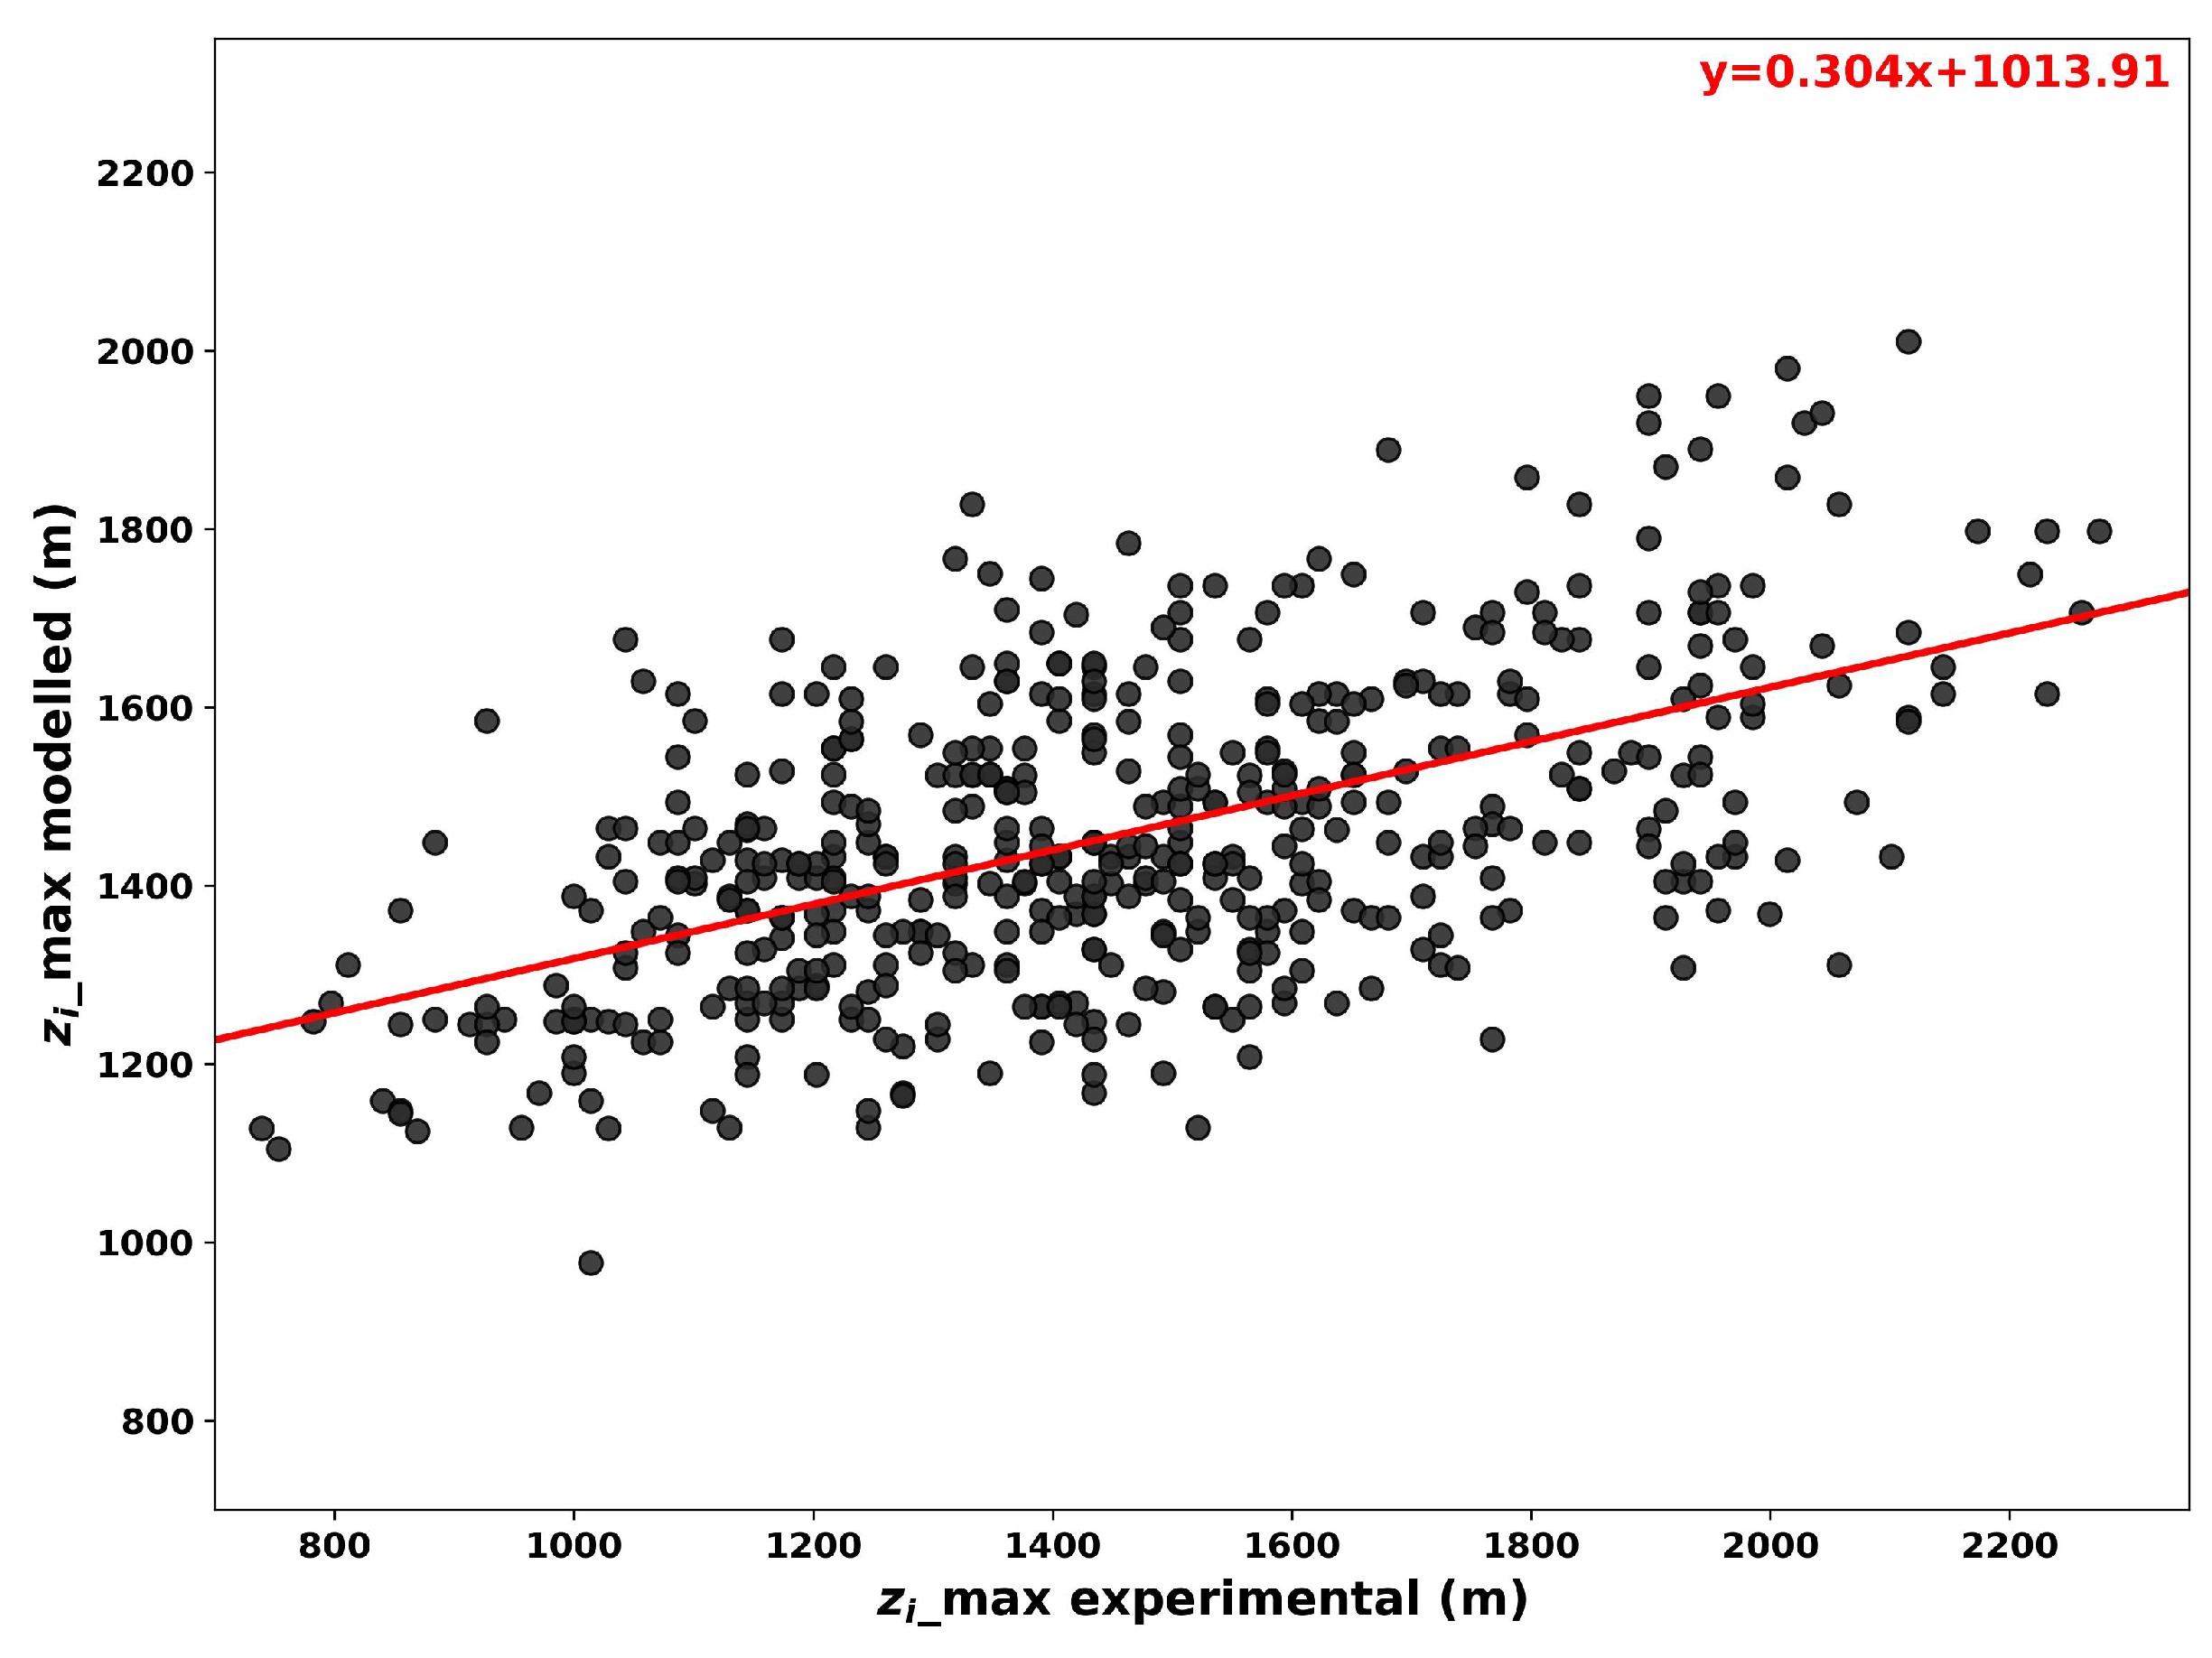
From Equation (5), the ABL height could be estimated obtaining a modelled zi_max. Figure 9 shows the relationship between the zi_max values obtained from the model versus the zi_max values obtained experimentally. It is possible to see that experimental zi_max values varied around 750 to 2250 m above the ATTO site for the period investigated. The correlation coefficient between modelled zi_max and experimental zi_max was r = 0.56, and the linear regression equation is Y = 0.3X + 1014. There is a good relationship between dzi/dt (which gave rise to the modelled zi_max (Equation (5)) and experimental zi_max, corroborating the information that in the absence of sensors that measure zi, such as radiosondes or ceilometers, it is possible to obtain zi_max through the growth rate of the ABL received from micrometeorological towers. We believe that the relationship between modelled and experimental zi_max should improve if we add other variables to the model, such as sensible heat fluxes and surface temperature.

4. Conclusions

Six years of data from a ceilometer installed in central Amazonia (ATTO’s experimental site) were used in order to estimate the daily cycle of the heights of the ABL. This dataset is the longest time record of continuous measurements over tropical pristine forest. Based on the results found, it was noted that the height of the ABL presents seasonality associated with wet/dry periods, besides being directly influenced by phenomena such as El Niño and La Niña.
The results showed that the zi average varies from year to year, with its mean maximum depth of approximately 1400 ± 277 m occurring around 15:00 LT. In addition, it was found that these maximum heights are higher in the dry season and during the El Niño years (about 1741 ± 242 m), and are smaller during the wet period and in La Niña years (1263 ± 229 m). For the seasonal scale, the highest zi-value was found in September (1710 ± 253 m) and the lowest in May (1108 ± 152 m), which correspond to the peaks of the dry and wet seasons, respectively. Additionally, the growth rate of the ABL during the early hours after sunrise is at its maximum in September/October (210–217 ± 53–59 m h 1 ) and minimum in April/July (159 ± 50 m h 1 ). Thus, in the wet seasons, the ABL presents lower heights than in the dry seasons, and this is influenced by the growth rates. It is believed that factors such as (i) cloud cover, (ii) the higher or lower incidence of solar radiation, (iii) the minimum height of the ABL that occurs immediately before the growth process, and (iv) the beginning of the process of erosion of the NBL, formed during the night period, are important for the intensity of the growth rate of the maximum height of the ABL.
Finally, a simple model was proposed to estimate the maximum z i m a x using the growth rate of the ABL at early morning. This modelling approach shows a good agreement for experimental values in the ranges commonly observed for the dry and wet periods of the Amazon region. We believe that this result can help in estimates of the ABL heights for regions or experimental sites that do not have the classical instruments for obtaining the ABL heights directly. For example, Equations (2)–(5) suggest that, if we have the growth rate of the ABL at early morning, we could estimate zi. We believe that this is useful information for estimating the maximum height of the ABL. This is a motivating result because, with the actual instrumentation configuration at the ATTO tower with 20 sonic 3D anemometers installed up to 325 m, it is possible to measure the ABL growth rate in the early morning and thus predict the maximum height of the ABL. This work can contribute to more realistic parameterizations of ABL growth in different atmospheric chemistry models as well as regional and global models.

Author Contributions

Conceptualization, C.Q.D.-J.; Methodology, C.M.A.S., C.Q.D.-J. and G.F.; Software, C.M.A.S., C.Q.D.-J. and F.A.F.D.; Validation, C.Q.D.-J. and G.F.; Formal analysis, C.M.A.S., C.Q.D.-J., F.A.F.D., H.S.M., R.G.C., B.T.T.P. and G.F.; Investigation, C.M.A.S., C.Q.D.-J., F.A.F.D., H.S.M., R.G.C., B.T.T.P. and G.F.; Resources, C.Q.D.-J.; Data curation, G.F.; Writing—original draft, C.M.A.S., C.Q.D.-J., F.A.F.D. and H.S.M.; Writing—review & editing, C.Q.D.-J., R.G.C., B.T.T.P. and G.F.; Visualization, C.M.A.S., H.S.M., R.G.C. and G.F.; Supervision, C.Q.D.-J. All authors have read and agreed to the published version of the manuscript.

Funding

This research received no external funding.

Data Availability Statement

The datasets used in this work are available at the ATTO data portal (https://www.attodata.org/, accessed on 20 July 2022).

Acknowledgments

We thank the Instituto Nacional de Pesquisas da Amazônia (INPA) and the Max-Planck Society for continuous support. We acknowledge the support by the German Federal Ministry of Education and Research (BMBF contract 01LB1001A. 01LK1602A, and 01LK1602B) and the Brazilian Ministério da Ciência, Tecnologia e Inovação (MCTI/FINEP contract 01.11.01248.00) as well as the Amazon State University (UEA), FAPEAM, CAPES and SDS/CEUC/RDS-Uatumã. The authors sincerely thank Christopher Pöhlker and his team for the efforts in obtaining the ceilometer data collected at the ATTO site. The authors acknowledges the support from CNPq (Processes 307530/2022-1, 307048/2018-7, 440170/2022-2, 151920/2022-2).

Conflicts of Interest

The authors declare no conflict of interest.

References

  1. Stull, R.B. An Introduction to Boundary Layer Meteorology; Springer Science & Business Media: Berlin, Germany, 1988; Volume 13. [Google Scholar]
  2. Garratt, J. Extreme maximum land surface temperatures. J. Appl. Meteorol. Climatol. 1992, 31, 1096–1105. [Google Scholar] [CrossRef]
  3. Wang, B.; Abdalla, E.; Atrio-Barandela, F.; Pavon, D. Dark matter and dark energy interactions: Theoretical challenges, cosmological implications and observational signatures. Rep. Prog. Phys. 2016, 79, 096901. [Google Scholar] [CrossRef] [PubMed] [Green Version]
  4. Grass, A.; Stuart, R.; Mansour-Tehrani, M. Vortical structures and coherent motion in turbulent flow over smooth and rough boundaries. Philos. Trans. R. Soc. Lond. Ser. A Phys. Eng. Sci. 1991, 336, 35–65. [Google Scholar]
  5. Su, T.; Li, Z.; Kahn, R. Relationships between the planetary boundary layer height and surface pollutants derived from lidar observations over China: Regional pattern and influencing factors. Atmos. Chem. Phys. 2018, 18, 15921–15935. [Google Scholar] [CrossRef] [Green Version]
  6. Camarinha-Neto, G.F.; Cohen, J.C.P.; Dias-Júnior, C.Q.; Sörgel, M.; Cattanio, J.H.; Araújo, A.; Wolff, S.; Kuhn, P.A.F.; Souza, R.A.F.; Rizzo, L.V.; et al. The friagem event in the central Amazon and its influence on micrometeorological variables and atmospheric chemistry. Atmos. Chem. Phys. 2021, 21, 339–356. [Google Scholar] [CrossRef]
  7. Beyrich, F. Mixing height estimation from sodar data—A critical discussion. Atmos. Environ. 1997, 31, 3941–3953. [Google Scholar] [CrossRef]
  8. Eresmaa, N.; Karppinen, A.; Joffre, S.; Räsänen, J.; Talvitie, H. Mixing height determination by ceilometer. Atmos. Chem. Phys. Discuss. 2005, 5, 12697–12722. [Google Scholar] [CrossRef] [Green Version]
  9. van der Kamp, D.; McKendry, I. Diurnal and seasonal trends in convective mixed-layer heights estimated from two years of continuous ceilometer observations in Vancouver, BC. Bound.-Layer Meteorol. 2010, 137, 459–475. [Google Scholar] [CrossRef]
  10. Sawyer, V.; Li, Z. Detection, variations and intercomparison of the planetary boundary layer depth from radiosonde, lidar and infrared spectrometer. Atmos. Environ. 2013, 79, 518–528. [Google Scholar] [CrossRef]
  11. Jordan, N.S.; Hoff, R.M.; Bacmeister, J.T. Validation of Goddard Earth Observing System-version 5 MERRA planetary boundary layer heights using CALIPSO. J. Geophys. Res. Atmos. 2010, 115, 24218. [Google Scholar] [CrossRef] [Green Version]
  12. Dias-Júnior, C.Q.; Carneiro, R.G.; Fisch, G.; D’Oliveira, F.A.F.; Sörgel, M.; Botía, S.; Machado, L.A.T.; Wolff, S.; Santos, R.M.N.d.; Pöhlker, C. Intercomparison of planetary boundary layer heights using remote sensing retrievals and ERA5 reanalysis over Central Amazonia. Remote Sens. 2022, 14, 4561. [Google Scholar] [CrossRef]
  13. Saha, S.; Sharma, S.; Kumar, K.N.; Kumar, P.; Lal, S.; Kamat, D. Investigation of atmospheric boundary layer characteristics using ceilometer lidar, COSMIC GPS RO satellite, radiosonde and ERA-5 reanalysis dataset over Western Indian region. Atmos. Res. 2022, 268, 105999. [Google Scholar] [CrossRef]
  14. Carneiro, R.G.; Fisch, G. Observational analysis of the daily cycle of the planetary boundary layer in the central Amazon during a non-El Niño year and El Niño year (GoAmazon project 2014/5). Atmos. Chem. Phys. 2020, 20, 5547–5558. [Google Scholar] [CrossRef]
  15. Wang, D.; Stachlewska, I.S.; Song, X.; Heese, B.; Nemuc, A. Variability of the boundary layer over an urban continental site based on 10 years of active remote sensing observations in Warsaw. Remote Sens. 2020, 12, 340. [Google Scholar] [CrossRef] [Green Version]
  16. Odintsov, S.; Miller, E.; Kamardin, A.; Nevzorova, I.; Troitsky, A.; Schröder, M. Investigation of the mixing height in the planetary boundary layer by using sodar and microwave radiometer data. Environments 2021, 8, 115. [Google Scholar] [CrossRef]
  17. de Arruda Moreira, G.; de Oliveira, A.P.; Sánchez, M.P.; Codato, G.; da Silva Lopes, F.J.; Landulfo, E.; Marques Filho, E.P. Performance assessment of aerosol-lidar remote sensing skills to retrieve the time evolution of the urban boundary layer height in the Metropolitan Region of São Paulo City, Brazil. Atmos. Res. 2022, 277, 106290. [Google Scholar] [CrossRef]
  18. Tzadok, T.; Ronen, A.; Rostkier-Edelstein, D.; Agassi, E.; Avisar, D.; Berkovic, S.; Manor, A. Profiling the Planetary Boundary Layer Wind with a StreamLine XR Doppler LiDAR: Comparison to In-Situ Observations and WRF Model Simulations. Remote Sens. 2022, 14, 4264. [Google Scholar] [CrossRef]
  19. Fisch, G.; Tota, J.; Machado, L.; Silva Dias, M.A.F.d.; Da, F. Lyra, R.; Nobre, C.; Dolman, A.; Gash, J. The convective boundary layer over pasture and forest in Amazonia. Theor. Appl. Climatol. 2004, 78, 47–59. [Google Scholar] [CrossRef] [Green Version]
  20. De Santana, R.; Dias-Júnior, C.; Tóta, J.; da Silva, R.; do Vale, R.; de Andrade, A.; Tapajós, R.; Mota, B.; Vieira, K.; de Santana, L. Estimating the atmospheric boundary layer height above multiple surfaces of the amazon region. Ciência e Natura 2020, 42, 25. [Google Scholar]
  21. Andreae, M.O.; Acevedo, O.C.; Araùjo, A.; Artaxo, P.; Barbosa, C.G.; Barbosa, H.; Brito, J.; Carbone, S.; Chi, X.; Cintra, B.; et al. The Amazon Tall Tower Observatory (ATTO): Overview of pilot measurements on ecosystem ecology, meteorology, trace gases, and aerosols. Atmos. Chem. Phys. 2015, 15, 10723–10776. [Google Scholar] [CrossRef] [Green Version]
  22. Dias-Júnior, C.Q.; Dias, N.L.; dos Santos, R.M.N.; Sörgel, M.; Araújo, A.; Tsokankunku, A.; Ditas, F.; de Santana, R.A.; von Randow, C.; Sá, M.; et al. Is there a classical inertial sublayer over the Amazon forest? Geophys. Res. Lett. 2019, 46, 5614–5622. [Google Scholar] [CrossRef]
  23. Martins, L.G.N.; Acevedo, O.C.; Puhales, F.S.; Degrazia, G.A.; Oliveira, P.E. Vertical profiles of turbulence parameters in the thermal internal boundary layer. Bound.-Layer Meteorol. 2021, 179, 423–446. [Google Scholar] [CrossRef]
  24. Zhou, Y.; Sühring, M.; Li, X. Evaluation of energy balance closure adjustment and imbalance prediction methods in the convective boundary layer—A large eddy simulation study. Agric. For. Meteorol. 2023, 333, 109382. [Google Scholar] [CrossRef]
  25. Chu, Y.; Li, J.; Li, C.; Tan, W.; Su, T.; Li, J. Seasonal and diurnal variability of planetary boundary layer height in Beijing: Intercomparison between MPL and WRF results. Atmos. Res. 2019, 227, 1–13. [Google Scholar] [CrossRef]
  26. Uzan, L.; Egert, S.; Khain, P.; Levi, Y.; Vadislavsky, E.; Alpert, P. Ceilometers as planetary boundary layer height detectors and a corrective tool for COSMO and IFS models. Atmos. Chem. Phys. 2020, 20, 12177–12192. [Google Scholar] [CrossRef]
  27. Geiß, A.; Wiegner, M.; Bonn, B.; Schäfer, K.; Forkel, R.; von Schneidemesser, E.; Münkel, C.; Chan, K.L.; Nothard, R. Mixing layer height as an indicator for urban air quality? Atmos. Meas. Tech. 2017, 10, 2969–2988. [Google Scholar] [CrossRef] [Green Version]
  28. Fitch, K.E.; Garrett, T.J. Measurement and Analysis of the Microphysical Properties of Arctic Precipitation Showing Frequent Occurrence of Riming. J. Geophys. Res. Atmos. 2022, 127, e2021JD035980. [Google Scholar] [CrossRef]
  29. Caicedo, V.; Rappenglück, B.; Lefer, B.; Morris, G.; Toledo, D.; Delgado, R. Comparison of aerosol lidar retrieval methods for boundary layer height detection using ceilometer aerosol backscatter data. Atmos. Meas. Tech. 2017, 10, 1609–1622. [Google Scholar] [CrossRef] [Green Version]
  30. Carneiro, R.; Fisch, G.; Neves, T.; Santos, R.; Santos, C.; Borges, C. Nocturnal boundary layer erosion analysis in the Amazon using large-eddy simulation during GoAmazon project 2014/5. Atmosphere 2021, 12, 240. [Google Scholar] [CrossRef]
  31. Macedo, A.d.S.; Fisch, G. Temporal variability of solar radiation during the GOAmazon 2014/15 experiment. Rev. Bras. Meteorol. 2018, 33, 353–365. [Google Scholar] [CrossRef]
  32. Newman, M.; Wittenberg, A.T.; Cheng, L.; Compo, G.P.; Smith, C.A. The extreme 2015/16 El Niño, in the context of historical climate variability and change. Bull. Am. Meteorol. Soc. 2018, 99, S16–S20. [Google Scholar] [CrossRef] [Green Version]
  33. Moura, M.M.; Dos Santos, A.R.; Pezzopane, J.E.M.; Alexandre, R.S.; da Silva, S.F.; Pimentel, S.M.; de Andrade, M.S.S.; Silva, F.G.R.; Branco, E.R.F.; Moreira, T.R.; et al. Relation of El Niño and La Niña phenomena to precipitation, evapotranspiration and temperature in the Amazon basin. Sci. Total Environ. 2019, 651, 1639–1651. [Google Scholar] [CrossRef] [PubMed]
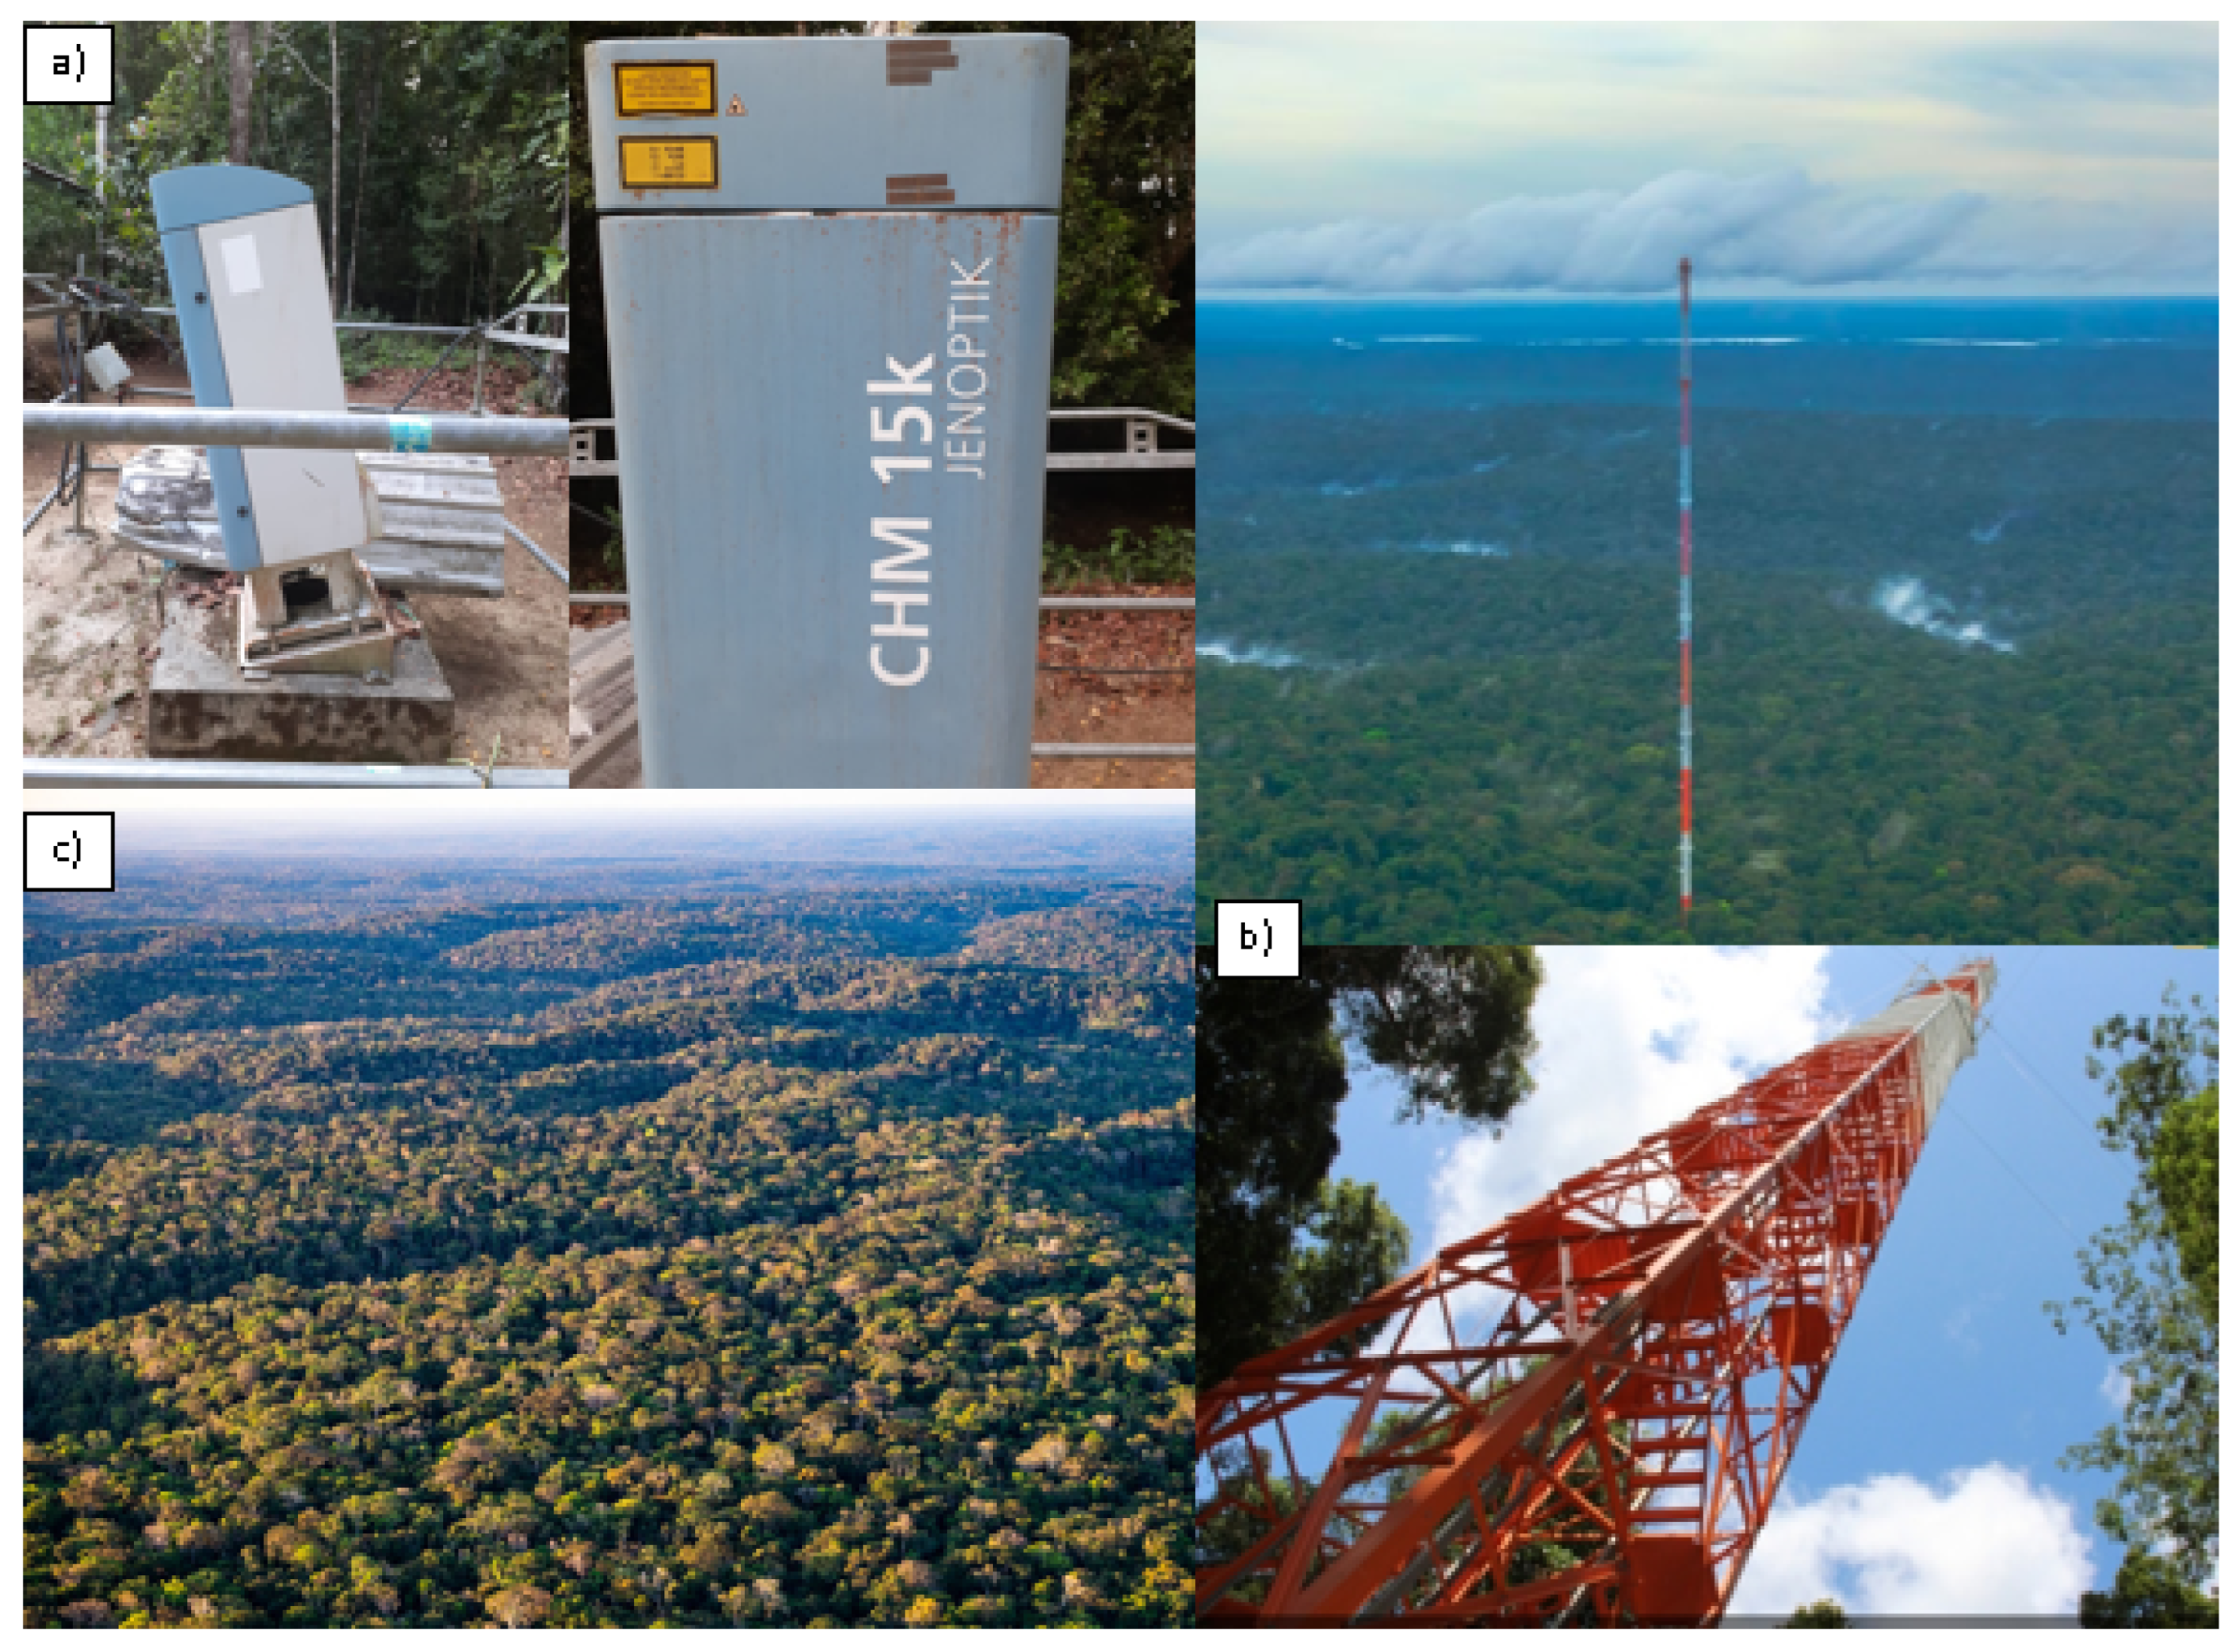
Figure 1. (a) Ceilometer model CHM15K used to monitor the ABL at ATTO site, (b) 325 m high micrometeorological tower, (c) Amazon forest.
Remotesensing 15 03261 g001
Figure 2. Aerosol backscatter profile and corresponding calculated variance profile for 4 August 2018 at 20:40 UTC. The horizontal red dashed line corresponds to ABL height.
Remotesensing 15 03261 g002
Figure 3. The black line represents the daily cycle of average ABL height for the year 2015 at the ATTO experimental site in central Amazonia. The red line indicates the approximately linear behavior of the ABL between 08:00 LT and 10:00 LT. The dashed blue lines represent the sunrise and sunset, which do not have a seasonal influence.
Remotesensing 15 03261 g003
Figure 4. Annual mean daily cycle of the ABL height (zi) above the ATTO site in central Amazonia during the years 2015 (black line), 2018 (blue line) and 2020 (red line), and associated variability. The dashed blue lines represent the sunrise and sunset.
Remotesensing 15 03261 g004
Figure 5. Annual mean daily cycle of the atmospheric boundary layer height measured at the ATTO experimental site in Central Amazonia, (a) in the wet and (b) in the dry periods. The dashed blue lines represent the sunrise and sunset.
Remotesensing 15 03261 g005
Figure 6. Averages of: (a) maximum ABL height (zi_max) and (b) ABL growth rate, above the ATTO experimental site in central Amazonia. Black vertical lines represent the 25% and 75% percentiles.
Remotesensing 15 03261 g006
Figure 7. Linear regression between maximum ABL height (zi_max) and ABL growth rates for the years 2015, 2018, and 2020 at the ATTO experimental site in central Amazonia.
Remotesensing 15 03261 g007
Figure 8. Linear regression between maximum ABL height (zi_max) and ABL growth rates above the ATTO experimental site in central Amazonia, for the (a) wet period and (b) dry period.
Remotesensing 15 03261 g008
Figure 9. Polynomial fit between modelled maximum ABL height (zi_max modelled) as a function of experimentally obtained maximum ABL height (zi_max experimental) above the ATTO site in central Amazonia. The red line is the best fit.
Remotesensing 15 03261 g009
Table 1. Ceilometer dataset collected at the ATTO experimental site, central Amazonia, from 2014 to 2020, with the exception of 2017. The days used in the analyses are different from the collected days due to data quality control. The wet and dry periods were defined using the precipitation (monthly values) as a parameter. The wet period is the months of February, March and April, and the dry period is August, September and October.
YearNumber of Days CollectedNumber of Days UsedPeriod%
20141816December (wet)88.9
2015273218January–December (wet and dry)79.9
20166428January–April (wet)43.8
2018291211January–November (wet and dry)72.5
20199966July–Dec (dry)66.7
2020328246January–December (wet and dry)75.0
Table 2. Year, RMSE, correlation coefficient (r), intercept and slope coefficients for the annual polynomial fit of Figure 7.
YearRMSE (m)rIntercept (m)Slope (h)
20152130.587334.19
20182030.548862.77
20202230.459252.75
All3110.518753.09
Disclaimer/Publisher’s Note: The statements, opinions and data contained in all publications are solely those of the individual author(s) and contributor(s) and not of MDPI and/or the editor(s). MDPI and/or the editor(s) disclaim responsibility for any injury to people or property resulting from any ideas, methods, instructions or products referred to in the content.