Technical Note

Attributing Evapotranspiration Changes with an Extended Budyko Framework Considering Glacier Changes in a Cryospheric-Dominated Watershed

1
State Key Laboratory of Cryospheric Sciences, Northwest Institute of Eco-Environment and Resources, Chinese Academy of Sciences, Lanzhou 730000, China
2
Key Laboratory of Ecohydrology of Inland River Basin, Northwest Institute of Eco-Environment and Resources, Chinese Academy of Sciences, Lanzhou 730000, China
3
University of Chinese Academy of Sciences, Beijing 100049, China
4
Shaanxi Key Laboratory of Earth Surface System and Environmental Carrying Capacity, Northwest University, Xi’an 710027, China
5
China Institute of Earth Surface System and Hazards, College of Urban and Environmental Sciences, Northwest University, Xi’an 710027, China
*
Author to whom correspondence should be addressed.
Remote Sens. 2023, 15(3), 558; https://doi.org/10.3390/rs15030558
Submission received: 18 December 2022 / Revised: 6 January 2023 / Accepted: 12 January 2023 / Published: 17 January 2023
(This article belongs to the Special Issue Remote Sensing in Natural Resource and Water Environment)

Abstract

:
The retreat of glaciers has altered hydrological processes in cryospheric regions and affects water resources at the basin scale. It is necessary to elucidate the contributions of environmental changes to evapotranspiration (ET) variation in cryospheric-dominated regions. Considering the upper reach of the Shule River Basin as a typical cryospheric-dominated watershed, an extended Budyko framework addressing glacier change was constructed and applied to investigate the sensitivity and contribution of changes in environmental variables to ET variation. The annual ET showed a significant upward trend of 1.158 mm yr−1 during 1982–2015 in the study area. ET was found to be the most sensitive to precipitation (P), followed by the controlling parameter (w), which reflects the integrated effects of landscape alterations, potential evapotranspiration (ET0), and glacier change (∆W). The increase in P was the dominant factor influencing the increase in ET, with a contribution of 112.64%, while the decrease in w largely offset its effect. The contributions of P and ET0 to ET change decreased, whereas that of w increased when considering glaciers using the extended Budyko framework. The change in glaciers played a clear role in ET change and hydrological processes, which cannot be ignored in cryospheric watersheds. These findings are helpful for better understanding changes in water resources in cryospheric regions.

1. Introduction

Catchment hydrology is fundamental to the study of interactions among climate, soil, vegetation, and terrain [1,2,3]. A full understanding of hydrological processes at the catchment scale is essential for water resource management. Global hydrological processes are undergoing significant change in response to climate change. Evapotranspiration (ET), as a significant part of hydrological processes, plays a crucial role in the water and energy exchanges in the atmosphere, hydrology, cryosphere, and biosphere [4,5]. Therefore, it is important to investigate the potential mechanisms behind ET variation to understand hydrological processes. However, quantifying the mechanisms behind ET variation remains a challenge, owing to limited long-term observations and the complexity of the processes between climate, soil, and vegetation.
There are several methods to quantify the impact of environmental changes on hydrological processes: (a) hydrological models, including physical-based and conceptual models [6,7], (b) the paired-basin method [8], and (c) statistical methods [9]. Physical-based hydrological models are powerful tools for evaluating the contributions of climate change and landscape alterations on hydrological regimes and water partitioning [6]. However, they require significant prior knowledge of soil and vegetation parameters [10], which are difficult to obtain in data-scarce regions, especially in cryospheric regions with limited observations and harsh environments. The paired-basin method, based on the similarity principle, is suitable for small catchments but not for medium or large catchments [11]. Statistical methods have been extensively applied due to their low computing requirements and high adaptability [12], among which the Budyko hypothesis [13,14] has been popular in recent years [15,16]. In addition, the Budyko hypothesis coupled with water-energy balance information provides an effective way to elucidate the contribution of each factor to hydrological processes [9,17,18,19,20,21], making the approach more feasible and robust.
The Budyko equation describes water balance by dividing precipitation (P) into runoff (R) and ET at a catchment scale [14]. Budyko [14] hypothesized that the annual ET is controlled by atmospheric demand (potential evapotranspiration, ET0) and water supply (P). Owing to the mismatch between observations and the Budyko curve, a controlling parameter was considered to reflect the impact of catchment characteristics on water partitioning [22,23,24,25]. The controlling parameter represents the combined effects of all factors other than the aridity index (ET0/P), which is related to soil, vegetation, land use, topography, and human activity [26]. Thus, the controlling parameter was used to differentiate the contributions of climatic and anthropogenic factors to water partitioning.
Previous studies have quantified the influences of climate change and landscape factors on ET change using the Budyko framework [5,21,27,28,29]. For example, Yang et al. [21] proposed that the positive contributions of P and the normalized difference vegetation index (NDVI) offset the negative contribution of ET0 to changes in ET in the Qilian Mountains. Ning et al. [5] suggested that ET variation in arid alpine basins was mainly controlled by rainfall variation during the growing season. Li et al. [30] found that ET variation was controlled by P in water-limited regions and dominated by the vapor pressure deficit in energy-limited regions in China, based on a modified Budyko framework. Furthermore, Li et al. [27] evaluated the relative contributions of environmental factors to global ET. These studies analyzed the relative contribution of each factor to ET in many regions using a series of Budyko equations. However, the application of the Budyko framework was limited to cryospheric regions, where glacier shrinking and permafrost degradation seriously affect water balance and hydrological processes.
Various studies have quantified the impact of cryospheric elements on runoff [3,31,32,33,34,35]. For example, Zhang et al. [31] indicated that runoff is sensitive to snow change in northern mountainous and high-altitude areas. Wang et al. [36] analyzed the response of streamflow to permafrost degradation in the source region of the Yellow River. Saydi et al. [37] and Liu et al. [35] reported that the effect of glaciers on runoff should be considered in the Budyko framework for cryospheric catchments. However, few studies have investigated the elasticity and contribution of glaciers to ET in cryospheric regions.
Glaciers, as natural solid reservoirs, significantly contribute to water supply in many catchments worldwide [38]. Global warming causes glacier retreat [39], which further changes hydrological processes in cryospheric regions [40]. The Tibetan Plateau (TP), known as the “Asian tower”, has approximately 36,763 glaciers with an area of approximately 49,873.44 km2 [41]. Owing to limited observations and complicated cryospheric processes, the responses of hydrological elements (i.e., R and ET) to climate change and glacier change are still unclear. Therefore, it is crucial to investigate the response of ET to climate change and glacier change in cryospheric regions, which will be helpful for understanding the potential driving mechanisms of ET variation.
The main purpose of this research was to investigate the potential mechanisms of climate change, glacier change, and landscape alterations in response to ET change in a typical cryospheric-dominated watershed. First, the spatiotemporal variations in ET and environmental factors during 1982–2015 were evaluated. Second, the elasticity coefficients of ET for the climatic factors, glacier change, and landscape alterations were assessed. Third, the contribution of all environmental factors to ET change were quantitatively analyzed. This study provides a foundation for better understanding the response of hydrological elements in cryospheric regions to glacier change, which is of great significance for water resource management.

2. Materials and Methods

2.1. Study Area

The upper reach of the Shule River Basin (URSRB) is located on the northeastern Tibetan Plateau (Figure 1), where the famous Hexi Corridor is also located [42,43]. Throughout, the Shule River in the basin flows from southeast to northwest; its total length is approximately 670 km [41]. Usually, the river section upstream of the Changmabao hydrological station is the URSRB, which covers an area of 1.1 × 10⁴ km2. It is a typical cryospheric watershed fed by glaciers and snowmelt. There were 486 glaciers in the study area during 2006–2010 [44]. The glaciers cover an area of 403.5 km2 and account for 3.7% of the total area based on data extracted from the Second Chinese Glacier Inventory [44,45]. Permafrost covers about 83% of the total area [46]. The elevation ranges from 2100 m to 5637 m (Figure 1).

2.2. Data Collection

Annual runoff data at the Changmabao Hydrologic Station were obtained from the Hydrological Bureau. Due to limited meteorological observations in the URSRB, P and ET0 were extracted from ERA5-Land reanalysis data. The ERA5-Land dataset has a higher horizontal resolution of 9 km compared to ERA5 [47] and its performance has been verified in previous studies [48,49,50]. Glacier data were obtained from the Cold and Arid Region Science Data Center (http://www.crensed.ac.cn/portal/ (accessed on 3 September 2022)) and the National Tibetan Plateau Scientific Data Center (http://data.tpdc.ac.cn/zhhans/ (accessed on 26 August 2022). NDVI were extracted from the Global Inventory Modelling and Mapping Studies (GIMMS) dataset (https://ecocast.arc.nasa.gov/data/pub/gimms/3g.v1/ (accessed on 12 October 2021) with a spatial resolution of 8 km, which provides an index representing vegetation dynamics. The collection period in this study was from 1982 to 2015.

2.3. Methods

2.3.1. Water Balance and Budyko Framework

The water balance in the watershed is written as follows:
ET = P R Δ S
where ET, P, R, and ∆S are the evapotranspiration (mm), precipitation (mm), runoff (mm), and terrestrial water storage change (mm), respectively. For long-term periods, ∆S can be ignored because of the small anomalies [20,35,51] on an annual scale.
In the cryospheric-dominated watershed, the water change caused by glacier mass balance cannot be ignored; it represents the effect of climate change on glacier volume and the fluctuation of glacier meltwater. The average annual glacier mass balance in the URSRB ranged from −595.9 to 222.8 mm w.e. (mm water equivalent), with an average value of −116.1 mm w.e. during 1970–2015 (Figure S1). It decreased significantly by −5.64 mm w.e. yr−1. Therefore, the glacier mass balance should be considered in the water balance of glaciated watersheds. Thus, the water balance for the glaciated watershed was modified as follows:
ET = ( P Δ W ) R Δ W = m b × f
where ∆W is the glacier mass balance with equivalent water height (mm), which can be calculated from the glacial mass balance (mb; mm w.e.) and the glacier fraction (f; %); mb can be calculated using the degree-day factor and positive accumulated temperature [45,52].
The Budyko framework was used for ET estimation to couple the concepts of water and energy balance. This framework divides the steady-state water balance as a function of the relative importance of atmospheric water supply (P), water demand (ET0), and the controlling parameter (w). There are many classical equations for describing the Budyko framework, such as the Fu equation [23,53], Zhang equation [24], Choudhury–Yang equation [22,54], and the Wang–Tang equation [25]. These equations produce similar performances in ET estimation [20]. Therefore, the Fu equation [53] was employed to estimate ET.
ET P = 1 + ET 0 P [ 1 + ( ET 0 P ) w ] 1 w
where P and ET0 can be extracted from ERA5-Land data and w is the controlling parameter, representing the combined effects of the landscape characteristics [55].

2.3.2. Extended Budyko Framework

By considering ∆W, the Budyko equation can be written as [36]:
ET ( P Δ W ) = 1 + ET 0 ( P Δ W ) [ 1 + ( ET 0 ( P Δ W ) ) w ] 1 w
By eliminating the denominator, Equation (4) can be written as:
ET = ( P Δ W ) + ET 0 [ ( P Δ W ) w + ET 0 w ] 1 w

2.3.3. Sensitivity Analysis

The elasticity coefficient method was used to evaluate the sensitivity of ET to environmental factors. The elasticity coefficient of ET for a particular variable can be expressed as [56]
ε x i = ET x i × x i ET
where εxi means the elasticity coefficient of ET for xi, where xi represents each environmental factor (P, ET0, ∆W, or w).
Based on Equation (5), the first-order partial derivative coefficients for P, ET0, ∆W, and w can be written as follows:
ET P = 1 [ ( P Δ W ) w + ET 0 w ] 1 w 1 ( P Δ W ) w 1
ET ET 0 = 1 [ ( P Δ W ) w + ET 0 w ] 1 w 1 ET 0 w 1
ET Δ W = 1 + [ ( P Δ W ) w + ET 0 w ] 1 w 1 ( P Δ W ) w 1
ET w = [ ( P Δ W ) w ln ( ( P Δ W ) w ) + ET 0 w ln ( ET 0 ) w ( ( P Δ W ) w + ET 0 w ) ln ( ( P Δ W ) w + ET 0 w ) w 2 ] × [ ( P Δ W ) w + ET 0 w ] 1 w
A positive (negative) elasticity coefficient means that ET increases (decreases) with the variable. Based on the above equations, the elasticity coefficients of ET for P, ET0, ∆W, and w can be obtained and the changes in the elasticity coefficients can be derived.

2.3.4. Contribution Analysis of ET Change

A differential equation method was adopted to quantify the contribution to ET variation. This method assumes that all the variables are independent of each other. Thus, the contribution for each variable to ET variation can be calculated as follows:
d ET d t = ET ET 0 d ET 0 d t + ET P d P d t + ET Δ W d Δ W d t + ET w d w d t + δ
The equation is simplified as:
L ( ET ) = C ( P ) + C ( ET 0 ) + C ( Δ W ) + C ( w ) + δ
where L(ET) is the slope of ET change; C(P), C(ET0), C(∆W), and C(w) are the contributions of change in P, ET0, ∆W, and w to change in ET, respectively; and δ is the systemic error.
The relative contribution of each variable to ET change can be expressed as:
RC ( x i ) = C ( x i ) C ( P ) + C ( ET 0 ) + C ( Δ W ) + C ( w )
where xi means one of the four variables and RC(xi) represents the relative contribution of xi to the ET change.

3. Results

3.1. Variations of ET, P, ET0, and ∆W

To better understand the influences of climate change, glacier change, and landscape alteration on ET change, the temporal variations of ET and environmental factors were analyzed (Figure 2). Annual ET and P showed significant increasing trends, whereas the increasing trend in ET0 was insignificant. The average values of annual ET, P, and ET0 were 394.2, 488.3, and 719.8 mm during 1982–2015, with increases of 1.158, 2.472, and 0.716 mm yr−1, respectively. Moreover, ∆W showed a significant decreasing trend with a slope of −0.392 mm yr−1, with an average value of −4.78 mm.

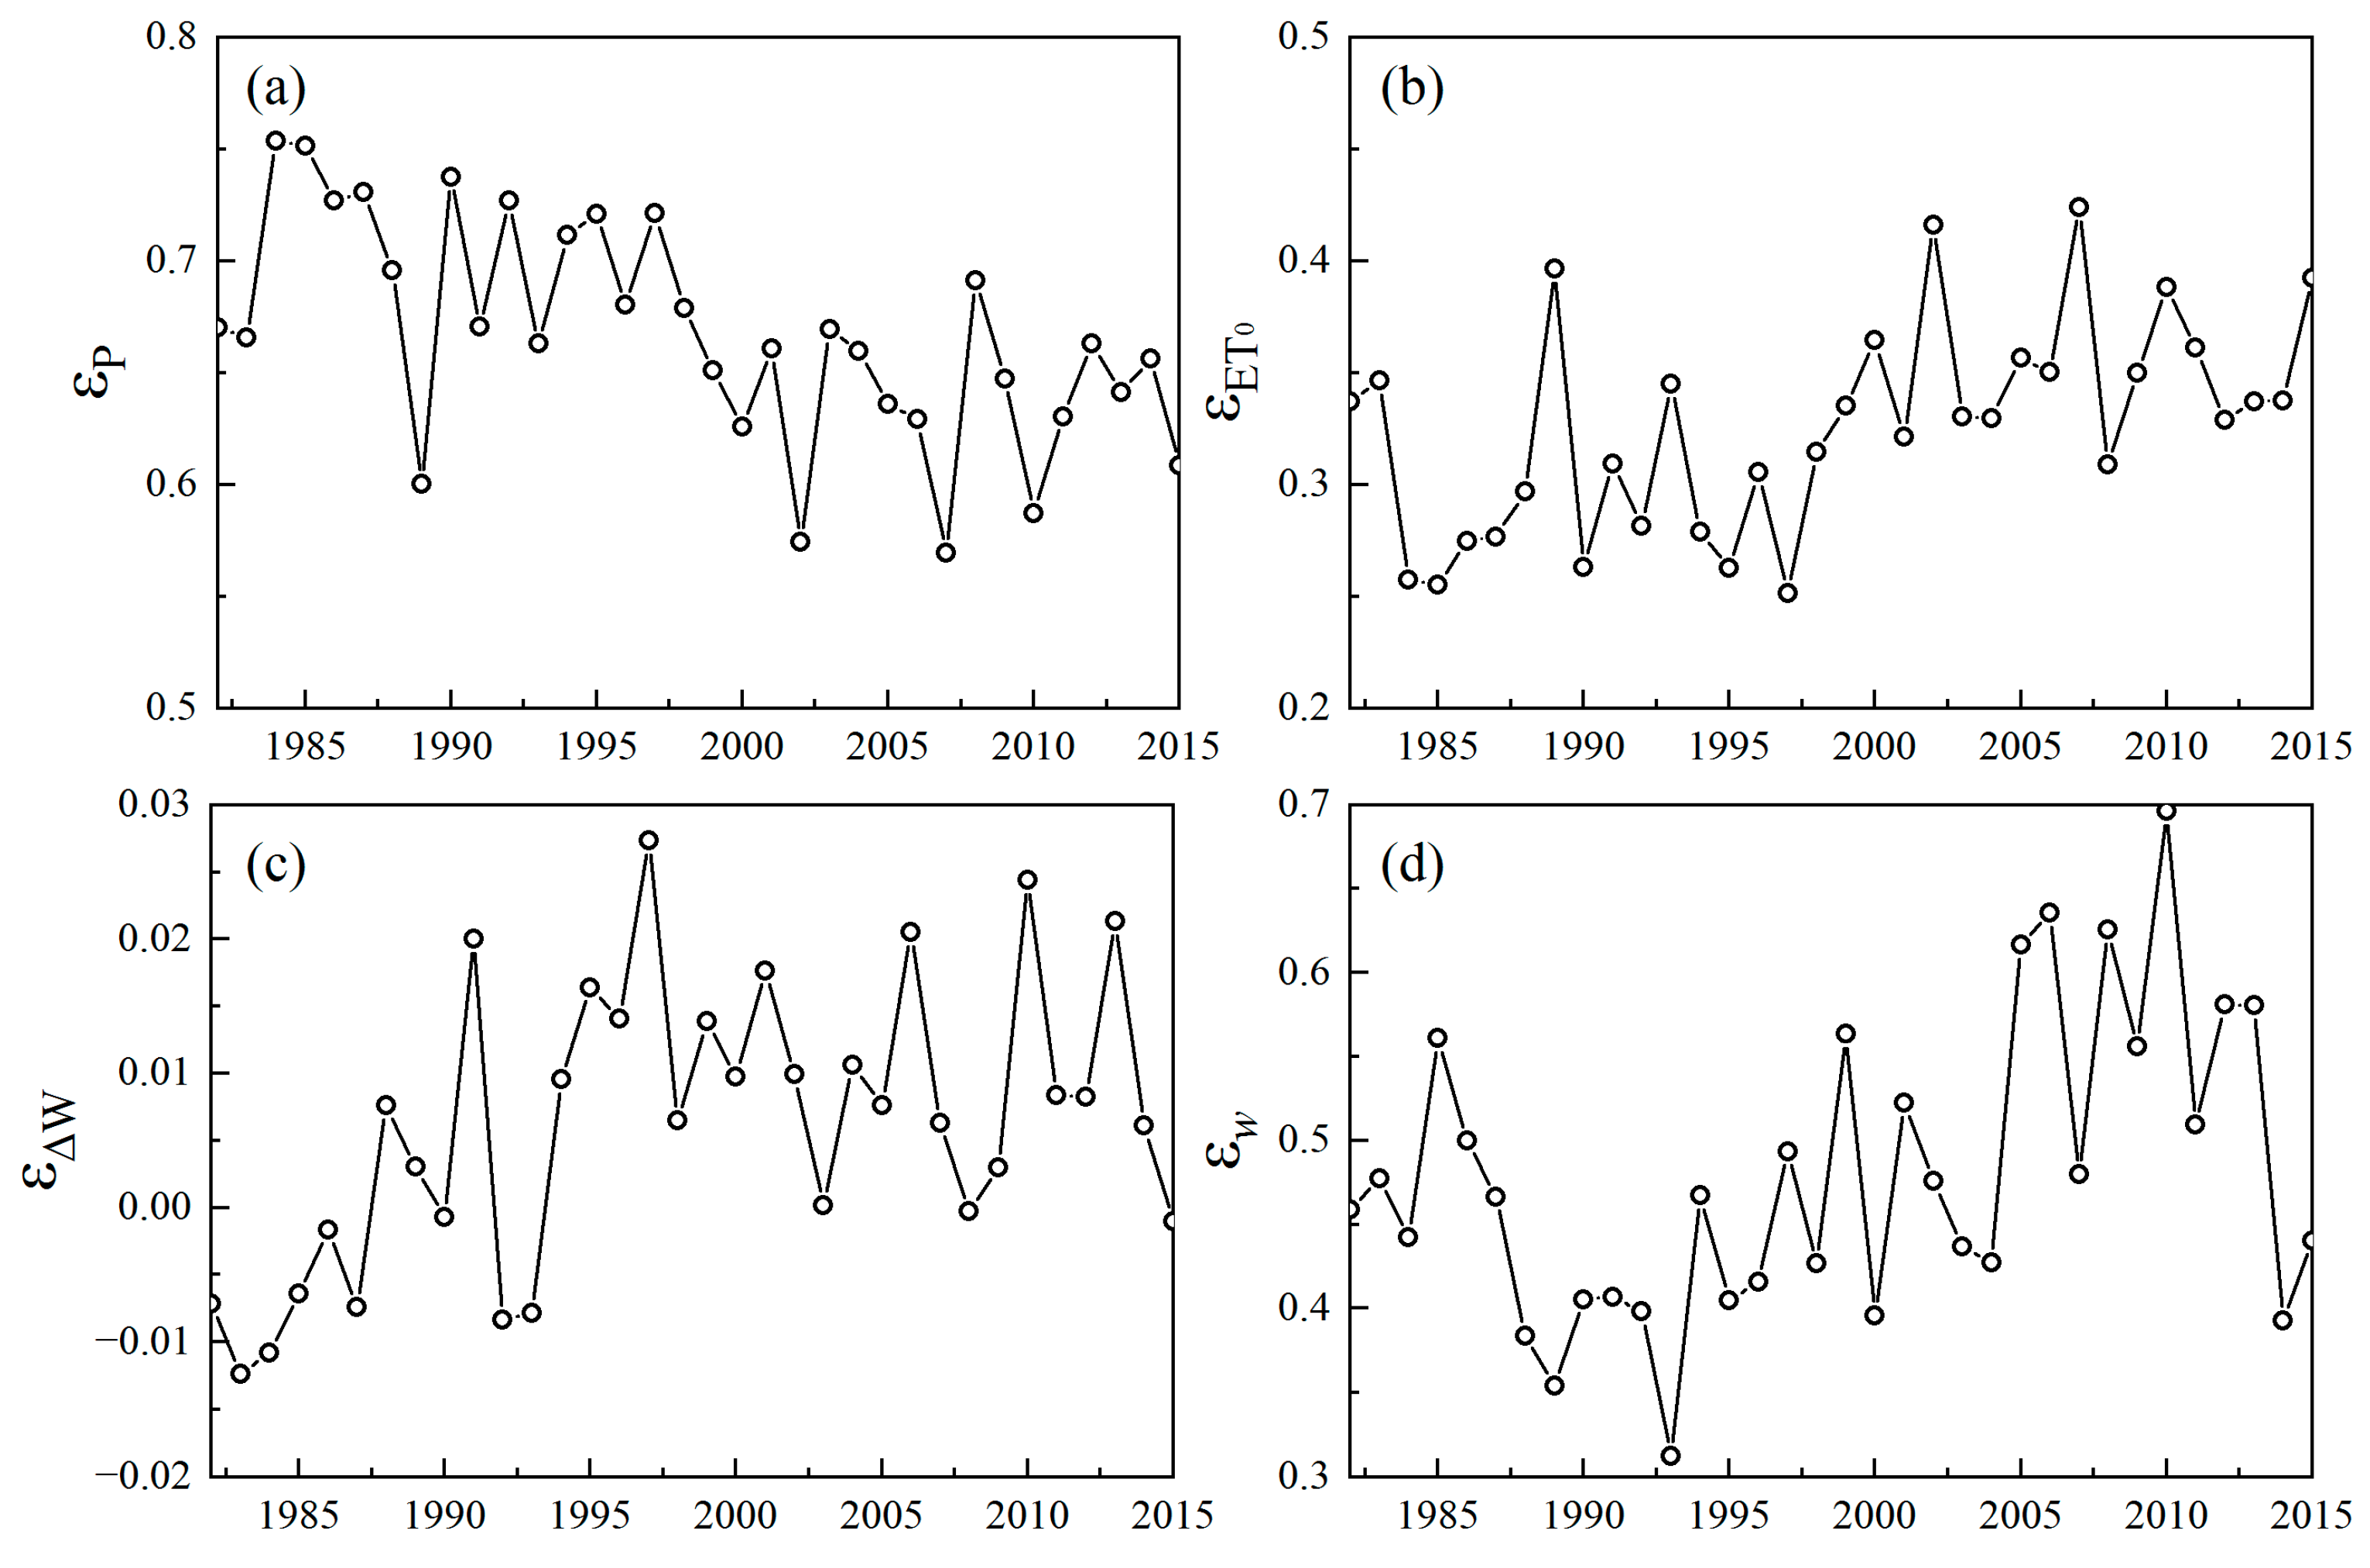
3.2. Sensitivity of ET to Environmental Variables

The elasticity coefficients of ET with respect to precipitation, potential evapotranspiration, glacier and landscape are shown in Figure 3. The elasticity coefficient ranged from 0.57 to 0.75 for P, from 0.25 to 0.42 for ET0, from −0.01 to 0.03 for ∆W, and from 0.31 to 0.7 for w. These values indicate that an increase of 1% in P, ET0, ∆W, or w would result in a 0.57~0.75% increase, 0.25~0.42% increase, −0.01 ~0.03% increase, or 0.31~0.7% increase in ET, respectively.
On average, an increase of 1% in P, ET0, ∆W, or w increased ET by 0.678, 0.325, 0.007, and 0.471%, respectively (Figure 4). The elasticity coefficient of ET for P was the largest, followed by the controlling parameter w, indicating that ET was the most sensitive to climate change.
The largest absolute value of the four elasticity coefficients was εP, whereas the smallest absolute value of the four elasticity coefficients was ε∆W. The absolute values of εET0 and εw increased significantly, whereas that of εP decreased significantly. In addition, the absolute value of ε∆W increased insignificantly. This suggests that ET became more sensitive to variations in landscape and glacier changes, whereas the sensitivity of ET to climate change decreased.

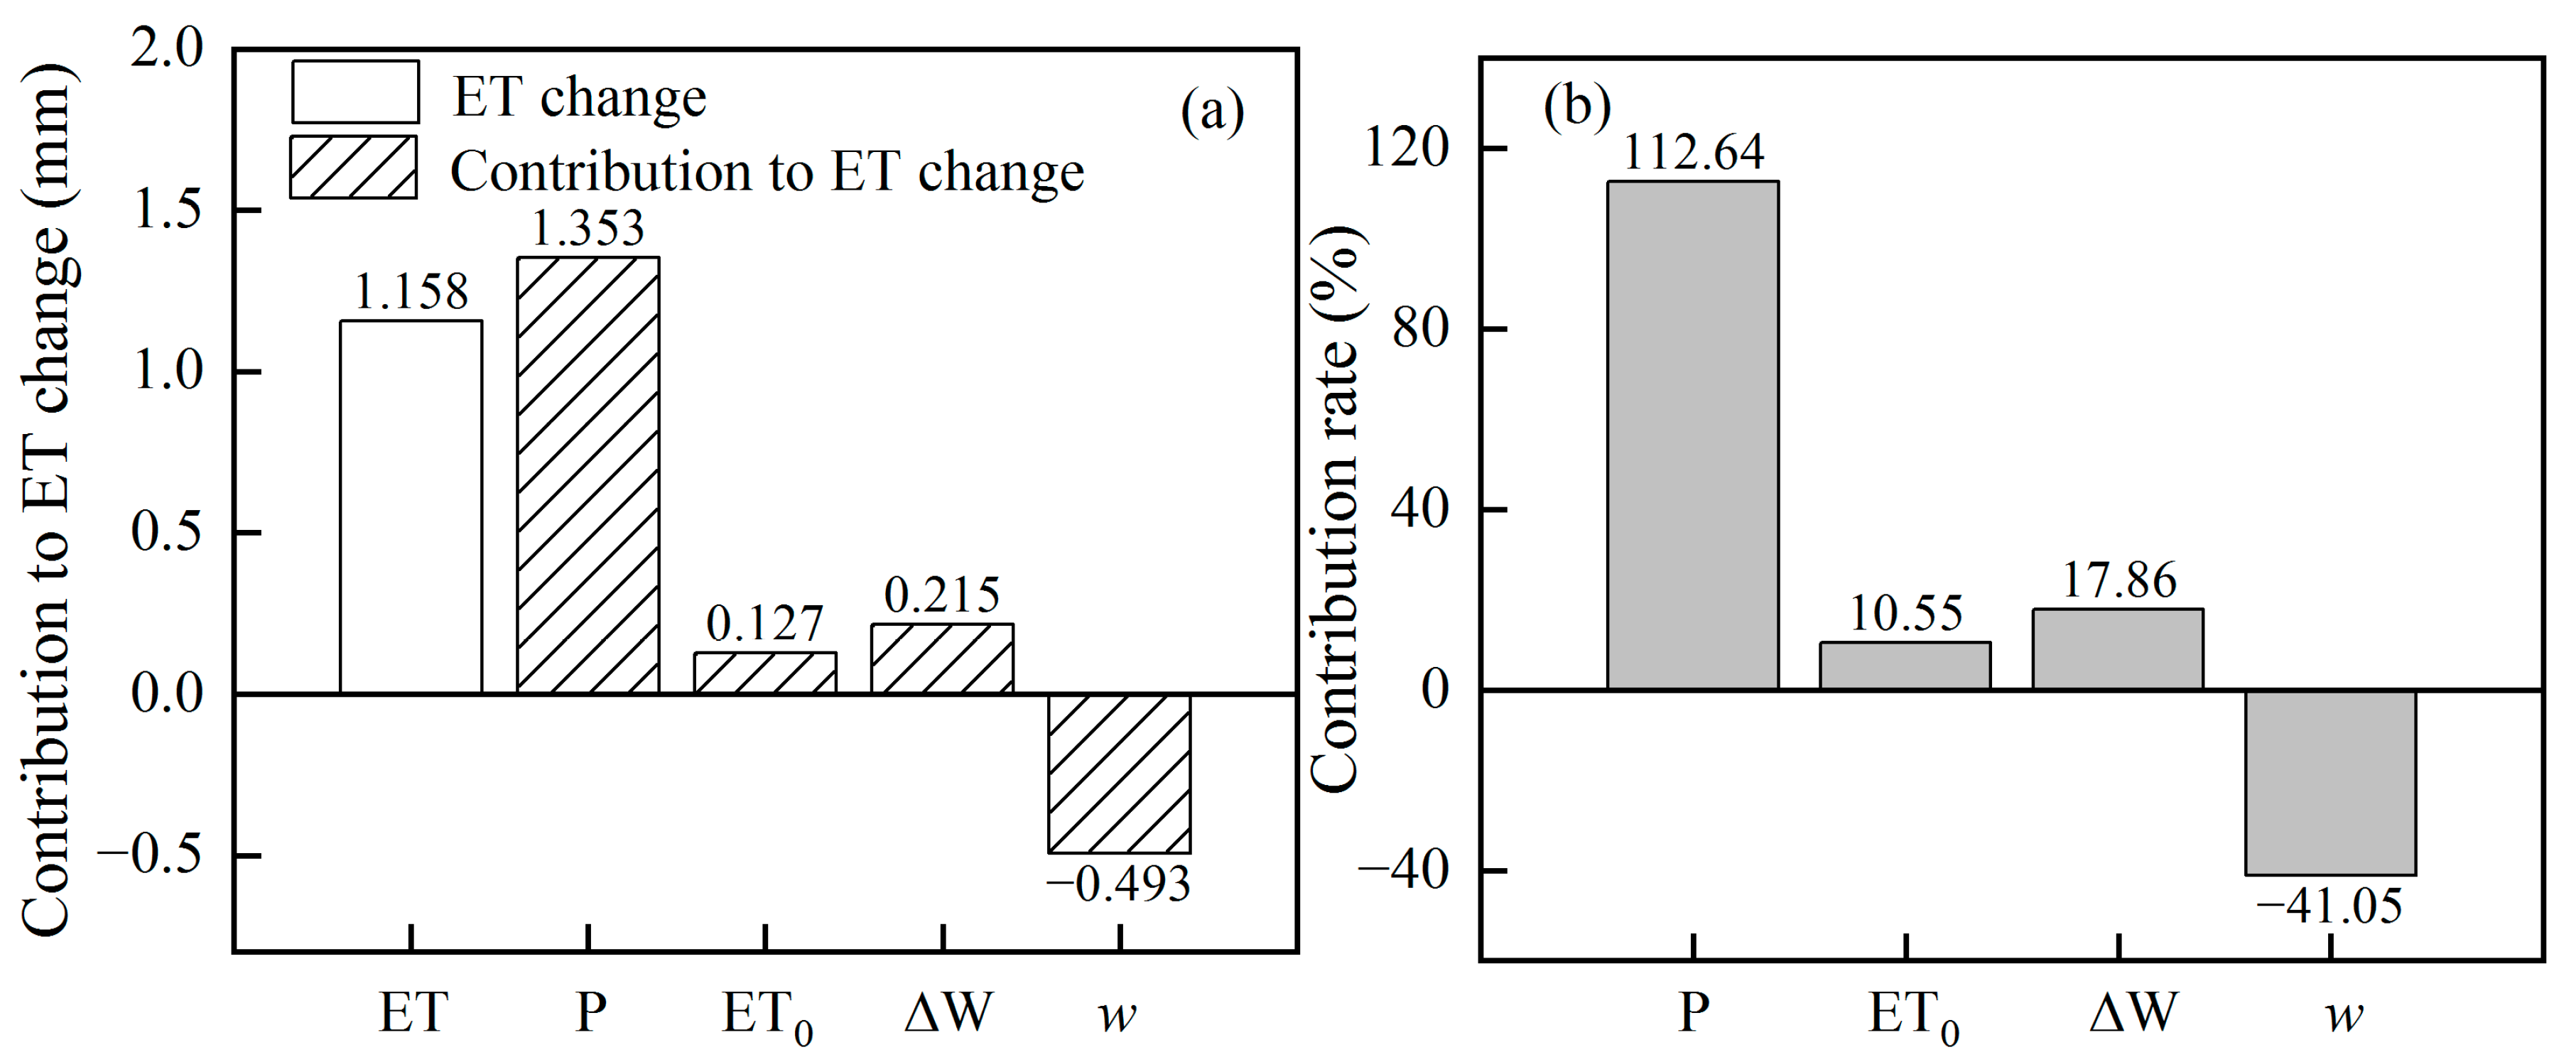
3.3. Attribution Analysis of ET Change

The calculated changes in ET (1.202) were similar to that observed for the ET trend (1.158), indicating that the method used in this study was appropriate for evaluating the contribution of environmental factors to ET variation (Figure 5a). The increased P and ET0 caused an increase in ET of 1.353 mm and 0.127 mm, respectively; the corresponding contribution rates were 112.64% and 10.55%, respectively (Figure 5b). The decrease in ∆W resulted in an increase in ET of 0.215 mm, with a contribution rate of 17.86%. The decrease in w caused a decrease in ET of −0.493 mm, with a contribution rate of −41.05%. Therefore, climate change increased ET, whereas landscape alteration decreased ET, and the contribution of climate change was greater than that of the latter. These results suggest that changes in P were the dominant factor in the increase in ET, followed by changes in landscape. Changes in ∆W had an impact on ET change, while changes in ET0 played a limited role in the change in ET. The combined effects of the positive contribution of P and the negative contribution of w resulted in an increase in ET.

4. Discussion

4.1. Performances of the Budyko Framework Considering Glaciers

The original Budyko framework assumes that the potential water supply for ET is from P. However, in areas covered by glaciers, the water supply originates from P and from glacier melting. To better interpret the influence of glaciers on ET, the original Budyko framework, without considering glaciers, was also analyzed (Figure 6). Parameter w in the original Budyko framework ranged from 2.05 to 3.39, with an optimal value of 2.518. The estimated w in this study ranged from 2.15 to 3.32, with an optimal value of 2.548. A larger optimal w value appears when considering meltwater from snow and glaciers [34].
In addition, the contribution rates of environmental factors to ET variation were different between the original and extended Budyko frameworks (Figure 7). The contribution rates of P and ET0 in the original Budyko framework were higher than those in the present study. The absolute value of the contribution rate of w was higher than that observed in this study, which considered the effect of glaciers, indicating that there were other factors that influenced the ET change.

4.2. Relationship between the Parameter w and NDVI

Parameter w is related to landscape conditions, including the topography, soil properties, and vegetation conditions [55,57]. The soil properties and topography of the study area have hardly changed in recent decades, whereas the vegetation has varied with time. The increasing NDVI resulted in an increase in transpiration and, thus, an increase in ET (Figure 8a). The decrease in w was negatively correlated with the increase in NDVI (Figure 8b), indicating that ET increased with decrease in w and the change in w negatively contributed to the change in ET. This further indicates that w might be influenced by factors other than NDVI. For example, Ning et al. [20] suggested that climate seasonality influences the ET. Liu et al. [35] reported that w reflected the combined results of NDVI, terrestrial slope, and glacier fraction. Future studies should focus on exploring the relationships between w and other related factors (i.e., topography, permafrost degradation, and climate seasonality).

4.3. Uncertainty Analysis

The Budyko framework assumes that all factors should be independent of each other, whereas some factors may exhibit autocorrelation [58], which leads to uncertainties in the contributions of environmental factors to ET change. Moreover, the interactions of related factors may have an indirect effect on ET, but the framework cannot quantify the indirect effects and needs to be further improved. The lack of long-term observations of ET limits the verification of model accuracy. Moreover, P, ET0 and NDVI were extracted from the existing data products (ERA5-Land and GIMMS), and the mismatches of these products may introduce uncertainties in the estimation of ET based on the water balance equation. In addition, terrestrial water storage has been ignored over long periods, which may introduce uncertainties in water-balance estimation [59].
In cryospheric regions, permafrost degradation directly influences hydrological processes [60], potentially affecting the redistribution of water resources. Previous studies have proposed that permafrost thawing and lengthening of non-freezing days may lead to a significant increase in ET [61,62]. However, the influence of permafrost (i.e., increasing ground temperature, deepening of the active layer thickness, and thawing of ground ice) on hydrological processes is difficult to determine directly. For example, the thawing of ice consumes energy, which was neglected in the ET estimation [63]. In addition, the ground ice content is difficult to quantify and the results estimated by different algorithms vary greatly [64,65]. Moreover, the spatial distribution of ground ice content is yet to be clearly investigated, which makes assessment of the impact of ground ice content on hydrological processes challenging [66]. Therefore, the role of permafrost is not considered in this study. Further studies should consider the impacts of permafrost freezing and thawing on hydrological processes.

5. Conclusions

Hydrological processes have been strongly affected by climate change and landscape alteration, especially in cryospheric-dominated regions. This study evaluated the long-term change in ET from 1982 to 2015 in the upper reach of the Shule River Basin using an extended Budyko framework involving consideration of glaciers. The responses of ET to the direct impact of climate change, the impact of glacier change, and landscape alteration were then also determined.
Annual ET, P, and ET0 exhibited increasing trends, whereas ∆W exhibited a significant decreasing trend. The elasticity coefficients were highest for P, followed by w, ET0, and ∆W. In addition, the elasticity coefficients varied with time. The increase in ET was dominated by changes in P, accounting for 112.64% of the total ET variation. The contributions of w, ∆W, and ET0 change accounted for −41.05%, 17.86%, and 10.55% of ET change, respectively. The positive contribution of P largely offset the negative contribution of w. Compared with the original Budyko framework, the contributions of P and ET0 to ET change decreased, while that of w increased when considering glaciers in the extended Budyko framework. This indicates that glaciers had a significant impact on annual ET which cannot be ignored.
These results provide insights for understanding the response of ET to climate change and landscape alteration in cryospheric-dominated watersheds, which can also serve as a reference for other cryospheric regions. Nevertheless, further studies should consider the effects of permafrost on hydrological processes in cryospheric regions.

Supplementary Materials

The following are available online at https://www.mdpi.com/article/10.3390/rs15030558/s1, Figure S1: Variation in glacier mass balance during 1970–2015.

Author Contributions

Conceptualization, Y.C. and S.Z.; methodology, Y.C.; software, Y.C.; validation, Y.D., Q.Z. and S.Z.; formal analysis, Q.Z.; investigation, Y.C., Y.D. and Q.Z.; resources, Y.D., data curation, Y.D., Q.Z. and S.Z.; writing—original draft preparation, Y.C.; writing—review and editing, Y.C., Y.D., Q.Z. and S.Z.; visualization, Q.Z.; supervision, S.Z.; project administration, Q.Z.; funding acquisition, Y.C., Y.D. and Q.Z. All authors have read and agreed to the published version of the manuscript.

Funding

This study was jointly funded by the National Natural Science Foundation of China (Grants Nos. 42001030, 41730751, and 41871059).

Data Availability Statement

Data sharing is not applicable to this article.

Acknowledgments

The authors would like to thank Zizhen Jin for providing and processing the glacier data.

Conflicts of Interest

The authors declare no conflict of interest.

References

  1. Berry, S.L.; Farquhar, G.D.; Roderick, M.L. Co-Evolution of Climate, Vegetation, Soil and Air. In Theory, Organization and Scale, Encyclopedia of Hydrological Sciences, 1; Blöschl, G., Sivapalan, M., Eds.; John Wiley & Sons: Hoboken, NJ, USA, 2005; pp. 177–192. [Google Scholar]
  2. Yang, Y.; Roderick, M.L.; Yang, D.; Wang, Z.; Ruan, F.; McVicar, T.R.; Zhang, S.; Beck, H.E. Streamflow stationarity in a changing world. Environ. Res. Lett. 2021, 16, 064096. [Google Scholar] [CrossRef]
  3. Liu, Q.; Yang, Y.; Liang, L.; Yan, D.; Wang, X.; Li, C.; Sun, T. Hydrological effects of the snow fraction and its ecohydrological explication within the Budyko framework. J. Hydrol. 2022, 610, 127813. [Google Scholar] [CrossRef]
  4. Chang, Y.; Ding, Y.; Zhang, S.; Qin, J.; Zhao, Q. Dynamics and environmental controls of evapotranspiration for typical alpine meadow in the northeastern Tibetan Plateau. J. Hydrol. 2022, 612, 128282. [Google Scholar] [CrossRef]
  5. Ning, T.; Li, Z.; Feng, Q.; Li, Z.; Qin, Y. Attribution of growing season evapotranspiration variability considering snowmelt and vegetation changes in the arid alpine basins. Hydrol. Earth Syst. Sci. 2021, 25, 3455–3469. [Google Scholar] [CrossRef]
  6. Liu, J.J.; Zhou, Z.H.; Yan, Z.Q.; Gong, J.G.; Jia, Y.W.; Xu, C.Y.; Wang, H. A new approach to separating the impacts of climate change and multiple human activities on water cycle processes based on a distributed hydrological model. J. Hydrol. 2019, 578, 124096. [Google Scholar] [CrossRef]
  7. Hu, J.; Ma, J.; Nie, C.; Xue, L.; Zhang, Y.; Ni, F.; Deng, Y.; Liu, J.; Zhou, D.; Li, L.; et al. Attribution analysis of runoff change in minTuo River basin based on SWAT model simulations, China. Sci. Rep. 2020, 10, 2900. [Google Scholar] [CrossRef] [Green Version]
  8. Van Loon, A.F.; Rangecroft, S.; Coxon, G.; Naranjo, J.A.B.; Van Ogtrop, F.; Van Lanen, H.A.J. Using paired catchments to quantify the human influence on hydrological droughts. Hydrol. Earth Syst. Sci. 2019, 23, 1725–1739. [Google Scholar] [CrossRef] [Green Version]
  9. Xu, X.Y.; Yang, D.W.; Yang, H.B.; Lei, H.M. Attribution analysis based on the Budyko hypothesis for detecting the dominant cause of runoff decline in Haihe basin. J. Hydrol. 2014, 510, 530–540. [Google Scholar] [CrossRef]
  10. Dey, P.; Mishra, A. Separating the impacts of climate change and human activities on streamflow: A review of methodologies and critical assumptions. J. Hydrol. 2017, 548, 278–290. [Google Scholar] [CrossRef]
  11. Li, Z.; Liu, W.Z.; Zhang, X.C.; Zheng, F.L. Impacts of land use change and climate variability on hydrology in an agricultural catchment on the Loess Plateau of China. J. Hydrol. 2009, 377, 35–42. [Google Scholar] [CrossRef]
  12. Kure, S.; Jang, S.; Ohara, N.; Kavvas, M.L.; Chen, Z.Q. Hydrologic impact of regional climate change for the snow-fed and glacier-fed river basins in the Republic of Tajikistan: Statistical downscaling of global climate model projections. Hydrol. Process. 2013, 27, 4071–4090. [Google Scholar] [CrossRef]
  13. Budyko, M.I.; Zubenok, L.I. Determination of evaporation from the land surface. Izv. Akad. SSSR. Ser. Geogr. 1961, 6, 3–17. (In Russian) [Google Scholar]
  14. Budyko, M.I. Climate and Life; Academic Press: New York, NY, USA, 1974. [Google Scholar]
  15. Greve, P.; Gudmundsson, L.; Orlowsky, B.; Seneviratne, S.I. A two-parameter Budyko function to represent conditions under which evapotranspiration exceeds precipitation. Hydrol. Earth Syst. Sci. 2016, 20, 2195–2205. [Google Scholar] [CrossRef] [Green Version]
  16. Wu, J.; Miao, C.; Wang, Y.; Duan, Q.; Zhang, X. Contribution analysis of the long-term changes in seasonal runoff on the loess plateau, China, using eight Budyko-based methods. J. Hydrol. 2017, 545, 263–275. [Google Scholar] [CrossRef]
  17. Lavenne, A.; Andréassian, V. Impact of climate seasonality on catchment yield: A parameterization for commonly-used water balance formulas. J. Hydrol. 2018, 558, 266–274. [Google Scholar] [CrossRef]
  18. Li, H.J.; Shi, C.X.; Zhang, Y.S.; Ning, T.T.; Sun, P.C.; Liu, X.F.; Ma, X.; Liu, W.; Collins, A.L. Using the Budyko hypothesis for detecting and attributing changes in runoff to climate and vegetation change in the soft sandstone area of the middle Yellow River basin, China. Sci. Total Environ. 2020, 703, 11. [Google Scholar] [CrossRef] [PubMed]
  19. Shen, Q.N.; Cong, Z.T.; Lei, H.M. Evaluating the impact of climate and underlying surface change on runoff within the Budyko framework: A study across 224 catchments in China. J. Hydrol. 2017, 554, 251–262. [Google Scholar] [CrossRef]
  20. Ning, T.; Li, Z.; Liu, W. Separating the impacts of climate change and land surface alteration on runoff reduction in the Jing River catchment of China. Catena 2017, 147, 80–86. [Google Scholar] [CrossRef]
  21. Yang, L.; Feng, Q.; Adamowski, J.; Alizadeh, M.; Yin, Z.; Wen, X.; Zhu, M. The role of climate change and vegetation greening on the variation of terrestrial evapotranspiration in northwest China’s Qilian Mountains. Sci. Total Environ. 2021, 759, 143532. [Google Scholar] [CrossRef]
  22. Choudhury, B.J. Evaluation of an empirical equation for annual evaporation using field observations and results from a biophysical model. J. Hydrol. 1999, 216, 99–110. [Google Scholar] [CrossRef]
  23. Fu, B. On the calculation of the evaporation from land surface. Sci. Atmos. Sin. 1981, 5, 23–31. (In Chinese) [Google Scholar]
  24. Zhang, L.; Dawes, W.R.; Walker, G.R. Response of mean annual evapotranspiration to vegetation changes at catchment scale. Water Resour. Res. 2001, 37, 701–708. [Google Scholar] [CrossRef]
  25. Wang, D.B.; Tang, Y. A one-parameter Budyko model for water balance captures emergent behavior in darwinian hydrologic models. Geophys. Res. Lett. 2014, 41, 4569–4577. [Google Scholar] [CrossRef] [Green Version]
  26. Saha, A.; Joseph, J.; Ghosh, S. Climate controls on the terrestrial water balance: Influence of aridity on the basin characteristics parameter in the Budyko framework. Sci. Total Environ. 2020, 739, 139863. [Google Scholar] [CrossRef] [PubMed]
  27. Li, S.; Wang, G.; Zhu, C.; Lu, J.; Ullah, W.; Hagan, D.; Kattel, G.; Peng, J. Attribution of global evapotranspiration trends based on the Budyko framework. Hydrol. Earth Syst. Sci. 2022, 26, 3691–3707. [Google Scholar] [CrossRef]
  28. Teuling, A.J.; de Badts, E.A.G.; Jansen, F.A.; Fuchs, R.; Buitink, J.; Hoek van Dijke, A.J.; Sterling, S.M. Climate change, reforestation/afforestation, and urbanization impacts on evapotranspiration and streamflow in Europe. Hydrol. Earth Syst. Sci. 2019, 23, 3631–3652. [Google Scholar] [CrossRef] [Green Version]
  29. Zeng, R.; Cai, X. Assessing the temporal variance of evapotranspiration considering climate and catchment storage factors. Adv. Water Resour. 2015, 79, 51–60. [Google Scholar] [CrossRef]
  30. Li, S.J.; Wang, G.J.; Sun, S.L.; Hagan, T.F.D.; Chen, T.X.; Dolman, H.; Liu, Y. Long-term changes in evapotranspiration over China and attribution to climatic drivers during 1980–2010. J. Hydrol. 2021, 595, 126037. [Google Scholar] [CrossRef]
  31. Berghuijs, W.R.; Woods, R.A.; Hrachowitz, M. A precipitation shift from snow towards rain leads to a decrease in streamflow. Nat. Clim. Change. 2014, 4, 583–586. [Google Scholar] [CrossRef] [Green Version]
  32. Zhang, D.; Cong, Z.; Ni, G.; Yang, D.; Hu, S. Effects of snow ratio on annual runoff within the Budyko framework. Hydrol. Earth Syst. Sci. 2015, 19, 1977–1992. [Google Scholar] [CrossRef] [Green Version]
  33. Xin, J.; Sun, X.; Liu, L.; Li, X.; Cheng, L.; Xu, Z. Quantifying the contribution of climate and underlying surface changes to alpine runoff alterations associated with glacier melting. Hydrol. Process. 2021, 35, e14069. [Google Scholar] [CrossRef]
  34. Bai, J.; Li, J.; Shi, H.; Liu, T.; Zhong, R. Snowmelt water alters the regime of runoff in the arid region of Northwest China. Water 2018, 10, 902. [Google Scholar] [CrossRef]
  35. Liu, S.; Wang, X.; Zhang, L.; Kong, W.; Gao, H.; Xiao, C. Effect of glaciers on the annual catchment water balance within Budyko framework. Adv. Climate Change Res. 2022, 13, 51–62. [Google Scholar] [CrossRef]
  36. Wang, T.; Yang, H.; Yang, D.; Qin, Y.; Wang, Y. Quantifying the streamflow response to frozen ground degradation in the source region of the Yellow River within the Budyko framework. J. Hydrol. 2018, 558, 301–313. [Google Scholar] [CrossRef]
  37. Saydi, M.; Tang, G.; Fang, H. Major controls on streamflow of the Glacierized Urumqi River Basin in the arid region of Northwest China. Water 2020, 12, 3062. [Google Scholar] [CrossRef]
  38. Yang, Z. Glacier meltwater runoff in China and its nourishment to river. Chin. Geogr. Sci. 1995, 5, 66–76. [Google Scholar] [CrossRef]
  39. Roger, G.B. The status of research on glaciers and global glacier recession: A review. Prog. Phys. Geogr. 2006, 30, 285–306. [Google Scholar]
  40. Fujita, K.; Ohta, T.; Ageta, Y. Characteristics and climatic sensitivities of runoff from a cold-type glacier on the Tibetan Plateau. Hydrol. Process. 2007, 21, 2882–2891. [Google Scholar] [CrossRef]
  41. Yao, T.D.; Qin, D.H.; Shen, Y.P.; Zhao, L.; Wang, N.L. Cryospheric changes and their impacts on regional water cycle and ecological conditions in the Qinghai Tibetan Plateau. Chinese J. Nature. 2013, 35, 179–186. [Google Scholar]
  42. Chang, Y.; Ding, Y.; Zhao, Q.; Zhang, S. Remote estimation of terrestrial evapotranspiration by Landsat 5 TM and the SEBAL model in cold and high-altitude regions: A case study of the upper reach of the Shule River Basin, China. Hydrol. Process. 2017, 31, 514–524. [Google Scholar] [CrossRef]
  43. Xu, M.; Kang, S.; Wang, X.; Pepin, N.; Wu, H. Understanding changes in the water budget driven by climate change in cryospheric-dominated watershed of the northeast Tibetan Plateau, China. Hydrol. Process. 2019, 33, 1040–1058. [Google Scholar] [CrossRef] [Green Version]
  44. Guo, W.; Liu, S.; Xu, J.; Wu, L.; Shangguan, D.; Yao, X.; Wei, J.; Bao, W.; Yu, P.; Liu, Q.; et al. The second Chinese glacier inventory: Data, methods and results. J. Glaciol. 2015, 61, 357–372. [Google Scholar] [CrossRef] [Green Version]
  45. Jin, Z.; Zhao, Q.; Qin, X.; Zhang, J.; Zhang, H.; Qin, J.; Qin, Y.; Li, H.; Chen, J.; Liu, Y.; et al. Quantifying the impact of landscape changes on hydrological variables in the alpine and cold region using hydrological model and remote sensing data. Hydrol. Process. 2021, 35, e14392. [Google Scholar] [CrossRef]
  46. Sheng, Y.; Li, J.; Wu, J.C.; Ye, B.S.; Wang, J. Distribution patterns of permafrost in the upper area of Shule River with the application of GIS technique. J. China Univ. Min. Tech. 2010, 39, 32–39. [Google Scholar]
  47. Muñoz-Sabater, J.; Dutra, E.; Agustí-Panareda, A.; Albergel, C.; Arduini, G.; Balsamo, G.; Boussetta, S.; Choulga, M.; Harrigan, S.; Hersbach, H.; et al. ERA5-Land: A state-of-the-art global reanalysis dataset for land applications. Earth Syst. Sci. Data. 2021, 13, 4349–4383. [Google Scholar] [CrossRef]
  48. Yilmaz, M. Accuracy assessment of temperature trends from ERA5 and ERA5-Land. Sci. Total Environ. 2023, 856, 159182. [Google Scholar] [CrossRef]
  49. Zhao, P.; He, Z. A first evaluation of ERA5-Land reanalysis temperature product over the Chinese Qilian Mountains. Front. Earth Sci. 2022, 10, 907730. [Google Scholar] [CrossRef]
  50. Xie, W.; Yi, S.; Leng, C.; Xia, D.; Li, M.; Zhong, Z.; Ye, J. The evaluation of IMERG and ERA5-Land daily precipitationover China with consideringthe influence of gauge data bias. Sci. Rep. 2022, 12, 8085. [Google Scholar] [CrossRef]
  51. Lu, W.; Tang, J.; Lu, C.; Lu, C.; Jia, Y.; Sun, Q.; He, X.; Zhang, X. Attribution analysis of the spatiotemporal variation in water balance in a typical semiarid basin in northern China. Hydrol. Processes. 2022, 36, e14651. [Google Scholar] [CrossRef]
  52. Hock, R. Glacier melt: A review of processes and their modelling. Prog. Phys. Geog. 2005, 29, 362–391. [Google Scholar] [CrossRef]
  53. Fu, B.P. On the calculation of evaporation from land surface in mountainous areas. Sci. Atmos. Sin. 1996, 16, 8. [Google Scholar]
  54. Yang, H.B.; Yang, D.W.; Lei, Z.D.; Sun, F.B. New analytical derivation of the mean annual water-energy balance equation. Water Resour. Res. 2008, 44, W03410. [Google Scholar] [CrossRef]
  55. Yang, H.B.; Qi, J.; Xu, X.Y.; Yang, D.W.; Lv, H.F. The regional variation in climate elasticity and climate contribution to runoff across China. J. Hydrol. 2014, 517, 607–616. [Google Scholar] [CrossRef]
  56. McCuen, R.H. A sensitivity and error analysis of procedures used for estimating evaporation. Water Resour. Bull. 1974, 10, 486–498. [Google Scholar] [CrossRef]
  57. Zhang, Y.; Guan, D.; Jin, C.; Wang, A.; Wu, J.; Yuan, F. Analysis of impacts of climate variability and human activity on streamflow for a river basin in Northeast China. J. Hydrol. 2011, 410, 239–247. [Google Scholar] [CrossRef]
  58. Zeng, S.; Zhan, C.; Sun, F.; Du, H.; Wang, F. Effects of climate change and human activities on surface runoff in the Luan River Basin. Adv. Meteorol. 2015, 2015, 740239. [Google Scholar] [CrossRef]
  59. Shi, G.; Gao, B. Attribution analysis of runoff change in the upper reaches of the Kaidu River basin based on a modified Budyko framework. Atmosphere 2022, 13, 1385. [Google Scholar] [CrossRef]
  60. McCrystall, M.R.; Stroeve, J.; Serreze, M.; Forbes, B.C.; Screen, J.A. New climate models reveal faster and larger increases in Arctic precipitation than previously projected. Nat. Commun. 2021, 12, 6765. [Google Scholar] [CrossRef]
  61. Zhang, Y.; Ma, N.; Park, H.; Walsh, J.E.; Zhang, K. Evaporation Processes and Changes over the Northern Regions. In Arctic Hydrology, Permafrost and Ecosystems; Yang, D., Kane, D.L., Eds.; Springer International Publishing: Cham, Switzerland, 2021; pp. 101–131. [Google Scholar]
  62. Huang, Q.W.; Ma, N.J.; Wang, P. Faster increase in evapotranspiration in permafrost-dominated basins in the warming Pan-Arctic. J. Hydrol. 2022, 615, 128678. [Google Scholar] [CrossRef]
  63. Wang, G.; Lin, S.; Hu, Z.; Lu, Y.; Sun, X.; Huang, K. Improving actual evapotranspiration estimation integrating energy consumption for ice phase change across the Tibetan Plateau. J. Geophys. Res. Atmos. 2020, 125, e2019JD031799. [Google Scholar] [CrossRef]
  64. Li, N.; Jia, L.; Lu, J. An improved algorithm to estimate the surface soil heat flux over a heterogeneous surface: A case study in the Heihe River Basin. Sci. China Earth Sci. 2015, 58, 1169–1181. [Google Scholar] [CrossRef]
  65. Kojima, Y.; Heitman, J.L.; Flerchinger, G.N.; Ren, T.; Horton, R. Sensible heat balance estimates of transient soil ice contents. Vadose Zone J. 2016, 15, 1–11. [Google Scholar] [CrossRef] [Green Version]
  66. Lin, Z.; Gao, Z.; Fan, X.; Niu, F.; Luo, J.; Yin, G.; Liu, M. Factors controlling near surface ground-ice characteristics in a region of warm permafrost, Beiluhe Basin, Qinghai-Tibet Plateau. Geoderma 2020, 376, 114540. [Google Scholar] [CrossRef]
Figure 1. Map of the upper reach of the Shule River Basin (URSRB).
Remotesensing 15 00558 g001
Figure 2. Temporal variations in annual (a) ET, (b) P, (c) ET0, and (d) ∆W during 1982–2015.
Remotesensing 15 00558 g002
Figure 3. Temporal variations in elasticity coefficients for (a) precipitation εP, (b) potential evapotranspiration εET0, (c) glacier change ε∆W and (d) landscape condition εw.
Remotesensing 15 00558 g003
Figure 4. Elasticity coefficients of ET to P, ET0, ∆W, and w.
Remotesensing 15 00558 g004
Figure 5. Contributions (a) and contribution rates (b) of the variation in P, ET0, ∆W, and w to ET variation.
Remotesensing 15 00558 g005
Figure 6. Relationships between annual ET/P and ET0/P in the original Budyko framework (a), and in the extended Budyko framework with glaciers (b).
Remotesensing 15 00558 g006
Figure 7. Contribution rate of the variation in P, ET0, and w to ET variation.
Remotesensing 15 00558 g007
Figure 8. Variations in controlling parameter w and NDVI (a); and relationship between w and NDVI (b) from 1982 to 2015.
Remotesensing 15 00558 g008
Disclaimer/Publisher’s Note: The statements, opinions and data contained in all publications are solely those of the individual author(s) and contributor(s) and not of MDPI and/or the editor(s). MDPI and/or the editor(s) disclaim responsibility for any injury to people or property resulting from any ideas, methods, instructions or products referred to in the content.

