Article

Mutual Interference Mitigation of Millimeter-Wave Radar Based on Variational Mode Decomposition and Signal Reconstruction

1
School of Electronic and Information Engineering, Beijing Jiaotong University, Beijing 100044, China
2
Beijing Institute of Radio Measurement, Beijing 100854, China
3
Institute for Integrated and Intelligent Systems, Griffith University, Nathan, QLD 4111, Australia
*
Author to whom correspondence should be addressed.
Remote Sens. 2023, 15(3), 557; https://doi.org/10.3390/rs15030557
Submission received: 2 December 2022 / Revised: 7 January 2023 / Accepted: 14 January 2023 / Published: 17 January 2023
(This article belongs to the Special Issue SAR-Based Signal Processing and Target Recognition)

Abstract

:
As an important remote sensing technology, millimeter-wave radar is used for environmental sensing in many fields due to its advantages of all-day, all-weather operation. With the increasing use of radars, inter-radar interference becomes increasingly critical. Severe mutual interference degrades radar signal quality and affects the performance of post-processing, e.g., synthetic aperture radar (SAR) imaging and target tracking. Aiming to deal with mutual interference, we propose an interference mitigation method based on variational mode decomposition (VMD). With the characteristics that the target is a single-frequency sine wave and the interference is a broadband signal, VMD is used for decomposing the radar received signal and separating the target from the interference. Interference mitigation is then implemented in each decomposed mode, and an interference-free signal is obtained through the reconstruction process. Simulation results of multi-target scenarios demonstrate that the proposed method outperforms existing decomposition-based methods. This conclusion is also confirmed by the experimental results on real data.

1. Introduction

With the development of information technology, many intelligent applications such as autonomous driving and intelligent transportation have been aroused. As the first step in environmental perception, sensor technology has received considerable attention. In long-distance sensing applications, radar has become irreplaceable due to its all-day and all-weather work ability [1]. In recent years, the manufacturing difficulty and cost of millimeter-wave (mmWave) radar have decreased with the development of chip technology [2,3,4], which has led to radar being widely used in many fields [5,6,7]. Along with the rapid growth in deployment number, interference between radars becomes non-negligible [8]. For example, a typical radar configuration for autonomous driving contains four short-range radars deployed at each corner of a vehicle, two mid-range radars at the front and back, and one long-range radar at the front [9]. This configuration makes mutual interference inevitable, especially in congested road conditions.
Mutual interference will seriously degrade radar performance and bring security risks to important radar applications such as synthetic aperture radar (SAR) imaging [10] and multiple target tracking. Specifically, the interference can cause false targets in radar echoes and raise noise level to reduce signal-to-noise rate (SNR), which affects target detecting or imaging performance [11,12]. Therefore, an effective interference suppression solution has become an urgent need for mmWave radar applications in recent years.
Some studies on the phenomenon of radar mutual interference have been proposed. The probability density function of interference is analyzed and the statistical similarity between interference and additive white Gaussian noise is explored in [13]. The results show that interference has a white-noise-like appearance in most cases, which raises the noise floor level. The phenomenon of radar mutual interference, such as characteristics in time domain, frequency domain, and time-frequency (TF) domain for different waveforms, is analyzed in [11,14,15,16]. The studies mentioned above allow us to understand the characteristics of radar mutual interference and provide a basis for subsequent radar interference suppression research.
In order to mitigate the impact of interference on radar target detection, signal processing approaches are investigated. Setting the interference area to zero is a straightforward approach to suppress interference in the time domain [17], while discontinuity is induced by zeroing in signals. Adding a cosine window to the interference area can avoid the discontinuity caused by zeroing [17]; however, target echoes of interest in interfered signal parts are lost. An autoregressive (AR) model is used for predicting the target information in the interfered parts [18]. This is able to recover target information when the interference duty cycle is small, but fails to obtain good performance in large interference duty cases. To improve the loss of useful information during interference mitigation, some studies turn to signal decomposition approaches [19,20], which first decompose radar-received signals to obtain decomposed modes, then detect and suppress interference in the decomposed modes, and finally reconstruct the received signal to obtain its interference-free version. These signal decomposition methods allow the useful information in the interference-free modes to be retained.
According to the conclusion that target echo and interference can be distinguished in the TF domain [21], interference mitigation methods based on TF analysis have received attention [22]. Experimental results show that TF-domain-based methods can locate interference position more accurately than time-domain-based methods. Nevertheless, TF domain methods need a large amount of storage and computation capacity since the area of interference information extraction is expanded from one dimension of the time domain to two dimensions of the TF domain, which is not suitable to real-time application. Therefore, it is necessary to further explore methods with a better effect but low storage and calculation burden.
On the basis of the above analysis, we investigated interference mitigation based on the signal decomposition technique since it has more flexibility of interference detection than time domain methods and less storage and computational burden than TF domain methods. In this work, a mutual interference mitigation method based on variational mode decomposition (VMD) is introduced. We show that targets in different distances are separated from the broadband interference based on the role of band-pass filter bank of VMD, and target echo in interfered area of decomposed modes can be reconstructed by AR model interpolation. As a result, the improvement of signal-to-interference ratio (SIR) can be realized via replacing the interference by a reconstructed signal. The reconstructed signal has a better interference mitigation effect especially in the multi-target scene.
Compared to the existing decomposition-based methods, this work mainly contributes as follows:
  • According to the broadband frequency characteristics of the interference, the VMD method with quasi-orthogonal decomposition characteristics can effectively decompose the interference energy into different decomposed modes, thus reducing the energy of the interference in each mode and helping to improve SIR through the interference mitigation process in decomposed modes.
  • With the narrowband characteristics of VMD, the linear frequency-modulated (LFM) like interference can be decomposed into sub-band components that have a limited time-support region. This is beneficial in interference detection and signal reconstruction.
  • For multi-target scenes, targets in different ranges can be separated into different decomposed modes based on the nature of narrowband filter banks of VMD. As a result, the number of targets in each mode can be reduced and signal reconstruction can be realized by the linear prediction model with low complexity.
The remainder of this paper is structured as follows. A review of related work and the research motivation of the proposed method are given in Section 2. The signal model of the mmWave radar with mutual interference is established in Section 3; then, the interference mitigation approach based on VMD is introduced in Section 4. The performance evaluation of the proposed method is discussed by simulations and real experiments in Section 5 and Section 6, respectively. Finally, the conclusions are given in Section 7.

2. Related Work and Research Motivation

When mutual interference occurs between mmWave radars, the interference typically appears as a short time component of higher energy in a received signal of a victim radar [11]. Locating and suppressing interference in the time domain can be achieved by zeroing or adding a window to interference. However, zeroing brings discontinuity of signals, which raises the noise level and affects target detection in a range profile (RP). Adding a window can relieve the discontinuity of signals, but still loses useful information in the overlapping part of the interference [17].
Considering the limitation of direct interference suppression in the time domain, a signal-decomposition-based approach is a promising method. For instance, empirical modal decomposition (EMD) has been used for radio frequency interference (RFI) suppression in high-frequency surface-wave radar [23,24], SAR [25], and microwave radiometry [26]. These studies decompose interfered signals by EMD, then process or suppress interference in different decomposed components, and finally obtain the interference-free signal by reconstruction process. The results of these studies demonstrate the effectiveness and potential of EMD in RFI suppression. Another signal decomposition approach based on wavelet technique is proposed in [20] to decompose radar received signal into layers of different resolution, then interference mitigation is achieved by wavelet reconstruction of those layers where the interference is removed.
Although the target information can be retained during interference mitigation by signal decomposition methods such as EMD and wavelet, the frequency characteristics of EMD and wavelet need to be reconsidered in mmWave radar interference mitigation applications.
A typical frequency-modulated continuous wave (FMCW) radar workflow for an interference scenario is shown in Figure 1. The radar signal goes through a total of three phases from transmitter to receiver as follows: a signal-transmitting phase, a target scattering and interference superimposing phase, and a signal-receiving phase. The radar workflow starts from the signal transmitting phase. The radar transmitting signal is generated by a waveform generator, and then amplified by a power amplifier (PA) and radiated into space by a radar transmitter antenna. In the target scattering and interference superimposing phase, when the radar signal encounters a target, it is scattered by the target and returns to the radar. Meanwhile, if there is an interfering signal, this interfering signal will also reach the radar. In this case, the target echo and the interference are superimposed to form a radar received signal. The radar workflow then enters the signal-receiving phase. The target echo and interference are received by the radar receiver antenna and amplified by a low-noise amplifier (LNA). After mixing with the reference signal generated by the waveform generator, a beat frequency signal is obtained. Finally, the digital signal is obtained after sampling by an analog-to-digital converter (ADC) to the beat frequency signal. Here, a low-pass filter (LPF) is used before the ADC in order to avoid aliasing during signal sampling.
The majority of radars currently operate in FMCW mode and the mixer of their receiver outputs a beat frequency signal, which is the difference between the received signal and the transmitted signal [8]. The range measurement is realized in the spectrum of the beat frequency signal, which is known as RP. In automotive radar or traffic radar application scenarios, targets may appear at different distances in front of the radar. Therefore, radar detection performance at different distances will be related to the frequency characteristics of EMD and wavelet decomposition.
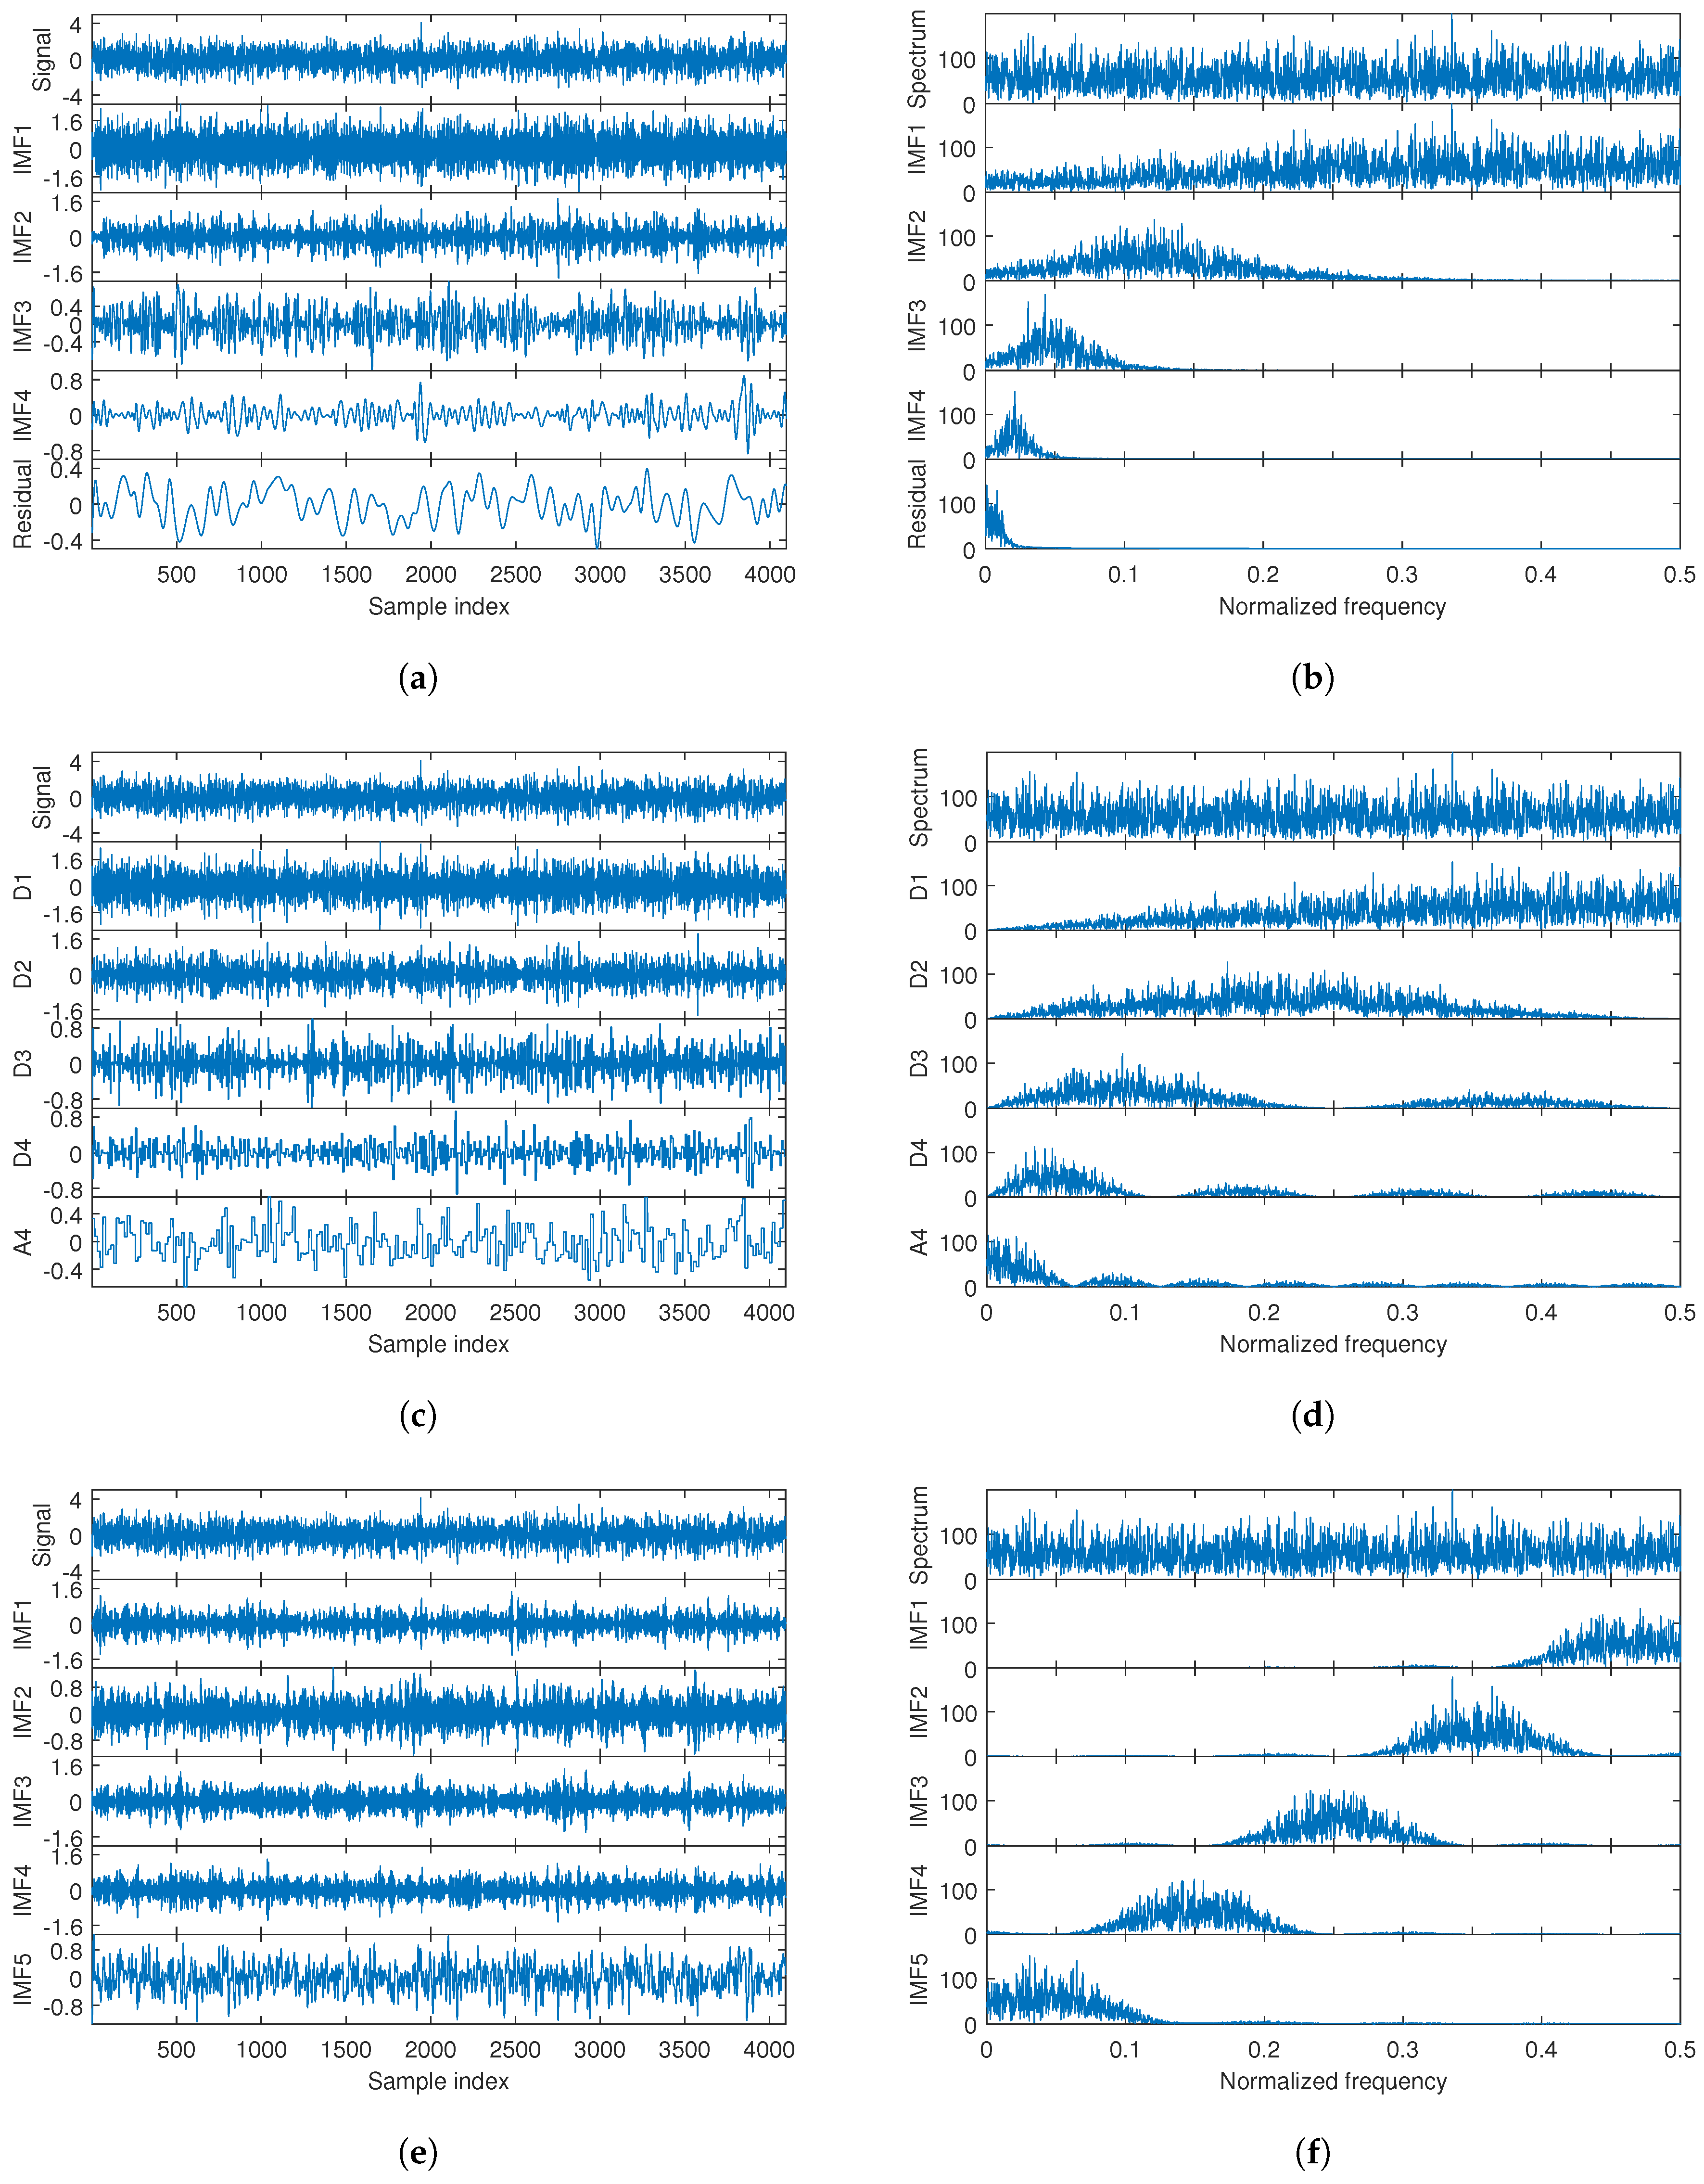
The decomposition results of a real−valued broadband white noise using different methods are shown in Figure 2, and the spectrum of each decomposed mode is also given. It is worth noting that millimeter wave radars have both real−valued and complex-valued sampling structures. Currently, most radar implementations use real−valued mixers and real−valued baseband and ADC chains. Part of the reason for this type of implementation is that the number of ADCs and variable gain amplifiers does not have to be doubled, thus gaining a cost advantage [27]. Therefore, the beat frequency signals discussed in this paper are real−valued signals. It can be seen that the frequency characteristics of EMD and wavelet are similar to a set of filter banks, where each decomposed mode occupies a frequency band that is roughly the upper half of the residuals of the previous mode [28,29], as shown in Figure 2b,d. The difference is that the highest band of the filter bank corresponding to EMD is determined by the highest frequency of a signal, while the highest band of the filter bank corresponding to the wavelet is predetermined and equal to the sampling frequency of a signal. These decomposition features indicate that the filter banks corresponding to EMD and wavelet do not divide frequency bands at equal intervals in the frequency domain. In mmWave radar applications, these decomposition features correspond to a non-uniform division of the radar detection range. This means that when broadband interference is present, the SIR of target echoes at different distances are different. In typical mmWave radar detection scenarios, such as vehicle detection on roads, the use of EMD or wavelet for echo decomposition will lead to different SIRs for vehicle echoes at different distances, resulting in different radar detection performance at different distances. Thus, a decomposition method that can provide similar SIR for targets at different distances is desired.
Recently, a new signal decomposition method, named VMD, has been proposed [30]. This decomposes a signal into a collection of band-limited intrinsic mode functions (IMF) with different center frequencies that are quasi-orthogonal to each other. Based on such characteristics, the broadband signal can be uniformly divided into multiple sub-bands in the frequency domain, as shown in Figure 2f. Corresponding to the radar scenario, the received signal is uniformly decomposed into different modes by distance. This allows the targets to have similar SIRs in different IMFs, thus making interference mitigation in different modes more efficient.
In summary, VMD has potential for interference mitigation in typical mmWaveu radar applications.

3. Signal Model with Mutual Interference

The most common signal used in mmWave radar is linear FMCW [8,31], which is also called chirp signal. In this work, the radar signal and interference are modeled for the FMCW system, and the interference mitigation technique for the FMCW system is discussed. The single LFM signal transmitted by radar is
s t ( t ) = 2 P t cos [ 2 π φ ( t ) ] = 2 P t cos 2 π f c + 1 2 k t t = 2 P t cos 2 π f c + 1 2 B T t t ,
where P t is the power of the transmitted signal, f c is the operating frequency of the radar, k is the slope of the chirp signal, B is the chirp sweep bandwidth, and T is the chirp duration time. When a target exists, the radar-transmitted signal will be scattered by the target, and the echo signal received by the radar is
s e ( t ) = 2 P e cos [ 2 π φ ( t τ ) ] ,
where τ is the time delay related to the range and velocity of the target and P e is the target echo power. According to the radar equation [32], the target echo power is
P e = P t G 2 λ 2 σ ( 4 π ) 3 R 4 ,
where λ is the wavelength, G is the antenna gain, σ is the target radar cross section (RCS), and R is the distance between the radar and the target. It should be noted that due to the two-way propagation of electromagnetic waves in space, the target echo power is inversely proportional to R 4 .
When mutual interference occurs, interference signal is usually emitted by a interferer radar. A typical interference signal is
s i ( t ) = 2 P i cos 2 π φ i t τ i = 2 P i cos 2 π f c i t τ i + 1 2 k i t τ i 2 ,
where P i , f c i and k i are the power, carrier frequency and chirp slope of interference, respectively. The interference power is
P i = P t i G i G λ 2 ( 4 π ) 2 R i 2 ,
where P t i and G i are the power of the transmitted signal and the antenna gain of the interferer radar, respectively. R i is the distance between the interferer radar and the victim radar. It should be noted that the propagation of electromagnetic waves is one-way in the interference case; thus, the interference power is inversely proportional to R i 2 . When the interferer and the target are located at the same distance, the interference power will be greater than the target echo power according to (3) and (5).
From (2) and (4), the target echo and the interference are received by radar, and the received signal is
s r ( t ) = s e ( t ) + s i ( t ) + ν ( t ) ,
where ν ( t ) is the radar receiver noise. From (1), (2), (4), and (6), the beat frequency signal in baseband can be obtained as
s b ( t ) = s t ( t ) · s r ( t ) = s t ( t ) · s e ( t ) + s i ( t ) + ν ( t ) = 2 P t cos [ 2 π φ ( t ) ] · { 2 P e cos [ 2 π φ ( t τ ) ] + 2 P i cos [ 2 π φ i ( t τ i ) ] } + ν ( t ) = 2 P t P e cos [ 2 π ( k τ ) t 2 π ( 1 2 k τ τ f c τ ) ] + 2 P t P i cos 2 π ( f c + 1 2 k t f c i + k i τ i 1 2 k i t ) t 2 π ( 1 2 k i τ i τ i f c i τ i ) + ν ( t ) .
From (7), the beat frequency corresponding to the target is f b = k τ and the beat frequency corresponding to the interference is f b i = f c f c i + k i τ i + 1 2 k k i t . It is worth noting that the beat frequency of interference is a LFM signal, which means the interference has a broadband spectrum in the frequency domain.
According to Figure 1, radar signal flow in an interfered condition can be described as follows: The signal is radiated into the environment through the transmitter, then scattered by the target and superimposed with the interference. At the end of the signal propagation, it reaches the radar and is received by the radar antenna. After mixing the received signal with the reference signal, a beat frequency signal can be obtained. Then, the beat frequency signal passes through an LPF before it is sampled by ADC. The function of the LPF is to prevent signal aliasing during analog-to-digital sampling. According to (7), the target echo after the dechirping process is a single-frequency sinusoid, while the interference shows LFM features after dechirping. For target echo, as long as its beat frequency is less than the cut-off frequency of LPF, the target information can be retained in the sampled digital signal. For interference, it becomes a broadband signal which occupies the whole frequency domain due to the LPF [15].
In a nutshell, after the dechirp process, the features of target echo and interference in the same distant are summarized as follows:
  • The target echo is a single-frequency and small-power sinusoid.
  • The interference is a broadband and large-power signal.

4. Interference Mitigation Method

In radar-received signals, target echo is a single-frequency component, while interference is a broadband signal. Therefore, in the spectrum of the received signal, the target is a spectral line and the interference is a broadband power signal that raises the noise floor [21]. Due to the characteristics of the target echo and the interference, we propose a interference mitigation method based on VMD. In this method, the received signal is decomposed by VMD to obtain subband signals, so that the broadband interference can be decomposed into different subbands, which reduces the interference power in each IMF, and therefore, interference mitigation can be performed in each IMF.

4.1. Introduction to Variational Mode Decomposition

VMD is an adaptive signal decomposition algorithm proposed in [30]. It is widely used in many fields due to its good adaptive decomposition characteristics [33,34,35]. A signal can be decomposed by VMD into an ensemble of band-limited IMFs, which have quasi-orthogonal property to each other. Essentially, VMD is a generalization of the classic Wiener filter into multiple, adaptive bands. Thus, we can obtain the decomposed IMFs for a given radar signal either exactly or in a least-squares sense. The narrow-band modes for a beat frequency signal can be obtained by solving the constrained variational problem as follows:
min { u m } , { ω m } m t δ ( t ) + j π t u m ( t ) e j ω m t 2 2 s . t . m u m ( t ) = s b ( t ) ,
where u m , m = 1 , , M and ω m , m = 1 , , M are the set of all modes and their center frequencies, respectively. There are three stages implemented for VMD in (8):
  • Firstly, for each mode u m , compute the associated analytic signal by using the Hilbert transform.
  • Secondly, for each mode u m , shift the mode’s frequency spectrum to baseband, by mixing with an exponential tuned to the respective estimated center frequency.
  • Finally, the bandwidth is estimated through the squared L 2 -norm of the gradient.
The variational problem in (8) can be converted to an unconstrained problem by introducing an augmented Lagrangian function L as follows:
L u m , ω m , β = α m t δ ( t ) + j π t u m ( t ) e j ω m t 2 2 + s b ( t ) m u m ( t ) 2 2 + β ( t ) , s b ( t ) m u m ( t ) ,
where α represents the variance of white noise and β is the Lagrange multiplier. Then, the unconstrained problem can be solved efficiently in a classical alternate direction method of multipliers (ADMM) approach, and the decomposition modes are extracted concurrently. In detail, the solution of (9) is the saddle point of the augmented Lagrangian L in a sequence of iterative sub-optimizations. At step n + 1 of the alternating update, the mode u m n + 1 , the center frequency ω m n + 1 of the current mode, and the Lagrange multiplier β n + 1 are:
u ^ m n + 1 ( ω ) = s ^ b ( ω ) i m u ^ i ( ω ) + β ^ ( ω ) 2 1 + 2 α ω ω m 2 ,
ω m n + 1 = 0 ω u ^ m ( ω ) 2 d ω 0 u ^ m ( ω ) 2 d ω ,
β ^ n + 1 ( ω ) β ^ n ( ω ) + γ s ^ b ( ω ) m u ^ m n + 1 ( ω ) ,
where u ^ m n + 1 , s ^ b and β ^ n + 1 are the Fourier transform corresponding to u m n + 1 , s b and β n + 1 , respectively. γ is the noise tolerance parameter. During the alternating update process, the bandwidth and centering frequency of each IMF mode are continuously updated until the iteration stop condition is satisfied as follows:
m u ^ m n + 1 u ^ m n 2 2 / u ^ m n 2 2 < ϵ ,
where ϵ is the convergence tolerance level.
After decomposition, the reconstruction of the beat frequency signal can be obtained from the summation of the IMFs, which is
s b ( t ) = m = 1 M u m ( t ) .
It is worth noting that the number of decomposition modes M is an important parameter of VMD, which affects the accuracy of the decomposition results. Studies to determine the number of decomposition modes have been proposed [36,37]. In the traffic-oriented interference mitigation, the determination of M can be based on existing methods; however, the following issues need to be considered. Since the spectrum of the radar beat frequency signal represents the RP, a reasonable value of M can be determined first by existing methods, and then a further correction of M is needed to fit the traffic scenario. The goal of the correction is to divide the radar detection range into suitable range subsections to ensure that the number of targets in each range section is not too large, which helps us to simplify the order of the subsequent linear prediction model.

4.2. Interference Mitigation Realization

For the mutual interference mitigation of mmWave radars, assuming that there are multiple targets, without loss of generality, we consider that targets are evenly distributed over the radar detection range, and target echoes are the superposition of multiple sinusoids. Since the spectrum of beat frequency signal is the RP, targets with different distances are located at different frequency bins, and a high frequency corresponds to a far distance. Unlike the targets, the power of interference distributes over the entire frequency domain and behaves like broadband noise.
Based on the different characteristics of target echo and interference in the frequency domain, VMD is used for decomposing radar-received signal into narrowband modes. Due to the quasi-orthogonal property of VMD, it ensure that targets of different range are assigned to different modes, and the interference power is also divided into these narrowband modes. As a result, the number of targets reduces in each decomposed mode, and the band width of interference is limited in each mode simultaneously. In these cases, signal power is preserved while the interference power is reduced in each mode, and thus, SIR is improved. This is beneficial for performing interference suppression and signal recovery.
After decomposition by VMD, interference can be located in the time domain for each IMF mode and suppressed by zeroing; then, the target echo signal in an interfered area can be recovered by linear interpolation, which can retain more information about the target. Usually, the interpolation can be realized by a linear prediction problem defined as
u ( t ) = i = 1 Q ϕ i u ( t i ) + ε t ,
where Q is the model order, ϕ i is the prediction coefficient and ε t is the residual. The AR model is a commonly used approach to solve the linear prediction problem, and the key point of the solution is to determine its order Q. Studies have shown that when the signal is the summation of N sinusoids, the prediction in (15) can be uniquely achieved by 2 N samples, i.e., Q = 2 N [38,39]. Corresponding to mmWave radar applications, the order Q of the linear model is related to the number of targets N in received signal.
It is worth noting that the order Q is not easy to determine in practice since the number of targets N is unknown, especially when the target number is large, e.g., in a congested traffic environment. In addition, an AR model of a large order will be sensitive to noise, which affects the quality of signal recovery. Therefore, it is necessary to reduce the number of targets to ensure that the AR model has lower order and is more robust to noise. From the decomposition characteristics of VMD as shown in Figure 2f, VMD has the ability to divide radar detection range into IMF modes uniformly, which will help to reduce the number of targets in each IMF. In this sense, VMD is suitable for the signal recovery in the linear prediction model as shown in (15).
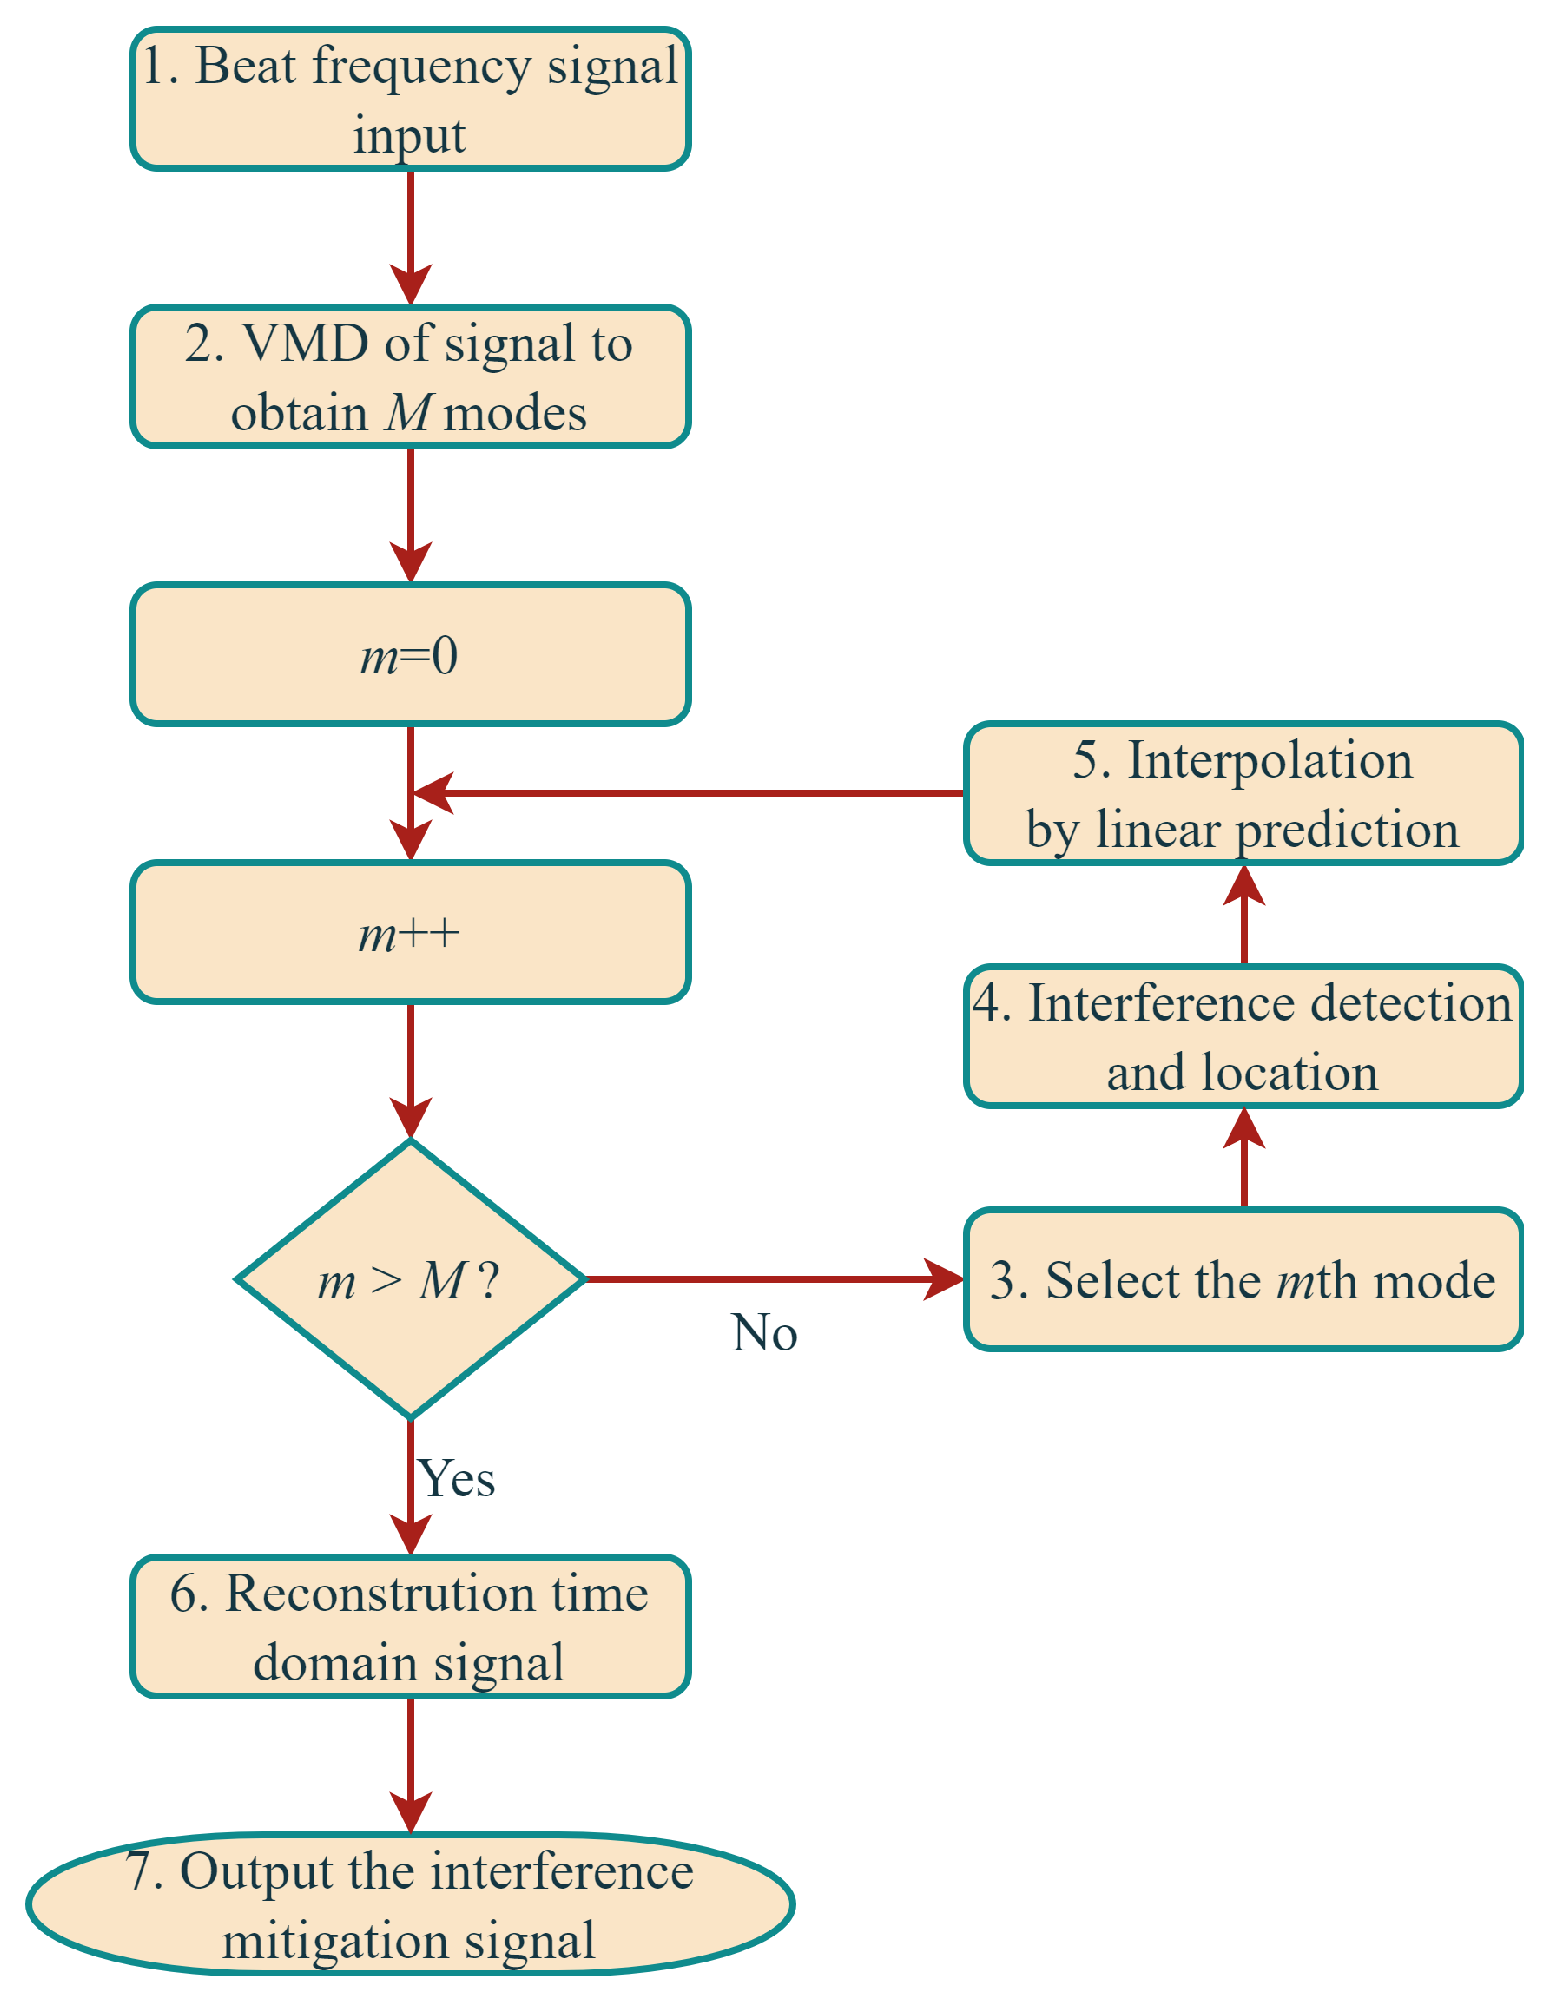
In summary, the interference mitigation algorithm flow is shown in Figure 3. The algorithm steps are identified numerically in the figure, and the details of the corresponding signal processing steps are described as follows:
  • Signal input step.
    The received signal with interference is dechirped in the radar receiver to obtain the beat frequency signal, and the beat frequency signal is the input of the interference mitigation algorithm.
  • Signal decomposition step.
    VMD is used to obtain the narrowband modes of the beat frequency signal. There are total M modes.
  • Mode selection step.
    Interference mitigation is performed on each decomposed mode. For one interference mitigation process, a decomposed mode needs to be selected.
  • Interference detection and location step.
    For each mode, the interference is detected and located by means of a constant false alarm rate (CFAR) detector [40].
  • Signal recovery step.
    Based on the results of interference location, the signal at the interference points is removed and replaced by interpolation values via an AR model as shown in (15) in each mode.
  • Signal reconstruction step.
    Repeat steps 3 to 5 until all modes have been processed. Then, the beat frequency signal is reconstructed according to (14) to obtain an interference-free time domain signal.
  • Signal output step.
    The interference-free signal is output and will be used as input for subsequent radar signal processing.

5. Numerical Simulation Results

5.1. Simulation Description

A multi-target scene is simulated to evaluate the performance of the proposed method. In the multi-target scene, a total of ten targets with different ranges and velocities are simulated. Specifically, the targets are evenly distributed in the range of 90 m to 900 m at a spacing of 90 m. The targets information of the simulation are shown in Table 1.
Considering that an automobile radar scenario is simulated in the experiment, a 77 GHz frequency band is used for simulation. Two interferer radars are configured with different modulation directions and slopes compares to the victim radar, as shown in Table 2. In this simulation, real−valued mixers and real−valued baseband and ADC chains are employed. In terms of the radar system signal flow as shown in Figure 1, the signals are analog until the ADC sampling; thus, we used a high sampling frequency, i.e., 2 GHz, to simulate the analog signal. In the simulation implementation, a complete process of radar signal transmitting, target interaction, interference superposition and signal receiving is simulated. In detail, the target echoes are generated according to (2) and (3) based on the range and speed of the targets as shown in Table 1. Meanwhile, the interference signals are generated according to (4) and (5) based on the parameters of the interferer radars as shown in Table 2. Then, the target echoes and interference signals are superposed according to (6), and the mixing process with the reference signal is performed according to (7). Finally, the sampling process of the ADC is simulated using the intermediate frequency (IF) as shown in Table 2, and the sampled beat frequency signal is obtained.
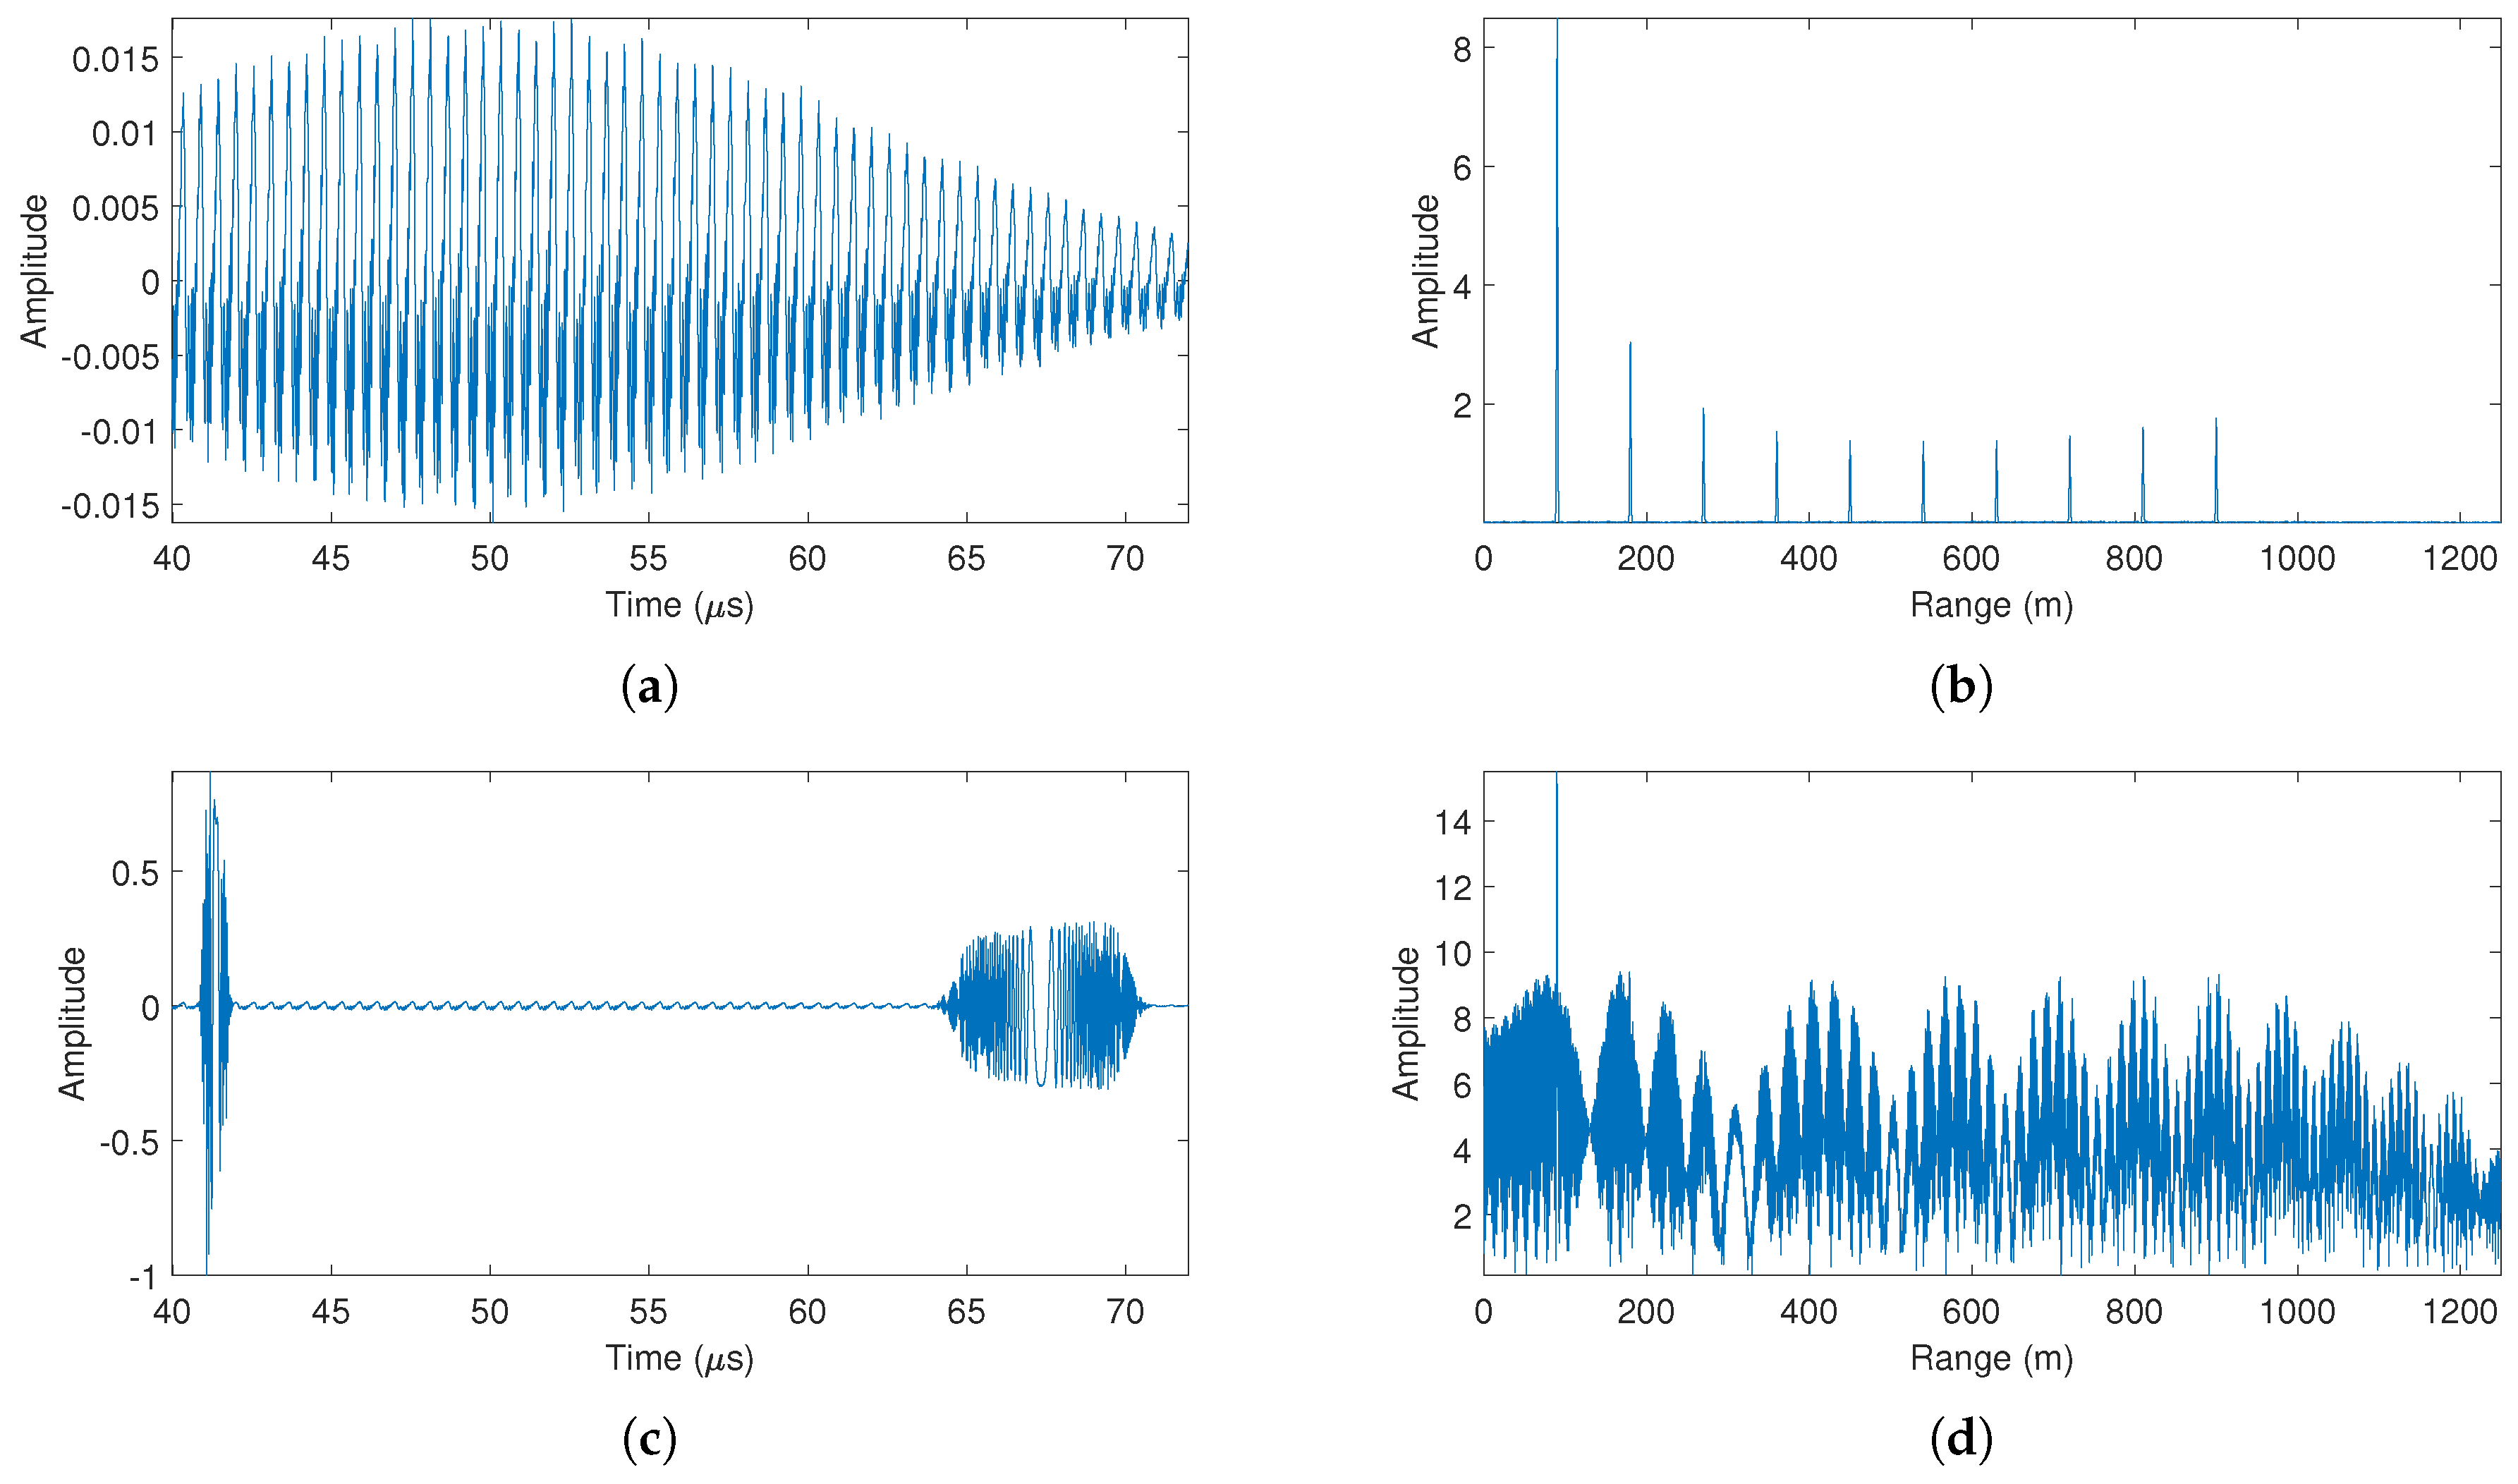
The simulated signals of targets are shown in Figure 4. Comparing the time domain signatures before and after adding interference to target echoes as shown in Figure 4a,c, the interference presents larger power at different time segments. In the range domain as shown in Figure 4b,d, the interference presents as a broadband power component. Since the power of the interference is larger than that of the target echo, the interference significantly increases the noise level in the RP, and all targets are invisible in the RP except for the first strong one. In this case, the detection performance of targets is degraded.

5.2. Performance Evaluation Methodology

A mmWave radar operating in FMCW mode usually transmits chirp sequences for sensing the environment. In radar signal processing, the received chirp sequence is applied with two-dimensional (2D) fast Fourier transform (FFT) to obtain the corresponding range and velocity information [5]. The first FFT is the range FFT, which is performed on the sampling points of each chirp. The range FFT finds the RP, which reflects the distribution of the targets on the range domain. The second FFT is the Doppler FFT, which is based on the range FFT and is processed at different chirps. The Doppler FFT obtains the velocity profile of the targets, which reflects the velocity distribution of the targets at a specific range. After 2D FFT, the range-Doppler (RD) response of the radar signal can be obtained, and the RD response reflects the distribution of the targets in the joint range-velocity plane.
In carrying out interference mitigation performance evaluation, one-dimensional (1D) evaluation and 2D evaluation are employed in this work. In the 1D evaluation, the main purpose is to evaluate interference mitigation performance in both the time domain and range domain for a single chirp. Based on the 1D evaluation, the 2D evaluation mainly evaluates the role of interference mitigation on radar velocity measurement.
For 1D evaluation, evaluation in the time domain aims to describe the degree of interference suppression, and evaluation in the range domain focuses on the improvement of target detection ability. In order to quantify the performance, one time-domain metric and one range-domain metric are adopted. The time-domain metric is the signal to interference plus noise ratio (SINR), which is defined as
SIN R = 10 × log 10 s e 2 s e s r e c 2 ,
where s e is the true value of target echo and s r e c is the reconstructed counterpart of s e . SINR is used for measuring the suppressed degree of interference in the time domain.
The RP metric is integrated sidelobe ratio (ISLR) [41,42]. The calculation of ISLR is slightly modified in this paper in order to suit for multi-target situation. In detail, a neighborhood RP of a specific target is extracted to calculate the modified ISLR (MISLR) of the target. For a specific target, the MISLR is defined as
MISLR = 10 × log 10 m = c a F 2 ( m ) + m = b d F 2 ( m ) m = a b F 2 ( m ) ,
where F is the spectrum of s r e c , the interval [ a , b ] bounds the main lobe and the interval [ c , d ] bounds the neighborhood of the target. A smaller MISLR value indicates a better performance of target detection, since the MISLR describes the ratio between the energy of neighborhood sidelobes with respect to the energy of the main lobe. For practical implementation, we recommend that the neighborhood can be selected as at least 5 times the width of the main lobe in order to have more adequate sample points to estimate the sidelobe level; i.e., the length of [ c , d ] is at least 5 times the length of [ a , b ] .

5.3. Simulation Results

Two decomposition-based methods are utilized for performance comparison, including an EMD-based method [24] and wavelet-based method [20]. In this experiment, Haar basis is employed for the wavelet decomposition. In implementing interference mitigation by the proposed method, the number of decomposition modes of the VMD is set to 5, which means that the detection range of the radar of 1200 m is divided into five sub-range segments, each of which is about 240 m. In the interference detection of each mode, a cell-averaging CFAR (CA-CFAR) detector is used, where the guard cell number is set to 2 times the number of main lobe sampling points and the training cell number is set to 10 times the number of main lobe sampling points.
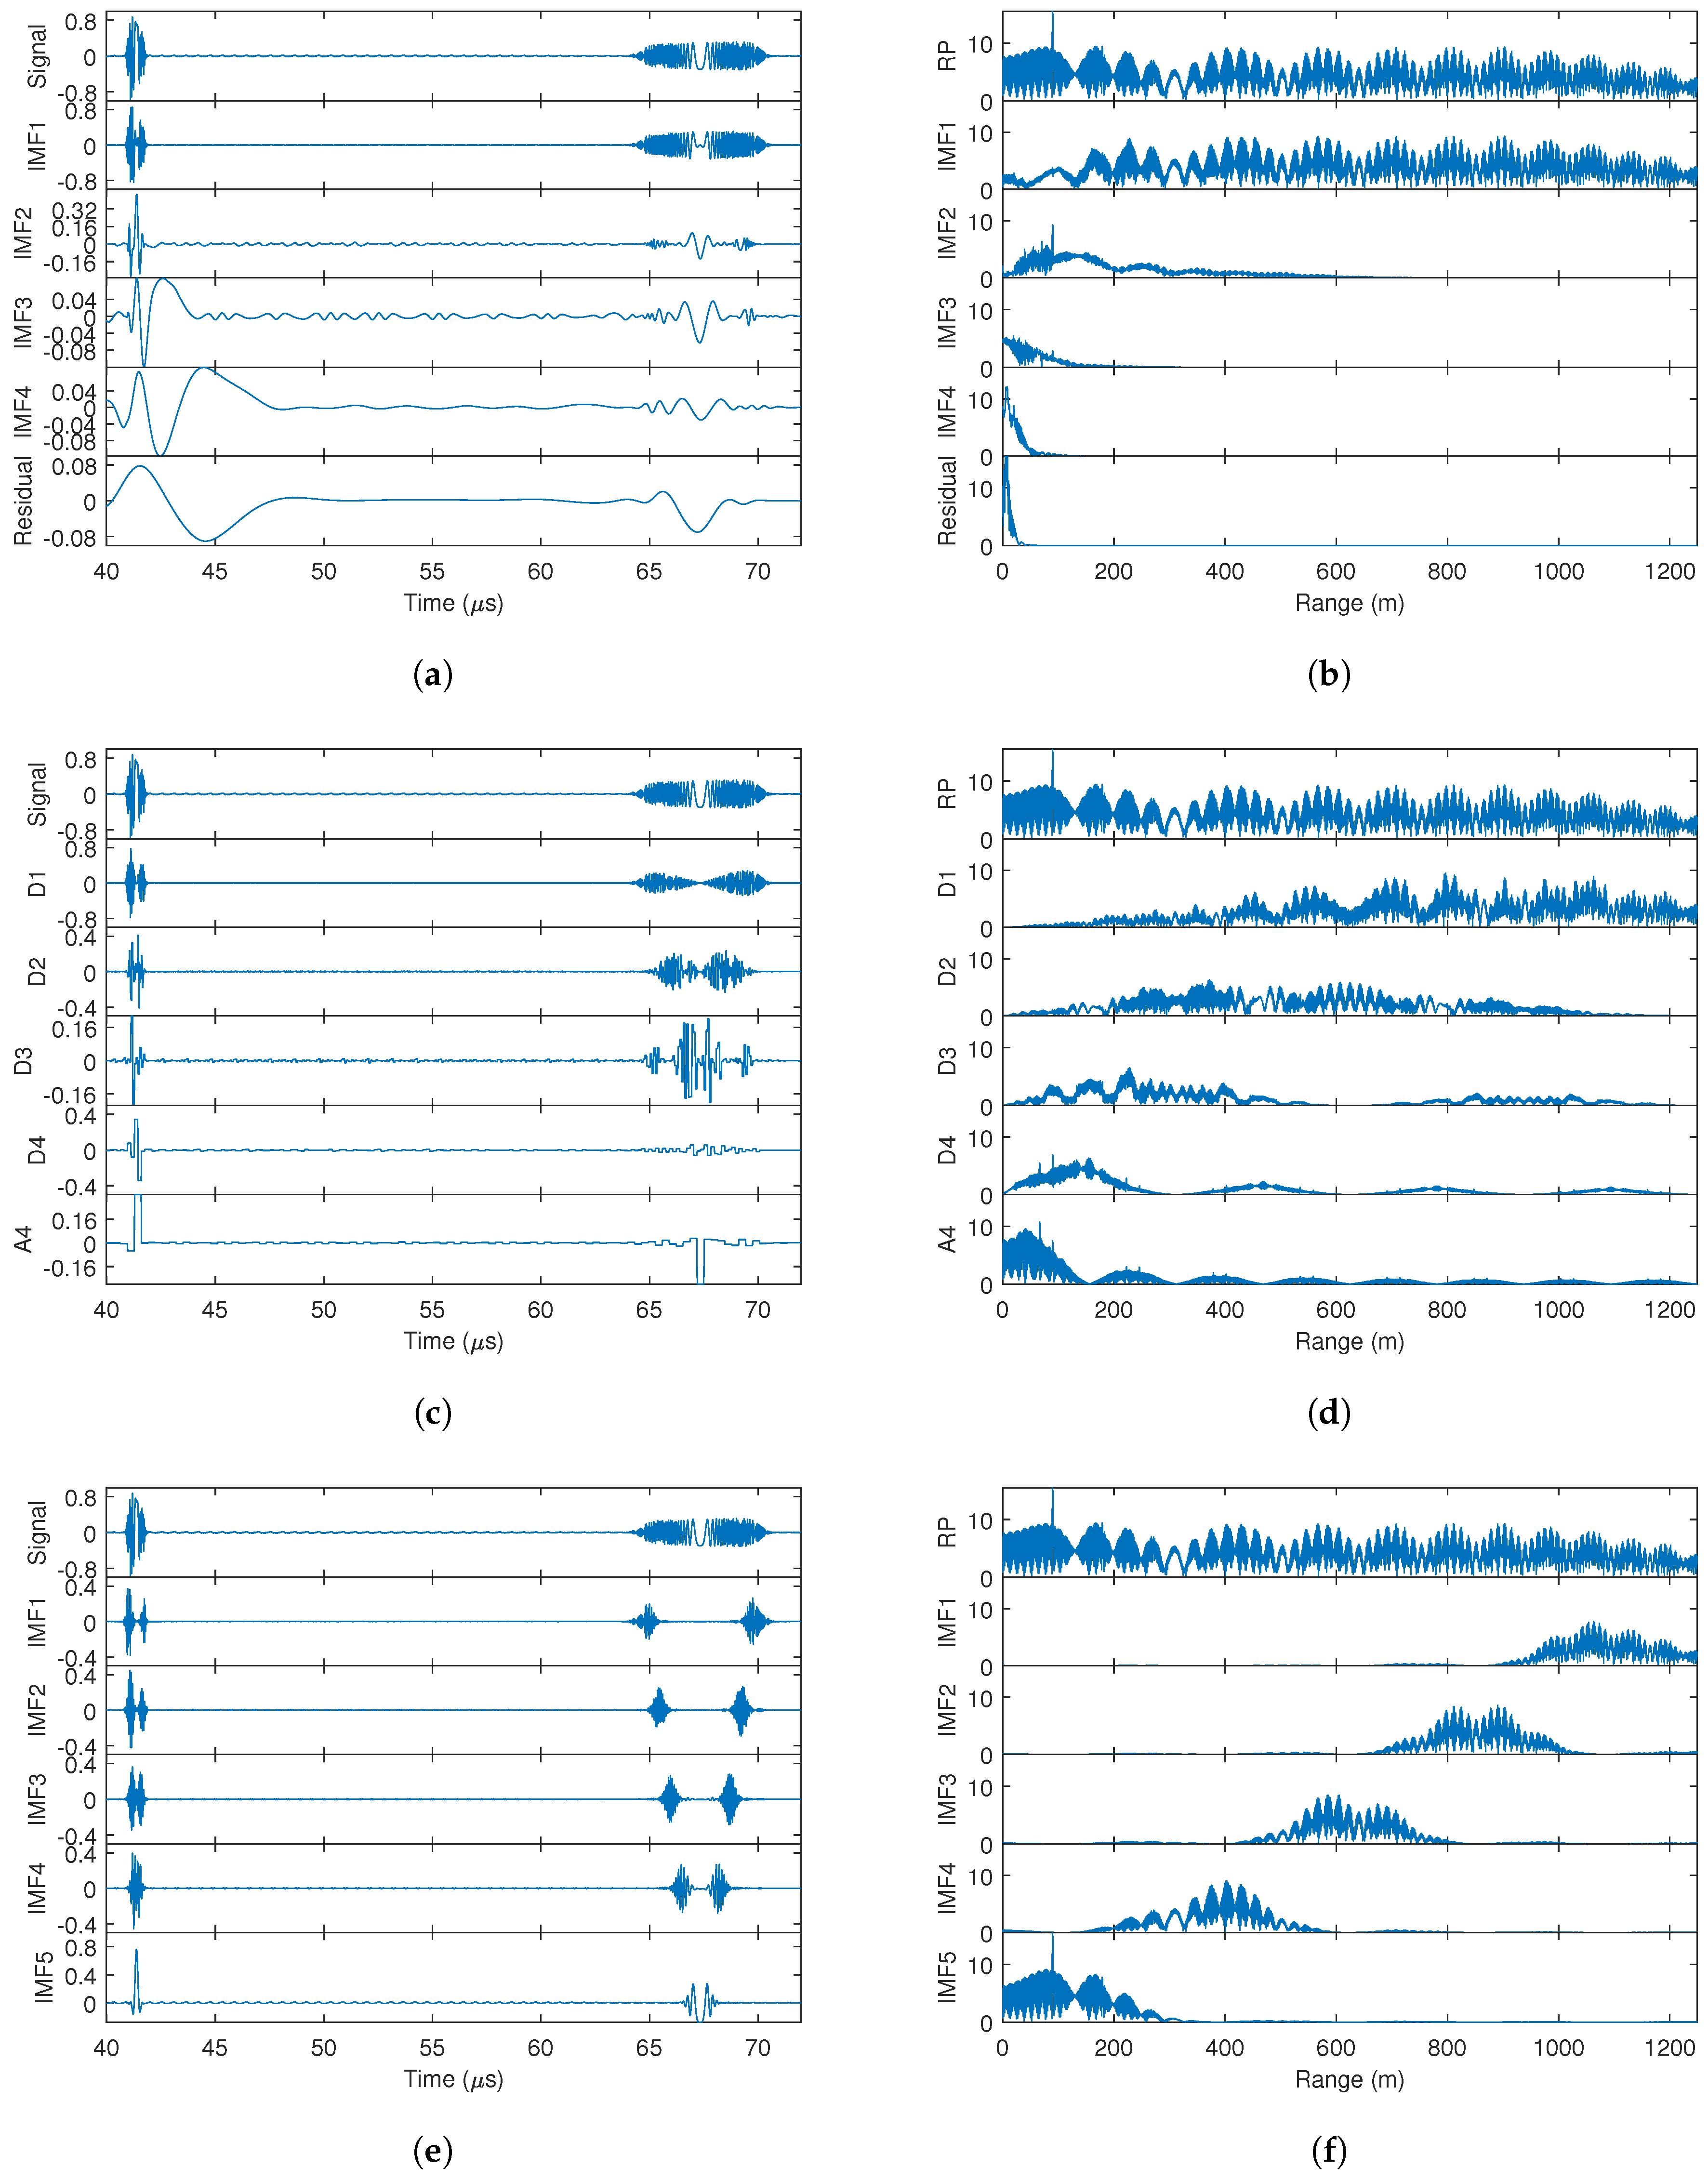
The decomposition results of EMD, wavelet and VMD for simulated signals are shown in Figure 5. In total, five modes are specified in the implementation of different methods. For EMD, there are four IMFs and a residual as shown in Figure 5a,b to represent the decomposition results in the time domain and RP, respectively. Correspondingly, the results of wavelet decomposition are shown in Figure 5c,d: there are four detail modes and one approximate modes. The results of VMD are shown in Figure 5e,f: there are five IMFs.
The analysis of the decomposition results in the time domain and RP are described as follows:
  • Results of EMD.
    It can be seen from the decomposition results of the RP that IMF1 contains most of the frequency components, as shown in Figure 5b. Although IMF2 occupies about half of the low-frequency band, there is still a large frequency overlap between IMF1 and IMF2. This decomposition feature makes the interference components and most of the target echoes to be contained in IMF1. The decomposition results in the time domain also show that the waveform of IMF1 is similar to the original signal. In this case, the interference mitigation based on EMD does not gain benefit in the decomposition process.
  • Results of wavelet.
    The wavelet decomposition results are similar to those of EMD, where most of the interference and target echo components are decomposed into Detail 1 and Detail 2 signals, as shown in Figure 5c,d. This also makes it impossible to obtain better interference mitigation based on this decomposition result.
  • Results of VMD.
    Based on the quasi-orthogonal and band-limited decomposition characteristics of VMD, the interfered echo signal is decomposed to obtain approximately uniform range sections in RP, as shown in Figure 5f. Such decomposition brings two benefits: the first benefit is that the interference power is uniformly decomposed into different IMFs. According to (7), the interference is characterized as an LFM signal in the beat frequency signal. When the interference is decomposed into different narrowband IMFs, it is correspondingly decomposed into different time segments in the time domain, as shown in Figure 5e. The second benefit is that targets at different distances are uniformly decomposed into different IMFs, and each target is basically decomposed into a unique IMF due to the quasi-orthogonality of VMD. As a result of the above benefits, the support area of the interference in time domain becomes smaller for each IMF, which contributes to the computational reduction in the linear prediction model. In addition, the number of targets in each IMF is reduced, which contributes to the reconstruction of target echoes by using a lower-order model.
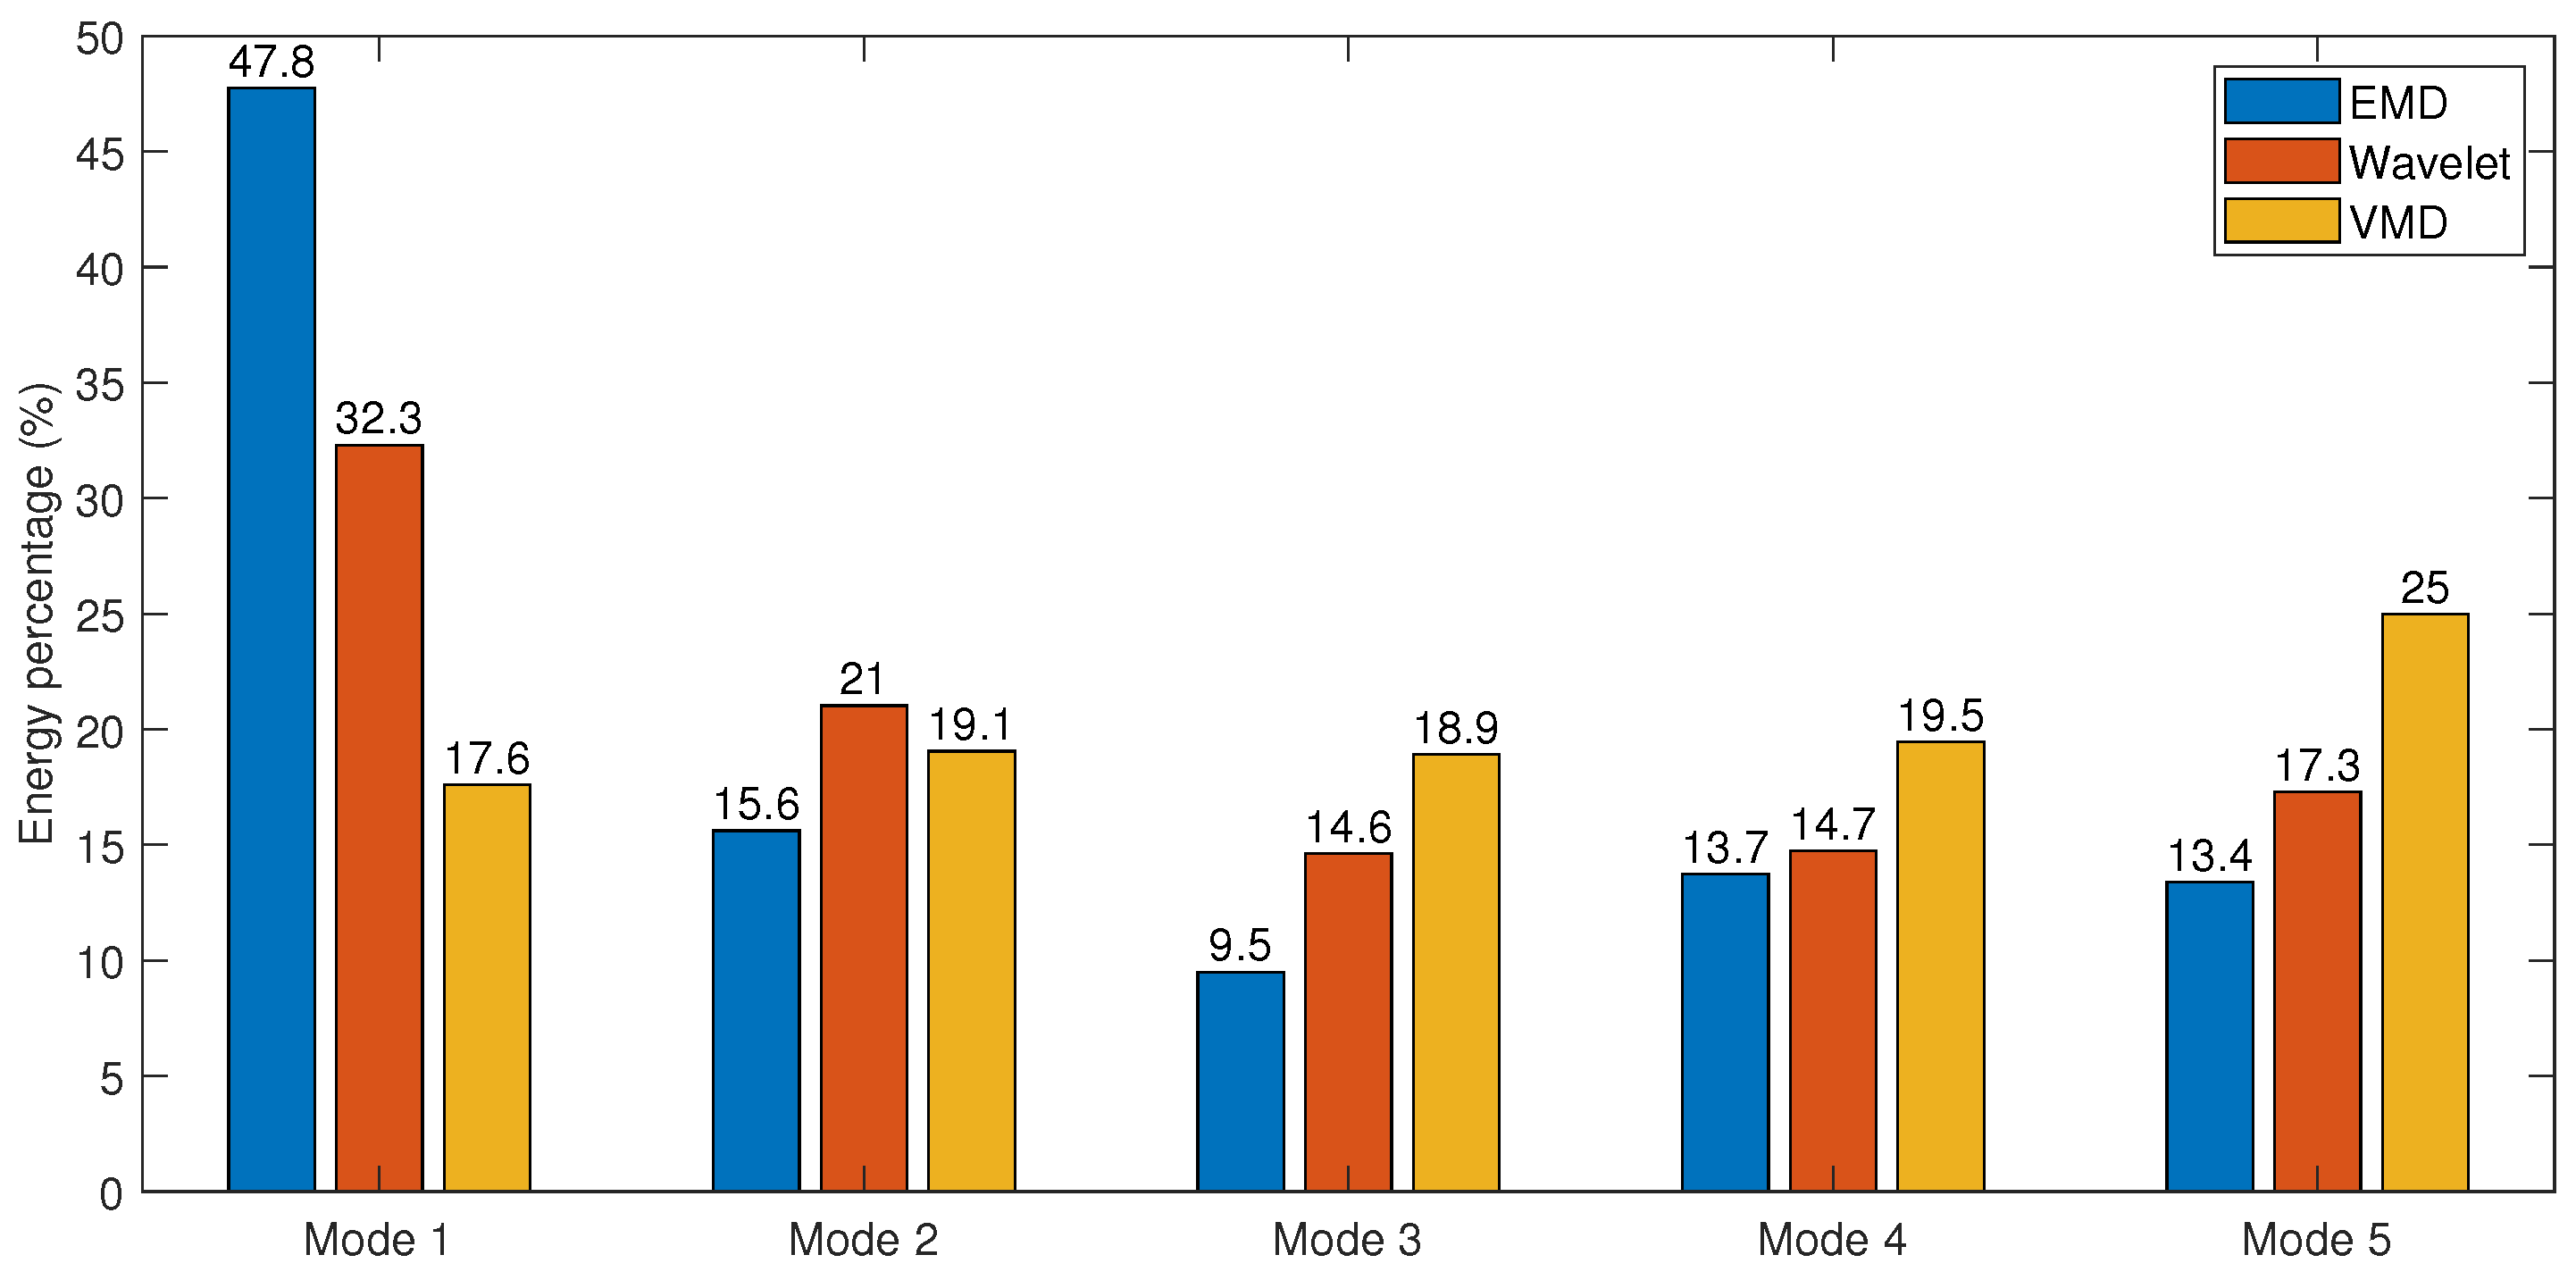
The energy percentage of the decomposition modes for each method is counted, as shown in Figure 6. It can be seen that VMD has the most balanced decomposition results among the three methods, where each mode has a similar energy percentage. Thus, it is more suitable for the interference mitigation application of mmWave radars.
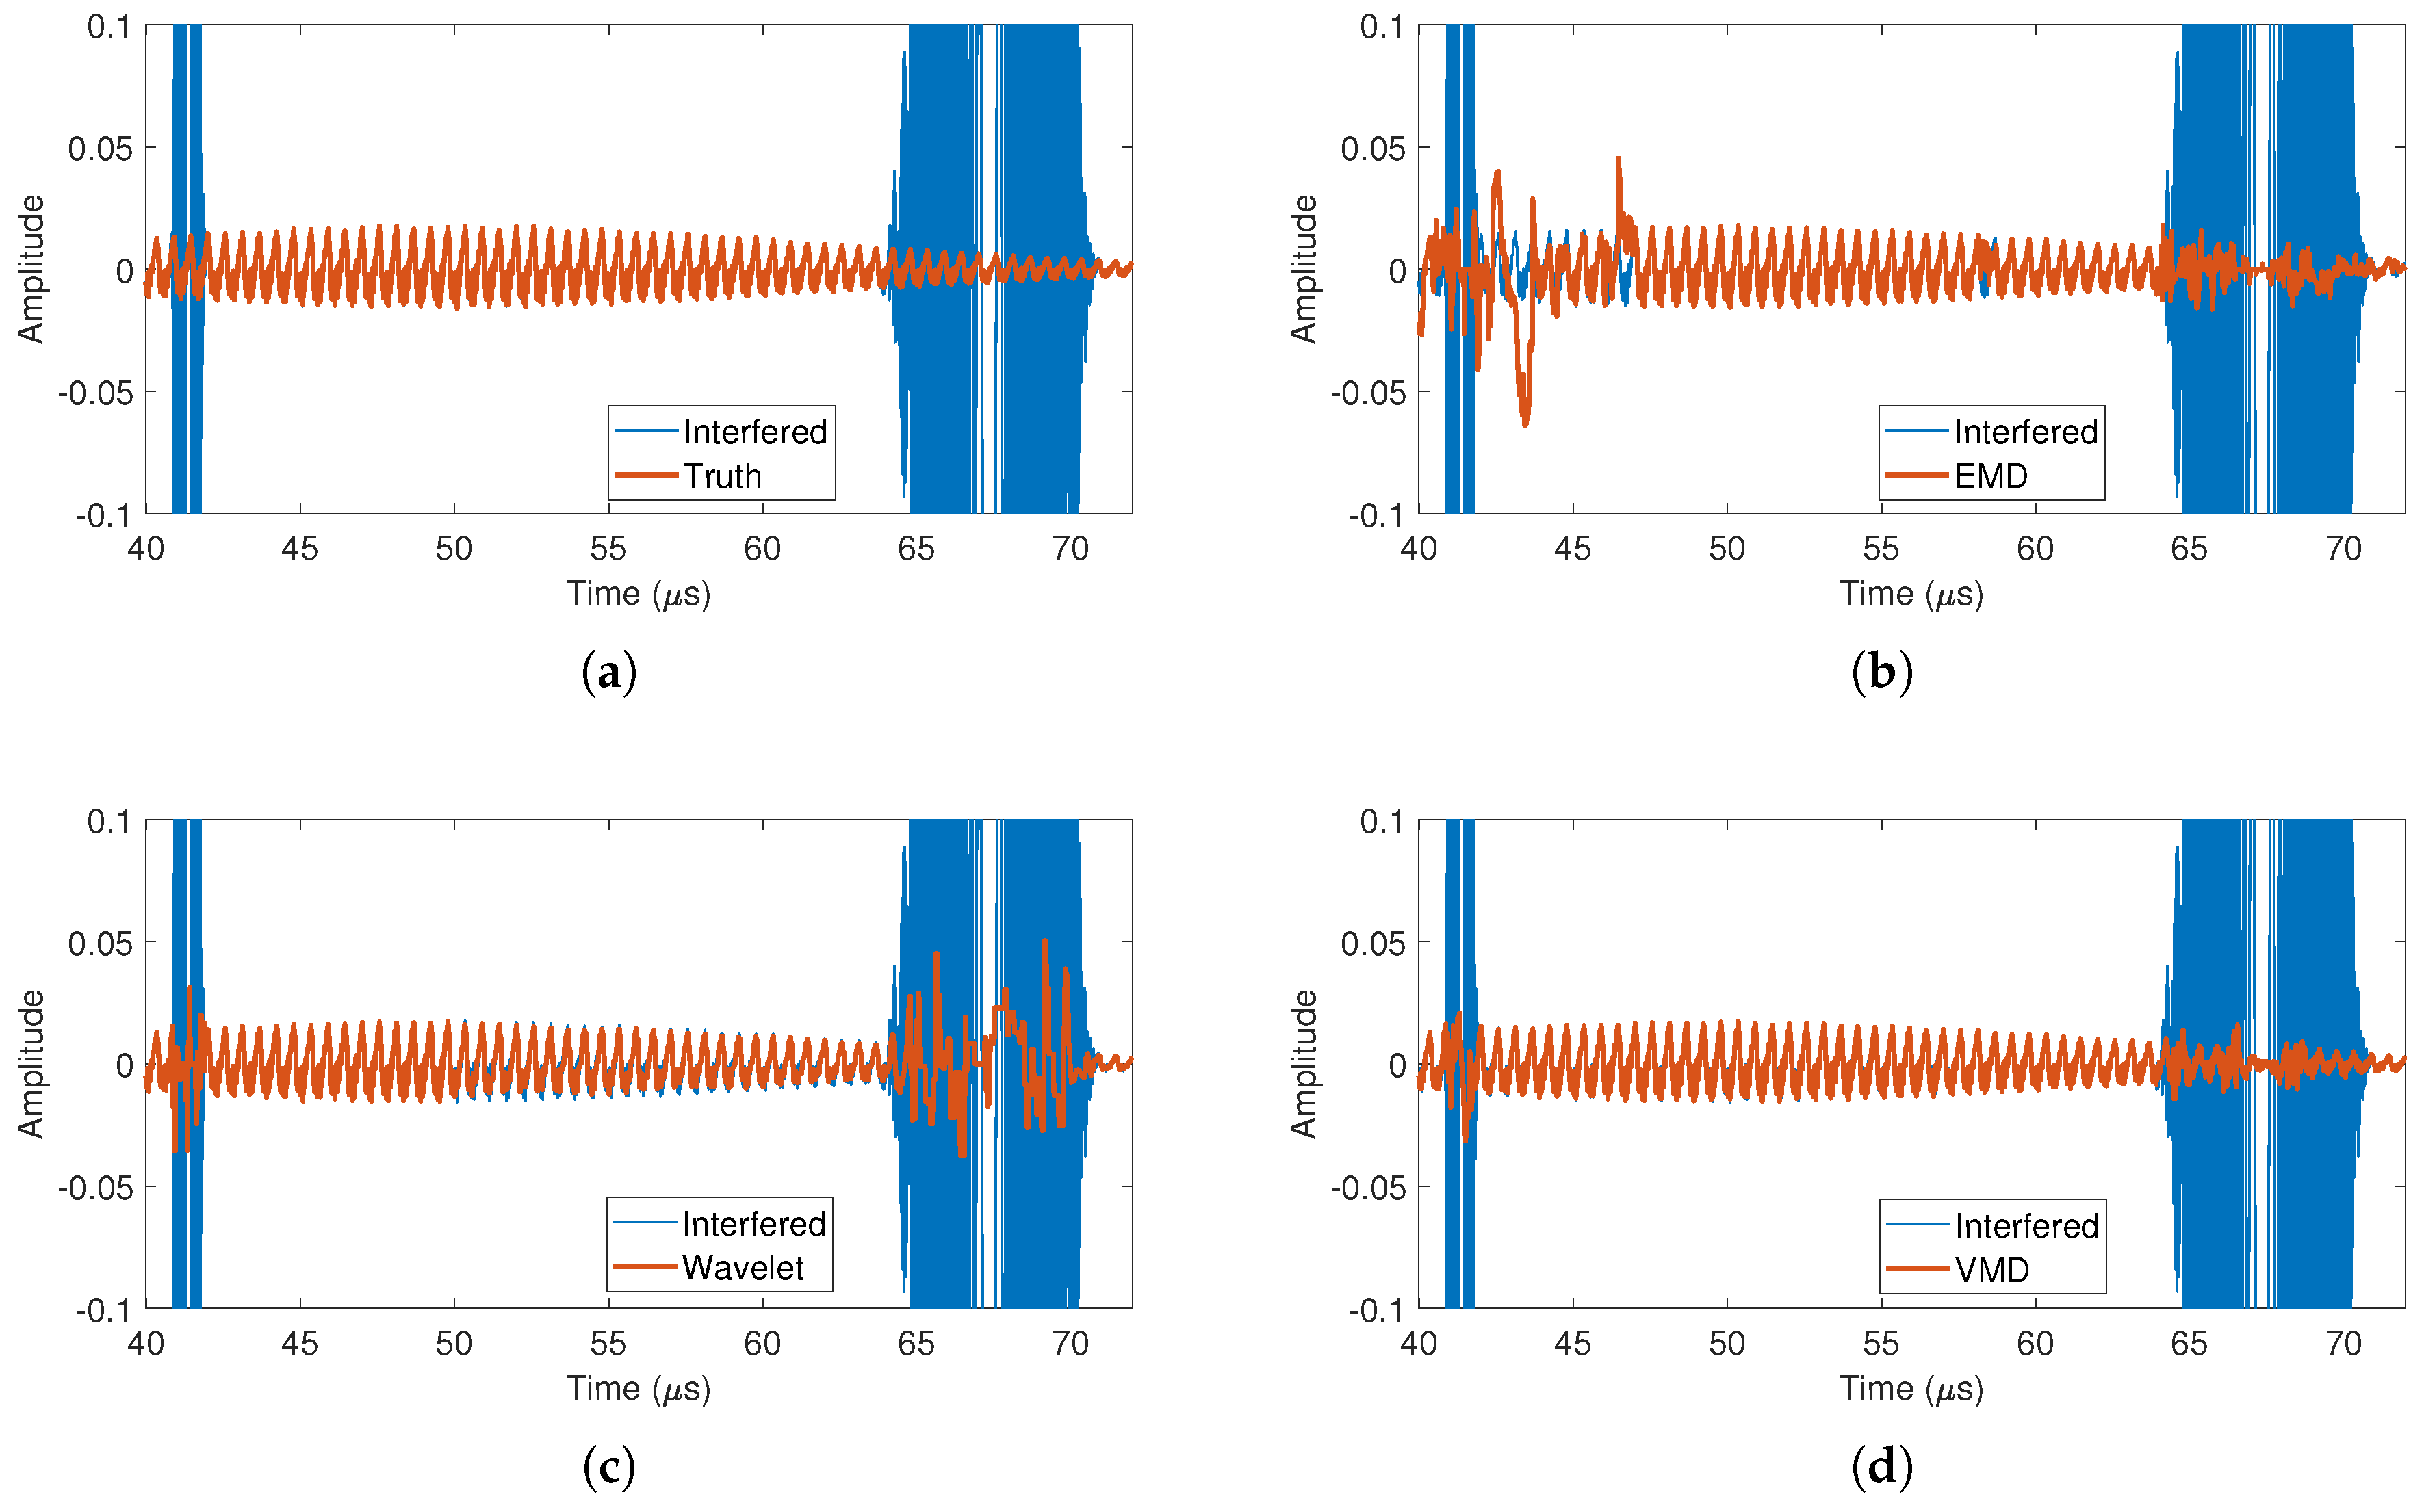
The interference mitigation performance of all the tested methods in the time domain is shown in Figure 7. Among these results, the EMD and wavelet methods result in the interference energy being concentrated in a few decomposed modes due to the inhomogeneity of the interference decomposition. Interference mitigation in these modes is not much improved compared to the interference mitigation in the original signal. This leads to limitations in interference localization and suppression. Compared with the EMD and wavelet methods, the VMD method decomposes the interference into different time segments and spreads the interference energy into different decomposed modes, which makes the interference reduced in both the support domain and power for a mode relative to the original signal, and then the localization and suppression of interference for each mode can obtain the benefits from the decomposition. Therefore, the VMD method obtains the best interference suppression and target reconstruction effect.
The quantitative evaluation results of interference mitigation for the tested methods in the time domain are shown in Figure 8. The corresponding SINR is calculated after interference mitigation using different methods, and the original SINR level is given as a reference. All three test methods achieved interference mitigation effects, and the highest SINR level is obtained by the VMD method. Relative to the EMD and wavelet methods, the SINR of the VMD method is about 4dB higher.
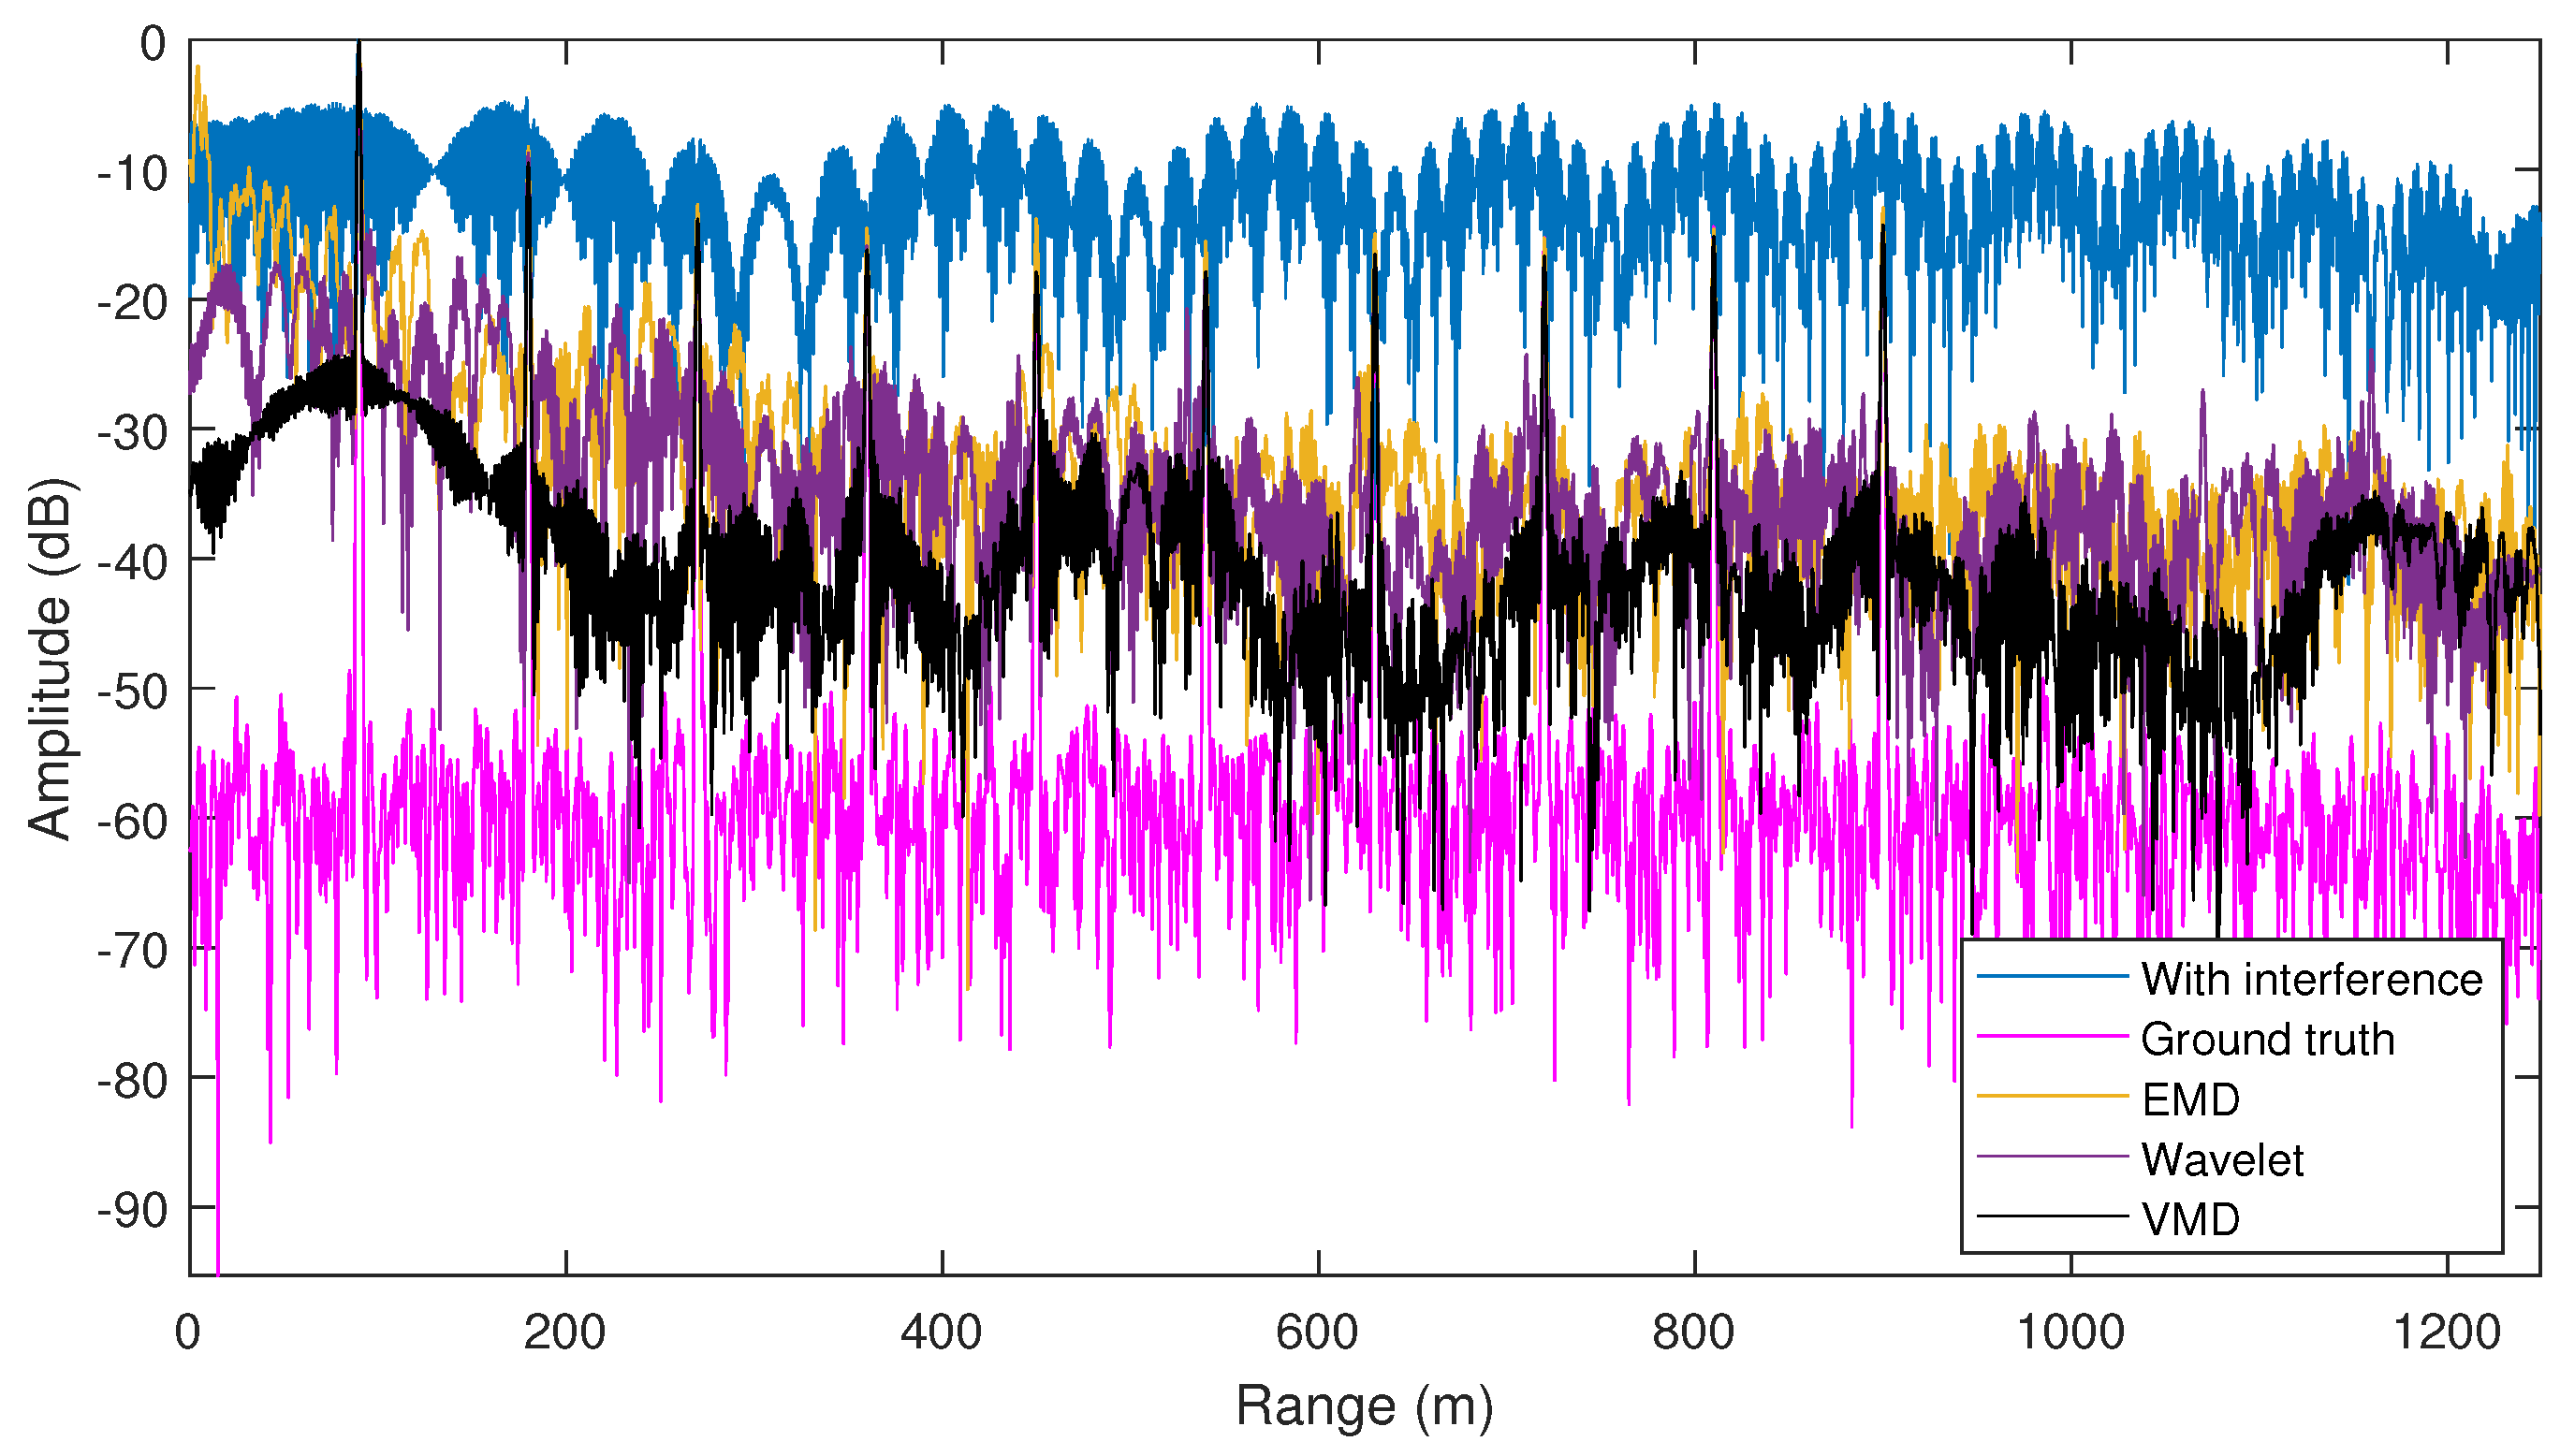
The interference mitigation performance of all the tested methods in RP is shown in Figure 9. Before interference mitigation, only the amplitude of the first target is higher than that of the interference, and the remaining nine targets are submerged by the interference in the original signal. After interference mitigation, all three methods are able to display the ten targets completely. Among them, the VMD method obtained the lowest noise level over the whole RP. This shows the advantage of the VMD decomposition feature for interference mitigation at different distance segments.
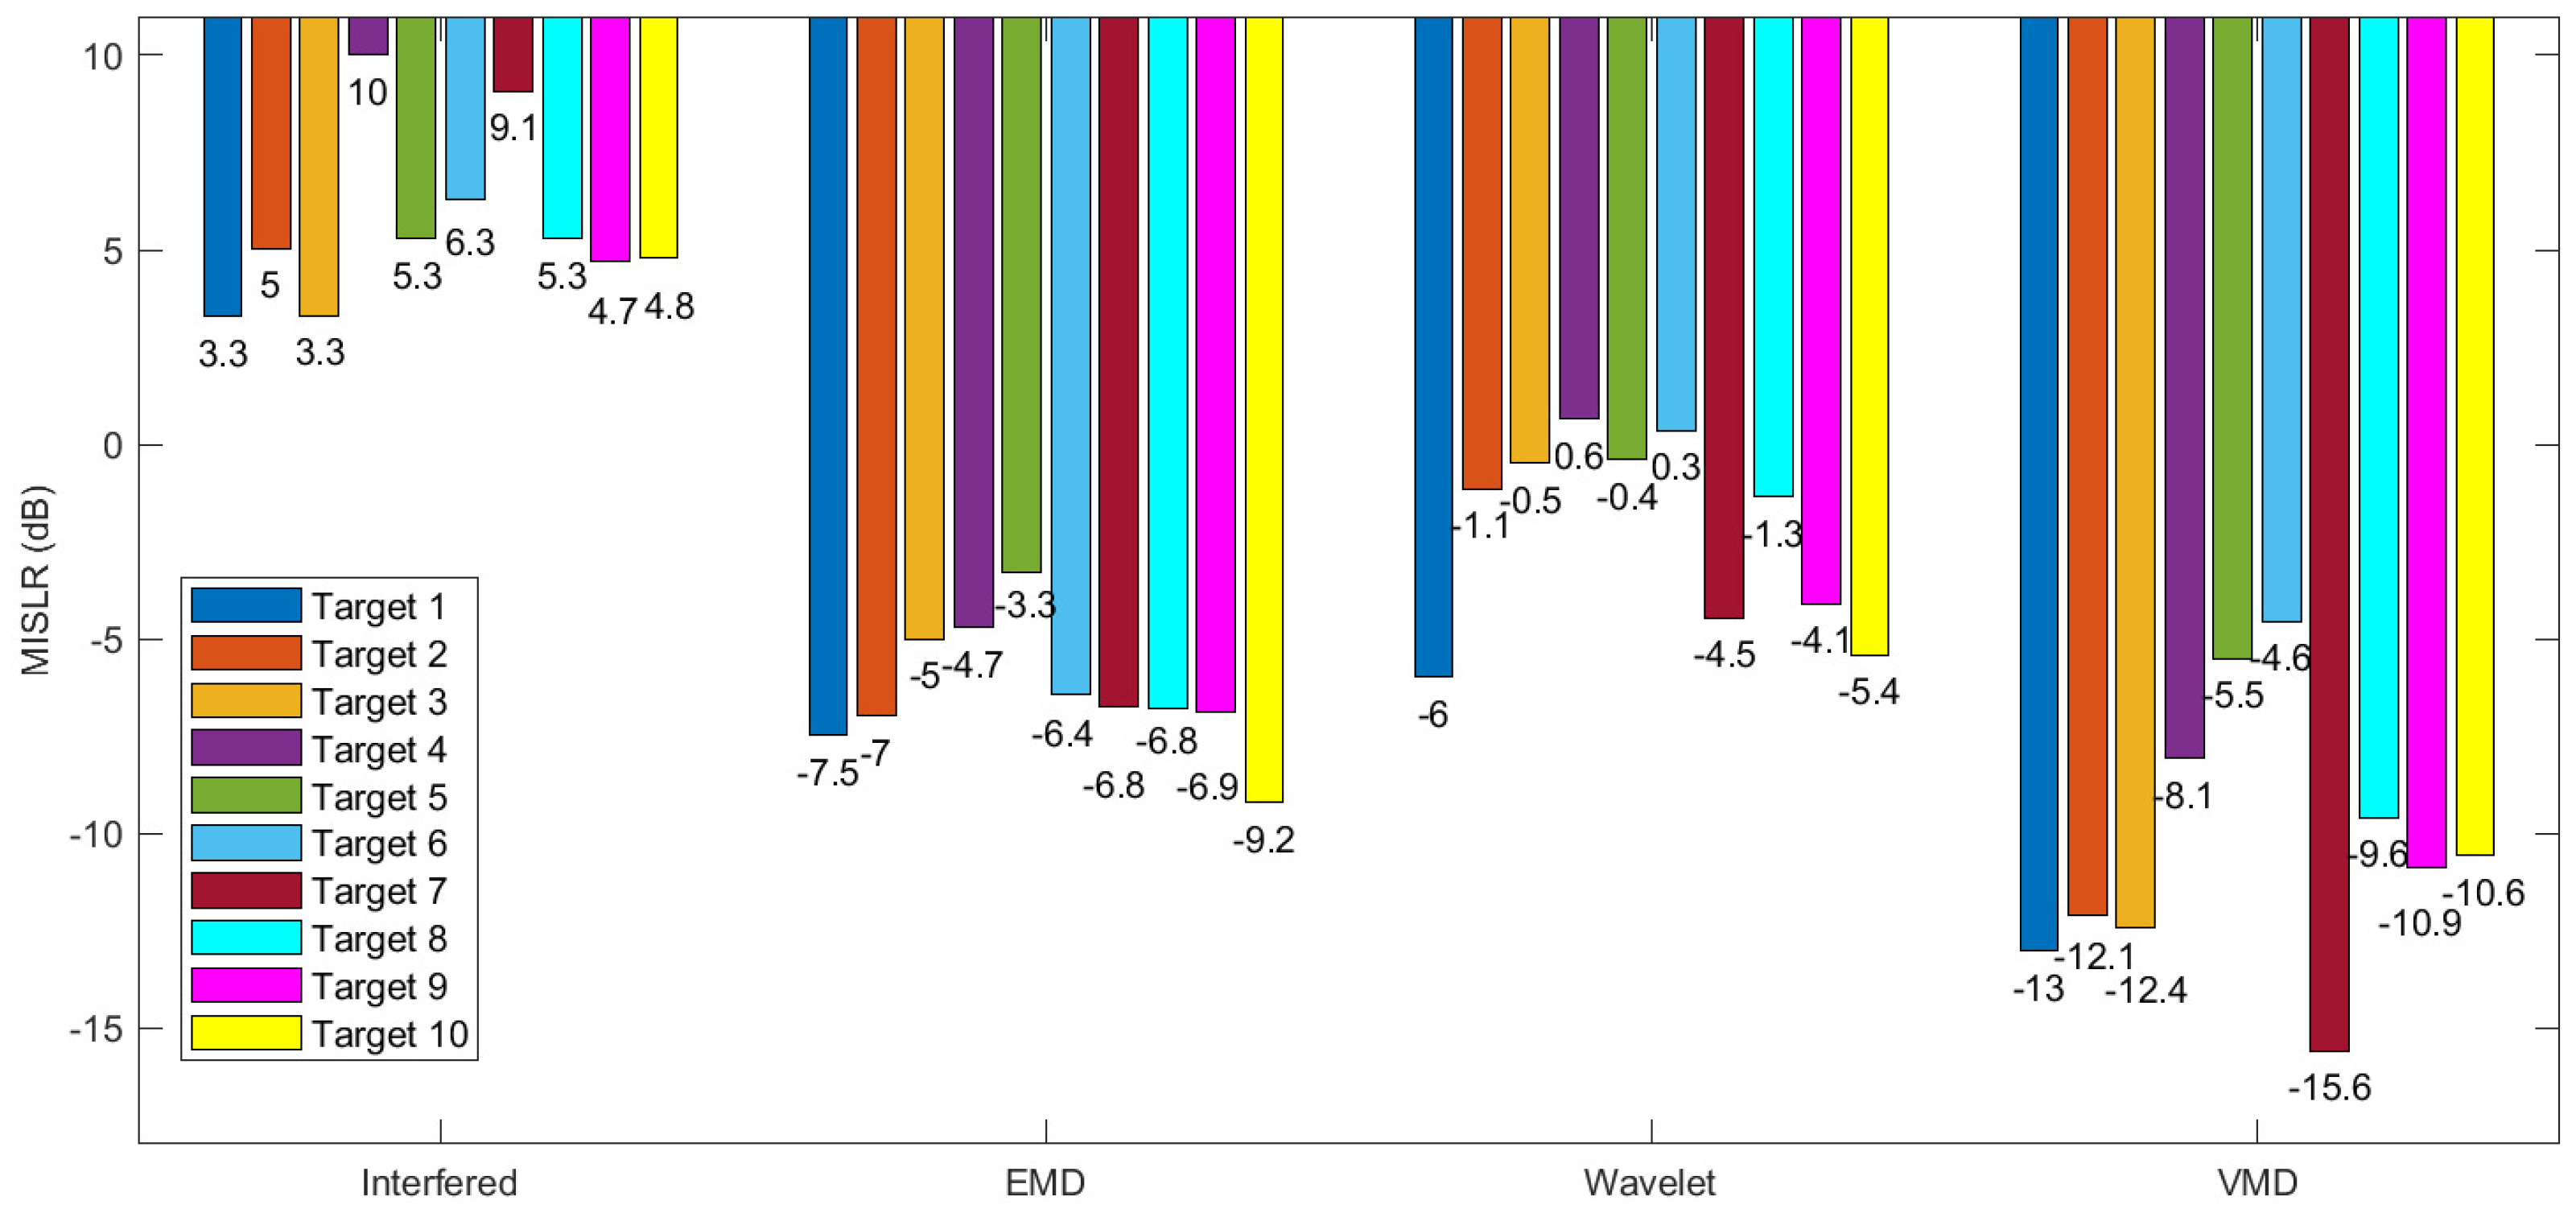
The quantitative results in the range domain are shown in Figure 10, which gives the MISLR levels of the ten targets, and the original MISLR levels are given as a reference. From the statistical results, it can be seen that the VMD method obtains significant improvements in the MISLR levels of most targets compared to the other methods.
Interference mitigation performance on RD response is also evaluated. A chirp sequence is designed in the simulation experiment for obtaining velocity measurement capability. There are in total 256 chirps in one sequence, which is denoted as a frame. For each chirp in a frame, interference mitigation is performed separately, and then the processed chirps are formed into a new frame for subsequent 2D FFT processing to obtain the RD response map after interference mitigation [8].
The RD maps of different methods are shown in Figure 11. Compared with the RD map with interference, all three tested methods provide effective interference mitigation. Compared with the truth, the three methods can correctly extract the RD response of the ten targets, and the VMD method obtains the best interference mitigation effect. In detail, the VMD method achieves the smallest noise level, which is beneficial to target detection performance.
In order to evaluate the computational power load of the tested methods, we use the simulation data for the running time analysis of each method. The algorithmic flow of interference mitigation is divided into two parts: signal decomposition and interference detection and mitigation. The running time of each part is counted separately and the total time consumed by each method is also given. The computer platform used for the evaluation has an AMD Ryzen 7 5800H central processing unit (CPU) and 16 GB of DDR4-3200 random access memory (RAM). The Matlab software version used in this experiment is R2021a. The running time results for the interference mitigation of a simulated chirp are shown in Table 3.
It can be seen that the proposed method has the longest running time. Specifically, for the running time of the signal decomposition part, the VMD is more time-consuming than EMD and wavelet because it is an optimization problem solving process. In the interference detection and mitigation part, the EMD and VMD methods use CFAR detector for interference detection, which has more computation and takes longer compared to the soft threshold detection of the wavelet method. In addition, the VMD method has an additional process of signal recovery using the AR model, which also increases the algorithm’s time consumption. Overall, the wavelet method consumes the least amount of time due to its fast algorithm structure, and the proposed method has the longest running time. In practice, since the proposed method is performed for each mode in the interference detection and mitigation part and there is no correlation between the modes, parallel processing can be considered in this part. The running time using parallel processing is shown in the last row of Table 3, which demonstrates that the elapsed time of the proposed method is significantly reduced by parallel computing.

6. Real Experiment Results

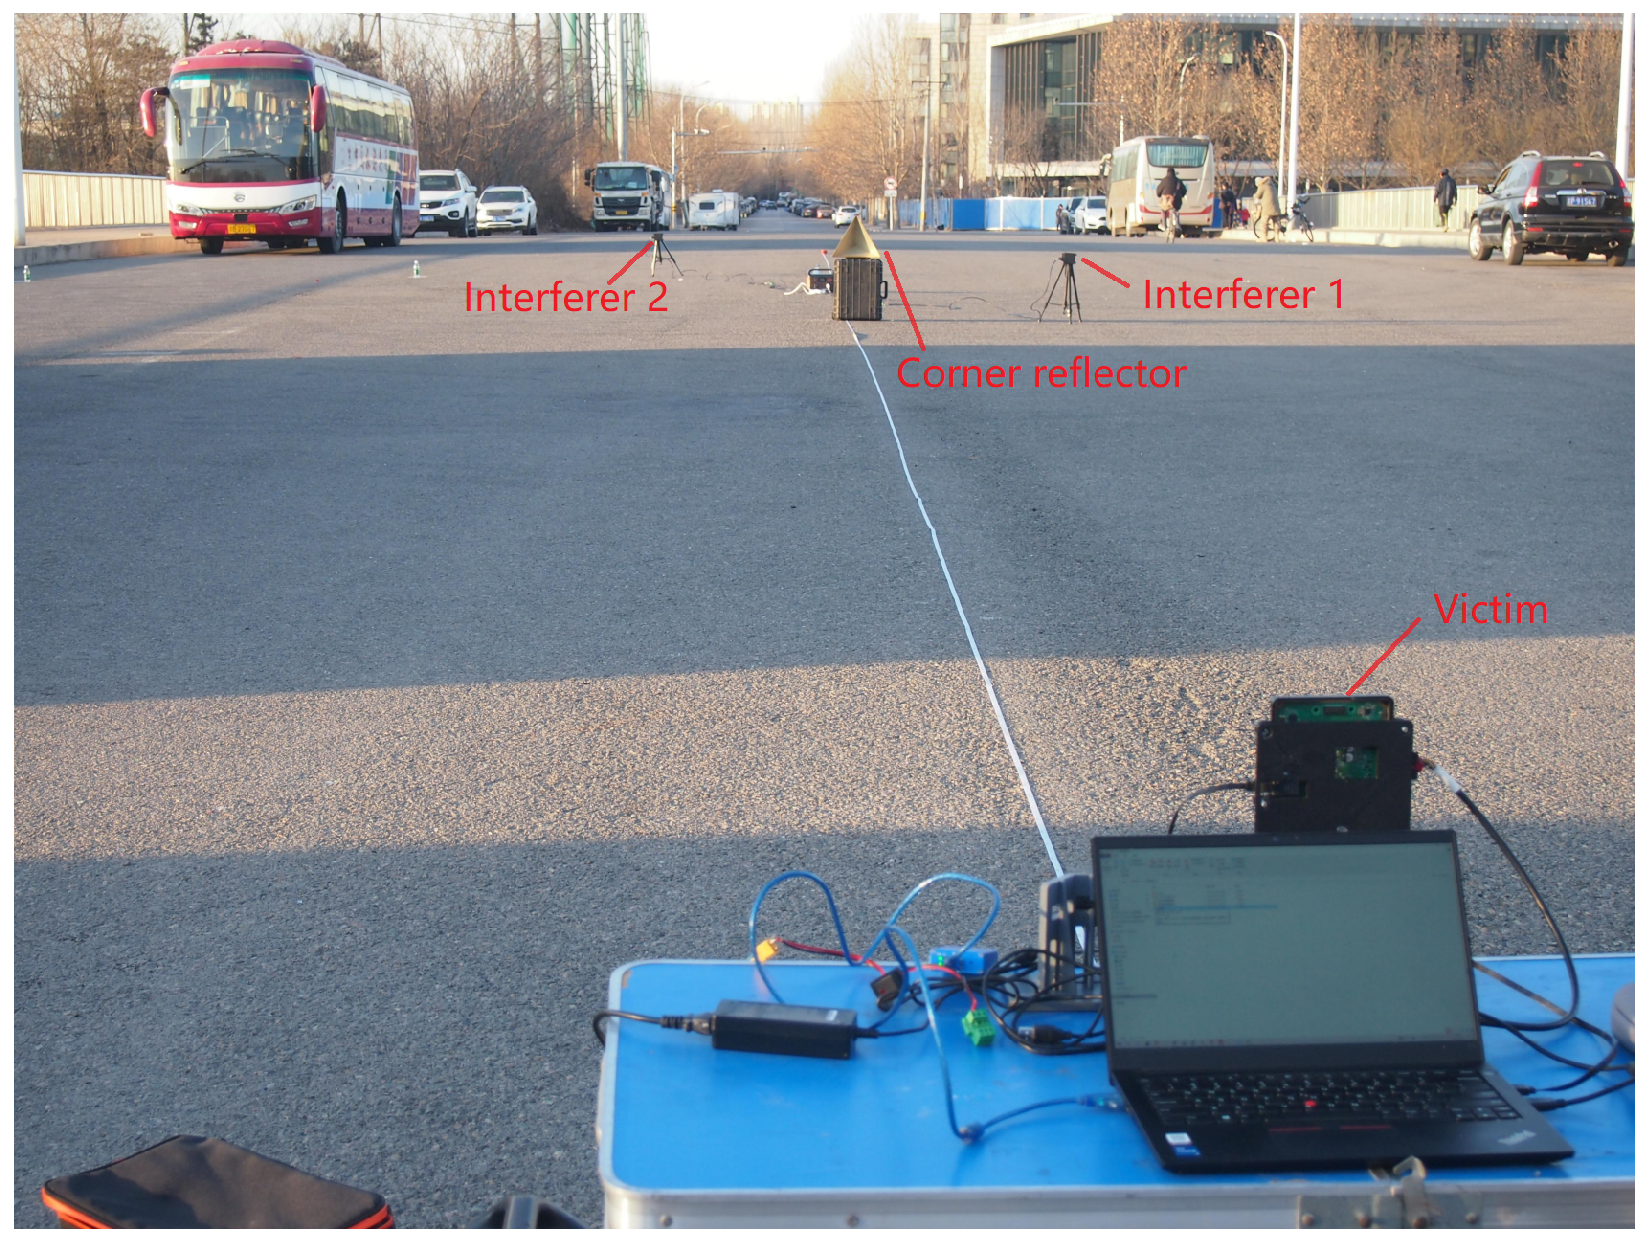
A real scene experiment is designed to evaluate the effectiveness of the proposed method. In the experiment, we used three 77 GHz mmWave radars from Muniu Linghang Technology Company for data recording. One of these radars is used as a victim device and the other two are used as interference sources. The received data of the victim radar are recorded for performance evaluation. The locations of all devices in the experimental scene are shown in Figure 12. The two interferer radars are distributed on the left and right sides of the victim’s line of sight, and the distance from the victim to the interference source 1 and source 2 is 20 m and 30 m, respectively. A corner reflector is placed at 20 m in front of the victim to simulate a typical strong target. A motorcycle rider’s echo data were also recorded.
The radar parameters used in the experiment are given in Table 4. All radar devices operate at 77 GHz, differing in specific signal parameters. The victim is configured as up-frequency modulation with a sweep bandwidth of 300 MHz, the interference source 1 is configured as the down-frequency modulation with a sweep bandwidth of 300 MHz, and the interference source 2 is configured as the up-frequency modulation with a sweep bandwidth of 500 MHz. The three radars are set to have different pulse repetition times (PRTs) in order to increase the probability of mutual interference.
Similar to the system workflow in the simulation experiment, the signal flow of the victim radar in the real experiment follows Figure 1. The echoes of the targets and the two interfering radar signals are superimposed and enter the receiver of the victim radar. After mixing and low-pass filtering, a discrete version of the real−valued beat frequency signal is sampled by the ADC chip. In implementing interference mitigation by the proposed method, the number of decomposition modes of the VMD is set to 5, which is the same as the simulation experiment, and the CA-CFAR detector is also the same as in the simulation experiment.
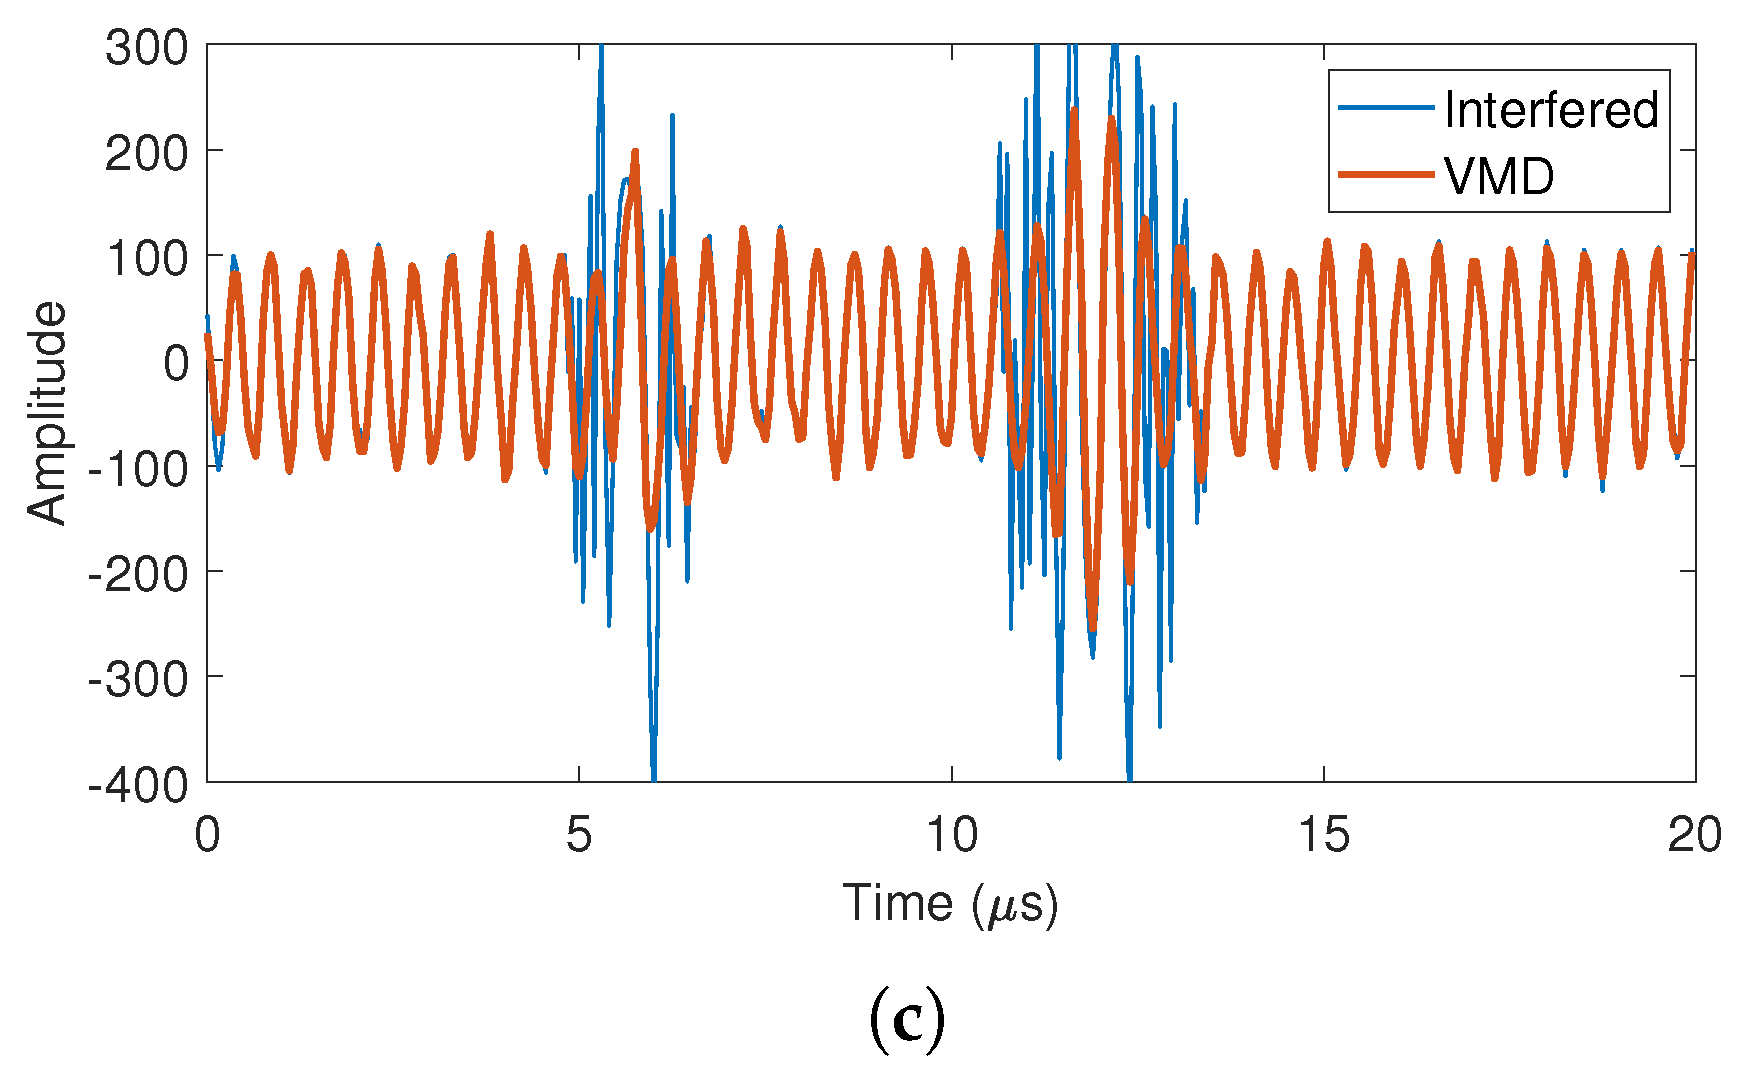
The original beat frequency signal and its interference mitigation version by different methods are shown in Figure 13. It can be seen that two forms of interference related to the two interferer radars are observed in the received signal. The interference with a short time duration is introduced by interferer 1, and the long time duration is introduced by interferer 2. From the reconstructed waveforms of the contaminated part, the VMD method recovers the sinusoidal waveform corresponding to the corner reflector while better suppressing the interference as shown in Figure 13c. In contrast, the EMD and wavelet methods did not recover the sinusoidal signal despite the interference suppression achieved as shown in Figure 13a,b. This is due to the fact that the VMD method performs a signal reconstruction process based on the AR model after zeroing the interference in each decomposed mode, which allows the VMD method to recover the target echoes with sinusoidal characteristics.
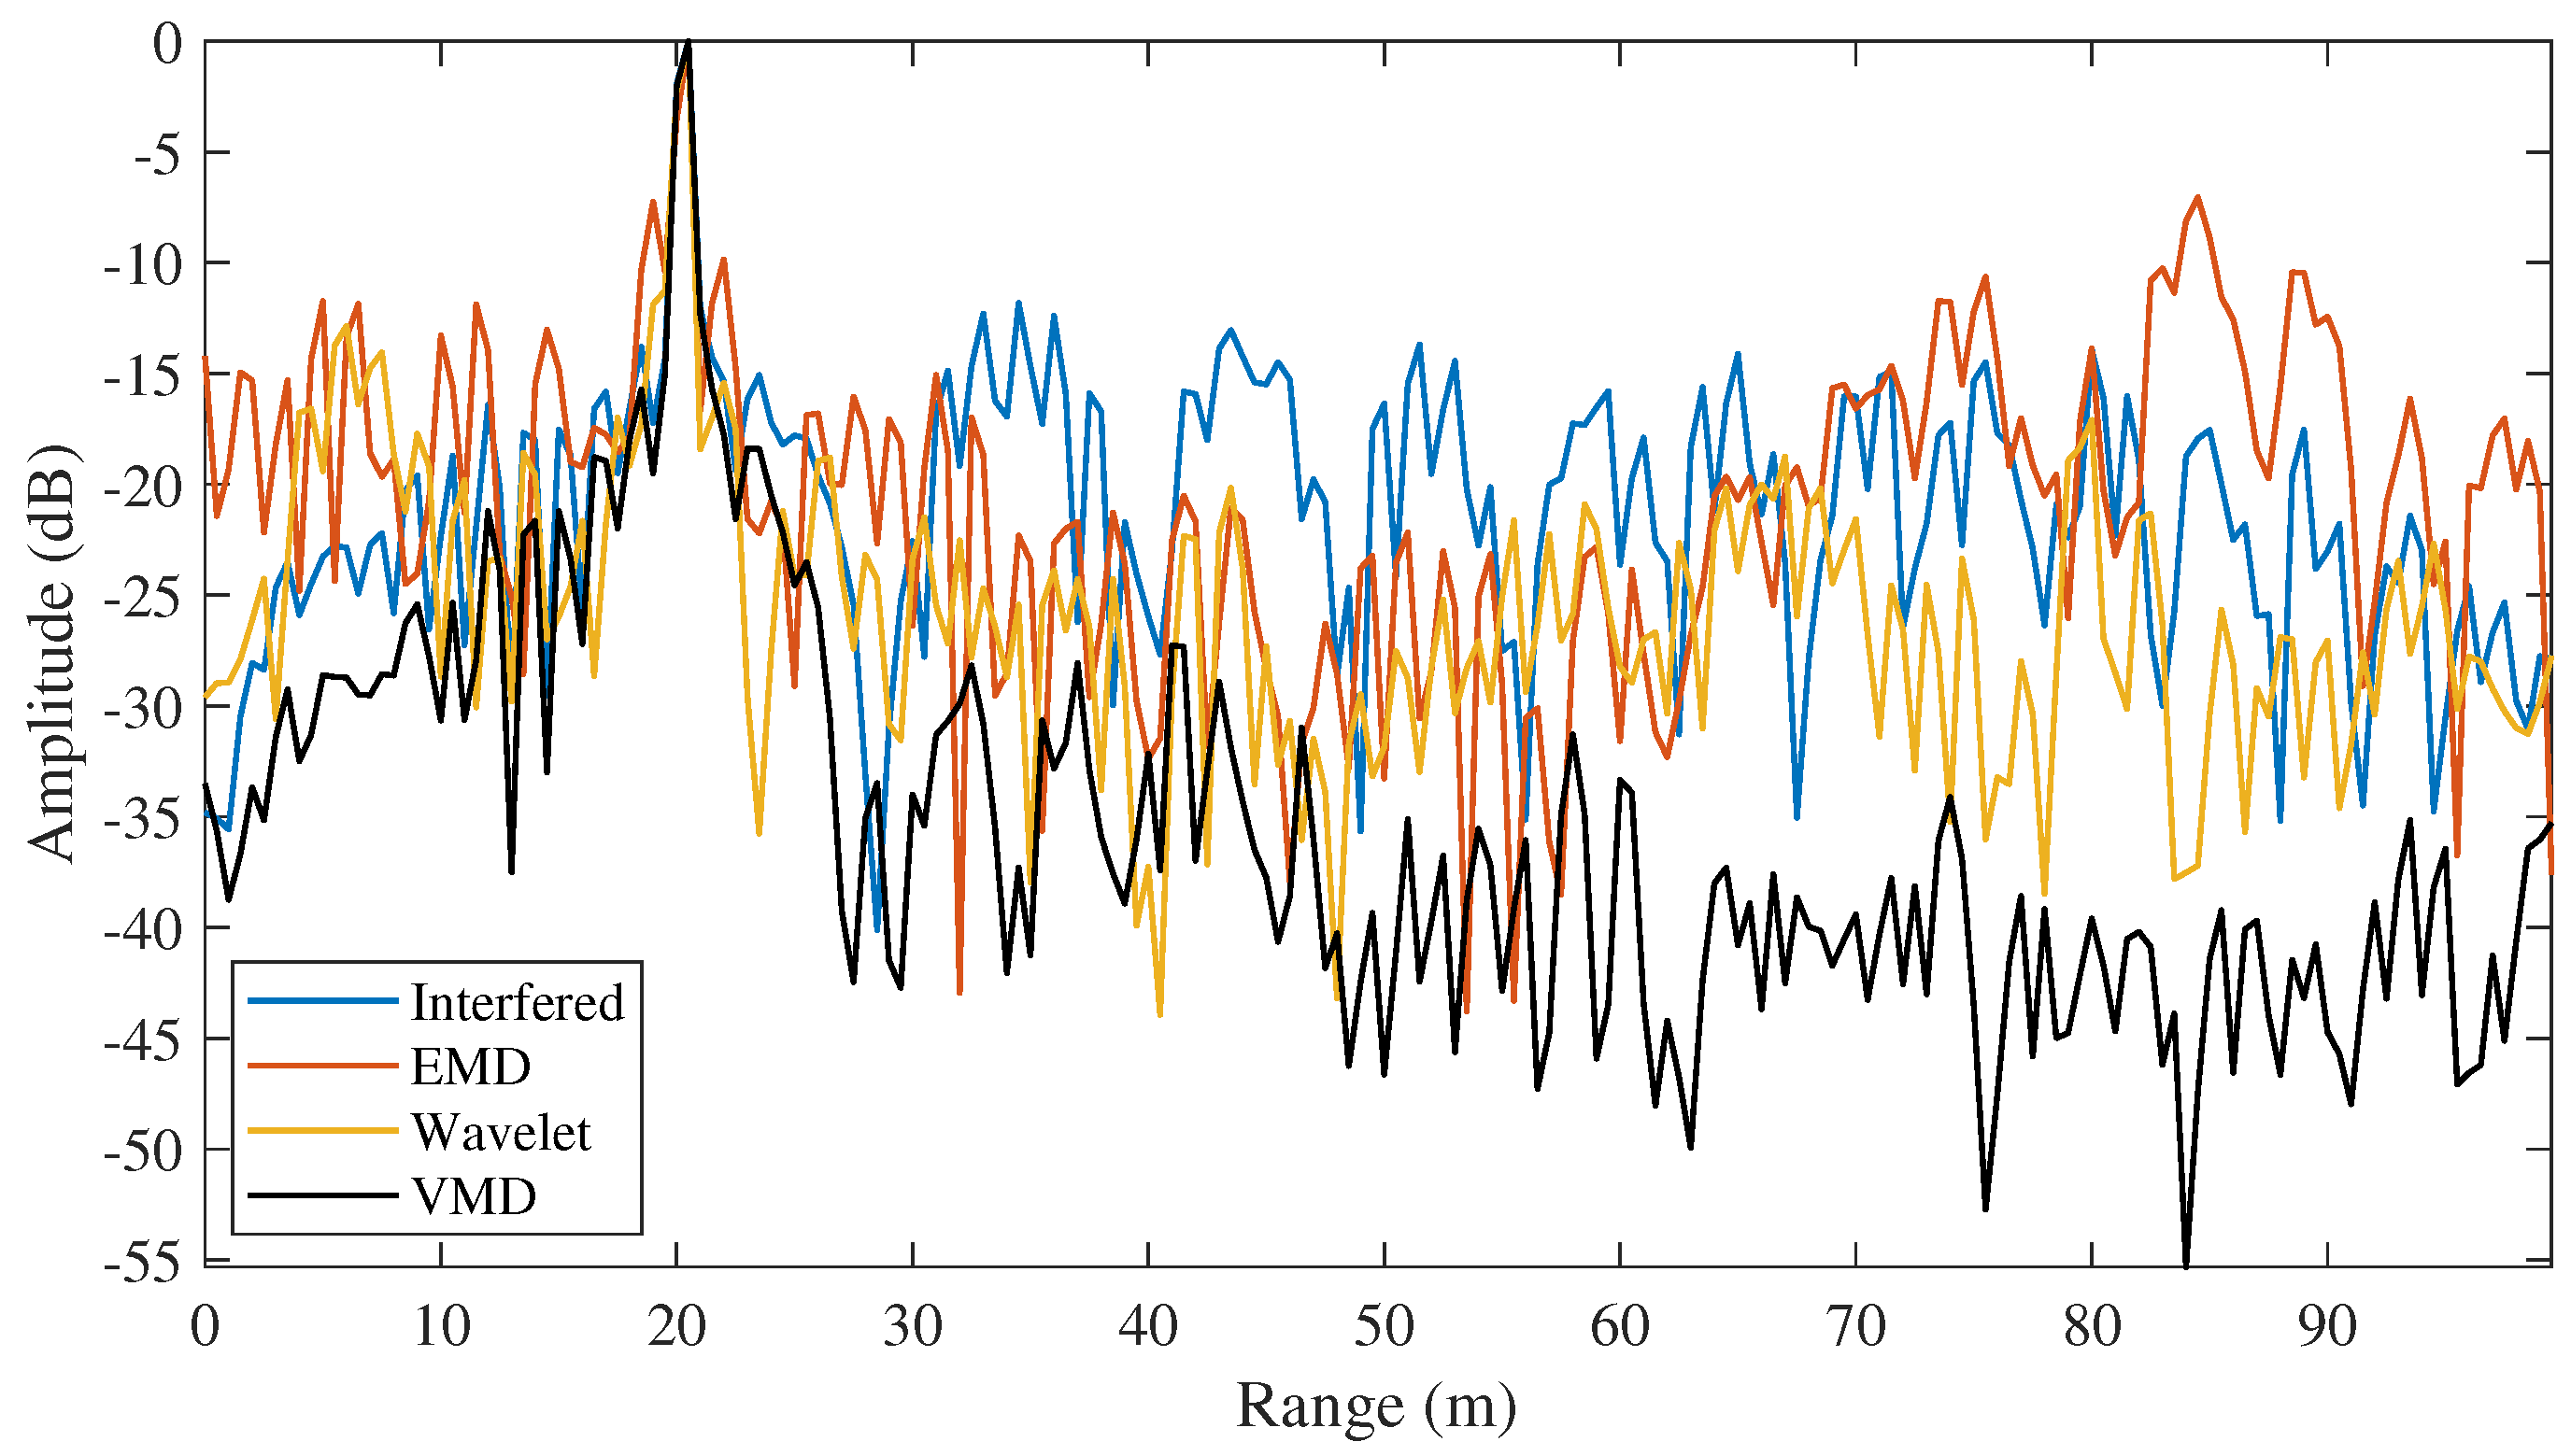
The RP after interference mitigation for all tested methods is shown in Figure 14. The corner reflector appears at 20 m, which coincides with the experiment setup. Overall, the proposed method has lower sidelobe levels than other methods across the entire RP. The quantitative analysis of MISLR is shown in Figure 15. It can be seen that the proposed method achieves the lowest MISLR level. These results indicate that the proposed method achieves the best interference mitigation performance and correspondingly has the best target detection performance in a real scene experiment.
The interference mitigation evaluation for a moving target scenario is implemented. The data of a motorcycle rider were recorded in the experiment. After 2D FFT processing of the received chirp sequence, the RD response can be obtained as shown in Figure 16. The RD response reflects the joint range–velocity distribution of the target, i.e., when a target locates at a specific range with a specific velocity simultaneously, a peak appears at the corresponding position in the RD map. According to the RD map of the moving target scenario in Figure 16, the motorcycle appears in the RD map at the range of 8 m and the velocity of 7.8 m/s. The corner reflector can also be observed in Figure 16, and it appears at the range of 20 m with the velocity of 0, which coincides with the experimental design of the scenario. In addition, some ground clutter components are observed in the range domain with velocity 0, which is different from the simulation experiment. As can be seen from the RD map before interference mitigation in the upper left of Figure 16, the motorcycle is barely visible in the presence of interference. When interference mitigation is performed, the motorcycle target is visible in the RD map obtained by all three tested methods. Compared to the EMD and the wavelet methods, the proposed method obtained the best interference mitigation performance. The noise level in the RD map is significantly reduced after using the proposed method for interference mitigation, as shown in the VMD result of Figure 16. It should be noted that some amounts of energy distribute in the RD cells near the range of 20 m. These amounts of energy are not introduced by the interference; in fact, they are the sidelobes of the strong corner reflector target in the velocity domain. The above experimental results show that the proposed method can also achieve good interference mitigation performance in a real-world moving target scenario.

7. Conclusions

In this paper, we analyzed the mutual interference of FMCW mmWave radars. After the dechirping process, the target echo becomes a single frequency sinusoid and the interference is a broadband signal. According to their difference, VMD is utilized to decompose the received signal into the summation of a set of narrowband modes. As a result, the interference power is broken down into each mode while the target echo is preserved. For each mode, after the interference detection, the target echo in the interfered area is restored by means of signal reconstruction, so as to achieve the effect of interference mitigation.
In the multi-target simulation scene, the modes obtained by VMD contain a reduced number of targets and reduced bandwidth interference. In this case, a good interference mitigation effect can be achieved using a simple linear prediction model. The simulation results show that the proposed method has better interference mitigation performance than the existing decomposition-based methods. The results based on the experimental data show that the proposed method also outperforms the other decomposition-based methods in a real scene.
Since the VMD implementation is based on the solution of an optimization problem, it has a computational disadvantage; however, in practice, the use of an algorithmic architecture with parallel computing can be considered to reduce the running time.

Author Contributions

Conceptualization, Y.L.; methodology, Y.L. and B.F.; software, Y.L. and W.Z.; validation, B.F.; formal analysis, B.F.; writing—original draft preparation, Y.L.; writing—review and editing, B.F. and W.Z.; supervision, Y.L.; project administration, Y.L.; funding acquisition, Y.L. All authors have read and agreed to the published version of the manuscript.

Funding

This research was funded by the Fundamental Research Funds for the Central Universities grant number 2022RC008.

Data Availability Statement

The data presented in this study are available on request from the corresponding author.

Acknowledgments

The authors would like to thank Muniu Linghang Technology Company for providing radar test equipment and data acquisition support.

Conflicts of Interest

The authors declare no conflict of interest.

References

  1. Zhang, Z.; Wang, X.; Huang, D.; Fang, X.; Zhou, M.; Zhang, Y. MRPT: Millimeter-Wave Radar-based Pedestrian Trajectory-Tracking for Autonomous Urban Driving. IEEE Trans. Instrum. Meas. 2021, 71, 1–17. [Google Scholar] [CrossRef]
  2. Hasch, J.; Topak, E.; Schnabel, R.; Zwick, T.; Weigel, R.; Waldschmidt, C. Millimeter-wave technology for automotive radar sensors in the 77 GHz frequency band. IEEE Trans. Microw. Theory Tech. 2012, 60, 845–860. [Google Scholar] [CrossRef]
  3. Saponara, S.; Greco, M.S.; Gini, F. Radar-on-chip/in-package in autonomous driving vehicles and intelligent transport systems: Opportunities and challenges. IEEE Signal Process. Mag. 2019, 36, 71–84. [Google Scholar] [CrossRef]
  4. Neri, B.; Saponara, S. Advances in technologies, architectures, and applications of highly-integrated low-power radars. IEEE Aerosp. Electron. Syst. Mag. 2012, 27, 25–36. [Google Scholar] [CrossRef]
  5. Bilik, I.; Longman, O.; Villeval, S.; Tabrikian, J. The rise of radar for autonomous vehicles: Signal processing solutions and future research directions. IEEE Signal Process. Mag. 2019, 36, 20–31. [Google Scholar] [CrossRef]
  6. Munoz-Ferreras, J.M.; Perez-Martinez, F.; Calvo-Gallego, J.; Asensio-Lopez, A.; Dorta-Naranjo, B.P.; Blanco-del Campo, A. Traffic Surveillance System Based on a High-Resolution Radar. IEEE Trans. Geosci. Remote. Sens. 2008, 46, 1624–1633. [Google Scholar] [CrossRef]
  7. Dogru, S.; Marques, L. Pursuing Drones With Drones Using Millimeter Wave Radar. IEEE Robot. Autom. Lett. 2020, 5, 4156–4163. [Google Scholar] [CrossRef]
  8. Roos, F.; Bechter, J.; Knill, C.; Schweizer, B.; Waldschmidt, C. Radar sensors for autonomous driving: Modulation schemes and interference mitigation. IEEE Microw. Mag. 2019, 20, 58–72. [Google Scholar] [CrossRef] [Green Version]
  9. Sun, S.; Petropulu, A.P.; Poor, H.V. MIMO radar for advanced driver-assistance systems and autonomous driving: Advantages and challenges. IEEE Signal Process. Mag. 2020, 37, 98–117. [Google Scholar] [CrossRef]
  10. Yamada, H.; Kobayashi, T.; Yamaguchi, Y.; Sugiyama, Y. High-resolution 2D SAR imaging by the millimeter-wave automobile radar. In Proceedings of the 2017 IEEE Conference on Antenna Measurements & Applications (CAMA), Tsukuba, Japan, 4–6 December 2017; pp. 149–150. [Google Scholar] [CrossRef]
  11. Brooker, G.M. Mutual interference of millimeter-wave radar systems. IEEE Trans. Electromagn. Compat. 2007, 49, 170–181. [Google Scholar] [CrossRef]
  12. Kim, G.; Mun, J.; Lee, J. A peer-to-peer interference analysis for automotive chirp sequence radars. IEEE Trans. Veh. Technol. 2018, 67, 8110–8117. [Google Scholar] [CrossRef]
  13. Pirkani, A.; Norouzian, F.; Hoare, E.; Cherniakov, M.; Gashinova, M. Automotive interference statistics and their effect on radar detector. IET Radar Sonar Navig. 2022, 16, 9–21. [Google Scholar] [CrossRef]
  14. Overdevest, J.; Jansen, F.; Laghezza, F.; Uysal, F.; Yarovoy, A. Uncorrelated Interference in 79 GHz FMCW and PMCW Automotive Radar. In Proceedings of the 2019 20th International Radar Symposium (IRS), Ulm, Germany, 26–28 June 2019; pp. 1–8. [Google Scholar] [CrossRef]
  15. Alland, S.; Stark, W.; Ali, M.; Hegde, M. Interference in Automotive Radar Systems: Characteristics, Mitigation Techniques, and Current and Future Research. IEEE Signal Process. Mag. 2019, 36, 45–59. [Google Scholar] [CrossRef]
  16. Goppelt, M.; Blöcher, H.L.; Menzel, W. Analytical investigation of mutual interference between automotive FMCW radar sensors. In Proceedings of the 2011 German Microwave Conference, Darmstadt, Germany, 14–16 March 2011; pp. 1–4. [Google Scholar]
  17. Nozawa, T.; Makino, Y.; Takaya, N.; Umehira, M.; Takeda, S.; Wang, X.; Kuroda, H. An anti-collision automotive FMCW radar using time-domain interference detection and suppression. In Proceedings of the International Conference on Radar Systems, Belfast, UK, 23–26 October 2017; pp. 1–5. [Google Scholar] [CrossRef]
  18. Rameez, M.; Dahl, M.; Pettersson, M.I. Autoregressive Model-Based Signal Reconstruction for Automotive Radar Interference Mitigation. IEEE Sens. J. 2020, 21, 6575–6586. [Google Scholar] [CrossRef]
  19. Wu, J.; Yang, S.; Lu, W.; Liu, Z. Iterative modified threshold method based on EMD for interference suppression in FMCW radars. IET Radar Sonar Navig. 2020, 14, 1219–1228. [Google Scholar] [CrossRef]
  20. Lee, S.; Lee, J.Y.; Kim, S.C. Mutual Interference Suppression Using Wavelet Denoising in Automotive FMCW Radar Systems. IEEE Trans. Intell. Transp. Syst. 2021, 22, 887–897. [Google Scholar] [CrossRef]
  21. Norouzian, F.; Pirkani, A.; Hoare, E.; Cherniakov, M.; Gashinova, M. Phenomenology of automotive radar interference. IET Radar Sonar Navig. 2021, 15, 1045–1060. [Google Scholar] [CrossRef]
  22. Neemat, S.; Krasnov, O.; Yarovoy, A. An interference mitigation technique for FMCW radar using beat-frequencies interpolation in the STFT domain. IEEE Trans. Microw. Theory Tech. 2018, 67, 1207–1220. [Google Scholar] [CrossRef] [Green Version]
  23. Eslami Nazari, M.; Huang, W.; Zhao, C. Radio Frequency Interference Suppression for HF Surface Wave Radar Using CEMD and Temporal Windowing Methods. IEEE Geosci. Remote Sens. Lett. 2020, 17, 212–216. [Google Scholar] [CrossRef]
  24. Chen, Z.; Xie, F.; Zhao, C.; He, C. Radio Frequency Interference Mitigation in High-Frequency Surface Wave Radar Based on CEMD. IEEE Geosci. Remote Sens. Lett. 2017, 14, 764–768. [Google Scholar] [CrossRef]
  25. Zhou, F.; Xing, M.; Bai, X.; Sun, G.; Bao, Z. Narrow-Band Interference Suppression for SAR Based on Complex Empirical Mode Decomposition. IEEE Geosci. Remote Sens. Lett. 2009, 6, 423–427. [Google Scholar] [CrossRef]
  26. Díez-García, R.; Camps, A.; Park, H. On the Potential of Empirical Mode Decomposition for RFI Mitigation in Microwave Radiometry. IEEE Trans. Geosci. Remote Sens. 2022, 60, 1–10. [Google Scholar] [CrossRef]
  27. Ramasubramanian, K.; Instruments, T. Using a complex-baseband architecture in FMCW radar systems. Tex. Instrum. 2017, 19, 1–9. [Google Scholar]
  28. Flandrin, P.; Rilling, G.; Goncalves, P. Empirical mode decomposition as a filter bank. IEEE Signal Process. Lett. 2004, 11, 112–114. [Google Scholar] [CrossRef] [Green Version]
  29. Vetterli, M.; Herley, C. Wavelets and filter banks: Theory and design. IEEE Trans. Signal Process. 1992, 40, 2207–2232. [Google Scholar] [CrossRef] [Green Version]
  30. Dragomiretskiy, K.; Zosso, D. Variational Mode Decomposition. IEEE Trans. Signal Process. 2014, 62, 531–544. [Google Scholar] [CrossRef]
  31. Patole, S.M.; Torlak, M.; Wang, D.; Ali, M. Automotive radars: A review of signal processing techniques. IEEE Signal Process. Mag. 2017, 34, 22–35. [Google Scholar] [CrossRef]
  32. Skolnik, M.I. Introduction to Radar Systems; McGraw-Hill: New York, NY, USA, 2001. [Google Scholar]
  33. Upadhyay, A.; Pachori, R.B. Instantaneous voiced/non-voiced detection in speech signals based on variational mode decomposition. J. Frankl. Inst. 2015, 352, 2679–2707. [Google Scholar] [CrossRef]
  34. Lahmiri, S. Intraday stock price forecasting based on variational mode decomposition. J. Comput. Sci. 2016, 12, 23–27. [Google Scholar] [CrossRef]
  35. Smruthy, A.; Suchetha, M. Real-Time Classification of Healthy and Apnea Subjects Using ECG Signals With Variational Mode Decomposition. IEEE Sens. J. 2017, 17, 3092–3099. [Google Scholar] [CrossRef]
  36. Zhang, X.; Miao, Q.; Zhang, H.; Wang, L. A parameter-adaptive VMD method based on grasshopper optimization algorithm to analyze vibration signals from rotating machinery. Mech. Syst. Signal Process. 2018, 108, 58–72. [Google Scholar] [CrossRef]
  37. Wang, Z.; Wang, J.; Du, W. Research on Fault Diagnosis of Gearbox with Improved Variational Mode Decomposition. Sensors 2018, 18, 3510. [Google Scholar] [CrossRef] [Green Version]
  38. Toth, M.; Meissner, P.; Melzer, A.; Witrisal, K. Performance Comparison of Mutual Automotive Radar Interference Mitigation Algorithms. In Proceedings of the 2019 IEEE Radar Conference, Boston, MA, USA, 22–26 April 2019; pp. 1–6. [Google Scholar] [CrossRef]
  39. Chan, Y.; Lavoie, J.; Plant, J. A parameter estimation approach to estimation of frequencies of sinusoids. IEEE Trans. Acoust. Speech Signal Process. 1981, 29, 214–219. [Google Scholar] [CrossRef]
  40. Richards, M.A. Fundamentals of Radar Signal Processing; McGraw-Hill: New York, NY, USA, 2005. [Google Scholar]
  41. Davis, M.S.; Lanterman, A.D. Minimum integrated sidelobe ratio filters for MIMO radar. IEEE Trans. Aerosp. Electron. Syst. 2015, 51, 405–416. [Google Scholar] [CrossRef]
  42. Chatzitheodoridi, M.E.; Taylor, A.; Rabaste, O. A Mismatched Filter for Integrated Sidelobe Level Minimization over a Continuous Doppler Shift Interval. In Proceedings of the 2020 IEEE Radar Conference, Florence, Italy, 21–25 September 2020; pp. 1–6. [Google Scholar] [CrossRef]
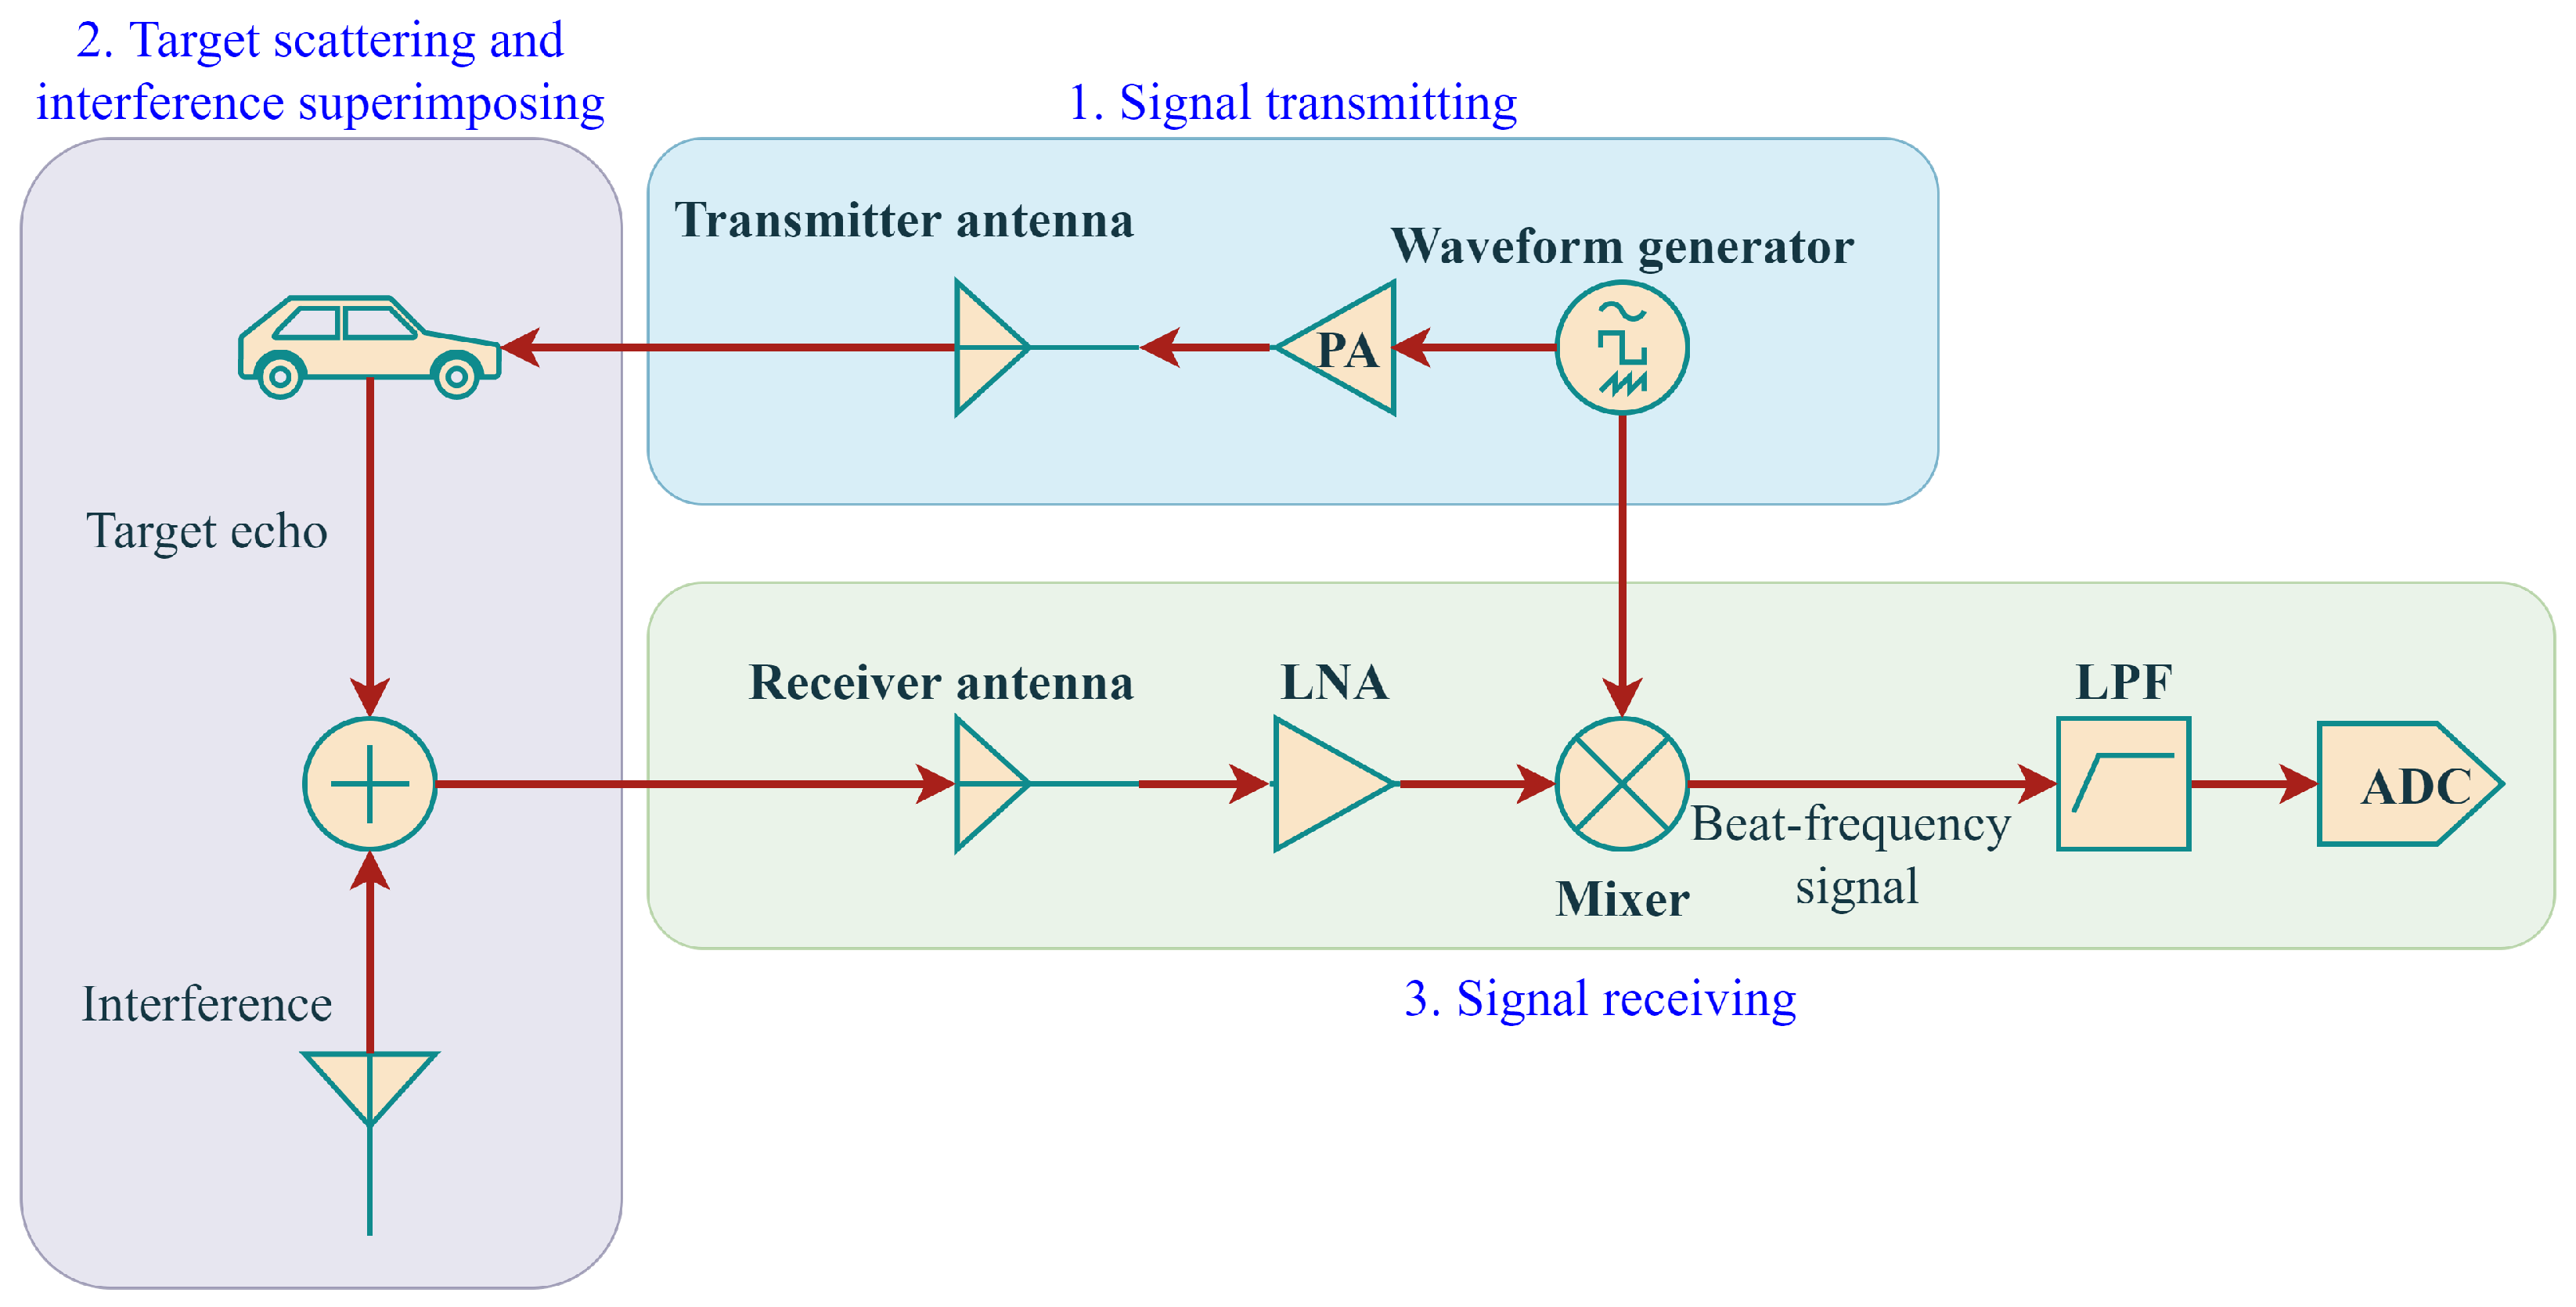
Figure 1. Flow chart of frequency-modulated continuous wave (FMCW) radar system.
Remotesensing 15 00557 g001
Figure 2. Decomposition results of real−valued white noise by different methods. (a) Results of empirical modal decomposition (EMD) in time domain, (b) results of EMD in frequency domain, (c) results of wavelet in time domain, (d) results of wavelet in frequency domain, (e) results of variational mode decomposition (VMD) in time domain, and (f) results of VMD in frequency domain.
Remotesensing 15 00557 g002
Figure 3. Interference mitigation flow chart.
Remotesensing 15 00557 g003
Figure 4. Real−valued beat frequency signal and correspondingrange profile (RP). (a) Beat frequency signal without interference, (b) RP without interference, (c) beat frequency signal with interference, and (d) RP with interference.
Remotesensing 15 00557 g004
Figure 5. Decomposition results of simulated real−valued beat frequency signal by different methods. A total of five modes are specified in the implementation of different methods. For EMD, there are four intrinsic mode functions (IMF) and a residual. For wavelet, there are four detail modes and one approximate modeb. For VMD, there are five IMFs. (a) Results of EMD in time domain, (b) results of EMD in RP, (c) results of wavelet in time domain, (d) results of wavelet in RP, (e) results of VMD in time domain, and (f) results of VMD in RP.
Remotesensing 15 00557 g005
Figure 6. Energy percentage of decomposed modes for different methods.
Remotesensing 15 00557 g006
Figure 7. The interference mitigation performance of different methods in time domain for simulation experiment. (a) The beat frequency signal with and without interference, (b) the reconstructed signal by EMD, (c) the reconstructed signal by wavelet, and (d) the reconstructed signal by VMD.
Remotesensing 15 00557 g007
Figure 8. Signal to interference plus noise ratio (SINR) of different methods for simulation experiment.
Remotesensing 15 00557 g008
Figure 9. The interference mitigation performance of different methods in RP for simulation experiment.
Remotesensing 15 00557 g009
Figure 10. Modified ISLR (MISLR) of different methods for simulation experiment.
Remotesensing 15 00557 g010
Figure 11. The interference mitigation performance of different methods in range-Doppler (RD) response for simulation experiment. Different colors represent different RD amplitudes in decibels.
Remotesensing 15 00557 g011
Figure 12. Data collection scenario.
Remotesensing 15 00557 g012
Figure 13. The interference mitigation performance of different methods in time domain for real scene experiment. (a) EMD method, (b) wavelet method, and (c) VMD method.
Remotesensing 15 00557 g013aRemotesensing 15 00557 g013b
Figure 14. The interference mitigation performance of different methods in RP for real scene experiment.
Remotesensing 15 00557 g014
Figure 15. MISLR of different methods for real scene experiment.
Remotesensing 15 00557 g015
Figure 16. The interference mitigation performance of different methods in RD map for motorcycle scenario. Different colors represent different RD amplitudes in decibels.
Remotesensing 15 00557 g016
Table 1. Target Information for Simulation.
Target Index12345678910
Range (m)90180270360450540630720810900
Velocity (m/s)2.73.03.33.63.84.14.44.75.05.2
Table 2. Numerical Simulation Parameters of Radars.
ParameterVictimInterferer1Interferer2
Operating frequency (GHz)777777
Sweep bandwidth (MHz)300600600
Sweep time (μs)1001050
Sweep directionUpDownUp
IF sampling frequency (MHz)50--
Table 3. Running Time of Different Methods for Simulation Data.
Method ListRunning Time of Signal Decomposition (ms)Running Time of Interference Detection and Mitigation (ms)Total Running Time (ms)
EMD47412.9459.9
Wavelet38.928.367.2
VMD192.2749.9942.1
VMD (parallel)191.1126.7317.8
Table 4. Radar Configurations for Real Scene Experiment.
Radar ParametersVictimInterferer1Interferer2
Operating frequency (GHz)777777
Sweep bandwidth (MHz)300300500
Sweep time (μs)202020
Sweep directionUpDownUp
Pulse repetition time (PRT) (μs)304361
Sampling frequency (MHz)20--
Disclaimer/Publisher’s Note: The statements, opinions and data contained in all publications are solely those of the individual author(s) and contributor(s) and not of MDPI and/or the editor(s). MDPI and/or the editor(s) disclaim responsibility for any injury to people or property resulting from any ideas, methods, instructions or products referred to in the content.