


Multi-Modal Image Registration Based on Phase Exponent Differences of the Gaussian Pyramid


Abstract
:1. Introduction
- (1)
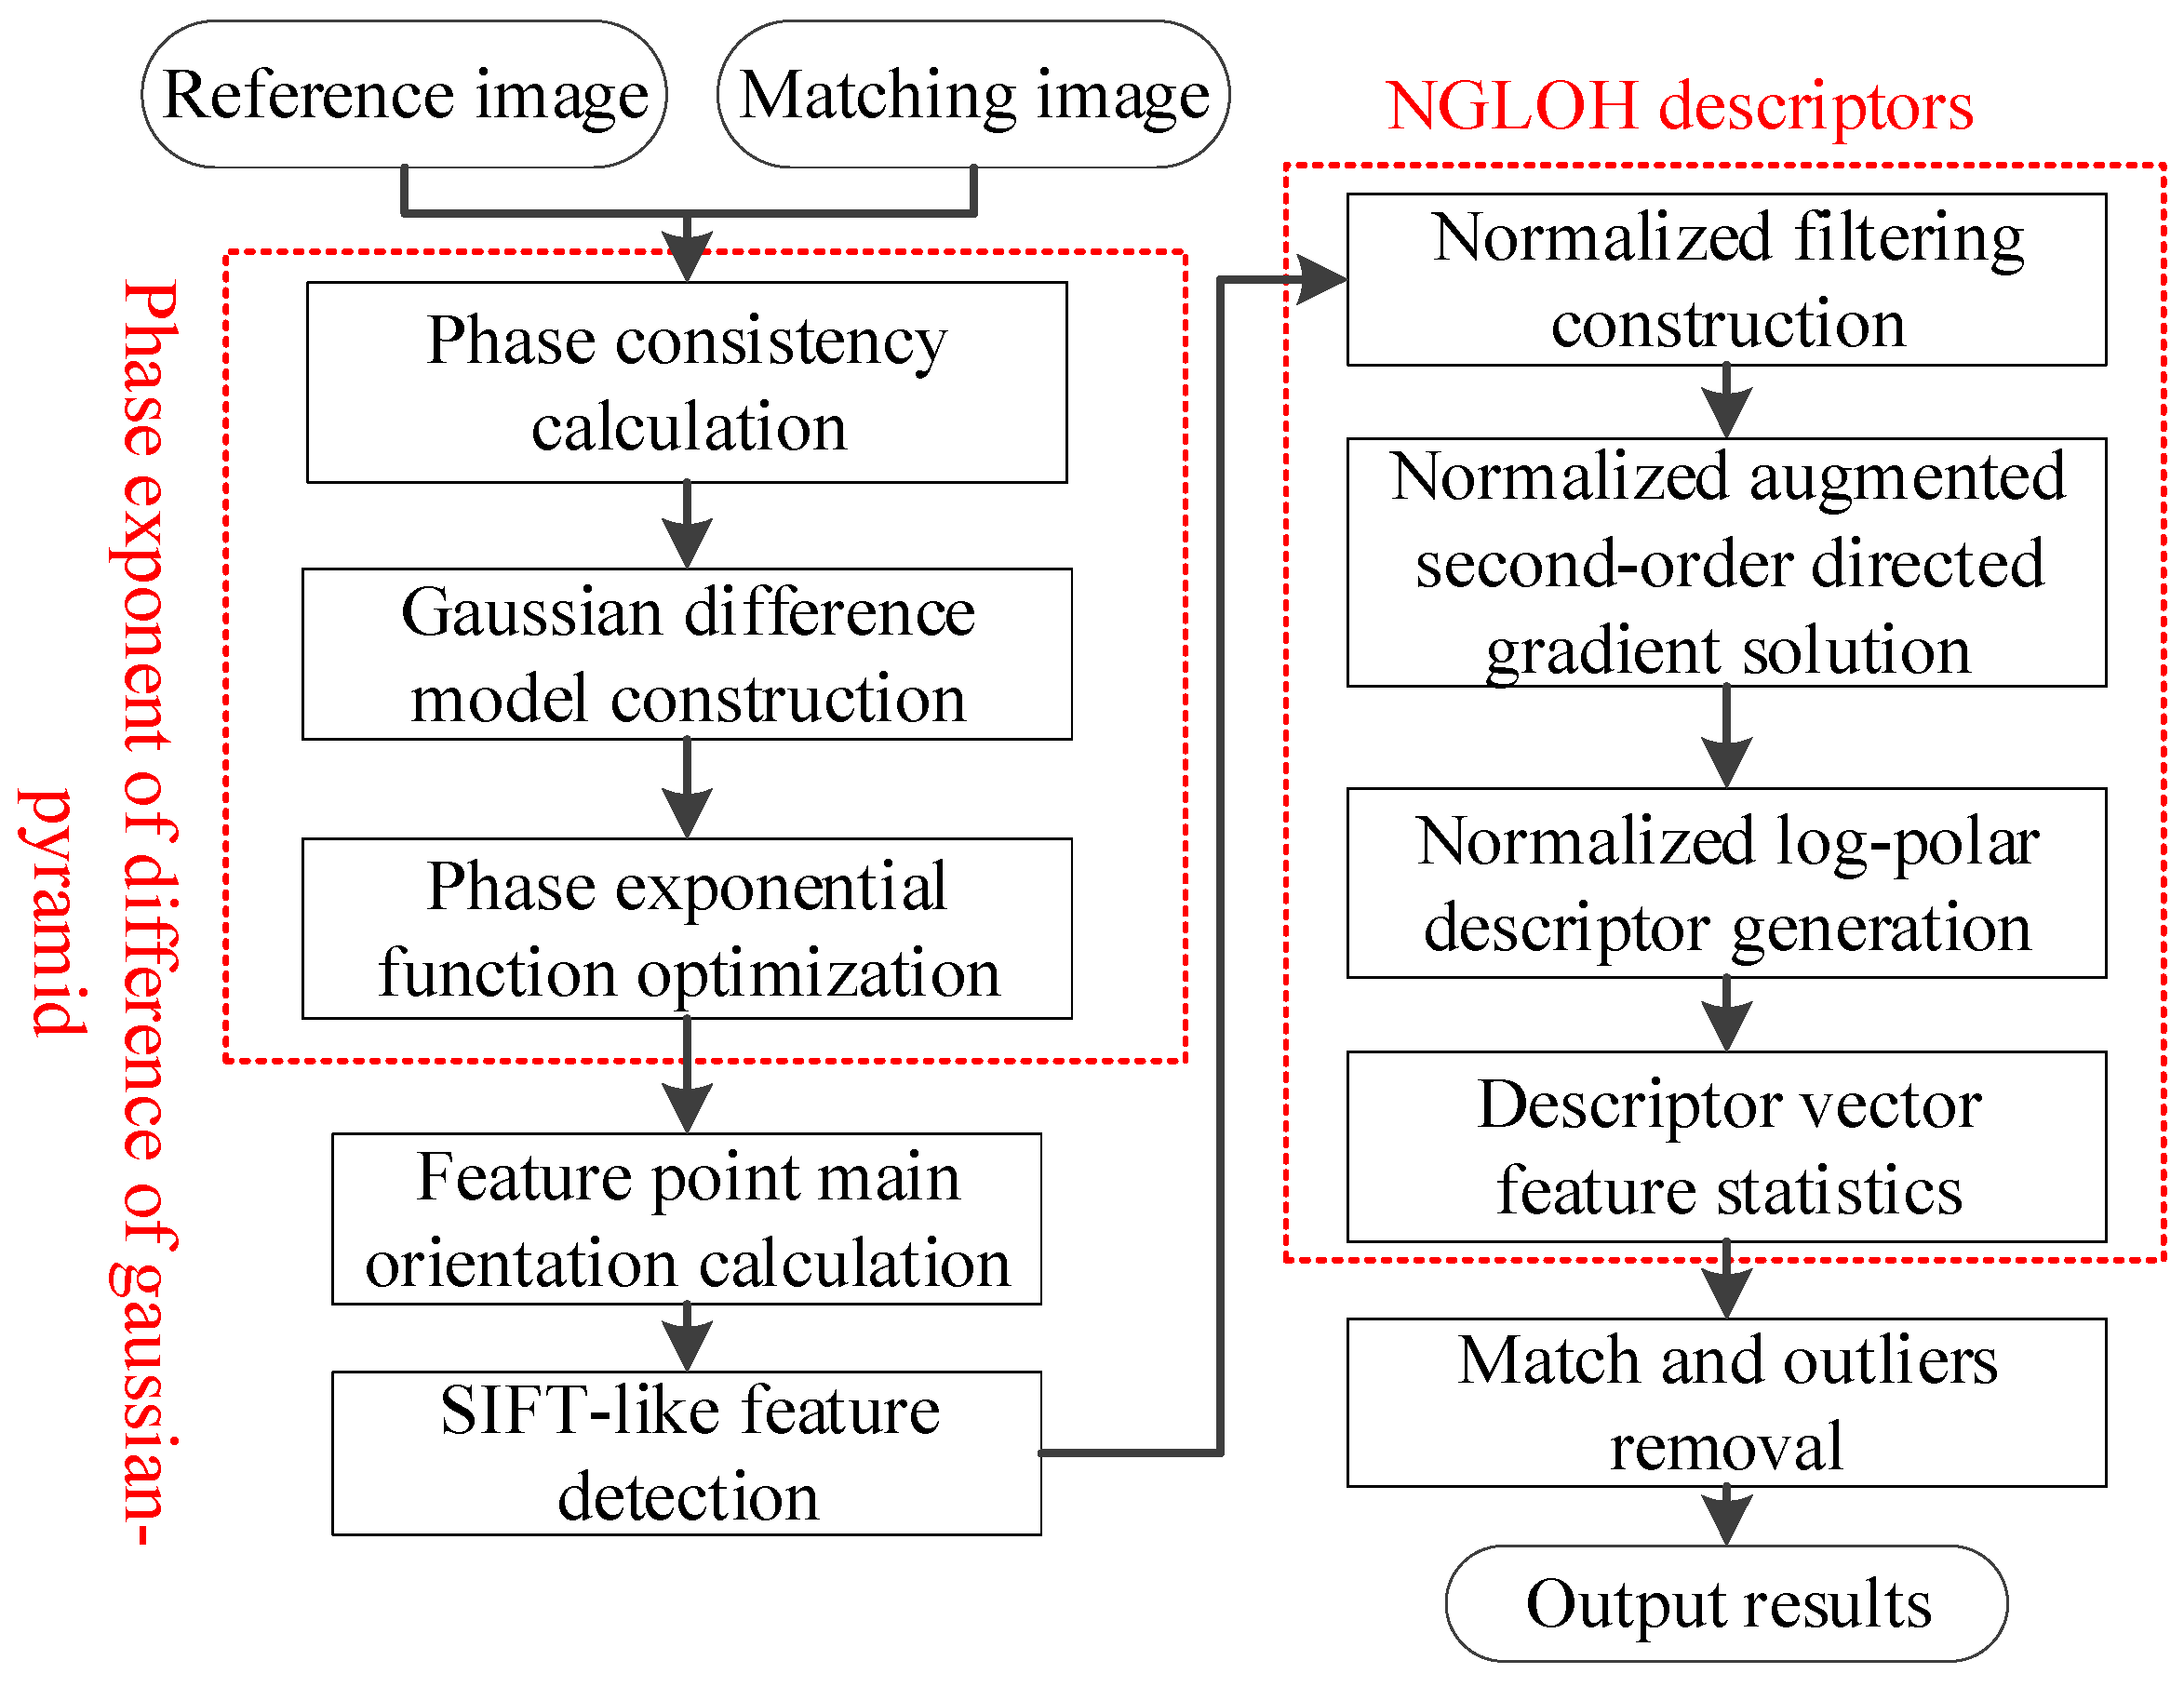
- A lightweight multi-modal image registration method was introduced that considers phase-indexed difference pyramids and normalized filtering. This approach achieves the high-precision recognition of corresponding points while maintaining geometric invariance in multi-modal matching.
- (2)
- A method for constructing phase-indexed difference pyramids was proposed. By combining the phase congruency model with differences in the Gaussian pyramid and optimizing it using exponential functions, we established the phase-indexed difference pyramid image space. We also employed an SIFT-like feature extractor to extract robust feature points.
- (3)
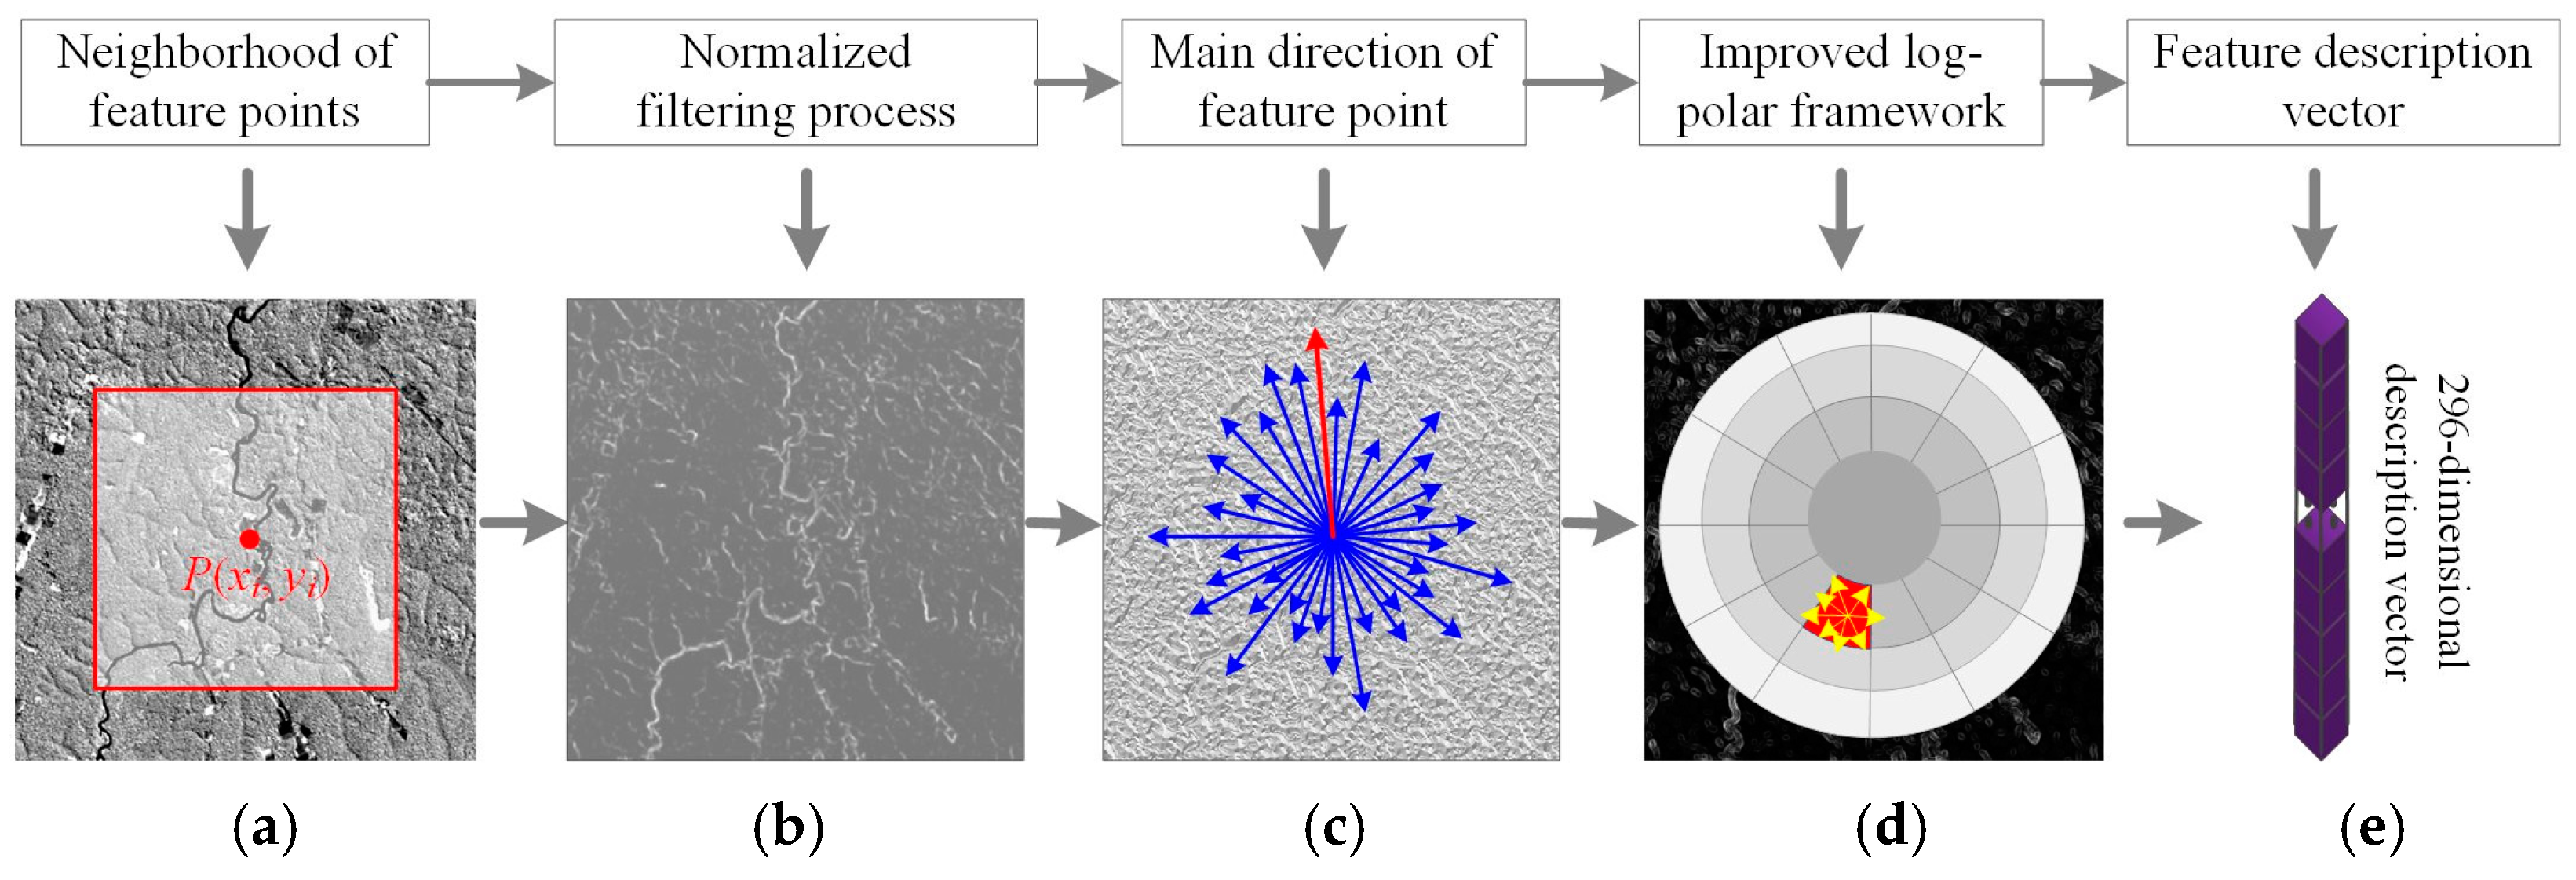
- A method for normalized filtering in logarithmic polar descriptors was introduced. This involves incorporating normalized filtering functions to enhance structural information in images, constructing second-order gradient-oriented features, and ultimately using a logarithmic polar coordinate framework to generate efficient descriptors that represent features in multi-modal images effectively.
2. Relate Work
3. Methods
3.1. Phase Exponent of Difference of Gaussian-Pyramid
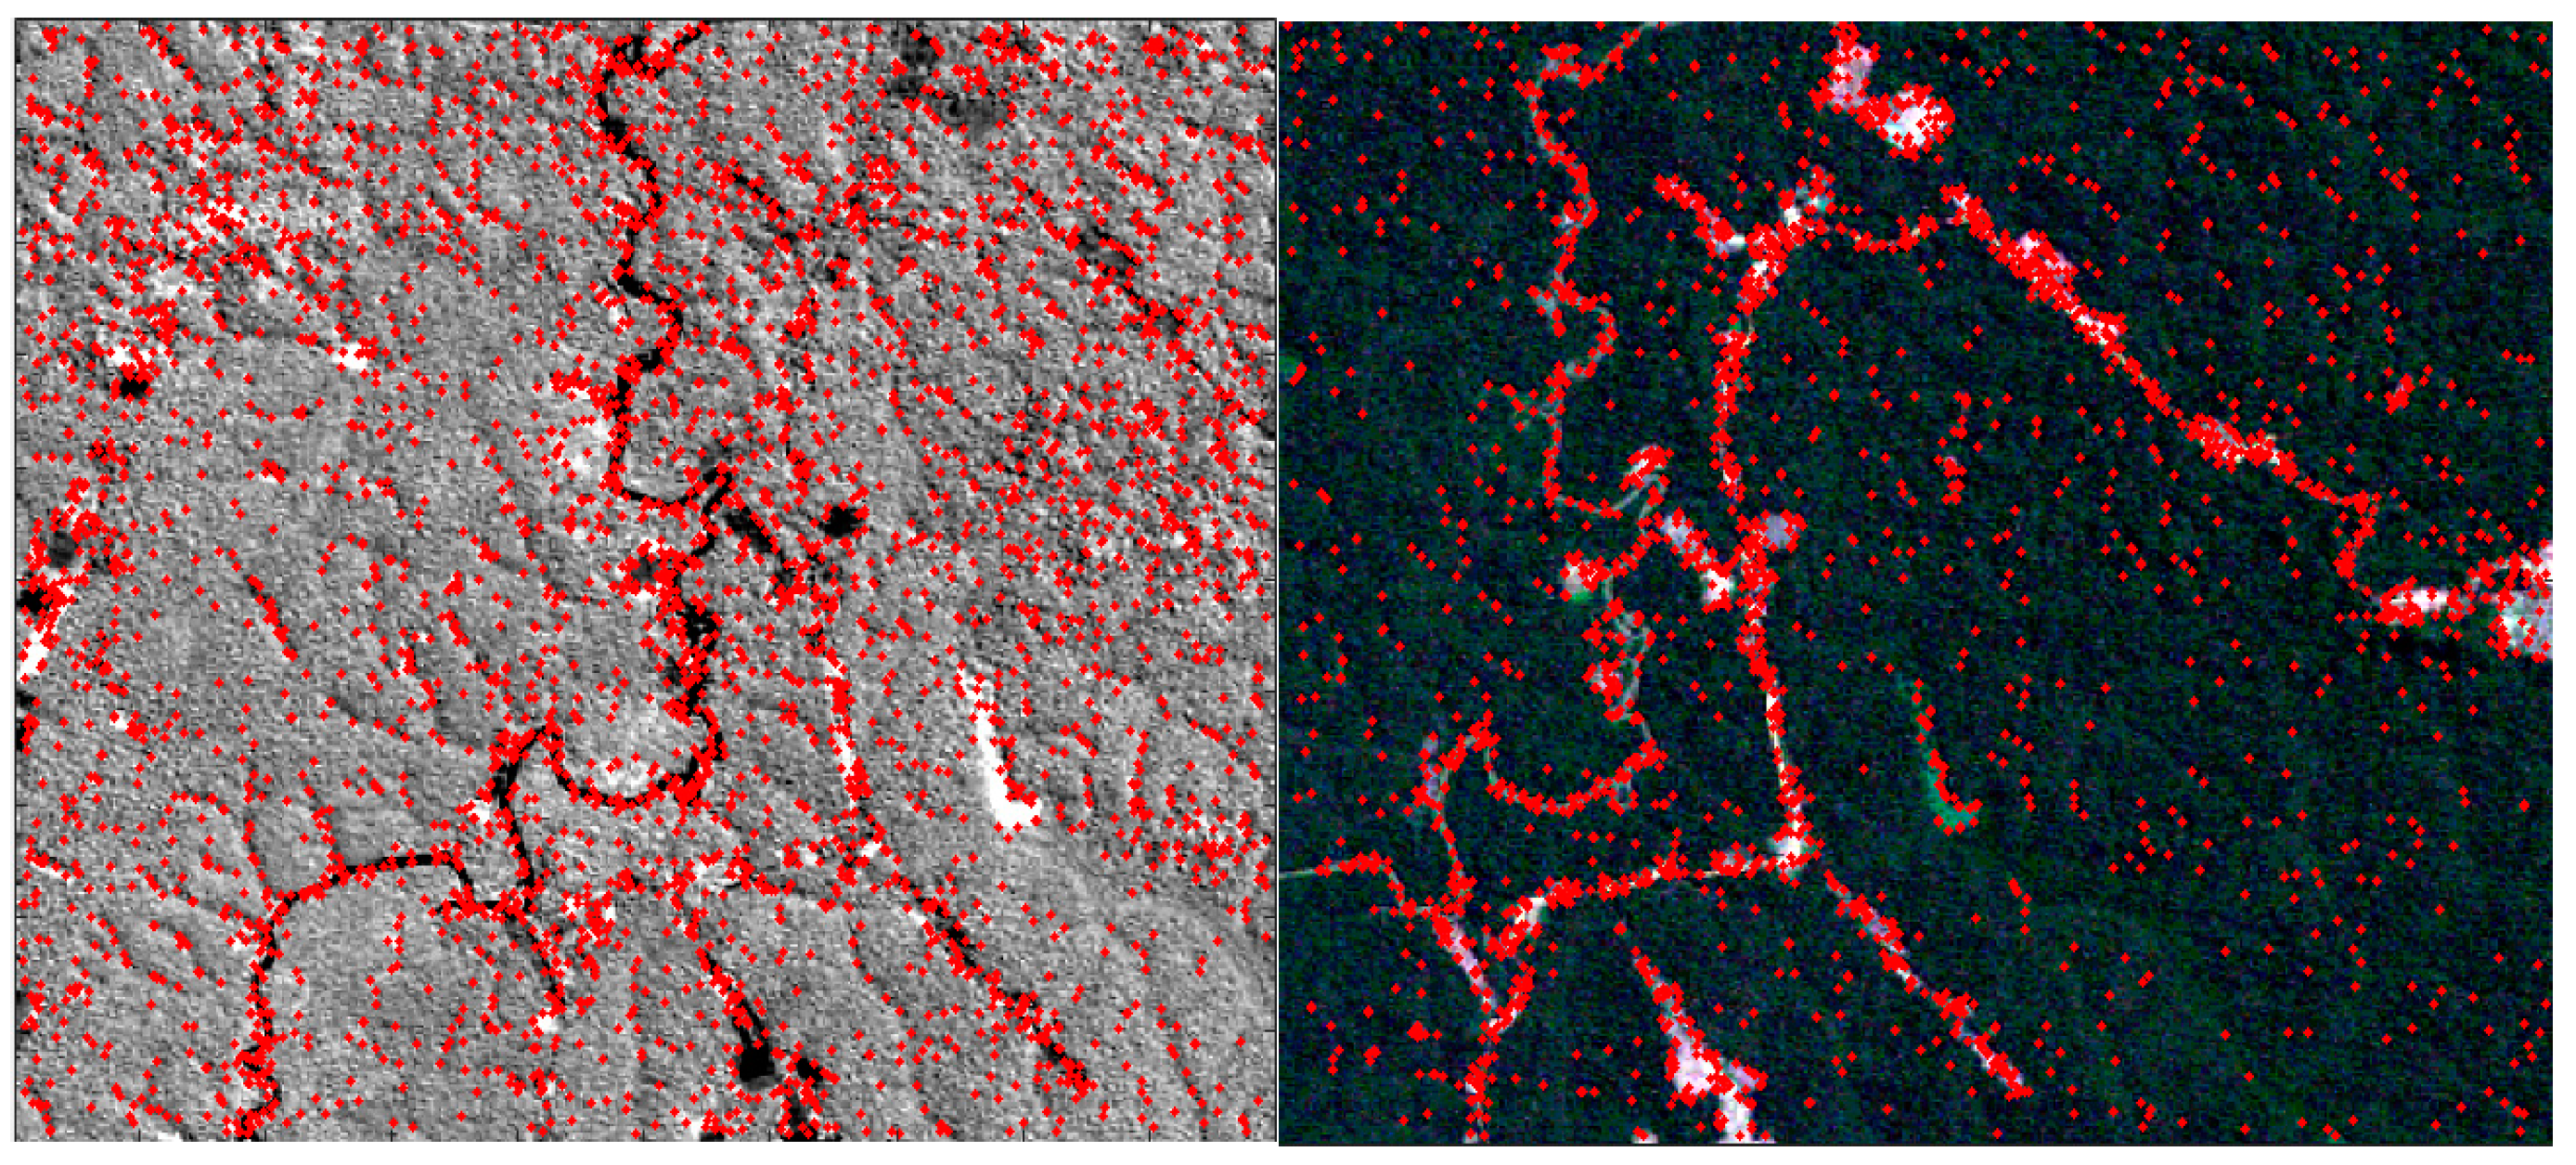
3.2. Improved Feature Detection
3.3. Improved GLOH-like Feature Descriptors
3.3.1. Normalized Filtering of Image-Oriented Gradient Features
3.3.2. Log-Polar Descriptive Feature Solving
4. Results
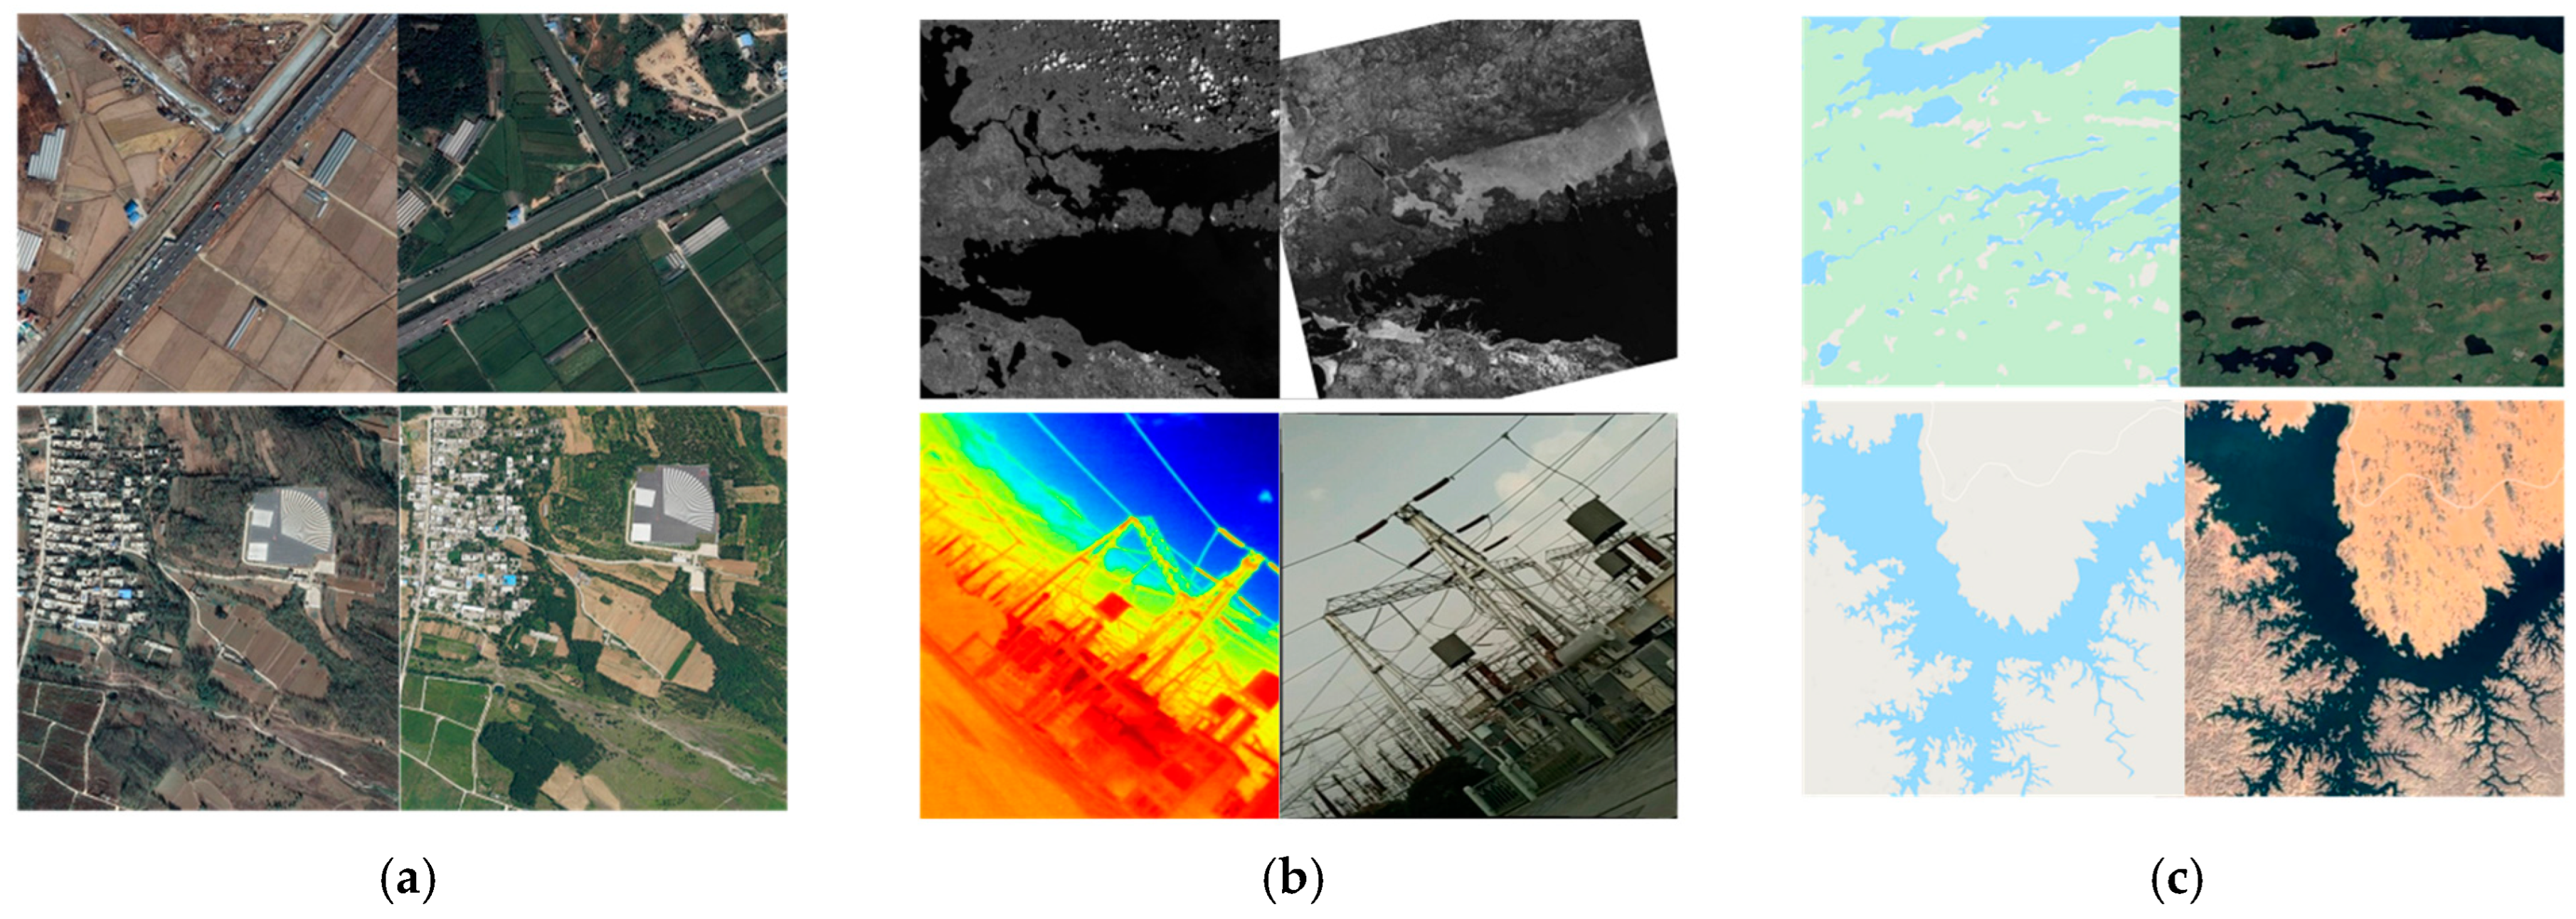
4.1. Experimental Datasets
4.2. Evaluation of Indicators
4.3. Results
- (1)
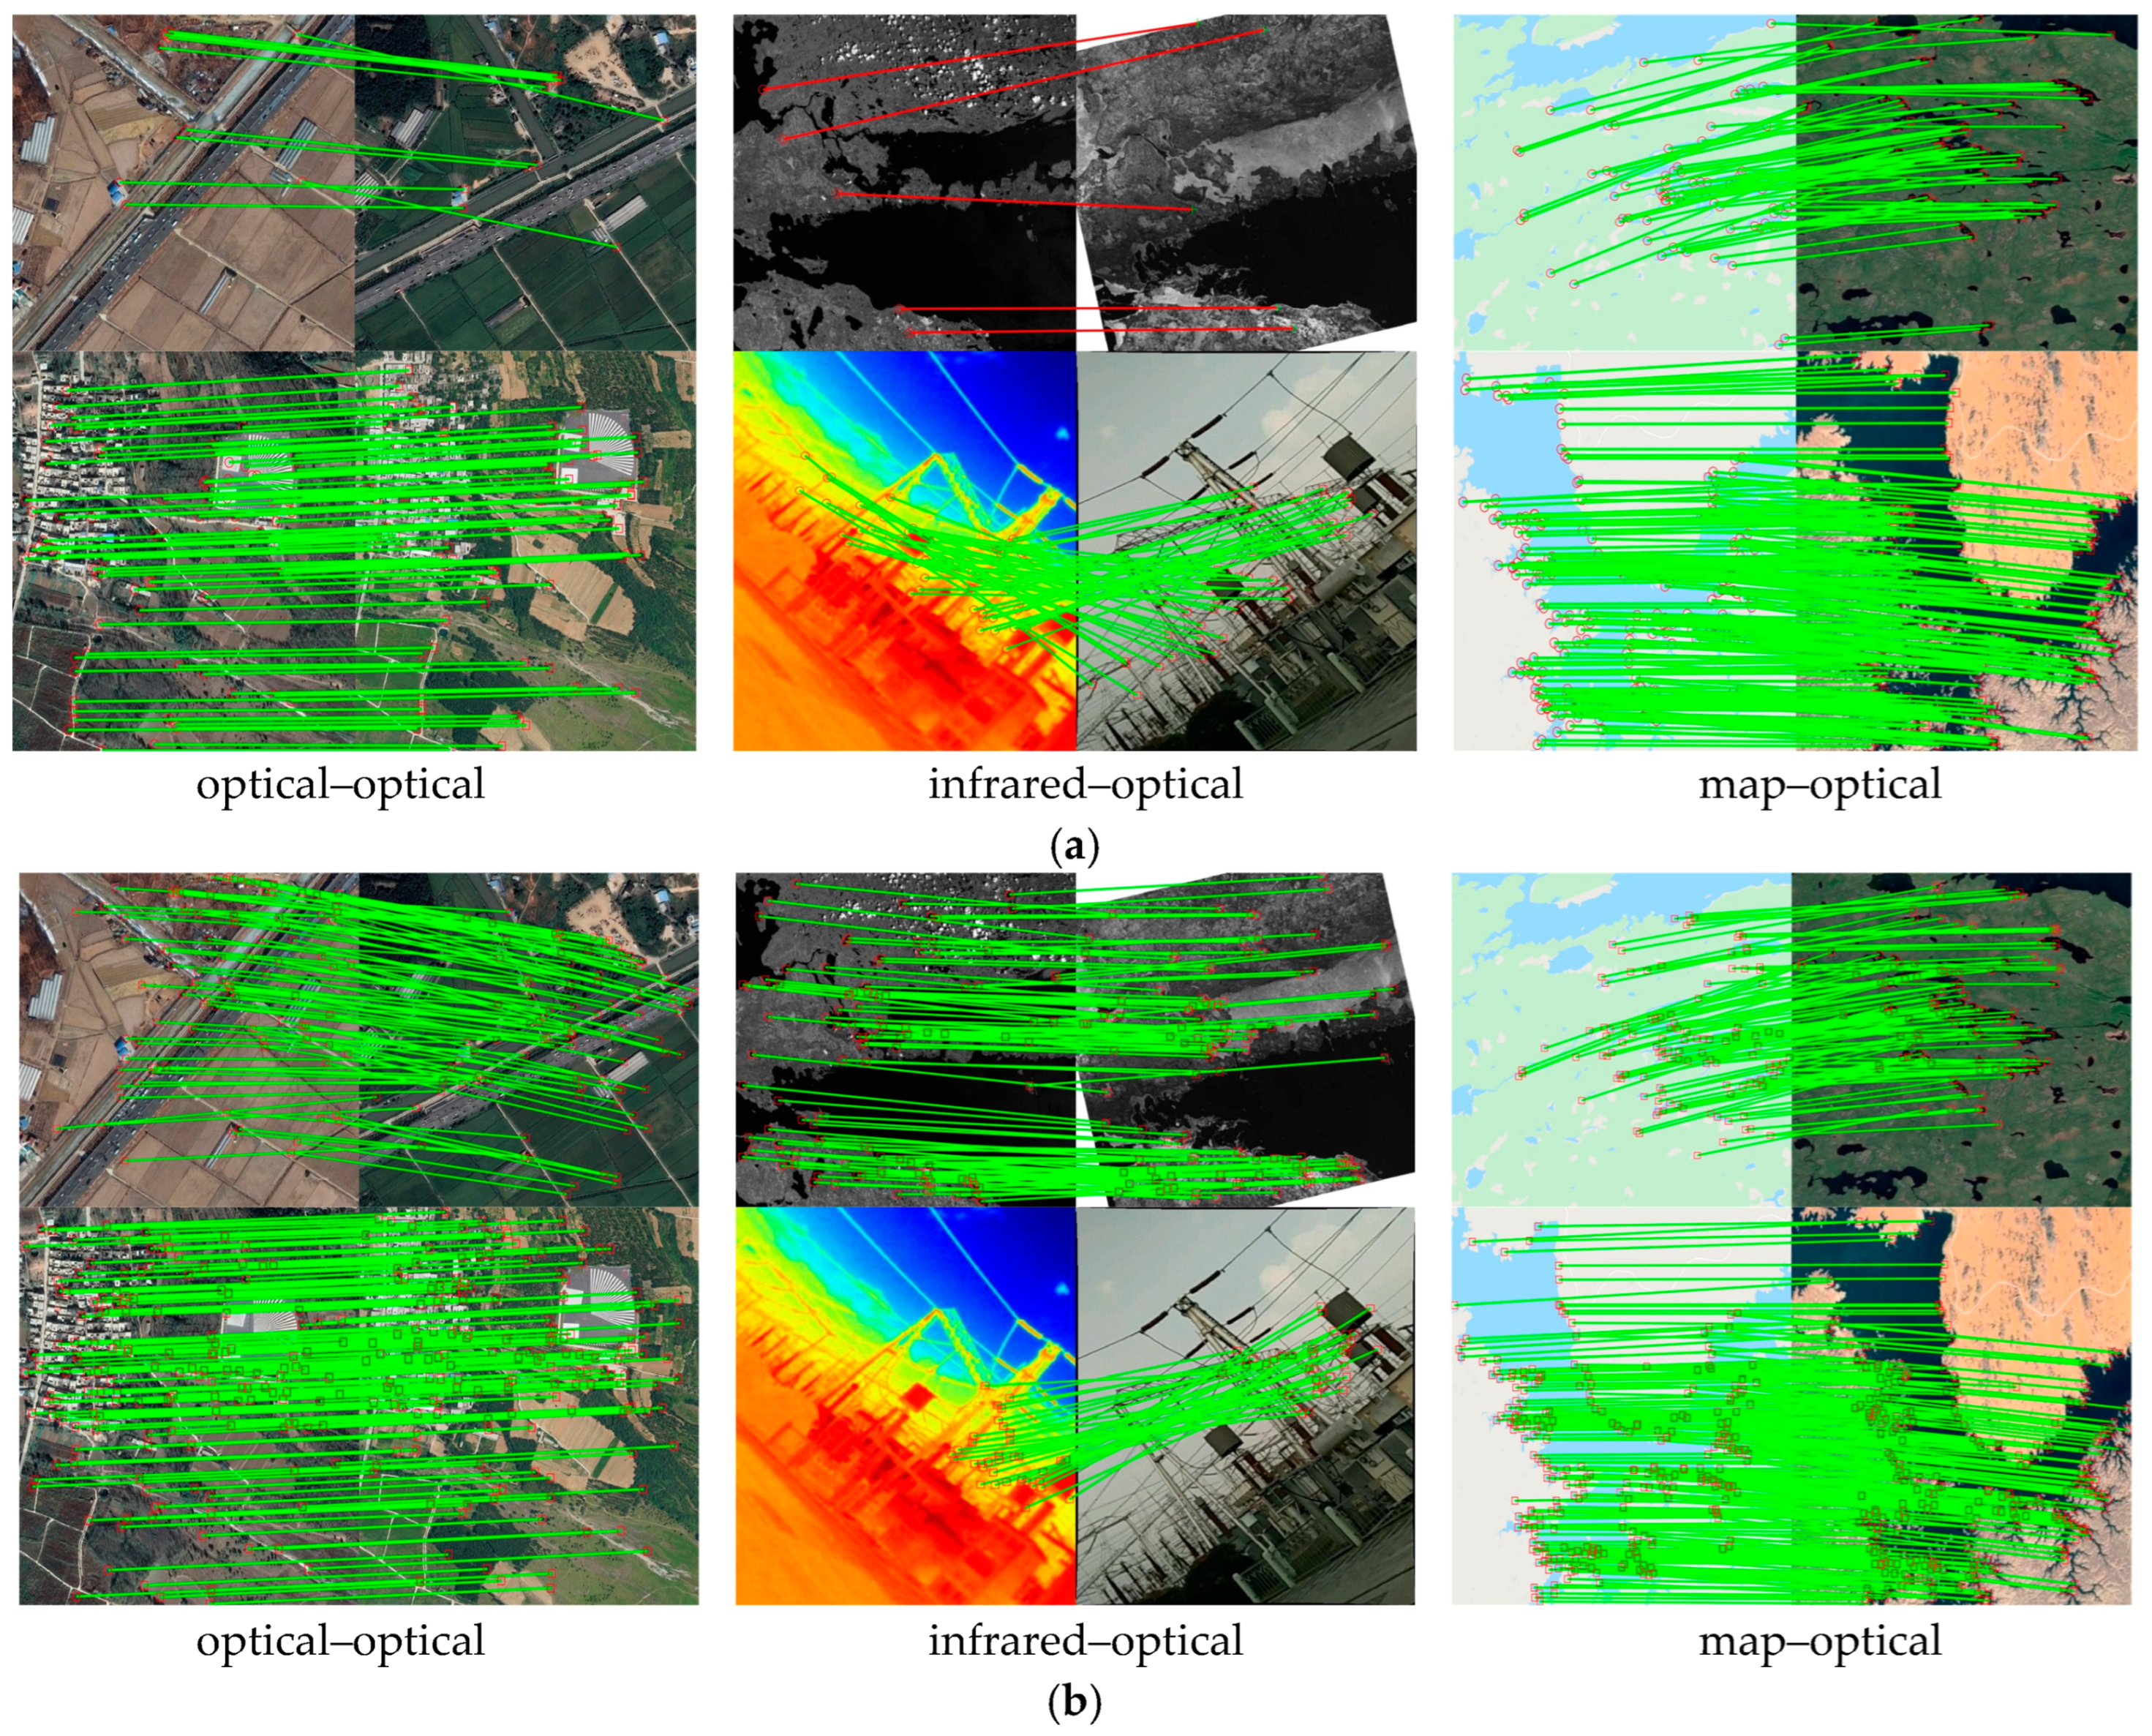
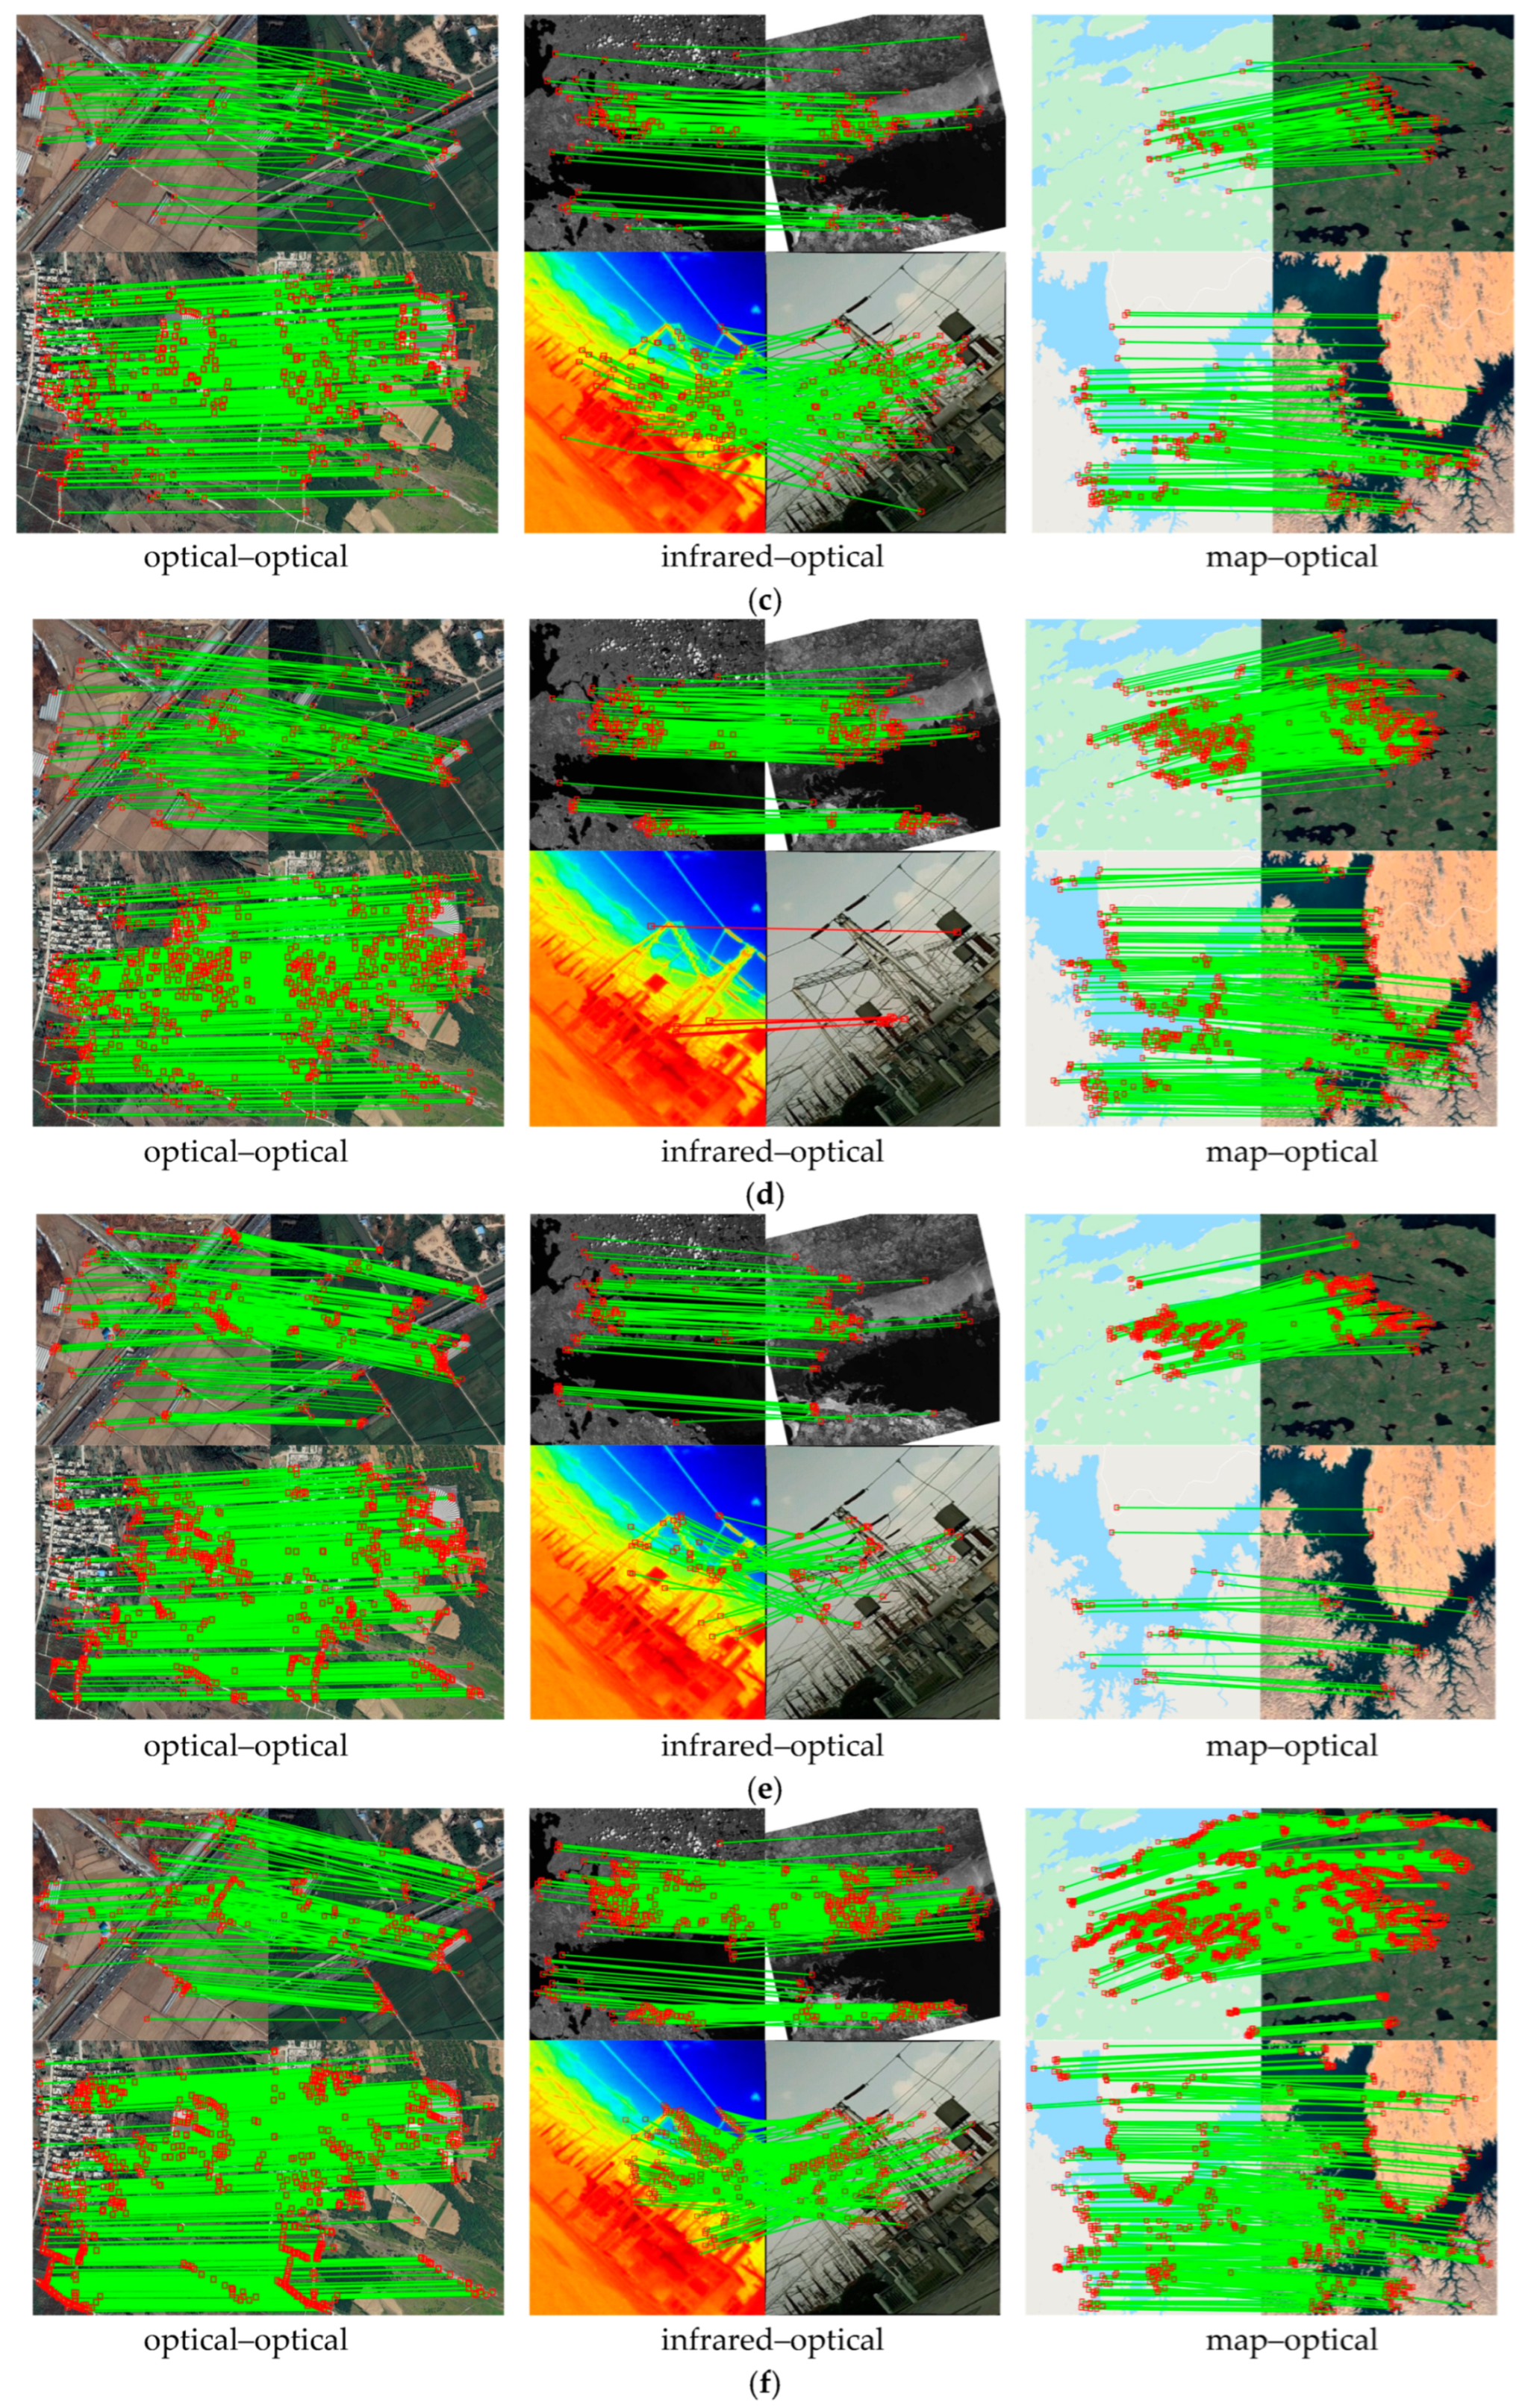
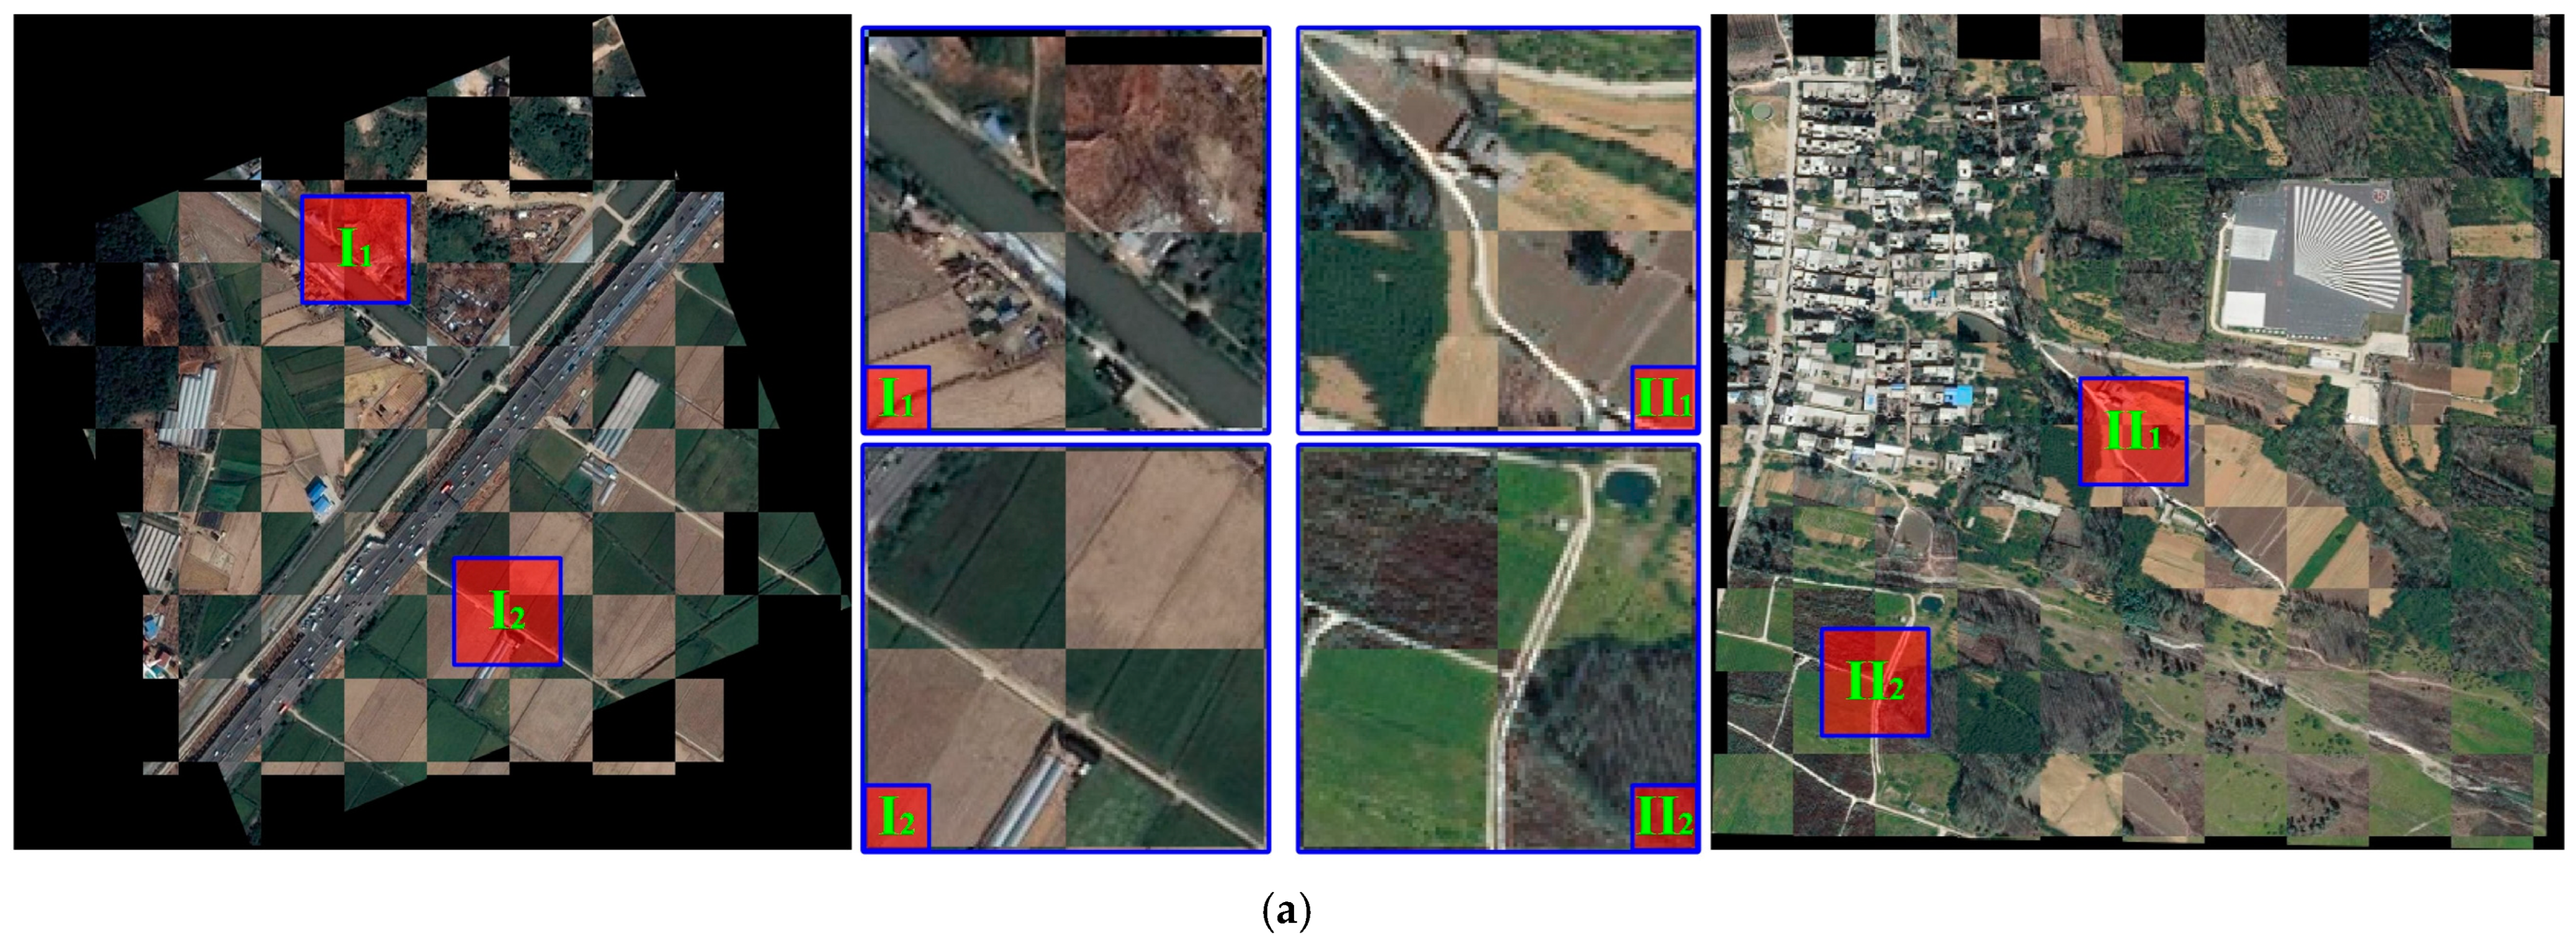
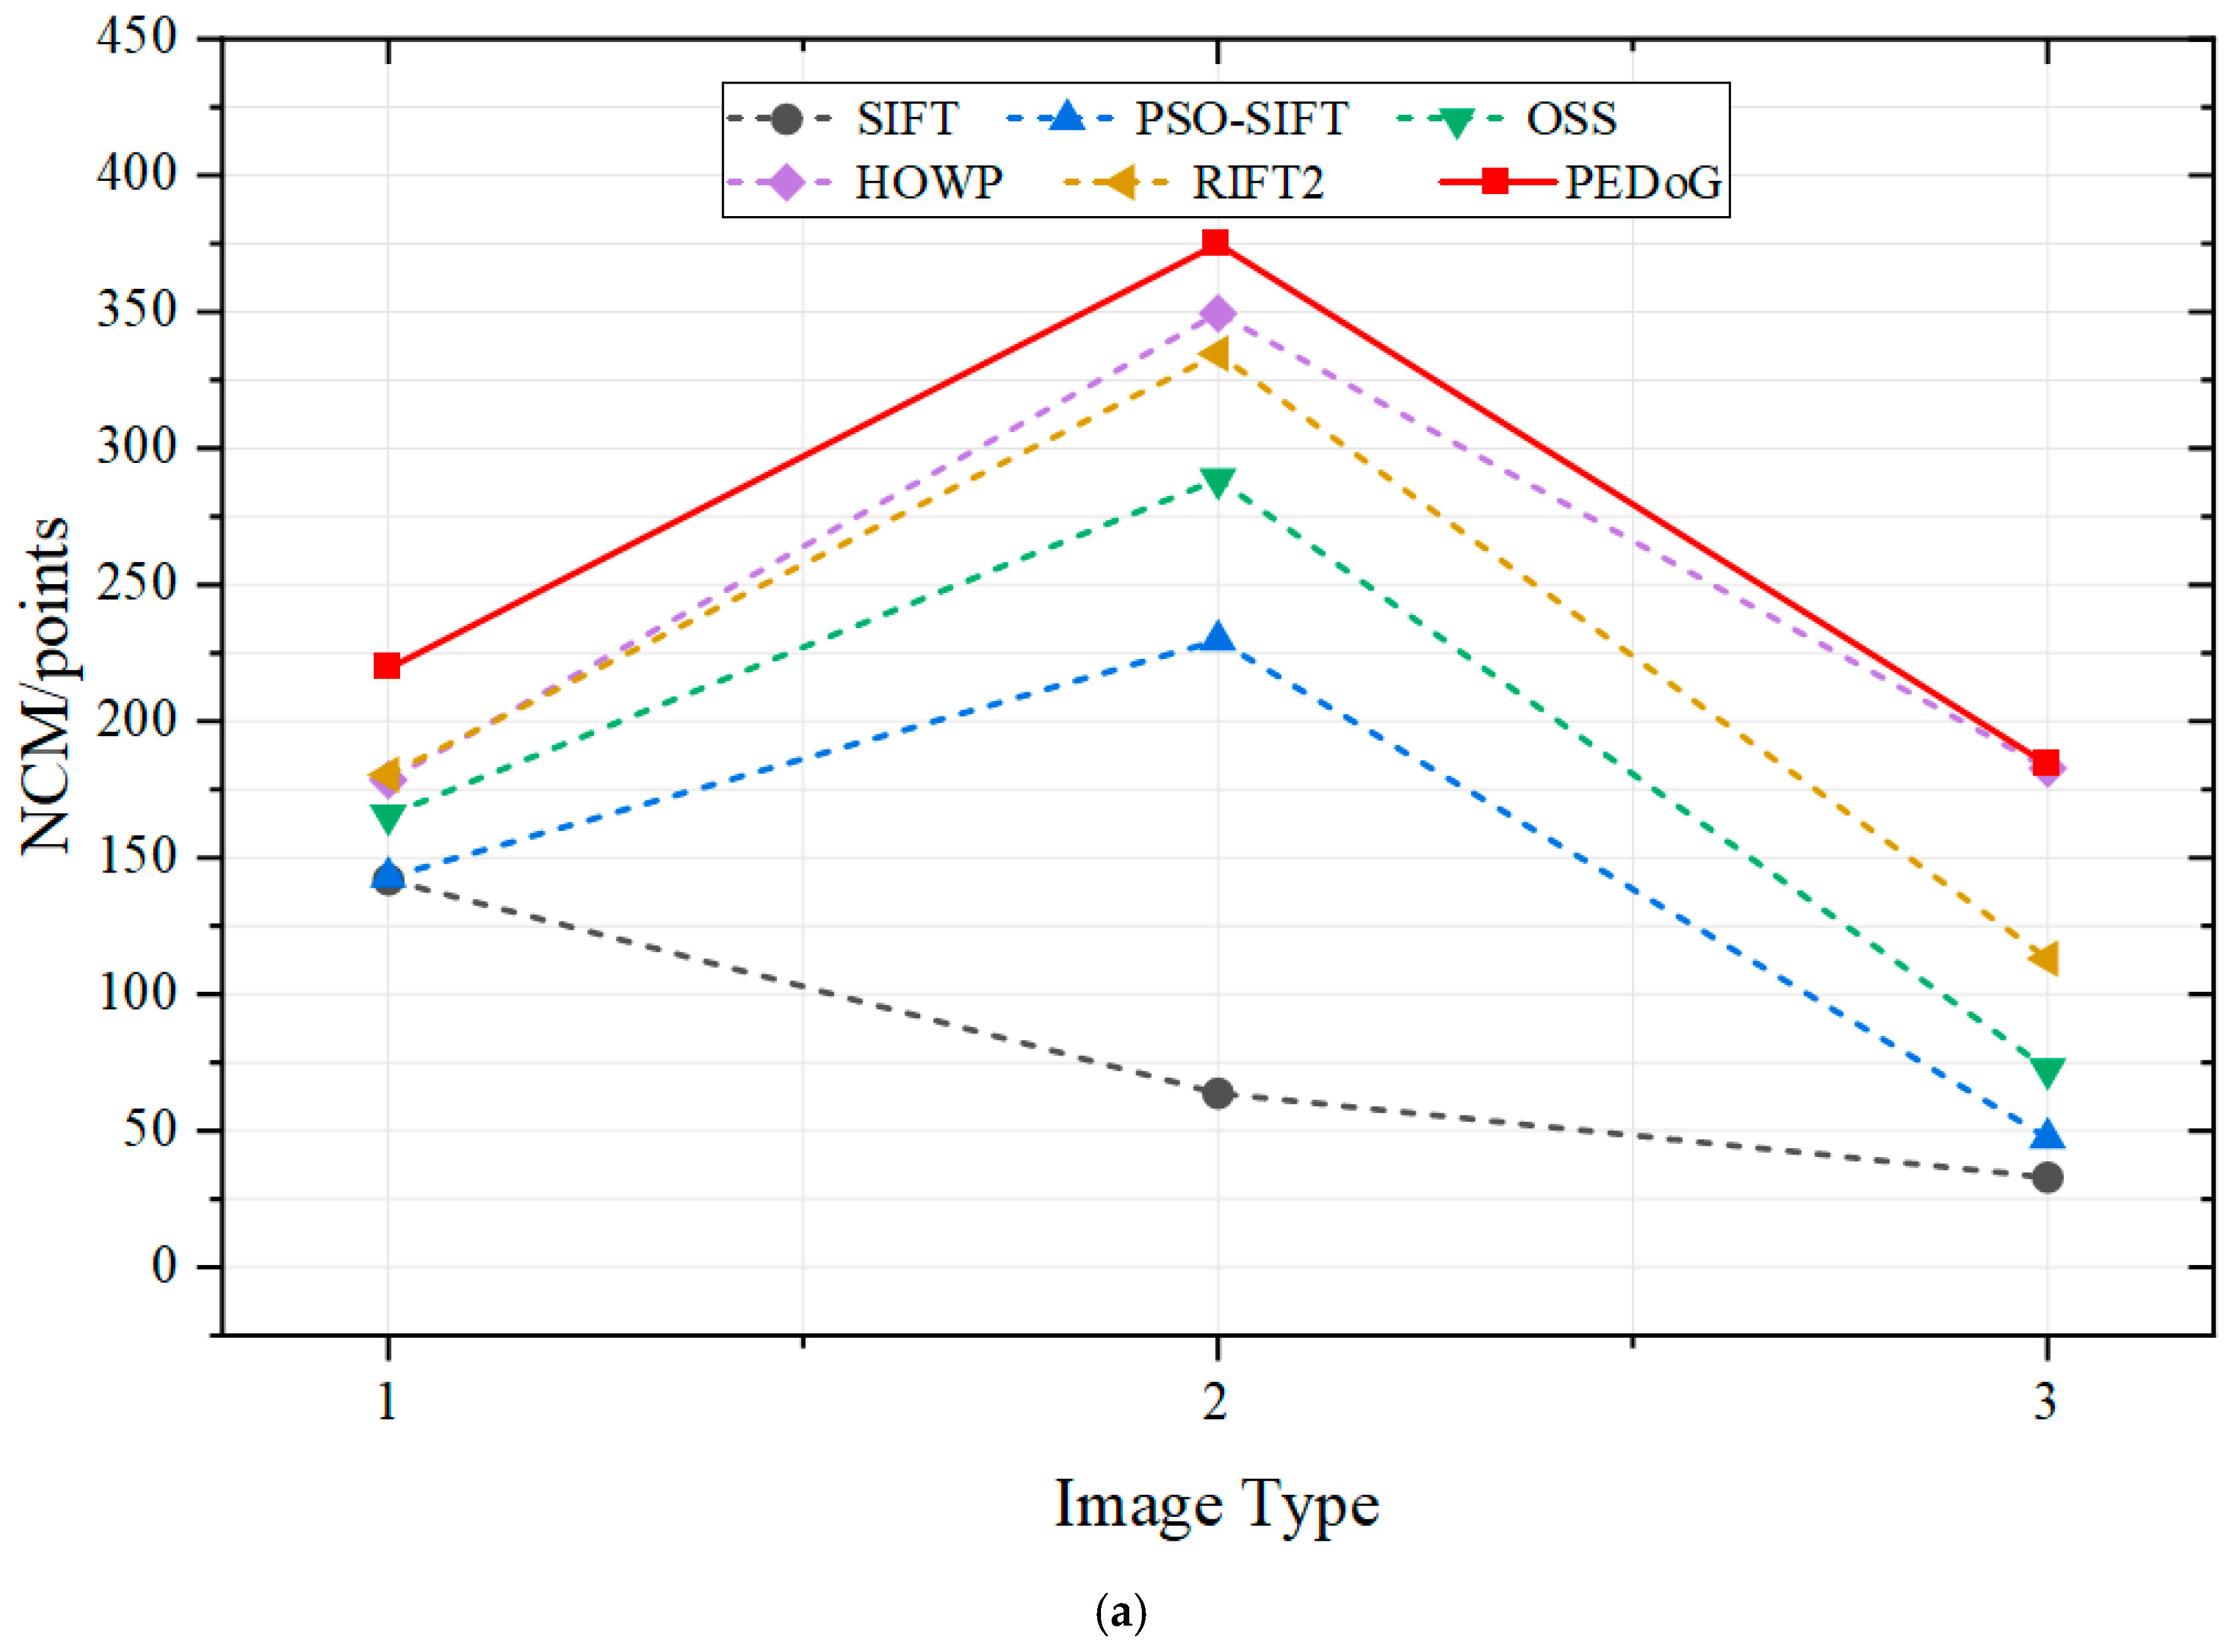
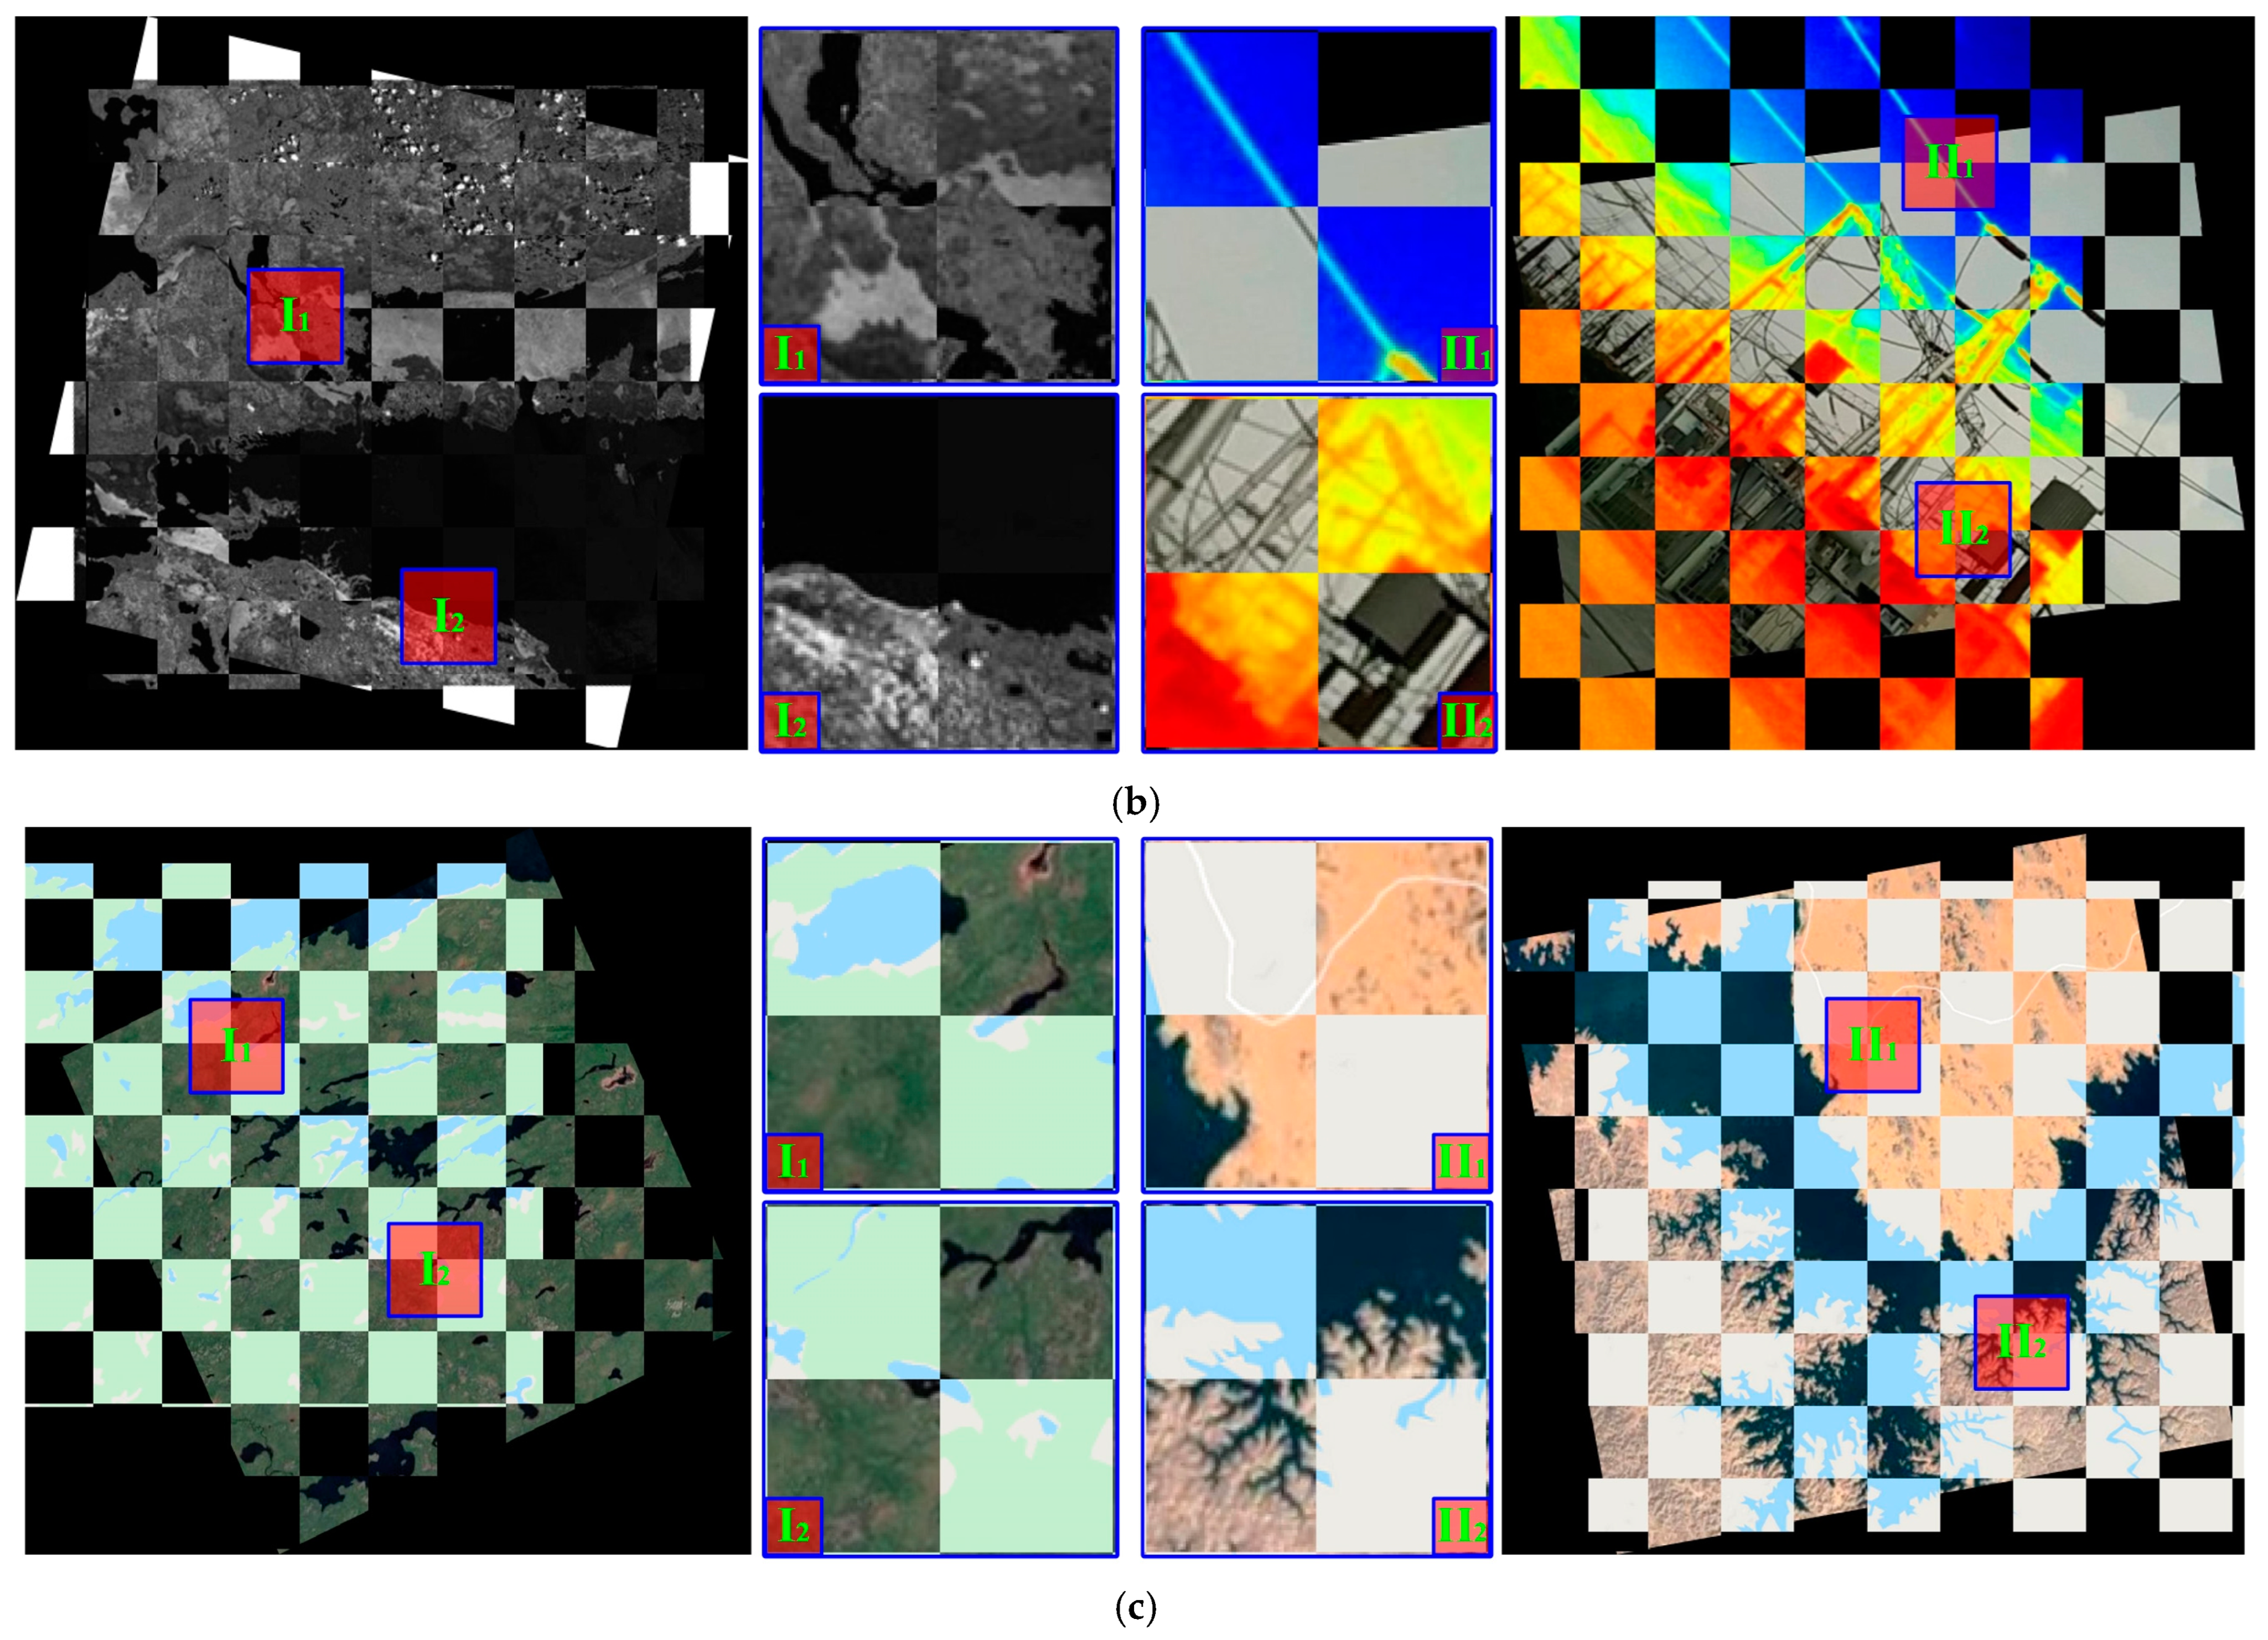
- Qualitative results
- (2)
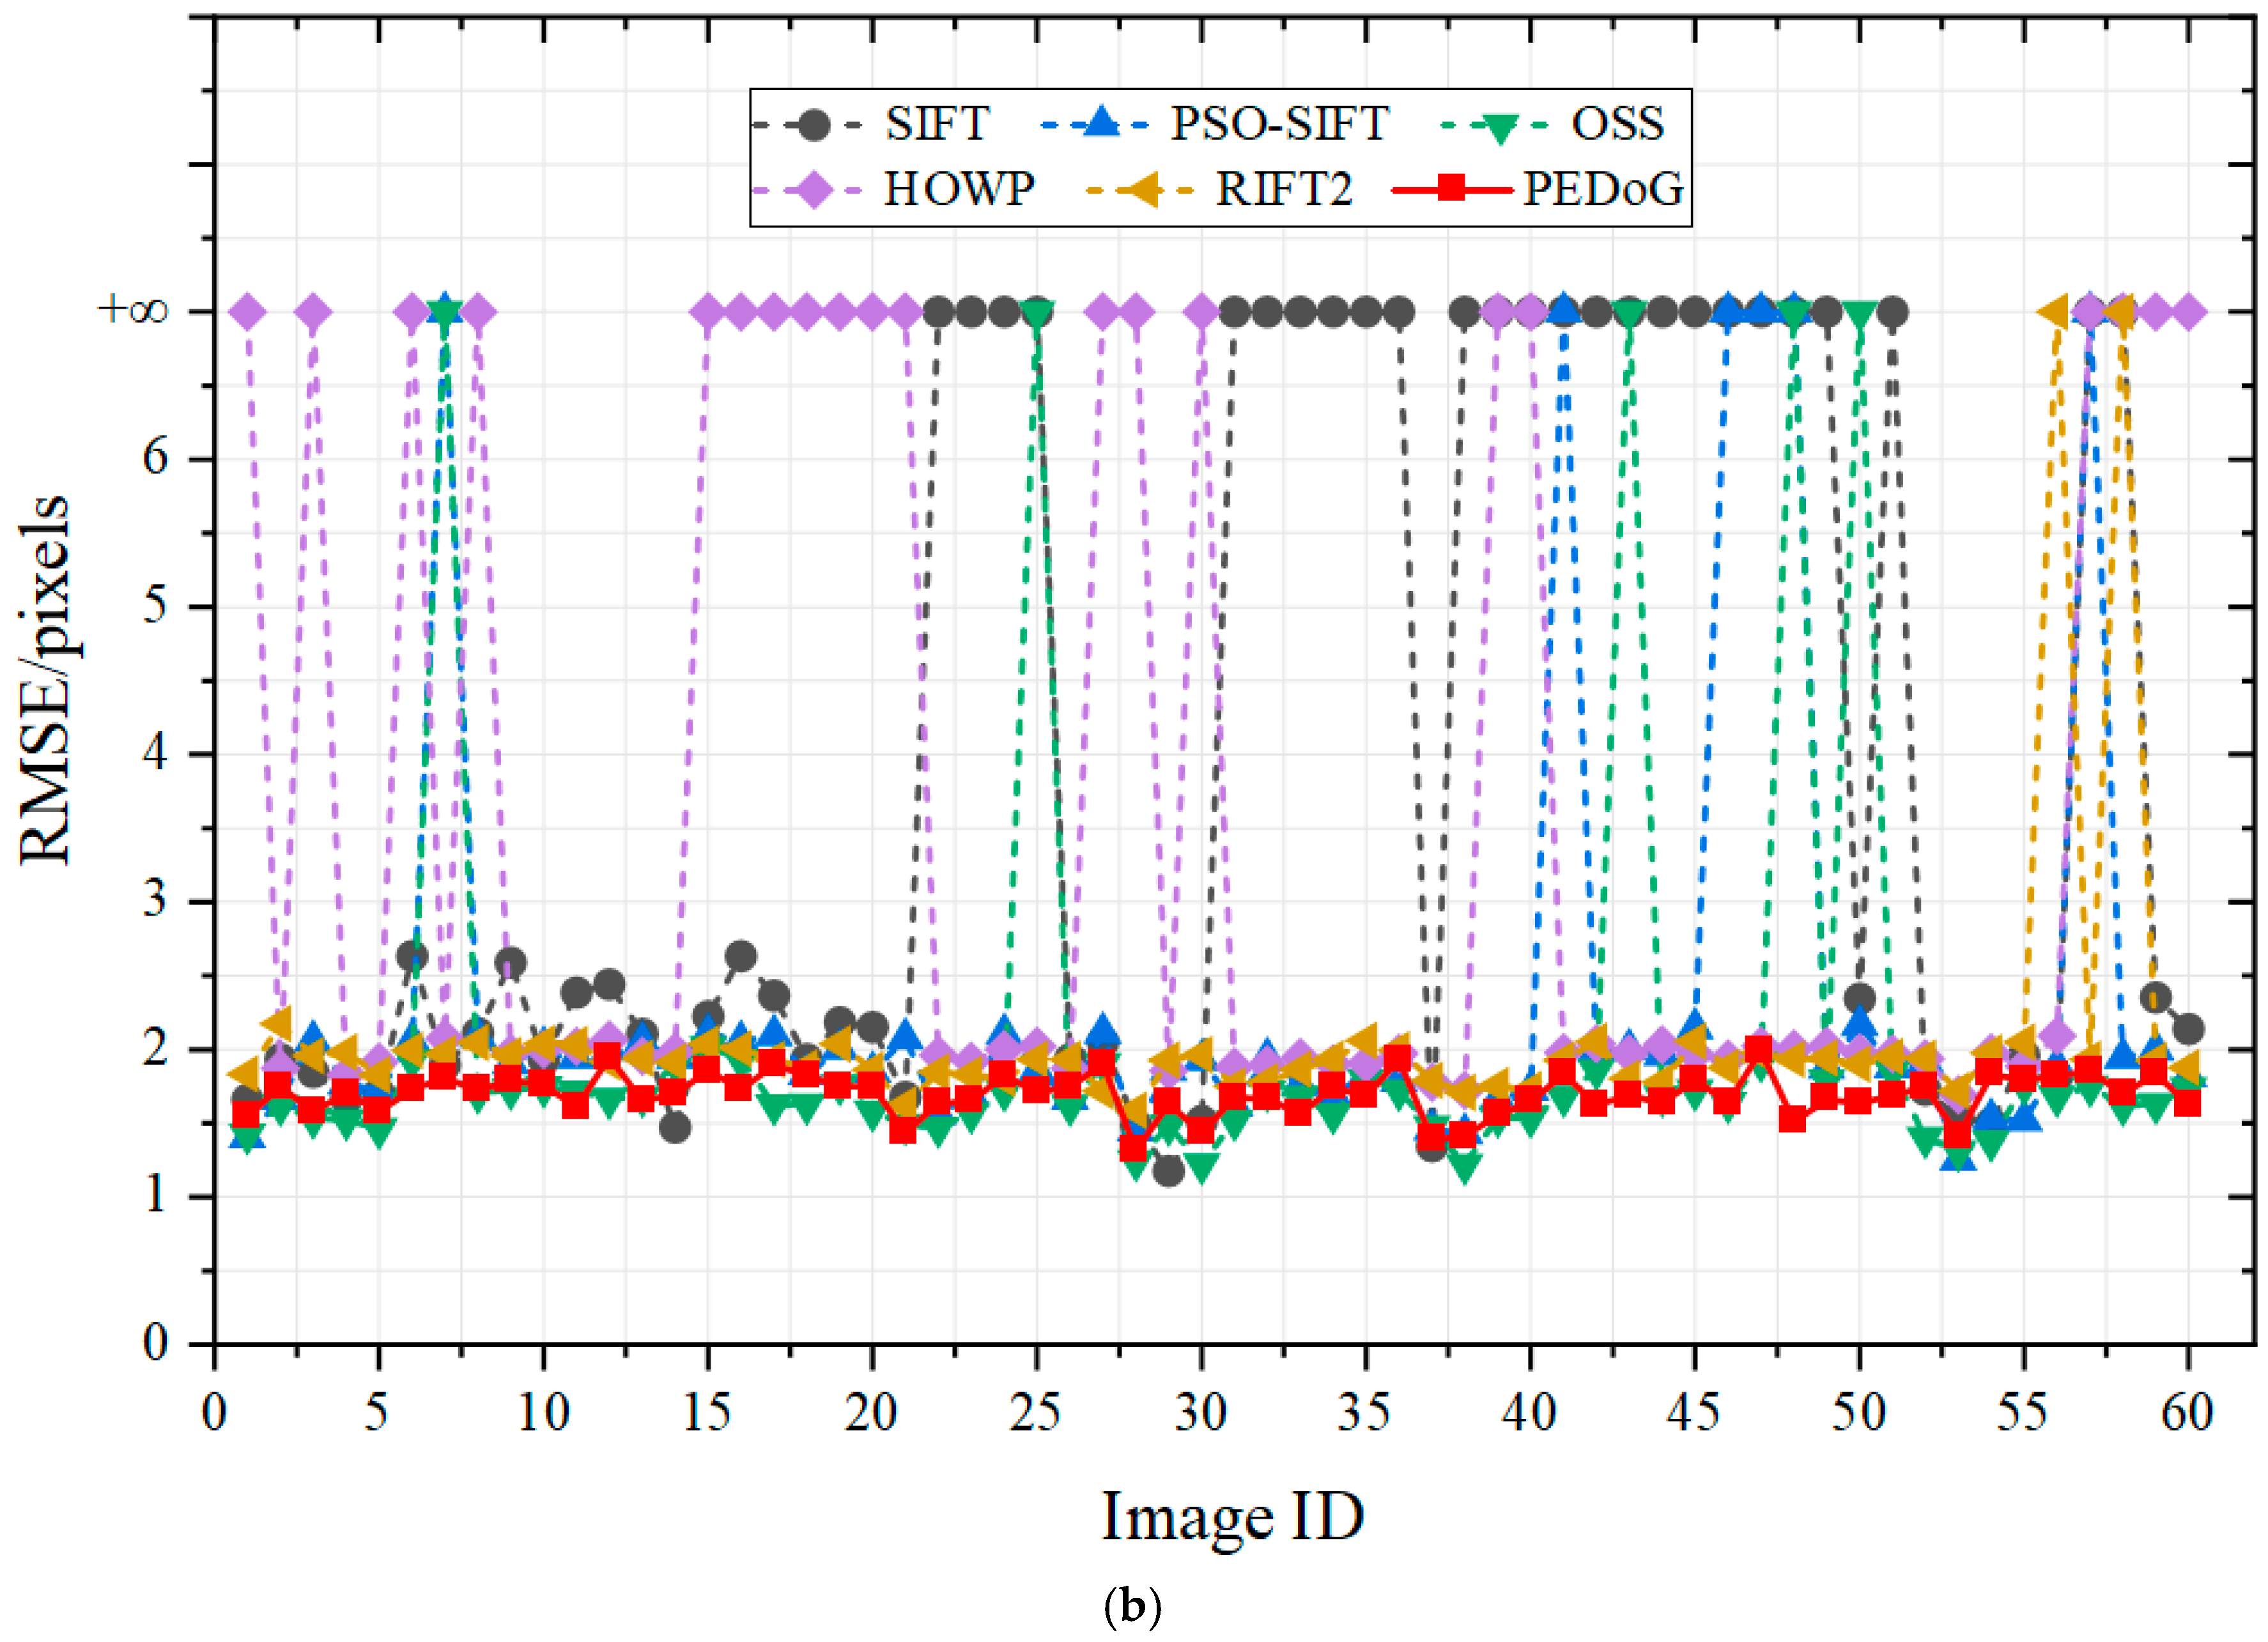
- Results of the registration
5. Analysis and Discussion
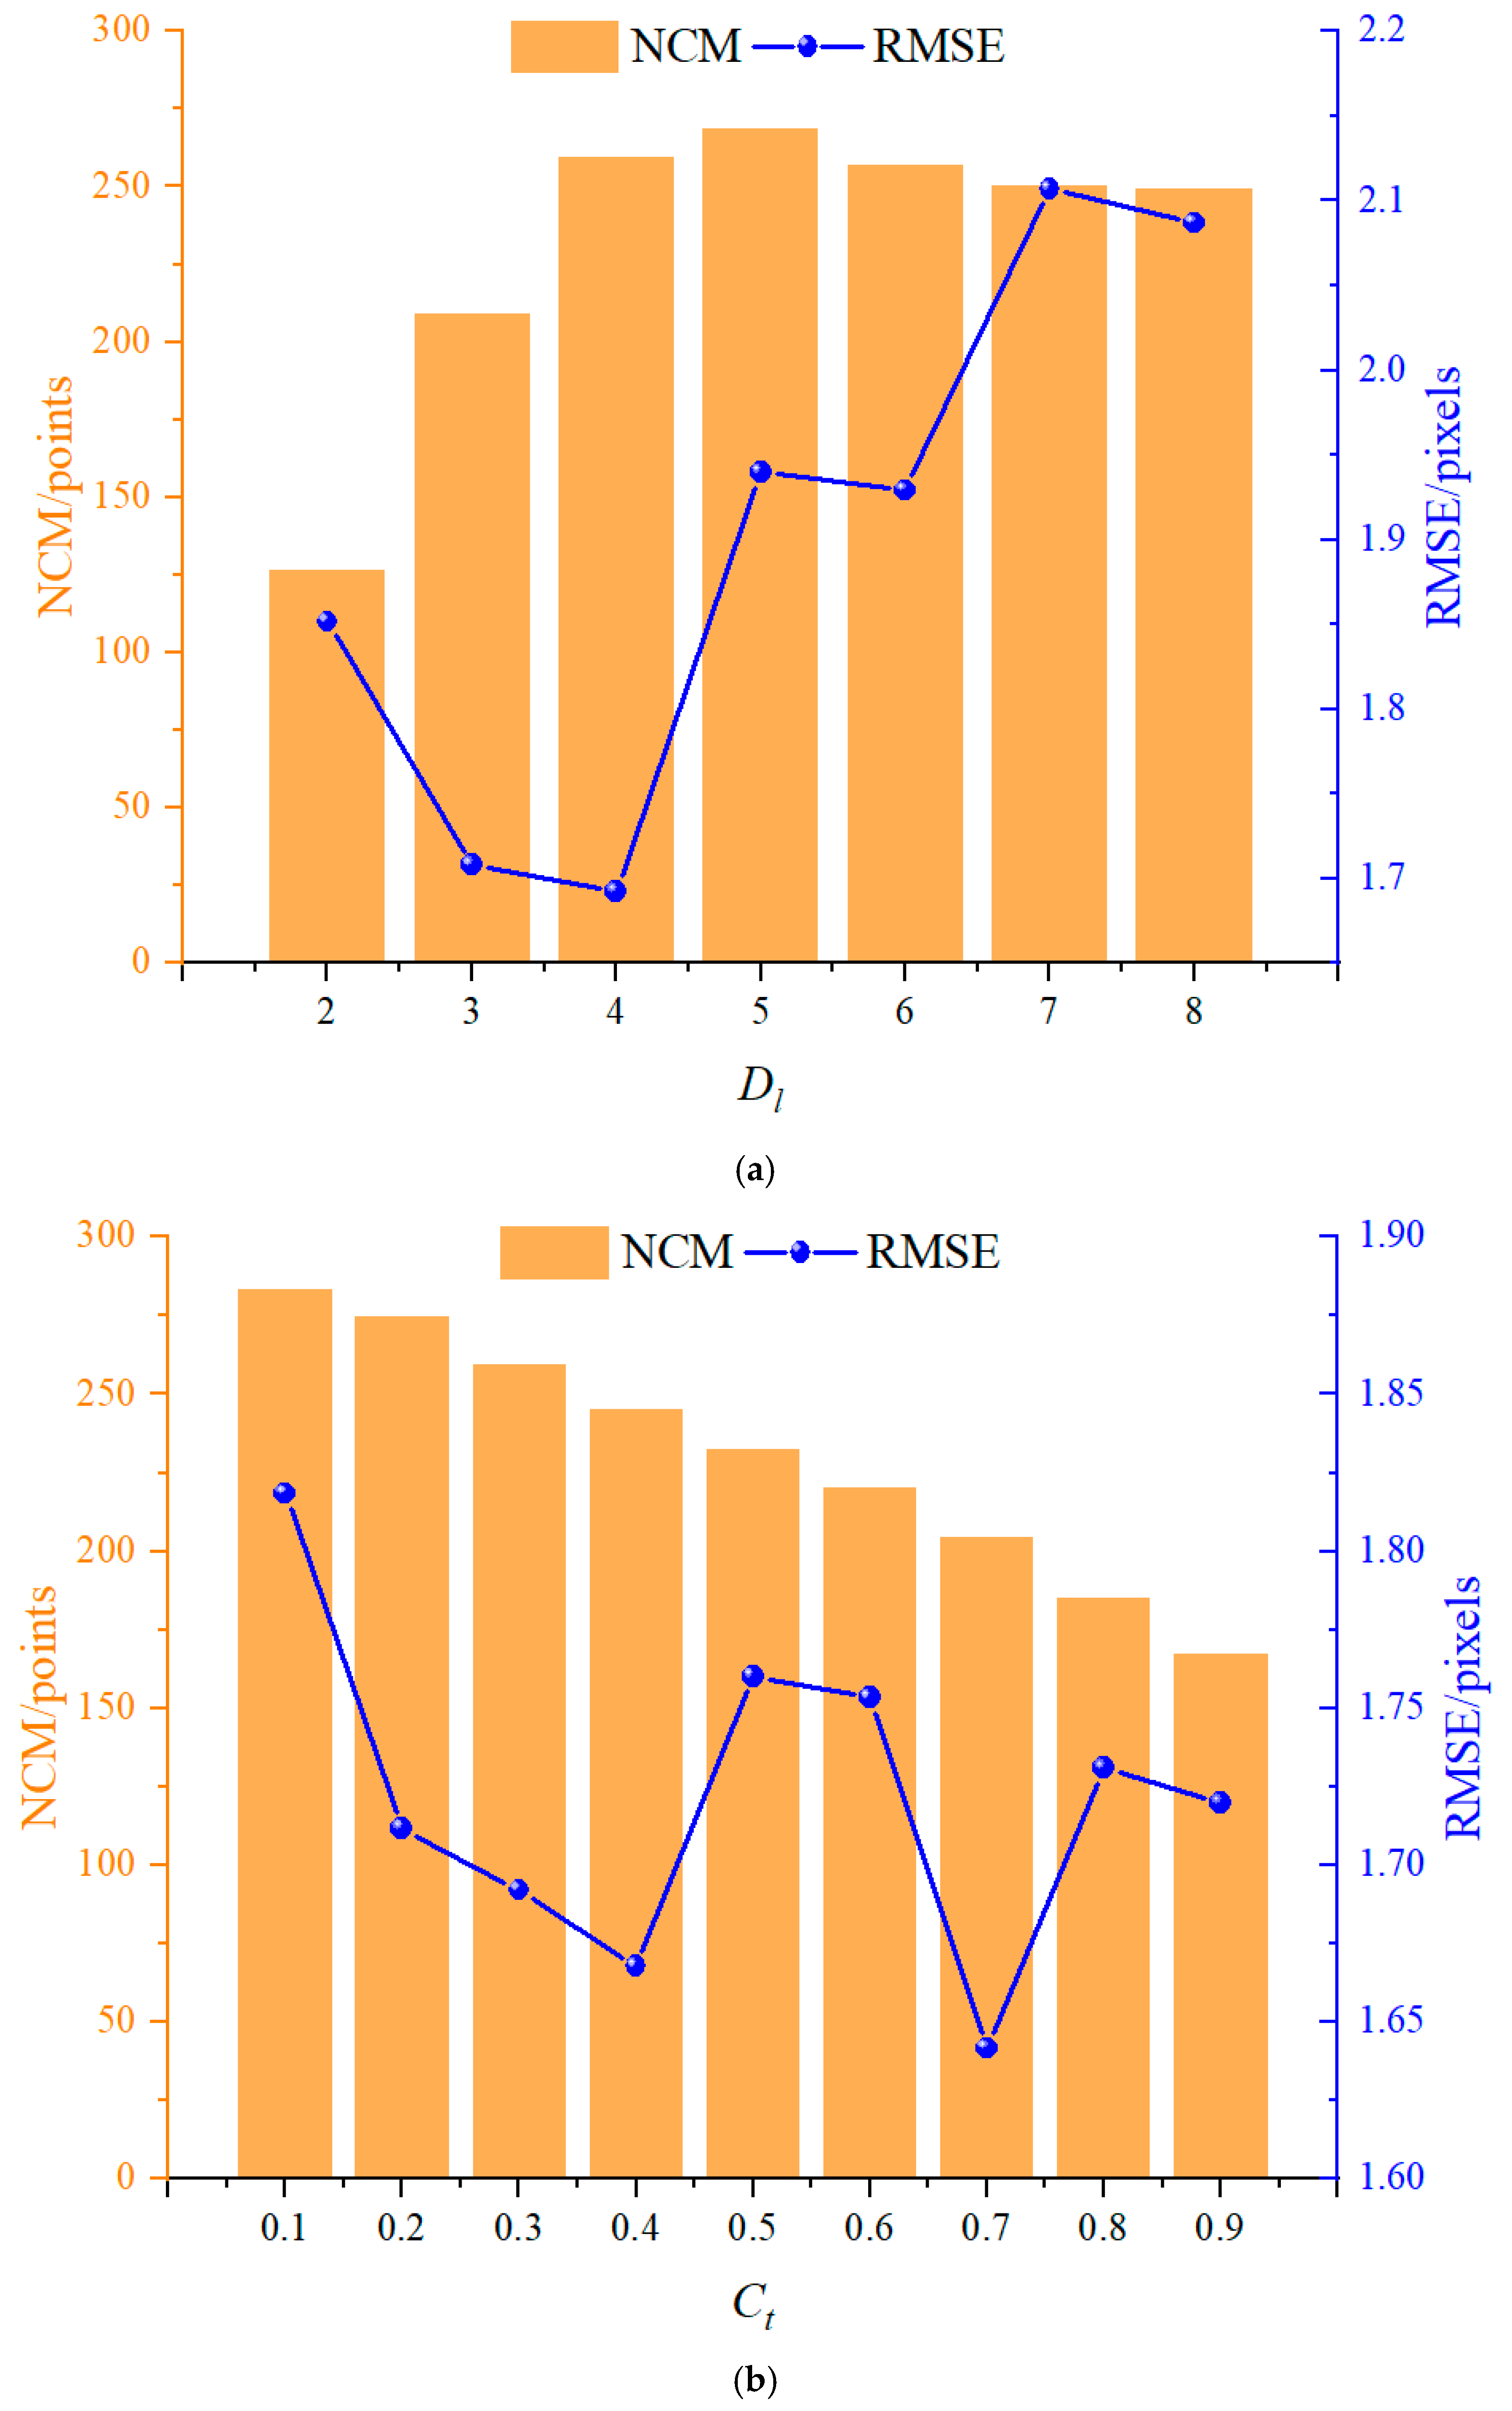
5.1. Parameter Setting
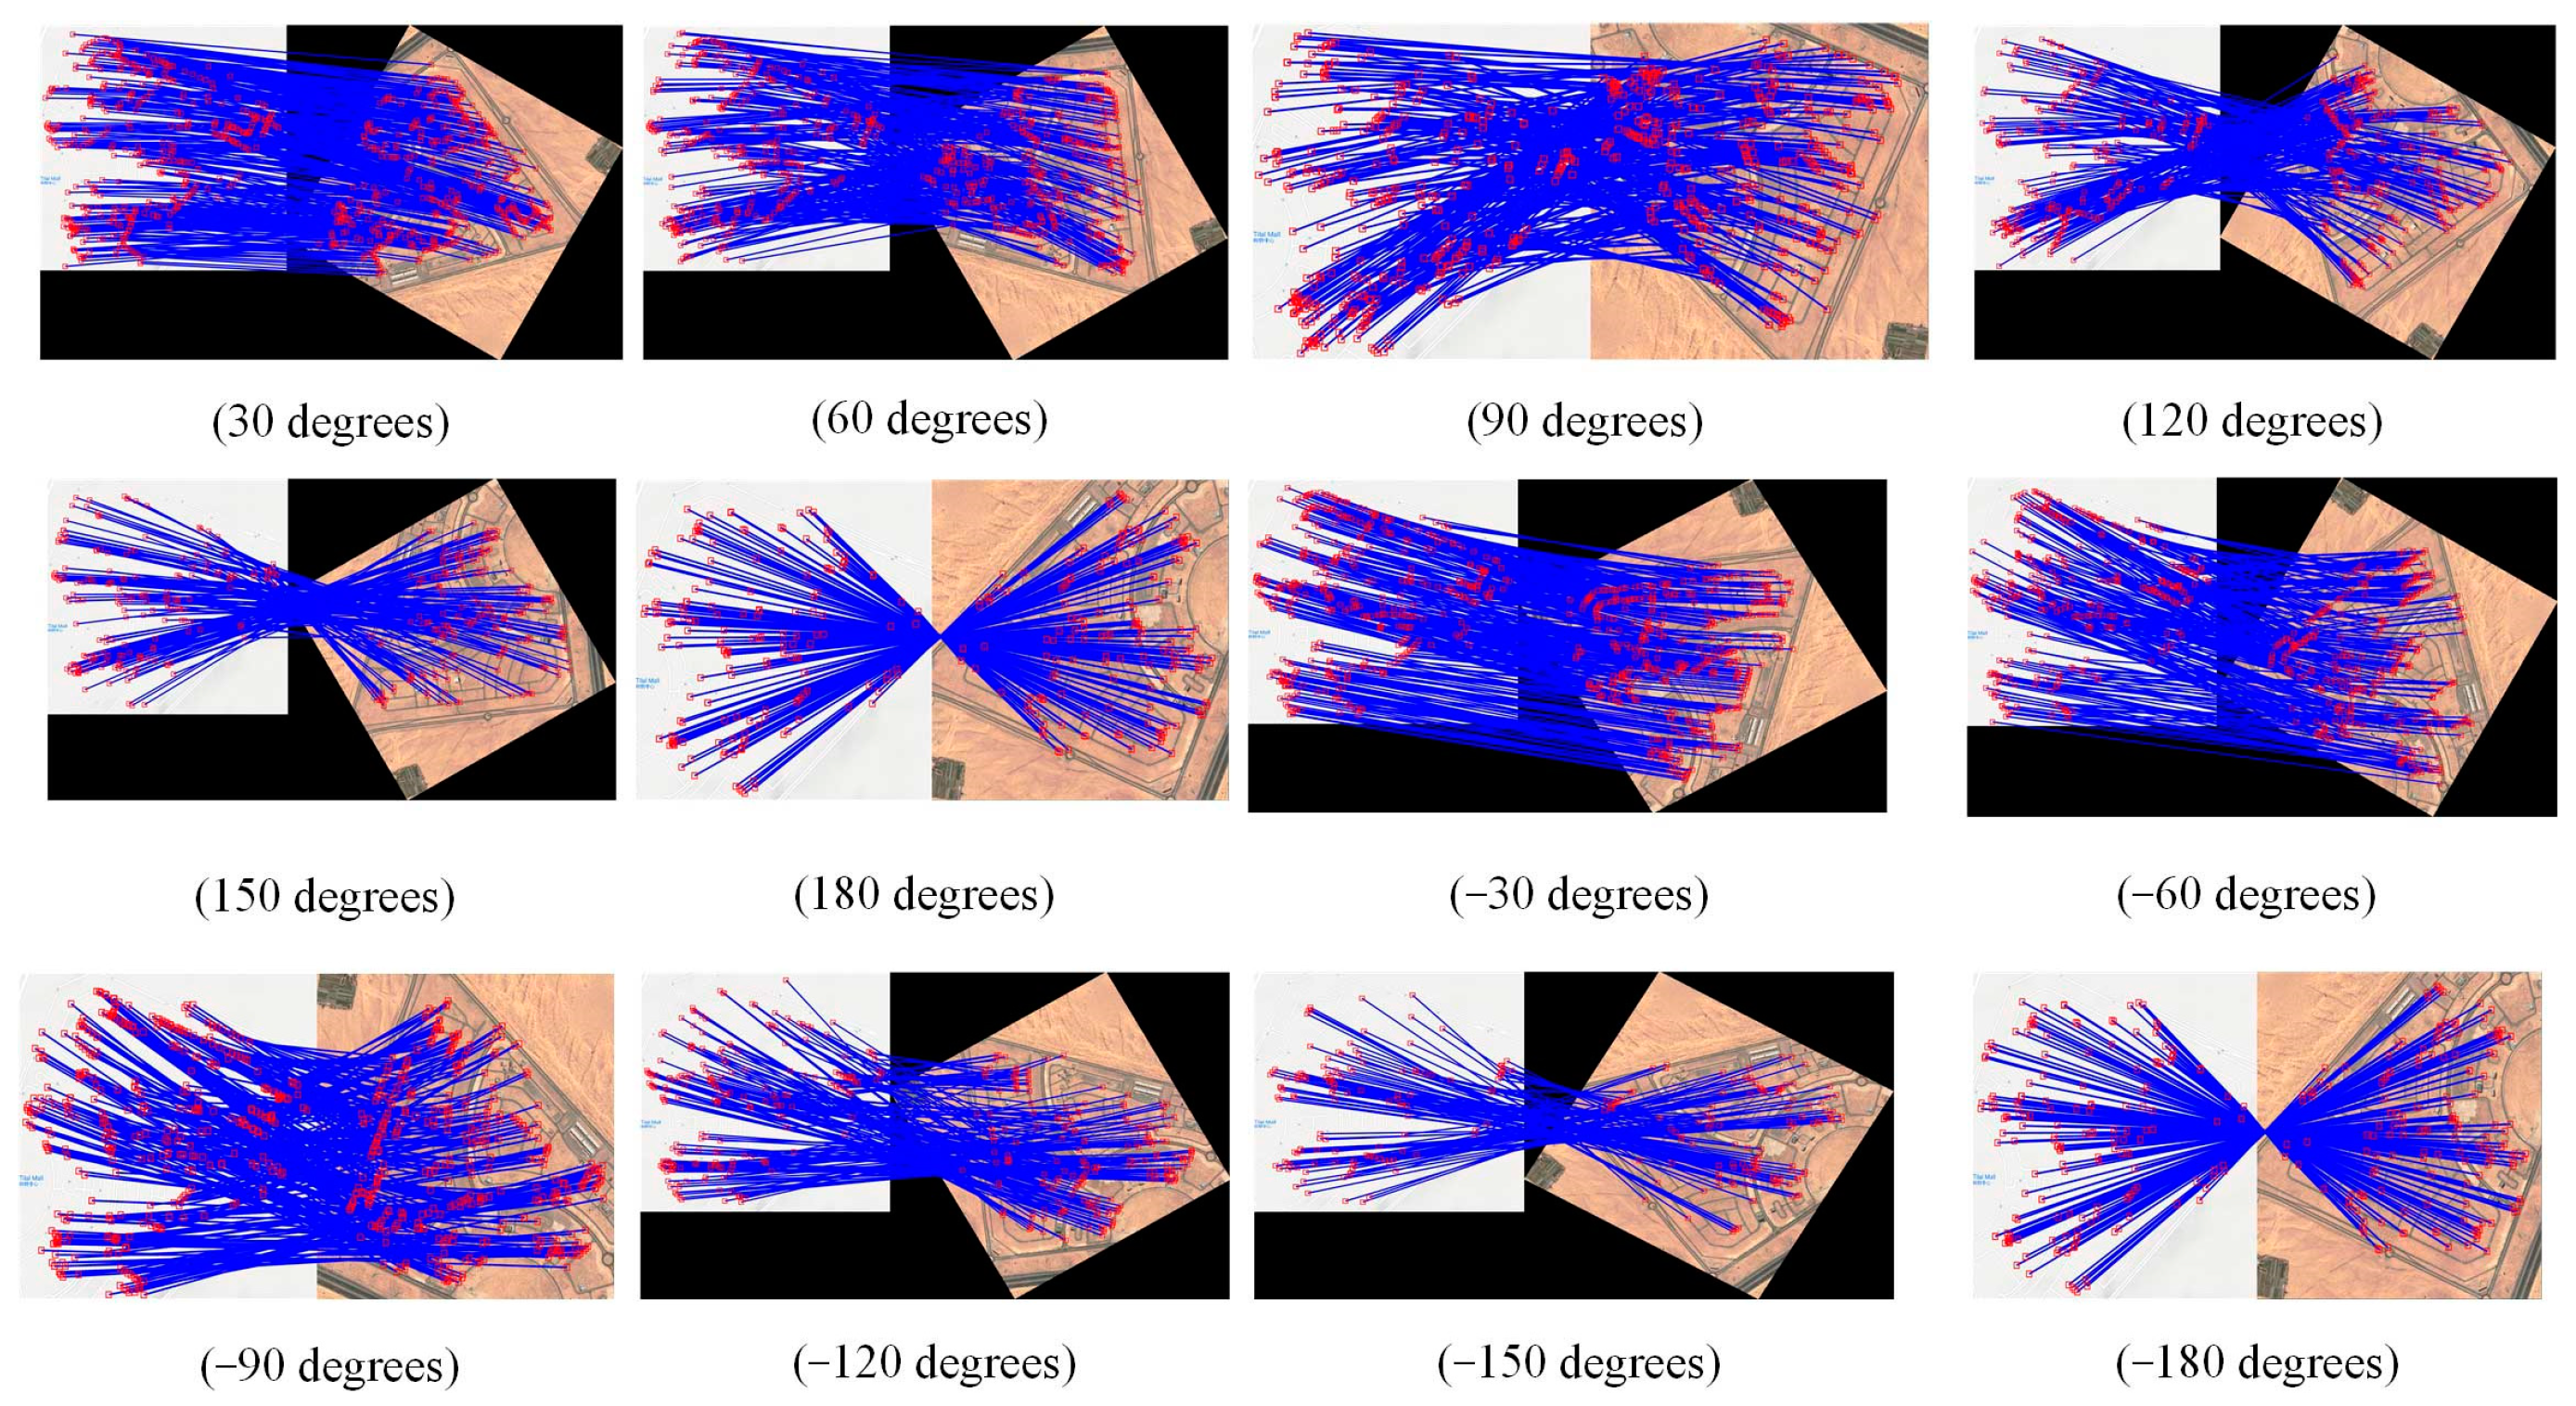
5.2. Analysis of Rotational-Invariance
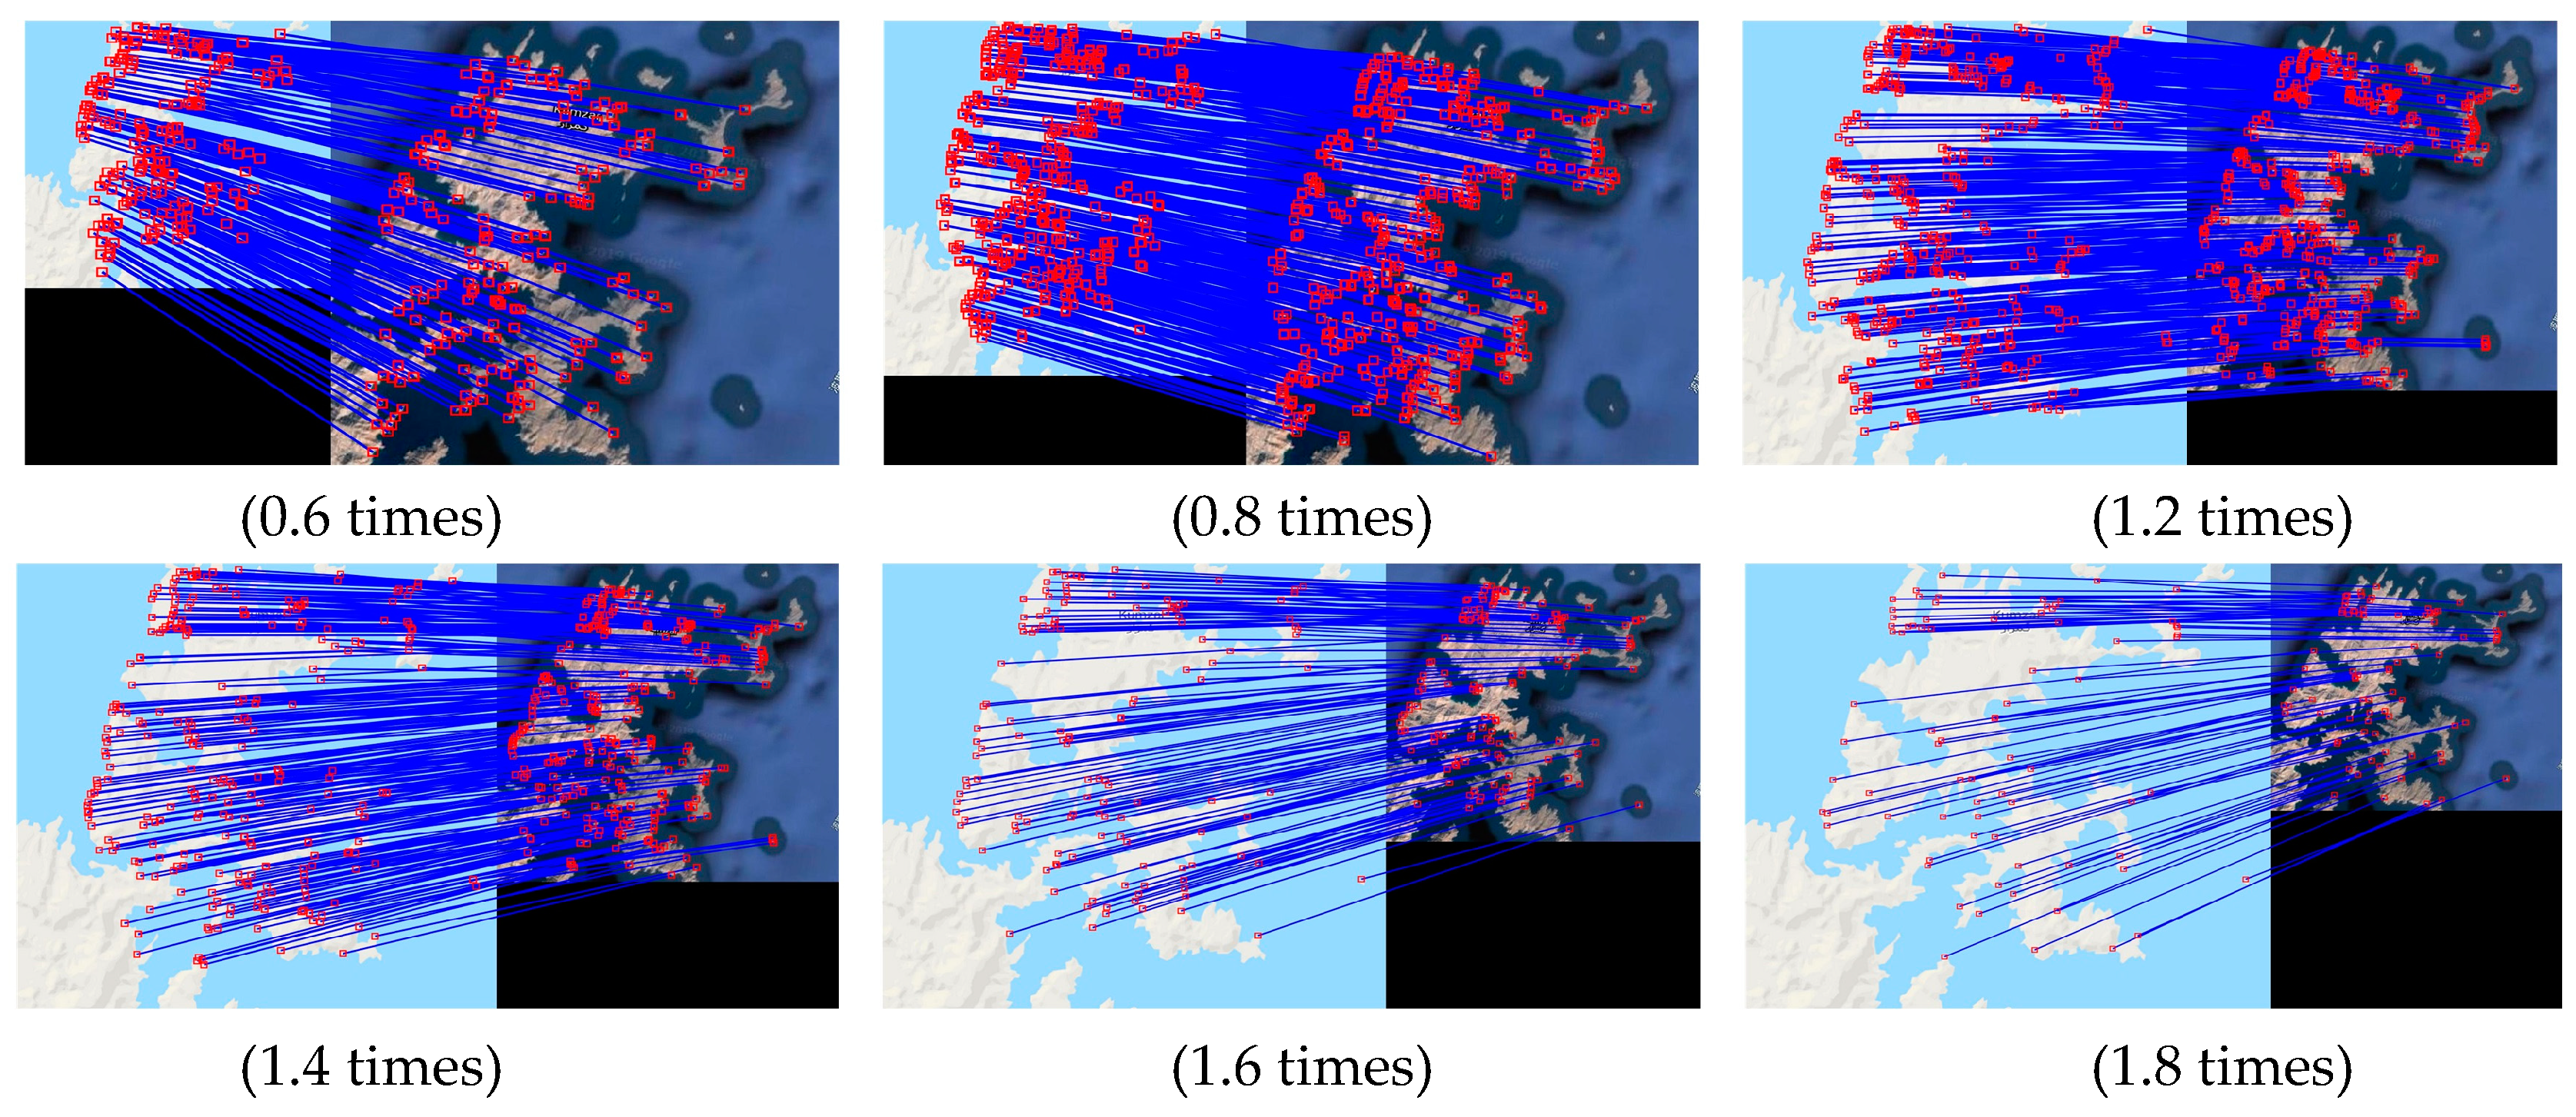
5.3. Analysis of Scale-Invariance
6. Conclusions
Author Contributions
Funding
Data Availability Statement
Conflicts of Interest
References
- Cao, S.; Shen, H.; Chen, S.; Li, C. Boosting structure consistency for multispectral and multimodal image registration. IEEE Trans. Image Process. 2020, 29, 5147–5162. [Google Scholar] [CrossRef]
- Zhang, F.; Yang, T.; Liu, L.; Liang, B.; Bai, Y.; Li, J. Image-only real-time incremental uav image mosaic for multi-strip flight. IEEE Trans. Multimed. 2020, 23, 1410–1425. [Google Scholar] [CrossRef]
- Zhang, Y.; Yao, Y.; Wan, Y.; Liu, W.; Yang, W.; Zheng, Z.; Xiao, R. Histogram of the orientation of the weighted phase descriptor for multi-modal remote sensing image matching. ISPRS J. Photogramm. Remote Sens. 2023, 196, 1–15. [Google Scholar] [CrossRef]
- Zhang, X.; Leng, C.; Hong, Y.; Pei, Z.; Cheng, I.; Basu, A. Multimodal remote sensing image registration methods and advancements: A survey. Remote Sens. 2021, 13, 5128. [Google Scholar] [CrossRef]
- Lowe, G. Sift-the scale invariant feature transform. Int. J. 2004, 2, 2. [Google Scholar]
- Bay, H.; Ess, A.; Tuytelaars, T.; Van Gool, L. Speeded-up robust features (SURF). Comput. Vis. Image Underst. 2008, 110, 346–359. [Google Scholar] [CrossRef]
- Kovesi, P. Phase congruency: A low-level image invariant. Psychol. Res. 2000, 64, 136–148. [Google Scholar] [CrossRef]
- Helor, Y.; Helor, H.; David, E. Matching by Tone Mapping: Photometric Invariant Template Matching. IEEE Trans. Pattern Anal. Mach. Intell. 2013, 36, 317–330. [Google Scholar] [CrossRef]
- Reddy, B.S.; Chatterji, B.N. An FFT-based technique for translation, rotation, and scale-invariant image registration. IEEE Trans. Image Process. 1996, 5, 1266–1271. [Google Scholar] [CrossRef]
- Sotiras, A.; Davatzikos, C.; Paragios, N. Deformable medical image registration: A survey. IEEE Trans. Med. Imaging 2013, 32, 1153–1190. [Google Scholar] [CrossRef]
- Xu, X.; Li, X.; Liu, X.; Shen, H.; Shi, Q. Multimodal registration of remotely sensed images based on Jeffrey’s divergence. ISPRS J. Photogramm. Remote Sens. 2016, 122, 97–115. [Google Scholar] [CrossRef]
- Ye, Y.; Shan, J.; Bruzzone, L.; Shen, L. Robust registration of multimodal remote sensing images based on structural similarity. IEEE Trans. Geosci. Remote Sens. 2017, 55, 2941–2958. [Google Scholar] [CrossRef]
- Ye, Y.; Bruzzone, L.; Shan, J.; Shen, L. A Fast and Robust Matching Framework for Multimodal Remote Sensing Image Registration. arXiv 2018, arXiv:1808.06194. [Google Scholar]
- Fan, Z.; Zhang, L.; Liu, Y.; Wang, Q.; Zlatanova, S. Exploiting High Geopositioning Accuracy of SAR Data to Obtain Accurate Geometric Orientation of Optical Satellite Images. Remote Sens. 2021, 13, 3535. [Google Scholar] [CrossRef]
- Yao, Y.; Zhang, B.; Wan, Y.; Zhang, Y. Motif: Multi-orientation tensor index feature descriptor for sar-optical image registration. Int. Arch. Photogramm. Remote Sens. Spatial Inf. Sci. 2022, XLIII-B2-2022, 99–105. [Google Scholar] [CrossRef]
- Chien, H.J.; Chuang, C.C.; Chen, C.Y.; Klette, R. When to use what feature? SIFT, SURF, ORB, or A-KAZE features for monocular visual odometry. In Proceedings of the 2016 International Conference on Image and Vision Computing New Zealand (IVCNZ), Palmerston North, New Zealand, 21–22 November 2016; pp. 1–6. [Google Scholar]
- Ma, W.; Wen, Z.; Wu, Y.; Jiao, L.; Gong, M.; Zheng, Y.; Liu, L. Remote sensing image registration with modified SIFT and enhanced feature matching. IEEE Geosci. Remote Sens. Lett. 2016, 14, 3–7. [Google Scholar] [CrossRef]
- Sedaghat, A.; Mohammadi, N. Illumination-Robust Remote Sensing Image Matching Based on Oriented Self-Similarity. ISPRS J. Photogramm. Rem. Sens. 2019, 153, 21–35. [Google Scholar] [CrossRef]
- Xiong, X.; Jin, G.; Xu, Q.; Zhang, H. Robust SAR image registration using rank-based ratio self-similarity. IEEE J. Sel. Top. Appl. Earth Obs. Remote Sens. 2021, 14, 2358–2368. [Google Scholar] [CrossRef]
- Xiang, Y.; Tao, R.; Wang, F.; You, H.; Han, B. Automatic Registration of Optical and SAR Images Via Improved Phase Congruency Model. IEEE J. Sel. Top. Appl. Earth Obs. Remote Sens. 2020, 13, 5847–5861. [Google Scholar] [CrossRef]
- Fan, J.; Ye, Y.; Li, J.; Liu, G.; Li, Y. A Novel Multiscale Adaptive Binning Phase Congruency Feature for SAR and Optical Image Registration. IEEE Trans. Geosci. Remote Sens. 2022, 60, 1–16. [Google Scholar] [CrossRef]
- Yao, Y.; Zhang, Y.; Wan, Y. Heterologous Images Matching Considering Anisotropic Weighted Moment and Absolute Phase Orientation. Geomat. Inf. Sci. Wuhan Univ. 2021, 46, 1727–1736. [Google Scholar]
- Yang, W.; Xu, C.; Mei, L.; Yao, Y.; Liu, C. LPSO: Multi-source image matching considering the description of local phase sharpness orientation. IEEE Photonics J. 2022, 14, 7811109. [Google Scholar] [CrossRef]
- Yao, Y.; Zhang, Y.; Wan, Y.; Liu, X.; Yan, X.; Li, J. Multi-modal Remote Sensing Image Matching Considering Co-occurrence Filter. IEEE Trans. Image Process. 2022, 31, 2584–2597. [Google Scholar] [CrossRef] [PubMed]
- Gao, C.; Li, W.; Tao, R.; Du, Q. MS-HLMO: Multi-scale Histogram of Local Main Orientation for Remote Sensing Image Registration. arXiv 2022, arXiv:2204.00260. [Google Scholar] [CrossRef]
- Li, J.; Xu, W.; Shi, P.; Zhang, Y.; Hu, Q. LNIFT: Locally Normalized Image for Rotation Invariant Multimodal Feature Matching. IEEE Trans. Geosci. Remote Sens. 2022, 60, 5621314. [Google Scholar] [CrossRef]
- Yi, K.M.; Trulls, E.; Lepetit, V.; Fua, P. Lift: Learned Invariant Feature Transform. In Proceedings of the European Conference on Computer Vision, Amsterdam, The Netherlands, 11–14 October 2016; Springer: Cham, Switzerland, 2016; pp. 467–483. [Google Scholar]
- Sarlin, P.E.; DeTone, D.; Malisiewicz, T.; Rabinovich, A. Superglue: Learning feature matching with graph neural networks. In Proceedings of the IEEE/CVF Conference on Computer Vision and Pattern Recognition, Seattle, WA, USA, 13–19 June 2020; pp. 4938–4947. [Google Scholar]
- Dusmanu, M.; Rocco, I.; Pajdla, T.; Pollefeys, M.; Sivic, J.; Torii, A.; Sattler, T. D2-net: A trainable cnn for joint description and detection of local features. In Proceedings of the IEEE/CVF Conference on Computer Vision and Pattern Recognition, Long Beach, CA, USA, 15–20 June 2019; pp. 8092–8101. [Google Scholar]
- Sun, J.; Shen, Z.; Wang, Y.; Bao, H.; Zhou, X. LoFTR: Detector-free local feature matching with transformers. In Proceedings of the IEEE/CVF Conference on Computer Vision and Pattern Recognition, Nashville, TN, USA, 20–25 June 2021; pp. 8922–8931. [Google Scholar]
- Bökman, G.; Kahl, F. A case for using rotation invariant features in state of the art feature matchers. In Proceedings of the IEEE/CVF Conference on Computer Vision and Pattern Recognition, New Orleans, LA, USA, 18–24 June 2022; pp. 5110–5119. [Google Scholar]
- Zhang, Y.; Liu, Y.; Zhang, H.; Ma, G. Multimodal Remote Sensing Image Matching Combining Learning Features and Delaunay Triangulation. IEEE Trans. Geosci. Remote. Sens. 2022, 60, 5635517. [Google Scholar] [CrossRef]
- Muja, M.; Lowe, D.G. Fast approximate nearest neighbors with automatic algorithm configuration. VISAPP 2009, 2, 2. [Google Scholar]
- Wu, Y.; Ma, W.; Gong, M.; Su, L.; Jiao, L. A novel point-matching algorithm based on fast sample consensus for image registration. IEEE Geosci. Remote Sens. Lett. 2014, 12, 43–47. [Google Scholar] [CrossRef]
- Kovesi, P. Image Features FromPhase Congruency. Videre J. Comput. Vis. Res. 1999, 1, 1–26. [Google Scholar]
- Schraudolph, N.N. A fast, compact approximation of the exponential function. Neural Comput. 1999, 11, 853–862. [Google Scholar] [CrossRef]
- Gao, W.; Zhang, X.; Yang, L.; Liu, H. An improved Sobel edge detection. In Proceedings of the 2010 3rd International Conference on Computer Science and Information Technology, Chengdu, China, 9–11 July 2010; Volume 5, pp. 67–71. [Google Scholar]
- Mikolajczyk, K.; Schmid, C. A performance evaluation of local descriptors. IEEE Trans. Pattern Anal. Mach. Intell. 2005, 27, 1615–1630. [Google Scholar] [CrossRef] [PubMed]
- Li, J.; Hu, Q.; Ai, M. RIFT: Multi-modal image matching based on radiation-variation insensitive feature transform. IEEE Trans. Image Process. 2019, 29, 3296–3310. [Google Scholar] [CrossRef] [PubMed]
- Xiong, X.; Jin, G.; Xu, Q.; Zhang, H. Self-similarity features for multimodal remote sensing image matching. IEEE J. Sel. Top. Appl. Earth Obs. Remote Sens. 2021, 14, 12440–12454. [Google Scholar] [CrossRef]


| SIFT | PSO-SIFT | OSS | HOWP | RIFT2 | PEDoG | |
|---|---|---|---|---|---|---|
| SR | 58.3% | 88.3% | 91.7% | 66.7% | 96.7% | 100% |
| NCM | 79.53 | 139.95 | 175.6 | 236.92 | 209.38 | 259.43 |
| RMSE | 4.08 | 2.36 | 2.08 | 3.63 | 2.07 | 1.69 |
| Parameter | Variable Values | Fixed Parameters |
|---|---|---|
| Dl | Dl = [2, 3, 4, 5, 6, 7, 8] | Ct = 0.3 |
| Ct | Ct = [0.1, 0.2, 0.3, 0.4, 0.5, 0.6, 0.7, 0.8, 0.9] | Dl =4 |
Disclaimer/Publisher’s Note: The statements, opinions and data contained in all publications are solely those of the individual author(s) and contributor(s) and not of MDPI and/or the editor(s). MDPI and/or the editor(s) disclaim responsibility for any injury to people or property resulting from any ideas, methods, instructions or products referred to in the content. |
© 2023 by the authors. Licensee MDPI, Basel, Switzerland. This article is an open access article distributed under the terms and conditions of the Creative Commons Attribution (CC BY) license (https://creativecommons.org/licenses/by/4.0/).
Share and Cite
Yan, X.; Cao, Y.; Yang, Y.; Yao, Y. Multi-Modal Image Registration Based on Phase Exponent Differences of the Gaussian Pyramid. Remote Sens. 2023, 15, 5764. https://doi.org/10.3390/rs15245764
Yan X, Cao Y, Yang Y, Yao Y. Multi-Modal Image Registration Based on Phase Exponent Differences of the Gaussian Pyramid. Remote Sensing. 2023; 15(24):5764. https://doi.org/10.3390/rs15245764
Chicago/Turabian StyleYan, Xiaohu, Yihang Cao, Yijun Yang, and Yongxiang Yao. 2023. "Multi-Modal Image Registration Based on Phase Exponent Differences of the Gaussian Pyramid" Remote Sensing 15, no. 24: 5764. https://doi.org/10.3390/rs15245764
APA StyleYan, X., Cao, Y., Yang, Y., & Yao, Y. (2023). Multi-Modal Image Registration Based on Phase Exponent Differences of the Gaussian Pyramid. Remote Sensing, 15(24), 5764. https://doi.org/10.3390/rs15245764