Article

Multiple Greenness Indexes Revealed the Vegetation Greening during the Growing Season and Winter on the Tibetan Plateau despite Regional Variations

1
State Key Laboratory of Earth Surface Processes and Resource Ecology, Faculty of Geographical Science, Beijing Normal University, Beijing 100875, China
2
Environmental Management Center, Mykolas Romeris University, Ateities g. 20, 08303 Vilnius, Lithuania
*
Author to whom correspondence should be addressed.
Remote Sens. 2023, 15(24), 5697; https://doi.org/10.3390/rs15245697
Submission received: 23 October 2023 / Revised: 6 December 2023 / Accepted: 7 December 2023 / Published: 12 December 2023

Abstract

:
Vegetation is an essential component of terrestrial ecosystems and supplies multiple ecosystem benefits and services. Several indices have been used to monitor changes in vegetation communities using remotely-sensed data. However, only a few studies have conducted a comparative analysis of different indices concerning vegetation greenness variation. Additionally, there have been oversights in assessing the change in greenness of evergreen woody species. In this study, we used the normalized difference vegetation index (NDVI), the enhanced vegetation index (EVI), the near-infrared reflectance of terrestrial vegetation (NIRv), and the leaf area index (LAI) data derived from MODIS data to examine spatial and temporal change in vegetation greenness in the growing season (May–September) and then evaluated the evergreen vegetation greenness change using winter (December–February) greenness using trend analysis and consistency assessment methods between 2000 and 2022 on the Tibetan Plateau, China. The results found that vegetation greenness increased in 80% of pixels during the growing season (northeastern, central-eastern, and northwestern regions). Nevertheless, a decline in the southwestern and central-southern areas was identified. Similar trends in greenness were also observed in winter in about 80% of pixels. Consistency analyses based on the four indexes showed that vegetation growth was enhanced by 29% and 30% of pixels in the growing season and winter, respectively. Further, there was relatively strong consistency among the different vegetation indexes, particularly between the NIRv and EVI. The LAI was less consistent with the other indexes. These findings emphasize the importance of selecting an appropriate index when monitoring long-term temporal trends over large spatial scales.

Graphical Abstract

1. Introduction

Vegetation is critical in terrestrial ecosystems and provides multiple ecosystem services, such as carbon storage [1,2]. During the past few decades, vegetation greenness showed an increasing trend in high latitude and altitude regions, such as Arctic tundra, boreal forest, and northeastern Tibetan Plateau [3,4,5]. Vegetation dynamics affect water cycles and the exchange of carbon and energy, impacting the climate [6,7,8,9]. The Tibetan Plateau is known as the “Roof of the World” and the “Third Pole”, averaging 4000 m above sea level [10]. This region is also the water tower of Asia, with abundant glaciers, lakes, and rivers [11]. The diverse terrestrial ecosystems distributed the forests, shrubs, alpine grasslands, and alpine deserts along the northwestward direction [12]. Furthermore, vegetation variations in the Tibetan Plateau affected the land surface process, ecosystem structure, and functions [13,14,15,16,17]. For example, grassland growth could attenuate warming by increasing evapotranspiration [13]. Also, the enhanced vegetation greenness on the eastern Tibetan Plateau increases the latent and sensible heat fluxes and affects the regional rainfall [18]. On the other hand, alpine meadow degradation reduces soil carbon storage and nutrient cycling capacity [14]. Furthermore, winter evergreen vegetation is also important in the Tibetan plateau ecosystem dynamic. For instance, deforestation by evergreen coniferous trees reduced the dry season (September–February) rainfall in the east of the Tibetan Plateau (Zagunao watershed) [19]. Evergreen vegetation exhibited the highest gross primary productivity per unit area across the plateau [20]. Therefore, vegetation dynamics are important to the Tibetan Plateau’s ecological status.
During the past few decades, vegetation greenness has been assessed by using various remote sensing vegetation indexes, such as the leaf area index (LAI), the normalized difference vegetation index (NDVI), and the enhanced vegetation index (EVI) [21,22,23]. NDVI and EVI are widely adopted due to their ease of calculation from surface reflectance in optical spectral bands and the vegetation cover indices, which are usually represented by the canopy structure parameter LAI [24,25,26]. From 1982 to 2015, a substantial greening trend was observed in the northeastern and central, southwestern, eastern, and south-central areas of the Tibetan Plateau, while browning was identified in some areas located in the southeastern part [25,27,28]. Other works showed that from 2000 to the late 2010s, vegetation greenness increased in northeastern, northwestern, east-central, and southeastern areas, and browning was observed in southwestern areas [5,29,30]. These results showed some spatial differences in the areas affected by greening or browning. For example, the areas of vegetation using NDVI in the southwest of the Tibetan Plateau were larger than those indicated by LAI and EVI [21]. EVI analysis showed high vegetation browning in central areas and some areas in the southeast of the Tibetan Plateau compared to NDVI [5,22]. Recently, a new vegetation index proxy, the near-infrared reflectance of terrestrial vegetation (NIRv), was developed and applied to assess the trend of vegetation greenness [21,31]. NIRv assessment showed that greening areas were lower than those indicated by NDVI, EVI, and LAI on the Tibetan Plateau [21]. Therefore, vegetation changes could be inconsistent using different indexes.
Vegetation greenness changes on the Tibetan Plateau were mainly focused on the annual or growing season, dominated by deciduous vegetation (grasslands) [22,29]. In the southeast of the Tibetan Plateau, evergreen vegetation is widely distributed and plays a vital role in carbon storage [32]. Previous studies focused more on evergreen trees’ radial growth variation, shrubs, treelines, and shrub lines [33,34]. For instance, evergreen trees’ radial growth showed an increasing trend in the southeast and south Tibetan Plateau and the south-central Tibetan Plateau from the 1960s to the 2010s [34,35,36,37,38,39]. Nevertheless, a reduction in evergreen tree and shrub growth was also identified in the northeastern edge of the Tibetan Plateau (during 1950–2013), south-central Tibetan Plateau (during 1957–2010), and central Himalayas (during the 1970s–2010s) [40,41,42,43]. Also, treelines shifted upward in the northeastern and southeastern Tibetan Plateau during the 1910s–2000s due to increasing temperatures [33]. Nevertheless, they remained stable on the southern edge of the Tibetan Plateau due to increasing tree density and intraspecific competition (i.e., spatial segregation between seedlings, juveniles, and adults) [44,45]. All these studies were observed at the local scale. Few assessments were conducted on larger scales. Therefore, studies focused on evergreen vegetation greenness changes at larger scales are unclear. The aims of this study are to:
(1)
Evaluate the spatial and temporal change characteristics of vegetation greenness on the Tibetan Plateau during the growing season between 2000 and 2022 using four vegetation greenness indexes.
(2)
On the basis of an analysis of growing season vegetation, assess the temporal change in winter evergreen vegetation on the Tibetan Plateau.
(3)
Analyze the consistency and difference in vegetation greenness variations using four vegetation greenness indexes.

2. Materials and Methods

2.1. Study Area

The Tibetan Plateau is in southwestern China and has an average elevation of over 4000 m above sea level [11] (Figure 1a). The plateau hosts various types of vegetation, including evergreen forests and several alpine ecosystem types (grasslands, shrublands, and cushion vegetation) (Figure 1b). The region is generally characterized by a cold and dry climate [46]. The mean annual temperature increased from −16 °C to 23 °C (Figure 1c). The mean annual precipitation was highest on the southern edge (i.e., the south face of the Himalayas), relatively lower in the southeast, and decreasing northwestward (Figure 1d). The plateau is also the source of several major rivers in Asia, with implications for the water cycle and water supply of millions of people downstream [11]. Furthermore, vegetation on the Tibetan Plateau is a crucial driver of ecosystem and atmospheric dynamics at the regional and continental scales [5,47,48,49,50].

2.2. Framework

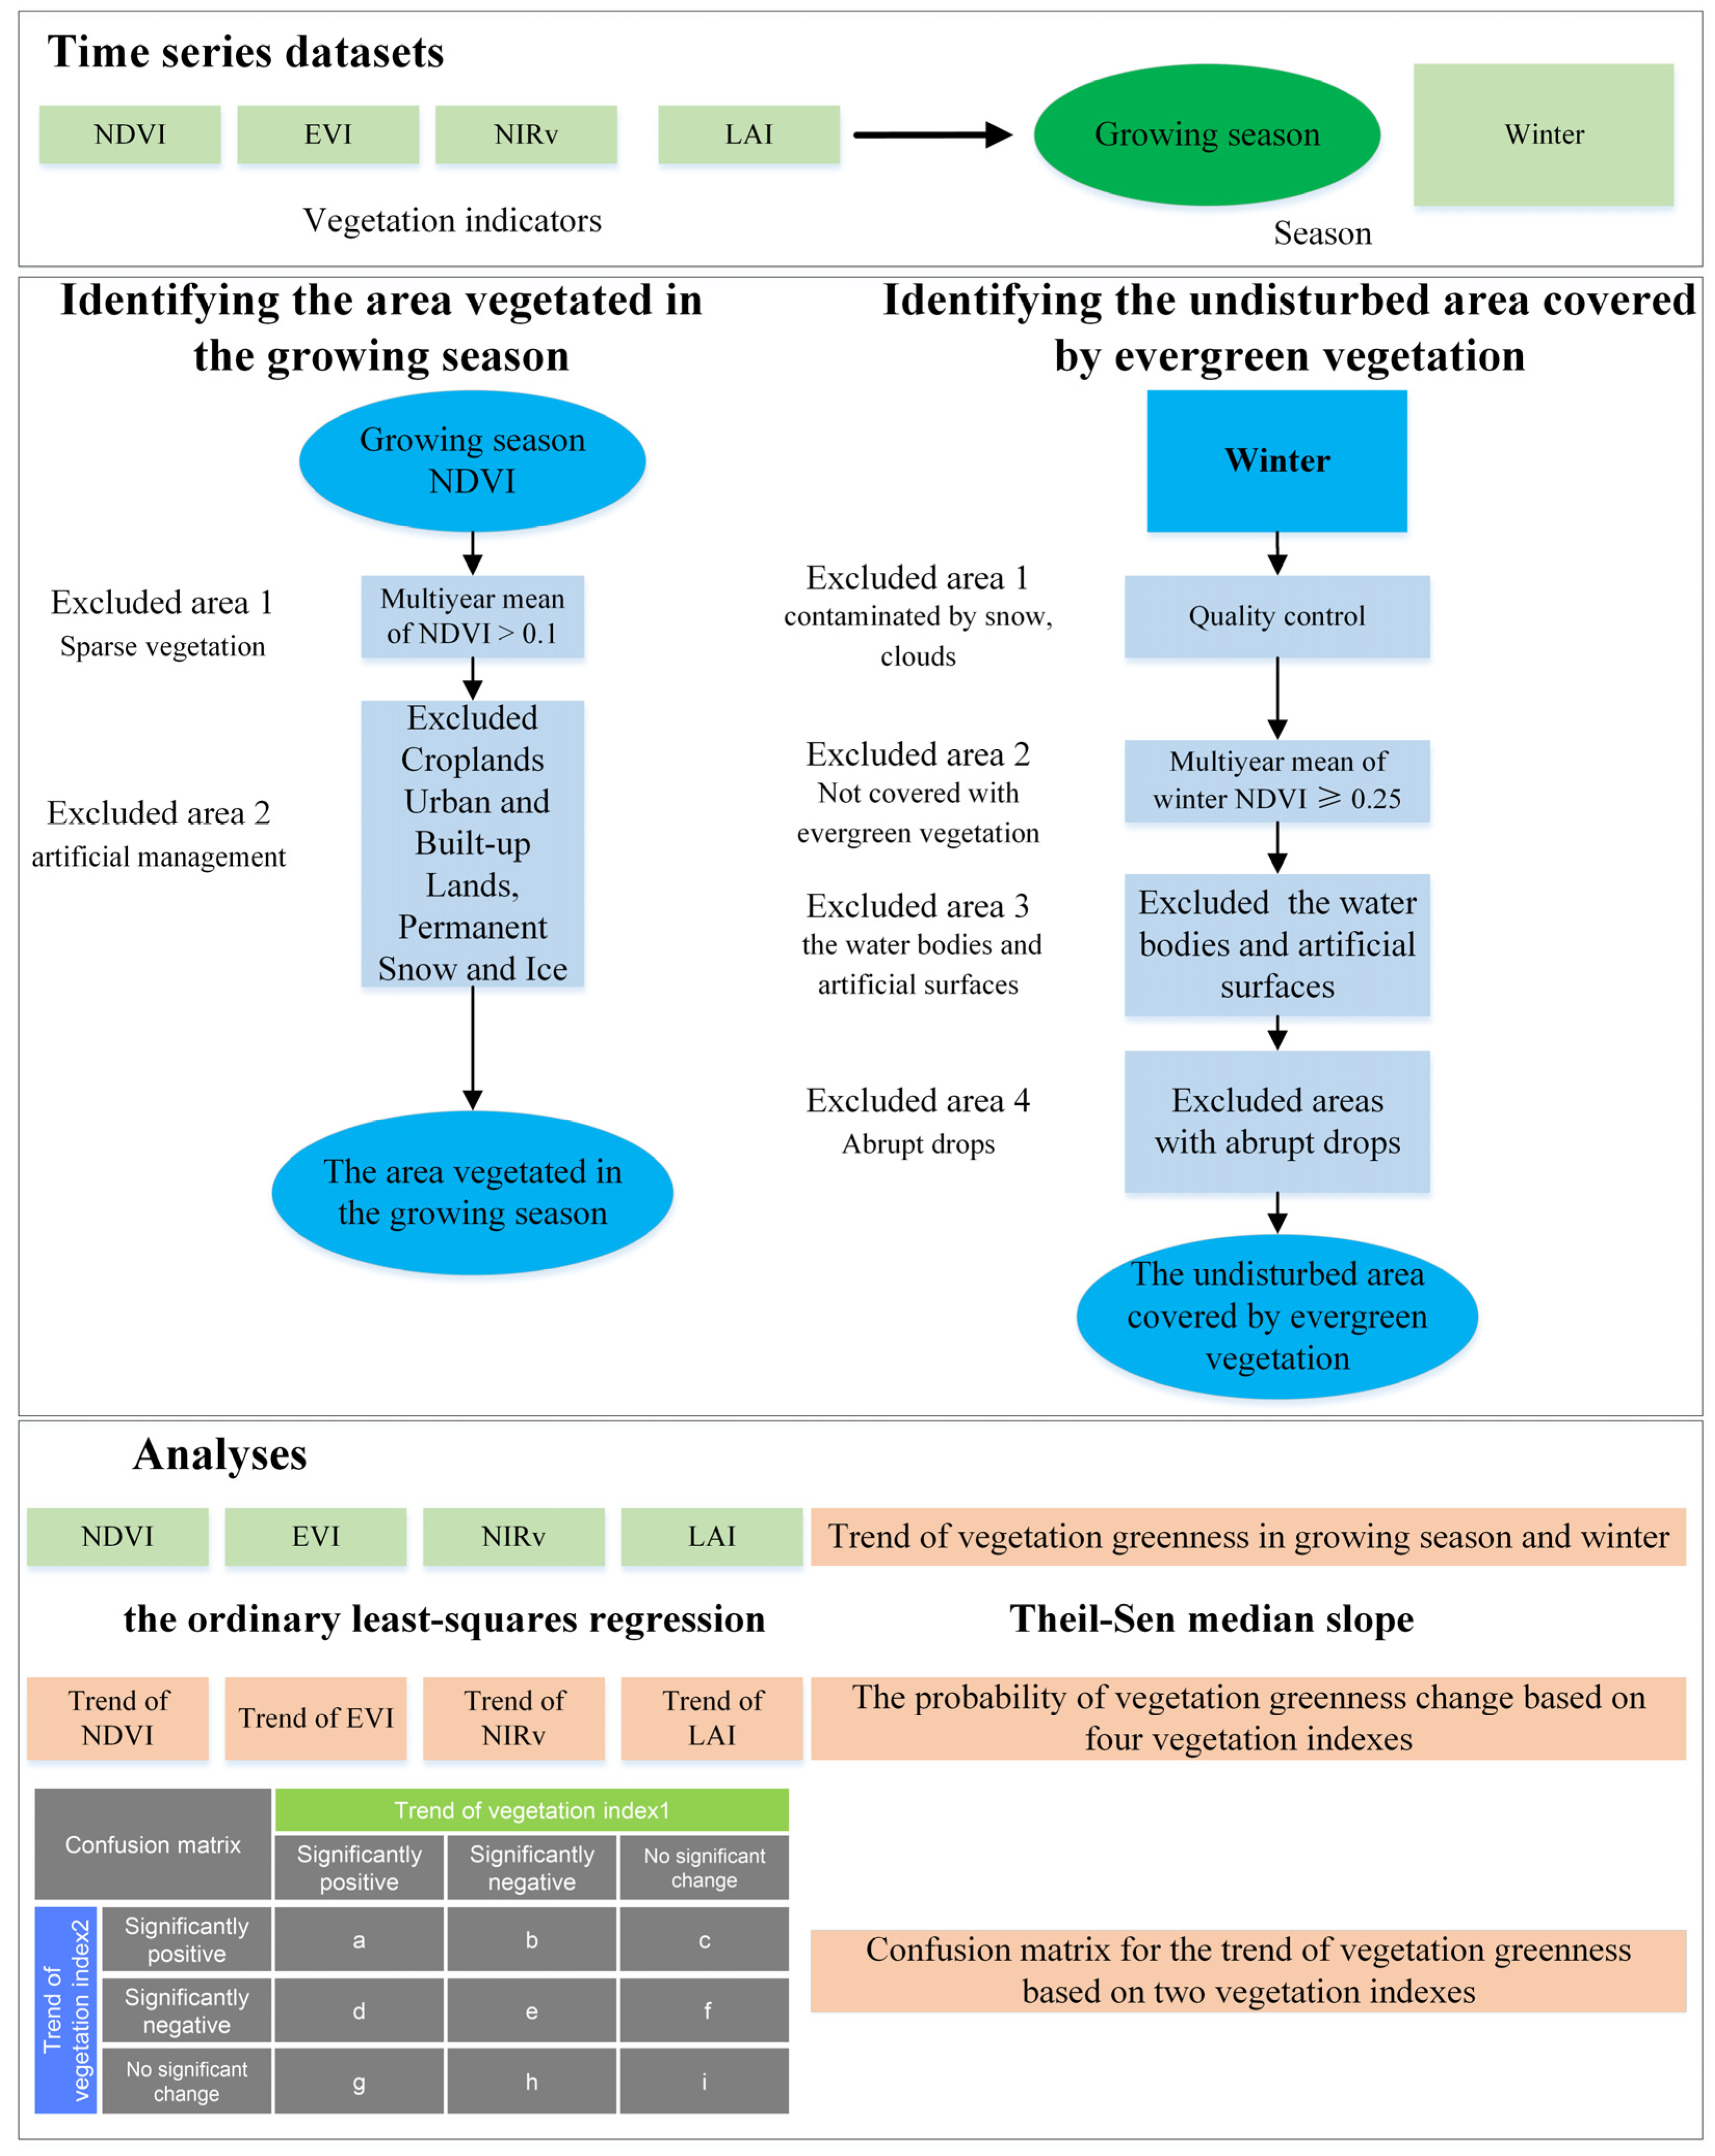
Firstly, we evaluated the trend of vegetation greenness during the growing season (May–September) based on four vegetation indices, including NDVI, EVI, NIRv, and LAI. Due to the coexistence of evergreen and winter-deciduous vegetation in numerous regions of the Tibetan Plateau, coupled with uncertainties in existing vegetation type maps [51,52], it is imperative to mitigate the impact of deciduous vegetation on assessing evergreen vegetation greenness. To address this, we conducted an analysis of vegetation greenness trends during the winter, a period when deciduous vegetation lacks greenness. In addition, to exclude the effect of snow cover on winter vegetation greenness, the normalized difference snow index (NDSI) snow cover was used to validate the variation of snow cover in winter. Furthermore, we used the MODIS land cover and GlobeLand30 to exclude water bodies and artificial surfaces in this study area. In summary, we first exclude the low-quality data on winter vegetation greenness and average the greenness in the growing season to evaluate the spatial variation of vegetation greenness in the growing season and winter. Then, we analyze the consistency of the trend of vegetation greenness in the growing season and winter based on different vegetation indices (Figure 2).

2.3. Dataset

2.3.1. Vegetation Greenness

Vegetation greenness was quantified with NDVI, EVI, NIRv, and LAI between 2000 and 2022 [53,54,55]. The formulas for NDVI, EVI, NIRv, and LAI are as follows:
N D V I = N I R R N I R + R
In the Formula (1), NIR and R are the spectral reflectances of the near-infrared and red bands, respectively.
E V I = G × N I R R N I R + C 1 × R C 2 × B l u e + L
In Formula (2), NIR, R, and Blue are the spectral reflectances of the near-infrared, red, and blue bands; G is the gain factor; L is a canopy background adjustment term; and C1 and C2 are the coefficients of the aerosol resistance term. The coefficients used in the EVI algorithm are L = 1, C1 = 6, C2 = 7.5, and G = 2.5 [54].
LAI is defined as the one-sided green leaf area per unit ground area in broadleaf canopies and as the projected needle leaf area in coniferous canopies [55].
N I R v = ( N D V I 0.08 ) × N I R
In the Formula (3), NIR is the spectral reflectance of the near-infrared band [53].
NDVI and EVI were extracted from the MOD13A1 version 6.1 product (accessed at https://earthengine.google.com on 10 December 2022). The NIRv was calculated by NDVI and reflectance from near-infrared band extracting from MOD13A1 version 6.1 product, which was better for capturing canopy physiological conditions than traditional vegetation index (i.e., NDVI and EVI) [53]. The MOD13A1 dataset has a spatial resolution of 500 m and a composite period of 16 days [56]. This dataset also provides quality information, including Pixel Reliability and VI (i.e., NDVI) Quality Assessment layers reflecting the status of the overall data quality rating and the conditions under which the data were obtained or processed, including clouds, snow/ice, shadows, and aerosols [54]. LAI was extracted from the MOD15A2H version 6.1 product (accessed at https://earthengine.google.com on 10 December 2022). This dataset has a spatial resolution of 500 m and a composite period of 8 days [57].

2.3.2. Solar-Induced Fluorescence Dataset

The solar-induced fluorescence (SIF) dataset can track the variation in the photosynthetic activity of terrestrial ecosystems [58]. Therefore, we explore the trend of SIF in the growing season to validate the greenness change [59]. The continuous SIF (CSIF) dataset during 2000–2019 was extracted from Orbiting Carbon Observatory-2 observations and MODIS surface reflectance using a neural network algorithm with a spatial resolution of 0.05° and 4 days of temporal resolution, and this dataset has been shown with low uncertainty [60].

2.3.3. Landcover Datasets

The landcover datasets used in this study are the GlobeLand30 dataset, accessed from https://www.nature.com/articles/514434c on 21 July 2021, and the MCD12Q1 version 6.1 dataset, accessed from https://search.earthdata.nasa.gov/ on 10 December 2022. The GlobeLand30 dataset provides landcover type at a spatial resolution of 30 m for 2000, 2010, and 2020, respectively [61]. The landcover types in the MCD12Q1 dataset are based on the International Geosphere-Biosphere Program (IGBP) scheme and have a spatial resolution of 500 m [62].

2.3.4. Snow Cover

The Normalized Difference Snow Index (NDSI) Snow Cover during 2000–2022 was extracted from the MOD10A1 version 6.1 product, with a spatial resolution of 500 m and a temporal resolution of 1 day [63]. The formula for NDSI is as follows:
N D S I = ρ V I S ρ N I R ρ V I S + ρ N I R
In Formula (4), ρVIS and ρNIR are the top-of-atmosphere reflectance of the visible band is centered at 0.55 µm and the near-infrared band is centered at 1.66 µm in the MODIS dataset [64].
The MOD10A1 dataset also provides the corresponding quality assessment (NDSI_Snow_Cover_Basic_QA) (accessed at https://search.earthdata.nasa.gov on 15 March 2023).

2.4. Data Preprocessing

The NDVI, EVI, NIRv, and LAI during 2000–2022 were extracted from monthly data based on the maximum value composite (MVC) method, which could eliminate the effects of clouds and atmospheric noise [6,65]. Previous studies revealed some outliers in the growing season due to cloudy contamination [66]. Therefore, we average the monthly data of the growing season (May–September) to derive growing season greenness. The multiyear mean of monthly NDVI < 0.1 was excluded in this study because it was considered covered with sparse vegetation [25]. We also exclude the pixels that are classified as Croplands, Cropland/Natural Vegetation Mosaics, Urban and Built-up Land, Permanent Snow, Ice, and Water based on the MCD12Q1 dataset, which could affect the trend of greenness evaluation due to different artificial management. After this step, we obtained the area of vegetation distribution in the growing season.
In winter, evergreen vegetation is easily contaminated by snow, clouds, and aerosols, which could lead to bias in the assessment of vegetation greenness trends. Therefore, we excluded the low-quality NDVI pixels, which are contaminated by snow, clouds, and aerosols, based on the ‘Pixel Reliability’ and ‘VI Quality Assessment’ layers. The EVI, NIRv, and LAI were processed in the same way. Then, to distinguish the area covered by evergreen vegetation, the pixels of the multiyear (≥15) mean of winter NDVI < 0.25 are excluded, considered sparse vegetation or no evergreen vegetation. Further, we excluded the water bodies and artificial surfaces if the proportion of water bodies and artificial surfaces with 30 m pixels in Globland30 in 500 m pixels ≥ 5%. Based on the MODIS landcover dataset, we also excluded the 500 m MODIS pixel of Croplands, Cropland/Natural Vegetation Mosaics and Urban and Built-up Land. The pixels with abrupt drops were identified by applying the LandTrendr algorithm [67] to the NDVI time series and excluded. After removing low-quality NDVI, water bodies, artificial surfaces, Croplands, Cropland/Natural Vegetation Mosaics and Urban and Built-up Land, we obtained the area covered by evergreen vegetation on the Tibetan Plateau.
To further validate the trend of vegetation greenness, we calculated the trend of CSIF, as it is considered a reliable proxy for photosynthetic activity. We initially performed quality control on the CSIF time series data from 2000 to 2019 [68]. However, even after preprocessing, we observed outliers and biases in the data. To mitigate this, we divided the annual CSIF time series data into two seasons: photosynthetically active and photosynthetically non-active. The photosynthetically active season was defined as when CSIF values increased by 30% from the beginning to the day when CSIF values decreased by 70% in the latter half of the year. On the other hand, the photosynthetically non-active season was defined as the period outside the photosynthetically active season [69]. We observed that CSIF values were more variable during the photosynthetically active season and less variable during the photosynthetically non-active season. Therefore, we applied different criteria to eliminate outliers and biases in these two seasons [69]. Subsequently, we applied the MVC method and calculated the average monthly CSIF values during the growing season. Due to the difference in spatial resolution between CSIF vegetation greenness data (i.e., NDVI), we spatially aggregated the greenness values by the average method if all the pixels in a corresponding CSIF pixel were valued. All data processing in this study were conducted using MATLAB R2020b and IDL 8.5 software.

2.5. Data Analysis

2.5.1. Temporal Change of Vegetation Greenness

Temporal changes in vegetation greenness over 2000–2022 were assessed using temporal trends in greenness. This study analyzes the temporal changes in vegetation greenness in the growing season and winter. The greenness trend was calculated as the slope in linear regression between greenness and year using the ordinary least-squares regression when the length of vegetation greenness time series ≥ 15, and the significance level was determined by the t-test [25]. In addition, the Theil–Sen median slope for robustness was also used to evaluate the trend of vegetation greenness in the growing season owing to a contiguous time series of 22 years [70,71]. The Theil–Sen median slope did not evaluate the trend of winter vegetation greenness; as a result, the time series were not contiguous for 22 years.

2.5.2. Probability of Vegetation Greenness Change

To evaluate the consistency of different vegetation greenness indices, we first divided the trends of vegetation greenness during 2000–2022 into 3 categories at the 0.05 significance level: significantly positive (↑), significantly negative (↓) and no significant change (–). Then, according to the probabilities or likelihoods of vegetation growth trends [6,72], we summarized the probability categories (Table 1). The criteria were as follows:
(1)
If four vegetation indexes (NDVI, EVI, NIRv, and LAI) showed significant change in the same direction, the probability of vegetation greenness change was defined as ‘very likely’ (i.e., four ‘↑’ is defined as ‘Enhanced very likely’, and four ‘↓’ is defined as ‘Degraded very likely’).
(2)
If three vegetation indexes showed significant change, the probability of vegetation greenness change was defined as ‘likely’.
(3)
If two vegetation indexes showed significant change, the probability of vegetation greenness change was defined as ‘probably’.
(4)
If there was none or only one vegetation index that showed a significant change, the probability of vegetation greenness change was defined as ‘Uncertainty’.
Furthermore, we used the confusion matrix to evaluate the difference in vegetation greenness between two vegetation indexes [73]. In this matrix, we expected the proportion to be large in the diagonal positions (a, e, and i in Figure 3), representing large consistency between the changes in two vegetation indexes. The accuracy was used as a proxy to measure the consistency trend of two vegetation indexes, and the expression can be written as:
A c c u r a c y = a + e + i a + b + c + d + e + f + g + h + i
The ‘Accuracy’ represents the pixel’s proportion of consistent change by using two vegetation indexes in total pixels. The ‘a’ represents the pixels proportion of the trend of vegetation index1 belonging to the class (significantly positive) and the trend of vegetation index2 belonging to the class (significantly positive) in total pixels. The ‘b’–‘i’ is calculated in the same way. All data analysis in this study were conducted using the MATLAB R2020b software.

3. Results

3.1. The Trend of Vegetation Greenness during the Growing Season and Winter

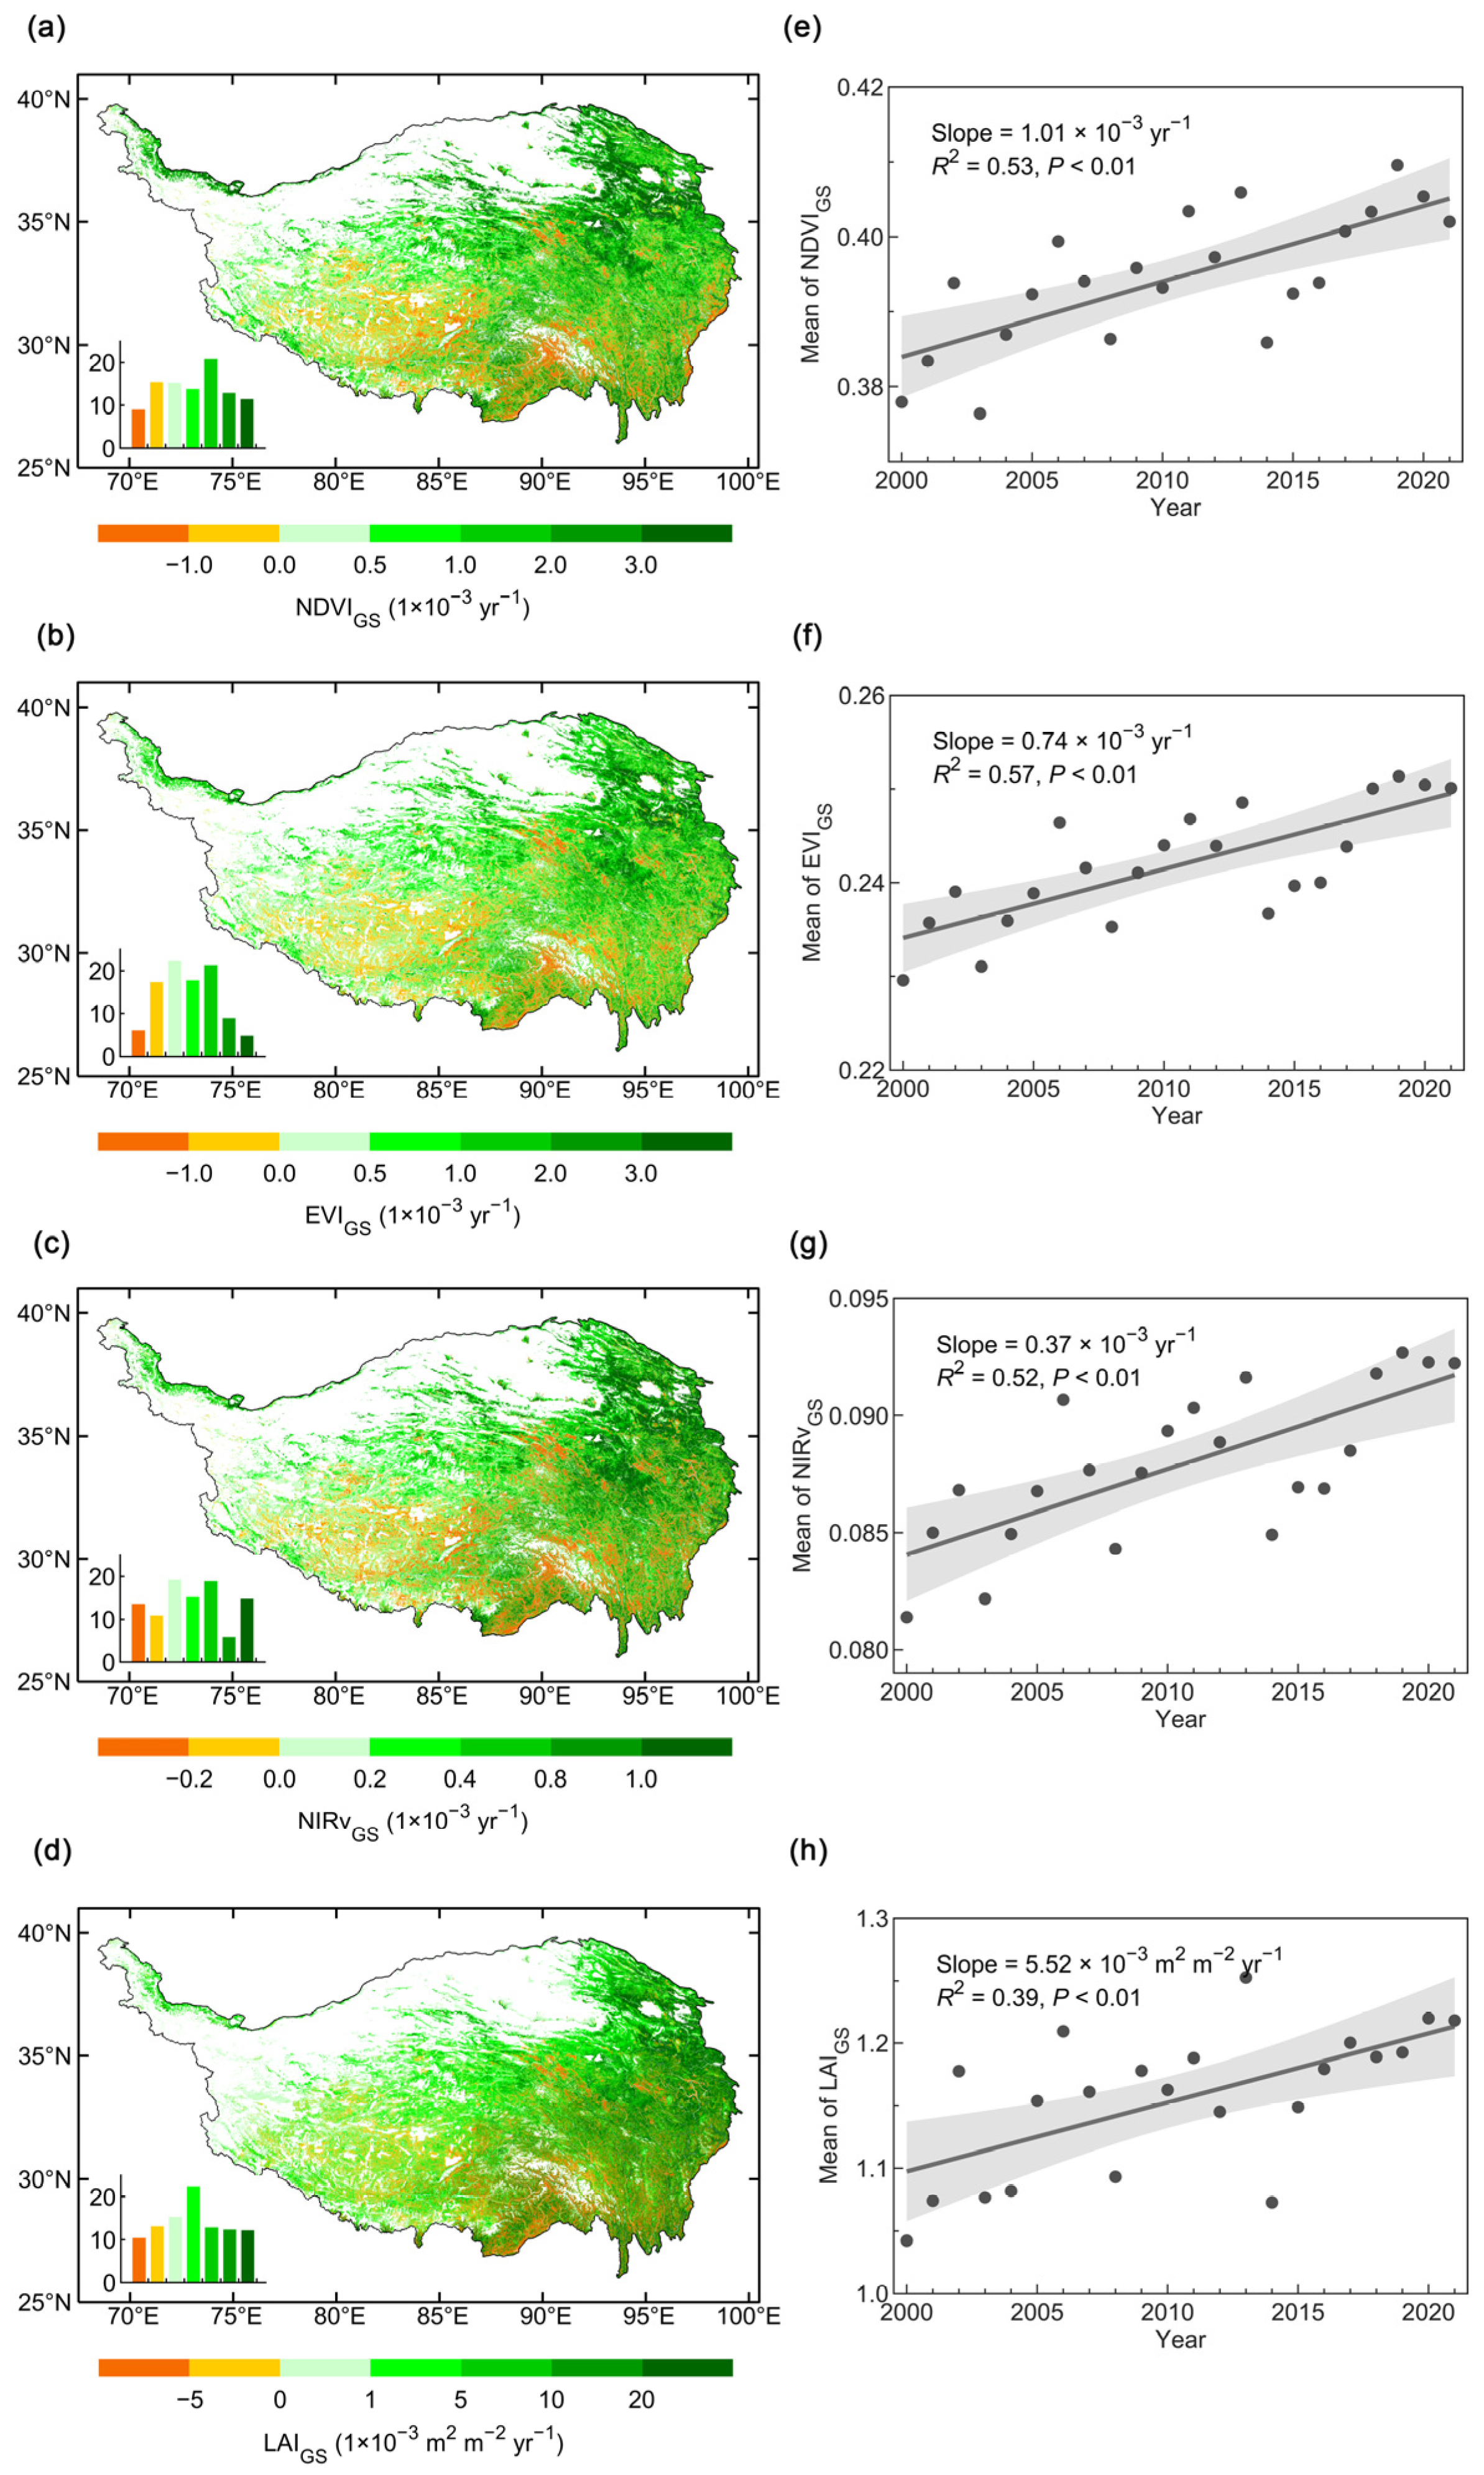
Spatially, the temporal trends in growing season NDVI, EVI, NIRv, and LAI (NDVIGS, EVIGS, NIRvGS, and LAIGS) during 2000–2021 were positive in 75.2%, 76.1%, 75.1%, and 76.0% of pixels covered by vegetation in the growing season on the Tibetan Plateau (Figure 4a–d). The growing season greenness indexes showed a positive trend in the northeastern, central-eastern, and northwestern areas. In contrast, negative trends in growing season greenness were observed in southwestern and central-southern regions. Temporally, the growing season greenness indexes averaged over the region significantly increased (p < 0.01) from 2000 to 2021 (Figure 4e,f). Furthermore, for robustness, similar trend patterns of NDVIGS, EVIGS, NIRvGS, and LAIGS were also observed using the Theil–Sen median slope method (Figure S1).
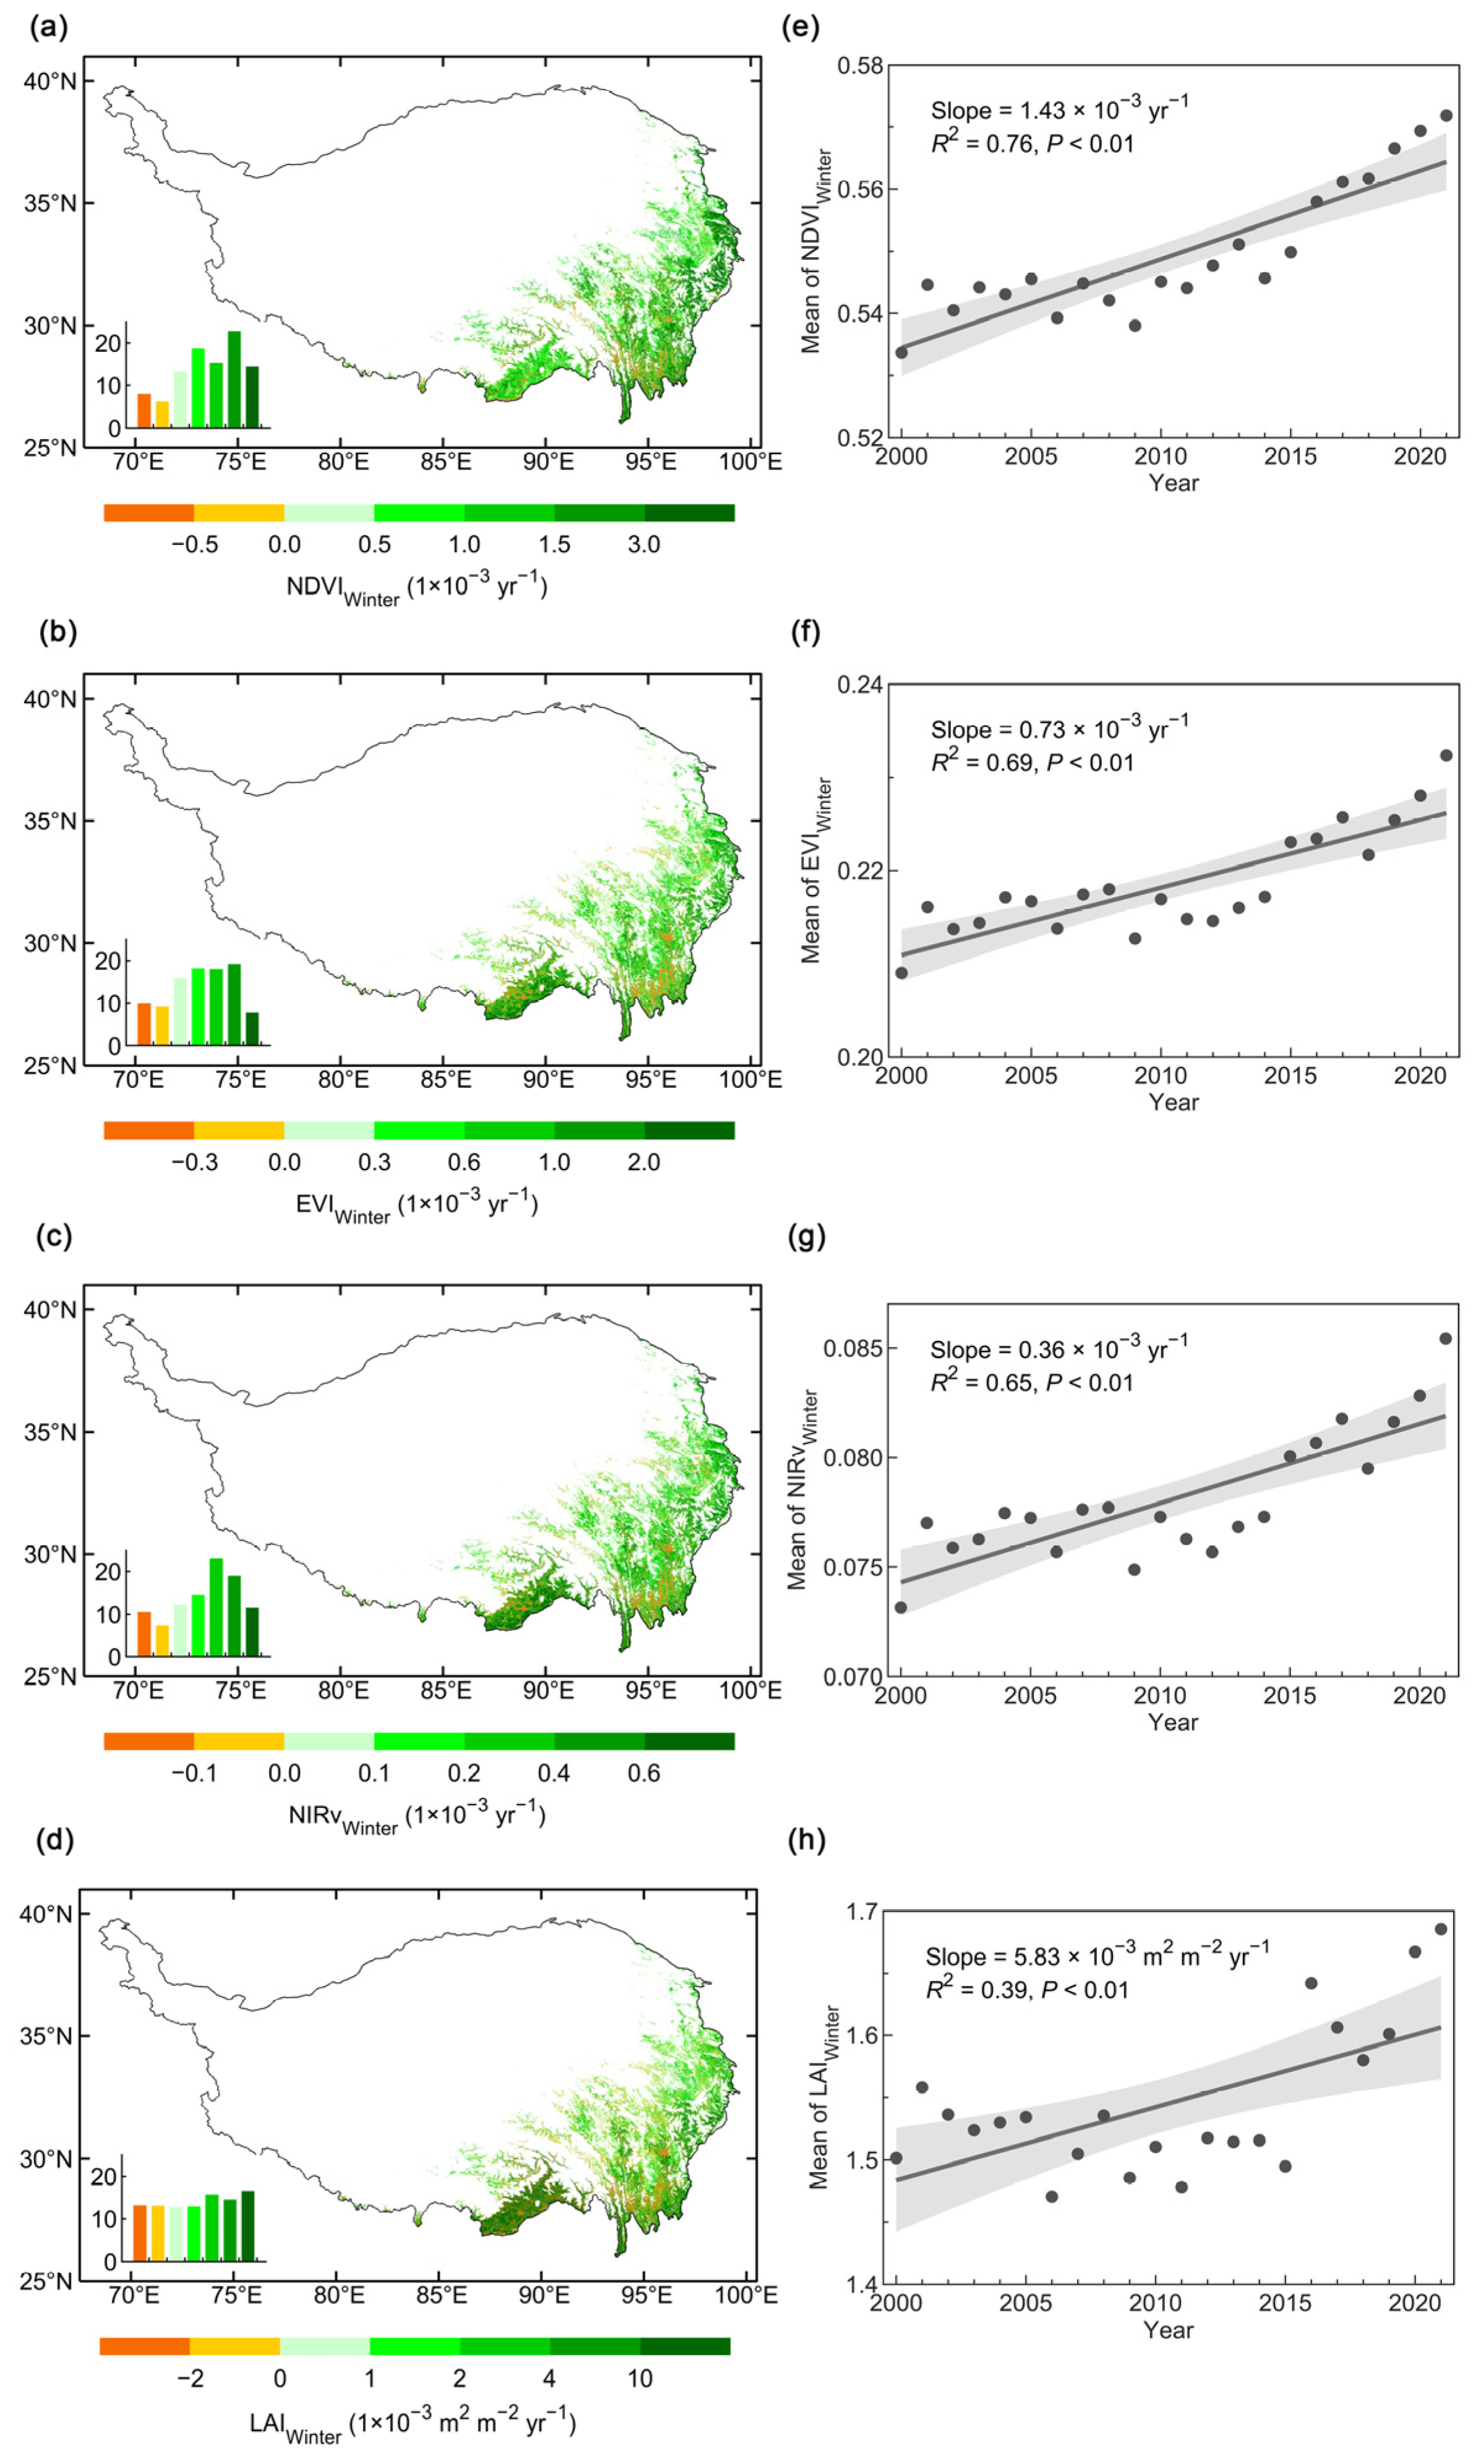
In addition, the temporal trends in winter NDVI, EVI, NIRv, and LAI (NDVIWinter, EVIWinter, NIRvWinter, and LAIWinter) from 2000–2001 to 2021–2022 were positive in 85.5%, 80.4%, 81.6%, and 73.4% of pixels covered by evergreen vegetation on the Tibetan Plateau (Figure 5a–d). In most pixels, the evergreen vegetation showed widespread greening trends. The winter greenness indexes averaged over the region significantly increased (p < 0.01) from 2000–2001 to 2021–2022 (Figure 5e,f). In this study, the multiyear mean of winter NDSI snow cover from 2000–2001 to 2021–2022 in 96.1% pixels was equal to 0, which indicated that snow cover showed little impact on the change of winter vegetation greenness (Figure S2). In summary, despite the regional variation, the NDVI, EVI, NIRv, and LAI showed similar greening change patterns in the growing season and winter in more than half of the total pixels.

3.2. Analysis of the Probability of Vegetation Greenness Change

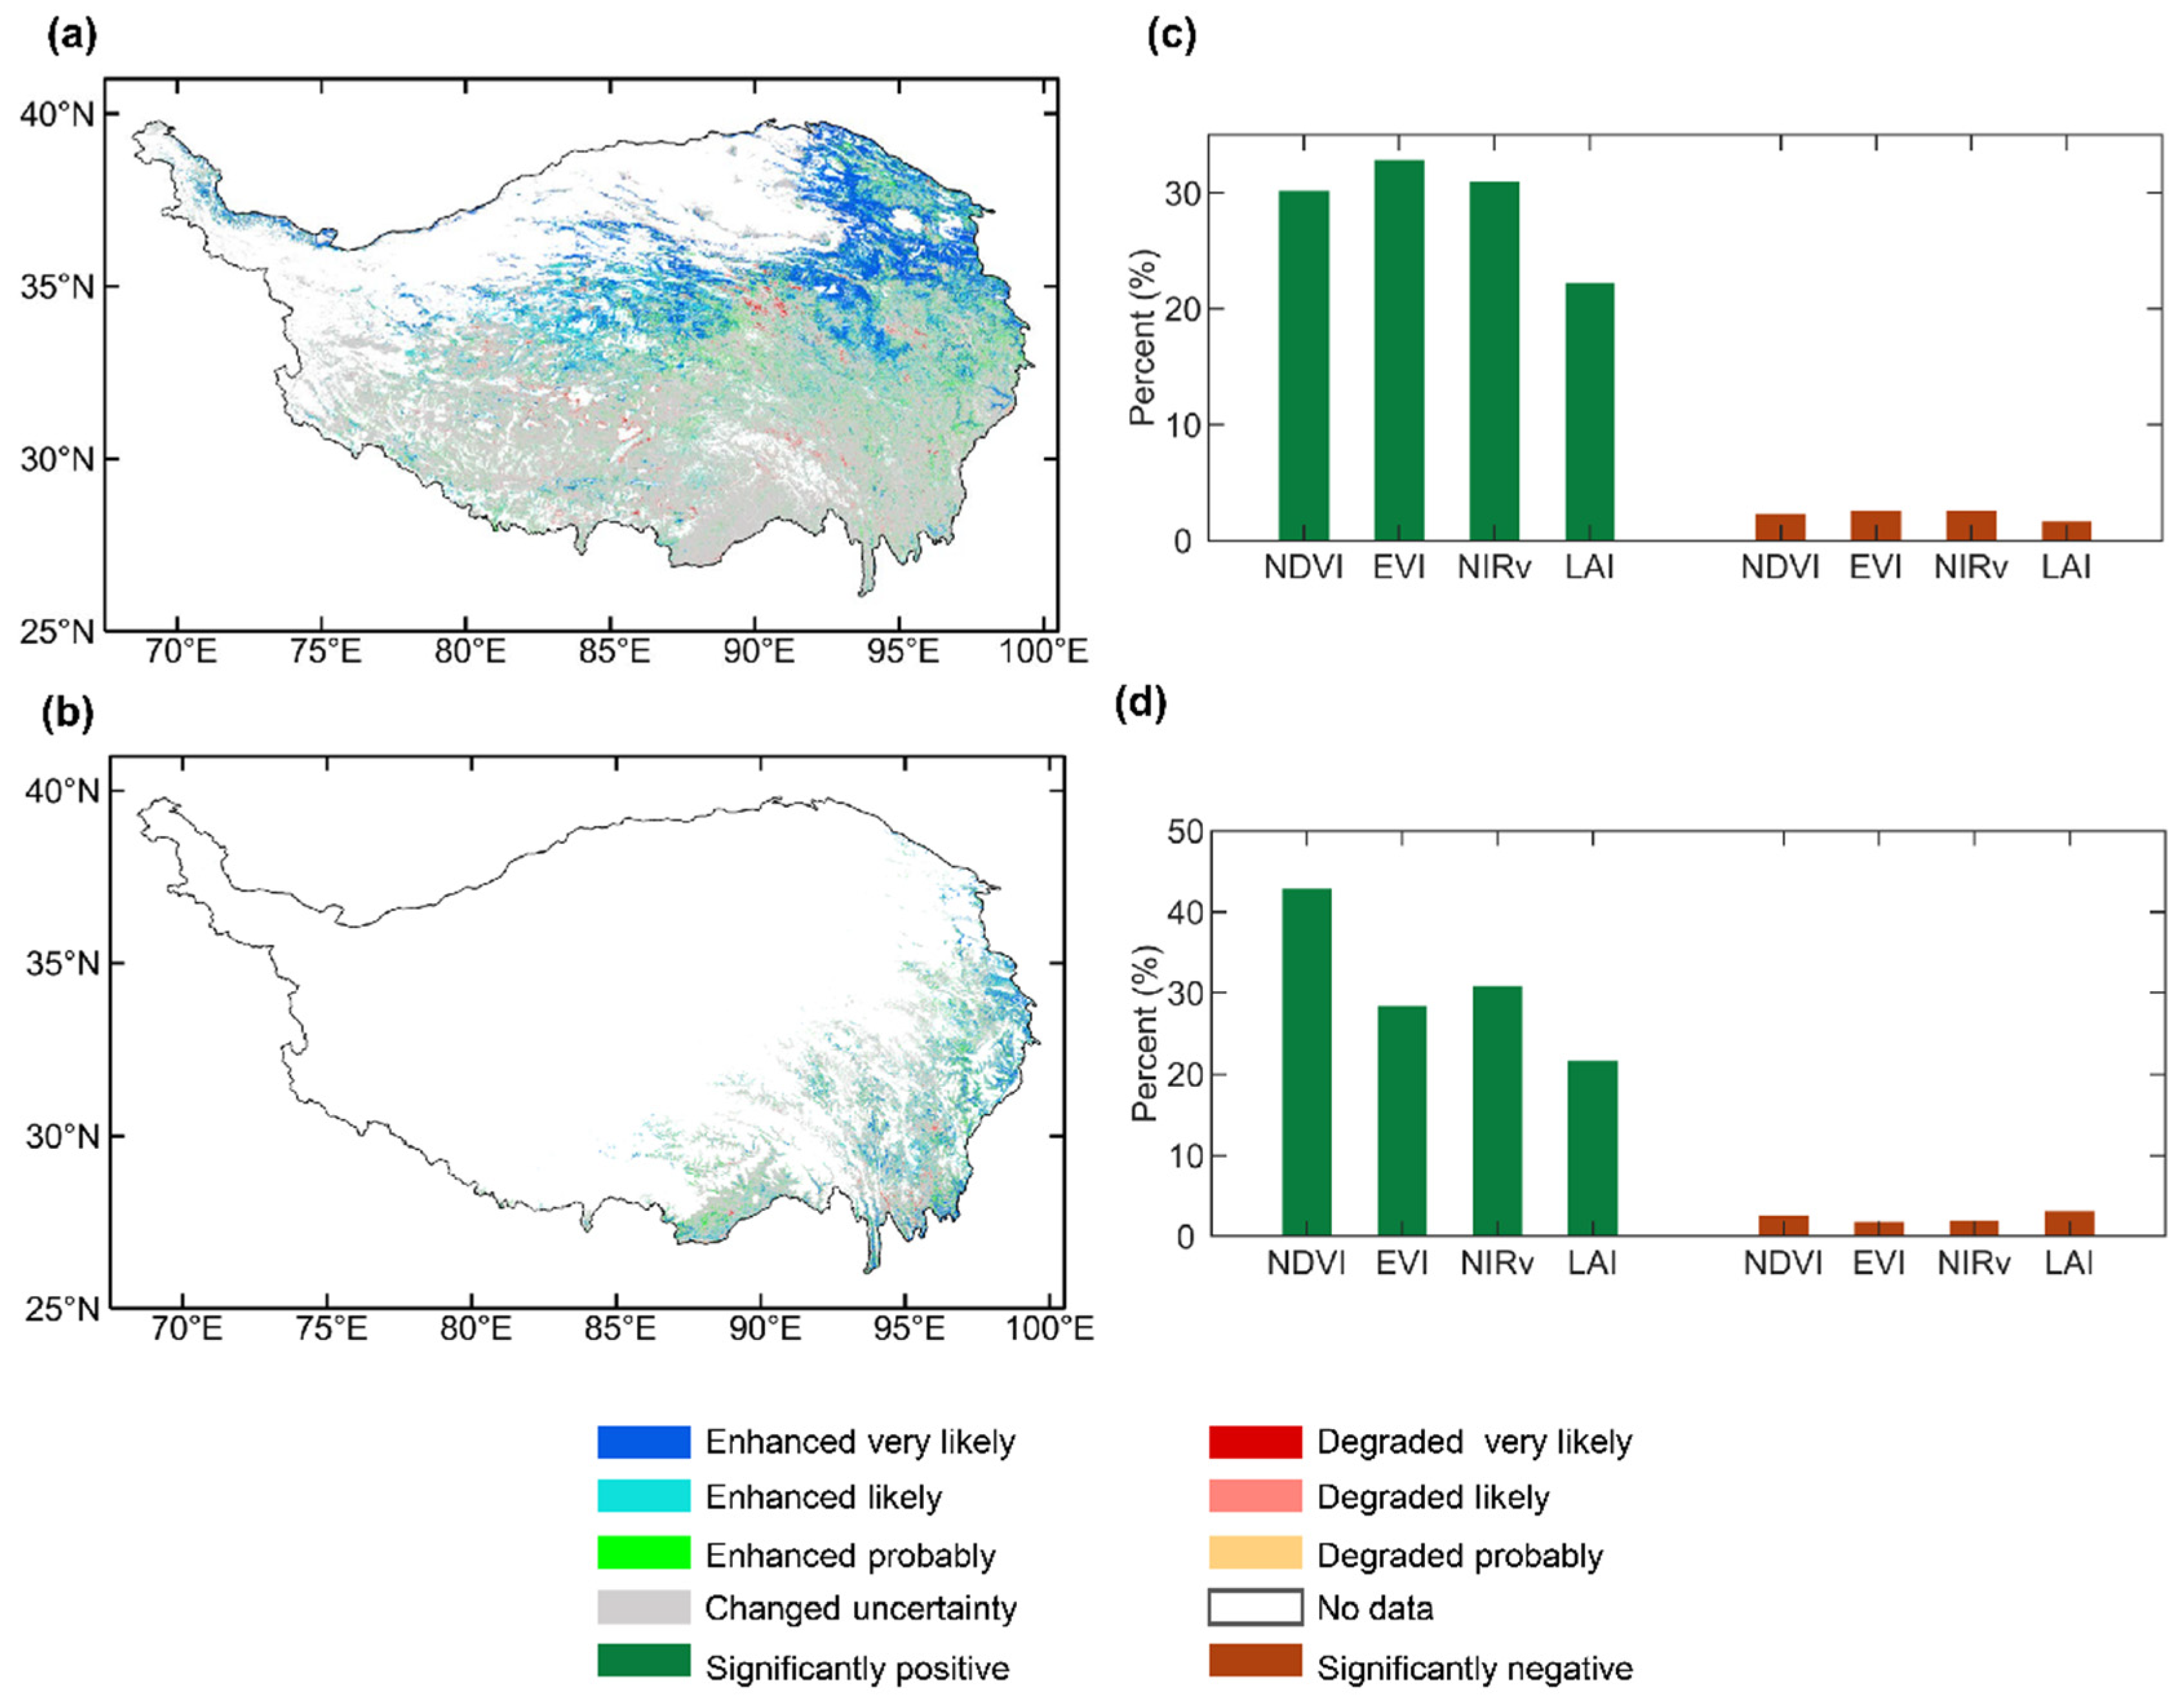
The consistency assessment of the trend of four vegetation greenness indicators in the growing season showed that in 28.5% of pixels, vegetation growth enhanced in pixels covered by vegetation (Figure 6a). The 14.0% and 8.4% pixels were identified as enhanced very likely and enhanced likely, which were distributed in northeastern and northern areas on the Tibetan Plateau. The 6.0% pixels were identified as enhanced and probably distributed in central and central-eastern areas on the Tibetan Plateau. Only 1.5% of pixels showed degraded distribution in southwestern and central-eastern areas. The inconsistent change in four vegetation greenness indexes was observed in only 0.04% of pixels in the growing season. The evergreen vegetation was also enhanced by 29.8% of the pixels covered by evergreen vegetation on the Tibetan Plateau (Figure 6b). The percent of pixels identified with enhanced very likely, enhanced likely, and enhanced probably of pixels covered by evergreen vegetation on the Tibetan Plateau were 10.6%, 11.4%, and 7.8%, which were distributed in eastern edges and southeastern areas. Only 1.3% of pixels showed degraded distribution in the valley of southeastern areas. The 0.64% pixels showed inconsistent change by four greenness indexes. Among multiple greenness indicators, significant greening was observed in 30.1%, 32.7%, 30.8%, and 22.1% of this study area when estimated from NDVIGS, EVIGS, NIRvGS, and LAIGS (Figure 6c). The NDVIGS, EVIGS, and NIRvGS were closest to the probability of vegetation greenness change. The LAI showed the lowest percentage of significantly positive trends in the growing season. The assessment of multiple greenness indicators could balance the percent of significantly positive vegetation trends, especially improving the percent of the significantly positive trend of LAIGS. Whereas, the percent of evergreen vegetation greening indicated by NDVIWinter (42.8%) was higher than that indicated by EVIWinter, NIRvWinter, and LAIWinter (28.2%, 30.8%, and 21.5%). Thus, asynchronous changes in different vegetation greenness should be the focus of further study.

3.3. Comparison of Vegetation Greenness Trends between Two Different Vegetation Indexes

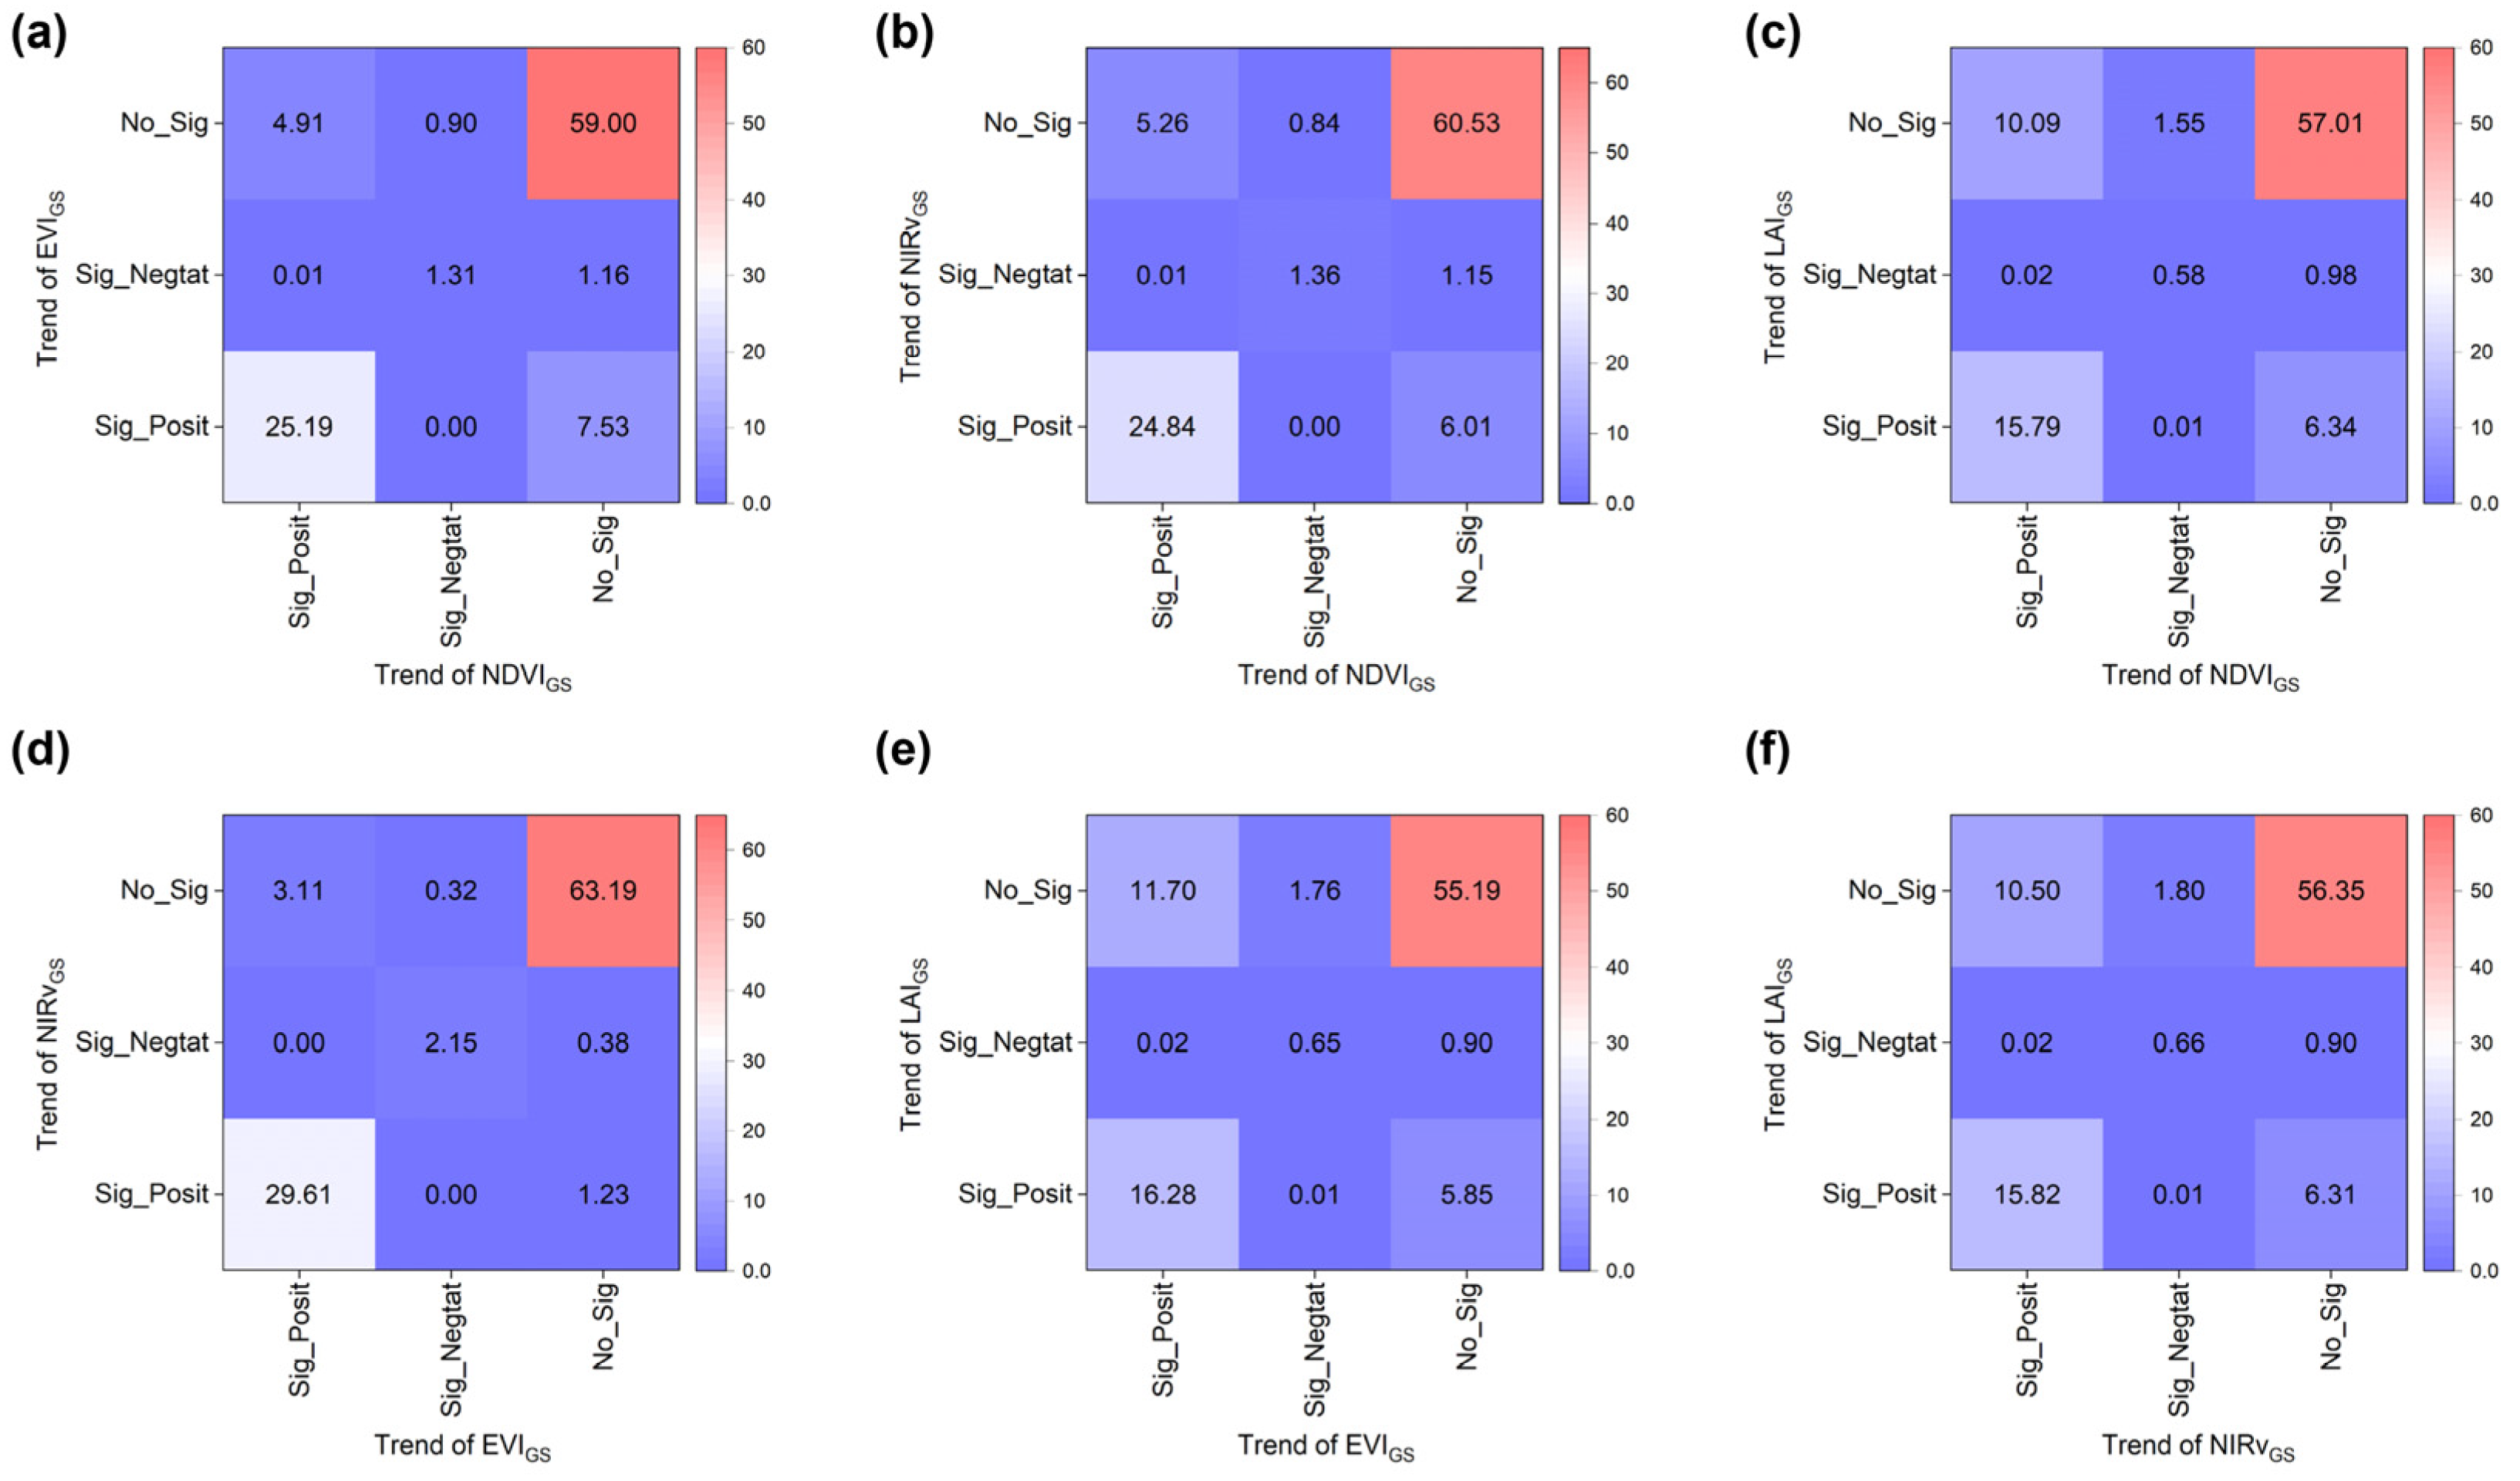
The largest consistency of significantly positive was between NIRvGS and EVIGS in 29.6% pixels, and the following consistency of significantly positive was between EVIGS and NDVIGS, NIRvGS and NDVIGS (Figure 7). The lowest consistency of significantly positive results was between EVIGS and LAIGS. The overall accuracy between the two vegetation indexes was about 0.80, and the accuracy between the trend of EVIGS and NIRvGS showed the biggest value. The accuracy between the LAIGS trend and other vegetation indexes was relatively low (Table 2).
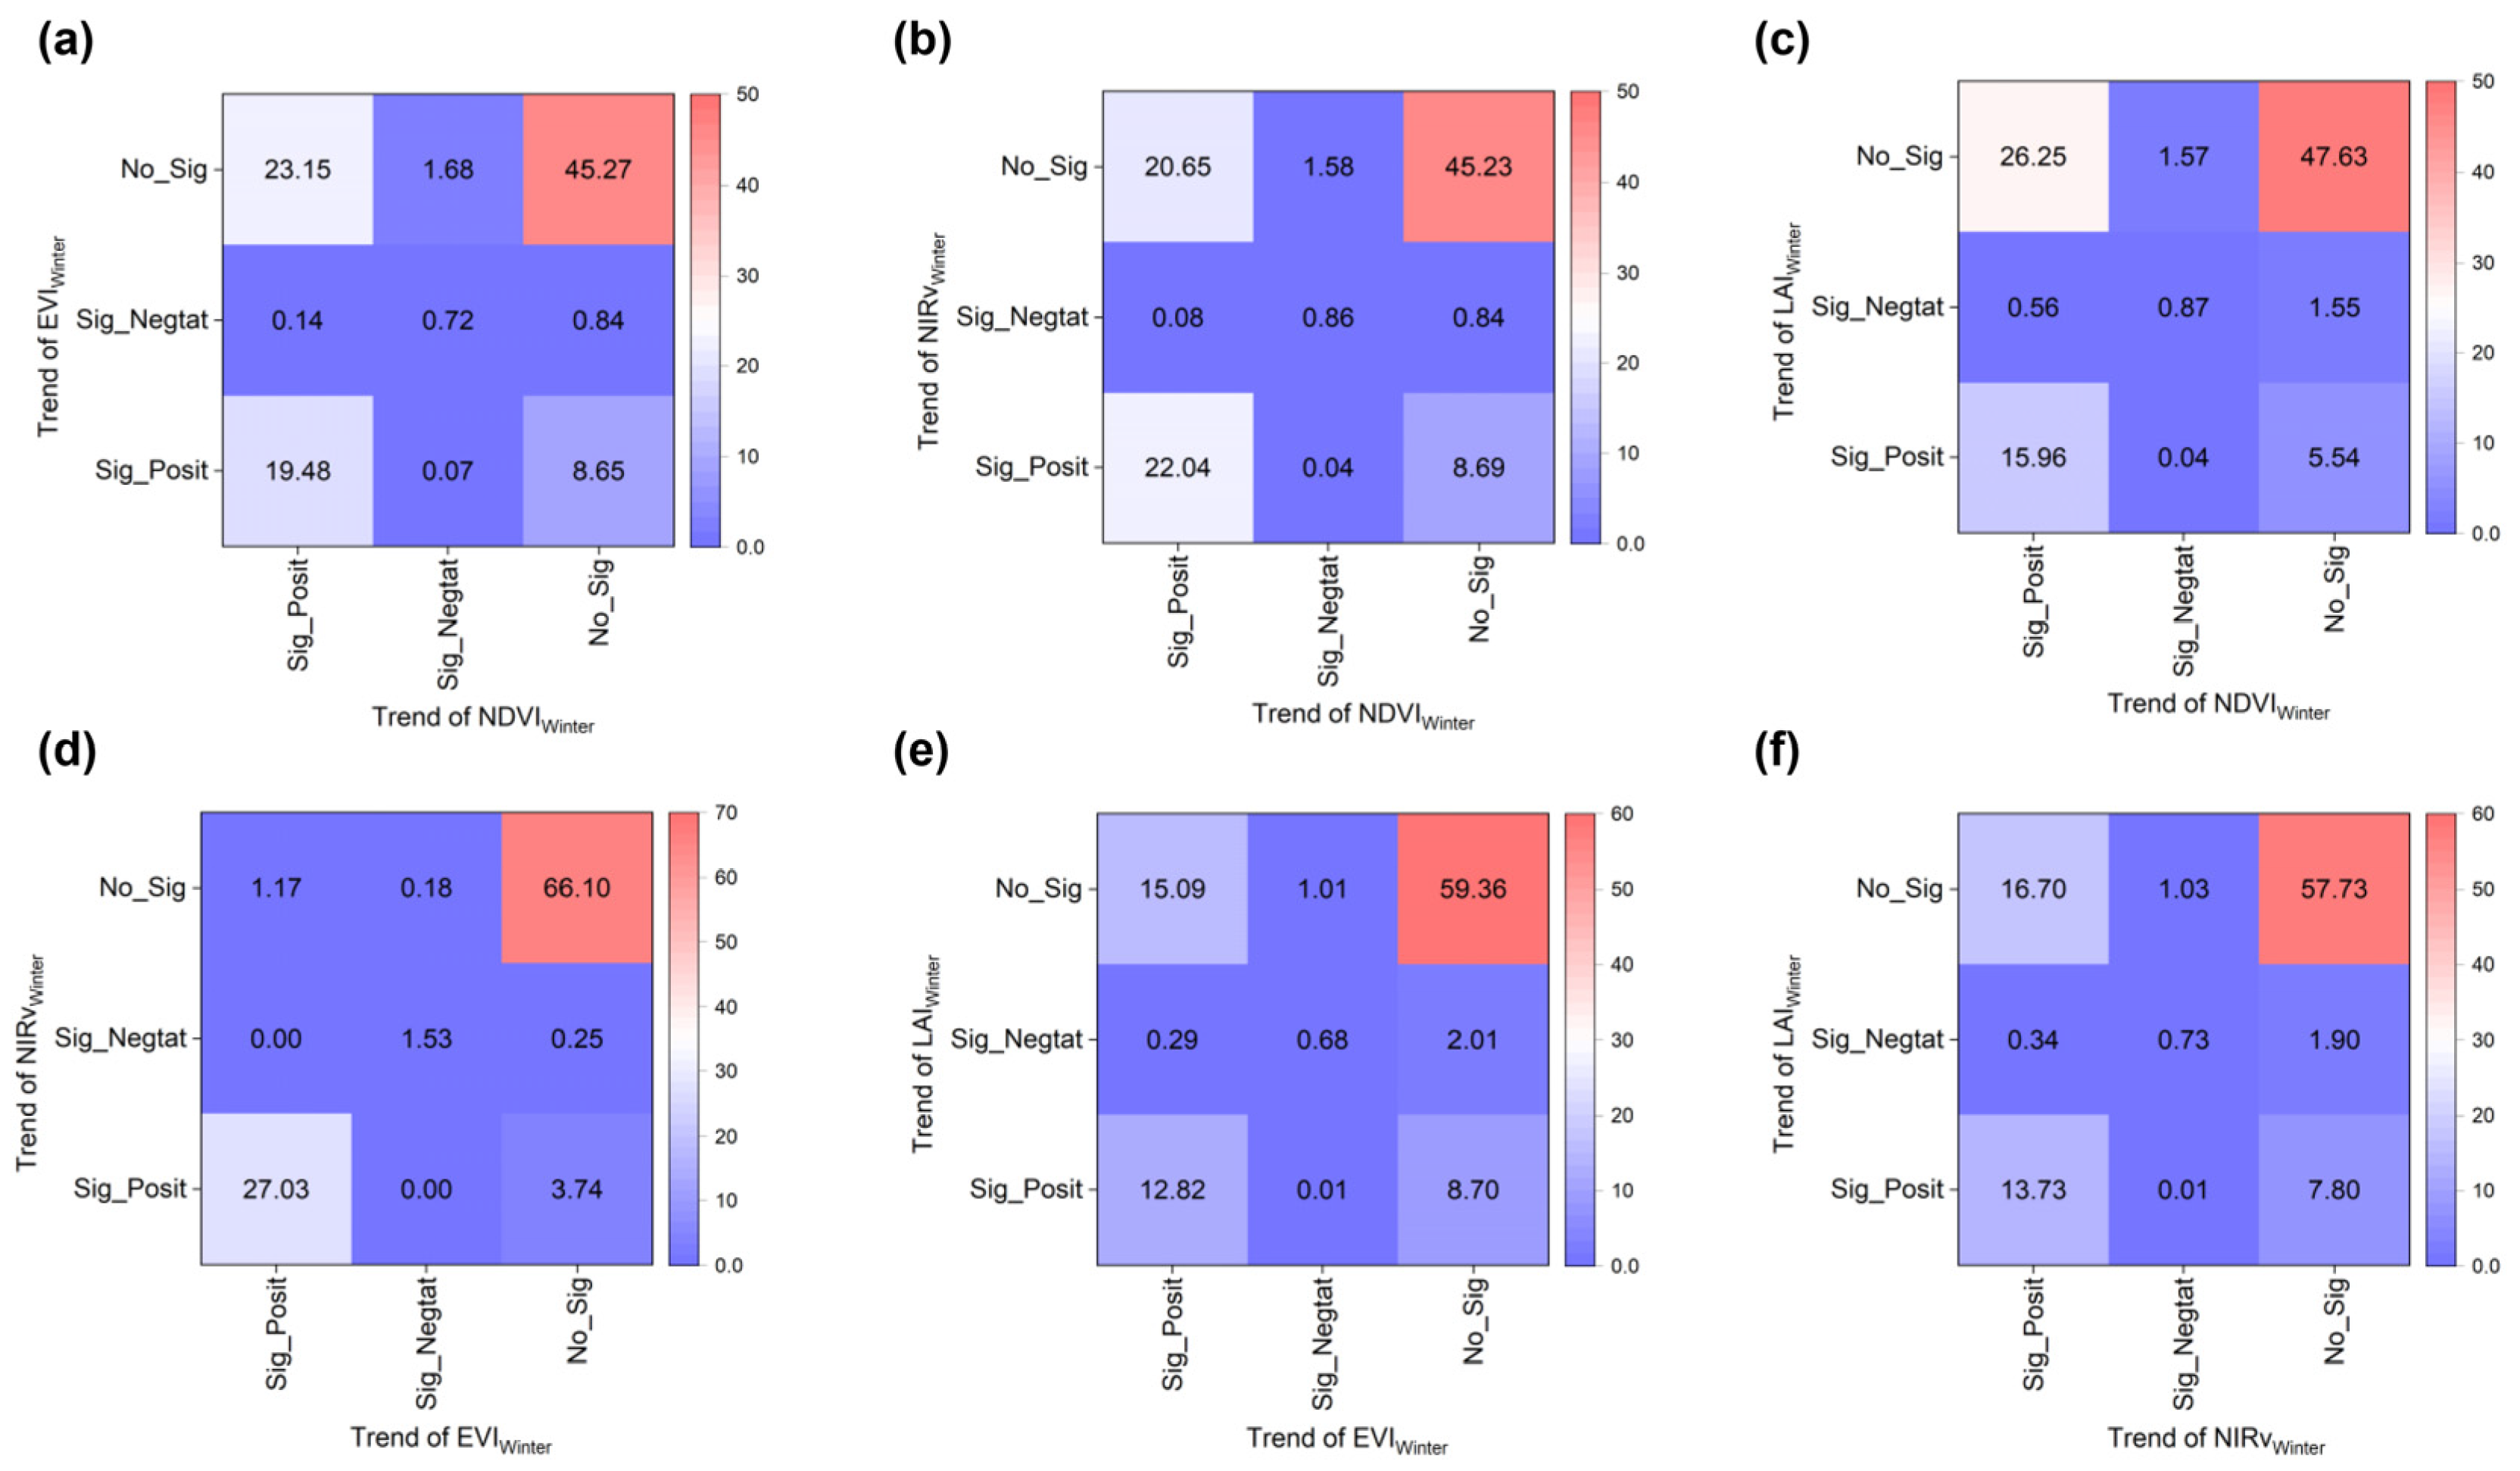
In the comparison of the trend of evergreen vegetation, the largest consistency of significantly positive was between NIRvWinter and EVIWinter in 27.0% pixels, and the following consistency of significantly positive was between NIRvWinter and NDVIWinter, EVIWinter and NDVIWinter (Figure 8). The lowest consistency of significantly positive results was between EVIWinter and LAIWinter, which showed a similar result with the trend of greenness in the growing season. The overall accuracy between the two vegetation indexes was about 0.65 lower than in the growing season, and the accuracy between the trends of LAIWinter and NDVIWinter was relatively low (Table 3). The overall accuracy between NDVIWinter and EVIWinter was lower than between NDVIGS and EVIGS. We found that the more pixels, the more NDVIWinter trends were significantly positive. However, EVIWinter trends showed no significant change.

4. Discussion

4.1. Significances of the Consistency of Vegetation Greenness Trend

The consistency analysis of four vegetation indexes for vegetation change on the Tibetan Plateau revealed a green trend during the growing and winter seasons. The EVIGS and NIRvGS, as well as EVIWinter and NIRvWinter, demonstrated the greatest consistency (0.95) in vegetation change trends, consistent with previous studies [31]. The consistency between NDVIGS and other vegetation greenness indexes (EVIGS, NIRvGS, and LAIGS) was higher in the growing season, with a value of about 0.80, but lower in NDVIWinter with EVIWinter, NIRvWinter, and LAIWinter, with a value of about 0.65. This could be explained by dataset accuracy due to the contamination by clouds and aerosols in winter, despite removing low-quality datasets. The LAI exhibited lower consistency with the other three vegetation indices, particularly in LAIWinter and NDVIWinter, as NDVI may not be suitable due to the lack of sensitivity in high LAI conditions [74]. To further explore the physiological activity of vegetation, we used the CSIF to assess the change in vegetation growth. The CSIF also showed a greening trend in the eastern and northeastern areas, and browning was observed in the southwestern and some southeastern areas (Figure S3). In most areas, the CSIF showed a consistent change with greenness (Figures S3 and S4). However, there were some differences in trends in SIF and greenness. The CSIF showed more browning areas (accounting for 34.8%) in the northwestern and southeastern parts of the Tibetan Plateau than NDVIGS, EVIGS, NIRvGS, and LAIGS (accounting for 24.4%, 25.7%, 27.0%, and 23.0%, respectively). When the leaf area remains stable, the change in greenness (i.e., NDVI) may be small, while the change in photosynthesis could provide more information about influencing factors such as solar radiation and drought conditions [75,76]. Therefore, in most areas, vegetation greenness is consistent with SIF in monitoring vegetation dynamics, but CSIF is more sensitive to greenness in the physiological activity of vegetation.

4.2. The Driving Factors of Vegetation Greenness Change

Compared with previous studies, the change in vegetation greenness in the growing season based on satellite observations showed increasing trends in northeastern, northwestern, central-eastern, and northwestern areas since 2000 as a result of increasing precipitation, increasing temperature, and solar radiation, respectively [5,77,78]. Browning was observed in the southwestern Tibetan Plateau due to decreasing precipitation from 2000 to 2018 [5]. On the other hand, since 2000, the Chinese government has implemented some ecological restoration projects, and vegetation growth has benefited from these projects [79,80,81]. Some studies revealed that establishing the protected areas increased vegetation greenness [79,80]. In addition, grazing reduction has been identified as an important and effective strategy in these projects on the Tibetan Plateau, such as fencing, degrading grassland, and ecological compensation [80]. Implementing these projects has mitigated grassland degradation in the central Tibetan Plateau [81].
For winter evergreen vegetation, similar to our findings, vegetation greenness in the southeastern Tibetan Plateau showed an increasing trend over the past 20 years due to increasing temperatures [78,82,83]. On the other hand, upward treelines and tree recruitment could lead to an increase in evergreen vegetation greenness [33,84]. For example, in an analysis of treeline dynamics on the Tibetan Plateau by collecting 59 treeline sites, 67% showed an upward trend from 1901 to 2017, and 73% of the tree recruitments showed an increasing trend [84]. In addition, ecological restoration projects such as afforestation also caused an increase in the greenness of evergreen vegetation [85].

4.3. Uncertainty and Limitations

In our analysis, we carefully considered the robustness of vegetation indices and chose to analyze four widely utilized ones. Nonetheless, there remains potential for future expansion by incorporating a broader range of indices. It is worth noting that our current focus is on identifying regions characterized by evergreen vegetation cover. However, the distinction between deciduous and evergreen vegetation can sometimes be challenging, warranting dedicated efforts to enhance accuracy in identifying areas with deciduous vegetation. The current study provides a concise overview of the factors contributing to variations in vegetation greenness. Recognizing the intricate nature of these factors, we should strive for a more refined and nuanced understanding of the underlying causes driving these changes.

4.4. Implications and Future Research Directions

A widespread greening of vegetation influences the structure and function of the ecosystem. For example, greening increases vegetation’s photosynthetic carbon absorption capacity, which in turn increases vegetation productivity, and enhanced productivity can increase terrestrial carbon storage [3]. Conversely, greening also causes some negative impacts on the ecosystem. For example, shrub encroachment decreased herbaceous coverage, density, and species richness and led to the loss of endemic species in the meadow community [86]. Vegetation greening also impacts the land surface process. For example, vegetation greening could reduce the temperature [78]. However, vegetation greening can only indirectly indicate vegetation expansion, and further exploration is necessary, combined with ground observations and other investigation data. Furthermore, when we assessed the change in vegetation greenness, more indexes could enhance the robustness of the results, especially in winter evergreen vegetation. In addition, vegetation growth in deciduous and winter evergreen vegetation is different. Evergreen vegetation should be considered to improve process-based land surface models, as most of these models use scenarios specified for vegetation types [87]. Further research is needed to elucidate the underlying drivers of these trends and their potential impacts on ecosystem services and land surface processes on the Tibetan Plateau.

5. Conclusions

In this study, we first assessed the change in growing-season vegetation greenness. Then, we identified the area covered by evergreen vegetation and evaluated the change in evergreen vegetation greenness from 2000 to 2022 based on satellite observations. Four vegetation greenness indexes were selected to show vegetation change and consistency assessment. This study found positive temporal trends in growing season vegetation greenness using NDVI, EVI, NIRv, and LAI on the Tibetan Plateau between 2000 and 2021. These positive trends were mainly observed in the northeastern, central-eastern, and northwestern areas, while negative trends were observed in the southwestern and central-southern regions. Widespread green trends in winter greenness indexes were observed during 2000–2022. The consistency assessment of different vegetation greenness indexes showed relatively high consistency in positive trends, particularly between NIRv and EVI. However, the consistency was relatively low between LAI and other vegetation indexes. These findings suggest the application of multiple indexes to study the dynamics of vegetation on the Tibetan Plateau synthetically.

Supplementary Materials

The following supporting information can be downloaded at: https://www.mdpi.com/article/10.3390/rs15245697/s1. Figure S1: Spatial variation of trend of growing season (May–September) NDVI, EVI, NIRv, and LAI by using the Theil–Sen median slope method, respectively (a, b, c, and d); Figure S2: Spatial distribution of multiyear mean of winter normalized difference snow index (NDSI) snow cover; Figure S3: Spatial variation of trend of growing season CSIF during 2000–2019 by using the ordinary least-squares regression; Figure S4: Spatial variation of trend of growing season NDVI, EVI, NIRv, and LAI during 2000–2019 by using the ordinary least-squares regression (a, b, c, and d).

Author Contributions

Conceptualization, J.L. and W.Z.; methodology, J.L.; writing—original draft preparation, J.L.; writing—review and editing, J.L., W.Z., T.H., L.Z. and P.P.; funding acquisition, W.Z. All authors have read and agreed to the published version of the manuscript.

Funding

This work was supported by the Second Tibetan Plateau Scientific Expedition and Research Program (No. 2019QZKK0405).

Data Availability Statement

The data supporting this study are available from the following resources in the public domain. The MOD13A1 V061 NDVI and EVI dataset and MOD15A2H v061 LAI dataset were downloaded from Google Earth Engine at https://developers.google.com/earth-engine/datasets/ (accessed on 10 December 2022). The NIRv dataset was calculated by NDVI and reflectance from near-infrared band extracting from MOD13A1 v061 product at https://earthengine.google.com (accessed on 10 December 2022). The Contiguous solar-induced fluorescence (CSIF) dataset was downloaded from https://figshare.com/articles/dataset/CSIF/6387494 (accessed on 10 February 2023). The GlobeLand30 and MCD12Q1 v06l landcover dataset were downloaded from https://www.nature.com/articles/514434c (accessed on 21 July 2021) and https://developers.google.com/earth-engine/datasets/ (accessed on 10 December 2022). The MOD10A1 v061 snow cover dataset was downloaded from https://developers.google.com/earth-engine/datasets/ (accessed on 15 March 2023).

Acknowledgments

We would like to thank David Eldridge at the University of NSW for his assistance with the English language and editing of this manuscript.

Conflicts of Interest

The authors declare that they have no conflict of interest.

References

  1. García-Pardo, K.A.; Moreno-Rangel, D.; Domínguez-Amarillo, S.; García-Chávez, J.R. Remote Sensing for the Assessment of Ecosystem Services Provided by Urban Vegetation: A Review of the Methods Applied. Urban For. Urban Green. 2022, 74, 127636. [Google Scholar] [CrossRef]
  2. Zhao, Y.; Liu, Z.; Wu, J. Grassland Ecosystem Services: A Systematic Review of Research Advances and Future Directions. Landsc. Ecol. 2020, 35, 793–814. [Google Scholar] [CrossRef]
  3. Piao, S.; Wang, X.; Park, T.; Chen, C.; Lian, X.; He, Y.; Bjerke, J.W.; Chen, A.; Ciais, P.; Tømmervik, H.; et al. Characteristics, Drivers and Feedbacks of Global Greening. Nat. Rev. Earth Environ. 2019, 1, 14–27. [Google Scholar] [CrossRef]
  4. Berner, L.T.; Massey, R.; Jantz, P.; Forbes, B.C.; Macias-Fauria, M.; Myers-Smith, I.; Kumpula, T.; Gauthier, G.; Andreu-Hayles, L.; Gaglioti, B.V.; et al. Summer Warming Explains Widespread but Not Uniform Greening in the Arctic Tundra Biome. Nat. Commun. 2020, 11, 4621. [Google Scholar] [CrossRef]
  5. Li, P.; Hu, Z.; Liu, Y. Shift in the Trend of Browning in Southwestern Tibetan Plateau in the Past Two Decades. Agric. For. Meteorol. 2020, 287, 107950. [Google Scholar] [CrossRef]
  6. Ding, Z.; Peng, J.; Qiu, S.; Zhao, Y. Nearly Half of Global Vegetated Area Experienced Inconsistent Vegetation Growth in Terms of Greenness, Cover, and Productivity. Earth’s Future 2020, 8, e2020EF001618. [Google Scholar] [CrossRef]
  7. Bonan, G.B. Forests and Climate Change: Forcings, Feedbacks, and the Climate Benefits of Forests. Science 2008, 320, 1444–1449. [Google Scholar] [CrossRef]
  8. Zheng, L.; Zhao, G.; Dong, J.; Ge, Q.; Tao, J.; Zhang, X.; Qi, Y.; Doughty, R.B.; Xiao, X. Spatial, Temporal, and Spectral Variations in Albedo Due to Vegetation Changes in China’s Grasslands. ISPRS J. Photogramm. Remote Sens. 2019, 152, 1–12. [Google Scholar] [CrossRef]
  9. Anwar, S.A. Understanding the Contribution of the Vegetation-Runoff System for Simulating the African Climate Using the Regcm4 Model. Theor. Appl. Climatol. 2019, 138, 1219–1230. [Google Scholar] [CrossRef]
  10. Liu, Z.; Duan, Q.; Fan, X.; Li, W.; Yin, J. Bayesian Retro-and Prospective Assessment of Cmip6 Climatology in Pan Third Pole Region. Clim. Dyn. 2022, 60, 767–784. [Google Scholar] [CrossRef]
  11. Yao, T.; Bolch, T.; Chen, D.; Gao, J.; Immerzeel, W.; Piao, S.; Su, F.; Thompson, L.; Wada, Y.; Wang, L.; et al. The Imbalance of the Asian Water Tower. Nat. Rev. Earth Environ. 2022, 3, 618–632. [Google Scholar] [CrossRef]
  12. Zhong, L.; Ma, Y.; Xue, Y.; Piao, S. Climate Change Trends and Impacts on Vegetation Greening over the Tibetan Plateau. J. Geophys. Res. Atmos. 2019, 124, 7540–7552. [Google Scholar] [CrossRef]
  13. Shen, M.G.; Jeong, S.J.; Zhou, L.M.; Zeng, Z.Z.; Ciais, P.; Chen, D.L.; Huang, M.T.; Jin, C.S.; Li, L.Z.X.; Li, Y.; et al. Evaporative Cooling over the Tibetan Plateau Induced by Vegetation Growth. Proc. Natl. Acad. Sci. USA 2015, 112, 9299–9304. [Google Scholar] [CrossRef]
  14. Wu, J.; Wang, H.; Li, G.; Ma, W.; Wu, J.; Gong, Y.; Xu, G. Vegetation Degradation Impacts Soil Nutrients and Enzyme Activities in Wet Meadow on the Qinghai-Tibet Plateau. Sci. Rep. 2020, 10, 21271. [Google Scholar] [CrossRef] [PubMed]
  15. Zuo, Z.; Zhang, R.; Zhao, P. The Relation of Vegetation over the Tibetan Plateau to Rainfall in China During the Boreal Summer. Clim. Dyn. 2011, 36, 1207–1219. [Google Scholar] [CrossRef]
  16. Wen, L.; Dong, S.; Li, Y.; Wang, X.; Li, X.; Shi, J.; Dong, Q. The Impact of Land Degradation on the C Pools in Alpine Grasslands of the Qinghai-Tibet Plateau. Plant Soil 2012, 368, 329–340. [Google Scholar] [CrossRef]
  17. She, Y.; Zhang, Z.; Ma, L.; Xu, W.; Huang, X.; Zhou, H. Vegetation Attributes and Soil Properties of Alpine Grassland in Different Degradation Stages on the Qinghai-Tibet Plateau, China: A Meta-Analysis. Arab. J. Geosci. 2022, 15, 193. [Google Scholar] [CrossRef]
  18. Zhang, J.; Wu, L.; Huang, G.; Zhu, W.; Zhang, Y. The Role of May Vegetation Greenness on the Southeastern Tibetan Plateau for East Asian Summer Monsoon Prediction. J. Geophys. Res. Atmos. 2011, 116. [Google Scholar] [CrossRef]
  19. Hou, Y.; Zhang, M.; Meng, Z.; Liu, S.; Sun, P.; Yang, T. Assessing the Impact of Forest Change and Climate Variability on Dry Season Runoff by an Improved Single Watershed Approach: A Comparative Study in Two Large Watersheds, China. Forests 2018, 9, 46. [Google Scholar] [CrossRef]
  20. Ma, M.; Yuan, W.; Dong, J.; Zhang, F.; Cai, W.; Li, H. Large-Scale Estimates of Gross Primary Production on the Qinghai-Tibet Plateau Based on Remote Sensing Data. Int. J. Digit. Earth 2017, 11, 1166–1183. [Google Scholar] [CrossRef]
  21. Wang, Z.; Cui, G.; Liu, X.; Zheng, K.; Lu, Z.; Li, H.; Wang, G.; An, Z. Greening of the Qinghai–Tibet Plateau and Its Response to Climate Variations Along Elevation Gradients. Remote Sens. 2021, 13, 3712. [Google Scholar] [CrossRef]
  22. Diao, C.; Liu, Y.; Zhao, L.; Zhuo, G.; Zhang, Y. Regional-Scale Vegetation-Climate Interactions on the Qinghai-Tibet Plateau. Ecol. Inform. 2021, 65, 101413. [Google Scholar] [CrossRef]
  23. Samra, A.; Rasha, M.; El-Barbary, S.M.A. The Use of Remote Sensing Indices for Detecting Environmental Changes: A Case Study of North Sinai, Egypt. Spat. Inf. Res. 2018, 26, 679–689. [Google Scholar] [CrossRef]
  24. Zeng, Y.; Hao, D.; Huete, A.; Dechant, B.; Berry, J.; Chen, J.M.; Joiner, J.; Frankenberg, C.; Bond-Lamberty, B.; Ryu, Y. Optical Vegetation Indices for Monitoring Terrestrial Ecosystems Globally. Nat. Rev. Earth Environ. 2022, 3, 477–493. [Google Scholar] [CrossRef]
  25. Zhang, L.; Shen, M.; Shi, C.; Shi, F.; Jiang, N.; Yang, Z.; Ji, Z. Local Climatic Factors Mediated Impacts of Large-Scale Climate Oscillations on the Growth of Vegetation across the Tibetan Plateau. Front. Environ. Sci. 2021, 9, 597971. [Google Scholar] [CrossRef]
  26. Zhou, D.; Zhang, L.; Hao, L.; Sun, G.; Xiao, J.; Li, X. Large Discrepancies among Remote Sensing Indices for Characterizing Vegetation Growth Dynamics in Nepal. Agric. For. Meteorol. 2023, 339, 109546. [Google Scholar] [CrossRef]
  27. Jiao, K.; Gao, J.; Liu, Z. Precipitation Drives the Ndvi Distribution on the Tibetan Plateau While High Warming Rates May Intensify Its Ecological Droughts. Remote Sens. 2021, 13, 1305. [Google Scholar] [CrossRef]
  28. Wang, C.; Huang, M.; Zhai, P. Change in Drought Conditions and Its Impacts on Vegetation Growth over the Tibetan Plateau. Adv. Clim. Change Res. 2021, 12, 333–341. [Google Scholar] [CrossRef]
  29. Chen, J.; Yan, F.; Lu, Q. Spatiotemporal Variation of Vegetation on the Qinghai–Tibet Plateau and the Influence of Climatic Factors and Human Activities on Vegetation Trend (2000–2019). Remote Sens. 2020, 12, 3150. [Google Scholar] [CrossRef]
  30. Li, L.; Zhang, Y.; Liu, L.; Wu, J.; Wang, Z.; Li, S.; Zhang, H.; Zu, J.; Ding, M.; Paudel, B. Spatiotemporal Patterns of Vegetation Greenness Change and Associated Climatic and Anthropogenic Drivers on the Tibetan Plateau During 2000–2015. Remote Sens. 2018, 10, 1525. [Google Scholar] [CrossRef]
  31. Qiu, B.; Yan, X.; Chen, C.; Tang, Z.; Wu, W.; Xu, W.; Zhao, Z.; Yan, C.; Berry, J.; Huang, W.; et al. The Impact of Indicator Selection on Assessment of Global Greening. GIScience Remote Sens. 2021, 58, 372–385. [Google Scholar] [CrossRef]
  32. Sun, X.; Wang, G.; Huang, M.; Chang, R.; Ran, F. Forest Biomass Carbon Stocks and Variation in Tibet’s Carbon-Dense Forests from 2001 to 2050. Sci. Rep. 2016, 6, 34687. [Google Scholar] [CrossRef] [PubMed]
  33. Liang, E.; Wang, Y.; Piao, S.; Lu, X.; Camarero, J.J.; Zhu, H.; Zhu, L.; Ellison, A.M.; Ciais, P.; Peñuelas, J. Species Interactions Slow Warming-Induced Upward Shifts of Treelines on the Tibetan Plateau. Proc. Natl. Acad. Sci. USA 2016, 113, 4380–4385. [Google Scholar] [CrossRef]
  34. Shi, C.; Schneider, L.; Hu, Y.; Shen, M.; Sun, C.; Xia, J.; Forbes, B.C.; Shi, P.; Zhang, Y.; Ciais, P. Warming-Induced Unprecedented High-Elevation Forest Growth over the Monsoonal Tibetan Plateau. Environ. Res. Lett. 2020, 15, 054011. [Google Scholar] [CrossRef]
  35. Huang, R.; Zhu, H.; Liu, X.; Liang, E.; Grießinger, J.; Wu, G.; Li, X.; Bräuning, A. Does Increasing Intrinsic Water Use Efficiency (Iwue) Stimulate Tree Growth at Natural Alpine Timberline on the Southeastern Tibetan Plateau? Glob. Planet. Chang. 2017, 148, 217–226. [Google Scholar] [CrossRef]
  36. Keyimu, M.; Li, Z.; Zhang, G.; Fan, Z.; Wang, X.; Fu, B. Tree Ring–Based Minimum Temperature Reconstruction in the Central Hengduan Mountains, China. Theor. Appl. Climatol. 2020, 141, 359–370. [Google Scholar] [CrossRef]
  37. Liu, B.; Wang, Y.; Zhu, H.; Liang, E.; Camarero, J.J. Topography and Age Mediate the Growth Responses of Smith Fir to Climate Warming in the Southeastern Tibetan Plateau. Int. J. Biometeorol. 2016, 60, 1577–1587. [Google Scholar] [CrossRef]
  38. Liu, J.; Yang, B.; Qin, C. Tree-Ring Based Annual Precipitation Reconstruction since Ad 1480 in South Central Tibet. Quat. Int. 2011, 236, 75–81. [Google Scholar] [CrossRef]
  39. Shi, C.; Shen, M.; Wu, X.; Cheng, X.; Li, X.; Fan, T.; Li, Z.; Zhang, Y.; Fan, Z.; Shi, F.; et al. Growth Response of Alpine Treeline Forests to a Warmer and Drier Climate on the Southeastern Tibetan Plateau. Agric. For. Meteorol. 2019, 264, 73–79. [Google Scholar] [CrossRef]
  40. Liang, E.; Leuschner, C.; Dulamsuren, C.; Wagner, B.; Hauck, M. Global Warming-Related Tree Growth Decline and Mortality on the North-Eastern Tibetan Plateau. Clim. Chang. 2016, 134, 163–176. [Google Scholar] [CrossRef]
  41. Liang, E.; Lu, X.; Ren, P.; Li, X.; Zhu, L.; Eckstein, D. Annual Increments of Juniper Dwarf Shrubs above the Tree Line on the Central Tibetan Plateau: A Useful Climatic Proxy. Ann. Bot. 2012, 109, 721–728. [Google Scholar] [CrossRef] [PubMed]
  42. Schwab, N.; Kaczka, R.; Janecka, K.; Böhner, J.; Chaudhary, R.; Scholten, T.; Schickhoff, U. Climate Change-Induced Shift of Tree Growth Sensitivity at a Central Himalayan Treeline Ecotone. Forests 2018, 9, 267. [Google Scholar] [CrossRef]
  43. Sigdel, S.R.; Dawadi, B.; Camarero, J.J.; Liang, E.; Leavitt, S.W. Moisture-Limited Tree Growth for a Subtropical Himalayan Conifer Forest in Western Nepal. Forests 2018, 9, 340. [Google Scholar] [CrossRef]
  44. Liang, E.; Wang, Y.; Eckstein, D.; Luo, T. Little Change in the Fir Tree-Line Position on the Southeastern Tibetan Plateau after 200 Years of Warming. New Phytol. 2011, 190, 760–769. [Google Scholar] [CrossRef] [PubMed]
  45. Wang, Y.; Pederson, N.; Ellison, A.M.; Buckley, H.L.; Case, B.S.; Liang, E.; Camarero, J.J. Increased Stem Density and Competition May Diminish the Positive Effects of Warming at Alpine Treeline. Ecology 2016, 97, 1668–1679. [Google Scholar] [CrossRef] [PubMed]
  46. Liu, D.; Wang, T.; Yang, T.; Yan, Z.; Liu, Y.; Zhao, Y.; Piao, S. Deciphering Impacts of Climate Extremes on Tibetan Grasslands in the Last Fifteen Years. Sci. Bull. 2019, 64, 446–454. [Google Scholar] [CrossRef] [PubMed]
  47. Duan, A.M.; Wu, G.X. Role of the Tibetan Plateau Thermal Forcing in the Summer Climate Patterns over Subtropical Asia. Clim. Dyn. 2005, 24, 793–807. [Google Scholar] [CrossRef]
  48. Wu, G.; Duan, A.; Liu, Y.; Mao, J.; Ren, R.; Bao, Q.; He, B.; Liu, B.; Hu, W. Tibetan Plateau Climate Dynamics: Recent Research Progress and Outlook. Natl. Sci. Rev. 2015, 2, 100–116. [Google Scholar] [CrossRef]
  49. Wu, G.; Liu, Y.; Zhang, Q.; Duan, A.; Wang, T.; Wan, R.; Liu, X.; Li, W.; Wang, Z.; Liang, X. The Influence of Mechanical and Thermal Forcing by the Tibetan Plateau on Asian Climate. J. Hydrometeorol. 2007, 8, 770–789. [Google Scholar] [CrossRef]
  50. Hua, W.; Lin, Z.; Guo, D.; Fan, G.; Zhang, Y.; Yang, K.; Hu, Q.; Zhu, L. Simulated Long-Term Vegetation–Climate Feedbacks in the Tibetan Plateau. Asia-Pac. J. Atmos. Sci. 2018, 55, 41–52. [Google Scholar] [CrossRef]
  51. Su, Y.; Guo, Q.; Hu, T.; Guan, H.; Jin, S.; An, S.; Chen, X.; Guo, K.; Hao, Z.; Hu, Y.; et al. An Updated Vegetation Map of China (1:1000000). Sci. Bull. 2020, 65, 1125–1136. [Google Scholar] [CrossRef]
  52. Sulla-Menashe, D.; Gray, J.M.; Abercrombie, S.P.; Friedl, M.A. Hierarchical Mapping of Annual Global Land Cover 2001 to Present: The Modis Collection 6 Land Cover Product. Remote Sens. Environ. 2019, 222, 183–194. [Google Scholar] [CrossRef]
  53. Badgley, G.; Field, C.B.; Berry, J.A. Canopy near-Infrared Reflectance and Terrestrial Photosynthesis. Sci. Adv. 2017, 3, e1602244. [Google Scholar] [CrossRef] [PubMed]
  54. Huete, A.; Didan, K.; Miura, T.; Rodriguez, E.P.; Gao, X.; Ferreira, L.G. Overview of the Radiometric and Biophysical Performance of the Modis Vegetation Indices. Remote Sens. Environ. 2002, 83, 195–213. [Google Scholar] [CrossRef]
  55. Myneni, R.B.; Hoffman, S.; Knyazikhin, Y.; Privette, J.L.; Glassy, J.; Tian, Y.; Wang, Y.; Song, X.; Zhang, Y.; Smith, G.R. Global Products of Vegetation Leaf Area and Fraction Absorbed Par from Year One of Modis Data. Remote Sens. Environ. 2002, 83, 214–231. [Google Scholar] [CrossRef]
  56. Didan, K. MODIS/Terra Vegetation Indices 16-Day L3 Global 500 m SIN Grid V061 [Data set]. NASA EOSDIS Land Processes Distributed Active Archive Center. 2021. Available online: https://lpdaac.usgs.gov/products/mod13a1v061/ (accessed on 12 October 2022).
  57. Myneni, R.; Knyazikhin, Y.; Park, T. MODIS/Terra Leaf Area Index/FPAR 8-Day L4 Global 500 m SIN Grid V061 [Data Set]. NASA EOSDIS Land Processes Distributed Active Archive Center. 2021. Available online: https://lpdaac.usgs.gov/products/mod15a2hv061/ (accessed on 12 October 2022).
  58. Magney, T.S.; Bowling, D.R.; Logan, B.A.; Grossmann, K.; Stutz, J.; Blanken, P.D.; Burns, S.P.; Cheng, R.; Garcia, M.A.; Kӧhler, P.; et al. Mechanistic Evidence for Tracking the Seasonality of Photosynthesis with Solar-Induced Fluorescence. Proc. Natl. Acad. Sci. USA 2019, 116, 11640–11645. [Google Scholar] [CrossRef]
  59. Turner, A.J.; Köhler, P.; Magney, T.S.; Frankenberg, C.; Fung, I.; Cohen, R.C. A Double Peak in the Seasonality of California’s Photosynthesis as Observed from Space. Biogeosciences 2020, 17, 405–422. [Google Scholar] [CrossRef]
  60. Zhang, Y.; Joiner, J.; Alemohammad, S.H.; Zhou, S.; Gentine, P. A Global Spatially Contiguous Solar-Induced Fluorescence (Csif) Dataset Using Neural Networks. Biogeosciences 2018, 15, 5779–5800. [Google Scholar] [CrossRef]
  61. Chen, J.; Ban, Y.; Li, S. Open Access to Earth Land-Cover Map. Nature 2014, 514, 434. [Google Scholar]
  62. Friedl, M.; Sulla-Menashe, D. MODIS/Terra+Aqua Land Cover Type Yearly L3 Global 500 m SIN Grid V061 [Data Set]. NASA EOSDIS Land Processes Distributed Active Archive Center. 2022. Available online: https://lpdaac.usgs.gov/products/mcd12q1v061/ (accessed on 12 October 2022).
  63. Hall, D.K.; Riggs, G.A. MODIS/Terra Snow Cover Daily L3 Global 500 m SIN Grid, Version 61 [Data Set]. Boulder, Colorado USA. NASA National Snow and Ice Data Center Distributed Active Archive Center. 2021. Available online: https://nsidc.org/data/mod10a1/versions/61 (accessed on 15 March 2023).
  64. Riggs, G.; Hall, D. Continuity of Modis and Viirs Snow Cover Extent Data Products for Development of an Earth Science Data Record. Remote Sens. 2020, 12, 3781. [Google Scholar] [CrossRef]
  65. Peng, W.; Kuang, T.; Tao, S. Quantifying Influences of Natural Factors on Vegetation Ndvi Changes Based on Geographical Detector in Sichuan, Western China. J. Clean. Prod. 2019, 233, 353–367. [Google Scholar] [CrossRef]
  66. Jiang, N.; Shen, M.; Ciais, P.; Campioli, M.; Peñuelas, J.; Körner, C.; Cao, R.; Piao, S.; Liu, L.; Wang, S.; et al. Warming Does Not Delay the Start of Autumnal Leaf Coloration but Slows Its Progress Rate. Glob. Ecol. Biogeogr. 2022, 31, 2297–2313. [Google Scholar] [CrossRef]
  67. Kennedy, R.E.; Yang, Z.; Cohen, W.B. Detecting Trends in Forest Disturbance and Recovery Using Yearly Landsat Time Series: 1. Landtrendr—Temporal Segmentation Algorithms. Remote Sens. Environ. 2010, 114, 2897–2910. [Google Scholar] [CrossRef]
  68. Zhang, Y.; Commane, R.; Zhou, S.; Williams, A.P.; Gentine, P. Light Limitation Regulates the Response of Autumn Terrestrial Carbon Uptake to Warming. Nat. Clim. Chang. 2020, 10, 739–743. [Google Scholar] [CrossRef]
  69. Zhang, L.; Shen, M.; Jiang, N.; Lv, J.; Liu, L.; Zhang, L. Spatial Variations in the Response of Spring Onset of Photosynthesis of Evergreen Vegetation to Climate Factors across the Tibetan Plateau: The Roles of Interactions between Temperature, Precipitation, and Solar Radiation. Agric. For. Meteorol. 2023, 335, 109440. [Google Scholar] [CrossRef]
  70. Sen, P.K. Robustness of Some Nonparametric Procedures in Linear Models. Ann. Math. Stat. 1968, 39, 1913–1922. [Google Scholar] [CrossRef]
  71. Theil, H. A Rank-Invariant Method of Linear and Polynomial Regression Analysis. Indag. Math. 1950, 12, 173. [Google Scholar]
  72. Hua, T.; Zhao, W.; Cherubini, F.; Hu, X.; Pereira, P. Effectiveness of Protected Areas Edges on Vegetation Greenness, Cover and Productivity on the Tibetan Plateau, China. Landsc. Urban Plan. 2022, 224, 104421. [Google Scholar] [CrossRef]
  73. Luque, A.; Carrasco, A.; Martín, A.; de las Heras, A. The Impact of Class Imbalance in Classification Performance Metrics Based on the Binary Confusion Matrix. Pattern Recognit. 2019, 91, 216–231. [Google Scholar] [CrossRef]
  74. Towers, P.C.; Strever, A.; Poblete-Echeverría, C. Comparison of Vegetation Indices for Leaf Area Index Estimation in Vertical Shoot Positioned Vine Canopies with and without Grenbiule Hail-Protection Netting. Remote Sens. 2019, 11, 1073. [Google Scholar] [CrossRef]
  75. Chen, S.; Huang, Y.; Wang, G. Detecting Drought-Induced Gpp Spatiotemporal Variabilities with Sun-Induced Chlorophyll Fluorescence During the 2009/2010 Droughts in China. Ecol. Indic. 2021, 121, 107092. [Google Scholar] [CrossRef]
  76. Zhou, Z.; Ding, Y.; Liu, S.; Wang, Y.; Fu, Q.; Shi, H. Estimating the Applicability of Ndvi and Sif to Gross Primary Productivity and Grain-Yield Monitoring in China. Remote Sens. 2022, 14, 3237. [Google Scholar] [CrossRef]
  77. Hao, A.; Duan, H.; Wang, X.; Zhao, G.; You, Q.; Peng, F.; Du, H.; Liu, F.; Li, C.; Lai, C.; et al. Different Response of Alpine Meadow and Alpine Steppe to Climatic and Anthropogenic Disturbance on the Qinghai-Tibetan Plateau. Glob. Ecol. Conserv. 2021, 27, e01512. [Google Scholar] [CrossRef]
  78. Liu, Y.; Li, Z.; Chen, Y.; Kayumba, P.M.; Wang, X.; Liu, C.; Long, Y.; Sun, F. Biophysical Impacts of Vegetation Dynamics Largely Contribute to Climate Mitigation in High Mountain Asia. Agric. For. Meteorol. 2022, 327, 109233. [Google Scholar] [CrossRef]
  79. Hua, T.; Zhao, W.; Cherubini, F.; Hu, X.; Pereira, P. Upgrading Protected Areas Can Improve or Reverse the Decline in Conservation Effectiveness: Evidence from the Tibetan Plateau, China. Sci Total Env. 2023, 873, 162345. [Google Scholar] [CrossRef] [PubMed]
  80. Zhang, B.; Zhang, Y.; Wang, Z.; Ding, M.; Liu, L.; Li, L.; Li, S.; Liu, Q.; Paudel, B.; Zhang, H. Factors Driving Changes in Vegetation in Mt. Qomolangma (Everest): Implications for the Management of Protected Areas. Remote Sens. 2021, 13, 4725. [Google Scholar] [CrossRef]
  81. Cai, H.; Yang, X.; Xu, X. Human-Induced Grassland Degradation/Restoration in the Central Tibetan Plateau: The Effects of Ecological Protection and Restoration Projects. Ecol. Eng. 2015, 83, 112–119. [Google Scholar] [CrossRef]
  82. Anderson, K.; Fawcett, D.; Cugulliere, A.; Benford, S.; Jones, D.; Leng, R. Vegetation Expansion in the Subnival Hindu Kush Himalaya. Glob. Chang. Biol. 2020, 26, 1608–1625. [Google Scholar] [CrossRef]
  83. Maina, F.Z.; Kumar, S.V.; Albergel, C.; Mahanama, S.P. Warming, Increase in Precipitation, and Irrigation Enhance Greening in High Mountain Asia. Commun. Earth Environ. 2022, 3, 43. [Google Scholar] [CrossRef]
  84. Wang, Y.; Li, D.; Ren, P.; Sigdel, S.R.; Camarero, J.J. Heterogeneous Responses of Alpine Treelines to Climate Warming across the Tibetan Plateau. Forests 2022, 13, 788. [Google Scholar] [CrossRef]
  85. Wenqi, S.; Yuhao, F.; Zhiheng, W. Ecological Restoration Programs Dominate Vegetation Greening in China. Sci. Total Environ. 2022, 848, 157729. [Google Scholar]
  86. Zhang, Z.; Liu, Y.-F.; Cui, Z.; Huang, Z.; Liu, Y.; Leite, P.A.M.; Zhao, J.; Wu, G.-L. Shrub Encroachment Impaired the Structure and Functioning of Alpine Meadow Communities on the Qinghai–Tibetan Plateau. Land Degrad. Dev. 2022, 33, 2454–2463. [Google Scholar] [CrossRef]
  87. Sitch, S.; Friedlingstein, P.; Gruber, N.; Jones, S.D.; Murray-Tortarolo, G.; Ahlström, A.; Doney, S.C.; Graven, H.; Heinze, C.; Huntingford, C.; et al. Recent Trends and Drivers of Regional Sources and Sinks of Carbon Dioxide. Biogeosciences 2015, 12, 653–679. [Google Scholar] [CrossRef]
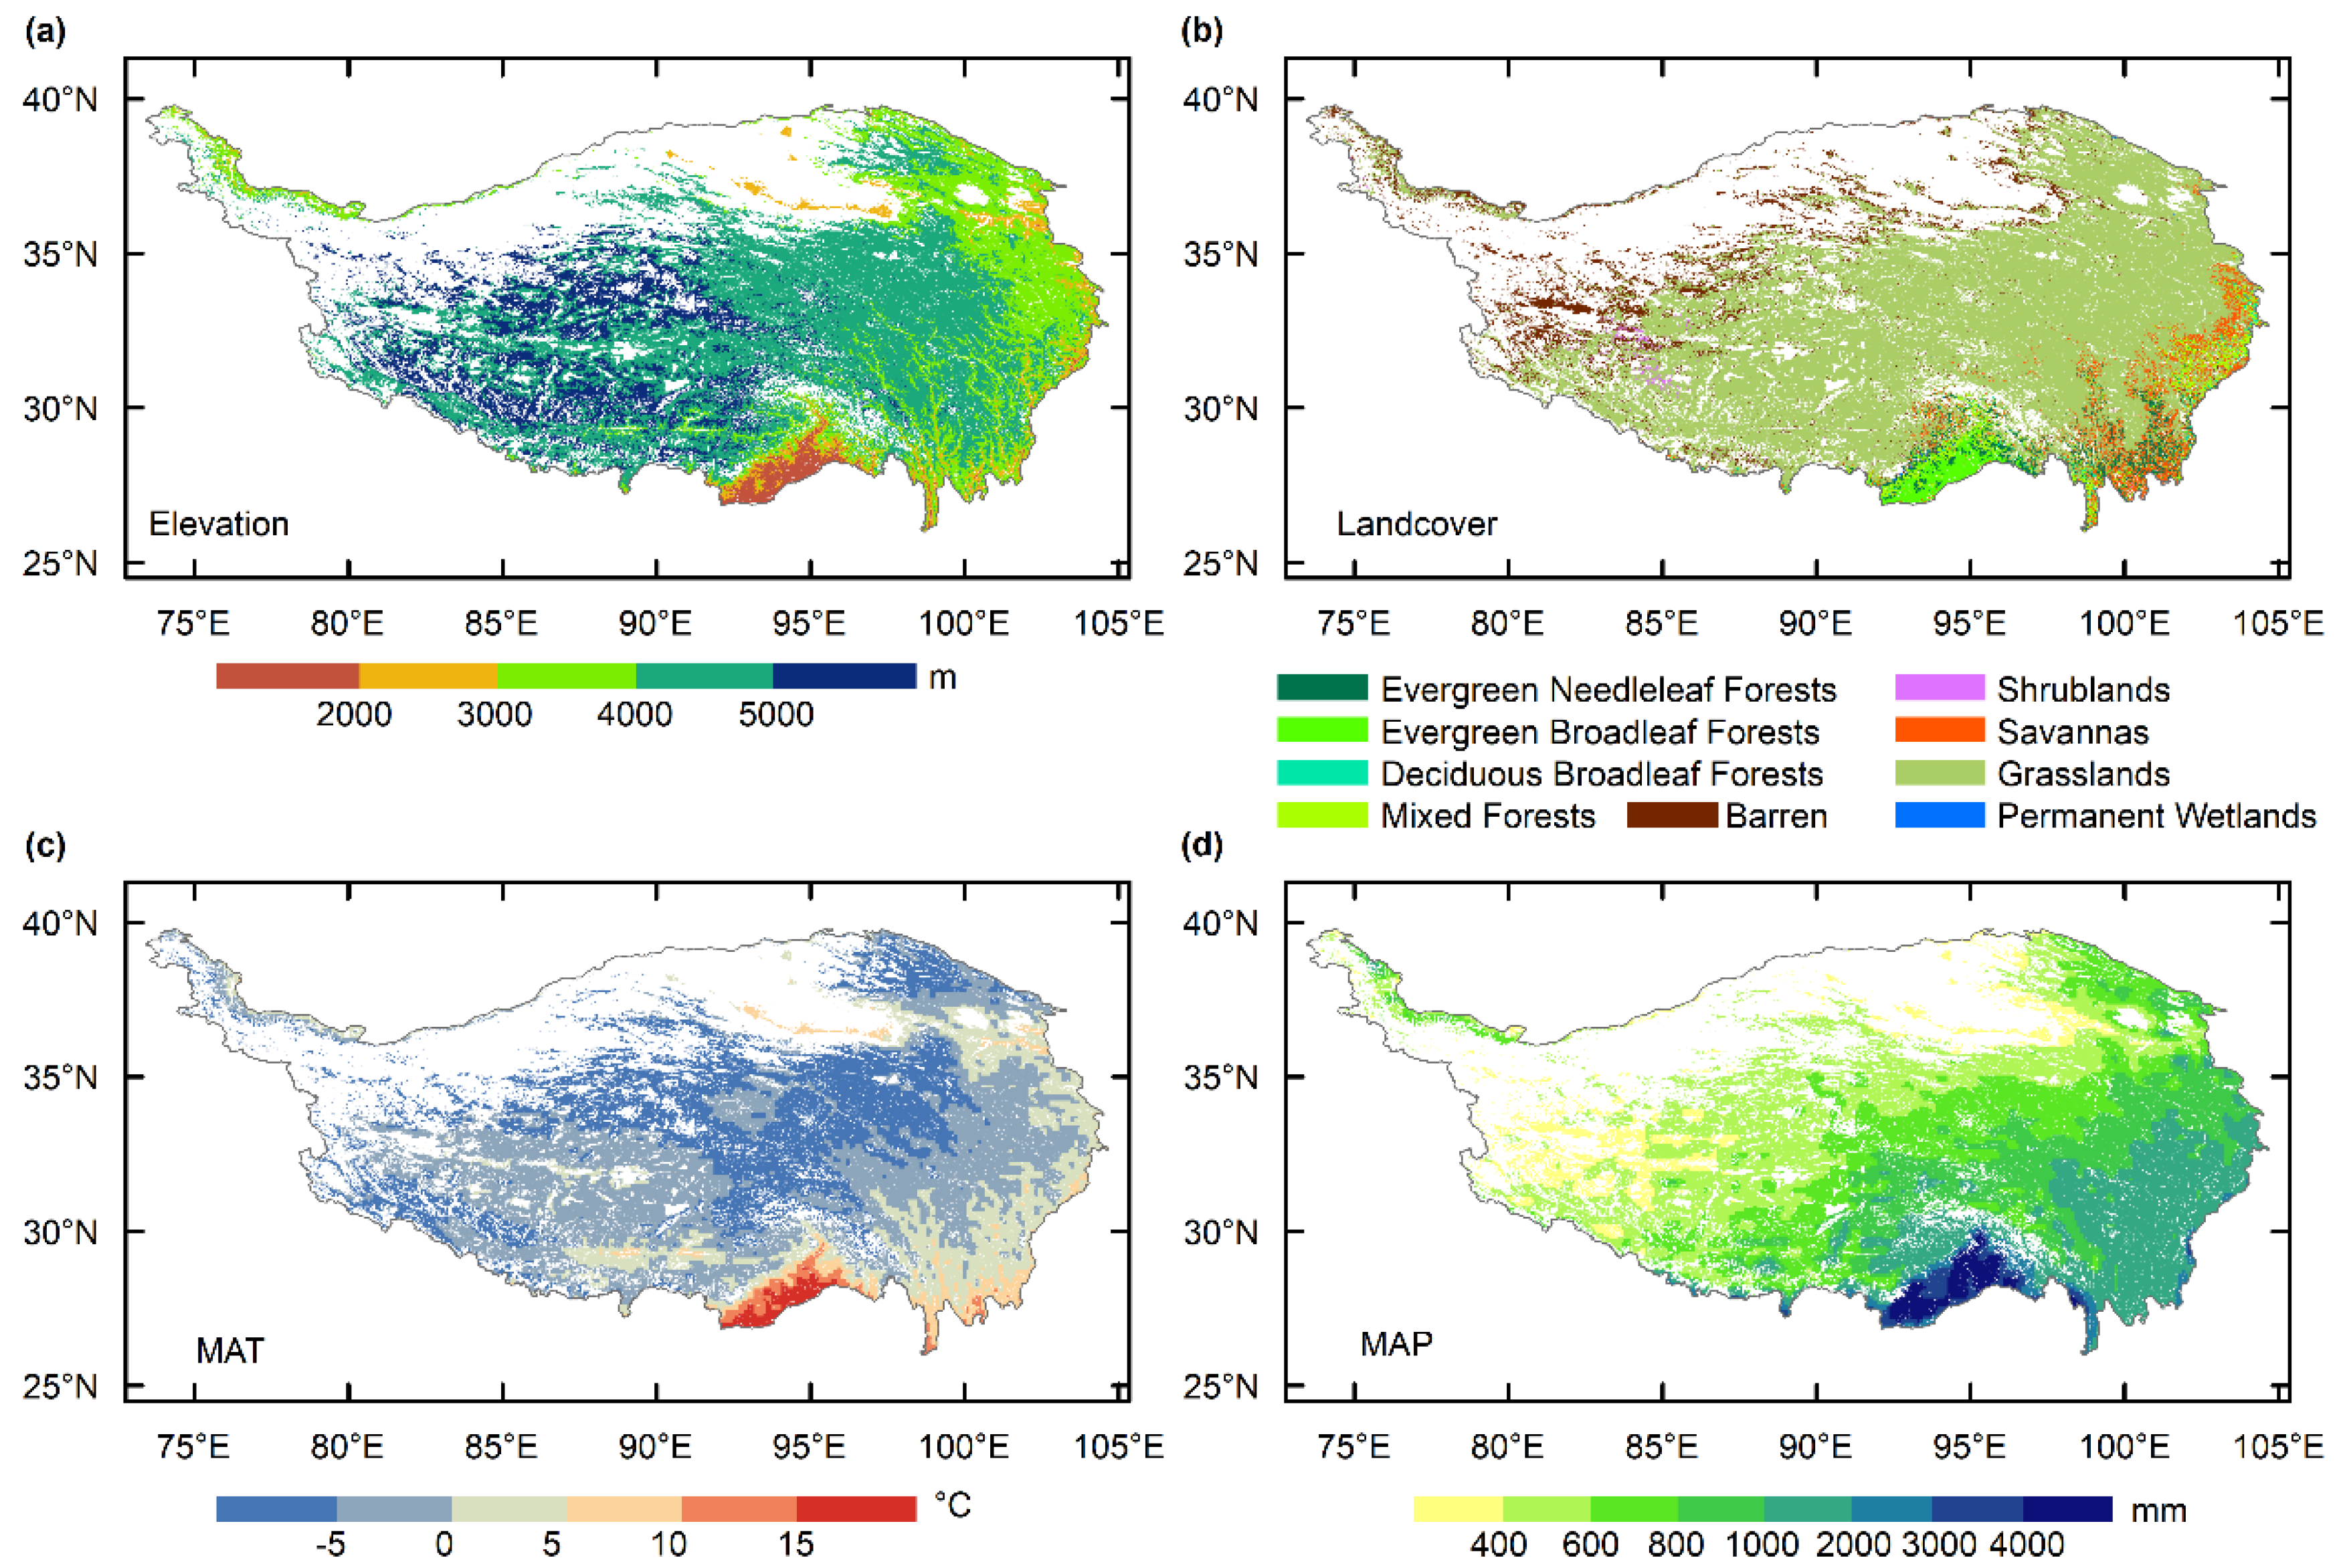
Figure 1. The spatial pattern of elevation, derived from Shuttle Radar Topography Mission version 3 (a), the landcover from MCD12Q1 version 6.1 based on the International Geosphere-Biosphere Program classification scheme of 2010 (b), the mean annual temperature (c), and the mean annual precipitation from the ERA5-Land dataset during 2000–2021 (d) on the Tibetan Plateau.
Remotesensing 15 05697 g001
Figure 2. Study framework.
Remotesensing 15 05697 g002
Figure 3. A confusion matrix for the trend of vegetation greenness is based on two vegetation indexes. The ‘a’ represents the pixels proportion of the trend of vegetation index1 belonging to the class (significantly positive) and the trend of vegetation index2 belonging to the class (significantly positive) in total pixels. The ‘b–i’ is calculated in the same way.
Remotesensing 15 05697 g003
Figure 4. Spatial variation of the trend of growing season (May–September) NDVI, EVI, NIRv, and LAI by using the ordinary least-squares regression, respectively (ad). The bottom-left inset in each map displays the percent of pixels in each trend of vegetation greenness interval with the corresponding interval values depicted by the color in the legend on the bottom. Temporal trend of growing seasons NDVI, EVI, NIRv, and LAI, respectively (eh). NDVIGS, EVIGS, NIRvGS, and LAIGS are the abbreviations of NDVI, EVI, NIRv, and LAI in the growing season.
Remotesensing 15 05697 g004
Figure 5. Spatial variation of the trend of winter (December–February) NDVI, EVI, NIRv, and LAI by using the ordinary least-squares regression, respectively (ad). The bottom-left inset in each map displays the percent of pixels in each trend of vegetation greenness interval with the corresponding interval values depicted by the color in the legend on the bottom. Temporal trend of growing seasons NDVI, EVI, NIRv, and LAI, respectively (eh). NDVIWinter, EVIWinter, NIRvWinter, and LAIWinter are the abbreviations of NDVI, EVI, NIRv, and LAI in winter.
Remotesensing 15 05697 g005
Figure 6. Consistency of trend of vegetation greenness in the growing season (a) and winter (b) on the Tibetan Plateau; (c) the percent of pixels of the trend of growing season vegetation greenness with significantly positive and negative in pixels covered by vegetation in the growing season on the Tibetan Plateau; (d) the percent of the trend of winter vegetation greenness pixels with significantly positive and negative in pixels covered by evergreen vegetation on the Tibetan Plateau.
Remotesensing 15 05697 g006
Figure 7. (a) The confusion matrix between the trend of growing season EVI (EVIGS) and NDVI (NDVIGS); (b) the confusion matrix between the trend of growing season NIRv (NIRvGS) and NDVIGS; (c) the confusion matrix between the trend of growing season LAI (LAIGS) and NDVIGS; (d) the confusion matrix between the trend of growing season LAI (LAIGS) and EVIGS; (e) the confusion matrix between the trend of LAIGS and EVIGS; (f) the confusion matrix between the trend of LAIGS and NIRvGS.
Remotesensing 15 05697 g007
Figure 8. (a) The confusion matrix between the trend of winter EVI (EVIWinter) and NDVI (NDVIWinter); (b) the confusion matrix between the trend of winter NIRv (NIRvWinter) and NDVIWinter; (c) the confusion matrix between the trend of winter LAI (LAIWinter) and NDVIWinter; (d) the confusion matrix between the trend of winter LAI (LAIWinter) and EVIWinter; (e) the confusion matrix between the trend of LAIWinter and EVIWinter; (f) the confusion matrix between the trend of LAIWinter and NIRvWinter.
Remotesensing 15 05697 g008
Table 1. The probability of vegetation’s greenness changing.
Trend of NDVITrend of EVITrend of NIRvTrend of LAIProbability of Vegetation Greenness Change
Enhanced, very likely
Enhanced likely
Enhanced probably
Degraded very likely
Degraded likely
Degraded probably
None or only one vegetation index showed a significant changeUncertainty
Note: significantly positive (↑), significantly negative (↓) and no significant change (–).
Table 2. The accuracy between the trends of different vegetation greenness indexes in the growing season.
AccuracyNDVIGSEVIGSNIRvGSLAIGS
NDVIGS-
EVIGS0.86-
NIRvGS0.870.95-
LAIGS0.790.780.79-
Table 3. The accuracy between the trends of different vegetation greennesses in winter.
AccuracyNDVIWinterEVIWinterNIRvWinterLAIWinter
NDVIWinter-
EVIWinter0.65-
NIRvWinter0.680.95-
LAIWinter0.640.730.72-
Disclaimer/Publisher’s Note: The statements, opinions and data contained in all publications are solely those of the individual author(s) and contributor(s) and not of MDPI and/or the editor(s). MDPI and/or the editor(s) disclaim responsibility for any injury to people or property resulting from any ideas, methods, instructions or products referred to in the content.