Article

Spatial Heterogeneity of Combined Factors Affecting Vegetation Greenness Change in the Yangtze River Economic Belt from 2000 to 2020

1
School of Geography and Information Engineering, China University of Geosciences, Wuhan 430079, China
2
Hunan Remote Sensing Geological Survey and Monitoring Institute, Changsha 410000, China
*
Author to whom correspondence should be addressed.
Remote Sens. 2023, 15(24), 5693; https://doi.org/10.3390/rs15245693
Submission received: 19 November 2023 / Revised: 1 December 2023 / Accepted: 4 December 2023 / Published: 12 December 2023
(This article belongs to the Special Issue Remote Sensing for Soil Moisture and Vegetation Parameters Retrieval)

Abstract

:
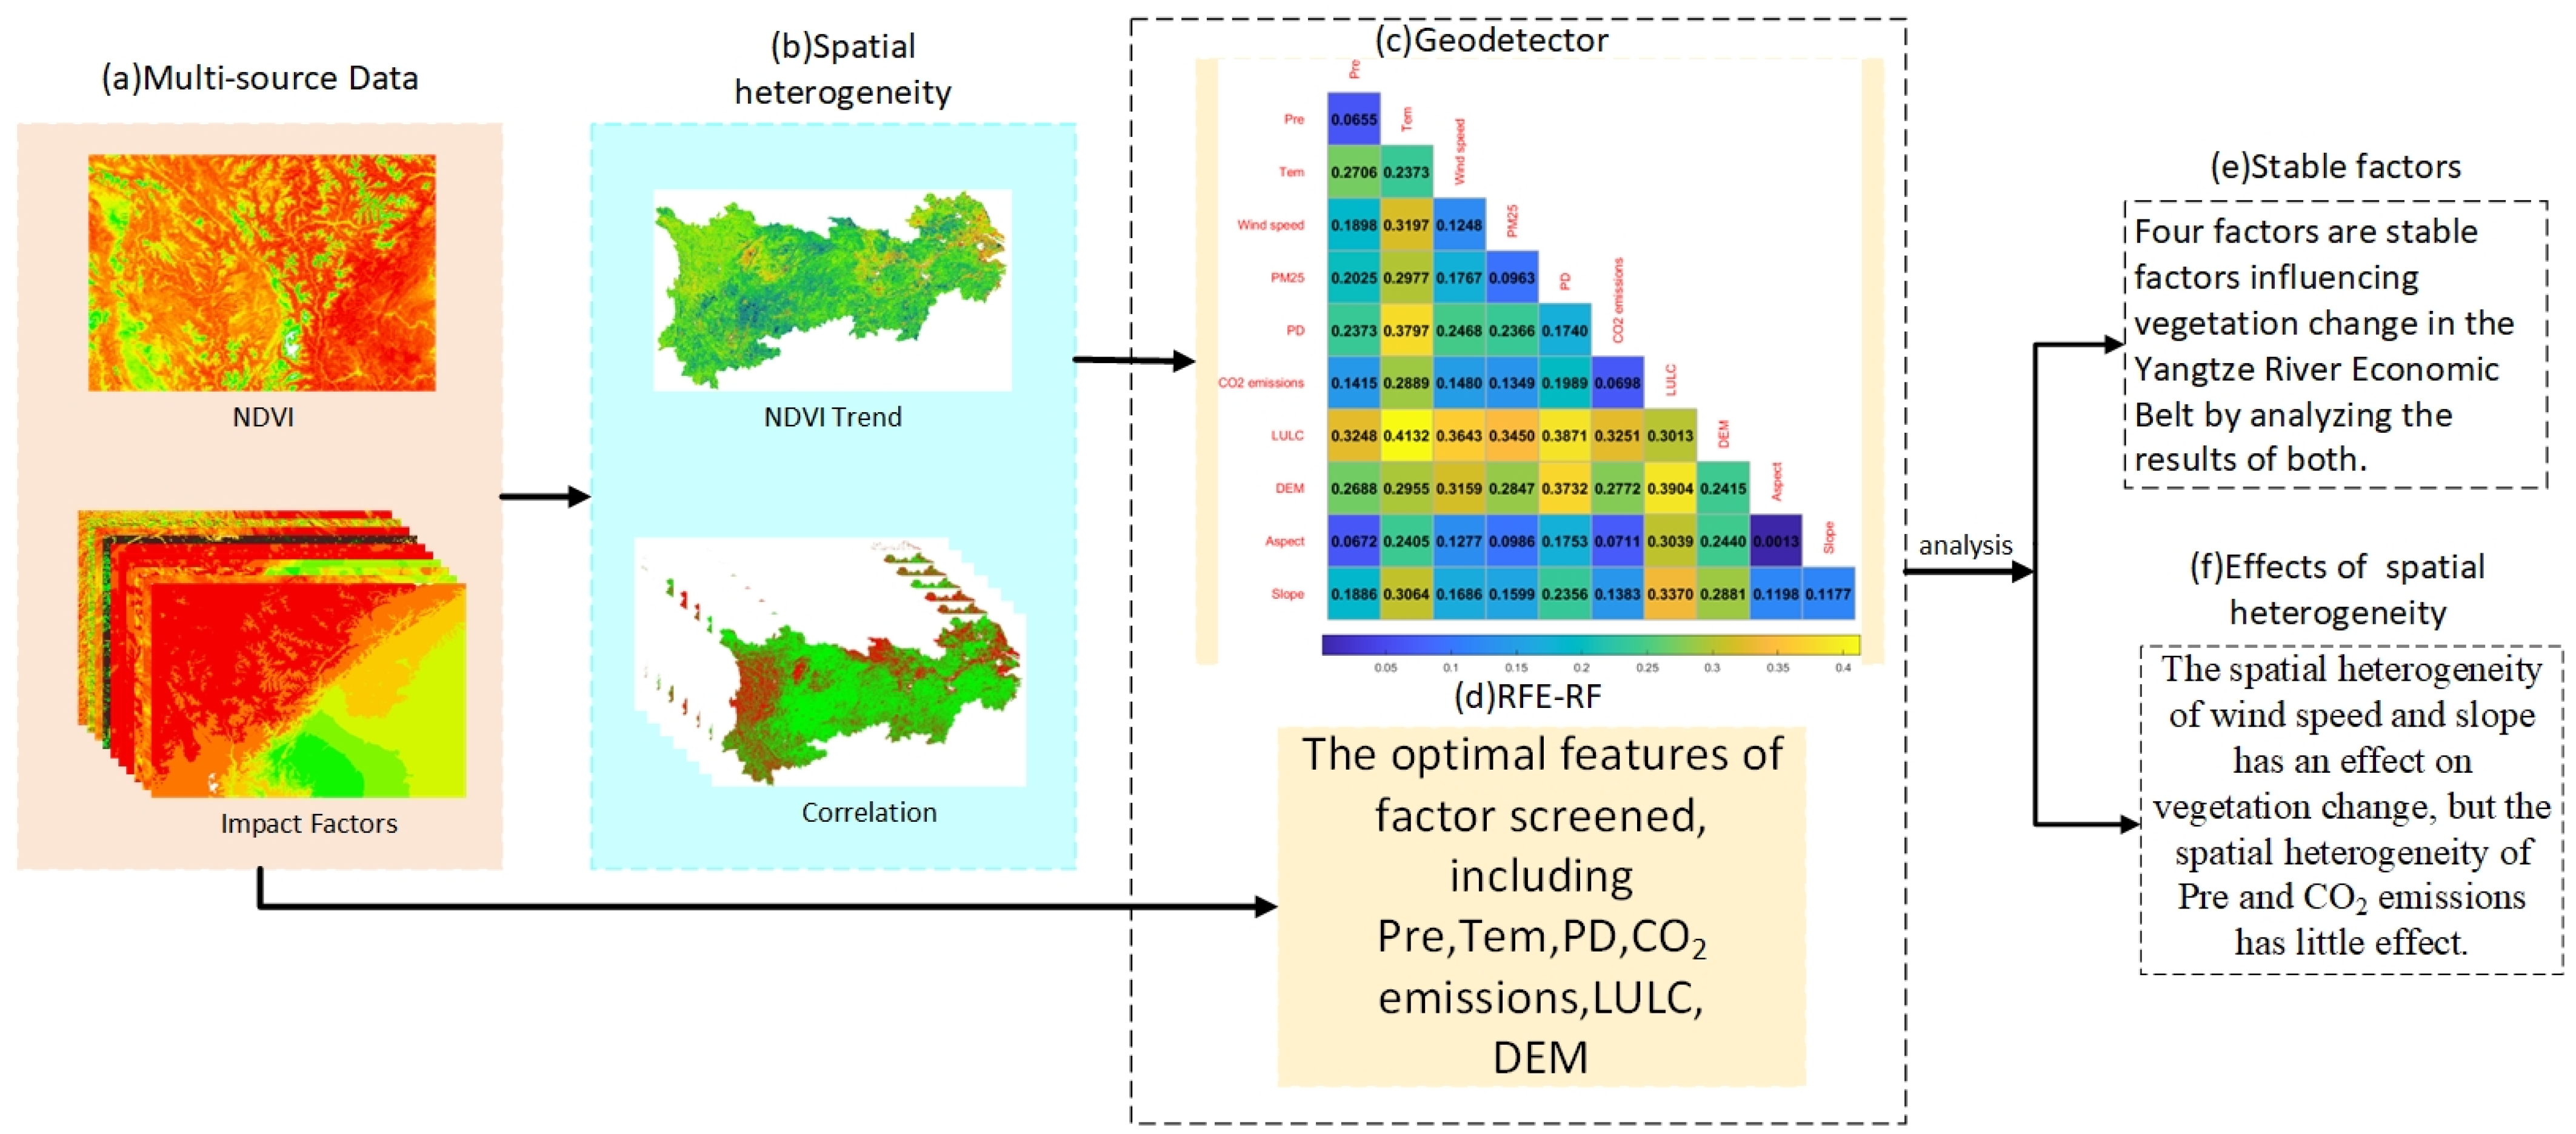
Vegetation greenness change is the result of the combination of natural and anthropogenic factors. Understanding how these factors individually and collectively affect vegetation dynamics and whether their spatial heterogeneity has any effect on vegetation greenness change is the crucial investigation area. Previous studies revealed the distinct characteristics of spatial and temporal heterogeneity in the impact factors influencing vegetation greenness change across various regions, often assuming a linear contribution mechanism between vegetation greenness change and these drivers. However, such a simplistic assumption fails to adequately capture the real-world dynamics of vegetation greenness change. Thus, this study firstly used geographical detector (Geodetector) to quantitatively measure the contribution of each factor to vegetation greenness change considering spatial heterogeneity in the Yangtze River Economic Belt (YREB) during the growing season from 2000 to 2020, then selecting significant factors from numerous drivers with the recursive feature elimination algorithm combined with a random forest model (RFE-RF), which is able to reduce redundant features in the data and prevent overfitting. Finally, four stable impact factors and the spatial heterogeneity of some factors contributing to vegetation greenness change were identified. The results show that approximately 83% of the regional vegetation has shown an overall increasing trend, while areas undergoing rapid development predominantly experienced a decline in greenness. Single factor screened by Geodetector with the explanatory power greater than 10% for vegetation greenness change included temperature (Tem), population density (PD), the land-use/land-cover (LULC), DEM, wind speed, and slope. The RFE-RF method identified precipitation (Pre) and CO2 emissions as additional influential factors for vegetation greenness change, in addition to the first four factors mentioned previously. These findings suggest that the four stable factors consistently influence vegetation greenness change. Combined with the principles of the algorithms and the above results, it was found that the spatial heterogeneity of wind speed and slope has an effect on vegetation greenness change, whereas the spatial heterogeneity of Pre and CO2 emissions has minimal effect.

Graphical Abstract

1. Introduction

Over the past few years, global vegetation has undergone noticeable changes attributed to a combination of factors, including climate change and human activities [1,2,3]. Vegetation greenness change serves as an indicator of environmental transformations, the evolution of ecological functions, and the influence of human activities [4]. Therefore, conducting research on vegetation greenness change holds great significance for promoting the sustainable development of terrestrial ecosystems [5].
There are numerous factors contributing to vegetation greenness change, such as precipitation (Pre), temperature (Tem), and human-based cultivation, which can be categorized into two distinct groups: natural and anthropogenic factors. Vegetation status is usually correlated to the natural climate change, which usually shows temporally and spatially heterogeneous in disparate regions. In the Red River Basin, Gu et al. [6] found that the response of vegetation to Pre was higher than that of Tem by using the methods of linear regression and partial correlation analysis. The study of Lamchin et al. [7] in Asia discovered that Tem was the main climatic factor affecting vegetation greenness, whereas Zhang et al. [8] revealed that the effects of Tem and Pre on vegetation change represented with NDVI had different characters under disparate seasons and growth periods in the Koshi River Basin of middle Himalayas from 1982 to 2011. Except for the growth season of vegetation, vegetation type might another variable for the correlation between vegetation greenness change and climatic factors. Pang et al. [9] researched vegetation change on the Tibetan Plateau and found that the response of NDVI to Pre was complex, with seasonal and spatial differences in the effects of Tem and Pre on various vegetation types. These studies were highly consistent with some scholars’ findings, like Mao et al. [10], who studied the relationship between NDVI and the monthly mean Tem and Pre in northeast China from 1982–2009, and revealed that NDVI was more strongly correlated with Tem than Pre at most stations and for all vegetation types. In fact, some climatic factors such as wind speed and sunshine hours also made a difference on vegetation greenness change, while not being considered in the above studies. Li et al. [11] found that vegetation change was influenced by the main climatic factors such as Pre, Tem, sunshine hours, and wind speed in environmentally sensitive and vulnerable areas in China. Among these factors, Pre and Tem had a promoting effect on vegetation, while wind speed had an inhibitory effect. Yu et al. [12] found that PM2.5 had a negative effect on vegetation photosynthesis, which subsequently affected vegetation growth. Other natural factors such as DEM, slope, and aspect also exert an impact on vegetation, Liu et al. [13] observed that vegetation coverage in the upper reaches of the Ganjiang River Basin in China continued to improve with the increase in DEM and slope, but there was no significant difference in the distribution of vegetation cover in terms of different aspects.
Moreover, with the rapid growth of global population and the diversity of human activities, collectively referred to as anthropogenic influences, these have become non-negligible factors affecting the ecological environment and even shaping the trend of vegetation greenness change. For example, the over-cultivation, overgrazing, and urban expansion have led to a decrease in vegetation coverage [14,15]. Moreover, many policies such as afforestation and closing hills for afforestation may increase vegetation coverage greatly [16,17]. Population density (PD), anthropogenic CO2 emissions, and land-use/land-cover (LULC) are additional factors that significantly influence vegetation dynamics. Changes in PD have been accompanied by changes in population structure and size [18], and anthropogenically increased CO2 concentrations may directly affect vegetation distribution by influencing photosynthesis and water use efficiency [19], and LULC affects vegetation through changes in land use [20].
The combined effect of both natural and human factors plays a significant role in driving vegetation greenness change. Understanding the contribution mechanisms of both natural and human factors is indeed valuable and worthy of study. In recent years, numerous scholars have conducted research to separate and quantify the relative influence of natural and anthropogenic factors on vegetation dynamics. For example, Yang et al. [21] quantified the effects of natural factors and human activities on vegetation change in Jiangsu Province by using structural equation modeling, and their results revealed that human activities had the largest effect on NDVI followed by the natural environment, which both showed negative effects on vegetation, while being the least positive factor was climate change. Similarly, Zhang et al. [22] revealed that vegetation dynamics in most areas of the middle reaches of the Jinsha River basin were influenced by anthropogenic factors through conducting a multiple linear regression method, which was also proved by the study of Ren et al. [23] in the Yellow River Basin. However, Li et al. [11] discovered that the impression of human activities and climate change on vegetation change exhibited obvious spatial and temporal heterogeneity in environmentally sensitive and vulnerable areas in China by using residual trend analysis.
The above studies used diverse ways to investigate the response of vegetation greenness change to influencing factors in different regions, which found that the influence of natural and anthropogenic factors on vegetation greenness change had spatial and temporal heterogeneity, but many studies obtained inconsistent findings. Therefore, the contribution mechanism of impact factors to vegetation greenness change in disparate regions are different, and whether the spatial heterogeneity of influencing factors has an impact on vegetation cover is a question worth studying.
Additionally, previous studies have often assumed a linear relationship between vegetation greenness change and numerous drivers. However, it is increasingly recognized that such a simplistic assumption does not adequately capture the complexity and nuances of the real-world dynamics of vegetation change [24]. Thus, some more comprehensive and nuanced approaches are necessary to understand the true dynamics of vegetation greenness change, including the statistical methods like a geographic detector model (Geodetector) [25] and machine learning methods like random forest (RF). Geodetector is a spatial statistical tool which can overcome the limitations of traditional statistical methods that are unable to deal with categorical variables and quantitatively capture the influences of natural and anthropogenic factors on vegetation greenness change by detecting spatial heterogeneity [25]. For example, Huo et al. [26] found that anthropogenic factors had a lower impact on vegetation change than natural factors in the northwestern Yunnan Plateau of China. And Zhu et al. [27] discovered that both natural and anthropogenic factors played significant roles in driving changes of NDVI in the middle reaches of the Heihe River Basin. Machine learning methods, such as multiple linear regression, RF, and support vector regression (SVR), have also been widely employed to investigate the sensitivity of vegetation greenness change to influencing factors. Researchers have utilized machine learning techniques to assess the sensitivity of vegetation, specifically the normalized difference vegetation index (NDVI), to climate change in different regions. Cui et al. [28] used RF to show that NDVI in the Yarlung Zangbo River basin exhibited higher sensitivity to Tem compared to Pre. And Bao et al. [29] found that the susceptivity of NDVI to climate factors was temporally and spatially heterogeneous in the Yellow-Huai-Hai River Basin by employing various machine learning models, including SVR, RF, linear regression, and polynomial regression. Some studies also considered the influence of human activities which contributed more to NDVI than climate factors in China [30]. Furthermore, Zhou et al. [31] used recursive feature elimination (RFE) based on RF (RFE-RF) to reduce redundant features in the data and prevent overfitting and select factors, which have significant influence on landslides. Therefore, in this study, we combined the advantages of Geodetector and RFE-RF to optimize vegetation impact factors and reduce data redundancy.
The Yangtze River Economic Belt (YREB) is a major national strategic development region in China, experiencing rapid urbanization and high-intensity development that has had certain environmental impacts. Existing studies on vegetation greenness change in the YREB have largely focused on the spatial distribution and changes in vegetation cover at regional scales, such as watershed, province, and protected areas, and the analysis of the driving force is also mostly analyzed from a single perspective, such as climate or human activities [32,33,34]. This paper used two methods, Geodetector and RFE-RF, to study the combined effects of natural and anthropogenic factors on vegetation greenness change in the whole YREB.
Above all, this paper focused on studying the impact factors to vegetation greenness change in the growing season (June–October) of the YREB from 2000 to 2020 and exploring whether spatial heterogeneity of these factors has an impact on vegetation greenness change. (1) Firstly, we discretized the impact factors in the YREB and used Geodetector to measure the contribution of each factor to vegetation greenness change considering spatial heterogeneity; (2) then, we selected the factors that have a significant impact on vegetation greenness change based on RFE-RF method; (3) and finally, based on the results of Geodetector and RFE-RF algorithms, certain stable impact factors and the effects of spatial heterogeneity for certain factors on vegetation greenness change were identified. This will provide valuable insights and references for formulating relevant policies and strategies in the YREB.

2. Materials and Methods

2.1. Study Area

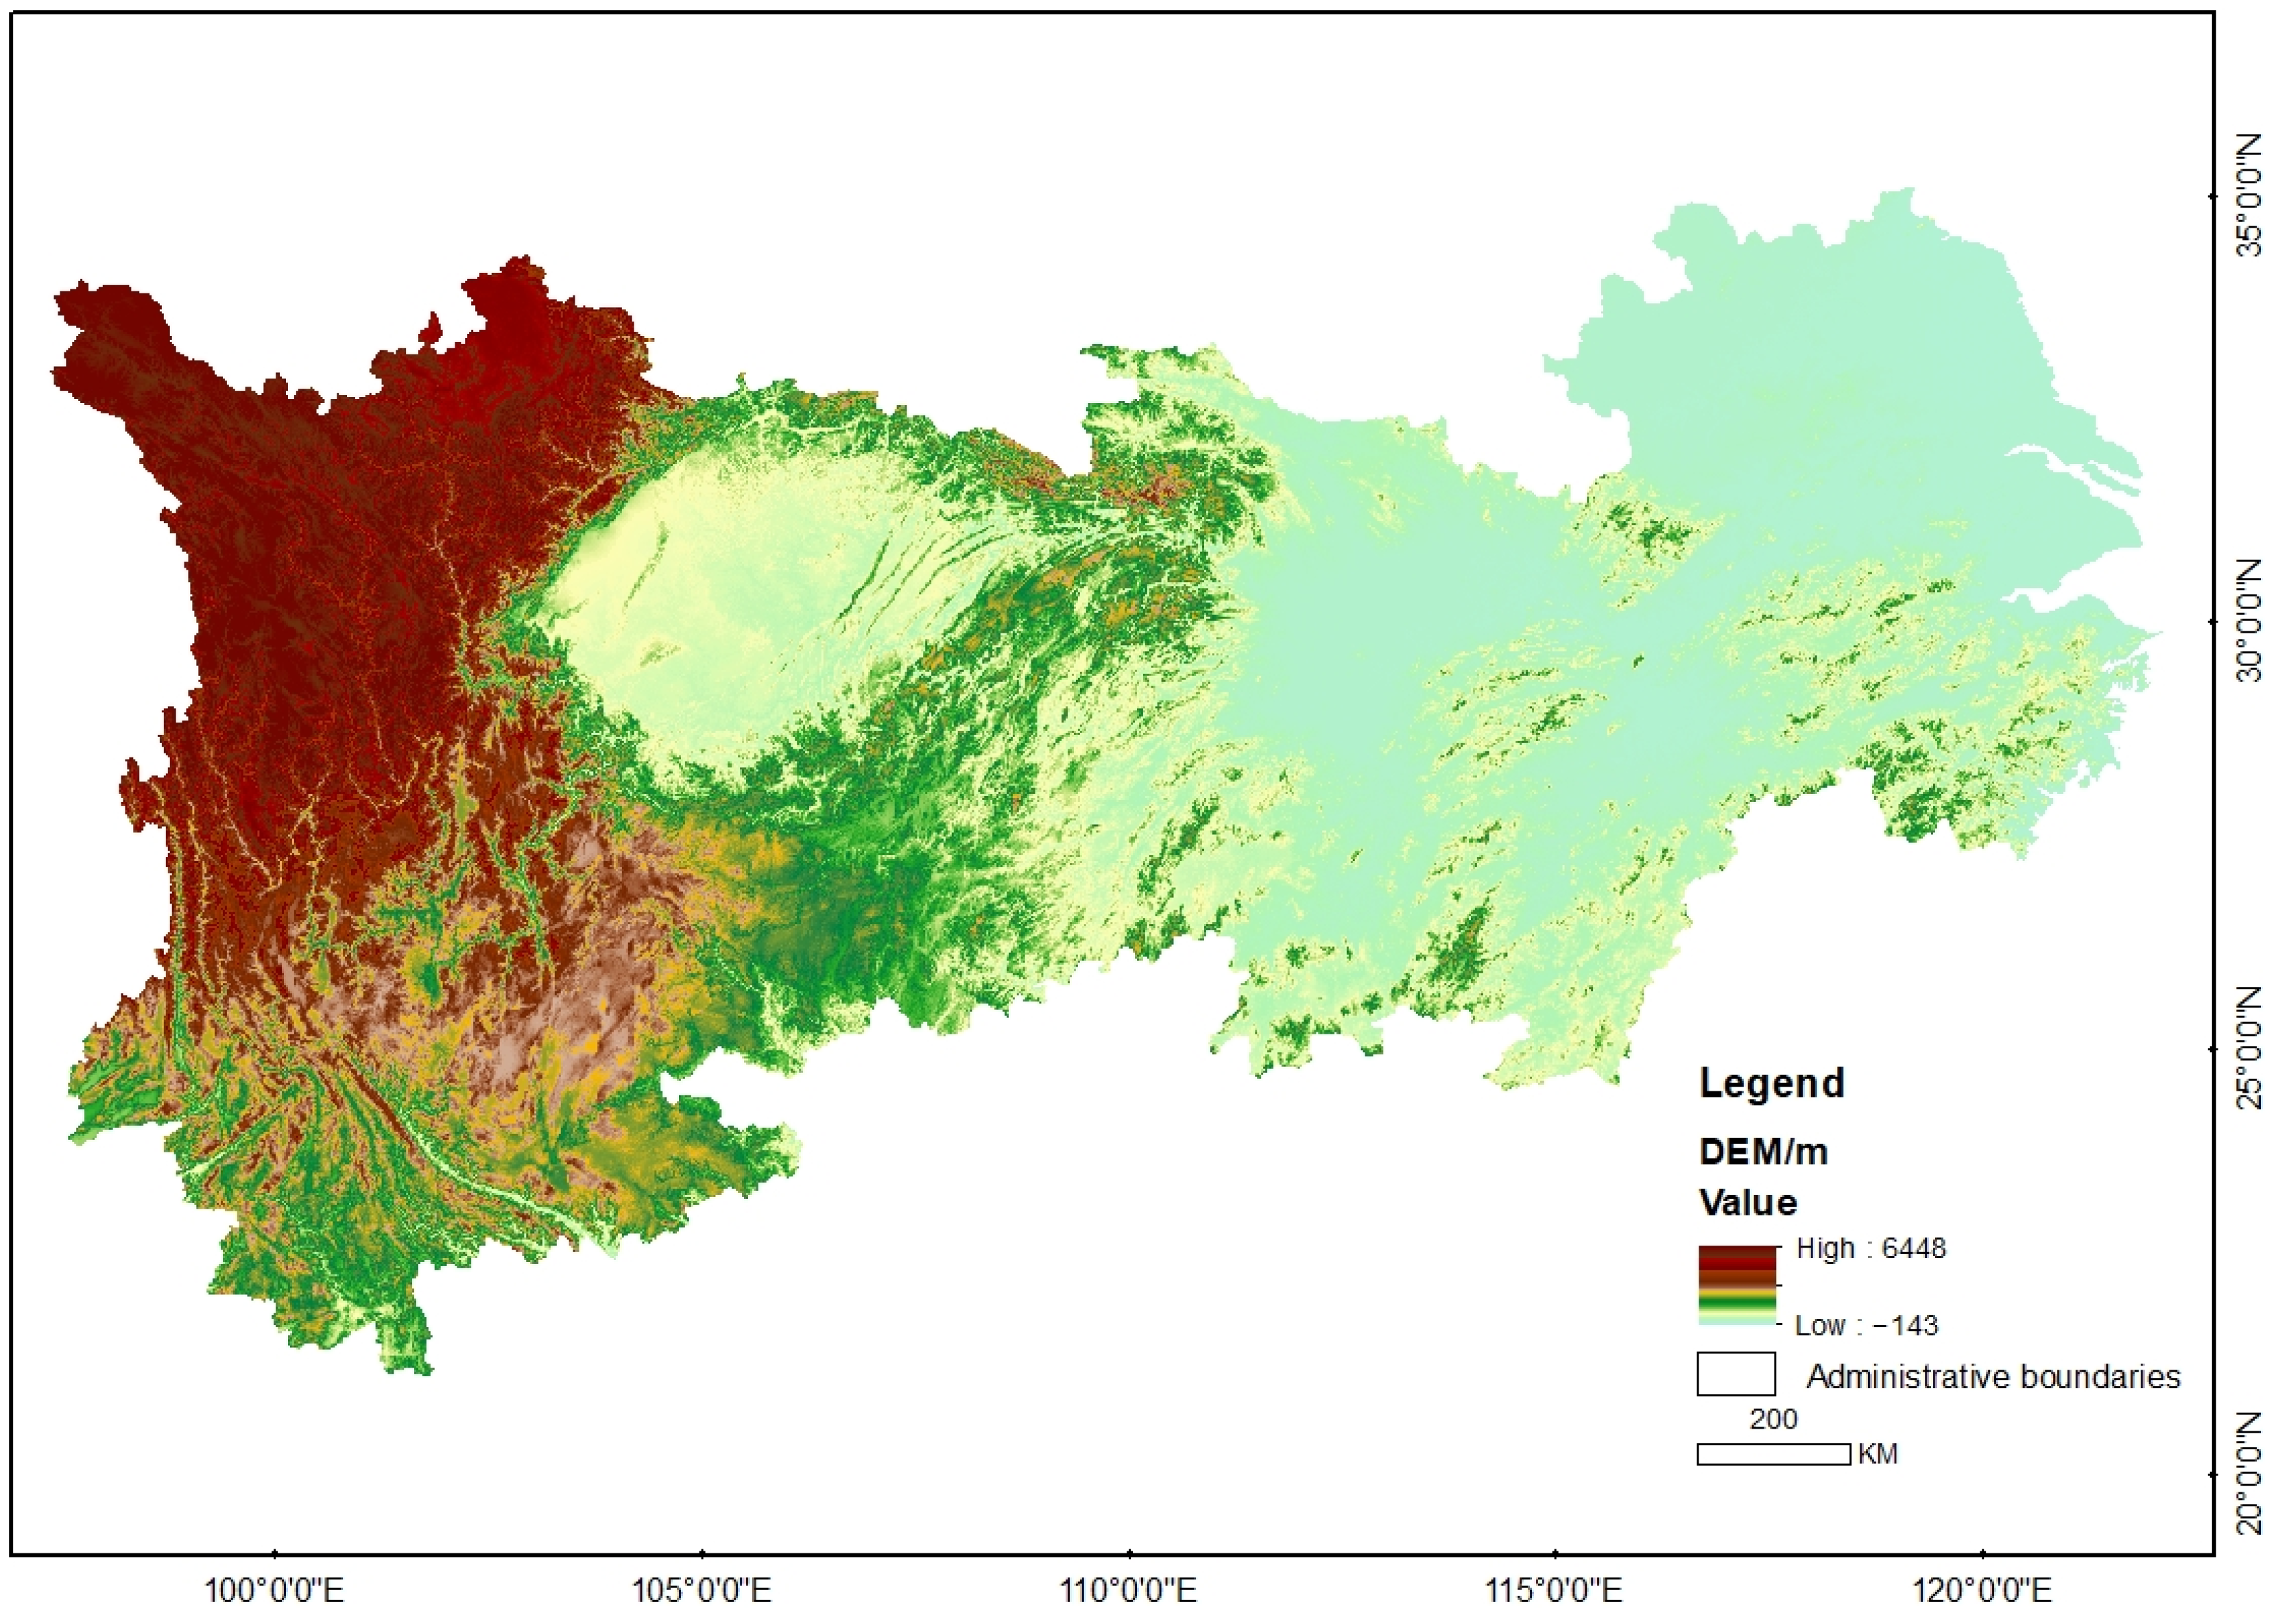
The YREB is an economically developed region, covering 11 provinces and cities in China (Figure 1), with an area of approximately 2 million square kilometers, accounting for 21.4% of the national land area. It straddles three regions of China, including the east, center, and west, with the high west and low east forming complex landforms, and a wide range of ground elevations (−143 to 6448 m, Figure 2). Most of the regions are dominated by plateaus, mountains, basins, and hills. The climate is mostly subtropical monsoon climate, with some areas falling under the tropical monsoon climate category. The averages of Tem, annual Pre, wind speed, and PM2.5 in the growing season from 2000 to 2020 are 20.5 °C, 709.5 mm, 0.9 m/s, and 31.2 μg/m3, respectively. The vegetation types are mainly coniferous forests, scrub, and cultivated vegetation; there are many river systems and lakes in the region, and they interact with each other. The number of national key ecological function areas in the region is huge, and national nature reserves account for 67.0% of the area.

2.2. Data

This paper used Google Earth Engine (GEE) to acquire the NDVI data, which were subsequently processed with the Savitsky–Golay (S-G) filtering method [35]. The NDVI values equal to or greater than 0.1 (June to October for each year from 2000 to 2020) was used to represent the vegetation cover change data from the growing seasons from 2000 to 2020 [36], which were obtained from MOD13A2 with a spatial and temporal resolution of 1 km and 16 days, respectively. Other data include monthly average Tem and Pre [37], wind speed [38], monthly PM2.5 [39], yearly PD and monthly CO2 emissions [40], land-use/land-cover (LULC) [41], DEM, slope, and aspect. Table 1 shows the above data types and their spatial resolution, units, and sources. To analyze the yearly data in a spatial resolution of 1 km, the monthly data were used in ArcGIS to calculate yearly data, including total annual Pre for the growing season, average yearly Tem, wind speed, PM2.5, and CO2 emissions. Slope and aspect data were calculated using DEM in ArcGIS, by which their high spatial resolution can be resampled to meet 1 km using the nearest neighbor method.

2.3. Methods

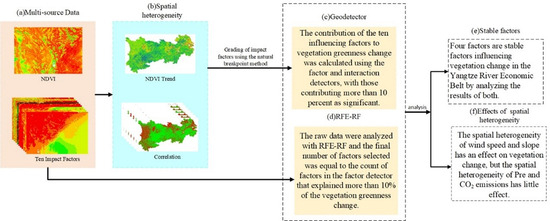
The research process of this paper is as follows (Figure 3). Firstly, the trend of NDVI changes was analyzed and the selected influence factors were graded using the natural breakpoint method. Secondly, Geodetector, and RFE-RF were used to calculate the graded and ungraded factors, respectively, and the stable factors affecting the NDVI changes of vegetation were obtained from the results of the two calculations. Finally, the effects of spatial heterogeneity of some factors were analyzed according to the differences in the principles of the two methods.
The Theil–Sen median method known as Sen trend analysis is a reliable non-parametric statistical method for trend calculation, which was proposed by Theil (1950) [42] and then extended by Sen et al. (1968) [43] during their analyses of the long time series variations. In this study, the trend analysis of NDVI and influencing factors of YREB from 2000 to 2020 was calculated as shown in Formula (1), and Pearson’s correlation coefficients for NDVI and impact factors were calculated using Equation (2).
β = m e d i a n N D V I j N D V I i j i
where β is the m e d i a n of N D V I change during the i th to j th years and N D V I i and N D V I j are the N D V I values in the years of i and j (1 < i < j < n), respectively. With a β value greater than 0, the N D V I sequence exhibits an increasing trend, and if β < 0, the trend of N D V I sequence is downward.
ρ X , Y = c o v X , Y σ X σ Y
where c o v is the covariance, σ represents the standard deviation, and X and Y represent NDVI and impact factor in this study, respectively.

2.3.1. Factor Selection and Grading

(1) Factor Selection: Climate variation and human activities have a large influence on vegetation greenness change [26,44], which is simultaneously sensitive to complex topography [11,21]. Based on the results of Li et al. [11] and Yu et al. [12], this paper selected Pre, Tem, wind speed, and PM2.5 as the climatic factors influencing the vegetation greenness change. Liu et al. [13] demonstrated that the topographic factors also affect vegetation coverage, so this paper considered the effects of DEM, aspect, and slope on vegetation greenness change. In addition to natural factors, anthropogenic factors also have an influence on vegetation, such as PD, CO2 emissions, and LULC (Table 1).
(2) Factor Grading: Geodetector can only handle discrete variables [25], so this paper classified the selected 10 factors in ArcGIS through the natural breakpoint method [45,46]. Combining experiments and prior knowledge, Pre and wind speed were divided into six categories; PM2.5 and PD into eight categories; CO2 emissions, LULC, aspect, and slope into nine categories; and Tem and DEM data into eleven categories (Table S1). The average NDVI values corresponding to different categories are shown in Figure 4.

2.3.2. Geographical Detector

Geodetector is used to analyze spatial heterogeneity, consisting of factor, interaction, risk, and ecological detectors [25]. This study primarily used factor and interaction detectors to study vegetation greenness change, and the Geodetector was run using R language.
(1) The factor detector detects the degree to which a single factor X (impact factors) can account for the target variable Y (NDVI), measured by the q -value ( q ∈ [0,1]), calculated as follows:
q = 1 h = 1 L N h σ h 2 N σ 2 = 1 S S W S S T
N h and N are the units of the h th ( h (1… L ) denotes the subarea of the variable Y or factor X, which is classified or partitioned) subregion and the whole area, respectively; σ h 2 and σ 2 denote the variances of Y values in subregion h and the whole area, respectively. S S W and S S T are the total variance within stratum and the total variance of the whole region, respectively. Larger values of q indicate the stronger explanatory power of the influence factor on the vegetation greenness change.
(2) The interaction detector can assess the explanation degree of factors to vegetation greenness change when any two factors work together. Firstly, the q -values ( q (X1) and q (X2)) were calculated as X1 and X2 of Y, respectively. Then, the q value of the interaction, q (X1∩X2), was computed, where X1∩X2 indicates the interaction of X1 and X2. Finally, the values of q (X1), q (X2), and q (X1∩X2) were compared in order to determine the type of interaction between the two factors. These are classified into five interaction types: nonlinear weakening, single-factor nonlinear weakening, two-factor enhancement, independent, and nonlinear enhancement.

2.3.3. Random Forest and Recursive Feature Elimination

RF is a statistical learning theory introduced by Breiman et al. [47], whose basic idea is that a forest contains multiple decision trees, each of which is constructed from a random sample that can be put back, and the sample of unknown categories is classified by final voting [48]. Several studies have shown that RF has comparatively high tolerance to outliers and noise, and is less susceptible to overfitting [49]. RF can be used as a classifier in combination with other algorithms, such as RFE.
The authors of [50] use a “greedy” algorithm to find the optimal subset of features. The main idea is to iteratively build a model and remove the least relevant characteristics in every iteration based on the forecast precision of the classifier, and finally select the best set of features for classification. RFE was combined with RF algorithm for factor selection, and the importance of each factor obtained from RF was used as the basis to remove the least important feature each time and built new feature importance iteratively until the optimal feature was selected. In this paper, the RFE-RF algorithm is mainly used to select the factors that have a significant impact on vegetation greenness change.
The basic process of RFE-RF is as follows. (1) Select an initial feature subset {F1, F2, F3,..., Fm} of m features to train the RF model. (2) The importance of features {Fi,..., Fj} is ranked using the “mean reduction impurity” index of the RF algorithm as the feature importance measure {f1, f2, f3,..., fm}. (3) Based on the ranking result, delete the feature Fk that corresponds to the minimum quantity fk and build a new subset of feature {Fi,..., Fk − 1, Fk + 1,..., Fj}. (4) Steps (1) to (3) are repeated until the best feature subset {Fi,..., Fn − 1, Fn + 1,..., Fj} is selected [31]. The RFE-RF algorithm in this paper ran in python with the inputs as the selected influence factors as well as the NDVI, and the output is the ranked importance of each factor in terms of its influence on vegetation greenness change.

3. Results

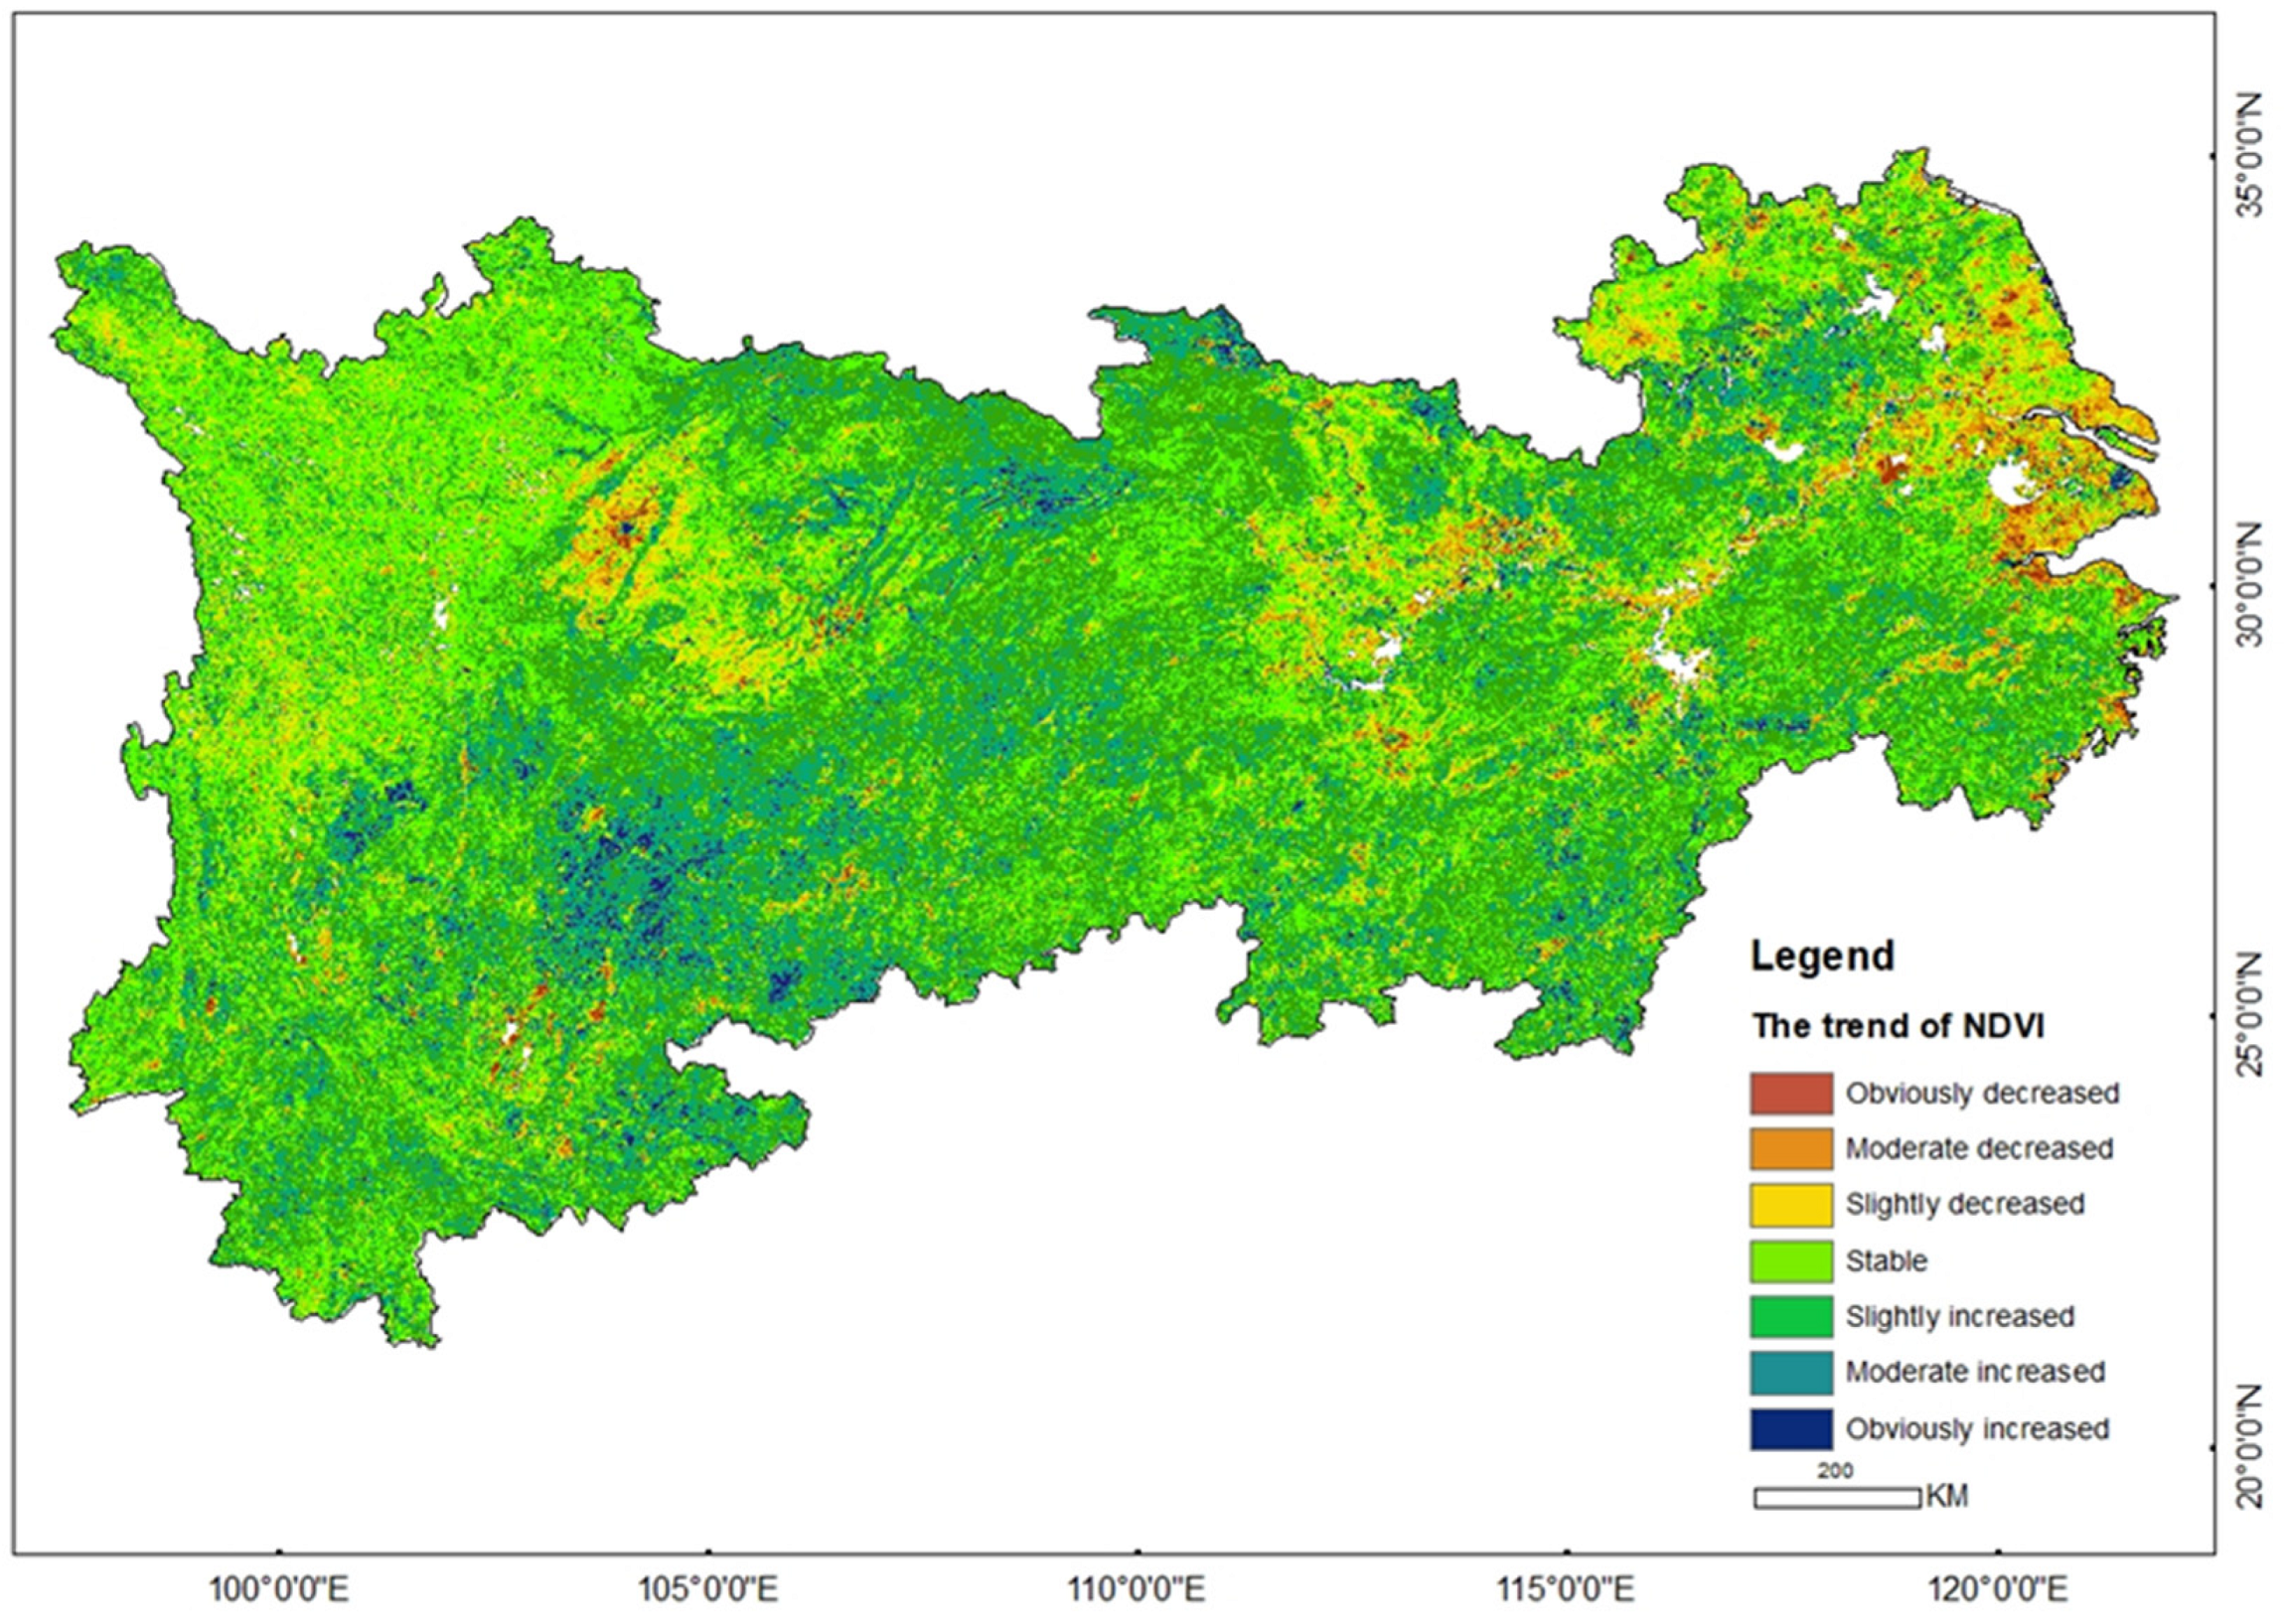
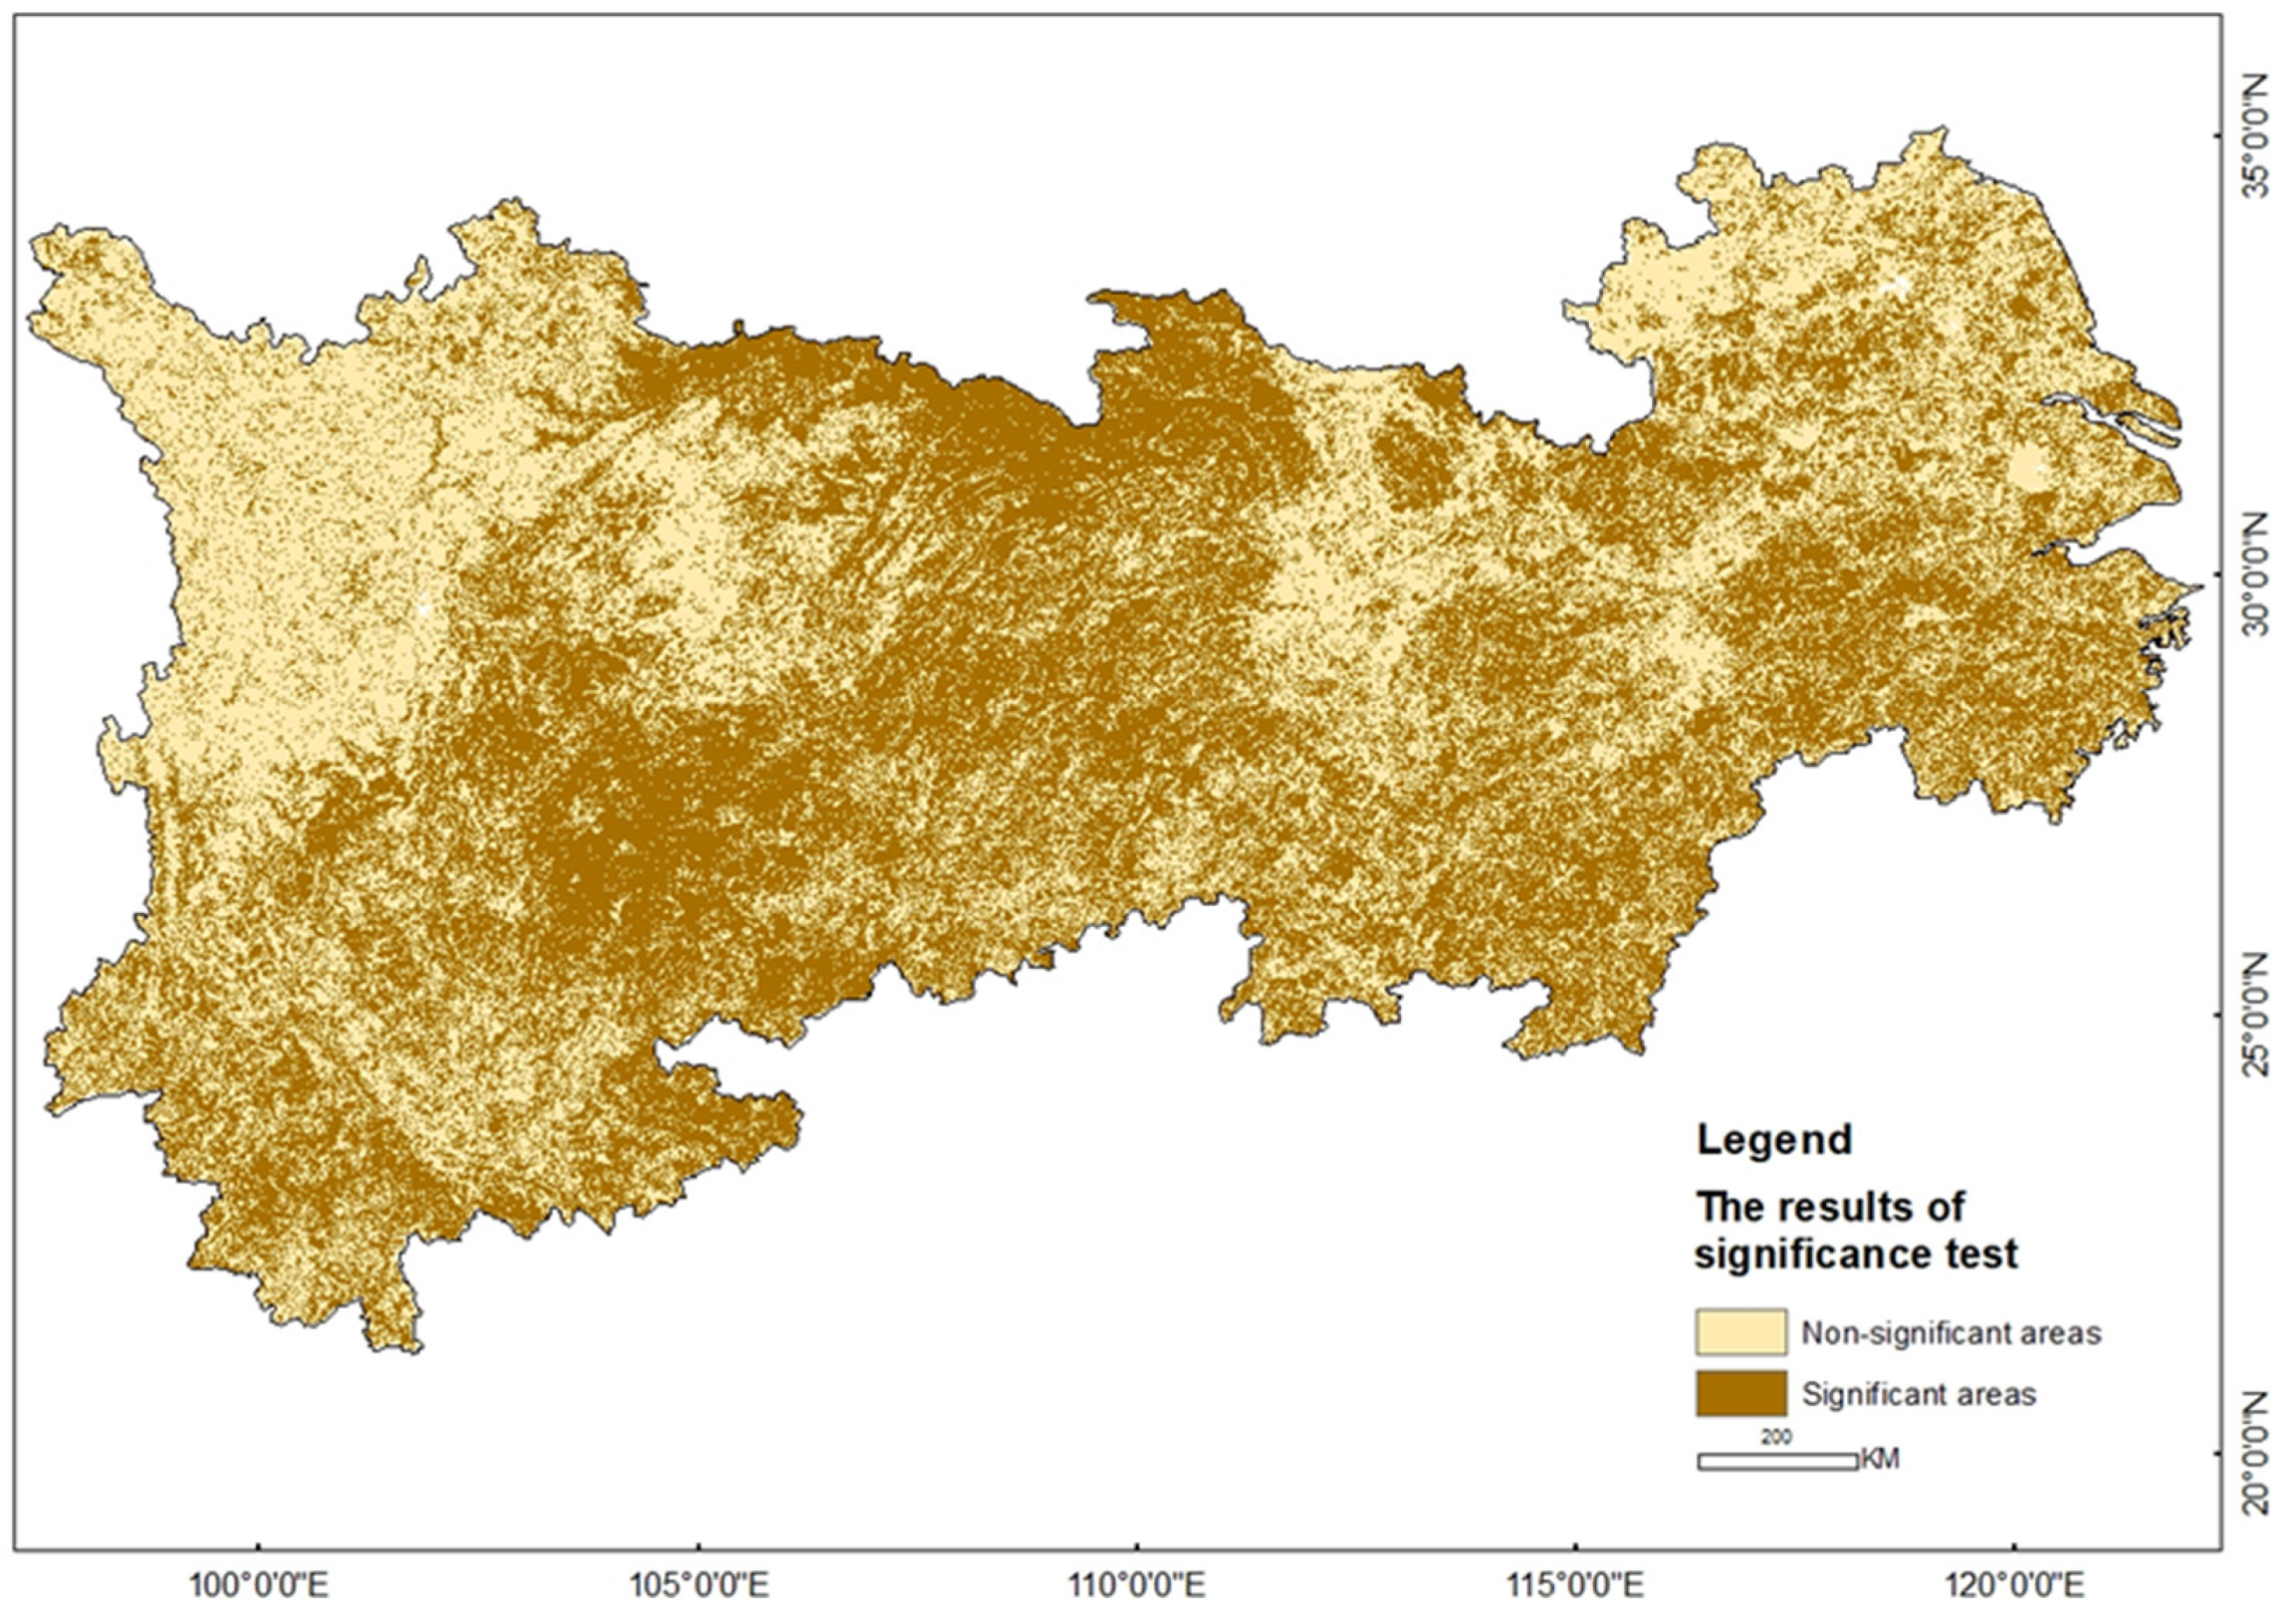
The mean NDVI of the YREB during 2000 to 2020 was 0.7891, indicating a high vegetation coverage. Generally, the areas where NDVI increased (about 83% of the region) were significantly larger than those where it decreased (about 17% of the region). The decreasing areas were mostly located in the eastern Yangtze River Delta, parts of Hubei, Hunan, and Sichuan provinces (Figure 5), which is consistent with a previous study [51], and the results of the significance test are shown in Figure 6. The southwestern part of Yunnan Province, central Sichuan Province, western Hubei Province, southeastern Guizhou Province, western Hunan Province, and most of Zhejiang Province had high vegetation coverage. The low vegetation coverage areas were predominantly distributed in some more developed regions, such as parts of the Yangtze River Delta, Wuhan, Changsha, and Chengdu, which are mainly influenced by urban sprawl and some economic policies.

3.1. Effect of Factors on NDVI Changes

3.1.1. Independent Effects of Influencing Factors on NDVI

The factor detection by Geodetector can disclose the influence degree of each factor on vegetation greenness change, which can be represented with a q -value for each factor (Table 2). All 10 influencing factors had a significant effect on NDVI changes (p value < 0.05). The LULC exhibited the largest q -value, which meant that it is the most important factor contributing to vegetation greenness change. The q -values of Tem and DEM were 0.2373 and 0.2415, respectively, indicating that their contributions to NDVI changes were more than 23%. Wind speed, PD and slope also demonstrated substantial contributions to NDVI changes, with q -values exceeding 0.11. The explanations of NDVI changes in Pre, PM2.5, CO2 emissions, and aspect were all below 10%, indicating that they had little effects on NDVI changes.
In this paper, the factors with explanation strength higher than 10% were taken as the main factors affecting vegetation greenness change, including Tem, wind speed, PD, LULC, DEM, and slope, of which Tem, wind speed, DEM, and slope are natural factors, and the others are human factors. From the number of major factors and the sum of q -values, natural factors have a higher effect on vegetation greenness change than human factors.
There were six factors with more than 10% explanation of NDVI changes in Geodetector, and for the convenience of the subsequent analysis, the RFE-RF selected six factors as well. By analyzing the NDVI and the influencing factors, Pre, Tem, PD, CO2 emissions, LULC, and DEM were finally determined as the most important factors affecting vegetation greenness change. The results of the analysis showed that aspect had the least effect on vegetation, which was consistent with the results of Geodetector, indicating that aspect has the lowest impact on vegetation greenness change.

3.1.2. Interaction Analysis of Each Factor

Changes in vegetation NDVI are generally impacted by numerous factors, and a single factor has limited explanation power. Thus, it is essential to further examine the interplay of diverse factors. In general, the explanatory strengths following the interaction of two different factors are both greater than those of a single factor, and most of the interactions show mutual enhancement [ q (X1∩X2) > Max( q (X1), q (X2))] or nonlinear enhancement [ q (X1∩X2) > q (X1) + q (X2)].
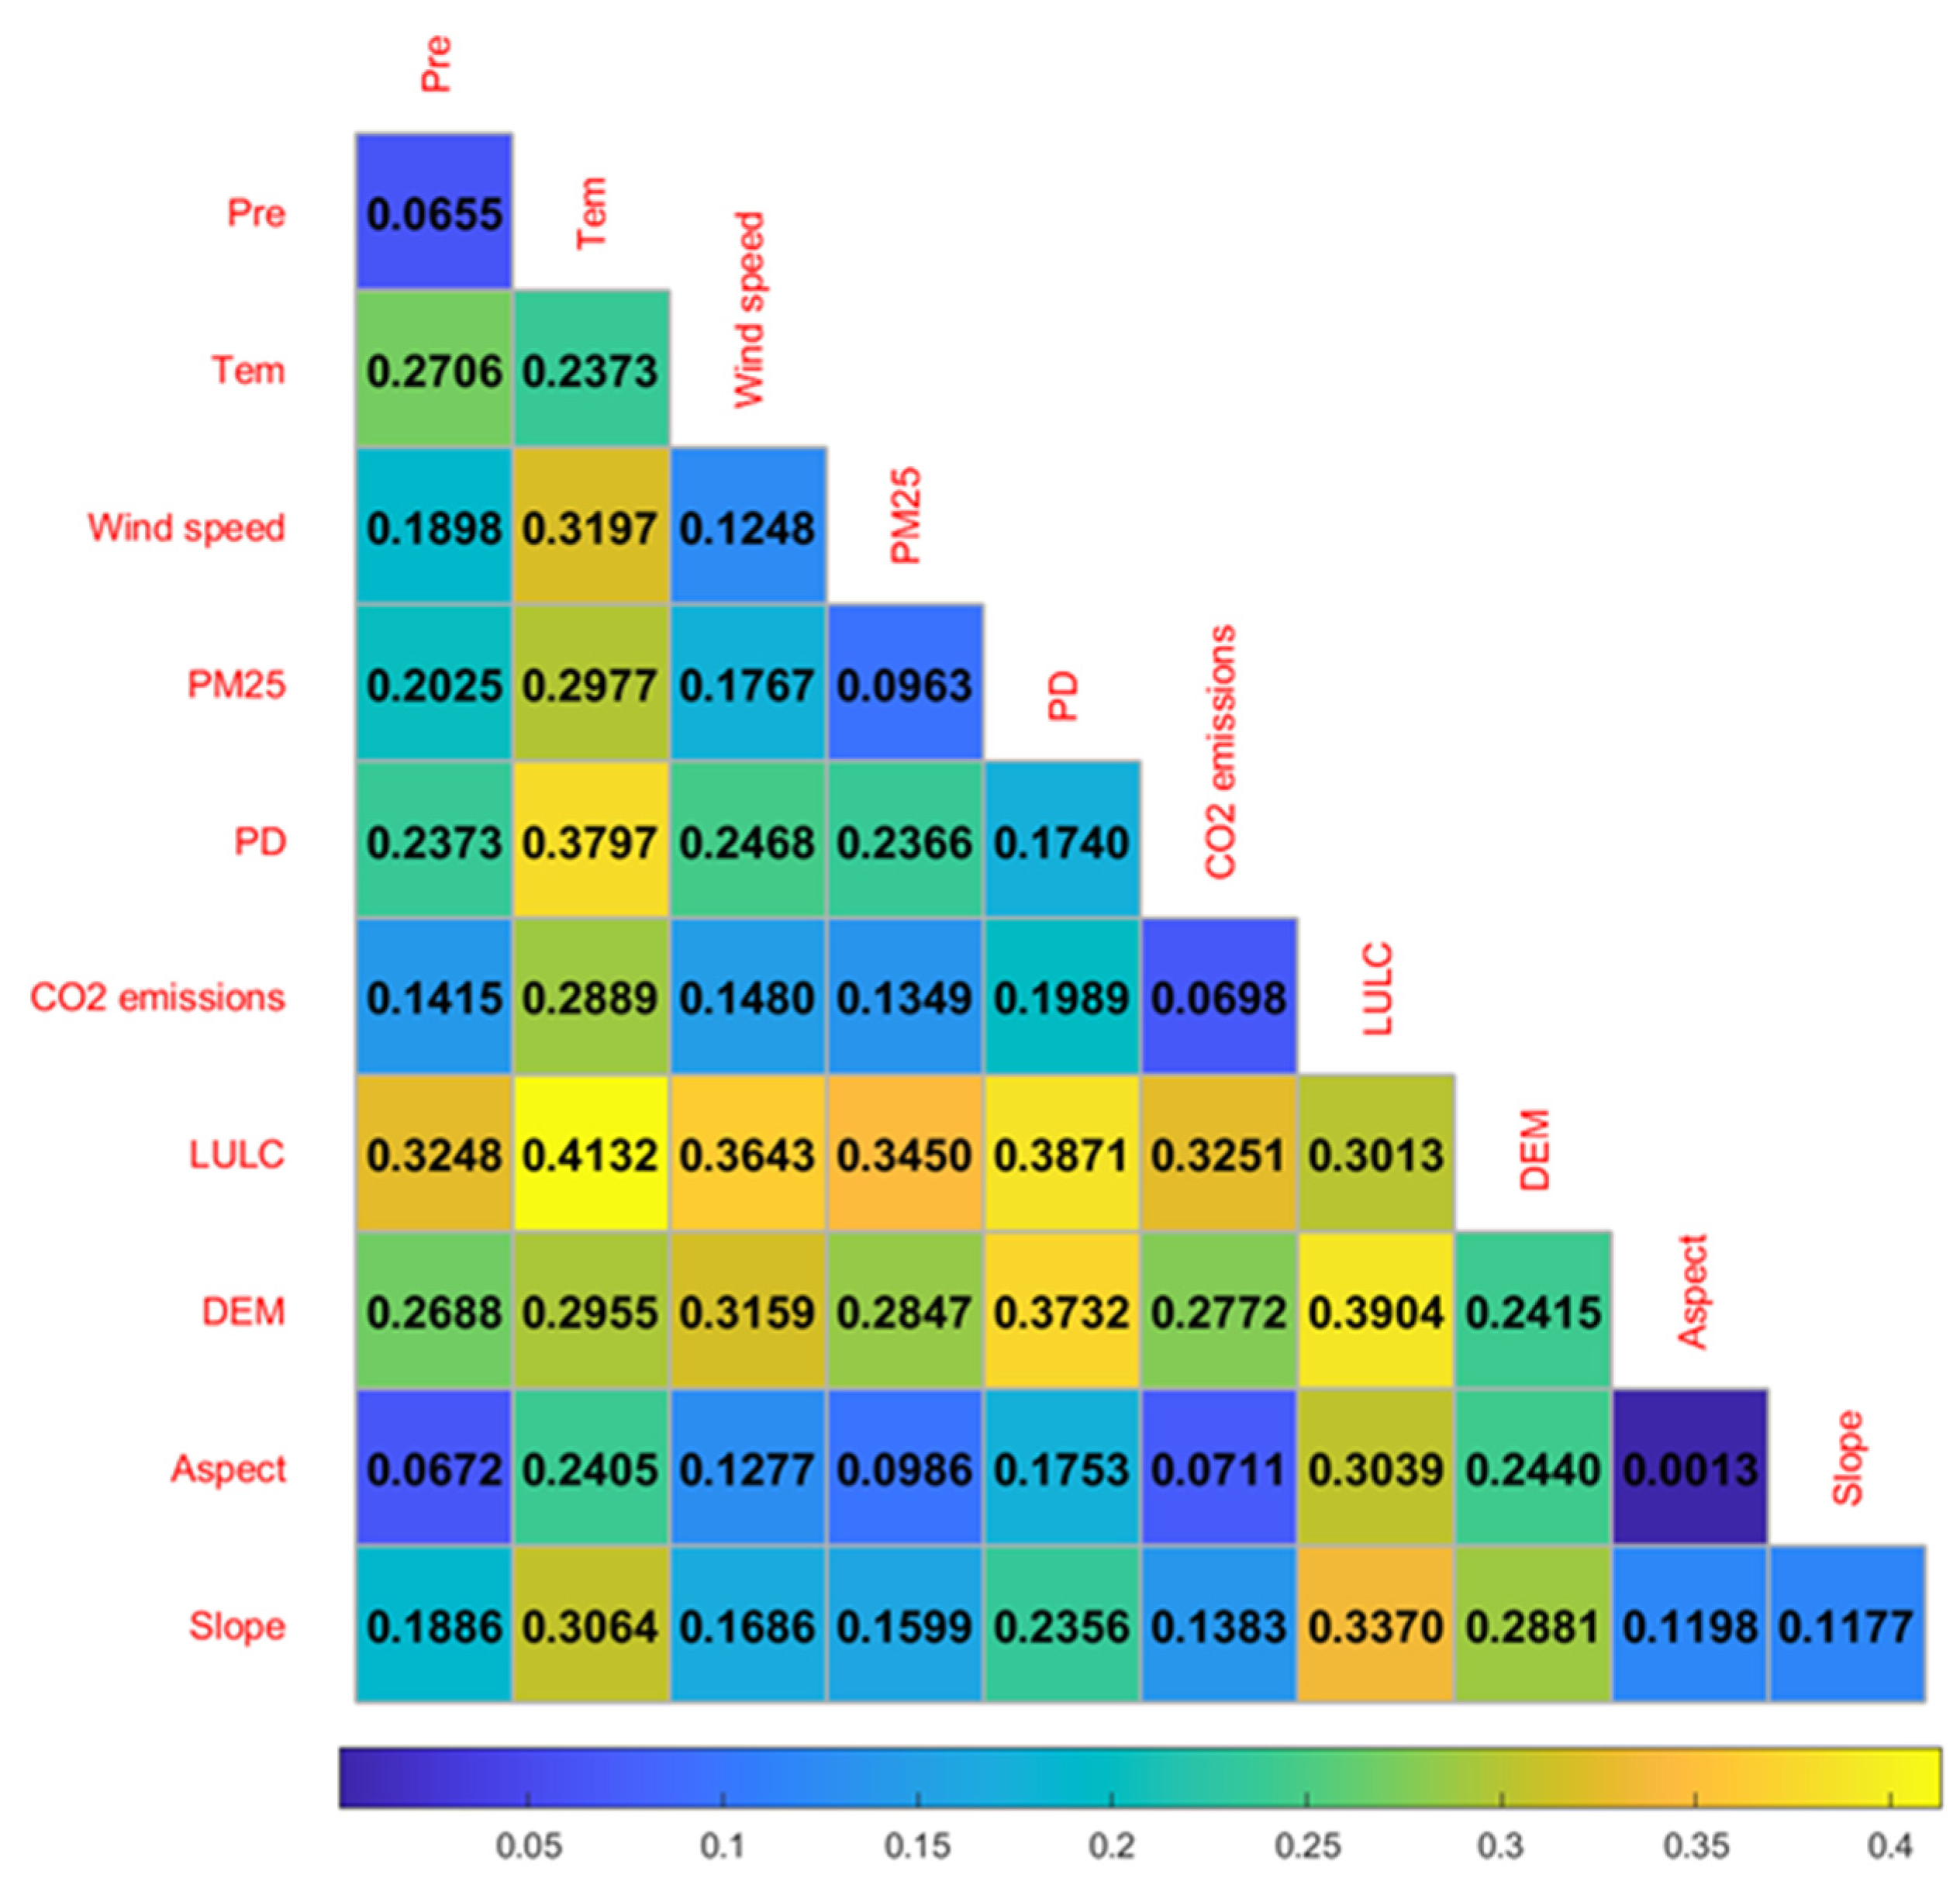
Figure 7 shows the results of interaction detection, from which it can be seen that the interaction between Tem and LULC had the largest effect on vegetation greenness change ( q = 0.4132), followed by LULC and DEM ( q = 0.3904). The interaction results of LULC with Tem and DEM both exhibited a mutual enhancement effect. The strength of explanation after the interaction between LULC and other factors was greater than 30%, which indicates that the interaction between LULC and other factors can improve the degree of explanation of factors. The explanatory power of aspect was nearly zero, but after interacting with other factors, the explanatory strengths were all greater than 6%. The above results indicate that the q -value of interaction detection is greater than that of the individual factor, suggesting that the explanatory power of the individual factor will be increased when interacting with other factors.

3.1.3. Stable Factors Affecting Vegetation NDVI

From Section 3.1.1, it can be seen that the selected factors of both Geodetector and RFE-RF included Tem, PD, LULC, and DEM, indicating that these four factors have a strong effect on the NDVI changes of vegetation. Therefore, Tem, PD, LULC, and DEM can be regarded as the stable factors affecting vegetation greenness change in the YREB.

3.2. Spatial Distribution of Trends in Factors

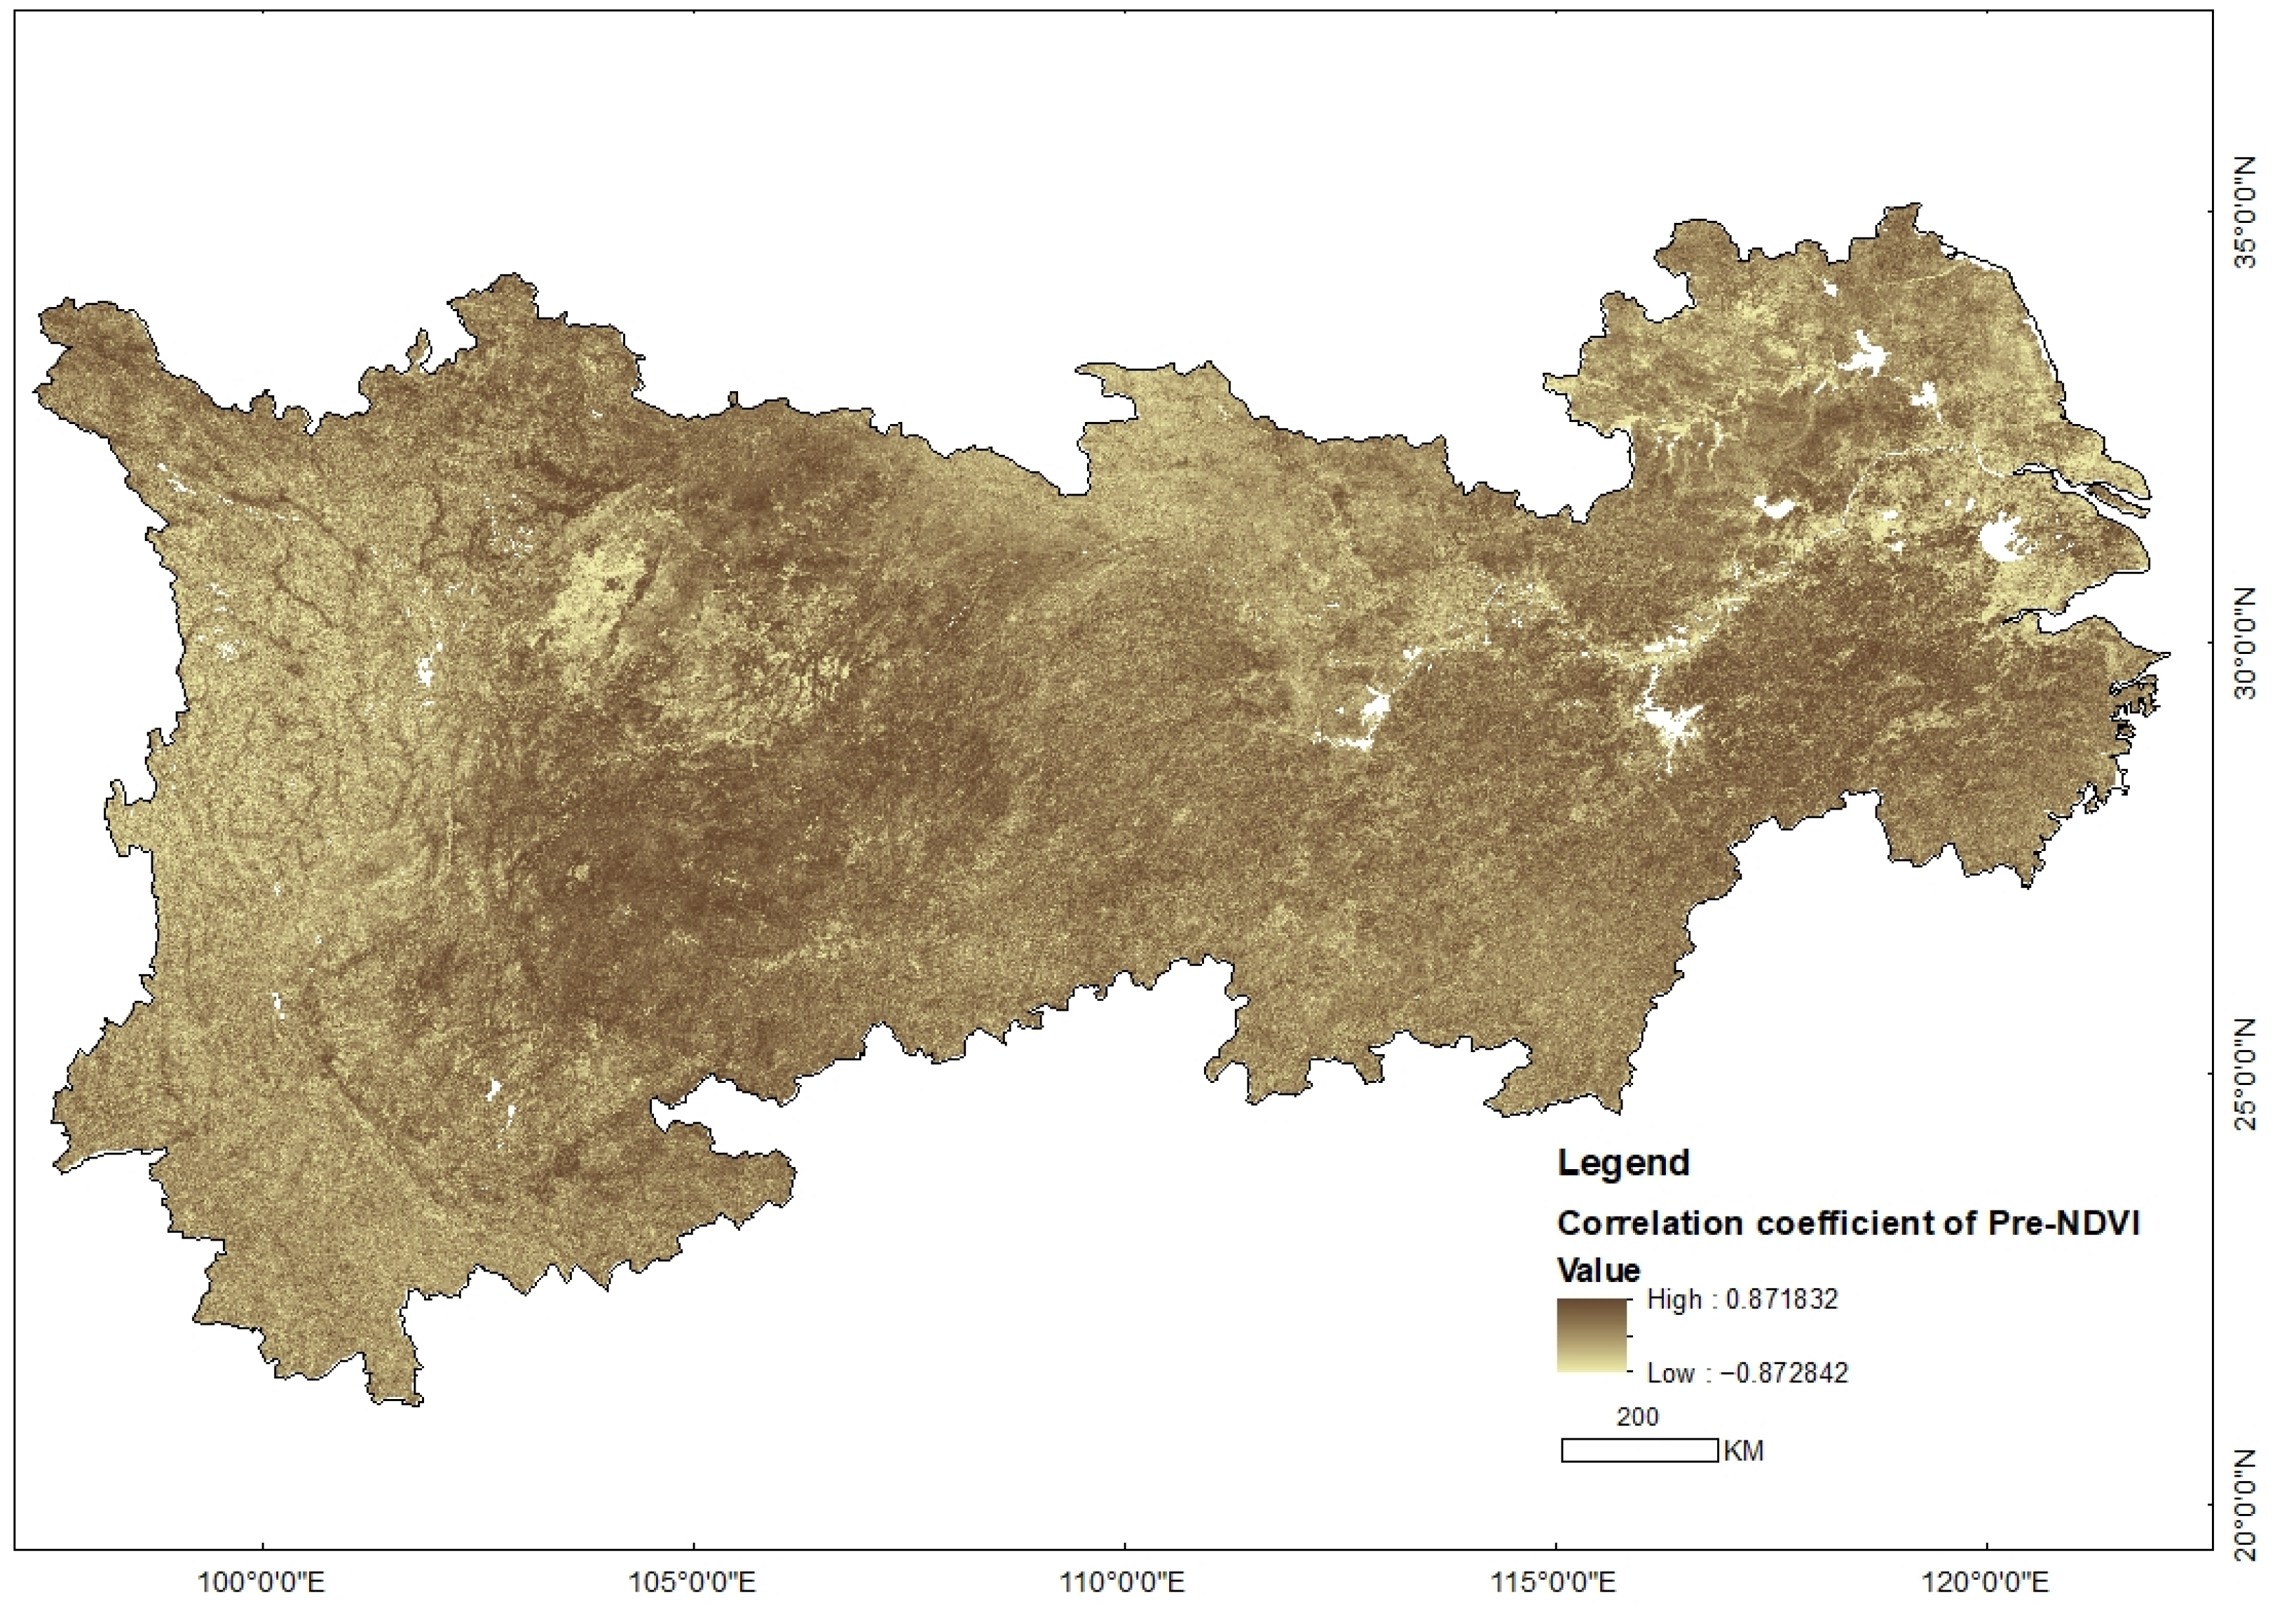
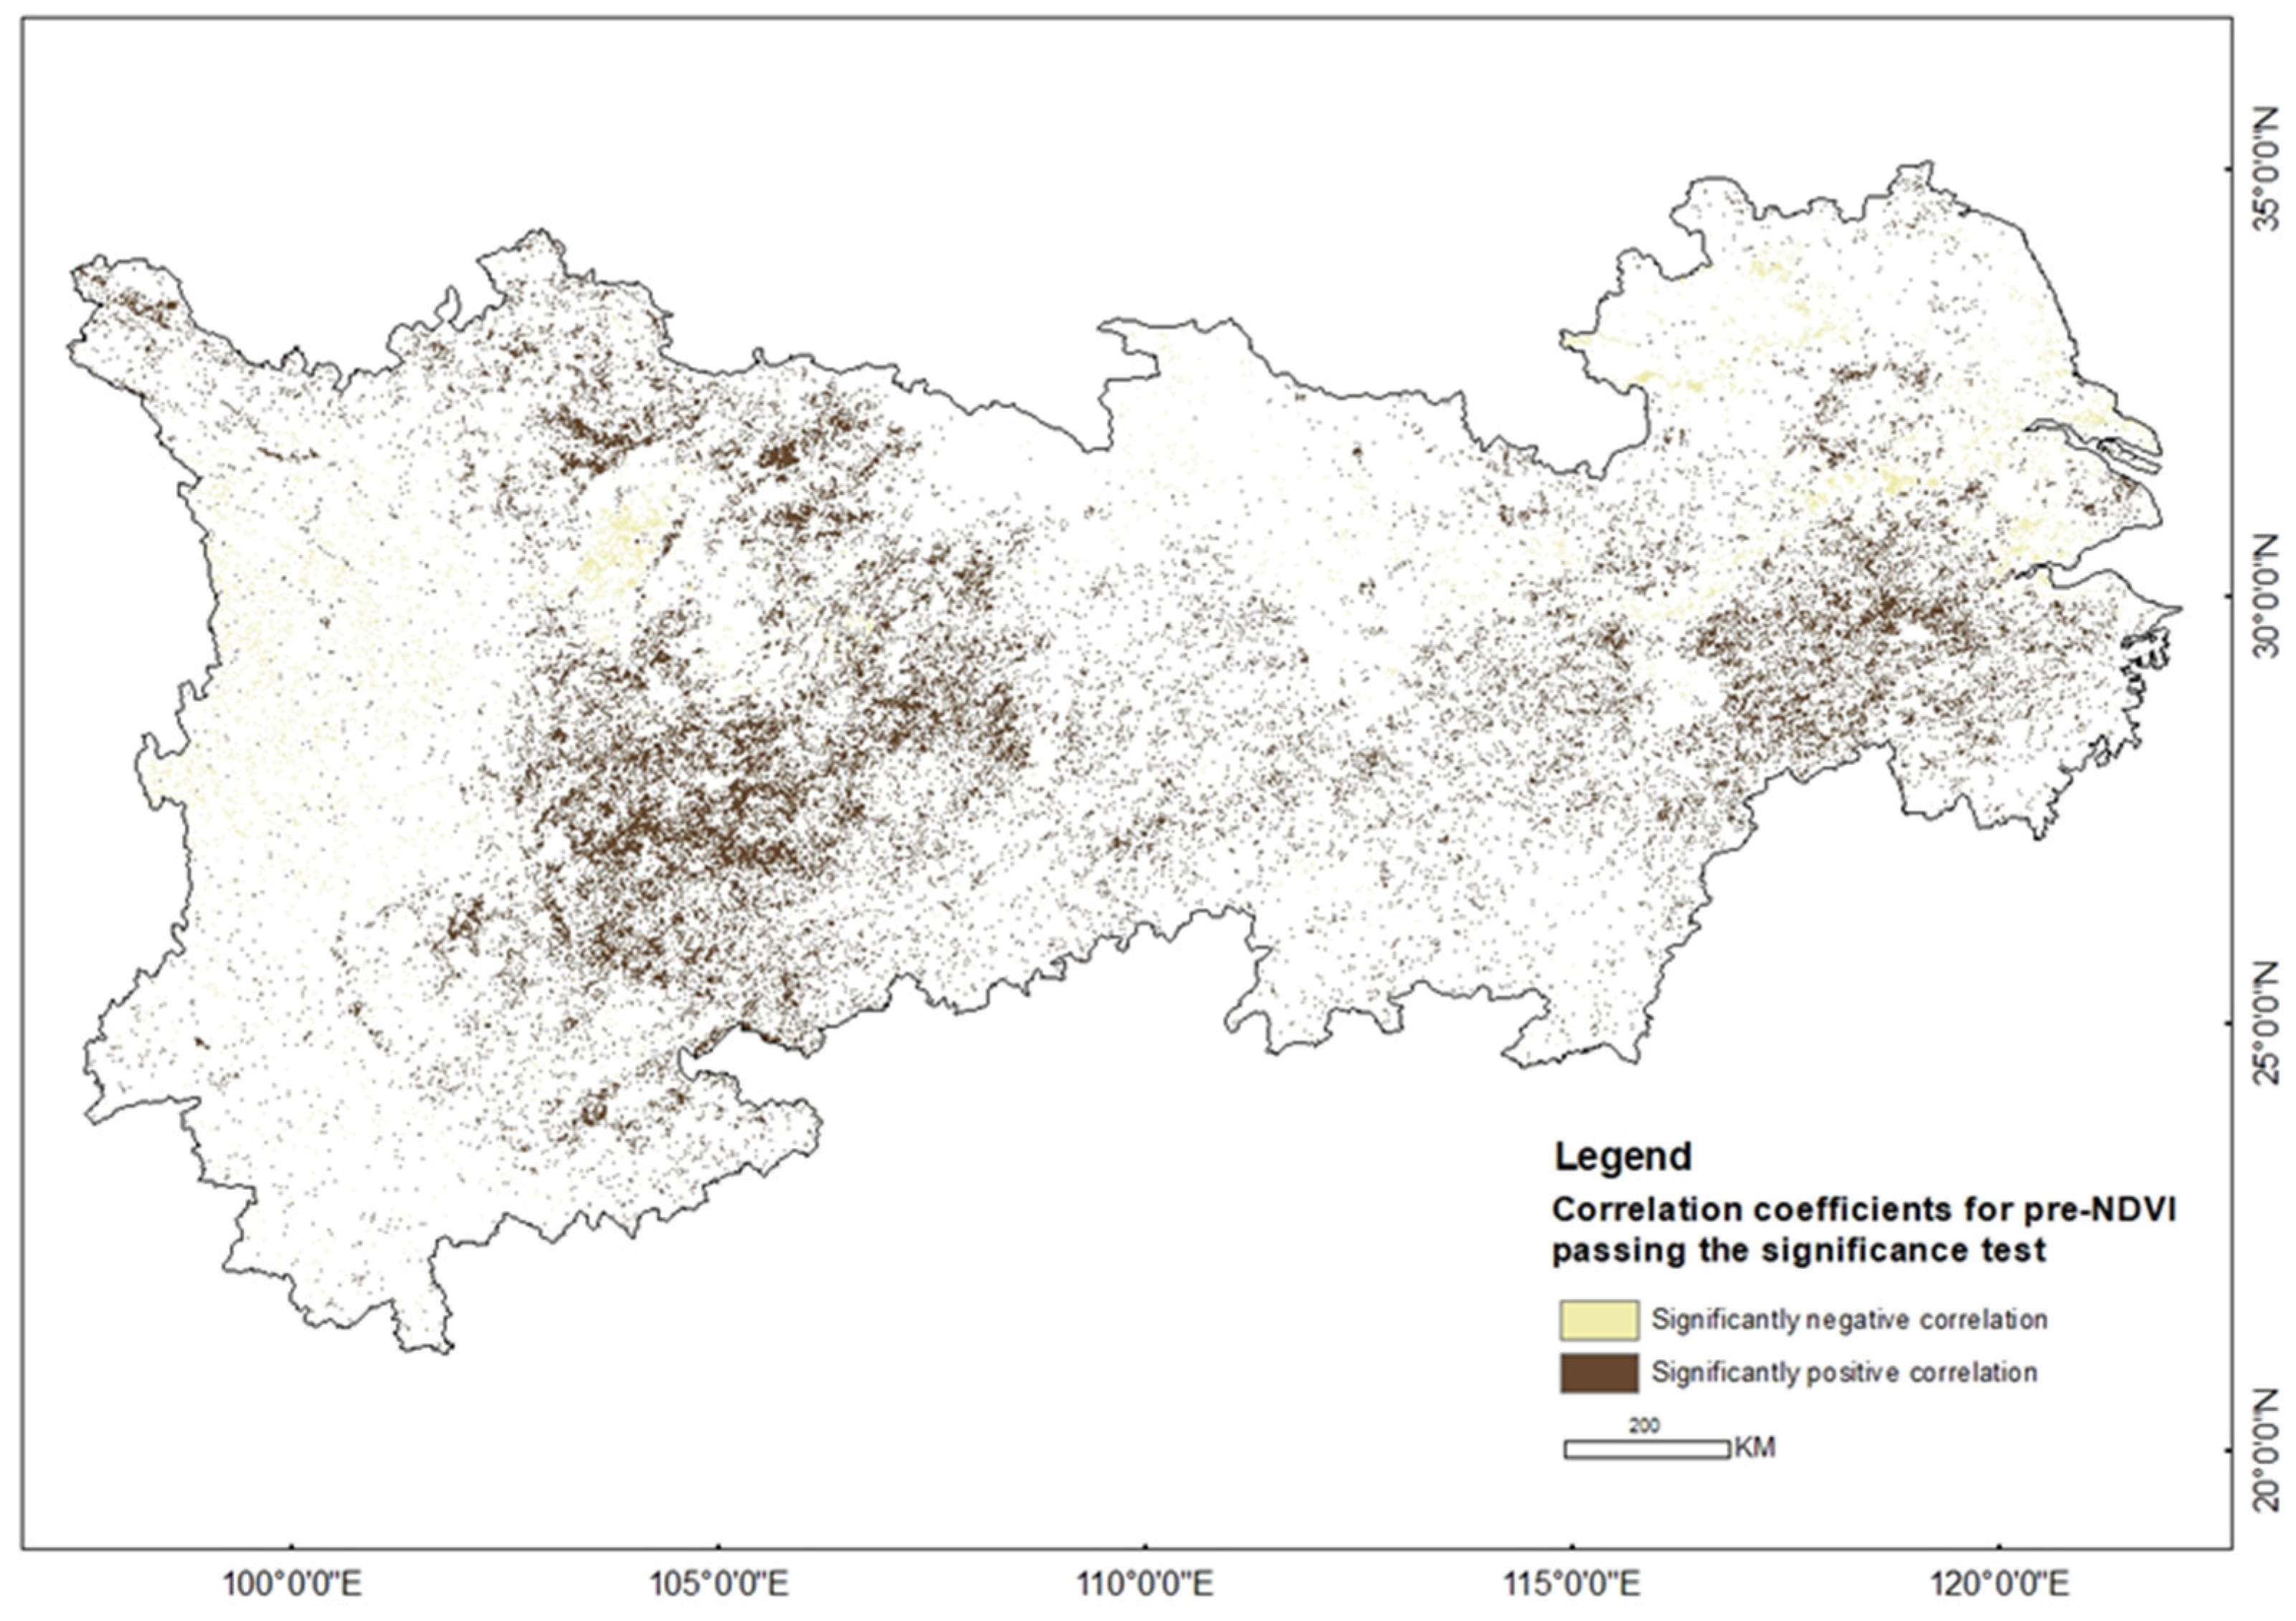
Figure 8 and Figure 9 depict Pearson’s correlation coefficients for Pre-NDVI and the correlation coefficients that passed the significance test, respectively. The correlation coefficients are high in the positive correlation areas where Pre-NDVI passes the significance test. The trends of impact factors and their correlation coefficients with NDVI are represented by Figures S1–S19. A trend value greater than 0 indicates an increasing trend in the factor being analyzed, and a correlation coefficient greater than 0 indicates a positive correlation between the factor and NDVI. From these plots, it is apparent that the spatial distribution of these trends and correlation coefficients is heterogeneous. Pre, CO2 emissions, and Tem are dominated by increasing trends while other factors mainly with decreasing trends. Pre and Tem are mainly positively correlated with NDVI while other factors are mainly negatively correlated.

4. Discussion

4.1. Vegetation Greenness Change

Vegetation greenness change in YREB exhibited significant spatial heterogeneity, with the area experiencing an upward trend being about five times as large as the area showing a decline. The regions with decreased NDVI are mainly affected by the “1+8” city circle in Hubei [52], the “Chengdu-Chongqing” city circle [53], “Changzhutan” and “3+5” urban circle, as well as Yangtze River Delta city agglomeration and development policies. Accelerated industrialization and urbanization have resulted in the rapid expansion of building land in the above areas and the constant occupation of forest land, grassland, and agricultural land, resulting in the decrease in regional vegetation cover and the decreasing trend of vegetation NDVI. The YREB serves as a pioneer demonstration belt for the construction of ecological civilization. By understanding the regional vegetation greenness change and the influence of factors, wise decisions and appropriate measures can be taken to ensure the long-term health and stability of the ecosystem.

4.2. Linking of Methods

This study combined two methods, Geodetector and RFE-RF, to select the influencing factors, which provides a certain reference for vegetation conservation. Geodetector identifies driving forces by examining spatial heterogeneity and can quantitatively describe the impact of each factor on vegetation greenness change. However, it is necessary to grade the data, and the absence of a standardized grading system can yield different results when using different grades. RFE-RF analyzes the original data and can reduce redundant features in the data by iteratively selecting the optimal subset of features. Zhou et al. [31] applied the RFE-RF method to select the seven optimal factors out of twenty-two landslide factors, successfully reducing the redundancy of the data. However, it does not take into account the spatial heterogeneity of the data. Therefore, in this study, we combined the advantages of Geodetector and RFE-RF to optimize vegetation impact factors and reduce data redundancy.

4.3. Effect of Factors on Vegetation Greenness Change

The selected factors of two methods all included Tem, PD, LULC, and DEM, indicating that these four factors have great effects on the changes of vegetation NDVI. In this study, the relative data of 2021 were used to verify the reliability of the above result. The NDVI and the impact factors in 2021 (PD and wind speed using 2020 data) were processed and calculated with Geodetector and RFE-RF, and the results of factor detection are presented in Table 3. In order to be consistent with the previous study, the factors with explanation strength greater than 10% in Geodetector were taken as the important factors affecting vegetation greenness change in 2021, including Tem, wind speed, PD, CO2 emissions, LULC, DEM, and slope. The seven impact factors selected by RFE-RF were Pre, Tem, PM2.5, PD, CO2 emissions, LULC, and DEM. The results of two methods include Tem, PD, CO2 emissions, LULC, and DEM. From the above results, it can be seen that the hypothesis in this paper has a certain degree of reliability, and it can be used as a reference for the subsequent research.
Elevation changes are the main cause of spatial variation in vegetation NDVI, and vegetation growth is mainly influenced by regional moisture, heat, and light conditions, and Tem is closely related to elevation. In general, Tem affects vegetation growth more at higher elevations than at lower elevations [54], and decreasing water availability with increasing elevation can also limit vegetation growth [55]. The effect of Tem on vegetation was higher than that of Pre in YREB, which is in agreement with the study by Qu et al. [56]. This is attributed to the dense distribution of rivers and the low effect of Pre on vegetation in YREB, whereas Tem has become a limiting factor for vegetation growth in most areas. With the acceleration of urbanization, the YREB has suffered large-scale population movements, with consequent changes in PD. The livelihoods of village residents have changed, and some cropland has gradually become unused and degraded into woodland and grassland, which has had an impact on vegetation [18]. From the results of Geodetector, it can be seen that LULC has the greatest influence on vegetation greenness change, which is consistent with the conclusion that land use change caused by afforestation is the main anthropogenic factor promoting vegetation growth in China obtained by Liu et al. [57].
In contrast, neither PM2.5 nor aspect appeared in the factors selected by both, indicating that PM2.5 and aspect have little influence on the change of vegetation NDVI. From Figure 4i, it can be seen that the NDVI values of aspect in the study area exhibit a decrease followed by an increase. Generally speaking, the south-facing aspect receives more solar radiation than the north-facing aspect, which is beneficial to vegetation growth. Although the YREB has a subtropical monsoon climate with abundant Pre, the long-term solar radiation leads to the excessive evaporation of plant and soil moisture, resulting in reduced water conditions and retarded vegetation growth [13]. Vegetation can reduce particulate pollution to a certain extent [58], but excessive airborne particulate matter retention has a negative impact on vegetation development [59].
In Geodetector, although the effects of Pre, CO2 emissions, and aspect on vegetation greenness change were weak, the explanatory power was significantly enhanced by interaction with LULC, Tem, and DEM. Moreover, from the results of interaction detection, it can be seen that the q -values after the interaction of two factors were greater than the individual q -value. This revealed that the interaction of the two factors was more important for vegetation greenness change than the individual factor. This conclusion is in agreement with those of Bai et al. [60] and Meng at al. [61].

4.4. Spatial Heterogeneity of Factors

The Geodetector is based on spatial heterogeneity and studies that were carried out after the discretization of the original data, while RFE-RF analyzes the original data directly without considering spatial heterogeneity. The assumption of the Geodetector is that if the independent variable has a significant effect on the dependent variable, the spatial distribution of the independent and dependent variables should be similar [25]. In this study, NDVI increased and gradually plateaued with the increase in slope. This can be attributed to the topographic and traffic constraints in areas with steep slopes, which greatly reduce human production activities. Vegetation growth in areas with steep slopes is mainly influenced by natural conditions and less disturbed by human activities [13]. Wind speed showed a negative correlation with NDVI, indicating that wind speed inhibits vegetation growth, which is consistent with the study of Li et al. [11]. Wind speed and slope appeared in Geodetector results but not in the RFE-RF results, suggesting that the spatial distribution of these two factors is similar to that of NDVI and they have effects on vegetation greenness change, thus the spatial heterogeneity of both has an effect on vegetation greenness change. In contact, the spatial heterogeneity of Pre and CO2 emissions has little effect.

4.5. Outlooks

Vegetation greenness change is a complicated process and influenced by many factors. In this paper, the factors affecting vegetation greenness change were obtained using two methods, one considering the spatial heterogeneity of the impact factors and the other without considering it, and the results of either of the two methods are credible. The factors finally selected by two algorithms contain Tem, PD, LULC, and DEM; thus, these four factors can be regarded as stable factors affecting vegetation greenness change in the YREB. In fact, more factors and their driving mechanisms of vegetation greenness change are not comprehensive enough, which should be considered further. For example, ecological projects and more economic factors ought to be considered in future studies to diminish the uncertainty of their effects on vegetation greenness change. It is known from the results of Geodetector and RFE-RF that the spatial heterogeneity of wind speed and slope has an effect on vegetation greenness change, while Pre and CO2 emissions have limited effects, but how the spatial heterogeneity affects the vegetation greenness change needs to be further investigated.

5. Conclusions

In this paper, the NDVI changes of vegetation in the YREB were studied via Geodetector and the RFE-RF algorithm, and the following conclusions were obtained:
(1) During the growing season, the multi-year average of NDVI was 0.7891. The spatial distribution pattern showed “high in the middle and low in the east and west”, with a dominant increasing trend in vegetation cover.
(2) Geodetector and RFE-RF identified Tem, PD, LULC, and DEM as stable factors affecting vegetation greenness change in YREB from 2000 to 2020, suggesting that these factors consistently demonstrated a significant impact on vegetation dynamics, whether or not spatial heterogeneity was considered.
(3) Wind speed and slope only appeared in Geodetector results, indicating that the spatial heterogeneity of two factors has an effect on vegetation greenness change. In contrast, Pre and CO2 emissions only appeared in the RFE-RF results, indicating that their spatial heterogeneity has little effect on vegetation greenness change.

Supplementary Materials

The following supporting information can be downloaded at: https://www.mdpi.com/article/10.3390/rs15245693/s1.

Author Contributions

Conceptualization, methodology, investigation, data curation, writing—original draft, C.P.; conceptualization, formal analysis, project administration, visualization, funding acquisition, L.D.; data curation, formal analysis, H.R.; resources, X.L. (Xiong Li); resources, writing—review and editing, X.L. (Xiangyuan Li). All authors have read and agreed to the published version of the manuscript.

Funding

This study was supported by the National Natural Science Foundation of China (grant no. 42101395). We thank all the data contributors.

Data Availability Statement

Data are contained within the article.

Conflicts of Interest

The authors declare that they have no known competing financial interest or personal relationships that could have appeared to influence the work reported in this paper.

References

  1. Piao, S.; Fang, J.; Zhou, L.; Guo, Q.; Henderson, M.; Ji, W.; Li, Y.; Tao, S. Interannual variations of monthly and seasonal normalized difference vegetation index (NDVI) in China from 1982 to 1999. J. Geophys. Res. Atmos. 2003, 108, 4401. [Google Scholar] [CrossRef]
  2. Bégué, A.; Vintrou, E.; Ruelland, D.; Claden, M.; Dessay, N. Can a 25-year trend in Soudano-Sahelian vegetation dynamics be interpreted in terms of land use change? A remote sensing approach. Glob. Environ. Chang. 2011, 21, 413–420. [Google Scholar] [CrossRef]
  3. Liu, H.; Zheng, L.; Yin, S. Multi-perspective analysis of vegetation cover changes and driving factors of long time series based on climate and terrain data in Hanjiang River Basin, China. Arab. J. Geosci. 2018, 11, 509. [Google Scholar] [CrossRef]
  4. Pettorelli, N.; Vik, J.O.; Mysterud, A.; Gaillard, J.-M.; Tucker, C.J.; Stenseth, N.C. Using the satellite-derived NDVI to assess ecological responses to environmental change. Trends Ecol. Evol. 2005, 20, 503–510. [Google Scholar] [CrossRef] [PubMed]
  5. Hao, F.; Zhang, X.; Ouyang, W.; Skidmore, A.K.; Toxopeus, A. Vegetation NDVI linked to temperature and precipitation in the upper catchments of Yellow River. Environ. Model. Assess. 2012, 17, 389–398. [Google Scholar] [CrossRef]
  6. Gu, Z.; Duan, X.; Shi, Y.; Li, Y.; Pan, X. Spatiotemporal variation in vegetation coverage and its response to climatic factors in the Red River Basin, China. Ecol. Indic. 2018, 93, 54–64. [Google Scholar] [CrossRef]
  7. Lamchin, M.; Lee, W.-K.; Jeon, S.W.; Wang, S.W.; Lim, C.H.; Song, C.; Sung, M. Long-term trend and correlation between vegetation greenness and climate variables in Asia based on satellite data. Sci. Total Environ. 2018, 618, 1089–1095. [Google Scholar] [CrossRef]
  8. Zhang, Y.; Gao, J.; Liu, L.; Wang, Z.; Ding, M.; Yang, X. NDVI-based vegetation changes and their responses to climate change from 1982 to 2011: A case study in the Koshi River Basin in the middle Himalayas. Glob. Planet. Chang. 2013, 108, 139–148. [Google Scholar] [CrossRef]
  9. Pang, G.; Wang, X.; Yang, M. Using the NDVI to identify variations in, and responses of, vegetation to climate change on the Tibetan Plateau from 1982 to 2012. Quat. Int. 2017, 444, 87–96. [Google Scholar] [CrossRef]
  10. Mao, D.; Wang, Z.; Luo, L.; Ren, C. Integrating AVHRR and MODIS data to monitor NDVI changes and their relationships with climatic parameters in Northeast China. Int. J. Appl. Earth Obs. Geoinf. 2012, 18, 528–536. [Google Scholar] [CrossRef]
  11. Li, Y.; Zheng, Z.; Qin, Y.; Rong, P. Relative contributions of natural and man-made factors to vegetation cover change of environmentally sensitive and vulnerable areas of China. J. Clean. Prod. 2021, 321, 128917. [Google Scholar] [CrossRef]
  12. Yu, W.; Wang, Y.; Wang, Y.; Li, B.; Liu, Y.; Liu, X. Application of a coupled model of photosynthesis and stomatal conductance for estimating plant physiological response to pollution by fine particulate matter (PM 2.5). Environ. Sci. Pollut. Res. 2018, 25, 19826–19835. [Google Scholar] [CrossRef]
  13. Liu, Y.; Huang, H.; Meng, L.; Liu, M.; Wu, Z.; Liu, T.; Labat, D. Spatial-temporal evolution of vegetation coverage and its relationship with terrain and human factors in the upper reaches of Ganjiang River Basin, China. Front. Earth Sci. 2023, 10, 1043403. [Google Scholar] [CrossRef]
  14. Feng, K.; Wang, T.; Liu, S.; Yan, C.; Kang, W.; Chen, X.; Guo, Z. Path analysis model to identify and analyse the causes of aeolian desertification in Mu Us Sandy Land, China. Ecol. Indic. 2021, 124, 107386. [Google Scholar] [CrossRef]
  15. Liu, X.; Pei, F.; Wen, Y.; Li, X.; Wang, S.; Wu, C.; Cai, Y.; Wu, J.; Chen, J.; Feng, K. Global urban expansion offsets climate-driven increases in terrestrial net primary productivity. Nat. Commun. 2019, 10, 5558. [Google Scholar] [CrossRef] [PubMed]
  16. Liu, D.; Chen, J.; Ouyang, Z. Responses of landscape structure to the ecological restoration programs in the farming-pastoral ecotone of Northern China. Sci. Total Environ. 2020, 710, 136311. [Google Scholar] [CrossRef] [PubMed]
  17. Sun, Z.; Mao, Z.; Yang, L.; Liu, Z.; Han, J.; Wanag, H.; He, W. Impacts of climate change and afforestation on vegetation dynamic in the Mu Us Desert, China. Ecol. Indic. 2021, 129, 108020. [Google Scholar] [CrossRef]
  18. Van der Geest, K.; Vrieling, A.; Dietz, T. Migration and environment in Ghana: A cross-district analysis of human mobility and vegetation dynamics. Environ. Urban. 2010, 22, 107–123. [Google Scholar] [CrossRef]
  19. Diffenbaugh, N.S.; Sloan, L.C.; Snyder, M.A.; Bell, J.L.; Kaplan, J.; Shafer, S.L.; Bartlein, P.J. Vegetation sensitivity to global anthropogenic carbon dioxide emissions in a topographically complex region. Glob. Biogeochem. Cycles 2003, 17, 1067. [Google Scholar] [CrossRef]
  20. Liu, T.; Zhang, Q.; Li, T.; Zhang, K. Dynamic Vegetation Responses to Climate and Land Use Changes over the Inner Mongolia Reach of the Yellow River Basin, China. Remote Sens. 2023, 15, 3531. [Google Scholar] [CrossRef]
  21. Yang, L.; Shen, F.; Zhang, L.; Cai, Y.; Yi, F.; Zhou, C. Quantifying influences of natural and anthropogenic factors on vegetation changes using structural equation modeling: A case study in Jiangsu Province, China. J. Clean. Prod. 2021, 280, 124330. [Google Scholar] [CrossRef]
  22. Zhang, P.; Cai, Y.; Yang, W.; Yi, Y.; Yang, Z.; Fu, Q. Contributions of climatic and anthropogenic drivers to vegetation dynamics indicated by NDVI in a large dam-reservoir-river system. J. Clean. Prod. 2020, 256, 120477. [Google Scholar] [CrossRef]
  23. Ren, Z.; Tian, Z.; Wei, H.; Liu, Y.; Yu, Y. Spatiotemporal evolution and driving mechanisms of vegetation in the Yellow River Basin, China during 2000–2020. Ecol. Indic. 2022, 138, 108832. [Google Scholar] [CrossRef]
  24. Peng, W.; Kuang, T.; Tao, S. Quantifying influences of natural factors on vegetation NDVI changes based on geographical detector in Sichuan, western China. J. Clean. Prod. 2019, 233, 353–367. [Google Scholar] [CrossRef]
  25. Wang, J.F.; Li, X.H.; Christakos, G.; Liao, Y.L.; Zhang, T.; Gu, X.; Zheng, X.Y. Geographical detectors-based health risk assessment and its application in the neural tube defects study of the Heshun Region, China. Int. J. Geogr. Inf. Sci. 2010, 24, 107–127. [Google Scholar] [CrossRef]
  26. Huo, H.; Sun, C. Spatiotemporal variation and influencing factors of vegetation dynamics based on Geodetector: A case study of the northwestern Yunnan Plateau, China. Ecol. Indic. 2021, 130, 108005. [Google Scholar] [CrossRef]
  27. Zhu, L.; Meng, J.; Zhu, L. Applying Geodetector to disentangle the contributions of natural and anthropogenic factors to NDVI variations in the middle reaches of the Heihe River Basin. Ecol. Indic. 2020, 117, 106545. [Google Scholar] [CrossRef]
  28. Cui, L.; Pang, B.; Zhao, G.; Ban, C.; Ren, M.; Peng, D.; Zuo, D.; Zhu, Z. Assessing the Sensitivity of Vegetation Cover to Climate Change in the Yarlung Zangbo River Basin Using Machine Learning Algorithms. Remote Sens. 2022, 14, 1556. [Google Scholar] [CrossRef]
  29. Bao, Z.; Zhang, J.; Wang, G.; Guan, T.; Jin, J.; Liu, Y.; Li, M.; Ma, T. The sensitivity of vegetation cover to climate change in multiple climatic zones using machine learning algorithms. Ecol. Indic. 2021, 124, 107443. [Google Scholar] [CrossRef]
  30. Shi, Y.; Jin, N.; Ma, X.; Wu, B.; He, Q.; Yue, C.; Yu, Q. Attribution of climate and human activities to vegetation change in China using machine learning techniques. Agric. For. Meteorol. 2020, 294, 108146. [Google Scholar] [CrossRef]
  31. Zhou, X.; Wen, H.; Zhang, Y.; Xu, J.; Zhang, W. Landslide susceptibility mapping using hybrid random forest with GeoDetector and RFE for factor optimization. Geosci. Front. 2021, 12, 101211. [Google Scholar] [CrossRef]
  32. Zhan, Y.; Fan, J.; Meng, T.; Li, Z.; Yan, Y.; Huang, J.; Chen, D.; Sui, L. Analysis on vegetation cover changes and the driving factors in the mid-lower reaches of Hanjiang River Basin between 2001 and 2015. Open Geosci. 2021, 13, 675–689. [Google Scholar] [CrossRef]
  33. Jiang, W.; Niu, Z.; Wang, L.; Yao, R.; Gui, X.; Xiang, F.; Ji, Y. Impacts of drought and climatic factors on vegetation dynamics in the Yellow River Basin and Yangtze River Basin, China. Remote Sens. 2022, 14, 930. [Google Scholar] [CrossRef]
  34. Yi, L.; Sun, Y.; Ouyang, X.; Yin, S. Identifying the Impacts of Climate Change and Human Activities on Vegetation Cover Changes: A Case Study of the Yangtze River Basin, China. Int. J. Environ. Res. Public Health 2022, 19, 6239. [Google Scholar] [CrossRef] [PubMed]
  35. Savitzky, A.; Golay, M.J. Smoothing and differentiation of data by simplified least squares procedures. Anal. Chem. 1964, 36, 1627–1639. [Google Scholar] [CrossRef]
  36. Jiang, W.; Yuan, L.; Wang, W.; Cao, R.; Zhang, Y.; Shen, W. Spatio-temporal analysis of vegetation variation in the Yellow River Basin. Ecol. Indic. 2015, 51, 117–126. [Google Scholar] [CrossRef]
  37. Peng, S.; Ding, Y.; Liu, W.; Li, Z. 1 km monthly temperature and precipitation dataset for China from 1901 to 2017. Earth Syst. Sci. Data 2019, 11, 1931–1946. [Google Scholar] [CrossRef]
  38. Jing, W.; Yang, Y.; Yue, X.; Zhao, X. A spatial downscaling algorithm for satellite-based precipitation over the Tibetan plateau based on NDVI, DEM, and land surface temperature. Remote Sens. 2016, 8, 655. [Google Scholar] [CrossRef]
  39. Wei, J.; Li, Z.; Lyapustin, A.; Sun, L.; Peng, Y.; Xue, W.; Su, T.; Cribb, M. Reconstructing 1-km-resolution high-quality PM2. 5 data records from 2000 to 2018 in China: Spatiotemporal variations and policy implications. Remote Sens. Environ. 2021, 252, 112136. [Google Scholar] [CrossRef]
  40. Oda, T.; Maksyutov, S. A very high-resolution (1 km × 1 km) global fossil fuel CO2 emission inventory derived using a point source database and satellite observations of nighttime lights. Atmos. Chem. Phys. 2011, 11, 543–556. [Google Scholar] [CrossRef]
  41. Yang, J.; Huang, X. The 30 m annual land cover dataset and its dynamics in China from 1990 to 2019. Earth Syst. Sci. Data 2021, 13, 3907–3925. [Google Scholar] [CrossRef]
  42. Theil, H. A rank-invariant method of linear and polynomial regression analysis. Indag. Math. 1950, 12, 173. [Google Scholar]
  43. Sen, P.K. Estimates of the regression coefficient based on Kendall's tau. J. Am. Stat. Assoc. 1968, 63, 1379–1389. [Google Scholar] [CrossRef]
  44. Jiang, L.; Bao, A.; Guo, H.; Ndayisaba, F. Vegetation dynamics and responses to climate change and human activities in Central Asia. Sci. Total Environ. 2017, 599, 967–980. [Google Scholar] [CrossRef] [PubMed]
  45. Liu, Y.; Li, J. Geographic detection and optimizing decision of the differentiation mechanism of rural poverty in China. Acta Geogr. Sin. 2017, 72, 161–173. [Google Scholar]
  46. Chen, Y.; Zhou, Y.; Zhang, H.; Wang, C.; Wang, X. Spatiotemporal variations of surface ozone and its influencing factors across Tibet: A Geodetector-based study. Sci. Total Environ. 2022, 813, 152651. [Google Scholar] [CrossRef] [PubMed]
  47. Breiman, L. Random forests. Mach. Learn. 2001, 45, 5–32. [Google Scholar] [CrossRef]
  48. Kohestani, V.; Hassanlourad, M.; Ardakani, A. Evaluation of liquefaction potential based on CPT data using random forest. Nat. Hazards 2015, 79, 1079–1089. [Google Scholar] [CrossRef]
  49. Sahin, E.K.; Colkesen, I.; Kavzoglu, T. A comparative assessment of canonical correlation forest, random forest, rotation forest and logistic regression methods for landslide susceptibility mapping. Geocarto Int. 2020, 35, 341–363. [Google Scholar] [CrossRef]
  50. Guyon, I.; Weston, J.; Barnhill, S.; Vapnik, V. Gene selection for cancer classification using support vector machines. Mach. Learn. 2002, 46, 389–422. [Google Scholar] [CrossRef]
  51. Zhang, L.; Luo, H.; Zhang, X. Land-Greening Hotspot Changes in the Yangtze River Economic Belt during the Last Four Decades and Their Connections to Human Activities. Land 2022, 11, 605. [Google Scholar] [CrossRef]
  52. Liu, C.; Liang, Y.; Zhao, Y.; Liu, S.; Huang, C. Simulation and analysis of the effects of land use and climate change on carbon dynamics in the Wuhan city circle area. Int. J. Environ. Res. Public Health 2021, 18, 11617. [Google Scholar] [CrossRef] [PubMed]
  53. Li, J.; Bi, M.; Wei, G. Investigating the Impacts of Urbanization on Vegetation Net Primary Productivity: A Case Study of Chengdu–Chongqing Urban Agglomeration from the Perspective of Townships. Land 2022, 11, 2077. [Google Scholar] [CrossRef]
  54. Du, J.; Shu, J.; Yin, J.; Yuan, X.; Jiaerheng, A.; Xiong, S.; He, P.; Liu, W. Analysis on spatio-temporal trends and drivers in vegetation growth during recent decades in Xinjiang, China. Int. J. Appl. Earth Obs. Geoinf. 2015, 38, 216–228. [Google Scholar] [CrossRef]
  55. Liu, L.; Wang, Y.; Wang, Z.; Li, D.; Zhang, Y.; Qin, D.; Li, S. Elevation-dependent decline in vegetation greening rate driven by increasing dryness based on three satellite NDVI datasets on the Tibetan Plateau. Ecol. Indic. 2019, 107, 105569. [Google Scholar] [CrossRef]
  56. Qu, S.; Wang, L.; Lin, A.; Zhu, H.; Yuan, M. What drives the vegetation restoration in Yangtze River basin, China: Climate change or anthropogenic factors? Ecol. Indic. 2018, 90, 438–450. [Google Scholar] [CrossRef]
  57. Liu, X.; Zhu, X.; Li, S.; Liu, Y.; Pan, Y. Changes in growing season vegetation and their associated driving forces in China during 2001–2012. Remote Sens. 2015, 7, 15517–15535. [Google Scholar] [CrossRef]
  58. Niu, X.; Li, Y.; Li, M.; Zhang, T.; Meng, H.; Zhang, Z.; Wang, B.; Zhang, W. Understanding vegetation structures in green spaces to regulate atmospheric particulate matter and negative air ions. Atmos. Pollut. Res. 2022, 13, 101534. [Google Scholar] [CrossRef]
  59. Rai, P.K. Impacts of particulate matter pollution on plants: Implications for environmental biomonitoring. Ecotoxicol. Environ. Saf. 2016, 129, 120–136. [Google Scholar] [CrossRef]
  60. Bai, L.; Jiang, L.; Yang, D.-y.; Liu, Y.-b. Quantifying the spatial heterogeneity influences of natural and socioeconomic factors and their interactions on air pollution using the geographical detector method: A case study of the Yangtze River Economic Belt, China. J. Clean. Prod. 2019, 232, 692–704. [Google Scholar] [CrossRef]
  61. Meng, X.; Gao, X.; Li, S.; Lei, J. Spatial and temporal characteristics of vegetation NDVI changes and the driving forces in Mongolia during 1982–2015. Remote Sens. 2020, 12, 603. [Google Scholar] [CrossRef]
Figure 1. Location of study area.
Remotesensing 15 05693 g001
Figure 2. DEM of study area.
Remotesensing 15 05693 g002
Figure 3. Workflow of this study.
Remotesensing 15 05693 g003
Figure 4. The average NDVI value of each impact factor at different categories. (aj) denote the mean NDVI values after classification of the 10 factors; the values on the graph indicate the mean NDVI values at different categories.
Remotesensing 15 05693 g004
Figure 5. The trend of vegetation NDVI change in the study area (2000–2020).
Remotesensing 15 05693 g005
Figure 6. Significance of vegetation NDVI change in the study area (2000–2020).
Remotesensing 15 05693 g006
Figure 7. Interactive detection of influencing factors in the study area. The values in the figure indicate the ability to explain vegetation greenness change after the interaction detection of two different factors.
Remotesensing 15 05693 g007
Figure 8. Pearson’s correlation coefficients of Pre-NDVI (2000–2020).
Remotesensing 15 05693 g008
Figure 9. Correlation coefficients of Pre-NDVI that pass the significance test (2000–2020).
Remotesensing 15 05693 g009
Table 1. Influencing factors to vegetation greenness change.
ClassCodeFactorsUnitSpatial ResolutionData Sources
ClimateX1Annual cumulative precipitation (Pre)0.1 mm1 kmhttp://www.geodata.cn/ accessed on 28 August 2022
X2Annual average temperature (Tem)0.1 °C1 km
X3Annual average wind speed (wind speed)m/s1 km
X4Annual average concentration of PM2.5 (PM2.5)μg/m31 km
HumanityX5Population density (PD)People/km21 kmhttps://hub.worldpop.org/ accessed on 18 September 2022
X6Annual average CO2 emissions (CO2 emissions)ton1 kmhttps://db.cger.nies.go.jp/dataset/ODIAC/ accessed on 25 October 2022
X7The land-use/land-cover (LULC)types30 mhttp://irsip.whu.edu.cn/resources/CLCD.php accessed on 8 November 2022
TopographyX8DEMm30 mhttps://e4ftl01.cr.usgs.gov/MEASURES/SRTMGL1.003/2000.02.11/ accessed on 8 November 2022
X9Aspect 30 m
X10Slope 30 m
Table 2. The q -value of factors influencing vegetation greenness changes from 2000 to 2020.
X1X2X3X4X5X6X7X8X9X10
q -value0.06550.23730.12480.09630.17400.06980.30130.24150.00130.1177
p-value0.00000.00000.00000.00000.00000.00000.00000.00000.00000.0000
Table 3. The q -value of factors influencing vegetation greenness change in 2021.
X1X2X3X4X5X6X7X8X9X10
q -value0.02550.18570.11520.07900.17790.10180.36490.21730.00130.1392
p-value0.00000.00000.00000.00000.00000.00000.00000.00000.00000.0000
Disclaimer/Publisher’s Note: The statements, opinions and data contained in all publications are solely those of the individual author(s) and contributor(s) and not of MDPI and/or the editor(s). MDPI and/or the editor(s) disclaim responsibility for any injury to people or property resulting from any ideas, methods, instructions or products referred to in the content.