Abstract
In order to achieve miniaturization, short-range radar (SRR) generally adopts millimeter-wave (MMW) radar with a frequency-modulated continuous-wave (FMCW) system, which may make the stop–go–stop assumption in traditional synthetic aperture radar (SAR) imaging algorithms invalid. In addition, in order to observe a large enough area, SRR often needs a wide radar beam, which may cause serious range–azimuth coupling when using SRR for SAR imaging. The above two problems may make the traditional SAR imaging algorithm invalid in SRR SAR imaging. Taking the SRR SAR imaging application into account, traditional frequency domain SAR imaging algorithms are analyzed and improved in this paper. Firstly, the intra-pulse motion (IPM) caused by the FMCW system and the two-dimensional coupling (TDC) in the case of a wide beam are analyzed. Subsequently, the applicability of the range Doppler algorithm (RDA), the frequency scaling algorithm (FSA) and the range migration algorithm (RMA) for SRR SAR is analyzed. Then, improvement measures are put forward to address the aliasing and folding phenomena caused by the wide-beam problem in the FSA and RMA, respectively. Finally, the effectiveness of the proposed algorithm is verified using simulation data and real measured data collected using an MMW radar fixed on a slide rail.
1. Introduction
Synthetic aperture radar (SAR) is a high-resolution imaging technology which has the properties of all-time and all-weather use. Early SAR was mainly used in space and in the air for battlefield reconnaissance, resource exploration, territorial surveys, ocean surveillance and other remote scenarios []. In recent years, with the continuous development of hardware and software technology, short-range radar has seen huge developments. At present, short-range radar (SRR) has become a necessary technology in human production and life, and is widely used in automobile safety, industrial automation, medical care, robotics, and security systems [,,,,]. Considering the advantages of SRR, with its high resolution and high precision in detecting and analyzing objects, researchers have gradually combined it with SAR imaging technology to produce SRR SAR, such as near-field mini-UAV SAR [,,,] and vehicle SAR []. This combination of technologies further broadens the field of SRR applications and is of important research value.
However, in order to achieve the characteristics of miniaturization, millimeter-wave (MMW) radar with an FMCW system [,,,] is generally used, which generally has a long pulse duration and produces a wider radar beam due to the micro-strip antenna. The above problems may make traditional imaging algorithms inapplicable.
Synthetic aperture technology relies on the relative motion between the radar array phase center (APC) and the target scene. Traditional SAR technology is generally based on the stop-and-go hypothesis; that is, the position change of the APC during signal transmission and reception is not considered. However, when the pulse duration is longer in a frequency-modulated continuous wave (FMCW) system, the position change is not negligible and can affect the accurate focusing of the scene. Papers [,] derived an FMCW SAR signal model and theoretically pointed out that continuous movement in the pulse of the aircraft carrier platform would cause an additional range migration term. The additional range migration value is related to the Doppler frequency, and based on this, an improved range Doppler algorithm (RDA) was proposed. Based on the same idea, the improved frequency scaling algorithm (FSA) [] and range migration algorithm (RMA) [] were proposed. Considering that the time domain algorithm has the best imaging accuracy and is not limited by the motion trajectory, the improved back projection algorithm (BPA) was proposed in [] to eliminate the IPM. Subsequently, a modified fast back projection algorithm (FBPA) [] was proposed to mitigate the problem of the low efficiency of the BPA proposed in []. However, its efficiency is still lower than that of the frequency domain algorithm. Thus, only the frequency domain algorithm is discussed for the pursuit of imaging efficiency in this paper.
Frequency domain imaging algorithms always have a certain dependence on the beam width of the radar. In order to make the energy more concentrated, a narrow beam is generally used in traditional long-range radar (LRR) for long-range detection, while a wider beam is always needed to achieve a wider coverage in SRR SAR. A wide azimuth beam may cause serious two-dimensional coupling (TDC), which will make the traditional SAR imaging algorithm ineffective. Previous studies mainly consider a low-frequency ultra-wideband (UWB) SAR system in the P or L band, which has quite a high fractional bandwidth and wide-beam characteristics. Due to the consideration of imaging efficiency and imaging accuracy, a nonlinear chirp scaling (NCS) algorithm suitable for a UWB SAR system is proposed in [] to eliminate the range-variant property of the quadratic coupling term and the range-invariant third-order coupling term; however, the range-variant properties of the third-order coupling term and the higher-order coupling term are ignored. To solve this problem, a generalized chirp scaling (GCS) algorithm is proposed in []. It is more suitable for a UWB SAR system because of the consideration of all higher-order coupling terms. However, the FSA should be used instead of the CS algorithm in an MMW SRR system with a Dechirp echo receiving mode. Ref. [] adopts the same idea as NCS to present a squint FSA considering the range-variant property of the quadratic coupling term. However, there are few reports on the higher-order coupling terms of the FSA in SRR. Furthermore, there is another issue in that the frequency scaling operation in the FSA may cause range frequency aliasing in some cases. Ref. [] points out the aliasing phenomenon in the squint mode and eliminates it by introducing a new residual video phase (RVP) item and a skew factor. For the wide-beam mode, whether the frequency scaling process will cause aliasing or not remains to be determined.
For SRR SAR systems, it is known that the signal carrier frequency is in the MMW band; this means that the fractional bandwidth is very small. Taking a typical 77 GHz MMW radar system as an example, even if its range bandwidth reaches 4 GHz, the fractional bandwidth can still be ignored. Therefore, although SRR has a wide azimuth beam, the degree of TDC is still unclear. When the degree of coupling is unknown, the RMA can be used. It is a more accurate frequency imaging algorithm that does not need to consider the high-order TDC terms due to directly processing in the spherical modulation phase. However, Stolt interpolation processing will cause range time domain folding because of the Dechirp system, especially in the case of a wide azimuth beam, so it is also not suitable for SRR SAR imaging. If the range azimuth coupling degree in SRR is small, the RDA and FSA can be greatly simplified to achieve SRR SAR imaging.
In order to obtain an imaging algorithm suitable for SRR SAR, in this paper, the echo property of SRR SAR signals is first analyzed based on the background of short-range millimeter-wave SAR imaging, including both the IPM caused by the continuous frequency modulation system and the TDC in the case of a wide azimuth beam. The negligibility of the IPM and high-order TDC term in SRR is pointed out. Subsequently, the RDA ignoring the higher-order coupling term is presented, and then the frequency aliasing problem caused by frequency scaling in the FSA and the time folding problem caused by Stolt interpolation in RMA are analyzed. Finally, the modified FSA and RMA suitable for SRR SAR are proposed by introducing a skew factor into the frequency scaling function directly and extending the range time domain before Stolt interpolation, respectively. In order to verify the feasibility of the proposed algorithm ignoring high-order coupling terms under a wide azimuth beam and the effectiveness of the proposed improved algorithm, both simulation data and real measurement data are used.
The rest of this paper is organized as follows. Section 2 introduces the geometry model of SRR SAR imaging. The details of IPM and TDC are also discussed in this section. In Section 3, the three SAR imaging algorithms for SRR SAR are described detail. The experimental results including simulation data and real measured data in W-band SRR SAR are provided in Section 4. Some discussions are made in Section 5. Section 6 provides a conclusion for the entire paper.
2. Modeling
2.1. SAR Imaging Geometry
This paper considers the application of SRR Mini-UAV SAR imaging. Figure 1 shows the broadside imaging geometry of stripmap SRR SAR under the ideal conditions. The Mini-UAV platform moves uniformly in a straight line along the direction parallel to the axis of X at a speed of V. H is the flight height of the platform. In the figure, O is the origin of the coordinate system of , and is the position of APC. The location can be expressed as , and represents any point target in the scene with the location as . The echo model under the FMCW system can be expressed as follows:
where represents the pulse duration, represents the carrier frequency, represents the frequency modulation slope, represents the fast time, represents the slow time, and represents the rectangular window. For a target with a range of , the echo can be expressed as follows:
where c is the speed of light, and represents the echo time delay. After receiving the echo, the FMCW SAR receiver mixes it with the reference signal to obtain the beat frequency signal, which is called the Dechirp. The reference signal can be the transmitted signal or its time delay version, which can be expressed as follows:
where is the reference range.
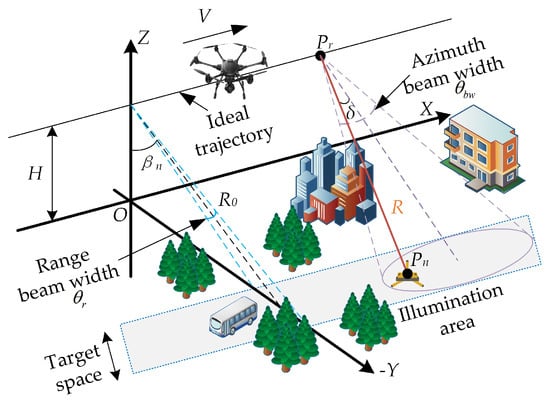
Figure 1.
Geometry of SRR SAR.
Making , the signal after the Dechirp can be expressed as follows:
where the first exponential term is the azimuth modulation term, the second exponential term is the range information term, and the third exponential term is the RVP term after the Dechirp. There is a certain skew of target echoes at different ranges after the Dechirp, which may inconvenience subsequent applications and need to be eliminated. It should be pointed out that the RVP term also disappears after the deskew process, and the whole process can be expressed as follows:
where and denote the Fourier transform and inverse Fourier transform, respectively; denotes the range frequency; and . After obtaining the echo model with RVP removed, the stripmap SAR signal model needs to be considered.
According to the geometric relation shown in Figure 1, the instantaneous slant range between the radar APC and the point target can be expressed as follows:
where represents the shortest slant range between the radar APC and the point target, also known as the zero Doppler slant range. The first-order Taylor expansion of the expression (6) at has
where the first term on the right side of the equation is the instantaneous slant range of the traditional pulse system SAR, and the second term is the primary term introduced by the FMCW system due to IPM. To simplify the analysis, the constant term in Equation (7) is expressed as , and the fast time coefficient of the second term is expressed as k. By substituting Equation (7) into (5), the SRR SAR echo model can be obtained as follows:
where . By observing Equation (8), it can be found that the influence of the last exponential term on the imaging is much smaller than the third exponential term according to the characteristics that in W-band FMCW radar. By ignoring the last exponential term, the SRR stripmap SAR signal model in the Dechirp receiving system after RVP removal can be obtained as follows:
2.2. Property Analysis of SRR SAR Echo
2.2.1. Analysis of IPM
It can be seen from Equation (9) that the IPM introduces an additional fast time term, and its coefficient is related to radar velocity, pulse duration and radar azimuth beam width. In order to better analyze for the IPM, the fast Fourier transform (FFT) is performed along the fast time in (9). After ignoring the amplitude, the intermediate frequency (IF) signal after range compression can be expressed as follows:
Observing Equation (10), it can be seen that the IPM will cause additional frequency offset . Considering the concrete expression of k in Equation (7), the following relation can be obtained:
where represents the instantaneous azimuth angle between the target and radar APC, and its value is limited by the azimuth beam width , and represents the instantaneous Doppler frequency. It can be seen that the frequency offset caused by IPM in FMCW SAR is approximately equal to the instantaneous Doppler frequency. Therefore, the range offset can be obtained as follows:
According to Equation (12), the range offset is time-varying throughout the synthetic aperture time, and its absolute value will reach the maximum at the beginning and end of the whole synthetic aperture time, and the largest range offset error is
From Equation (13), the maximum slant range introduced by the IPM over the entire synthetic aperture is . Obviously, in order to evaluate the effect of IPM, the ratio of to the range resolution is used. Dividing Equation (13) by the range resolution and expressing the result as , one can obtain
Equation (14) can be used to evaluate the effect of IPM. It can be found that is determined by the radar flight speed, pulse duration, radar wavelength, and azimuth beam width. In order to analyze the changes in IPM with radar parameters, Figure 2 shows the trend changes with azimuth beam width and flight velocity. Other parameters are shown in Table 1.
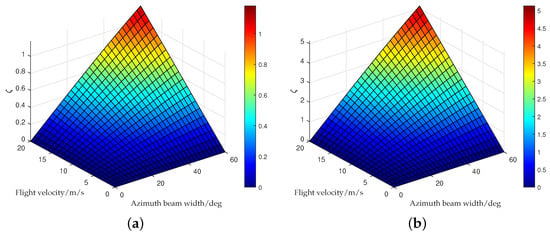
Figure 2.
The analysis for IPM in SSR SAR. (a) T_p = 0.23 ms; (b) T_p = 1.0 ms.

Table 1.
Parameters in the simulations.
It can be seen that is correlated positively with the velocity, pulse duration, and azimuth beam width. When is less than 0.5, the maximum slant range over the entire synthetic aperture does not exceed one range resolution cell, and the IPM can be neglected. Otherwise, we should consider it. Taking the typical SRR SAR parameters from Table 1 into account, the is more than 0.5. Therefore, the IPM is considered in the following derivation.
2.2.2. Analysis of TDC
A wide beam may cause serious TDC, which increases the complexity of subsequent imaging algorithms. However, for the W-band, although the bandwidth is up to several GHz, the fractional bandwidth generated is far less than 1, so the coupling in the case of wide-beam W-band needs to be further analyzed. Considering Equation (11), Equation (9) can be rewritten as follows:
Equation (15) needs to be transformed into the Doppler domain expression for the analysis of TDC. By using the Principle of Stationary Phase (POSP), one can obtain the stationary phase point as
Subsequently, the signal expression in the Doppler domain can be obtained as follows, utilizing .
where the first exponential term is the IPM term, and the last exponential term is a linear phase term, which is related to the azimuth location of the target. The second exponential term is spherical phase modulation, which can be approximated in some cases, such as the classical Fresnel approximation. For the SRR SAR, whether Fresnel approximation is valid needs further analysis. It should be noted that has no effect on coupling, so it is ignored in the above equation.
In order to analyze the degree of TDC in SRR SAR, the spherical modulation term (SMT) in Equation (17) is expanded at . One can obtain the following expression, where .
where the first term is the constant term, the second term is the range migration term, the third term is the quadratic range term, and the rest are higher-order terms. By observing Equation (18), it can be found that the product of modulation frequency and fast time is equal to the signal frequency, and its maximum value is half of the signal bandwidth. Under broadside conditions and the beam width not exceeding , the minimum value of is . It can be easily known by the derivative of the coefficient that the absolute value of the coefficient in high-order terms decreases monotonically with .
It can be seen that the maximum value of the higher-order coupling term will be determined by the signal bandwidth, beam width, carrier frequency, and zero Doppler slant. Ref. [] provides an indicator for evaluating high-order coupling degrees, which can be ignored when the maximum coupling term is less than . If the set of parameters in Table 1 is used, the value of the quadratic coupling term is about rad, and the value of the cubic coupling term is about rad. Obviously, the degree of the cubic coupling term is completely negligible in typical SRR SAR imaging applications, while the quadratic coupling term needs the further analysis. The following expression can be used to evaluate the degree of the quadratic coupling term.
where denotes the signal bandwidth. With the improvement in , , and , the relation in Equation (20) will be broken down. However, the quadratic coupling term can be compensated for easily by establishing a compensation function based on Equation (18). In typical SRR SAR imaging applications (Table 1), it can still be neglected.
3. The SRR SAR Imaging Algorithm
Three frequency domain algorithms for SRR SAR imaging are discussed in this section, combining them with the above analysis. In Section 3.1, the RDA is derived first for SRR SAR under the conditions without the quadratic and high-order coupling terms. Subsequently, the traditional FSA is derived and its problem in SRR SAR is analyzed and solved in Section 3.2. Finally, the traditional RMA is derived and its problem in SRR SAR is analyzed and solved in Section 3.3. The core steps of the imaging algorithm include range compression, range azimuth decoupling and azimuth compression. Due to the different phase histories of targets at different azimuth positions, decoupling generally needs to be transformed into the Doppler domain for unified processing. Therefore, the derivation of the three algorithms below will start from the signals in the Doppler domain.
3.1. The Range Doppler Algorithm
The RDA is the most classic and basic SAR imaging algorithm, its essence is a cascade of two one-dimensional filters. Because of its intuitive and efficient characteristics, it is still widely used in broadside, narrow-beam and low-resolution scenes. There are many kinds of RD algorithms, but some approximate relations are always taken into account, such as the RD algorithm using bulk range cell migration correction (RCMC), which ignores the range-variant property of the range migration curve, and the parabolic RDA using Fresnel approximation for azimuth compression. According to the analysis in Section 2.2.2, the higher-order term of TDC can be ignored in SRR SAR; therefore, Equation (17) can be written as
After ignoring the second- or high-order TDC terms, the imaging processing only needs to consider the IPM and range migration terms. The compensation function for IPM can be easily obtained as follows:
Since Equation (20) is not compressed, the echoes of targets at different ranges overlap together. In this case, a bulk RCMC function can be constructed based on the range migration expression in Equation (20) to realize the RCMC. In the case of low resolution and a narrow beam, range migration is not obvious, and the error caused by such processing is negligible, but for the SRR SAR, such processing will cause residual range migration of non-central targets, which will affect focusing. In that case, the RCMC needs to be realized through interpolation processing. After multiplying Equations (20) and (21), the IPM term is removed. Subsequently, range compression is carried out using range FFT. The signal after range compression is expressed as follows:
Range migration correction can be realized by Sinc interpolation of Equation (22). The relation between the new range frequency after interpolation and the range frequency before interpolation is expressed as follows:
The range compression domain and azimuth Doppler domain signal after RCMC using Sinc interpolation can be written as follows:
After Sinc interpolation, the range migration curve of the target is straightened; that is, the term in the function is eliminated. After RCMC correction, the azimuth matching filter is executed and azimuth inverse FFT (IFFT) is performed to obtain the SAR image. In parabolic RDAs, the first exponential term in Equation (24) can perform a Fresnel approximation of , and only the quadratic term is compensated for. However, in the case of a wide beam, that approximation is invalid, and the azimuth matching filter needs to be constructed in the following form:
The RDA using Equation (25) for azimuth matching is called Hyperbolic RDA. After azimuth compression, the final SAR image can be expressed as follows:
Equation (26) shows that after RDA the target is focused on the position. However, since the phase introduced by the reference range is not considered in the derivation of Equation (17), the focus position of the target in the actual processing is . The whole algorithm flowchart is shown in Figure 3.

Figure 3.
RDA for SRR SAR imaging.
3.2. The Frequency Scaling Algorithm
In order to achieve accurate RCMC, Sinc interpolation is performed in the RDA. In the FSA, the range-variant property of the range migration curve is removed by the frequency scaling operation, and then the Sinc interpolation operation can be replaced by bulk RCMC such that the efficiency will be greatly improved. In this section, the traditional FSA is derived, and then the problem in SRR SAR is analyzed and the improvement measure proposed.
3.2.1. The Traditional FSA
The FSA depends on the RVP term in the echo, so it needs to be derived from Equation (4). Firstly, rewriting Equation (4) and ignoring the irrelevant terms, one can obtain the following expression.
where ⊗ represents convolution. Utilizing the same method in Equations (15)–(17), one can obtain the range time and Doppler domain signal as follows:
For the convenience of derivation, the above expression is expressed in wave-number field form, i.e., , , , , . Then, Equation (28) can be rewritten as follows:
where the first exponential term is the expression of the IPM in the wave-number domain, while the third exponential term corresponds to the spherical modulation phase, which can be simplified as the following expression by first-order Taylor expansion according to Section 2.2.2.
To eliminate the range-variant property in coefficient term of , the frequency scaling operation is firstly performed in the FSA. The frequency scaling function is expressed as follows:
After ignoring the focusing independent term, the frequency scaled signal can be expressed as follows:
Then, Equation (32) is transformed from the domain to the domain by range FFT to eliminate the RVP item. , which means the range axis. The corresponding RVP compensation function is as follows:
The process of RVP elimination is same as Equation (5), and the wave-number domain signal after RVP correction can be expressed as follows:
The last exponential term is the quadratic term introduced by the frequency scaling and needs to be removed using the inverse frequency scaling (IFS); the IFS function is expressed as follows:
Multiplying Equations (34) and (35), the quadratic term will be removed and the following expression can be obtained.
Equation (37) is the IPM compensation function, and it can be directly multiplied with Equation (36) to eliminate the IPM.
From Equation (36), we can see that the range migration curve is only dependent on instead of in Equation (30), which means that the range-variant property of the range migration curve has been eliminated; therefore, it can be corrected using the bulk RCMC compensation function, whose expression is
The signal expression in the two-dimensional wave domain after IPM compensation and bulk RCMC can be written as follows:
Finally, the term in Equation (39) is compensated for by the azimuth matching filter, and the filter function can be expressed as follows:
After multiplying Equations (39) and (40), the range FFT and azimuth IFFT need to be executed in order to obtain the final SAR image. According to the time–frequency mapping relationship in FFT, one can know that the target is focused at .
By observing the expression in (31), one can know that the frequency scaling function will introduce extra signal bandwidth in the range direction. The absolute value of the extra bandwidth is
where is the signal bandwidth. Obviously, in the case of broadside and a narrow beam, the scaling factor is close to 1, and the range bandwidth introduced by the frequency scaling operation can be ignored. However, when the beam width increases, the will increase sharply, making the frequency of the final signal exceed the system sampling rate, causing range frequency aliasing. The existence of aliasing in the range frequency spectrum will cause the RCMC to be inefficient, leading to a defocused image. Therefore, the traditional FSA can only be used in the case of broadside and a narrow beam below 1 or even several degrees, but is not applicable in SRR SAR imaging.
3.2.2. The Proposed FSA
The FSA can be applied to FMCW wide-beam SAR if the range frequency aliasing caused by the scaling function can be eliminated. The existing literature proposes a solution to range frequency aliasing in the case of high squint. Firstly, the original RVP is removed, and then additional RVP terms are introduced using convolution. Finally, the scaling function is constructed according to additional RVP terms to achieve the purpose of reducing the signal bandwidth introduced by the frequency scaling. Obviously, such processing increases the unnecessary complexity. In order to reduce the extra signal bandwidth introduced by frequency scaling, the skew factor M is directly introduced into the frequency scaling function, that is, Equation (31), instead of introducing a new RVP item. The new scaling function has the following expression.
At this time, it can be found that the signal bandwidth introduced by the frequency scaling function is reduced M times, so after Equation (42)’s processing, Equation (32) also needs to be rewritten as
In the above equation, represents the corresponding azimuth term and constant term in Equation (32). It should be noted that the additional range quadratic term caused by the inconsistency between the new scaling function and the RVP term is ignored in Equation (43). After modifying the frequency scaling function, the corresponding RVP compensation function and IFS function also need to be modified. The expressions are shown in Equations (44) and (45).
The flowchart of the modified FSA for SRR SAR imaging is shown in Figure 4. The value of M can be selected according to the degree of aliasing, which means the proposed FSA is not limited by beam width and can be used in SRR SAR imaging.
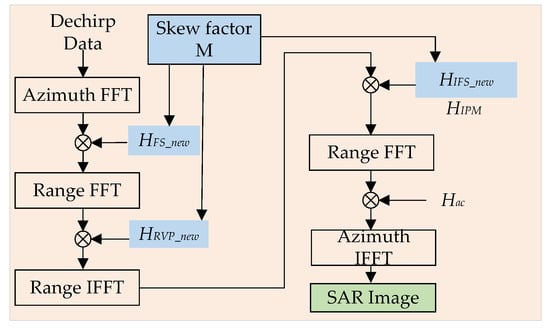
Figure 4.
The proposed FSA for SRR SAR imaging.
3.3. The Range Migration Algorithm
The RMA is a wave-number domain SAR imaging algorithm, and its frequency domain form is also called the algorithm. In the Dechirp system, the algorithm can directly process the removed RVP signal the same as the RDA, that is, Equation (17). Because it directly deals with the spherical phase modulation term in Equation (17), it is more accurate than the above two algorithms. In the following, the algorithm for time–frequency domain processing is introduced in detail, and the problem it faces in SRR SAR is analyzed and the improvement measure proposed.
3.3.1. The Traditional RMA
For the SRR SAR, the algorithm still needs to consider IPM when processing Equation (17). In order to avoid processing non-baseband data, the algorithm needs to establish a reference signal and adjust the data to the baseband signal, which is called bulk focusing. The compensation for IPM and the bulk focusing function can be written as follows:
where represents the slant range from the center of the scene. By multiplying Equations (46) and (24), the signal expression can be expressed as follows:
The result of the above operation is to remove the phase of the target at the reference range, such as IPM, range migration, higher-order TDC terms, and azimuth frequency modulation, which means that the target at the reference range can be effectively focused. However, the non-reference range target is only partially focused, so the second step is differential focusing by Stolt interpolation, which can directly decouple the SMT. For the Dechirp system, Stolt needs to be carried out in the range time domain and azimuth frequency domain. The corresponding mapping relation before and after Stolt interpolation can be expressed as follows:
According to Equation (48), the range time domain and azimuth frequency domain signal after Stolt interpolation can be expressed as follows:
By performing the range FFT and azimuth IFFT on Equation (49), we can obtain a similar expression as Equation (26), which is the final imaging result. However, the Stolt interpolation will have a problem in practical processing. By performing first-order Taylor expansion and making some simplification for the radical term in Equation (48), we obtain
Equation (50) can approximate the range time mapping relation before and after Stolt interpolation. Since the Dechirp echo is full time width in the range time domain, the range time domain scale transformation will cause range time folding. The folding phenomenon makes the decoupling process using Stolt fail in the range non-central target, leading to a defocused image. The folding phenomenon is not obvious in the case of a narrow beam below 1 or even several degrees; however, for the SRR SAR, the Stolt interpolation will cause severe folding, which seriously affects the subsequent imaging process.
3.3.2. The Proposed RMA
Through the analysis in Section 3.3.1, we know that the failure of traditional algorithms is due to the folding of the range time domain caused by Stolt interpolation. If the folding phenomenon can be eliminated, it can effectively solve the failure problem of traditional algorithms. There are various methods in existing research that address the issue of Doppler frequency domain aliasing in squint mode, such as frequency domain expansion or scaling operations. However, there are few reports on the range time domain folding problem caused by Stolt under wide-beam conditions. In this section, we propose a solution to solve this problem.
The folding phenomenon is caused by the full time width characteristic of the Dechirp system. If the full time width characteristic can be eliminated, the folding phenomenon will be alleviated or even disappear. Extending the range time domain before the Stolt interpolation is a feasible way to eliminate the full time width characteristic. It can be easily achieved by zero padding at both ends of the data. It is worth noting that the range time axis also need to be extended. Thus, the modified RMA for SRR SAR imaging can be obtained as Figure 5.

Figure 5.
The proposed RMA for SRR SAR imaging.
The scale of time domain expansion in the improved RMA can be calculated using Equation (50), and it can be adjusted based on the degree of time folding after Stolt interpolation. Due to the elimination of the range time folding, the proposed RMA can be used in SRR SAR imaging.
4. Results
This section reports some simulation and real data experiments to prove the effectiveness of the proposed algorithms. The simulation environment of the experiment was a Win10 operating system (i7-11800H CPU@2.3 GHz), the system memory was 32 GB, and the simulation software was MATLAB R2021b. The crucial simulation parameters are shown in Table 2. There are five ideal point targets in the scene, and the locations are (0 m, −18 m, 0 m), (−5 m, −18 m, 0 m), (5 m, −18 m, 0 m), (0 m, −14 m, 0 m), and (0 m, −22 m, 0 m), respectively. The first point target is located in the center of the scene.

Table 2.
Parameters in the simulations for SRR SAR imaging.
4.1. Range Doppler Algorithm
Firstly, the simulation experiment of the RDA was carried out. Figure 6 shows the range migration curve of the central target after RCMC. It can be seen that the existence of residual range migration is caused by IPM, and it disappears after IPM compensation. Figure 7 shows the imaging results before and after IPM compensation.
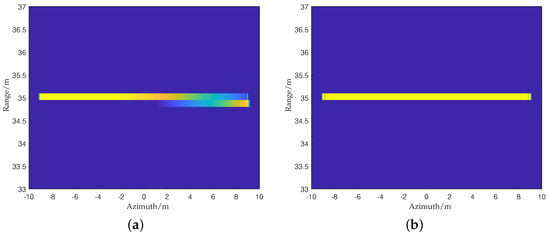
Figure 6.
The RCMC results of the central target in different cases: (a) without IPM compensation; (b) with IPM compensation.
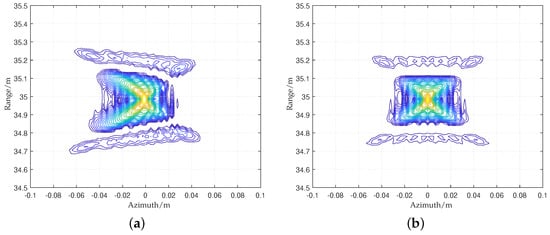
Figure 7.
The imaging results of the central target using the RDA in different cases: (a) without IPM compensation; (b) with IPM compensation.
As can be seen from the focusing results in Figure 7, the existence of the IPM will affect high-precision focusing, and the target is effectively focused after IPM compensation. It is worth noting that the final imaging results are reflected as non-orthogonal side lobes due to the non-orthogonal spectrum support region (Section 4.3). Since only the central target of the scene is considered, the RDA of the bulk RCMC is used in the above experiments.
Section 3.1 points out that for the FMCW wide-beam RDA, Sinc interpolation should be used for RCMC correction. Figure 8 shows the range migration curve of the target in the non-central target obtained using two kinds of RCMC methods.
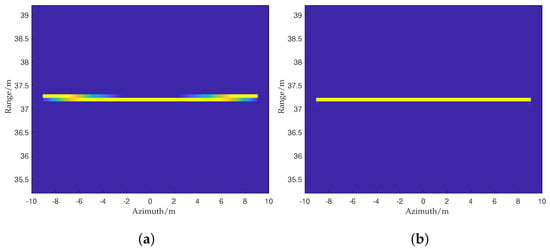
Figure 8.
The RCMC results of the non-central target using (a) bulk RCMC and (b) Sinc interpolation.
The bulk RCMC in Figure 8 does not completely correct the range migration of the non-central target, and its accuracy is lower than that of Sinc interpolation. Although the Sinc interpolation is inefficient due to the interpolation operation, it can be accelerated by calling the Sinc interpolation table. Table 3 gives the operation times of all RCMC methods, and it can be seen that the acceleration effect of calling the interpolation table is remarkable. The final focusing result is shown in Figure 9.

Table 3.
Efficiency comparison of two RCMC methods.
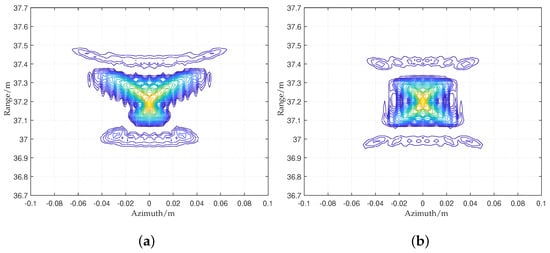
Figure 9.
The imaging results of the non-central target using the RDA in different cases: (a) bulk RCMC; (b) Sinc interpolation.
Figure 9 shows the focusing results of two kinds of RDAs. It can be seen that the target is effectively focused after the range migration is fully corrected. Table 4 gives the relevant indicators of range and azimuth profiles at the focusing center, including resolution (Res), peak side lobe ratio (PSLR), and integral side lobe ratio (ISLR).

Table 4.
The imaging indicators of the RDA.
From Table 4, it can be seen that the RDA discussed in Section 3.1 can accurately focus the five targets. It is worth noting that there are non-orthogonal side lobes in the focusing results. This result is caused by the non-orthogonal two-dimensional spectral support region, and a detailed illustration can be seen in Section 4.3.
4.2. The Frequency Scaling Algorithm
The effectiveness of the proposed FSA is analyzed and verified as follows, and the IPM is compensated for in the experiments. Figure 10 shows the range frequency aliasing caused by the frequency scaling operation in SRR SAR. The proposed FSA eliminates the aliasing by introducing a skew factor M, which can be adjusted according to the degree of aliasing. In the simulations, M was set to 40 and the aliasing was eliminated.
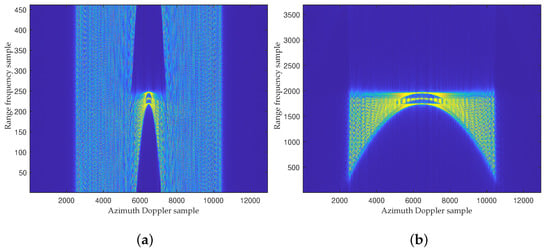
Figure 10.
The range frequency and Doppler domain after frequency scaling in different cases: (a) M = 1; (b) M = 40.
Figure 11 shows the RCMC results of the central and range non-central targets. In the following content, the range non-central target is denoted by the non-central target. It can be seen that the FSA can remove the range-variant property of the migration curves using a scaling operation instead of Sinc interpolation. The running time is similar to the bulk RCMC, but it has a higher imaging accuracy.
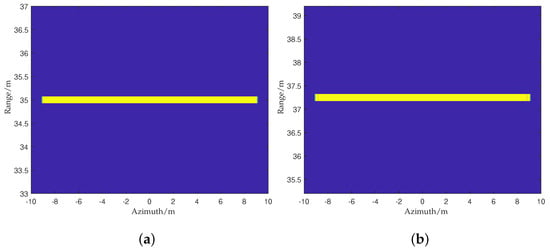
Figure 11.
The RCMC results of the (a) central and (b) non-central targets.
Figure 12 shows the comparison of the results focused using the traditional FSA and the proposed FSA. There is serious resolution loss and a certain amount of energy dispersion in the results focused using the traditional FSA due to range frequency aliasing.
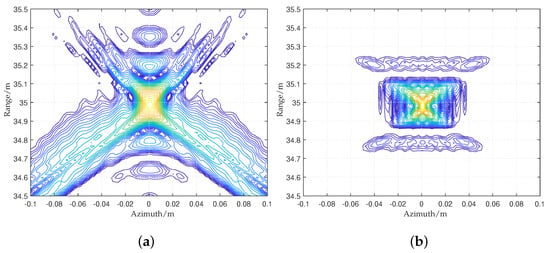
Figure 12.
The imaging results of the central target using (a) the traditional FSA and (b) the proposed FSA.
The proposed FSA can obtain good focus results because aliasing is avoided by introducing the skew factor. Figure 13 shows the imaging results of targets 4 and 5. For further analysis, the relevant indicators of the five targets are proposed in Table 5, where the SFSA denotes the proposed FSA.
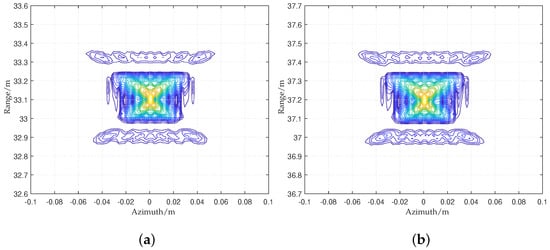
Figure 13.
The imaging results using the proposed FSA for (a) target 4 and (b) target 5.

Table 5.
The imaging indicators of the FSA.
The above experiments not only prove the effectiveness of the proposed FSA for eliminating the range aliasing, but they also prove that the FSA has a higher accuracy than the RDA using bulk RCMC and a higher efficiency than the RDA using Sinc interpolation. Furthermore, the introduction of the skew factor does not add extra computation, so it can be set flexibly.
4.3. The Range Migration Algorithm
There is no approximation for the spherical modulation phase in RMA; therefore, it has a higher imaging accuracy than the RDA and FSA. However, the wide-beam problem in SRR SAR will cause range time folding after performing Stolt interpolation. The proposed RMA avoids the folding by extending the range time domain before Stolt interpolation, thus achieving accurate imaging. Figure 14 shows the two-dimensional support region of the range time and Doppler domain before and after Stolt interpolation.
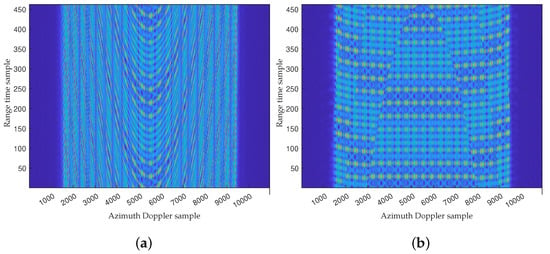
Figure 14.
The two-dimensional support region (a) before Stolt and (b) after Stolt.
Figure 14 shows that the two-dimensional support spectrum of the echo is a rectangular spectrum before Stolt interpolation with full time width. The full time width leads to range time folding after the Stolt interpolation operation, so a focused SAR image cannot be obtained. Figure 15 shows how the range time extension method solves the above problem. As can be seen from Figure 15, the folding phenomenon in the range time domain is eliminated, and the SAR image can be obtained directly using range FFT and azimuth IFFT. It should be emphasized that the shape of the support region has a serious non-orthogonal phenomenon as shown in Figure 15b. The following figure shows the focusing results of the range central and non-central targets obtained using the traditional RMA (Figure 16) and proposed RMA (Figure 17).
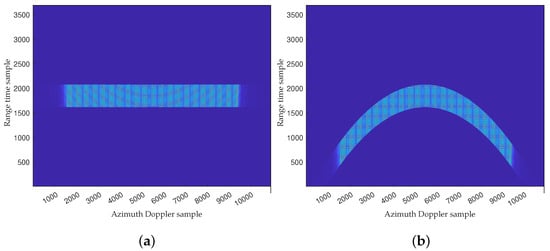
Figure 15.
The new two-dimensional support region (a) before Stolt and (b) after Stolt.
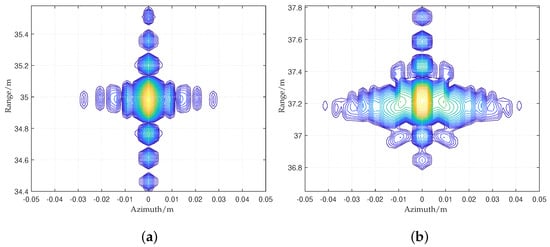
Figure 16.
The imaging results using the traditional RMA for (a) central and (b) non-central targets.
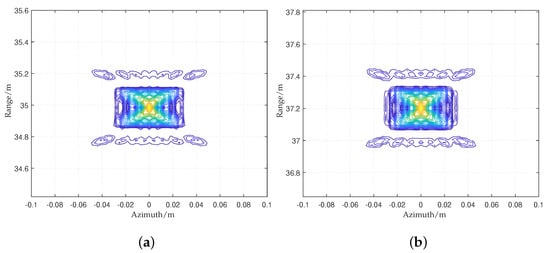
Figure 17.
The imaging results using the proposed RMA for (a) central and (b) non-central targets.
Due to the range time folding, the support region still maintains an orthogonal spectrum after Stolt; therefore, the focusing result will reflect orthogonal side lobes. Nonetheless, the Stolt is ineffective due to the range time folding. This phenomenon will result in the range migration curve of non-central targets being unable to be fully corrected, thus leading to defocusing. The proposed RMA can eliminate the range time folding and obtain the non-orthogonal spectrum after Stolt, which means a focused result with non-orthogonal side lobes.
Because the imaging model of the RMA is more accurate, the focusing results reflect better side lobe symmetry than the RDA and FSA. Table 6 shows the relevant indicators of the five targets, where the TRMA denotes the proposed RMA.

Table 6.
The imaging indicators of the RMA.
From Table 6, it can be seen that the traditional RMA can obtain an orthogonal result with two-dimensional indicators close to the theoretical values for central target imaging. However, the non-central targets are defocused due to range time folding. The proposed RMA can solve the range time folding and make the non-central targets focused.
All the above simulations have preliminarily confirmed the effectiveness of the proposed algorithm for SRR SAR imaging, also revealing that the SRR SAR has extremely high two-dimensional resolution and significant research value. This article analyzes three frequency domain algorithms, and Table 7 compares the various indicators of the results obtained using the three algorithms.

Table 7.
Comparison of algorithm performance.
From Table 7, it can be seen that the proposed FSA efficiency of the three algorithms is the highest, while the RMA is the most accurate but its efficiency is the lowest. The RDA is also limited in efficiency due to the use of Sinc interpolation processing.
4.4. Real Data Processing
In order to test the effectiveness of the proposed algorithm in practical applications, the FMCW MMW radar is fixed to the slide rail equipment for actual data collection. The RF front end of the MMW radar adopts the consumer AWR1642 development board on the market. There are three corner reflectors set in the scene, and the horizontal range of each corner reflector is 1 m; the rear two corner reflectors are 9 m away from the radar, and the front corner reflector is 8 m away from the radar.
Figure 18 shows the actual data collection scenario including the radar, slide rail device, and corner reflectors. The radar is powered by the mobile power supply, and the SAR echo data is stored on the onboard SD card through the signal acquisition board for offline processing. Table 8 shows the radar parameters used in the experiment. It is obvious that the uniform linear motion of the radar cannot be guaranteed in the actual experiment; thus, there may be azimuth defocusing in the imaging result. According to the analysis in Section 2.2.1, is about , which means the range migration caused by IPM is negligible.
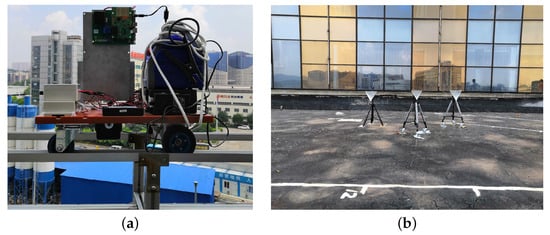
Figure 18.
The imaging results using the RMA for (a) central and (b) non-central targets.

Table 8.
Parameters of the SRR SAR system.
For the SAR data of the slide rail, the focusing results using the three algorithms are shown in Figure 19, Figure 20 and Figure 21. It can be seen that the three algorithms analyzed in Section 3 for SRR SAR can achieve accurate focusing on the three corner reflectors. It can also be seen that the imaging results of the proposed RMA and FSA are similar, and both are slightly better than the RDA, which may be caused by the fact that the RDA ignores the higher-order coupling term, and the Sinc interpolation may introduce some interpolation error. According to Figure 20, it can be seen that the traditional FSA cannot obtain well focused results due to frequency aliasing. The range resolution of the imaging results is m in each algorithm, while there is a certain level of defocusing in the azimuth direction due to the existence of a velocity error. Figure 20 shows that the results focused using the RMA and TRMA are similar. The reason maybe because of defocusing in the azimuth direction. Nonetheless, it can be clearly seen that the results in Figure 20a are orthogonal side lobes, while there is a non-orthogonal phenomenon in Figure 20b. For the proposed RMA, we will conduct Mini-UAV SRR SAR flight tests for further verification in the future.
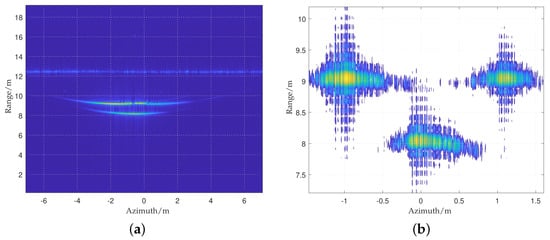
Figure 19.
The real data analysis. (a) Range compression results and (b) focusing results using the RDA.
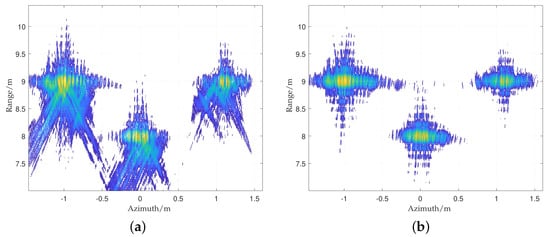
Figure 20.
The focusing results using (a) the traditional FSA and (b) proposed FSA.
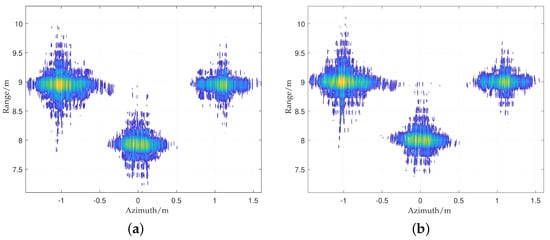
Figure 21.
The focusing results using (a) the traditional RMA and (b) proposed RMA.
5. Discussion
Three frequency domain imaging algorithms, RDA, FSA, and RMA, were discussed in Section 3 for SRR SAR, and the traditional FSA and RMA were modified for SRR SAR imaging. All three algorithms can effectively realize SRR SAR imaging. However, the imaging efficiency is different between them. For the RDA and proposed RMA, although Sinc and Stolt interpolation bring a huge amount of computation, the operation efficiency can be improved by calling the interpolation table and parallel computation. It should be noted that the computational cost of the proposed RMA increased exponentially due to data expansion. The proposed FSA algorithm had high efficiency without an interpolation operation, and the run time was the same as the traditional FSA; however, this was only because a skew factor was introduced.
6. Conclusions
In this paper, the IPM and TDC in SRR SAR imaging were analyzed and the criterion for ignoring them was provided. Based on this, three frequency domain algorithms for SRR SAR imaging were analyzed. Considering the wide-beam condition in SRR SAR, a modified FSA was proposed to eliminate the frequency aliasing caused by the traditional FSA; furthermore, a modified RMA was proposed to eliminate the range time folding caused by the traditional RMA. Compared with traditional imaging algorithms, simulation and measured data verified the effectiveness of the proposed algorithms.
All the analyses in this paper are based on the ideal uniform linear motion of a radar. In practical applications, the focusing failure of the algorithm will be caused by speed and positional errors of the radar platform in the SRR Mini-UAV SAR application. In this case, the proposed algorithms should be combined with corresponding motion compensation/autofocus algorithms; otherwise, the image focusing quality will be significantly degraded, including loss of geometric resolution and a reduction in contrast. Motion error will be reflected in the echo as an envelope error and a phase error, and phase errors have a significant impact on imaging due to the strong phase dependence of SAR imaging. Moreover, the relationship between electromagnetic wave translocation and phase can also reflect that when the wavelength is at the millimeter level, slight motion errors can lead to more serious phase errors. Therefore, for W-band SRR systems, motion compensation/autofocus algorithms are extremely crucial in practical applications. Therefore, the combination of the proposed algorithm and the motion compensation/autofocus algorithm will be the focus of our next work [,]. In terms of motion compensation/autofocus algorithms, we can use external devices such as GPS and IMU to obtain the real-time position of the radar and construct motion error compensation functions to achieve precise focusing. At the same time, we can also construct compensation functions by directly estimating error parameters in the echo.
Author Contributions
Conceptualization, F.Z., C.L. and Y.F.; methodology, F.Z. and C.L.; software, F.Z. and C.L.; validation, Y.F., W.Y., W.Z., R.Y. and S.Y.; formal analysis, F.Z. and C.L.; writing—original draft preparation, F.Z. and C.L.; writing—review and editing, Y.F., W.Y. and W.Z. All authors have read and agreed to the published version of the manuscript.
Funding
This research received no external funding.
Conflicts of Interest
The authors declare no conflict of interest.
References
- Tsokas, A.; Rysz, M.; Pardalos, P.M.; Dipple, K. SAR data applications in earth observation: An overview. Expert Syst. Appl. 2022, 205, 117342. [Google Scholar] [CrossRef]
- Cui, H.; Dahnoun, N. Real-Time Short-Range Human Posture Estimation Using MMW Radars and Neural Networks. IEEE Sens. J. 2022, 22, 535–543. [Google Scholar] [CrossRef]
- Lee, J.; Lee, H.; Ko, G.-H.; Baek, D.; Lee, H.L. Compact and Highly Efficient Short-Range Radar for Advanced Driver Assistant Systems. IEEE Trans. Veh. Technol. 2023, 72, 1629–1637. [Google Scholar] [CrossRef]
- Tavanti, E.; Rizik, A.; Fedeli, A.; Caviglia, D.D.; Randazzo, A. A Short-Range FMCW Radar-Based Approach for Multi-Target Human-Vehicle Detection. IEEE Trans. Geosci. Remote Sens. 2022, 60, 1–16. [Google Scholar] [CrossRef]
- Palm, S.; Sommer, R.; Janssen, D.; Tessmann, A.; Stilla, U. Airborne Circular W-Band SAR for Multiple Aspect Urban Site Monitoring. IEEE Trans. Geosci. Remote Sens. 2019, 57, 6996–7016. [Google Scholar] [CrossRef]
- Krčum, D.P.; Glavonjić, Đ.P.; Mihajlović, V.R.; Saranovac, L.V.; Milovanović, V.M.; Milosavljević, I.M. A fully integrated 2TX–4RX 60-GHz FMCW radar transceiver for short-range applications. Int. J. Electron. 2022, 110, 708–733. [Google Scholar] [CrossRef]
- Ding, M.-L.; Ding, C.-B.; Tang, L.; Wang, X.-M.; Qu, J.-M.; Wu, R. A W-Band 3-D Integrated Mini-SAR System with High Imaging Resolution on UAV Platform. IEEE Access 2020, 8, 113601–113609. [Google Scholar] [CrossRef]
- Kim, S.; Jeon, S.-Y.; Kim, J.; Lee, U.-M.; Shin, S.; Choi, Y.; Ka, M.-H. Multichannel W-Band SAR System on a Multirotor UAV Platform with Real-Time Data Transmission Capabilities. IEEE Access 2020, 8, 144413–144431. [Google Scholar] [CrossRef]
- Bekar, A.; Antoniou, M.; Baker, C.J. Low-Cost, High-Resolution, Drone-Borne SAR Imaging. IEEE Trans. Geosci. Remote Sens. 2022, 60, 1–11. [Google Scholar] [CrossRef]
- Kan, T.; Guo, X.; Liang, X.; Lin, Z. Implementation of Real-time Automotive SAR Imaging. In Proceedings of the 2020 IEEE 11th Sensor Array and Multichannel Signal Processing Workshop (SAM), Hangzhou, China, 8–11 June 2020; pp. 1–4. [Google Scholar]
- Meta, A.; Hoogeboom, P.; Ligthart, L.P. Signal Processing for FMCW SAR. IEEE Trans. Geosci. Remote Sens. 2007, 45, 3519–3532. [Google Scholar] [CrossRef]
- de Wit, J.J.M.; Meta, A.; Hoogeboom, P. Modified Range-Doppler Processing for FM-CW Synthetic Aperture Radar. IEEE Geosci. Remote Sens. Lett. 2006, 3, 83–87. [Google Scholar] [CrossRef]
- Liang, Y.; Wang, H.-X.; Xing, M.-D.; Bao, Z. The Analysis of FMCW SAR Signal and Image Study. J. Electron. Inf. Technol. 2008, 30, 1017–1021. [Google Scholar] [CrossRef]
- Wang, Y.; Qu, C.W.; Su, F.; Zhou, Q. Research on Range Migration Algorithm for FMCW SAR. J. Chin. Acad. Electron. Inf. Technol. 2008, 3, 478–482. [Google Scholar]
- Ribalta, A. Time-Domain Reconstruction Algorithms for FMCW-SAR. IEEE Geosci. Remote Sens. Lett. 2011, 8, 396–400. [Google Scholar] [CrossRef]
- Zhang, F.; Fu, Y.; Yu, R.; Sun, X. A Modified Fast Back-Projection Algorithm for mini-UAV-borne FMCW SAR Imaging. In Proceedings of the 2022 2nd International Conference on Electronic Information Engineering and Computer Technology (EIECT), Xi’an, China, 25–27 November 2022; pp. 415–419. [Google Scholar]
- Davidson, G.W.; Cumming, I.G.; Ito, M.R. A Chirp Scaling Approach for Processing Squint Mode SAR Data. IEEE Trans. Aerosp. Electron. Syst. 1996, 32, 121–133. [Google Scholar] [CrossRef]
- Zaugg, E.C.; Long, D.G. Generalized Frequency-Domain SAR Processing. IEEE Trans. Geosci. Remote Sens. 2009, 47, 3761–3773. [Google Scholar] [CrossRef]
- Yuan-bao, H.; Zhen-fang, L.; Bao, Z. High squint SAR data processing using a modified frequency scaling algorithm. Syst. Eng. Electron. 2003, 25, 1542–1546. [Google Scholar]
- Dong, L.; Guisheng, L.; Zhiwei, Y.; Qing, X. Frequency scaling algorithm for high squint FMCW-SAR imaging. J. XIDIAN Univ. 2013, 40, 21–28. [Google Scholar]
- Chen, J.; Xing, M.; Yu, H.; Liang, B.; Peng, J.; Sun, G.-C. Motion Compensation/Autofocus in Airborne Synthetic Aperture Radar: A Review. IEEE Geosci. Remote Sens. Mag. 2022, 10, 185–206. [Google Scholar] [CrossRef]
- Schorlemer, J.; Schulz, C.; Pohl, N.; Rolfes, I.; Barowski, J. Compensation of Sensor Movements in Short-Range FMCW Synthetic Aperture Radar Algorithms. IEEE Trans. Microw. Theory Technol. 2021, 69, 5145–5159. [Google Scholar] [CrossRef]
Disclaimer/Publisher’s Note: The statements, opinions and data contained in all publications are solely those of the individual author(s) and contributor(s) and not of MDPI and/or the editor(s). MDPI and/or the editor(s) disclaim responsibility for any injury to people or property resulting from any ideas, methods, instructions or products referred to in the content. |
© 2023 by the authors. Licensee MDPI, Basel, Switzerland. This article is an open access article distributed under the terms and conditions of the Creative Commons Attribution (CC BY) license (https://creativecommons.org/licenses/by/4.0/).