Article

Measuring the Multi-Scale Landscape Pattern of China’s Largest Archipelago from a Dual-3D Perspective Based on Remote Sensing

1
Key Laboratory of Coastal Science and Integrated Management, First Institute of Oceanography, Ministry of Natural Resources, No.6, Xianxialing Road, Qingdao 266061, China
2
School of Geography and Ocean Science, Nanjing University, Nanjing 210023, China
*
Author to whom correspondence should be addressed.
Remote Sens. 2023, 15(24), 5627; https://doi.org/10.3390/rs15245627
Submission received: 30 August 2023 / Revised: 23 November 2023 / Accepted: 29 November 2023 / Published: 5 December 2023

Abstract

:
Measuring the landscape pattern from a three-dimensional perspective is of great significance for comprehensively revealing the complex spatial characteristics of island ecosystems. However, the archipelago composed of rocky islands has received little attention as its three-dimensional landscape characteristics are difficult to quantify. This study took the largest archipelago in China, the Zhoushan Archipelago, as the study area and constructed an island landscape pattern evaluation model from a dual-three-dimensional (dual-3D) perspective. The model divided the island into upper and lower layers, namely the surface landscape based on topography and the landscape elements above the surface (i.e., vegetation and buildings), and then evaluated their landscape patterns from a three-dimensional perspective, respectively. The landscape pattern model based on a dual-3D perspective and multiple scales achieved excellent results in the archipelago. First, the island landscape pattern was evaluated from three-dimensional perspectives, including human interference, landscape fragmentation, vegetation space, and building space. Second, landscape indices such as the human interference three-dimensional index (HITI), the landscape fragmentation three-dimensional index (LFTI), the vegetation three-dimensional index (VTI), and the building three-dimensional index (BTI) established at multiple spatial scales revealed spatial heterogeneity within and between islands. Environmental factors such as elevation, slope, and island area exhibited significant correlations with them. There were significant differences in landscape pattern indices between the two-dimensional (2D) and the three-dimensional (3D) perspectives, and high values were mainly distributed in areas with significant topographic changes and larger islands. In addition, as the evaluation unit increased, the landscape indices increased, and HITI became more responsive to the transitions from 2D to 3D, while LFTI was the opposite. Therefore, the multiscale landscape pattern measurement of China’s largest archipelago based on high-resolution remote sensing was carried out from three-dimensional perspectives to accurately reveal the spatial heterogeneity.

1. Introduction

Islands are tiny terrestrial ecosystems that are part of marine ecosystems and have their own distinctive characteristics. Island ecosystems are distinguished by their distinct geographic position, peculiar topography, and intricate external stressors. As a result, they display features of independence, integrity, and fragility [1,2]. The term “island landscape pattern” refers to the external characteristics of various landscape elements that occupy and use the geographical space of islands. These characteristics can directly or indirectly reflect the ecological status of island ecosystems in terms of their composition, configuration, and function [3]. The uniqueness and typicality of island ecosystems are likely to result in different landscape pattern characteristics between islands and the mainland [4,5]. The independence and aggregation of the geographical distribution of islands are likely to result in differences in landscape patterns between islands [6]. Thus, spatial heterogeneity is the most notable characteristic of island landscape patterns. Owing to their evident geographic advantages, islands have been receiving increasing attention recently. The intensity of human activities and the utilization of island spaces have changed significantly. For example, while the effects of urban construction, industrial development, and tourism growth have increased, those of agricultural cultivation and fishery productivity have declined [7,8,9]. The spatial variability of island landscape patterns is highlighted by complex human activities, which destroy natural landscapes and yield artificial and fragmented landscapes [10]. Changing landscape types and patterns have significant impacts on island ecosystems, affecting ecosystem function and health, reducing ecological connectivity, causing habitat loss, and posing a serious threat to biodiversity [7,11].
The four important components of current research on island landscape patterns are landscape types and classification, landscape pattern indices and changes, ecological effects of human activities based on landscape patterns, and island ecosystem assessment based on landscape patterns. (1) Landscape types serve as the foundation for landscape pattern studies. They are frequently categorized using the same schemes as mainland regions. However, due to the limitations of island areas and the complexity of island landscapes, a more accurate classification of island landscapes can only be achieved by using more specialized and exact classification methods and systems than those used on the mainland. In terms of classification systems, most studies only chose simple primary landscape categories or directly used common land use and land cover types as landscape types [12,13]. Few studies have expanded or refined primary landscape categories according to research needs [14], and added secondary landscape categories that can reflect more detailed characteristics, thus revealing more detailed landscape information. (2) The spatial patch is the most common form of landscape pattern and is the result of the interaction of various disturbances. It affects the ecological processes and edge effects of regions [15,16]. Therefore, the identification and establishment of landscape pattern indices must incorporate a variety of spatial patch attributes, such as type, shape, size, quantity, and spatial combination. These attributes can reflect the spatial characteristics of landscapes in various aspects, such as fragmentation, separateness, diversity, and aggregation [17,18,19]. The spatial and temporal variation of island landscape patterns has received increasing attention. The way the spatial relationships between features interact throughout time may be demonstrated by comparing different landscape types or landscape indices [20,21]. Its pattern may be shown by changes in the landscape index and type throughout time [22,23,24]. (3) The impacts of human activity on island ecosystems, which are typically characterized by fragmentation, spatial heterogeneity, and connectivity of landscape patterns, have been described and analyzed qualitatively or quantitatively using the ecological effects of human activity based on landscape patterns [25]. Positive and negative effects of human activities on islands can be distinguished; however, in practice, the negative effects far outweigh the positive ones [26,27]. Negative human activities mainly include urban construction, transportation development, industrial and agricultural production, tourism development, and sea reclamation. Landscape patterns have been mainly characterized by an increase in fragmentation and a decrease in ecological connectivity [12,28,29]. Positive human activities mainly include afforestation, reforestation, and urban green space planning. The predominant trends in landscape patterns include a decrease in fragmentation and an increase in ecological connectivity [30,31]. (4) Ecological suitability, ecological health, and ecological security patterns are the three primary components of island ecosystem assessments based on landscape patterns. The term “ecological suitability” describes an island’s capacity to retain the structural and functional integrity of its ecosystem despite the presence of a variety of human development and utilization activities [30,32]. The vulnerability, sensitivity, and resilience of island ecosystems are closely related to their ecological health, which has attracted growing interest [33]. This is thought to be a thorough reflection of the state of various island components under the influence of numerous natural and anthropogenic factors [34,35]. Landscape ecological security patterns, such as landscape ecological networks or green infrastructure, are effective means of reducing landscape fragmentation, enhancing landscape connectivity, and maintaining ecosystem integrity and stability. Additionally, they provide a more interconnected network for the movement of species, allowing for larger life ranges and mitigating threats to biodiversity from human activities [4,36]. In summary, the studies on the landscape pattern of islands are mainly based on the two-dimensional (2D) perspective, and there are fewer studies from three-dimensional (3D) perspectives.
Compared with the three-dimensional perspective, there are two shortcomings in studies of island landscape patterns from two-dimensional perspectives. First, the landscape pattern analyses downplay the effects of the limited area and topographic variations on landscape space. Second, there is a disregard for the spatial properties of three-dimensional landscape elements, such as vegetation and buildings. In reality, island landscapes are made up of vertical and stereoscopic landscape elements in three dimensions, in addition to horizontal and flat landscape elements. Vertical landscape features may have a greater influence on the functions and processes of island ecosystems. Thus, to measure the landscape pattern of islands from three-dimensional perspectives, it is necessary to consider four important aspects: various landscape types, a distinctive topographic environment, vertical vegetation structure, and complex building space. However, previous studies can provide methodological references for conducting research on island landscape patterns from a three-dimensional perspective. Landscape-type studies provide methods for data processing that are convenient for combining with high-resolution three-dimensional data to carry out studies at different spatial scales. Landscape index and human impact studies provide methods for evaluating the degree of landscape pattern fragmentation and the intensity of human activities. Ecosystem assessment studies provide methods for the evaluation of landscape patterns to improve ecosystem connectivity and health.
Many landscape studies from three-dimensional perspectives have been carried out in urban areas. Firstly, different observation technologies, such as high-resolution satellite imagery [37,38], oblique photogrammetry [39], and laser point cloud technology [40,41], were used to obtain landscape element information, mainly including vegetation height [42,43], building height [37,38], vegetation three-dimensional structure [40,44], and building three-dimensional structure [45]. Then, landscape pattern indices were established based on landscape element information, such as three-dimensional building indices [37,45,46], three-dimensional vegetation indices [47], and three-dimensional landscape indices [48,49,50]. Three-dimensional landscape information and landscape indices provide a more comprehensive understanding of the spatial structure and organization of urban areas, which can better analyze the impact of urban form and buildings on the overall landscape. Furthermore, ecosystem assessments based on the characteristics of three-dimensional landscape elements were carried out [47,51]. Three-dimensional landscape ecological assessment can not only evaluate the urban heat island effect and sunlight distribution but also the visual aesthetics and residents’ and tourists’ perceptions of urban landscapes. Similar studies have been conducted on fewer islands [43,52,53]. The common point of these studies is that their study areas are small. It is easier to acquire and process three-dimensional landscape information in local areas or on small islands. However, it is difficult to apply similar methods to landscape studies on larger islands or island groups. Therefore, it is necessary to establish a three-dimensional perspective island landscape pattern model with applicability, accuracy, and comprehensiveness. The model could select easily accessible three-dimensional information about landscape elements, combine high-resolution landscape data with developed methods, and consider the impact of topography on the landscape.
To examine the multiscale spatial variation of island landscape patterns from a three-dimensional perspective, this study used the Zhoushan Archipelago, the largest archipelago in China, as the study area. First, island landscape types were visually interpreted using high-resolution remote sensing images and the hierarchical classification system (10 primary categories and 28 secondary categories). On this basis, a dual-3D landscape pattern model was built by combining the two-dimensional and three-dimensional information of topography, vegetation, and buildings. Then, the spatial characteristics and changes in landscape patterns from two perspectives (2D and 3D) and six spatial scales (five grid scales and one island scale) were thoroughly analyzed. The significance of the research results on island landscape patterns from three-dimensional perspectives was discussed. Correlations between landscape patterns and environmental factors at spatial scales were explored. Finally, the contributions and limitations of island landscape pattern studies from three-dimensional perspectives were discussed (Figure 1).
This study proposed the following hypothesis: compared with a two-dimensional perspective, the landscape pattern indices of islands undergo significant changes from a three-dimensional perspective. To verify this hypothesis, we proposed three scientific questions: (1) How can an island landscape pattern model be constructed from three-dimensional perspectives? (2) What are the spatial characteristics and changes of island landscape indices and their perspective differences at different spatial scales? (3) What are the environmental factors significantly correlated to the spatial characteristics of island landscape patterns? Island landscape pattern measurement from a three-dimensional perspective can accurately and efficiently reveal the spatial characteristics and changes of landscape patterns at multiple scales. The results can provide reasonable suggestions for government departments to conduct spatial planning and ecological protection on islands.
Abbreviations: 2D, two-dimensional perspective; 3D, three-dimensional perspective; HII, human interference index; HITI, human interference three-dimensional index; LFI, landscape fragmentation index; LFTI, landscape fragmentation three-dimensional index; VTI, vegetation three-dimensional index; BTI, building three-dimensional index; NP, number of patches; TE, total edge; AWMSI, area-weighted mean shape index; LII, landscape isolated index; VP, proportion of vegetation; BP, proportion of buildings; VVI, vegetation volume index; BVI, building volume index.

2. Materials and Methods

2.1. Study Area

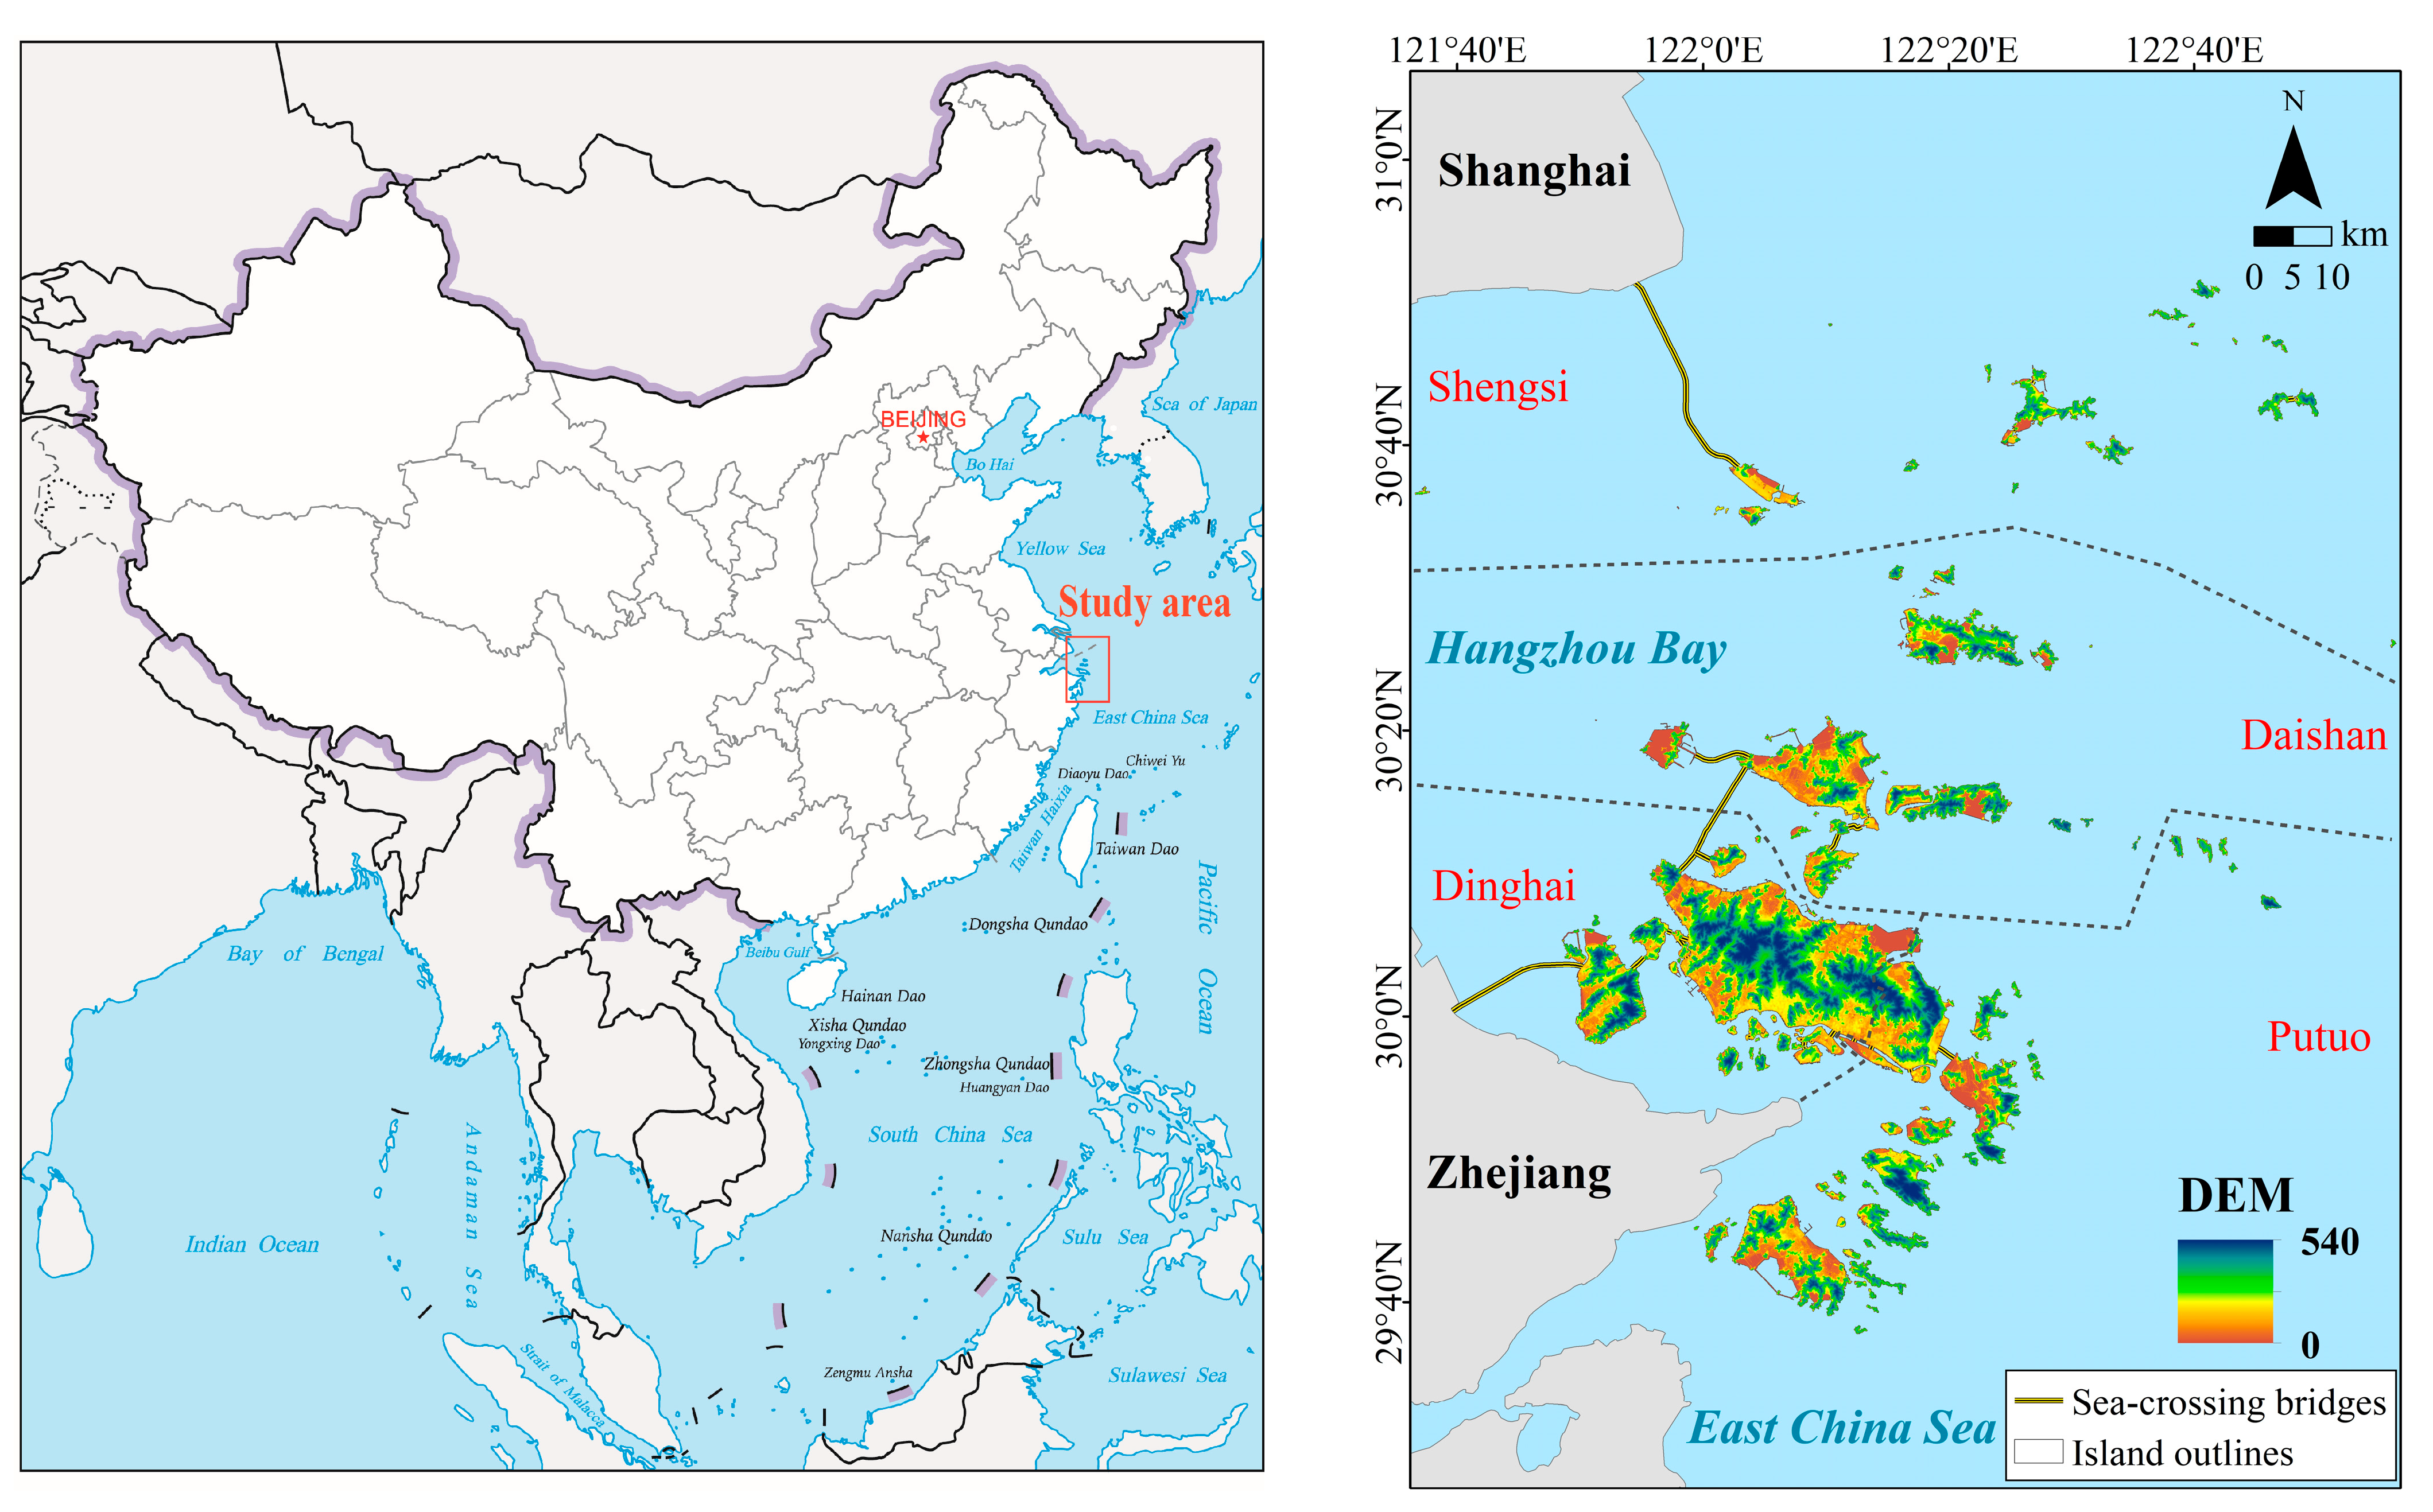
The Zhoushan Archipelago, located in the East China Sea on the south side of the Yangtze River estuary and on the outer edge of Hangzhou Bay, is the largest archipelago in China [1], with a total area of 22,200 km2, including a sea area of 20,800 km2 and a land area of 1440 km2 [1,54] (Figure 2). There are 2085 islands in the Zhoushan Archipelago, varying in size. Their spatial characteristics are as follows: more in number in the south and less in the north; larger in area in the south and smaller in the north; and higher in elevation in the south and lower in the north [55]. The archipelago’s proximity to the Zhoushan Fishing Ground not only provides access to abundant fish resources but also supports the local fishing industry, contributing to China’s food security and economy [56]. Additionally, its role as a habitat and stopover for migratory birds underscores its ecological significance and biodiversity [1]. The strategic location of the Zhoushan Archipelago, with easy access to maritime trade routes and major ports, positions it as a key hub for maritime transportation, logistics, and trade activities in the East China Sea [9]. This plays a crucial role in facilitating international and domestic trade and contributes to the region’s economic development [10]. Furthermore, the archipelago’s focus on the blue economy, including renewable energy generation, aquaculture, and marine research, reflects its commitment to sustainable development and environmental conservation. Initiatives such as wind farms not only contribute to clean energy generation but also support the growth of the renewable energy sector in China [56,57]. With beautiful scenery, charming beaches, and cultural heritage, the Zhoushan Archipelago has become a popular tourist destination [1,9]. Moreover, the thriving tourism industry driven by the archipelago’s scenic beauty, beaches, and cultural heritage has not only boosted local income and employment opportunities but also facilitated cultural exchanges, benefiting both the local community and the national economy [32,58]. Overall, the Zhoushan Archipelago’s unique combination of fisheries, ports, and tourism forms a solid foundation for economic development, making it a crucial contributor to regional and global progress while serving as a model for sustainable and inclusive growth [9,54]. The Zhoushan Archipelago is indeed a remarkable region with significant economic and environmental importance. Its vast area, rich marine resources, and strategic location make it a vital part of China’s maritime landscape.
Based on their social attributes, the islands of the Zhoushan Archipelago are categorized into inhabited and uninhabited islands [55]. Inhabited islands have registered residential addresses, while uninhabited islands do not [55]. The landscape patterns between these two categories differ significantly. Uninhabited islands are less influenced by human activities and thus maintain a more natural landscape, often displaying simple landscape patterns [59]. On the other hand, inhabited islands are affected by both natural factors such as climate change and human activities of various types and scales, resulting in complex landscape patterns [26,28]. As a result, the inhabited islands reflect the three-dimensional spatial characteristics of the study area. For this study, all the inhabited islands of the Zhoushan Archipelago were chosen as the focus area due to their complexity and the interplay of natural and human influences.

2.2. Data Source

2.2.1. Remote Sensing

Four types of remote sensing data were adopted in this study. First, aerial remote sensing images were taken in the summer of 2018 with a spatial resolution of 0.5 m × 0.5 m. They were sourced from the Guangzhou Urban Planning Survey and Design Institute. These images were primarily used for visual interpretation to obtain data on island outlines and landscape types. Second, the digital elevation model data with a spatial resolution of 5 m × 5 m was obtained from the Institute of Remote Sensing and Digital Earth, Chinese Academy of Sciences. This data was used to extract and calculate landscape information and topographic factors, such as elevation, slope, and aspect. The forest canopy height data had a spatial resolution of 30 m × 30 m and was derived from the global forest canopy height data obtained from the Global Ecosystem Dynamics Investigation (GEDI) [60]. It provided information about the height of vegetation in the study area. Finally, the combination of aerial remote sensing images, Baidu Street View maps, and public community data was used for manual interpretation. The goal was to obtain the average number of floors in each building patch, and then the building height was calculated according to an average building height of 3 m. These different types of remote sensing data were analyzed and processed using ArcGIS 10.6.

2.2.2. Field Survey

Field surveys were conducted in September 2020 and September 2022, respectively. The sampling sites were set on islands with high accessibility, that is, islands that can be reached through sea-crossing bridges or routine ships [6]. Within the islands, the sites were generally distributed following a grid sampling pattern [61], and the factual sampling sites were modified in accordance with the on-site conditions. Finally, a total of 289 sites were investigated on 32 islands. At each site, information about location, elevation, landscape type, vegetation, and building were recorded. By combining the field survey data, this study validated the island outline, landscape type, forest canopy height data, and building height data for further stages of analysis and processing.

2.3. Island Landscape Type Classification System

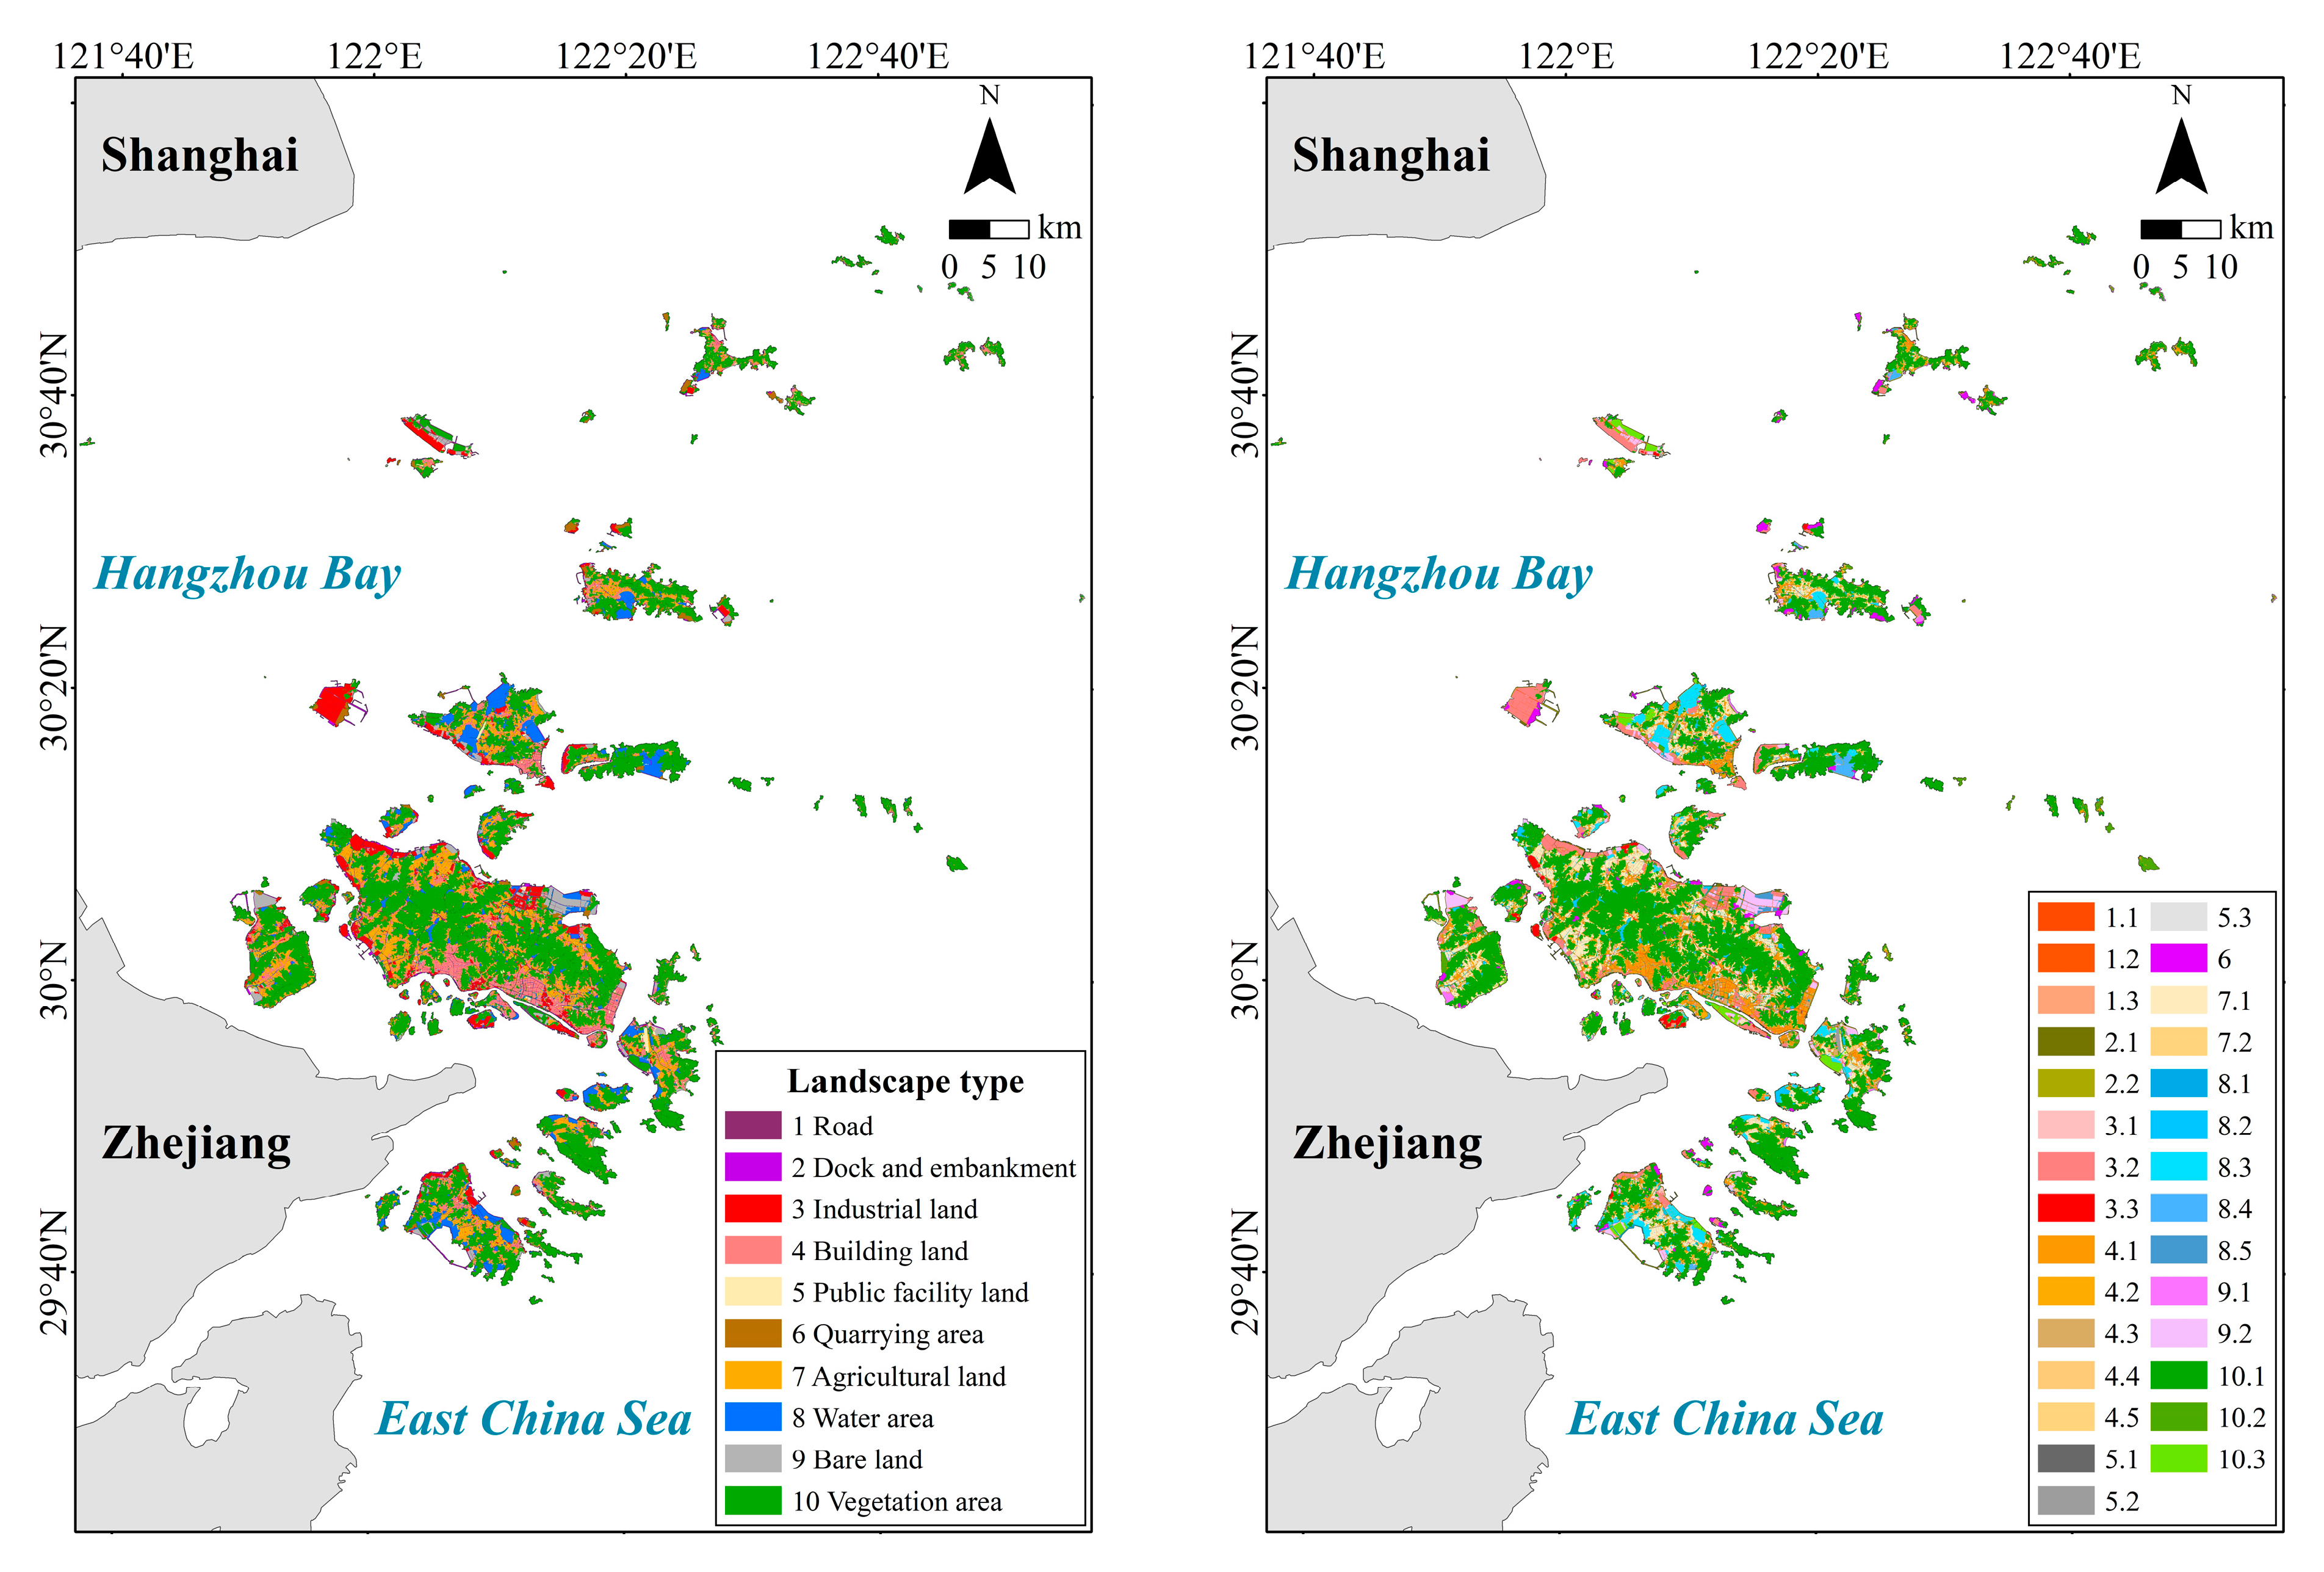
Referring to a previous island landscape classification system [28], this study adopted a classification system for island landscape types with hierarchical characteristics, including 10 primary categories and 28 secondary categories (Table 1). The visual interpretation method was chosen for the landscape classification, which was combined with high-resolution aerial remote sensing images to ensure the classification accuracy of landscape types. These types were classified based on surface characteristics, meaning that each type has its own unique spectrum, position, and shape compared to the others. The ten primary types included roads, docks and embankments, industrial land, construction land, public facility land, quarrying area, agricultural land, water area, bare land, and vegetation area. The 28 secondary types were determined by their function or genesis. These types are conducive to refining the human interference activities and landscape functions of islands, combining topographic, vegetation, and building data, and serving the evaluation of the three-dimensional landscape pattern. Roads were categorized into three types. Asphalt roads refer to the main roads within the urban area and connecting the towns, which are relatively wide and long. Their function is to connect the urban area and the main town centers. Cement roads refer to the main roads on the edges of urban areas and inside townships, which are narrower and shorter and serve as connections between the suburbs and the interior of towns. Dirt roads refer to temporary roads pending development or during the construction of public facilities. Docks and embankments have similar locations and spectra. The main function of the former is transportation, while the main function of the latter is to resist coastal erosion and intercept water storage. Industrial lands were divided into clean energy industry land, ordinary industry land, and tank farmland. The clean energy industry is mainly distributed in mountainous areas for wind power generation. The ordinary industry mainly refers to manufacturing enterprises along the coastline, and the tank farm refers to the area occupied by oil tanks, gas tanks, and industrial tanks. Building lands were divided into five categories based on their functions: residential, educational, commercial, tourism, and temporary. Residential buildings mainly refer to urban buildings and land for self-built houses in townships. Educational buildings mainly refer to the land used for universities and high schools. Commercial buildings mainly refer to the land used for shopping malls and urban office buildings. Tourism buildings mainly refer to the construction land within scenic spots. Temporary buildings mainly refer to the land for temporarily erected movable houses. Public facility lands were divided into structured facility land, unstructured facility land, and parking lot land based on appearance and function. Public facility land refers to public facilities with structures, including park facilities, sports stadiums, and cemeteries. Structured facility land refers to artificial impermeable land without buildings and facilities, including squares, sun yards, and land to be constructed. Parking lot land is an outdoor facility that is frequently used and has a significant impact on the environment. Quarrying area refers to a mountain that has been excavated for stone. Agricultural land includes two types: cultivated land and garden land. The former mainly refers to farmland in plain areas, while the latter mainly refers to orchards and tea gardens in hilly areas. There are five subtypes of water areas. Natural water areas are widely distributed ponds and waterways with irrigation, drainage, or landscape functions. Reservoirs are used for collecting rainwater and storing drinking water. Aquaculture ponds are aquaculture ponds distributed in coastal areas. Harbor basins are auxiliary water areas of large docks used for berthing ships. Temporary water areas are unused land covered by water after reclamation. Bare lands were divided into natural bare land and artificial bare land. The former mainly refers to the exposed rocks in the coastal area, while the latter mainly refers to the exposed soil inside the island. Vegetation areas were divided into three categories: woodland, grassland, and wetland. Wetlands, grasslands, and woodlands are distributed sequentially from the coastline to the interior of the islands and from the plains to the mountains. Therefore, various types of island landscapes were obtained, almost all of which were formed or influenced by human activities. During the visual interpretation process, areas where remote sensing data could not fully determine specific landscape types were marked for verification during the field survey. Landscape classification was performed using ArcGIS 10.6. The results were displayed with a total of 52,117 spatial patches (Figure 3 and Table 1).

2.4. Dual-3D Island Landscape Pattern Model

2.4.1. First 3D

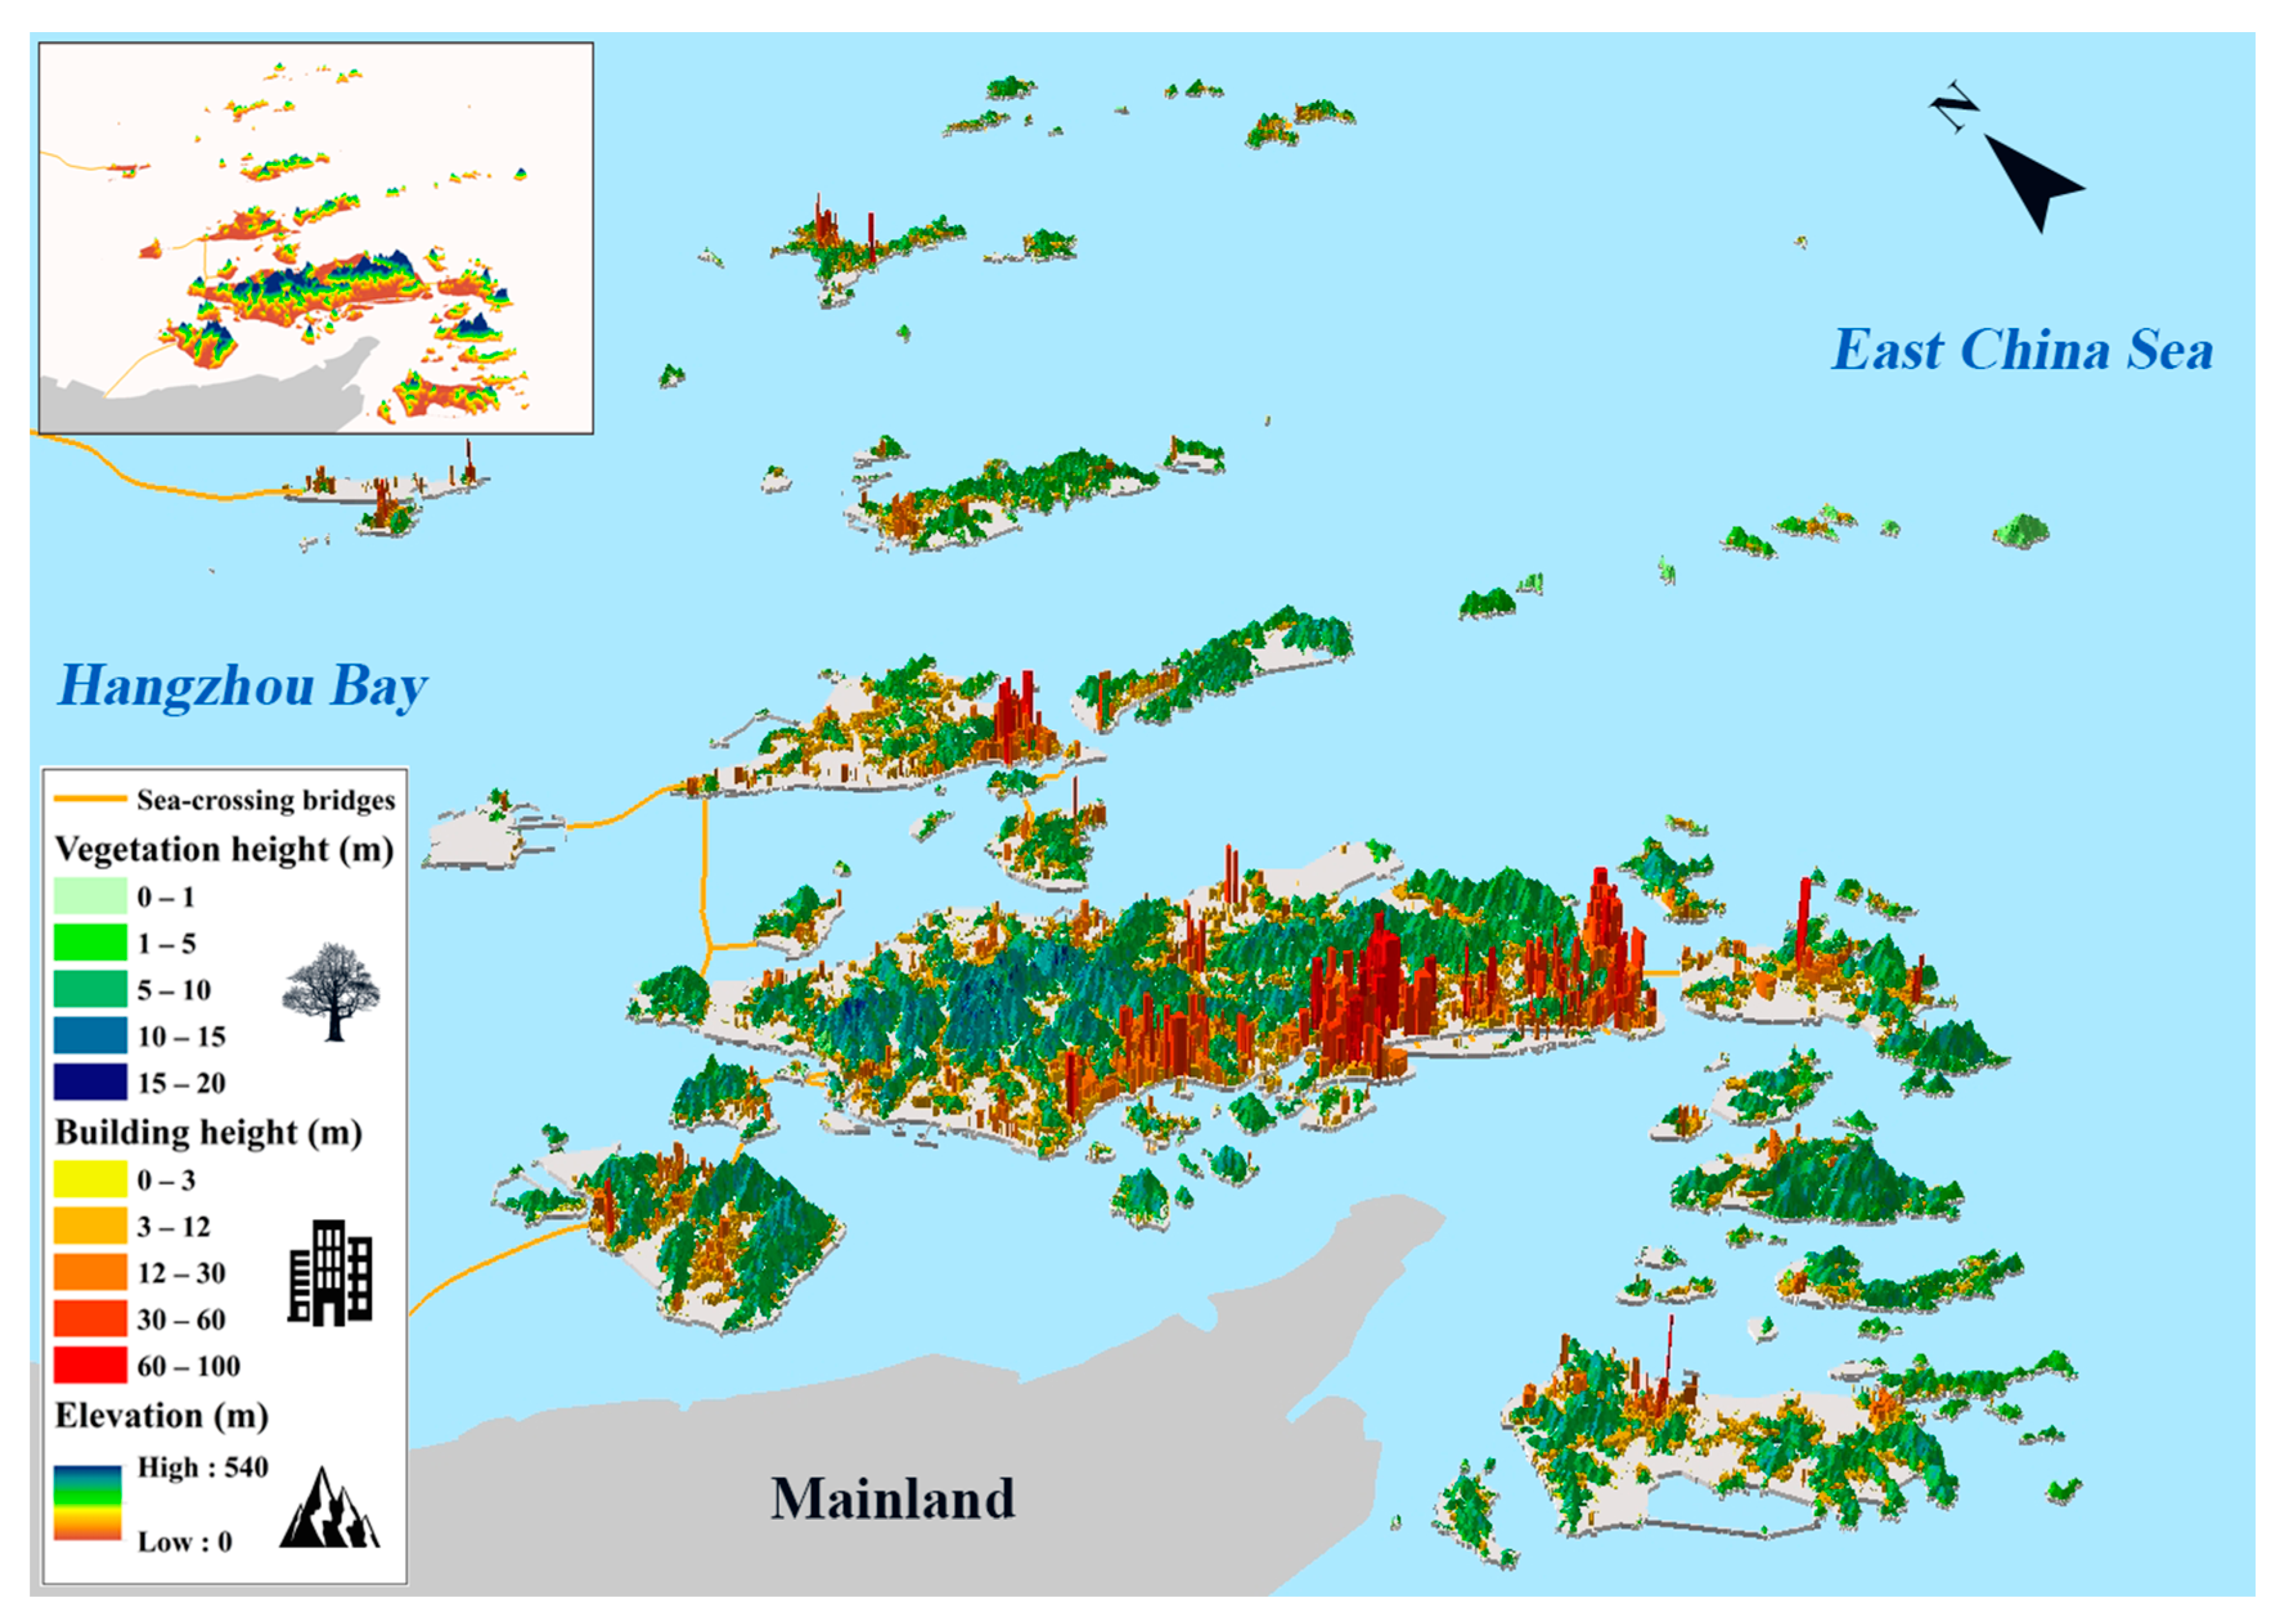
The first 3D perspective represents the 3D topography (Figure 4). The most obvious three-dimensional characteristic of island landscapes is complex topography. The dependence of landscape patterns on topographic changes is one of the main influencing factors in species distribution [62]. Based on three-dimensional topography, there will be significant changes in the attributes of landscape patches, such as surface area and edge length. This can affect the validity and accuracy of landscape pattern analysis. Therefore, to explore the impact of topography on patch areas, we calculated patch areas from 2D and 3D perspectives and quantified the differences using area change rates. The area change rate (ACR) was established and calculated in ArcGIS 10.6. High ACR areas are greatly affected by topography and should be given special attention in landscape pattern analysis.
First, the human interference index (HII) and landscape fragmentation index (LFI) were established based on landscape patches and types in landscape studies [26,63]. They were used to evaluate the intensity of human activity interference and the comprehensive status of landscape fragmentation. However, they were established based on two-dimensional perspectives, and the differences between plane area and surface area affected by topography were not considered. Therefore, based on the existing methods [26,63], the surface area was used to establish the human disturbance three-dimensional index (HITI) and the landscape fragmentation three-dimensional index (LFTI) in the three-dimensional perspective of topography. Then, the perspective difference analyses of landscape indices were carried out. The perspective differences of the human interference index (ΔHITI) and landscape fragmentation index (ΔLFTI) were calculated. These indices were used to analyze the spatial characteristics of island landscape patterns and their changes from a three-dimensional topographic perspective. The calculation methods of HII and HITI and influence coefficient (IC) assignments refer to previous studies [63] and use Equations (1) and (2). The LFI and LFTI integrated four landscape fragmentation factors, i.e., the number of patches (NP), total edge (TE), area-weighted mean shape index (AWMSI), and landscape isolation index (LII), which represent patch fragmentation, edge effect, shape complexity, and patch isolation, respectively. These factors were calculated by referring to the existing related studies [63], where the area parameters used plan area and surface area, respectively. Then, they were standardized using Equation (3) (Figures S2–S11). Considering that the influence of each factor was comparable, equal weight values were assigned. The calculation methods were shown in Equations (4) and (5). The indices were calculated using ArcGIS 10.6.
H I I = L A i × I C i T A × 100
H I T I = L S A i × I C i T S A × 100
where the LAi and LSAi denote the plan area and surface area of landscape type i, respectively. The TA and TSA denote the plan area and surface area of evaluation units from the 2D and 3D perspectives, respectively. The ICi denotes the influence coefficient of landscape type i. All landscape types were considered in the calculation process.
V s t = V i V m i n / V m a x V m i n
where Vst is the standardized value of a factor, Vi is the original factor value. Vmax and Vmin are the 95th and 5th percentiles of the factor values, respectively, indicating the upper and lower limits, respectively. If Vst < 0, then Vst = 0, and if Vst > 1, then Vst = 1. All factors were standardized to an interval of 0–1.
L F I = ( N P s t 1 + T E s t 1 + A W M S I s t 1 + L I I s t 1 ) / 4
L F T I = ( N P s t 2 + T E s t 2 + A W M S I s t 2 + L I I s t 2 ) / 4
where the subscripts st1 and st2 denote the standardized values of factors from the 2D and 3D perspectives, respectively.

2.4.2. Second 3D

The second 3D perspective represents landscape elements above the surface (Figure 4). Landscape elements are usually regarded as flat landscape patches, whereas they are three-dimensional spaces with complex vertical characteristics, such as height and volume. It is difficult to unify the complex structures and various types of landscape elements. After simplifying the features, grouping the types, and unifying the attributes of landscape elements, natural landscapes dominated by vegetation and artificial landscapes dominated by buildings are the most important three-dimensional landscape elements [47,49]. Thus, in the dual-3D island landscape pattern model, the second 3D perspective mainly refers to vegetation and buildings. Therefore, this study combined the 2D and 3D characteristics of vegetation and buildings and established the vegetation three-dimensional index (VTI) and the building three-dimensional index (BTI), respectively. From a three-dimensional perspective, the vegetation area proportion index (VP) and vegetation volume index (VVI) were established for calculating VTI. They represent the vegetation area and vegetation volume of each evaluation unit, respectively. Similarly, from a three-dimensional perspective, the building area proportion index (VP) and building volume index (VVI) were established for calculating BTI. They represent the building area and building volume of each evaluation unit, respectively. VP, VVI, BP, and BVI were calculated using Equations (6)–(9). They were standardized and then combined with the equal weight method to calculate VTI and BTI (see Equations (10) and (11)). The standardized method was the same as that described above (Figures S12–S15). The indices were calculated using ArcGIS 10.6.
V P = L S A i T S A
V V I = L S A i × H i T S A
B P = L S A j T S A
B V I = L S A j × H j T S A
where the LSAi, Hi, LSAj, Hj, and TSA denote the area of vegetation patches, height of building patches, area of vegetation patches, height of building patches, and total area of evaluation units from 3D perspectives, respectively.
V T I = V P S t + V V I S t / 2
B T I = B P S t + B V I S t / 2
where the VPSt, VVISt, BPSt, and BVISt denote the standardized VP, VVI, BP, and BVI, respectively.

2.5. Spatial Scale

2.5.1. Scale Establishment

Spatial scale is an essential analytical unit in landscape ecology research from a two-dimensional perspective, which may have an impact on landscape analysis from a three-dimensional perspective [62]. Spatial scale is conducive to establishing the connection between landscape indices and evaluation units, further exploring scale effects, and determining the optimal evaluation unit [63]. Islands are inherently characterized by multiple spatial scales. Six spatial scales were established by synthesizing the scope of the study area and the internal ecological characteristics of islands, i.e., five grid scales and one island scale. The five grid scales were 100 m × 100 m, 200 m × 200 m, 300 m × 300 m, 400 m × 400 m, and 500 m × 500 m, respectively. The grid scales were created using the Create Fishnet tool in ArcGIS 10.6, and the island scale was obtained from island outlines. Then, connections between the spatial scales and landscape indices were established. At different spatial scales, the landscape indices, including human disturbance, landscape fragmentation, vegetation space, and building space, were calculated while considering two perspectives. Landscape indices were uniformly graded at each spatial scale, and the index values of 0–0.2, 0.2–0.6, and 0.6–1 were classified as low-, medium-, and high-level, respectively.

2.5.2. Scale Analysis

The spatial characteristics of landscape indices and their perspective differences at different spatial scales were analyzed. Furthermore, the changing characteristics of island landscape patterns with an increase in evaluation units can be obtained. Based on this, spatial matching analyses of landscape pattern indices were carried out at the grid scale and the island scale, respectively. They help to suggest landscape pattern optimization and ecological protection for different island groups and the entire archipelago. Then, connections between spatial scales and environmental factors were established. Correlation analyses between landscape indices and environmental factors were carried out at the grid and island scales. They contribute to revealing environmental factors significantly correlated with the spatial characteristics of island landscape patterns at different spatial scales. In addition, based on the minimum evaluation units, the spatial characteristics of landscape patterns at the island group scale were obtained and analyzed for relevant environmental factors.

3. Results

3.1. Changes in ACR at Different Spatial Scales

The ACR values at different spatial scales are shown in Figure 5. First, the mean and range of the ACR at the six scales were 4.29, 0–107.97, 4.12, 0–107.97, 4.04, 0–56.09, 4, 0–95.19, 3.96, 0–83.85, 4.6, and 0–25.48%, respectively, indicating that the grid-scale ACRs were lower than the island-scale ACR and gradually decreased as the evaluation units increased. Second, the ACR showed spatial heterogeneity at different spatial scales. ACR was higher in the southern part of the study area than in the northern part, and higher in the interior of the island than at the edge. Within the islands, regions with high and medium ACR values exhibited aggregation characteristics, mainly distributed in areas with higher elevations. At the island scale, the numbers of islands with low, medium, and high ACR values were 85, 49, and 7, respectively, indicating that most islands had low ACR values. In summary, the ACR showed significant spatial heterogeneity, with high ACR mainly distributed in areas with higher elevations within islands and a few smaller islands. Moreover, the area change at the island scale was more obvious than that at the grid scale, and a smaller spatial scale can more accurately reveal the spatial characteristics of area change.

3.2. Changes in HII and HITI at Different Spatial Scales

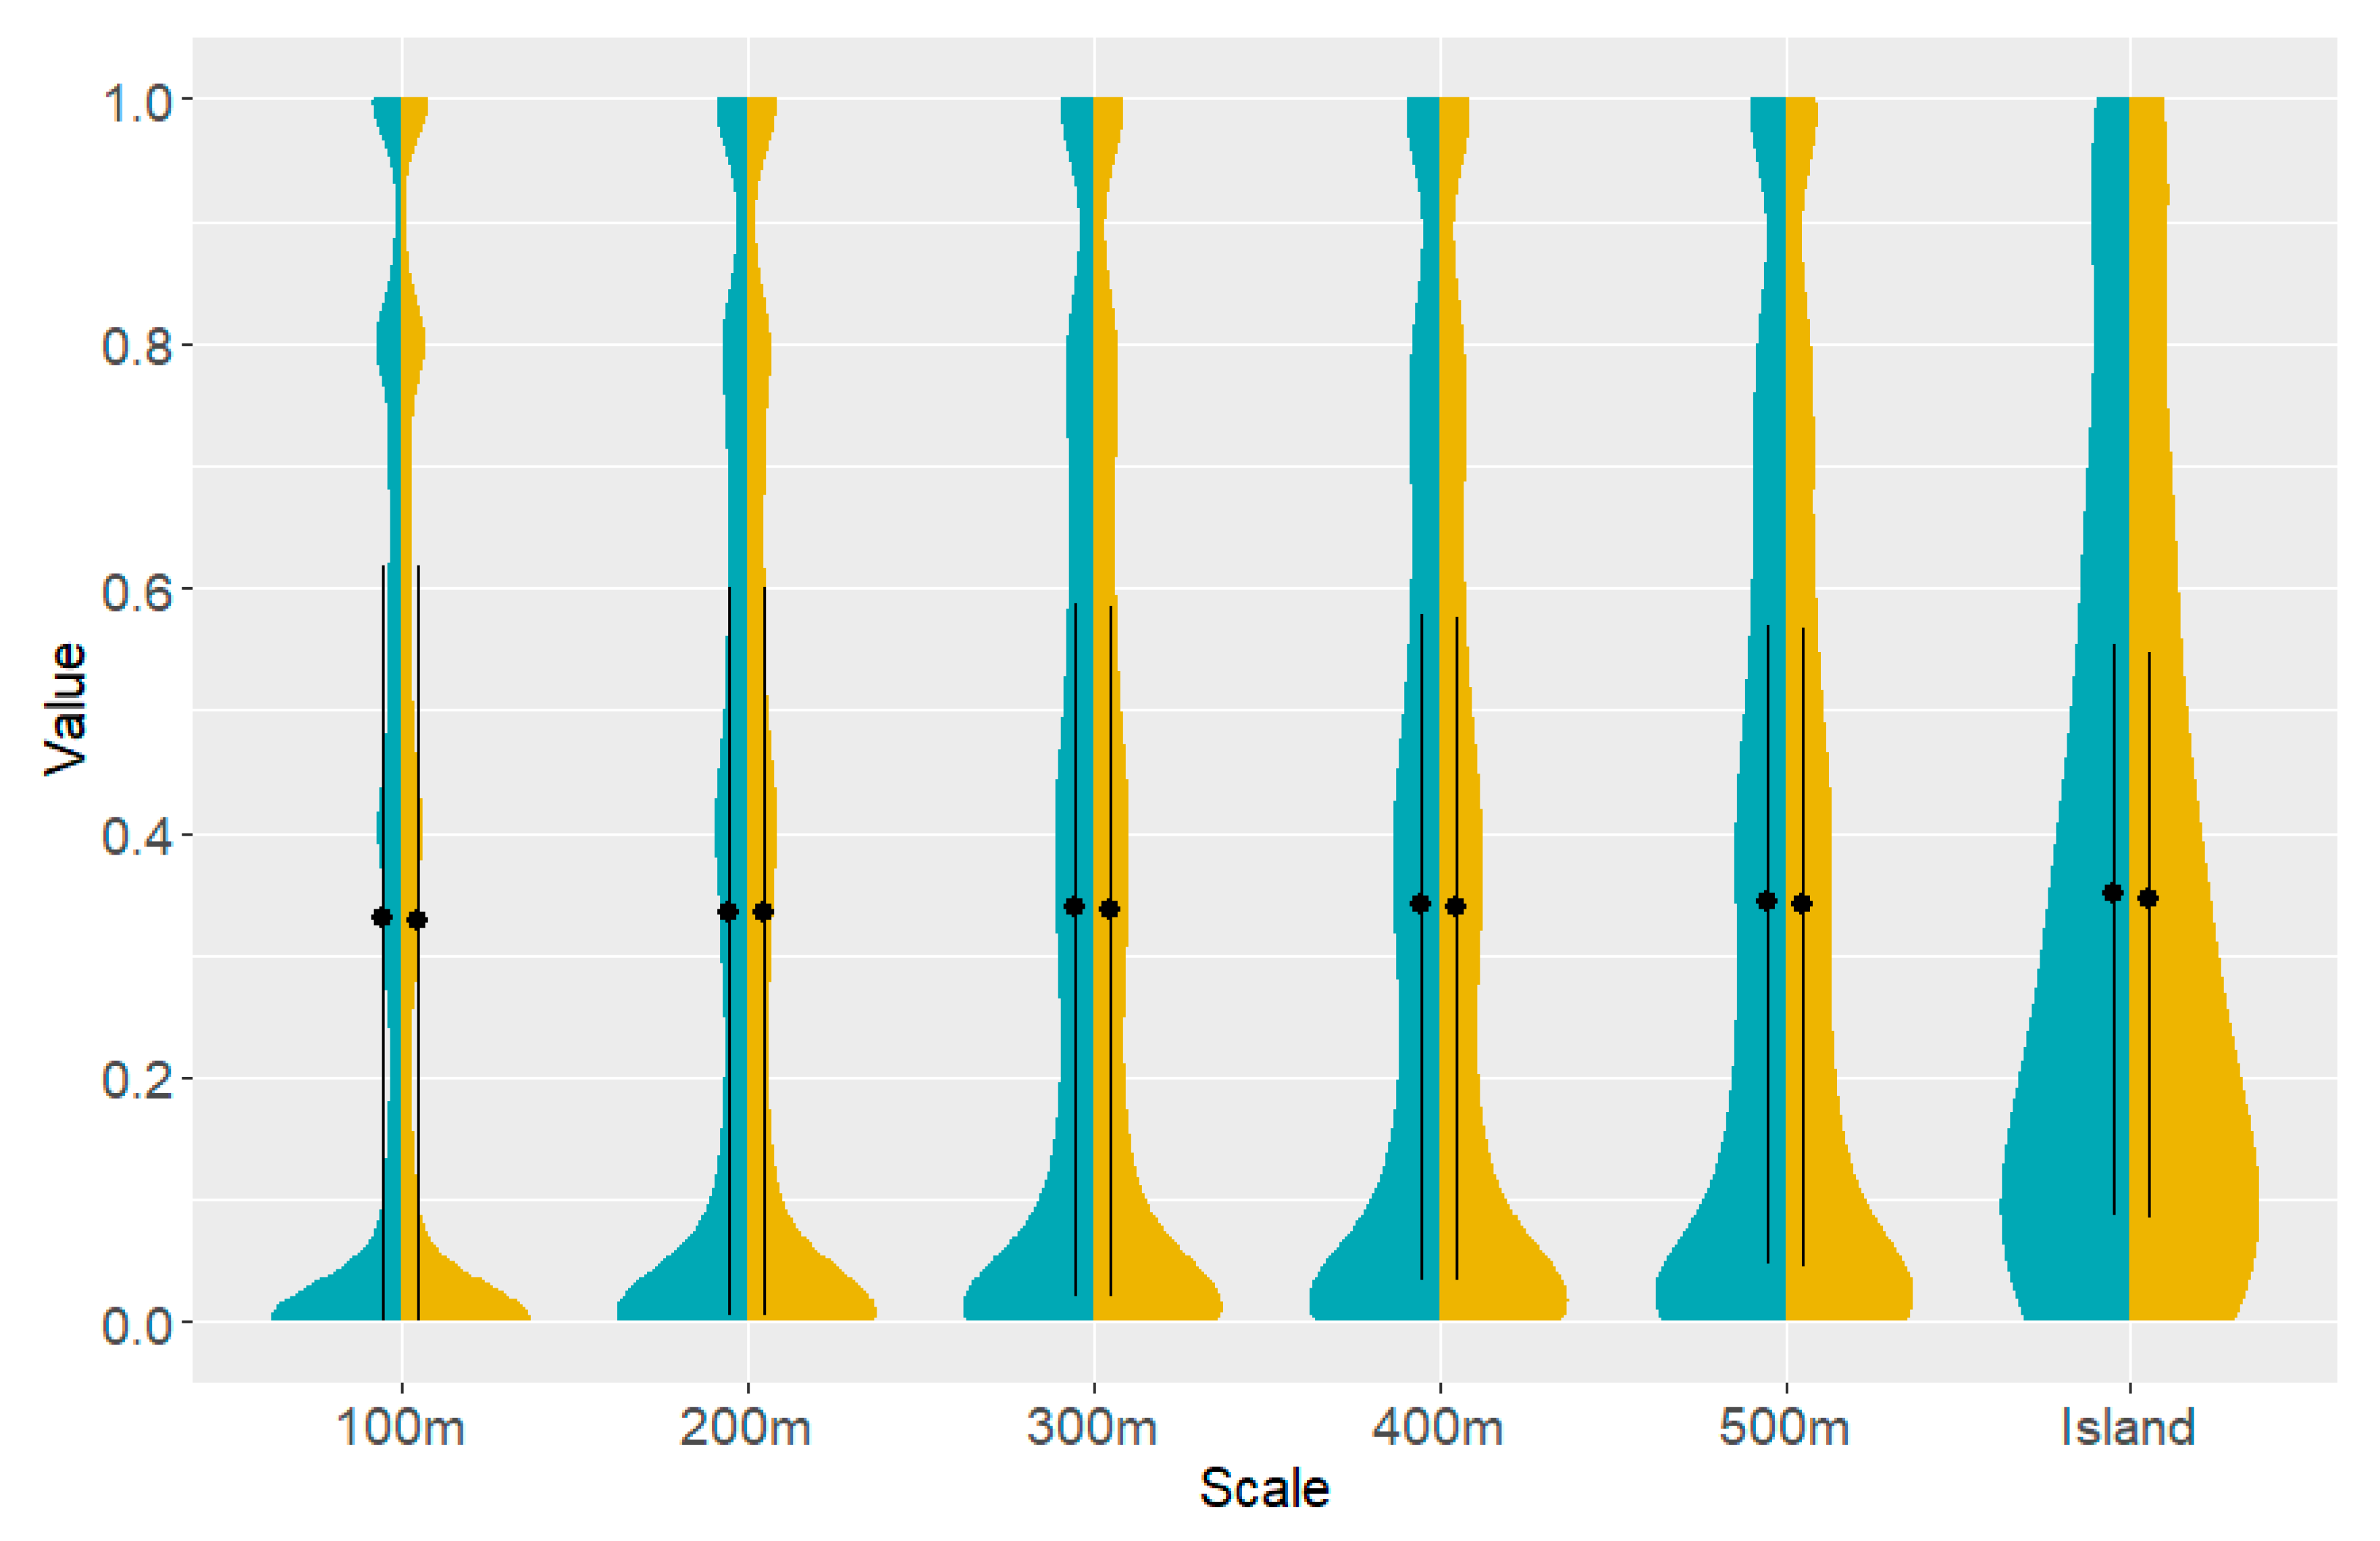
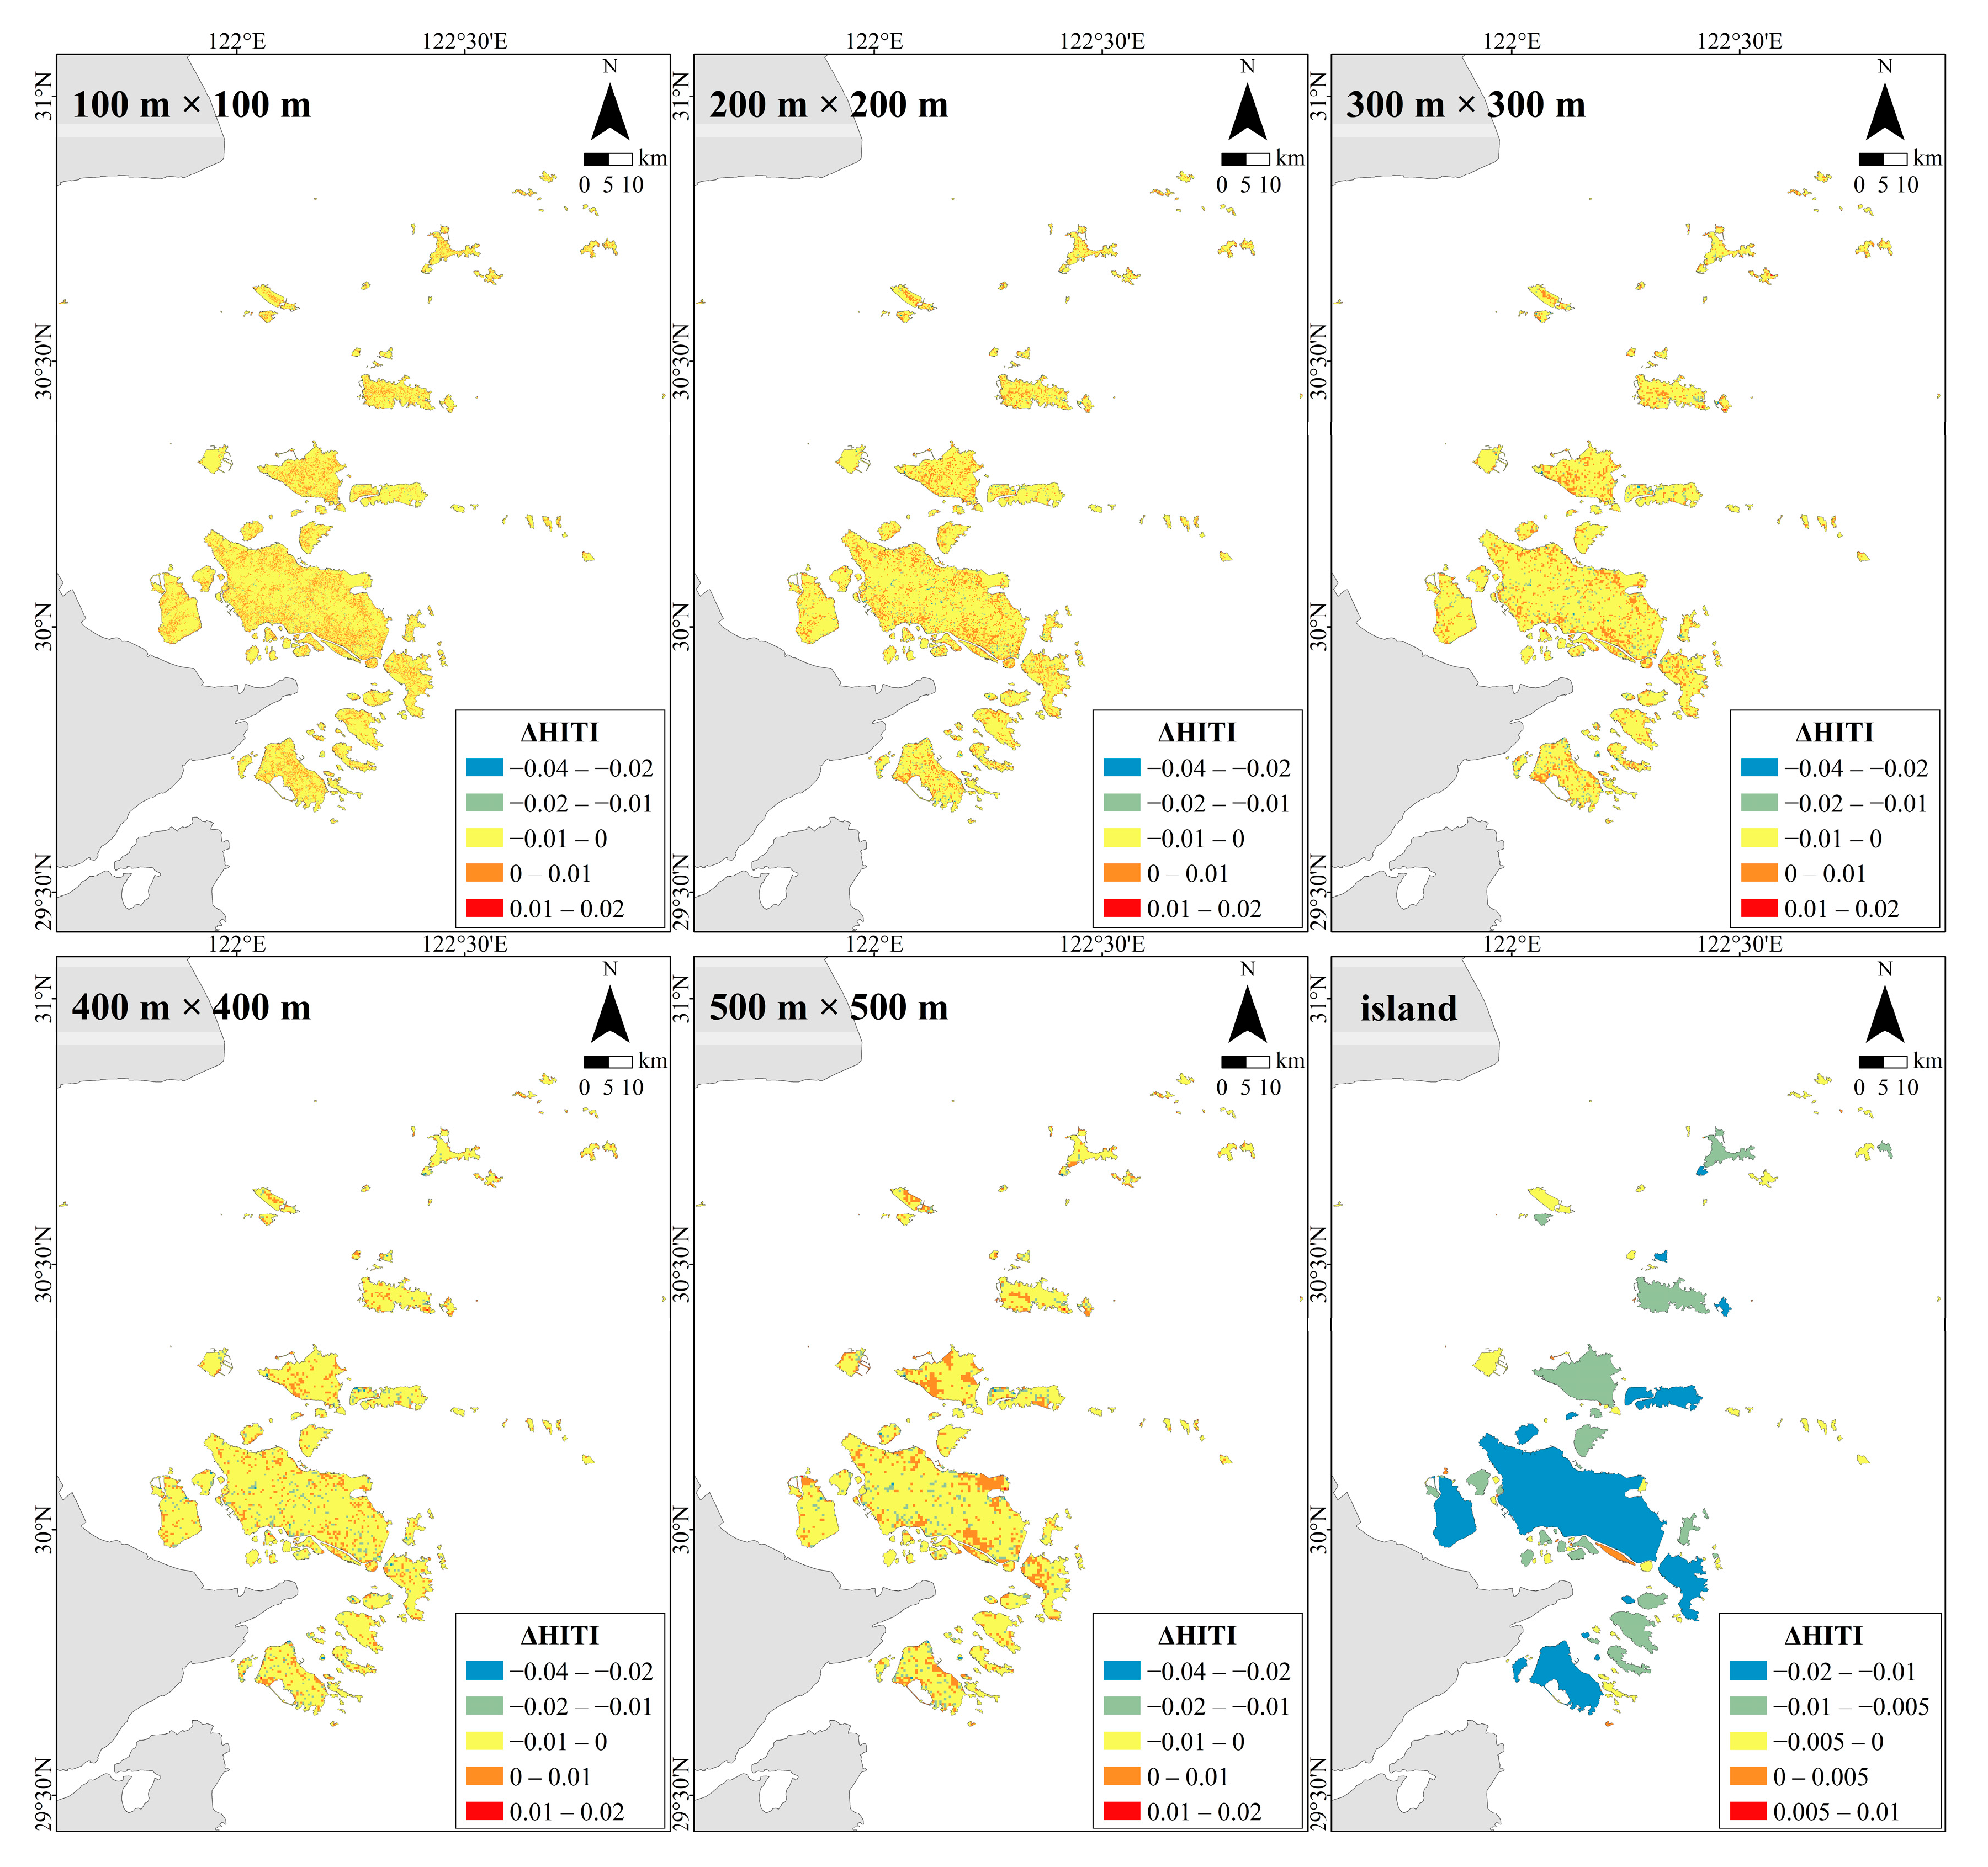
The HII and HITI values at different spatial scales are shown in Figure 6 and Figure 7, respectively. The HII and HITI at the six spatial scales ranged from 0 to 1. The mean values of the HII were 0.330, 0.336, 0.339, 0.342, 0.343, and 0.350, respectively. The mean values of the HITI were 0.329, 0.334, 0.337, 0.340, 0.341, and 0.346, respectively. The human interference index of the study area was lower than that of the Yellow River Delta (0.345, 300 m × 300 m) and higher than that of Chongming Island (0.315, 100 m × 100 m) [26]. The HII and HITI increased with an increase in the evaluation units, and HITI was slightly lower than HII. Second, the HII and HITI showed spatial heterogeneity at different spatial scales. HII and HITI were lower in the southern part of the study area than in the northern part. Moderate islands had a higher proportion of high HII and high HITI. At the grid scale, the HII and HITI showed basically the same trend as the evaluation unit increased; the regions with high and low HII and HITI gradually decreased, and the regions with medium HII and HITI gradually increased. The spatial distribution of HII and HITI within the islands showed spatially aggregated characteristics, with high-value regions mainly distributed at the edges of the islands, whereas low-value regions were mainly distributed in the middle of the islands. At the island scale, the numbers of islands with low, medium, and high HII and HITI were 62, 45, and 34, respectively. Islands with high HII and HITI were relatively small, while larger islands had medium and low HII.
The HITI and HII differences (ΔHITI) at different spatial scales are shown in Figure 8. The mean values and ranges were −0.0006, −0.078 to 0.07, −0.0012, −0.048 to 0.029, −0.0016, −0.045 to 0.023, −0.002, −0.049 to 0.021, −0.0023, −0.03 to 0.013, −0.0038, and −0.019 to 0.003, respectively. The difference values increased with an increase in the evaluation units, and the spatial heterogeneity was more notable. ΔHITI was higher in the southern part of the study area than in the northern part. First, at the grid scale, the difference values varied mainly within a fixed range (−0.01 to 0.01), marked with different colors. Orange regions indicate that the HITI is higher than the HII, and yellow and blue regions indicate that the HITI is lower than the HII. As the evaluation unit increased, the orange region gradually decreased and its spatial distribution changed from scattered to clustered, whereas the yellow region always dominated and gradually increased, and the blue region increased. This indicates that the regions with an HITI lower than the HII dominated and gradually expanded as the evaluation unit increased. At the island scale, the numbers of islands with ΔHITI < 0, ΔHITI = 0, and ΔHITI > 0 were 108, 15, and 18, respectively, indicating that the HITI was lower than the HII on most islands. Islands with high ΔHITI were relatively small. In summary, human interference intensity exhibited significant spatial heterogeneity from 2D and 3D perspectives, with high HII and HITI mainly distributed at the edge of islands and some smaller islands. The HITI at grid scale was lower than that at island scale and increased with an increase in evaluation units. HITI is lower than HII. ΔHITI decreased with an increase in evaluation units, with its overall distribution shifting from scattered to concentrated.
The blue areas on the left refer to HII, and the yellow areas on the right refer to HITI. The middle lines connect the 25th and 75th percentiles, and the black dots refer to the mean values.

3.3. Changes in LFI and LFTI at Different Spatial Scales

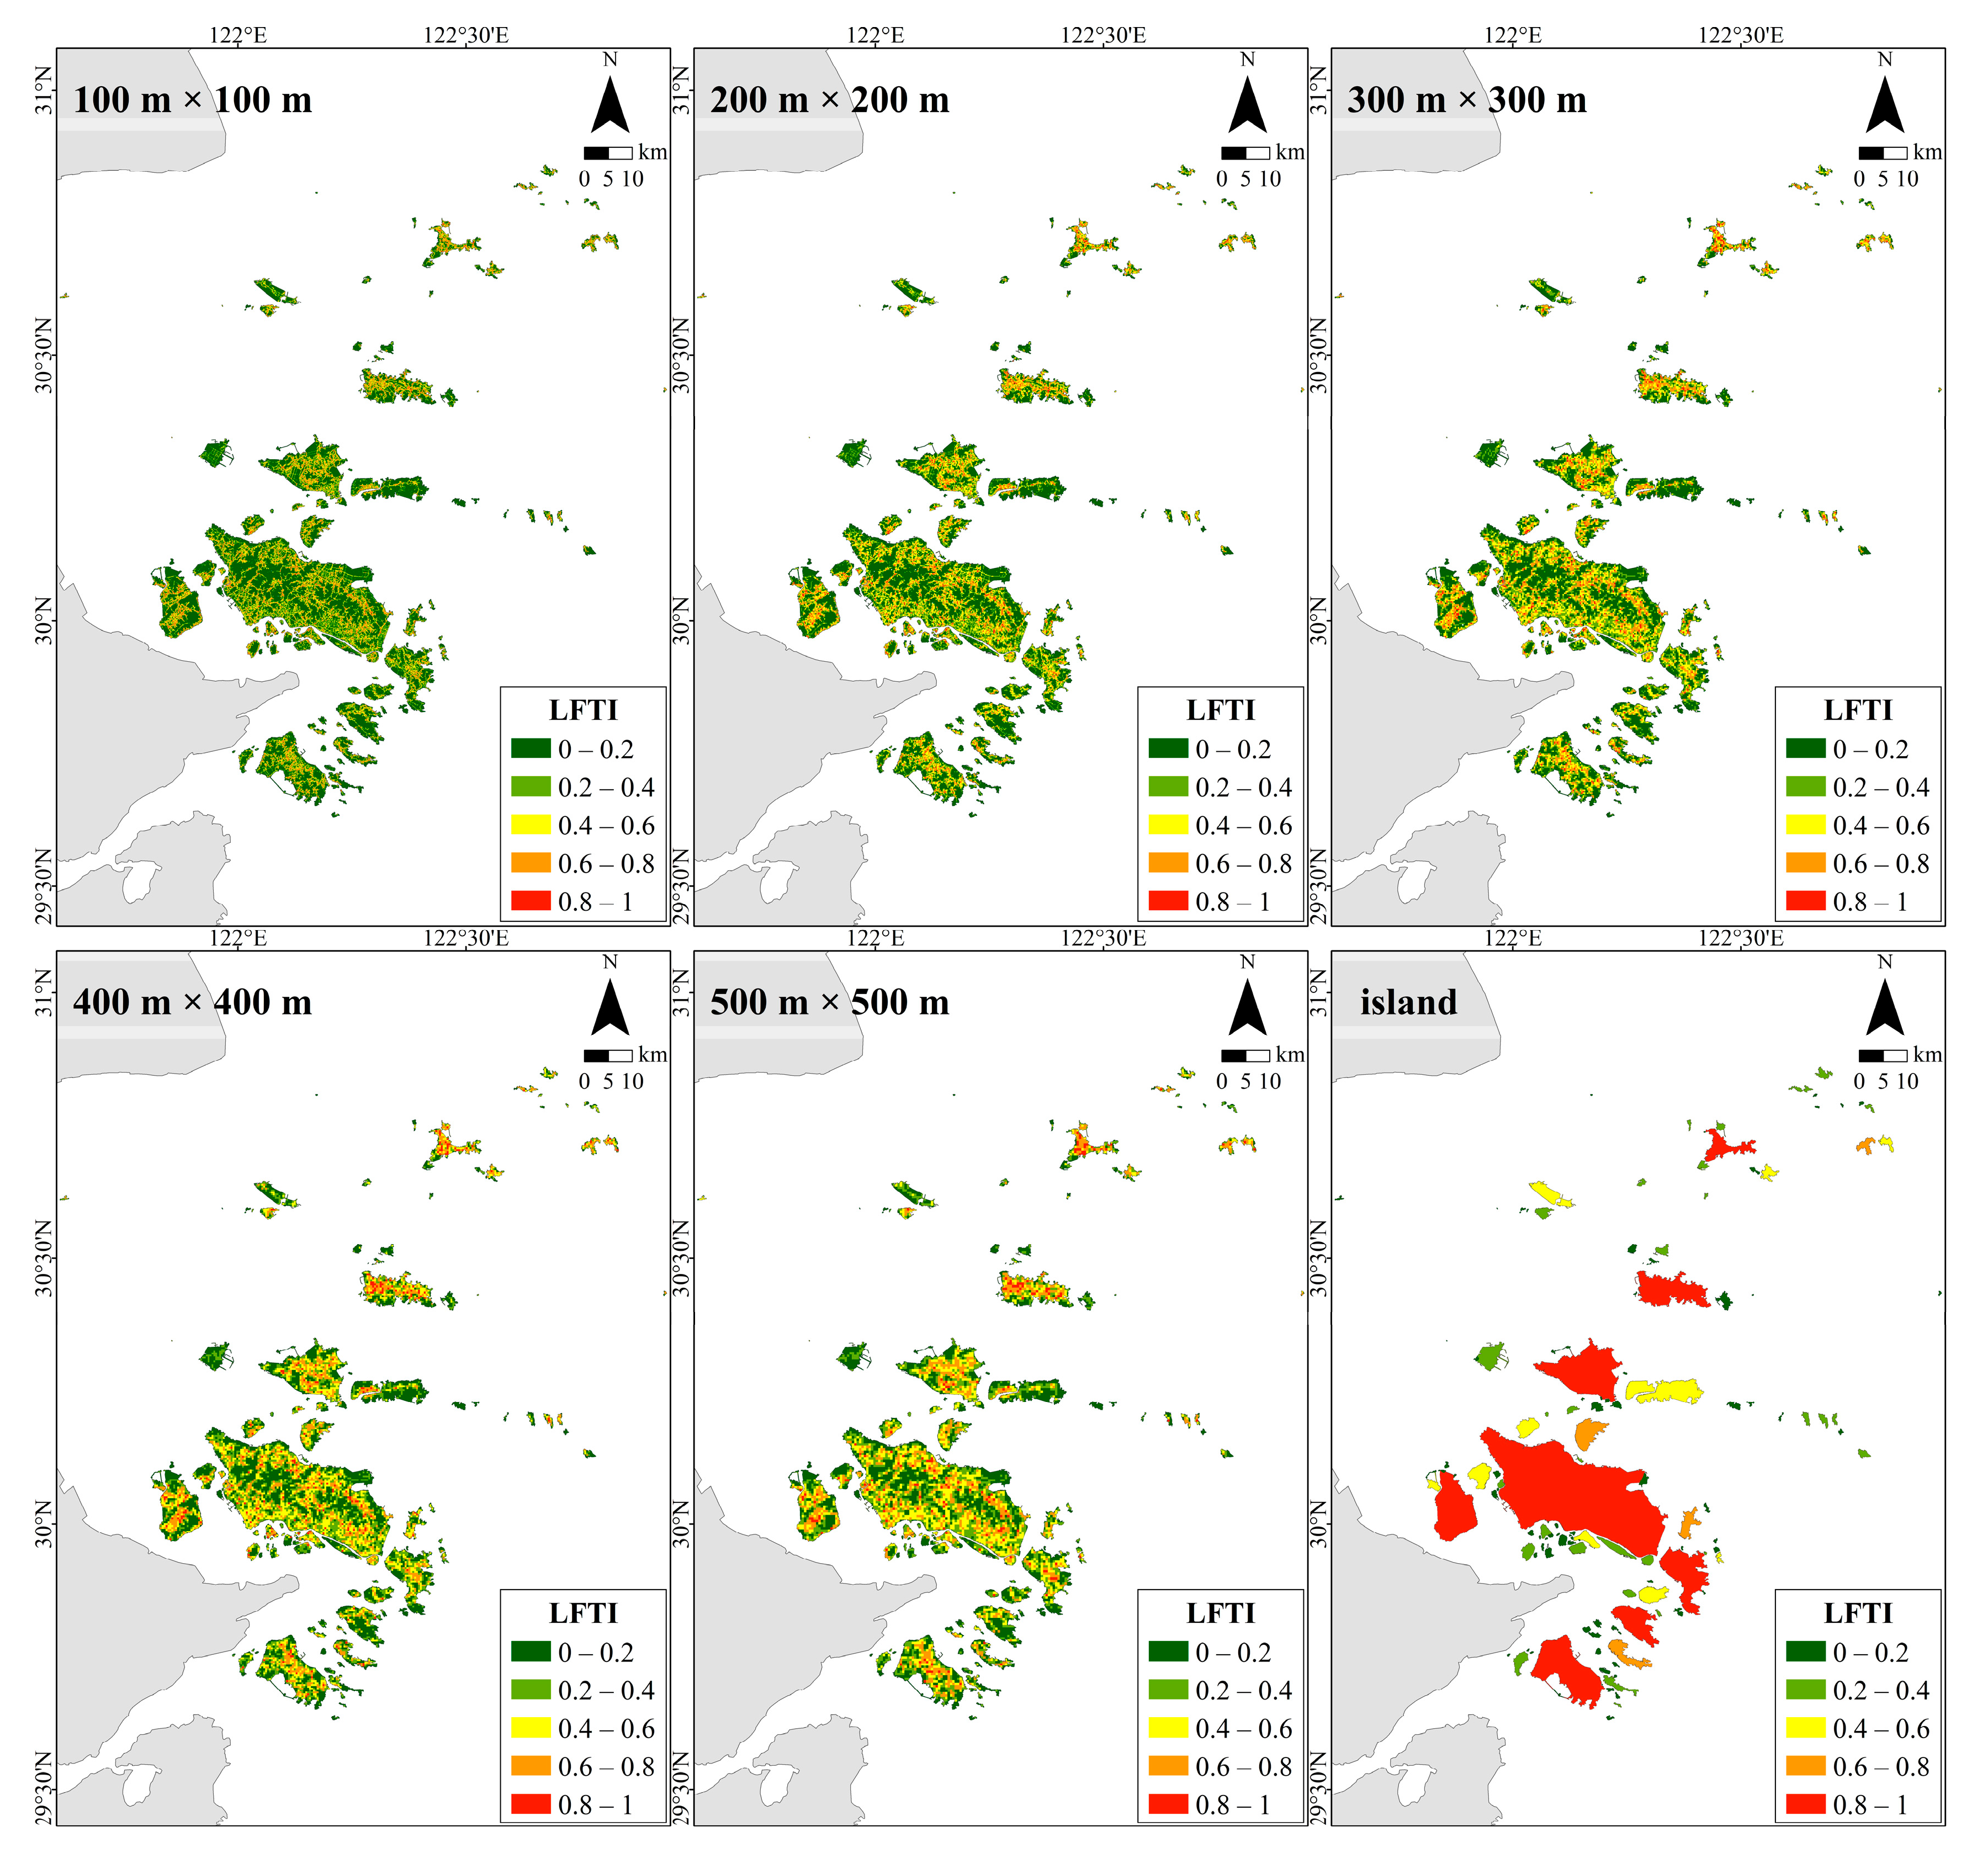
The LFI and LFTI values at different spatial scales are shown in Figure 9 and Figure 10, respectively. First, the range of the LFI and LFTI was 0–1 at six spatial scales. The mean values of the LFI were 0.230, 0.269, 0.294, 0.304, 0.314, and 0.216, respectively. The mean values of the LFTI were 0.232, 0.270, 0.295, 0.305, 0.315, and 0.217, respectively. These indicate that the LFI and LFTI at the grid scale were higher than those at the island scale, and they increased with the increase in the evaluation units. Second, the LFI and LFTI showed spatial heterogeneity at different spatial scales. LFI and LFTI were higher in the southern part of the study area than in the northern part. Large islands had more areas with high LFI and high LFTI. At the grid scale, the LFI and LFTI showed basically the same trend as the evaluation unit increased; the low LFI and LFTI regions gradually decreased, and the medium and high LFI and LFTI regions gradually increased. Within the islands, low LFI and LFTI were mainly distributed in regions with higher elevation, whereas the distributions of medium and high LFI and LFTI were slightly different on islands of different sizes. Specifically, the high LFI and LFTI of large islands were mainly distributed in regions with medium elevation and slope, i.e., the transition zone from plains to mountains. The medium LFI and LFTI of medium-sized islands were mainly distributed in regions with low elevation and slope, i.e., plains. The medium and high LFI and LFTI of small islands were mainly distributed in regions with low elevation and slope. This was different from the trend of landscape fragmentation on Haitan Island, which decreased from the coast to the interior [64]. Finally, at the island scale, the numbers of islands with low, medium, and high LFI and LFTI were 87, 42, and 12, respectively. Larger islands had high LFI and LFTI, while smaller islands had low LFI and LFTI.
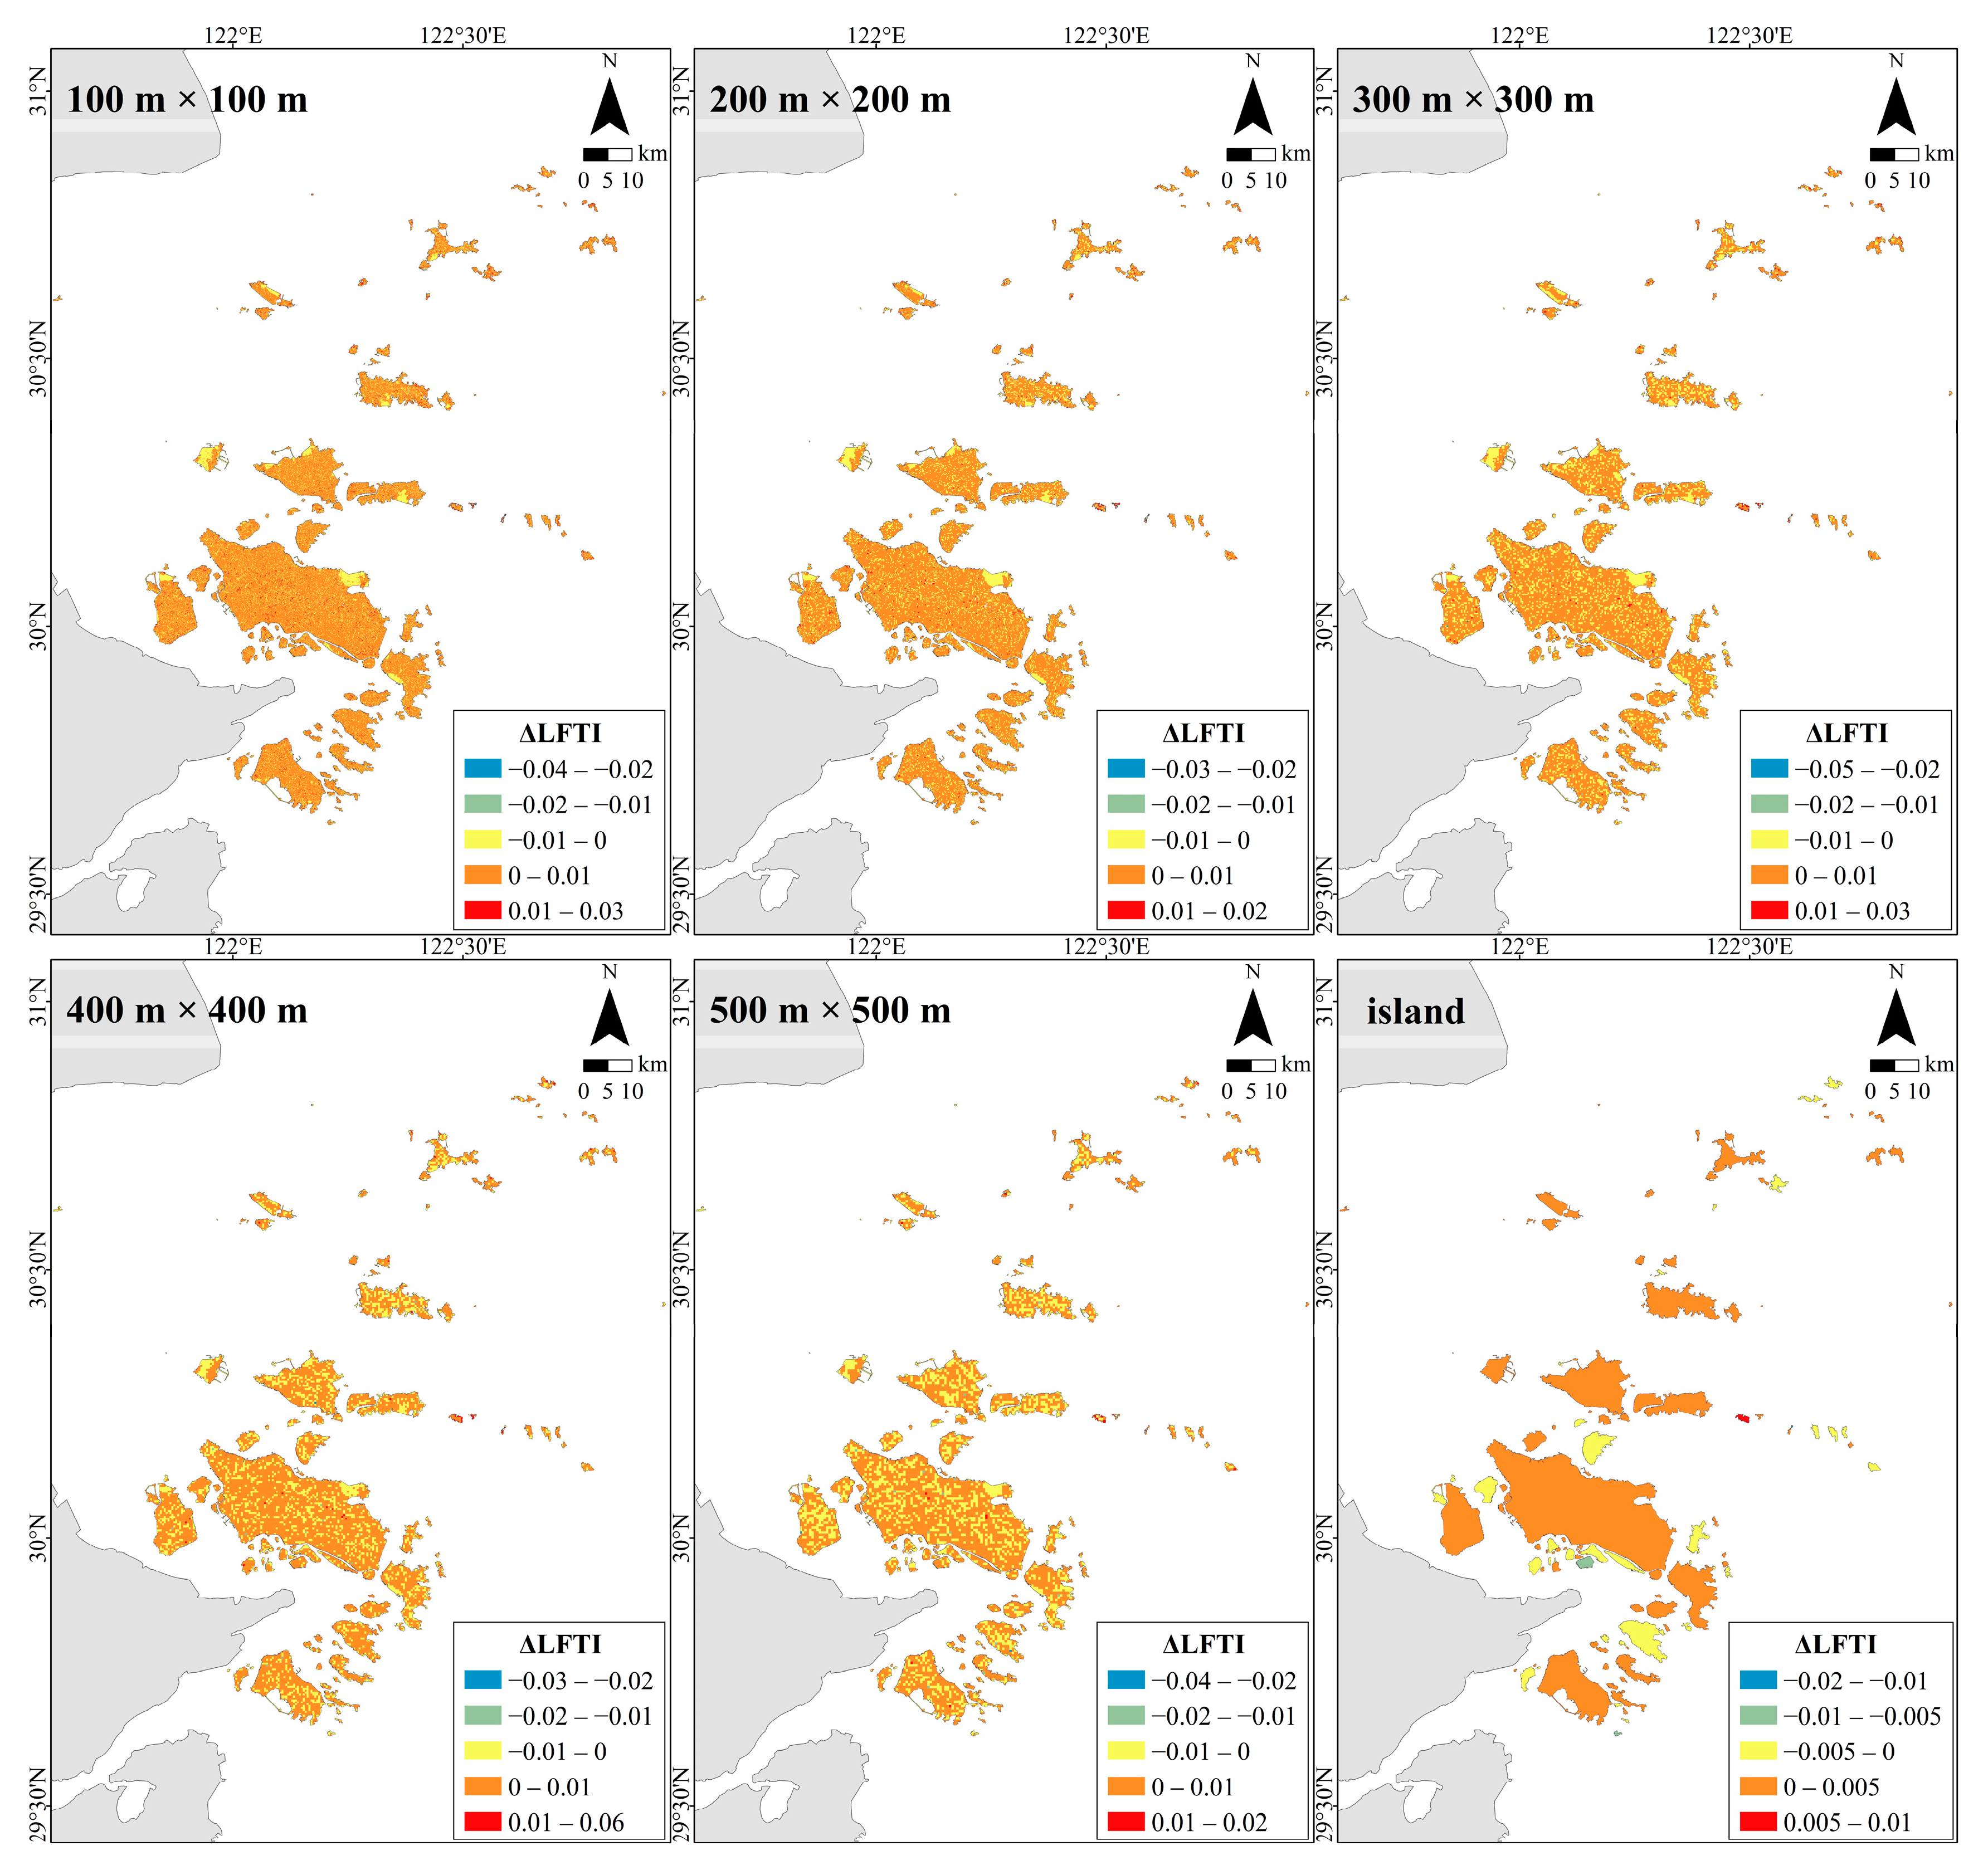
The LFTI and LFI differences (ΔLFTI) at different spatial scales are shown in Figure 11. The mean values and ranges were 0.0016, −0.054 to 0.143, 0.0012, −0.041 to 0.103, 0.0009, −0.045 to 0.079, 0.0005, −0.029 to 0.058, 0.0003, −0.034 to 0.057, 0.0004, and −0.016 to 0.009, respectively. The difference values decreased with an increase in the evaluation units. ΔLFTI was higher in the southern part of the study area than in the northern part. First, at the grid scale, the difference values varied mainly within a fixed range (−0.01 to 0.01), marked separately with different colors. Orange regions indicate that the LFTI is higher than the LFI, and yellow regions indicate that the LFTI is lower than the LFI. As the evaluation unit increased, the dominant orange region gradually decreased and the yellow region gradually increased. This indicates that some regions with an LFTI higher than the LFI gradually changed to those with an LFTI lower than the LFI as the evaluation unit increased. At the island scale, the number of islands with ΔLFTI < 0, ΔLFTI = 0, and ΔLFTI > 0 were 40, 1, and 100, respectively, indicating that the LFTI is higher than the LFI on most islands. In summary, the degree of landscape fragmentation from 2D and 3D perspectives exhibited significant spatial heterogeneity, with high LFI and LFTI mainly distributed in the transition area from plain to mountainous areas in the interior of islands and larger islands. The LFTI at grid scale was higher than that at island scale and increased with an increase in evaluation units. The LFTI is higher than the LFI. ΔLFTI decreased with an increase in evaluation units, with the overall distribution tending from concentration to dispersion.
The blue areas on the left refer to LFI, and the yellow areas on the right refer to LFTI. The middle lines connect the 25th and 75th percentiles, and the black dots refer to the mean values.

3.4. Changes in VTI at Different Spatial Scales

The VTI values at different spatial scales are shown in Figure 12. First, the VTI range was 0–1 at six spatial scales. The mean values of the VTI were 0.411, 0.412, 0.414, 0.416, 0.421, and 0.495, respectively, indicating that the VTI increased with an increase in the evaluation units. Second, the VTI showed significant spatial heterogeneity at different spatial scales. VTI was higher in the southern part of the study area than in the northern part, and higher in the interior of the island than at the edge. Large islands had a large area of high VTI. At the grid scale, the VTI showed basically the same trend as the evaluation unit increased. Regions with high and low VTI gradually decreased, and regions with medium VTI gradually increased. Within the islands, medium and high VTI were mainly distributed in regions with a relatively high elevation, i.e., hilly and mountainous areas. Low VTI was mainly distributed in regions with low elevation, i.e., plain areas. Finally, at the island scale, the number of islands with low, medium, and high VTI were 7, 82, and 52, respectively. High VTI was mainly distributed on the islands in the southern study area. Medium VTI was mainly distributed on the islands in the northern study area. Low VTI was only present on a relatively small number of very small islands. In summary, VTI exhibited significant spatial heterogeneity from a three-dimensional perspective, with high VTI mainly distributed in mountainous and hilly areas within the island and some islands in the southern part of the study area. The VTI at grid scale was lower than that at island scale and increased with an increase in evaluation units.

3.5. Changes in BTI at Different Spatial Scales

The BTI values at different spatial scales are shown in Figure 13. First, the BTI range was 0–1 at six spatial scales. The mean values of the BTI were 0.113, 0.126, 0.137, 0.144, 0.152, and 0.237, respectively, indicating that the BTI increased with an increase in the evaluation units. Second, the BTI exhibited significant spatial heterogeneity at different spatial scales. BTI was higher in the southern part of the study area than in the northern part, and higher on the edge of the island than in the interior. Large islands had a large area of high BTI. At the grid scale, the BTI showed essentially the same trend as the evaluation unit increased; the regions with low BTI gradually decreased, and the regions with medium and high BTI gradually increased. Within the islands, medium and high BTI were mainly distributed in regions with relatively low elevations and slopes, i.e., plains. Low BTI was mainly distributed in regions with higher elevations, i.e., hills and mountainous areas. Finally, at the island scale, the numbers of islands with low, medium, and high BTI were 85, 37, and 19, respectively. High BTI was mainly distributed on the islands in the administrative center of the four districts. Medium BTI was mainly distributed in the larger islands around the islands with a high BTI. Low BTI was present only on relatively small islands. In summary, BTI exhibited significant spatial heterogeneity from a three-dimensional perspective, with high BTI mainly distributed in the plain areas within islands and the islands where the administrative centers are located. The BTI at the grid scale was lower than that at the island scale and increased with an increase in evaluation units.

4. Discussion

4.1. The Significance of the Research Results on Island Landscape Patterns from Three-Dimensional Perspectives

4.1.1. The Theoretical Significance of Three-Dimensional Landscape Indices

Island landscape pattern indices from three-dimensional perspectives, such as human disturbance, landscape fragmentation, vegetation space, and building space, were developed by considering vertical dimensions and incorporating more detailed information about habitat structure, human activities, and the built environment. These indices provided a holistic view of island landscapes and their ecological and socio-cultural dynamics while enhancing our understanding of the differences between two-dimensional and three-dimensional perspectives [47,52]. The human disturbance index measured the level of human activity and its impact on natural ecosystems within island landscapes [25,63]. HITI extended the two-dimensional human disturbance analysis to the vertical dimension, considering how factors such as urbanization, infrastructure development, agriculture, tourism, and other forms of anthropogenic change affect the entire spatial volume. Understanding the extent and intensity of human disturbance is critical for sustainable land use planning, conservation decision-making, and mitigating negative impacts on biodiversity and ecosystem services. The landscape fragmentation index quantified the extent of habitat fragmentation on islands by examining the spatial arrangement of habitats, and it highlighted the extent of habitat loss, connectivity, and dispersal potential for various species [36,64]. LFTI considered not only the horizontal extent of the landscape, measuring the number, size, and shape of patches and their connectivity, but also the vertical structure. This means considering how different elevations, topography, and three-dimensional features affect habitat connectivity and species movement [62]. In addition, by analyzing landscape fragmentation patterns at different scales, conservation efforts can be better targeted to identify corridors or stepping-stone habitats to mitigate the negative impacts of fragmentation [65].
VTI more accurately described the vertical structure and complexity of plant communities on islands, thereby affecting various ecological processes. Vegetation was usually represented as a two-dimensional layer, ignoring the spatial characteristics of the forest canopy [63]. VTI identified forest or vegetation types, measured canopy height, estimated biomass, and evaluated the overall vegetation structure. Analyzing vegetation patterns from a three-dimensional perspective can provide a deeper understanding of the structure, composition, and health status of ecosystems [47,66]. This information is crucial for effective habitat management, restoration work, and monitoring of ecosystem health. BTI focused on the vertical dimensions of existing structures within the island landscape and captured the height and spatial arrangement of buildings. Monitoring the three-dimensional dimensions of buildings helps in urban planning, evaluating the expansion of human settlements, measuring land consumption, and evaluating the impact of development on natural habitats, coastal erosion, and visual aesthetics [38,49]. This information contributes to sustainable urban development, disaster management, and conservation strategies, with priority given to minimizing negative impacts on island ecological integrity. In addition, analyzing the three-dimensional patterns of vegetation and buildings at different scales can help to better understand the impact of urban development on urban visual aesthetics, microclimate, and overall livability, promoting sustainable and inclusive design [67].

4.1.2. The Practical Significance of Three-Dimensional Landscape Indices

The field survey data were used to verify the shoreline, landscape type, elevation, vegetation height, and building height of the islands. This ensures the accuracy and integrity of the three-dimensional landscape pattern evaluation of islands. The spatial matching analysis of landscape indices is also a way of internal validation of the research results. Spatial matching analysis was applied to landscape index combinations (HITI-LFTI, HITI-VTI, HITI-BTI, LFTI-VTI, LFTI-BTI, and VTI-BTI) and established area intersection matrices at different spatial scales (Table 2). They can reveal the complex coupling characteristics of different landscape indices [32]. Spatial matches and mismatches among the indices were analyzed and provided a nature-based solution for coordinating development and utilization with ecological protection. Suggestions for optimizing the landscape patterns and supporting sustainable development were proposed for island groups and the entire archipelagic group.
At the grid scale, the most significant spatial matching of landscape indices was for large islands, which showed a high LFTI-high BTI spatial match. In general, large islands usually attract multiple types and larger-scale human development and utilization activities, which tend to create areas of high landscape fragmentation and high building space [12,34]. The countermeasures are to find suitable spatial optimization methods for landscape patterns, rationally plan built-up areas and urban green spaces, reduce built-up space, and increase vegetation space. Second, medium islands showed a high spatial match between high HITI and low VTI. They tend to be geographically close to the mainland or large islands, have relatively low development and utilization costs, and are prone to areas with high levels of human disturbance and low vegetation space [28,68]. The countermeasures are to rationally utilize natural resources, limit the intensity and scope of human disturbance, and improve the ecological conditions of damaged islands. Third, small islands exhibited high spatial matches among low HITI, low LFTI, and low BTI. The suggestions are to carry out moderate resource protection and ecological restoration work and to eliminate development and utilization activities that are detrimental to ecosystem health [3,32]. At the island scale, high HITI-high LFTI, high HITI-high VTI, and high HITI-high BTI showed spatial mismatches. The targeted strategy is to strictly control the degree of human activity interference and take measures to manage the types and scale of development and utilization [26,28]. Planning managers should adhere to the principle of minimizing the impact of ecosystems to select the type of development and utilization and the principle of optimizing the landscape pattern to control the scale of development and utilization. Then, high LFTI-high VTI and high LFTI-high BTI showed high spatial matches. The targeted strategy is to resist the development trend of landscape fragmentation, which mainly refers to the continuous optimization of landscape configuration and the strengthening of landscape connectivity and integrity construction [69,70]. Finally, high VTI and high BTI exhibited a high spatial match. The targeted suggestion is to protect the existing vegetation areas, expand the vegetation three-dimensional space, limit the building three-dimensional space, and construct the ecological security barrier [35,71].

4.2. Correlations between Island Landscape Pattern and Environmental Factors at Different Spatial Scales

4.2.1. Grid Scale and Island Scale

The correlation between island landscape patterns and environmental factors is a complex and multifaceted issue that has attracted great attention in ecological research [12,64]. On the one hand, it can provide insights into how different factors affect landscape patterns, such as landscape composition or spatial arrangement. It can also help researchers determine which environmental factors have the most impact on the formation of landscape patterns, which contributes to effective landscape ecological management and protection work [51]. Correlation analyses between landscape indices and environmental factors were carried out at the grid scale and island scale (Table 3). A key environmental factor affecting the landscape patterns of islands is topography. The topographic complexity of islands, including elevation, slope, and aspect, can strongly influence the distribution of habitats and species [72]. Topographic factors included elevation (DEM), slope (Sl), and aspect (As). Within the islands, areas with higher elevations and slopes had larger vegetation spaces, a lower intensity of human disturbance and landscape fragmentation, and smaller building spaces. At the island scale, islands with higher elevations or slopes had a lower intensity of human disturbance, a higher degree of landscape fragmentation, and larger vegetation spaces. Another important environmental factor is the ocean. The moderating effect of the ocean on the island’s local climate can directly influence the spatial characteristics of landscapes [73]. Oceanic factors included Euclidean distance to the sea (EDTS) and cost distance to the sea (CDTS). Within the islands, areas away from the ocean had larger vegetation spaces, a lower intensity of human disturbance and landscape fragmentation, and smaller building spaces. Human activities also have a significant impact on island landscape patterns. Factors such as land use change, urbanization, and infrastructure development may lead to habitat fragmentation, loss of biodiversity, and altered landscape connectivity [26,28]. Anthropogenic factors included Euclidean distance to the main road (EDTR) and cost distance to the main road (CDTR). Within the islands, areas away from the main road had larger vegetation spaces, a lower intensity of human disturbance and landscape fragmentation, and smaller building spaces.
In addition, at the grid scale, topographic factors were significantly more correlated with landscape indices than marine and anthropogenic factors. Correlations between environmental factors considering topographic cost distance (CDTS and CDTR) and landscape indices were significantly higher than those of Euclidean distance (EDTS and EDTS). This suggested that cost-distance factors based on three-dimensional topography can more accurately express the environmental characteristics of islands and more effectively explain the influence of marine and anthropogenic factors on the spatial heterogeneity of landscape patterns within islands. In addition, island attribute factors such as appearance and location can also have an impact on the overall characteristics of island landscapes. The appearance factors included island plan area (IA), surface area (ISA), and shape index (ISI), and the location factors included distance to the mainland (DTM) and distance to Zhoushan Island (DTZ). At the island scale, appearance factors showed significant correlations with landscape indices. Islands with larger areas or complex shapes showed a high degree of landscape fragmentation.

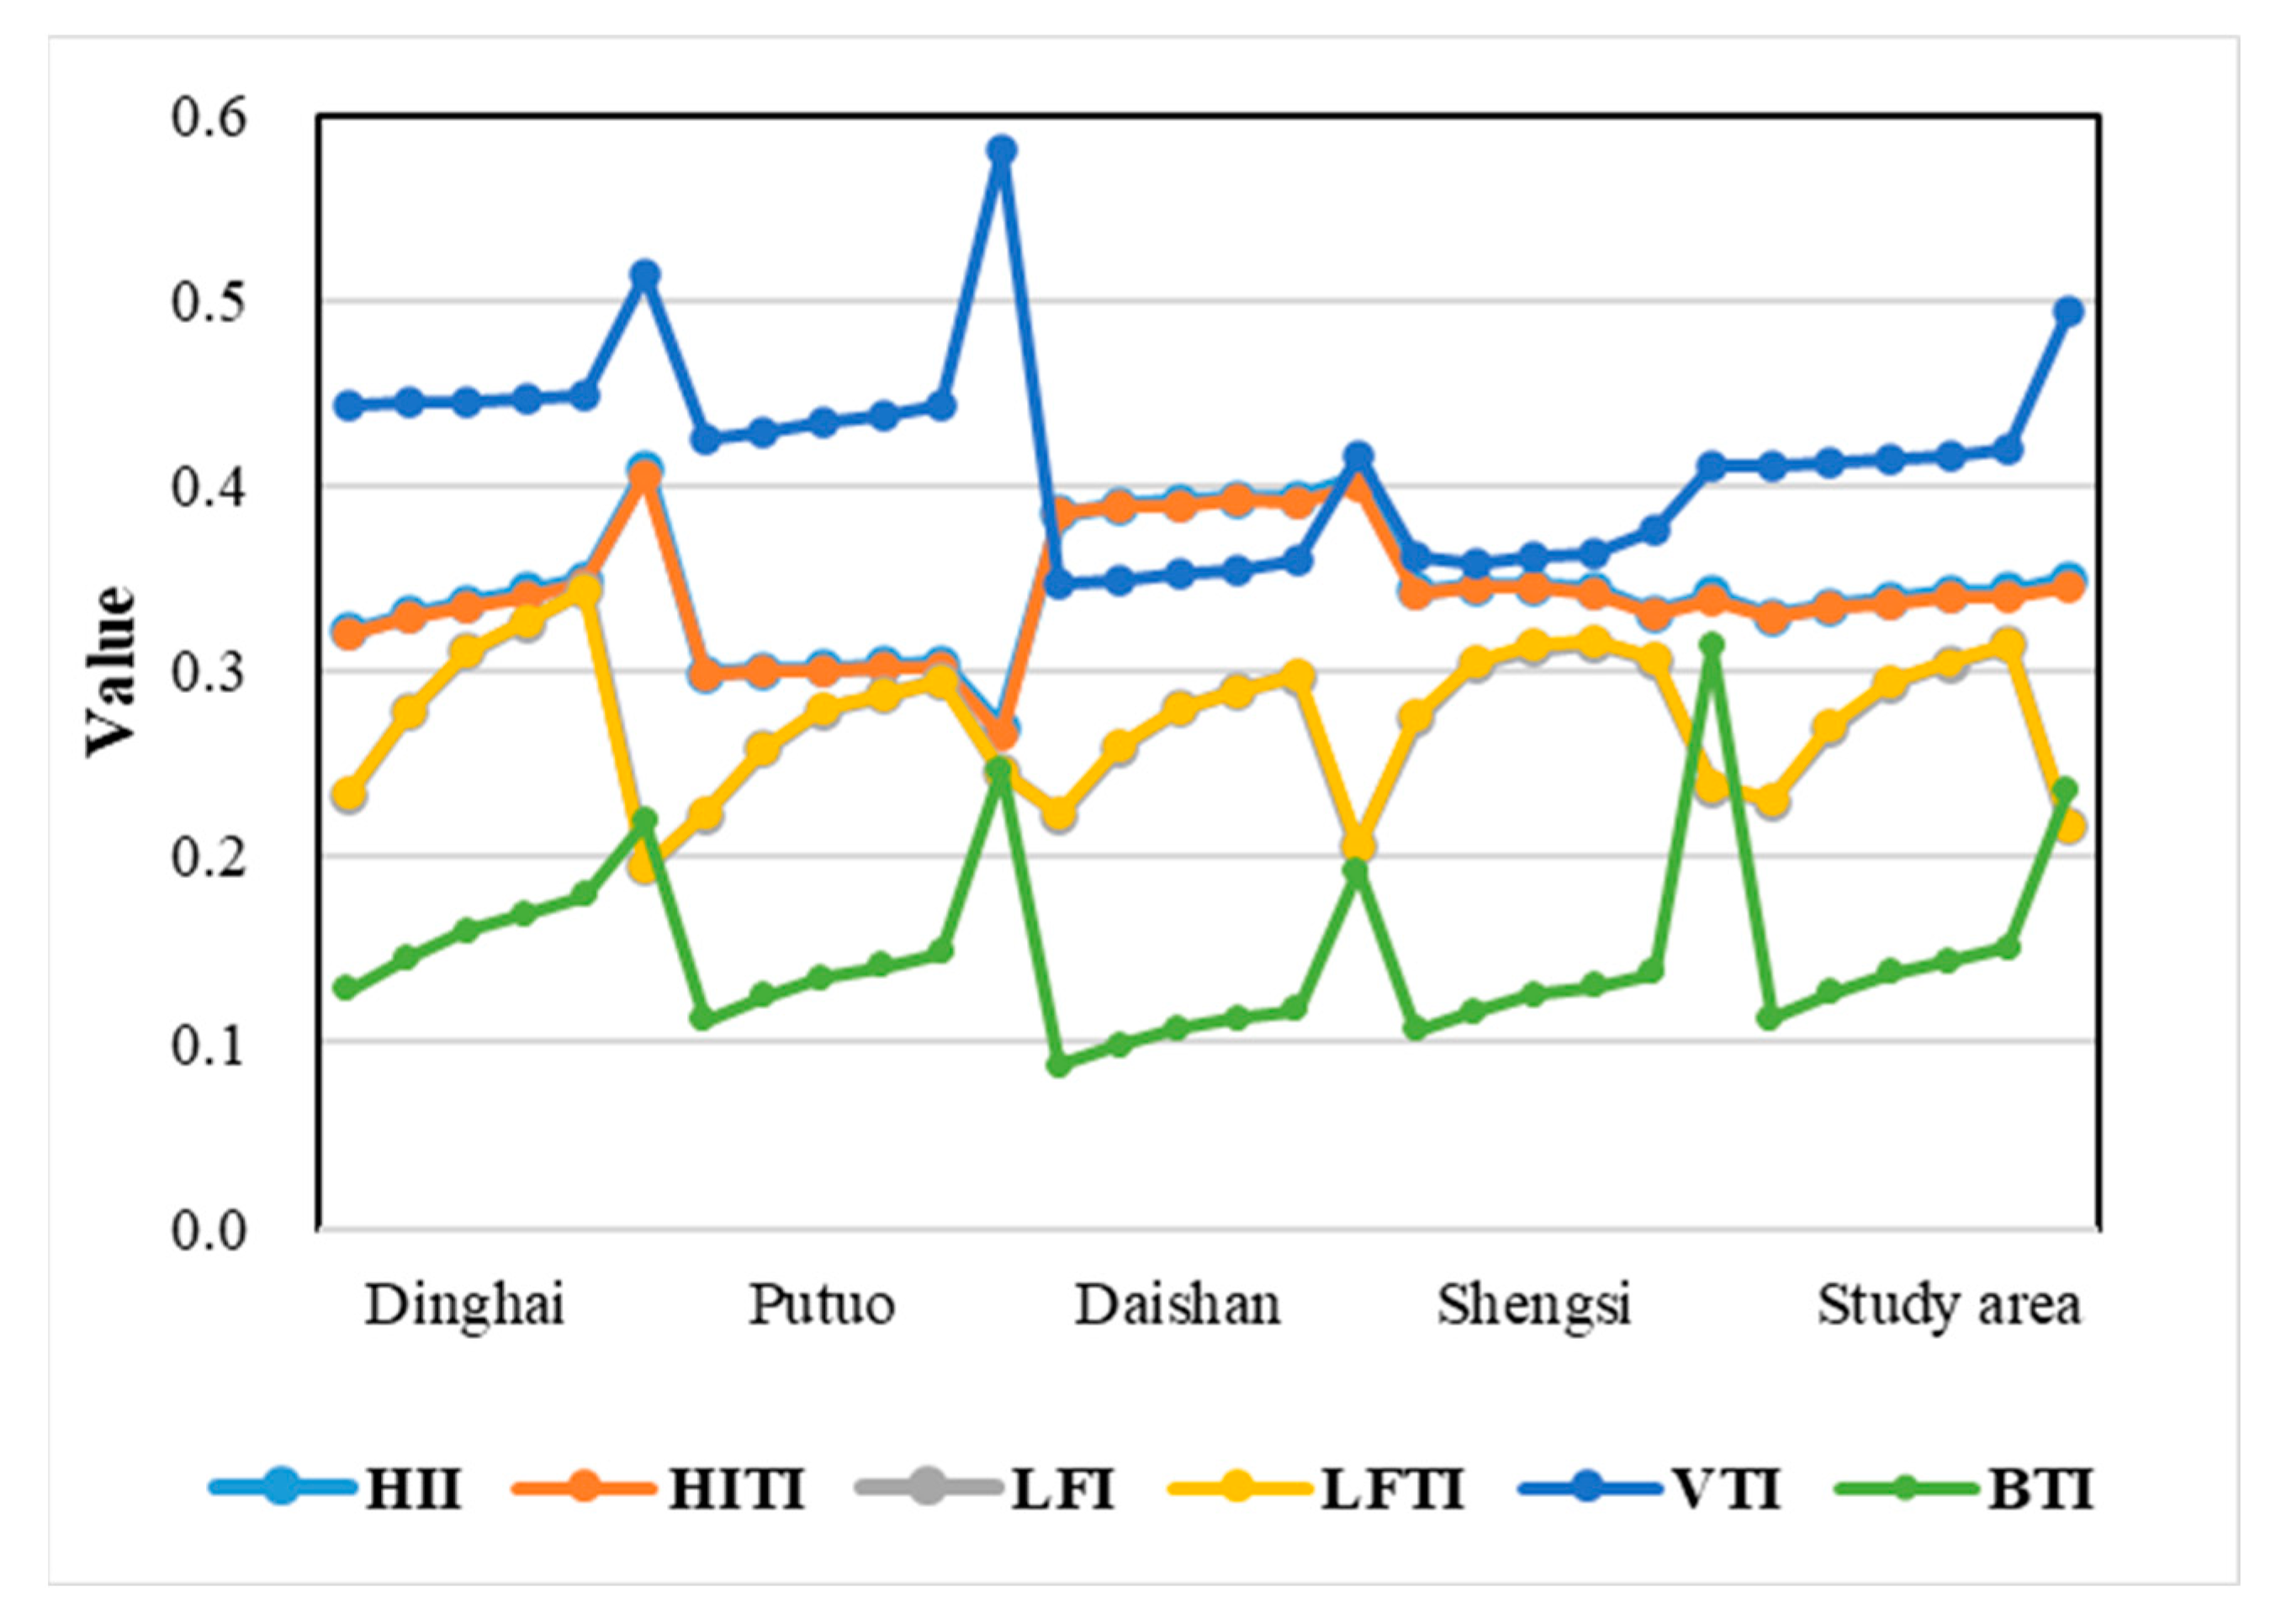
4.2.2. Island Group Scale

The island group scale is a unique spatial scale in island ecological research. The study area was divided into four island groups, Dinghai, Putuo, Daishan, and Shengsi, according to administrative divisions. Different island groups differ in terms of climate, geographic location, population, policies, and resources [74]. The landscape pattern of the island groups may be influenced by the socioeconomic level and industrial development structure [75,76]. Therefore, the landscape pattern of island groups is derived from the spatial statistics of landscape indices at the minimum grid scale (Figure 14). The environmental factors related to the spatial characteristics of the island group landscape pattern are discussed. As an important part of the “One Circle” layout of the Zhoushan Archipelago New Area, the proportion of primary, secondary, and tertiary industries in Daishan is 9.4, 24.1, and 66.5%, respectively [77]. Daishan is a vigorously developing port industry and concentrates on the construction of the core circle of port and shipping logistics [77], which leads to the highest proportion of high-intensity human interference (Figure S16) and the highest degree of human disturbance. With the successive completion of sea-crossing bridges between the islands and mainland and among islands in Dinghai, they have strengthened the links, rendered population migration and tourism more convenient, rendered economic development and urban expansion more rapid, and increased the intensity of development and utilization [9,76], which result in the highest proportion of medium- and high-landscape fragmentation (Figure S16) and the highest degree of landscape fragmentation. Dinghai and Putuo own Zhoushan Island, the largest island in the Zhoushan Archipelago. It is the main area for the development and opening up of the Zhoushan Archipelago New Area and plays an important role in radiating and driving the economic development of the surrounding islands [78]. The proportion of tertiary industry in Dinghai and Putuo is 64% and 60%, respectively [79,80]. In addition, the islands of Dinghai and Putuo are relatively large and located in lower-latitude areas, which can provide a good growing environment for vegetation and more space for urban development. As a result, Dinghai and Putuo have larger vegetation and building spaces than Shengsi and Daishan.

4.3. The Contributions and Limitations of Island Landscape Pattern Studies from Three-Dimensional Perspectives

The study of island landscape patterns from 3D perspectives and multiple spatial scales was critical to understanding the complex dynamics and processes that shape these unique ecosystems. It contributed to our conceptual understanding of ecological processes, expanded research methods, and informed effective conservation strategies for island environments. First, the understanding of spatial heterogeneity and scale dependence was enhanced. Examining island landscapes from three-dimensional perspectives better captures the spatial heterogeneity and scale dependence within archipelagic ecosystems [52,81]. This included variations in island topography, habitat, and anthropogenic landscapes across regions and scales [6,82]. Moreover, landscape gradients were identified. The three-dimensional perspective analysis contributed to identifying landscape gradients, such as topographic gradients, oceanic gradients, or anthropogenic gradients, which affect species distribution, community composition, and ecosystem function [48]. Landscape fragmentation and habitat connectivity were understood in depth. The three-dimensional perspective analysis allowed for both a detailed assessment of landscape fragmentation by analyzing the extent and configuration of dispersed habitats across different topographies and quantifying habitat connectivity across elevations, slopes, or landforms [15,69]. Second, exploring island landscape patterns from three-dimensional perspectives promoted the development of research methods. It promoted the integration of remote sensing (RS), geographic information systems (GIS), and modeling techniques to acquire and process multi-source remote sensing data for large island groups and to construct and quantify landscape metrics at multiple spatial scales for spatial analysis and visualization of complex landscape patterns [51,52]. These advances not only helped to improve the accuracy and efficiency of island landscape studies but also helped to apply landscape ecology and geospatial analysis. Finally, through a comprehensive understanding of island ecosystems, the three-dimensional perspective analysis will help to improve conservation planning in the future. It will enable researchers and conservation practitioners to identify critical areas for biodiversity conservation, prioritize habitat restoration efforts [41], and design networks of protected areas that consider horizontal and vertical connectivity [83].
The main limitations of studying island landscape patterns from three-dimensional perspectives and potential directions to overcome them can be categorized into four aspects. The first is data availability. High-quality and high-resolution data are required for three-dimensional perspective analysis, yet obtaining comprehensive and accurate data on island topography, land cover, vegetation structure, and building structure can be challenging. Overcoming this limitation requires advances in remote sensing technology, such as LiDAR or photogrammetry to collect detailed three-dimensional data [39,40]. Second, there is a potential scale mismatch between available data and ecological processes on the islands. Utilizing a multi-scale approach, integrating data from a variety of sources, and developing robust scaling methods can help overcome this limitation [50,63]. Third, there is a lack of integrated analytical techniques. Traditional analytical techniques for studying landscape patterns, such as patch metrics and spatial statistics, may not fully capture the complexity of three-dimensional landscapes [47,52]. The development of integrated analysis methods for island landscape patterns that incorporate structural indicators (e.g., height, shape, and vertical stratification) and three-dimensional spatial relationships is critical [49]. Finally, interpreting the ecological significance of three-dimensional landscape patterns can be challenging. Further research is needed to develop ecological models that integrate three-dimensional landscape data and incorporate ecological processes that operate across multiple dimensions.

5. Conclusions

This study aims to measure the multi-scale landscape pattern of China’s largest archipelago from three-dimensional perspectives. The island landscape from a three-dimensional perspective not only has two-dimensional landscape information but also includes information such as the location and attributes of the landscape in the three-dimensional space. Firstly, the island landscape pattern evaluation model from a dual three-dimensional (dual-3D) perspective was established. The dual-3D perspective has been proposed for the types and spatial characteristics of island landscapes. It refers to placing a three-dimensional perspective on the surface landscape based on topography and the landscape elements above the surface. The first 3D perspective mainly relies on the topography, and its spatial changes affect the composition and configuration of surface landscapes. The second 3D perspective focuses on the landscape elements above the surface, including natural landscapes dominated by vegetation and artificial landscapes dominated by buildings. The model selected high-resolution landscape and topographic data, as well as easily accessible vegetation and building data. Moreover, it combined existing research methods and integrated four evaluation directions: human interference, landscape fragmentation, vegetation space, and building space. This ensured the accuracy, applicability, and comprehensiveness of island landscape pattern evaluation from a three-dimensional perspective. These are the differences and advantages between this study and previous studies. There are three steps in the model establishment process: the first step is to calculate the human interference index (HII) and landscape fragmentation index (LFI) based on landscape type data from a two-dimensional perspective. The second step is to establish the human interference three-dimensional index (HITI) and landscape fragmentation three-dimensional index (LFTI) based on landscape type data and high-resolution topographic data from the first 3D perspective. The third step is to establish the vegetation three-dimensional index (VTI) and the building three-dimensional index (BTI) based on the two-dimensional and three-dimensional information of vegetation and buildings. Using the dual-3D model and developing specific landscape indices based on this viewpoint is an innovative step in understanding the complex spatial characteristics of island ecosystems. This work answered the first scientific question raised at the end of the introduction section.
The model considered evaluating the island landscape pattern from multiple perspectives and spatial scales. The largest archipelago in China, the Zhoushan Archipelago, was used as the study area to conduct multi-scale evaluations of landscape patterns from a three-dimensional perspective, including human interference, landscape fragmentation, vegetation space, and building space. The landscape indices were calculated based on six spatial scales: 100 m × 100 m, 200 m × 200 m, 300 m × 300 m, 400 m × 400 m, 500 m × 500 m grid scales, and one island scale. Landscape indices such as HITI, LFTI, VTI, and BTI established at multiple spatial scales can help reveal spatial heterogeneity within and between islands. High HITI was mostly distributed on the edges of islands and smaller islands. High LFTI was mostly distributed in the transition areas from plain to mountain and larger islands. High VTI was mostly distributed in the mountainous and hilly areas and southern islands of the study area. High BTI was mostly distributed in plain areas and islands, where the administrative centers of the four districts and counties were located. Moreover, at the grid scale, the LFTI was higher than the island scale, the HITI, VTI, and BTI were lower than the island scale, and the HITI, LFTI, VTI, and BTI increased with an increase in evaluation units. The perspective changes of landscape indices (ΔHITI and ΔLFTI) were analyzed. The HITI was smaller than the HII, and the LFTI was larger than the LFI. With an increase in evaluation units, the ΔHITI and ΔLFTI decreased. The overall distribution of ΔHITI tended to be concentrated, while the overall distribution of ΔLFTI tended to be dispersed. Therefore, they help reveal the differences in landscape patterns from different perspectives, highlighting spatial heterogeneity at different scales. Interestingly, how landscape indices respond differently to evaluations from 2D to 3D and how their behavior changes with changes in evaluation units provide deeper insights into the complexity of archipelagic landscapes. In addition, at the island group scale, landscape patterns differed significantly between island groups. Daishan possessed the highest HITI, Dinghai possessed the highest LFTI, and Dinghai and Putuo possessed higher VTI and BTI. Spatial matching analyses among landscape indices were carried out at the grid and island scales. Based on this, targeted strategies for optimizing landscape patterns and suggestions for supporting sustainable development were proposed for different island groups and the entire archipelago. These correspond to the second scientific question.
To explore and discover the environmental factors significantly correlated to the landscape pattern of islands, correlation analyses between environmental factors and landscape indices were carried out at the grid scale and island scale, respectively. The correlations between these indices and environmental factors such as altitude, slope, and island area further enriched the understanding of archipelago landscape dynamics. They provided valuable insights into the complex interactions between natural features and human impacts within the archipelago. At the grid scale, topographic, marine, and anthropogenic factors exhibited significant correlations with landscape indices, and the topographic factors had higher correlations. Within the islands, areas with higher elevation and slope, areas away from the ocean, or areas away from the main road usually had a larger vegetation space, while the intensity of human disturbance and landscape fragmentation were lower and the building space was smaller. At the island scale, significant correlations were shown between topographic and appearance factors and landscape indices. Islands with higher elevations or slopes had a lower intensity of human disturbance, a higher degree of landscape fragmentation, and a larger vegetation space. Islands with larger areas or complex shapes exhibited high levels of landscape fragmentation. Therefore, topographic factors (DEM and Sl), topography-based marine factors (CDTS), and anthropogenic factors (CDTR) had high correlations with the spatial characteristics of landscape patterns within the islands. Topographic factors (DEM and Sl) and appearance factors (IA, ISA, and ISI) had high correlations with the spatial characteristics of landscape patterns between islands. In addition, the level of economic development and economic structure had high correlations with the spatial characteristics of landscape patterns between island groups. These correspond to the third scientific question.
Three scientific questions posed earlier were answered, namely, the establishment of the island landscape pattern evaluation model based on a dual-3D perspective, the analyses of spatial characteristics and changes of landscape indices and their perspective differences at different spatial scales, and the analyses of environmental factors significantly correlated with the spatial characteristics of island landscape patterns. Therefore, compared with a two-dimensional perspective, the landscape pattern indices of islands from a three-dimensional perspective have changed significantly.

Supplementary Materials

The following supporting information can be downloaded at: https://www.mdpi.com/article/10.3390/rs15245627/s1, Table S1: Island information in the study area; Figure S1: The spatial distribution of islands in the study area. Islands were numbered in descending order of area. The name and attribute information are shown in Table S1; Figure S2: Spatial distribution of the HII at different spatial scales; Figure S3: Spatial distribution of the LFI at different spatial scales; Figure S4: Spatial distribution of the NP1 at different spatial scales; Figure S5: Spatial distribution of the NP2 at different spatial scales; Figure S6: Spatial distribution of the TE1 at different spatial scales; Figure S7: Spatial distribution of the TE2 at different spatial scales; Figure S8: Spatial distribution of the AWMSI1 at different spatial scales; Figure S9: Spatial distribution of the AWMSI2 at different spatial scales; Figure S10: Spatial distribution of the LII1 at different spatial scales; Figure S11: Spatial distribution of the LII2 at different spatial scales; Figure S12: Spatial distribution of the VP at different spatial scales; Figure S13: Spatial distribution of the VVI at different spatial scales; Figure S14: Spatial distribution of the BP at different spatial scales; Figure S15: Spatial distribution of the BVI at different spatial scales; Figure S16: Area proportion of landscape indices for different island groups.

Author Contributions

Conceptualization, Y.C., J.G. and Y.-P.W.; Methodology, Y.Q., Y.C. and J.G.; Software, Y.Q., Y.C. and Z.Z.; Validation, Y.Q.; Formal Analysis, Y.Q. and Y.C.; Investigation, Y.Q., Y.C., Z.Z. and Z.L.; Resources, Y.Q.; Data Curation, Z.Z. and Z.L.; Writing—Original Draft Preparation, Y.Q.; Writing—Review and Editing, Y.Q., Y.C. and J.G.; Visualization, Y.Q. and Y.C.; Supervision, Y.C., J.G. and Y.-P.W.; Project Administration, Y.C. and J.G.; Funding Acquisition, Y.C. and J.G. All authors have read and agreed to the published version of the manuscript.

Funding

This research was funded by the National Key Research and Development Program of China (No. 2023YFC3108103), the Basic Scientific Fund for National Public Research Institutes of China (No. 2021S02), and the Fundamental Research Funds for the Central Universities (No. 14380100).

Data Availability Statement

Data is contained within the article or Supplementary Material.

Conflicts of Interest

The authors declare no conflict of interests.

Abbreviations

2Dtwo-dimensional perspective
3Dthree-dimensional perspective
HIIhuman interference index
HITIhuman interference three-dimensional index
ΔHITIdifference between HITI and HII
LFIlandscape fragmentation index
LFTIlandscape fragmentation three-dimensional index
ΔLFTIdifference between LFTI and LFI
VTIvegetation three-dimensional index
BTIbuilding three-dimensional index
NPnumber of patches
TEtotal edge
AWMSIarea-weighted mean shape index
LIIlandscape isolated index
VParea proportion of vegetation
BParea proportion of buildings
VVIvegetation volume index
BVIbuilding volume index
ACRarea change rate
DEMmean elevation
Slmean slope
Asmean aspect
EDTSEuclidean distance to the sea
CDTScost distance to the sea
EDTREuclidean distance to the main road
CDTRcost distance to the main road
IAisland area
ISAisland surface area
ISIisland shape index
DTMdistance to the mainland
DTZdistance to the Zhoushan Island

References

  1. Zhang, H.; Xiao, Y.; Deng, Y. Island ecosystem evaluation and sustainable development strategies: A case study of the Zhoushan Archipelago. Glob. Ecol. Conserv. 2021, 28, e01603. [Google Scholar] [CrossRef]
  2. Matias, T.P.; Leonel, J.; Imperador, A.M. A systemic environmental impact assessment on tourism in island and coastal ecosystems. Environ. Dev. 2022, 44, 100765. [Google Scholar] [CrossRef]
  3. Kurniawan, F.; Adrianto, L.; Bengen, D.G.; Prasetyo, L.B. Patterns of Landscape Change on Small Islands: A Case of Gili Matra Islands, Marine Tourism Park, Indonesia. Procedia—Soc. Behav. Sci. 2016, 227, 553–559. [Google Scholar] [CrossRef]
  4. Li, L.; Huang, X.; Wu, D.; Wang, Z.; Yang, H. Optimization of ecological security patterns considering both natural and social disturbances in China’s largest urban agglomeration. Ecol. Eng. 2022, 180, 106647. [Google Scholar] [CrossRef]
  5. Nel, R.; Mearns, K.F.; Jordaan, M.; Goethals, P. Towards understanding the role of islandness in shaping socio-ecological systems on SIDS: The socio-ecological islandscape concept. Ecol. Inform. 2021, 62, 101264. [Google Scholar] [CrossRef]
  6. Chi, Y.; Shi, H.; Zheng, W.; Wang, E. Archipelagic landscape patterns and their ecological effects in multiple scales. Ocean Coast. Manag. 2018, 152, 120–134. [Google Scholar] [CrossRef]
  7. Steibl, S.; Gebauer, G.; Laforsch, C. Impacts on food web properties of island invertebrate communities vary between different human land uses. Sci. Total Environ. 2022, 831, 154838. [Google Scholar] [CrossRef]
  8. Nori, J.; Villalobos, F.; Osorio-Olvera, L.; Loyola, R. Insufficient protection and intense human pressure threaten islands worldwide. Perspect. Ecol. Conserv. 2022, 20, 223–230. [Google Scholar] [CrossRef]
  9. Ma, X.; de Jong, M.; Sun, B.; Bao, X. Nouveauté or Cliché? Assessment on island ecological vulnerability to Tourism: Application to Zhoushan, China. Ecol. Indic. 2020, 113, 106247. [Google Scholar] [CrossRef]
  10. Xi, H.; Cui, W.; Cai, L.; Chen, M.; Xu, C. Evaluation and Prediction of Ecosystem Service Value in the Zhoushan Islands Based on LUCC. Sustainability 2021, 13, 2302. [Google Scholar] [CrossRef]
  11. Šálek, M.; Riegert, J.; Krivopalova, A.; Cukor, J. Small islands in the wide open sea: The importance of non-farmed habitats under power pylons for mammals in agricultural landscape. Agric. Ecosyst. Environ. 2023, 351, 108500. [Google Scholar] [CrossRef]
  12. Ai, J.; Yu, K.; Zeng, Z.; Yang, L.; Liu, Y.; Liu, J. Assessing the dynamic landscape ecological risk and its driving forces in an island city based on optimal spatial scales: Haitan Island, China. Ecol. Indic. 2022, 137, 108771. [Google Scholar] [CrossRef]
  13. Han, Z.; Cui, S.; Yan, X.; Liu, C.; Li, X.; Zhong, J.; Wang, X. Guiding sustainable urban development via a multi-level ecological framework integrating natural and social indicators. Ecol. Indic. 2022, 141, 109142. [Google Scholar] [CrossRef]
  14. Duncan, J.M.A.; Haworth, B.; Boruff, B.; Wales, N.; Biggs, E.M.; Bruce, E. Managing multifunctional landscapes: Local insights from a Pacific Island Country context. J. Environ. Manag. 2020, 260, 109692. [Google Scholar] [CrossRef] [PubMed]
  15. Cadavid-Florez, L.; Laborde, J.; McLean, D.J. Isolated trees and small woody patches greatly contribute to connectivity in highly fragmented tropical landscapes. Landsc. Urban Plan. 2020, 196, 103745. [Google Scholar] [CrossRef]
  16. Lazaro-Lobo, A.; Martin de Agar, P.; de Pablo, C.T.L. Spatial configuration of patches with different ecological maturity: Implications for service supply at the landscape level. J. Environ. Manag. 2023, 342, 118094. [Google Scholar] [CrossRef]
  17. Li, Y.; Sun, Y.; Li, J. Heterogeneous effects of climate change and human activities on annual landscape change in coastal cities of mainland China. Ecol. Indic. 2021, 125, 107561. [Google Scholar] [CrossRef]
  18. Yang, H.; Zhong, X.; Deng, S.; Nie, S. Impact of LUCC on landscape pattern in the Yangtze River Basin during 2001–2019. Ecol. Inform. 2022, 69, 101631. [Google Scholar] [CrossRef]
  19. Liu, Y.; Lu, Y.; Fu, B.; Zhang, X. Landscape pattern and ecosystem services are critical for protected areas’ contributions to sustainable development goals at regional scale. Sci. Total Environ. 2023, 881, 163535. [Google Scholar] [CrossRef]
  20. Shifaw, E.; Sha, J.; Li, X. Detection of spatiotemporal dynamics of land cover and its drivers using remote sensing and landscape metrics (Pingtan Island, China). Environ. Dev. Sustain. 2018, 22, 1269–1298. [Google Scholar] [CrossRef]
  21. Zhang, Y.; Zhan, C.; Wang, H.; Gao, Y. Evolution and reconstruction of settlement space in tourist islands: A case study of Dachangshan Island, Changhai County. Environ. Dev. Sustain. 2021, 24, 9777–9808. [Google Scholar] [CrossRef]
  22. Li, Y.; Wen, H.; Wang, F. Analysis of the Evolution of Mangrove Landscape Patterns and Their Drivers in Hainan Island from 2000 to 2020. Sustainability 2022, 15, 759. [Google Scholar] [CrossRef]
  23. Kefalas, G.; Kalogirou, S.; Poirazidis, K.; Lorilla, R.S. Landscape transition in Mediterranean islands: The case of Ionian islands, Greece 1985–2015. Landsc. Urban Plan. 2019, 191, 103641. [Google Scholar] [CrossRef]
  24. Wang, D.G.; Dou, Y.J.; Shi, A.Q.; Cheng, J.; Lv, D.A. Research on the Evolution of Island Coastal Wetland Landscape Pattern. IOP Conf. Ser. Earth Environ. Sci. 2021, 787, 012053. [Google Scholar] [CrossRef]
  25. Shi, H.; Yin, L.; Gao, M. Landscape changes and their ecological effects of Miaodao Archipelago with human disturbances and under natural conditions in the past 30 years. J. Oceanol. Limnol. 2021, 39, 955–978. [Google Scholar] [CrossRef]
  26. Chi, Y.; Liu, D.; Wang, J.; Wang, E. Human negative, positive, and net influences on an estuarine area with intensive human activity based on land covers and ecological indices: An empirical study in Chongming Island, China. Land Use Policy 2020, 99, 104846. [Google Scholar] [CrossRef]
  27. Pan, Y.; Qiu, L.; Wang, Z.; Zhu, J.; Cheng, M. Unravelling the association between polycentric urban development and landscape sustainability in urbanizing island cities. Ecol. Indic. 2022, 143, 109348. [Google Scholar] [CrossRef]
  28. Chi, Y.; Zhang, Z.; Xie, Z.; Wang, J. How human activities influence the island ecosystem through damaging the natural ecosystem and supporting the social ecosystem? J. Clean. Prod. 2020, 248, 119203. [Google Scholar] [CrossRef]
  29. Ferrer-Valero, N.; Hernández-Calvento, L.; Hernández-Cordero, A.I. Human impacts quantification on the coastal landforms of Gran Canaria Island (Canary Islands). Geomorphology 2017, 286, 58–67. [Google Scholar] [CrossRef]
  30. Chi, Y.; Liu, D.; Wang, C.; Xing, W.; Gao, J. Island development suitability evaluation for supporting the spatial planning in archipelagic areas. Sci. Total Environ. 2022, 829, 154679. [Google Scholar] [CrossRef]
  31. Pena-Alonso, C.; Garcia-Romero, L.; Hernandez-Cordero, A.I.; Hernandez-Calvento, L. Beach vegetation as an indicator of human impacts in arid environments: Environmental conditions and landscape perception in the Canary Islands. J. Environ. Manag. 2019, 240, 311–320. [Google Scholar] [CrossRef] [PubMed]
  32. Chi, Y.; Liu, D. Measuring the island tourism development sustainability at dual spatial scales using a four-dimensional model: A case study of Shengsi archipelago, China. J. Clean. Prod. 2023, 388, 135775. [Google Scholar] [CrossRef]
  33. Liyun, W.; Weibin, Y.; Zhirong, J.; Shihong, X.; Dongjin, H. Ecosystem health assessment of Dongshan Island based on its ability to provide ecological services that regulate heavy rainfall. Ecol. Indic. 2018, 84, 393–403. [Google Scholar] [CrossRef]
  34. Lei, J.; Chen, Y.; Li, L.; Chen, Z.; Chen, X.; Wu, T.; Li, Y. Spatiotemporal change of habitat quality in Hainan Island of China based on changes in land use. Ecol. Indic. 2022, 145, 109707. [Google Scholar] [CrossRef]
  35. Liu, C.; Yang, M.; Hou, Y.; Zhao, Y.; Xue, X. Spatiotemporal evolution of island ecological quality under different urban densities: A comparative analysis of Xiamen and Kinmen Islands, southeast China. Ecol. Indic. 2021, 124, 107438. [Google Scholar] [CrossRef]
  36. Hazard, Q.C.K.; Froidevaux, J.S.P.; Yoh, N.; Moore, J.; Senawi, J.; Gibson, L.; Palmeirim, A.F. Foraging guild modulates insectivorous bat responses to habitat loss and insular fragmentation in peninsular Malaysia. Biol. Conserv. 2023, 281, 110017. [Google Scholar] [CrossRef]
  37. Ren, W.; Zhao, J.; Ma, X. Analysis of the spatial characteristics of inhalable particulate matter concentrations under the influence of a three-dimensional landscape pattern in Xi’an, China. Sustain. Cities Soc. 2022, 81, 103841. [Google Scholar] [CrossRef]
  38. Liu, M.; Hu, Y.-M.; Li, C.-L. Landscape metrics for three-dimensional urban building pattern recognition. Appl. Geogr. 2017, 87, 66–72. [Google Scholar] [CrossRef]
  39. Wang, X.; Xiang, H.; Niu, W.; Mao, Z.; Huang, X.; Zhang, F. Oblique photogrammetry supporting procedural tree modeling in urban areas. ISPRS J. Photogramm. Remote Sens. 2023, 200, 120–137. [Google Scholar] [CrossRef]
  40. Zhou, X.; Li, C. Mapping the vertical forest structure in a large subtropical region using airborne LiDAR data. Ecol. Indic. 2023, 154, 110731. [Google Scholar] [CrossRef]
  41. McNeil, D.J.; Fisher, G.; Fiss, C.J.; Elmore, A.J.; Fitzpatrick, M.C.; Atkins, J.W.; Cohen, J.; Larkin, J.L. Using aerial LiDAR to assess regional availability of potential habitat for a conservation dependent forest bird. For. Ecol. Manag. 2023, 540, 121002. [Google Scholar] [CrossRef]
  42. Zhang, J.; Wang, J.; Liu, G. Vertical Structure Classification of a Forest Sample Plot Based on Point Cloud Data. J. Indian Soc. Remote Sens. 2020, 48, 1215–1222. [Google Scholar] [CrossRef]
  43. Wang, S.; Liu, C.; Li, W.; Jia, S.; Yue, H. Hybrid model for estimating forest canopy heights using fused multimodal spaceborne LiDAR data and optical imagery. Int. J. Appl. Earth Obs. Geoinf. 2023, 122, 103431. [Google Scholar] [CrossRef]
  44. Li, F.-x.; Li, M.; Feng, X.-g. High-Precision Method for Estimating the Three-Dimensional Green Quantity of an Urban Forest. J. Indian Soc. Remote Sens. 2021, 49, 1407–1417. [Google Scholar] [CrossRef]
  45. Cao, S.; Du, M.; Zhao, W.; Hu, Y.; Mo, Y.; Chen, S.; Cai, Y.; Peng, Z.; Zhang, C. Multi-level monitoring of three-dimensional building changes for megacities: Trajectory, morphology, and landscape. ISPRS J. Photogramm. Remote Sens. 2020, 167, 54–70. [Google Scholar] [CrossRef]
  46. Guo, F.; Wu, Q.; Schlink, U. 3D building configuration as the driver of diurnal and nocturnal land surface temperatures: Application in Beijing’s old city. Build. Environ. 2021, 206, 108354. [Google Scholar] [CrossRef]
  47. Kong, F.; Wang, D.; Yin, H.; Dronova, I.; Fei, F.; Chen, J.; Pu, Y.; Li, M. Coupling urban 3-D information and circuit theory to advance the development of urban ecological networks. Conserv. Biol. 2021, 35, 1140–1150. [Google Scholar] [CrossRef]
  48. Yu, S.; Chen, Z.; Yu, B.; Wang, L.; Wu, B.; Wu, J.; Zhao, F. Exploring the relationship between 2D/3D landscape pattern and land surface temperature based on explainable eXtreme Gradient Boosting tree: A case study of Shanghai, China. Sci. Total Environ. 2020, 725, 138229. [Google Scholar] [CrossRef]
  49. Kedron, P.; Zhao, Y.; Frazier, A.E. Three dimensional (3D) spatial metrics for objects. Landsc. Ecol. 2019, 34, 2123–2132. [Google Scholar] [CrossRef]
  50. Wu, Q.; Li, Z.; Yang, C.; Li, H.; Gong, L.; Guo, F. On the Scale Effect of Relationship Identification between Land Surface Temperature and 3D Landscape Pattern: The Application of Random Forest. Remote Sens. 2022, 14, 279. [Google Scholar] [CrossRef]
  51. Ge, M.; Fang, S.; Gong, Y.; Tao, P.; Yang, G.; Gong, W. Understanding the Correlation between Landscape Pattern and Vertical Urban Volume by Time-Series Remote Sensing Data: A Case Study of Melbourne. ISPRS Int. J. Geo-Inf. 2021, 10, 14. [Google Scholar] [CrossRef]
  52. Guo, Z.; Wang, J.; Xu, H.; Wang, J.; Ma, J.; Zhang, Z. Construction of 3D landscape indexes based on oblique photogrammetry and its application for islands. Ecol. Inform. 2023, 75, 102112. [Google Scholar] [CrossRef]
  53. Zhu, Z.; Shen, Y.; Fu, W.; Zheng, D.; Huang, P.; Li, J.; Lan, Y.; Chen, Z.; Liu, Q.; Xu, X.; et al. How does 2D and 3D of urban morphology affect the seasonal land surface temperature in Island City? A block-scale perspective. Ecol. Indic. 2023, 150, 110221. [Google Scholar] [CrossRef] [PubMed]
  54. Cao, W.; Zhou, Y.; Li, R.; Li, X. Mapping changes in coastlines and tidal flats in developing islands using the full time series of Landsat images. Remote Sens. Environ. 2020, 239, 111665. [Google Scholar] [CrossRef]
  55. Zhoushan Natural Resources and Planning Bureau. Information and Data Related Natural Resources in Zhoushan City. 2021. Available online: http://zsblr.zhoushan.gov.cn/ (accessed on 15 March 2023).
  56. Jin, J.; Quan, Y. Assessment of marine ranching ecological development using DPSIR-TOPSIS and obstacle degree analysis: A case study of Zhoushan. Ocean Coast. Manag. 2023, 244, 106821. [Google Scholar] [CrossRef]
  57. Cheng, F.; Wei, C.; Tang, T.; Kong, J.; Mikhaylov, A. The Impact of Marine Economic Development on Energy Efficiency: The Case of Zhoushan Archipelago New Area in China. Int. J. Energy Res. 2023, 2023, 4476352. [Google Scholar] [CrossRef]
  58. Zhou, B.; Xu, J.-m.; Yu, H.; Wang, L.-t. Comprehensive assessment of ecological risks of Island destinations—A case of Mount Putuo Island, China. Ecol. Indic. 2023, 154, 110783. [Google Scholar] [CrossRef]
  59. Chen, Q.; Lin, Y.; Zhang, Y.; Wang, C.; Cai, A. Evaluation Framework for Determining the Developmental Suitability and Sustainability of Uninhabited Islands. J. Coast. Res. 2022, 38, 816–827. [Google Scholar] [CrossRef]
  60. Potapov, P.; Li, X.; Hernandez-Serna, A.; Tyukavina, A.; Hansen, M.C.; Kommareddy, A.; Pickens, A.; Turubanova, S.; Tang, H.; Silva, C.E.; et al. Mapping global forest canopy height through integration of GEDI and Landsat data. Remote Sens. Environ. 2021, 253, 112165. [Google Scholar] [CrossRef]
  61. Gruijter, J.J.; Bierkens, M.F.; Brus, D.J.; Knotters, M. Sampling for Natural Resource Monitoring; Springer: Berlin/Heidelberg, Germany, 2006; 332p. [Google Scholar]
  62. Wu, Q.; Guo, F.; Li, H.; Kang, J. Measuring landscape pattern in three dimensional space. Landsc. Urban Plan. 2017, 167, 49–59. [Google Scholar] [CrossRef]
  63. Chi, Y.; Zhang, Z.; Gao, J.; Xie, Z.; Zhao, M.; Wang, E. Evaluating landscape ecological sensitivity of an estuarine island based on landscape pattern across temporal and spatial scales. Ecol. Indic. 2019, 101, 221–237. [Google Scholar] [CrossRef]
  64. Ai, J.; Yang, L.; Liu, Y.; Yu, K.; Liu, J. Dynamic Landscape Fragmentation and the Driving Forces on Haitan Island, China. Land 2022, 11, 136. [Google Scholar] [CrossRef]
  65. Zhang, Y.; Xue, X.; Lin, Y.; Chen, H.; Chen, Q.; Huang, F.; Cheng, H. Developing a multiscale landscape assessment framework integrating multiobjectives to identify priority action plans for sustainable development of small inhabited islands. Ocean Coast. Manag. 2023, 243, 106735. [Google Scholar] [CrossRef]
  66. Zeng, P.; Sun, F.; Liu, Y.; Tian, T.; Wu, J.; Dong, Q.; Peng, S.; Che, Y. The influence of the landscape pattern on the urban land surface temperature varies with the ratio of land components: Insights from 2D/3D building/vegetation metrics. Sustain. Cities Soc. 2022, 78, 103599. [Google Scholar] [CrossRef]
  67. Qi, J.; Lin, E.S.; Yok Tan, P.; Chun Man Ho, R.; Sia, A.; Olszewska-Guizzo, A.; Zhang, X.; Waykool, R. Development and application of 3D spatial metrics using point clouds for landscape visual quality assessment. Landsc. Urban Plan. 2022, 228, 104585. [Google Scholar] [CrossRef]
  68. Xie, Z.; Li, X.; Zhang, Y.; Chen, S. Accelerated expansion of built-up area after bridge connection with mainland: A case study of Zhujiajian Island. Ocean Coast. Manag. 2018, 152, 62–69. [Google Scholar] [CrossRef]
  69. Guzmán-Colón, D.K.; Pidgeon, A.M.; Martinuzzi, S.; Radeloff, V.C. Conservation planning for island nations: Using a network analysis model to find novel opportunities for landscape connectivity in Puerto Rico. Glob. Ecol. Conserv. 2020, 23, e01075. [Google Scholar] [CrossRef]
  70. Manolaki, P.; Chourabi, S.; Vogiatzakis, I.N. A rapid qualitative methodology for ecological integrity assessment across a Mediterranean island’s landscapes. Ecol. Complex. 2021, 46, 100921. [Google Scholar] [CrossRef]
  71. Lin, Q.; Eladawy, A.; Sha, J.; Li, X.; Wang, J.; Kurbanov, E.; Thomas, A. Remotely Sensed Ecological Protection Redline and Security Pattern Construction: A Comparative Analysis of Pingtan (China) and Durban (South Africa). Remote Sens. 2021, 13, 2865. [Google Scholar] [CrossRef]
  72. Lorilla, R.S.; Poirazidis, K.; Detsis, V.; Kalogirou, S.; Chalkias, C. Socio-ecological determinants of multiple ecosystem services on the Mediterranean landscapes of the Ionian Islands (Greece). Ecol. Model. 2020, 422, 108994. [Google Scholar] [CrossRef]
  73. Phillips, J.D. Landscape change and climate attribution, with a case study of estuarine marshes. Geomorphology 2023, 430, 108666. [Google Scholar] [CrossRef]
  74. Zhoushan Municipal Statistics Bureau. Zhoushan Statistical Yearbook in 2021. 2022. Available online: http://zstj.zhoushan.gov.cn/ (accessed on 15 March 2023).
  75. Andersen, D. Secondary human impacts on the forest understory of Ulleung Island, South Korea, a temperate island. J. Ecol. Environ. 2019, 43, 20. [Google Scholar] [CrossRef]
  76. Pan, Y.; Zhai, M.; Lin, L.; Lin, Y.; Cai, J.; Deng, J.-s.; Wang, K. Characterizing the spatiotemporal evolutions and impact of rapid urbanization on island sustainable development. Habitat Int. 2016, 53, 215–227. [Google Scholar] [CrossRef]
  77. Bureau of Statistics of Daishan County in Zhoushan City. Daishan Statistical Yearbook in 2020. 2021. Available online: http://www.daishan.gov.cn/ (accessed on 4 April 2023).
  78. The People’s Government of Zhoushan Municipality. Master Plan of Zhoushan Archipelago New Area (City) in Zhejiang Province (2012–2030). 2022. Available online: https://www.zhoushan.gov.cn/ (accessed on 15 March 2023).
  79. Bureau of Statistics of Dinghai District in Zhoushan City. Dinghai Statistical Yearbook in 2020. 2022. Available online: http://www.dinghai.gov.cn/ (accessed on 4 April 2023).
  80. Bureau of Statistics of Putuo District in Zhoushan City. Putuo Statistical Yearbook in 2020. 2022. Available online: http://www.putuo.gov.cn/ (accessed on 4 April 2023).
  81. Collin, A.; Hench, J.L.; Pastol, Y.; Planes, S.; Thiault, L.; Schmitt, R.J.; Holbrook, S.J.; Davies, N.; Troyer, M. High resolution topobathymetry using a Pleiades-1 triplet: Moorea Island in 3D. Remote Sens. Environ. 2018, 208, 109–119. [Google Scholar] [CrossRef]
  82. Thompson-Ambriz, J.; Moreno, C.E.; Rangel-Salazar, J.L.; Martínez-Morales, M.A. Multi-scale response of wetland bird assemblages to landscape patterns on a Neotropical island: When wetland type matters more than size. Wetl. Ecol. Manag. 2020, 28, 251–269. [Google Scholar] [CrossRef]
  83. Carrasco, L.; Giam, X.; Papeş, M.; Sheldon, K. Metrics of Lidar-Derived 3D Vegetation Structure Reveal Contrasting Effects of Horizontal and Vertical Forest Heterogeneity on Bird Species Richness. Remote Sens. 2019, 11, 743. [Google Scholar] [CrossRef]
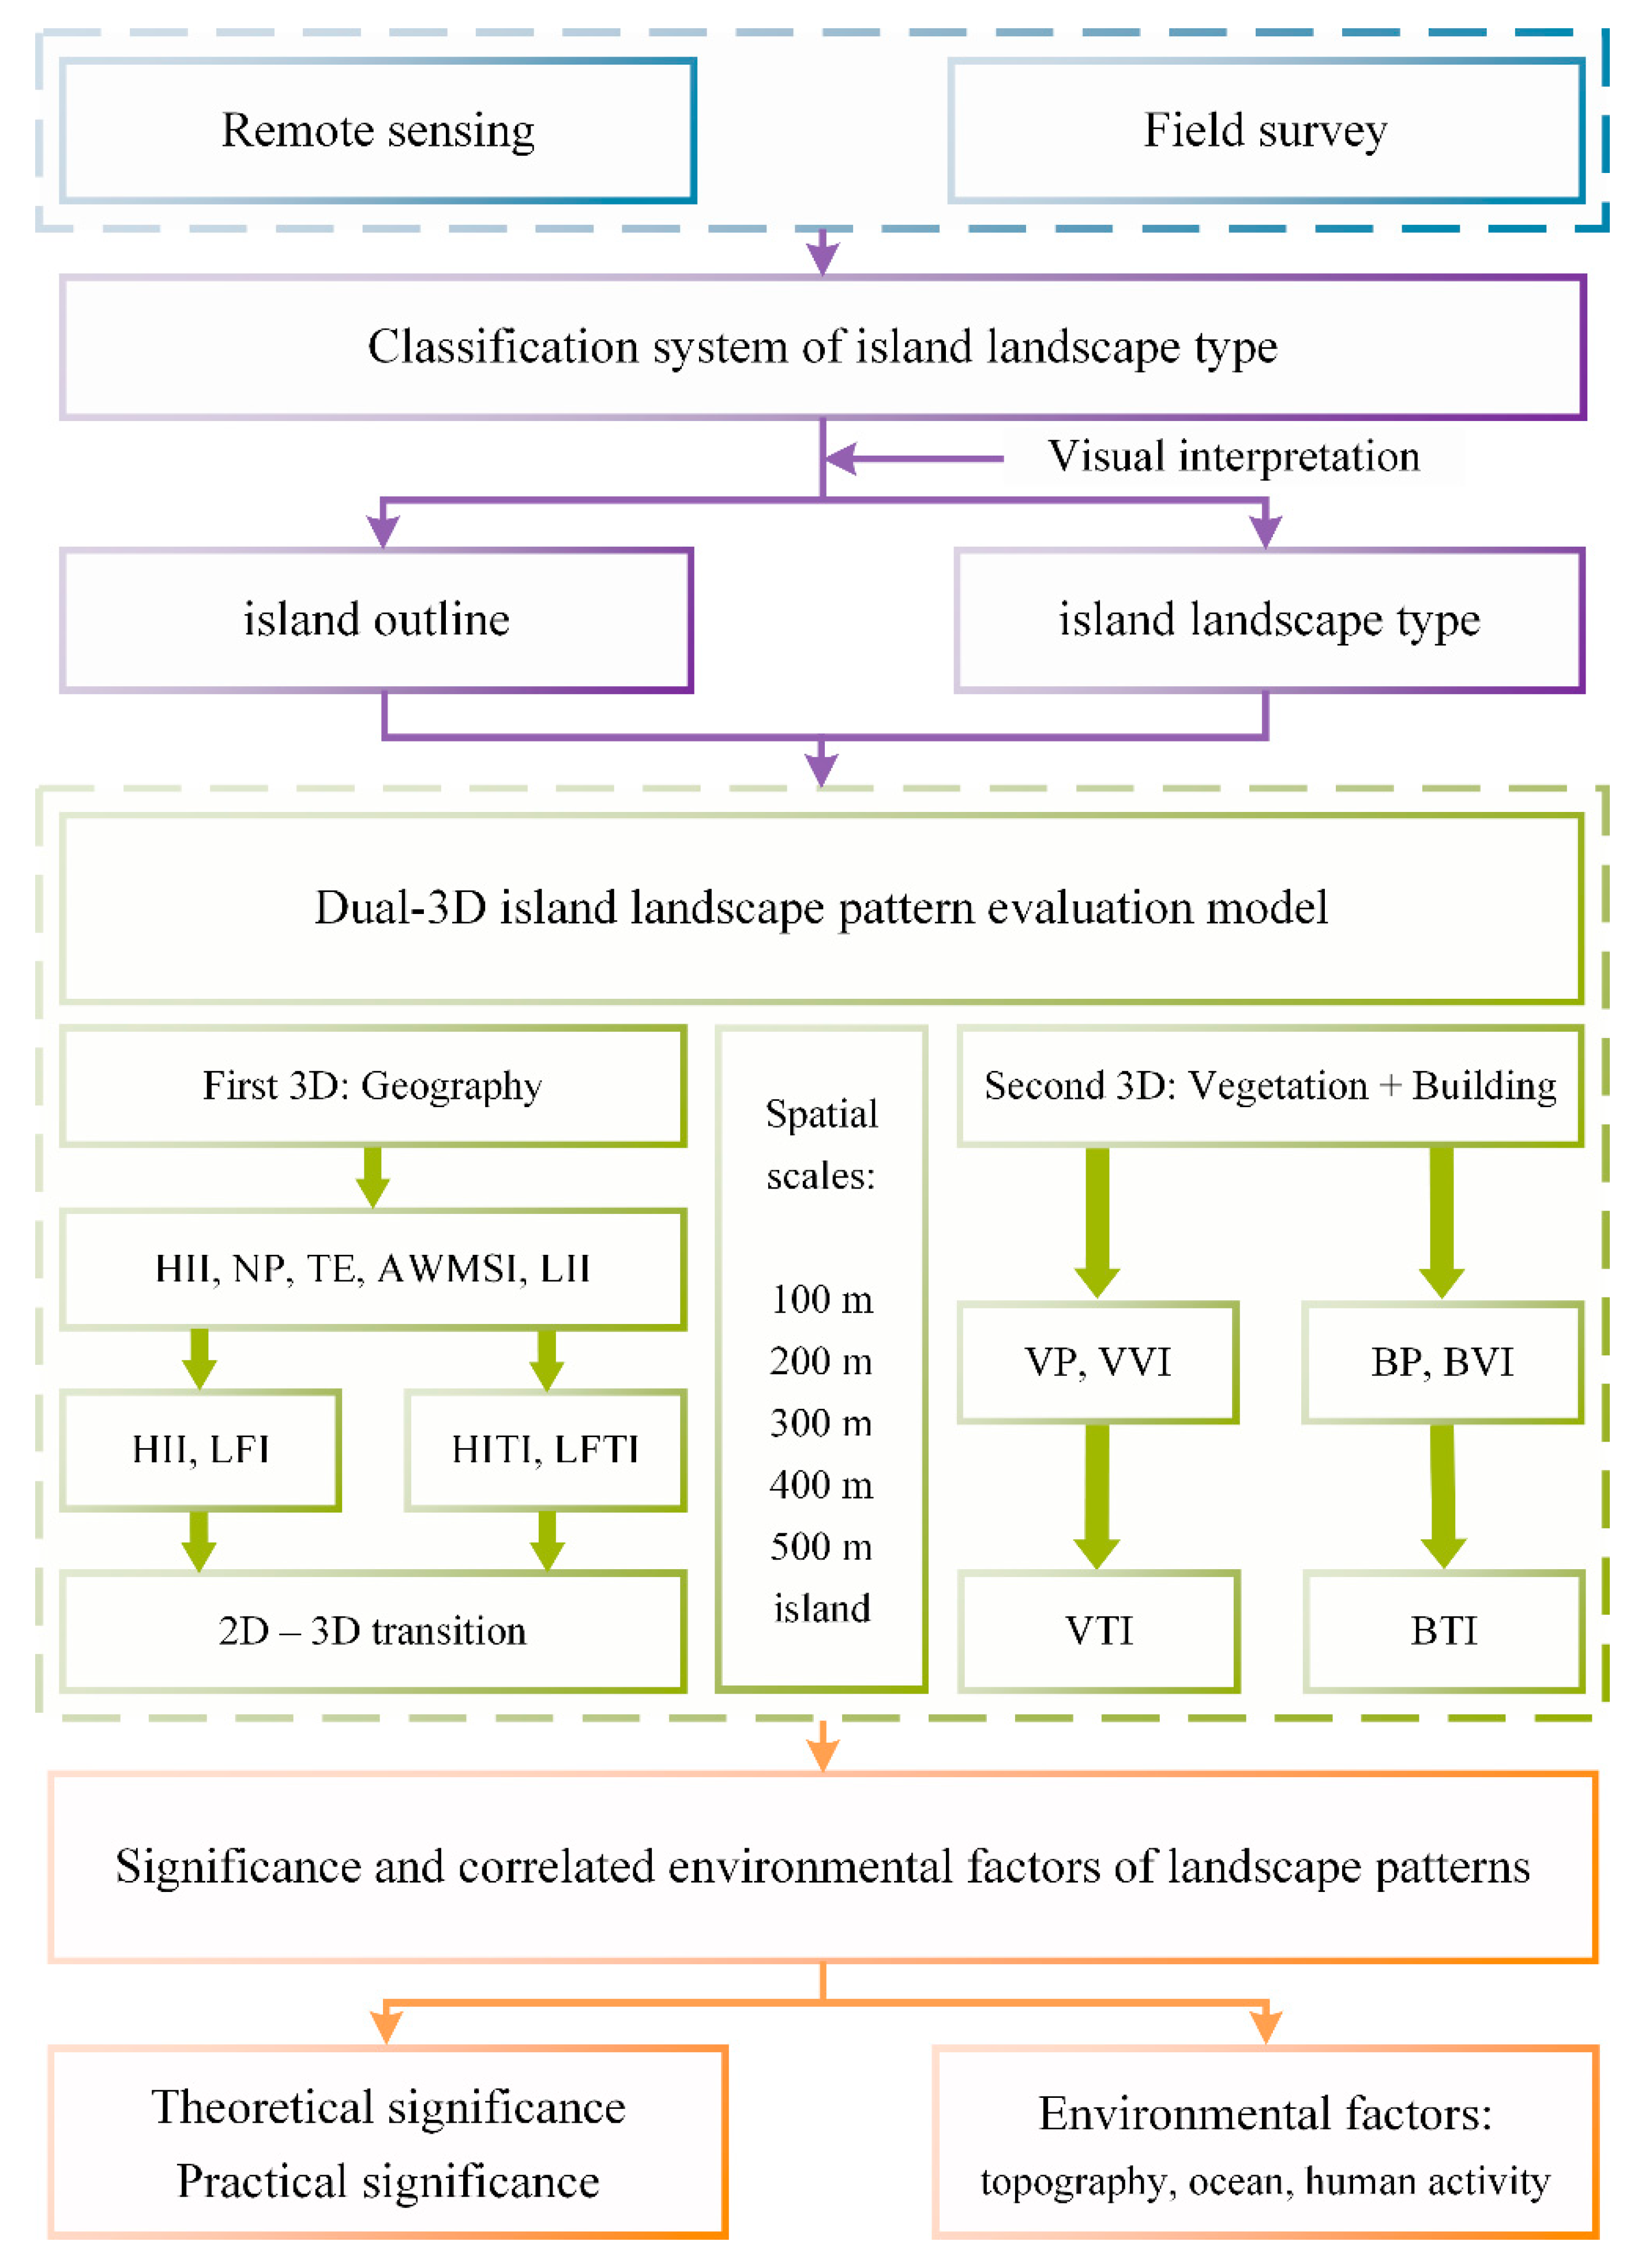
Figure 1. Framework for measuring the multi-scale landscape pattern of islands.
Remotesensing 15 05627 g001
Figure 2. Location of the study area. The map of China was provided by the Ministry of Natural Resources, China (left). The study area was divided into four districts and counties according to administrative division, namely Dinghai, Putuo, Daishan, and Shengsi, and was marked with dotted lines (right). The sea-crossing bridges were only for display and did not participate in the analyses. The spatial distribution and attribute information of islands are shown in Figure S1 and Table S1.
Remotesensing 15 05627 g002
Figure 3. Landscape type map.
Remotesensing 15 05627 g003
Figure 4. Sketch map of the Zhoushan Archipelago from a dual-3D perspective: The landscape texturing of the 3D model used the ArcScene module in ArcGIS 10.6. Vertical stretching was applied to better visualize the 3D characteristics of vegetation and buildings.
Remotesensing 15 05627 g004
Figure 5. Spatial distribution of the ACR at different spatial scales.
Remotesensing 15 05627 g005
Figure 6. Violin plots of the HII and HITI values.
Remotesensing 15 05627 g006
Figure 7. Spatial distribution of the HITI at different spatial scales.
Remotesensing 15 05627 g007
Figure 8. Spatial distribution of the ΔHITI at different spatial scales.
Remotesensing 15 05627 g008
Figure 9. Violin plots of the LFI and LFTI values.
Remotesensing 15 05627 g009
Figure 10. Spatial distribution of the LFTI at different spatial scales.
Remotesensing 15 05627 g010
Figure 11. Spatial distribution of the ΔLFTI at different spatial scales.
Remotesensing 15 05627 g011
Figure 12. Spatial distribution of the VTI at different spatial scales.
Remotesensing 15 05627 g012
Figure 13. Spatial distribution of the BTI at different spatial scales.
Remotesensing 15 05627 g013
Figure 14. Mean values of the landscape indices of island groups at different spatial scales.
Remotesensing 15 05627 g014
Table 1. Landscape type and statistical data of the study area.
Primary TypeSecondary TypePatch NumberProportion (%)Area (km2)Proportion (%)
1 Road1.1 Asphalt road900.17 33.172.43
1.2 Cement road14262.74 18.421.35
1.3 Dirt road2600.50 1.620.12
2 Dock and embankment2.1 Dock8311.59 9.940.73
2.2 Embankment12532.40 14.191.04
3 Industrial land3.1 Clean energy industry1270.24 0.590.04
3.2 Ordinary industry11612.23 79.435.82
3.3 Tank farm1230.24 8.950.66
4 Building land4.1 Residential building14,78828.37 105.677.74
4.2 Educational building1450.28 5.320.39
4.3 Business building19653.77 22.731.67
4.4 Tourism building3740.72 2.750.20
4.5 Temporary building18753.60 1.780.13
5 Public facility land5.1 Structured facility land524510.06 5.720.42
5.2 Unstructured facility land5791.11 5.590.41
5.3 Parking lot land3180.61 2.600.19
6 Quarrying area3170.61 25.421.86
7 Agricultural land7.1 Cultivated land961918.46 141.0710.34
7.2 Garden land1330.26 3.150.23
8 Water area8.1 Natural water area17353.33 15.601.14
8.2 Reservoir18993.64 23.491.72
8.3 Aquaculture pond4120.79 52.903.88
8.4 Harbor basin300.06 9.930.73
8.5 Temporary water area390.07 3.200.23
9 Bare land9.1 Natural bare land3200.61 5.590.41
9.2 Artificial bare land13382.57 46.203.39
10 Vegetation area10.1 Woodland22804.37 654.3747.96
10.2 Grassland31406.02 41.283.03
10.3 Wetland2950.57 23.811.75
Note: The primary types and secondary types of island landscape referenced previous studies [28], and were modified according to the actual characteristics of the study area.
Table 2. Area intersection matrices of different grades of landscape indices (km2).
Indices HITILFTIVTIBTI
GradeLMHLMHLMHLMH
HITIL 49815523911854967250
M 871759824011642726919
H 153135403253019322113
LFTIL41767120 23658445706429
M210214144 2441211003414876
H2513336 9558895588
VTIL7232295176254105 39754123
M10617544815979 1903810
H5387038115410 55030
BTIL64026717558540889345202535
M121122257269716510
H034102138735118170
HITIL 35824230795528613170
M 572291702242231026714149
H 10414133272601632293
LFTIL31350100 1474532850956
M270248133 2401781934358690
H3118535 11610116998946
VTIL5211262134228116 31075118
M91262644196119 2109024
H51810028522716 523140
BTIL59425815845546095286215509
M201692331031067811618
H0558648949114271
HITIL 27528840590508576260
M 482522051972891925418566
H 8913236249801473179
LFTIL261517 1184325140543
M3616930 21620724847311583
H5310190 118136279812360
VTIL003312210 25685110
M135111423110405 21813435
H101692022104667 502241
BTIL4489344512103035102
M70362910833493260179
H075242317231243512
HITI, human interference three-dimensional index; LFTI, landscape fragmentation three-dimensional index; VTI, vegetation three-dimensional index; BTI, building three-dimensional index. L, M, and H denote the low-, medium-, and high-level indices, respectively. The six colored matrix blocks from top to bottom denote the area intersection matrices of the indices at different spatial scales, i.e., 100 m × 100 m, 200 m × 200 m, 300 m × 300 m, 400 m × 400 m, 500 m × 500 m grid scale, and island scale.
Table 3. Correlation coefficients between the landscape indices and environmental factors.
ScalesVariablesHIIHITILFILFTIVTIBTI
100 m × 100 mDEM−0.571−0.571−0.353−0.3490.748−0.245
Sl−0.707−0.708−0.318−0.3120.843−0.306
As−0.082−0.0830.0980.0990.0720.111
EDTS−0.186−0.1860.0280.0290.2330.040
CDTS−0.390−0.390−0.219−0.2170.538−0.145
EDTR−0.110−0.110−0.190−0.1890.124−0.197
CDTR−0.436−0.435−0.305−0.3020.592−0.194
200 m × 200 mDEM−0.582−0.581−0.343−0.3390.770−0.254
Sl−0.731−0.732−0.312−0.3090.866−0.315
As−0.117−0.1180.1400.1400.1080.134
EDTS−0.196−0.1960.0900.0910.2520.064
CDTS−0.400−0.400−0.216−0.2140.562−0.151
EDTR−0.107−0.106−0.242−0.2410.109−0.224
CDTR−0.448−0.448−0.316−0.3140.619−0.207
300 m × 300 mDEM−0.585−0.585−0.297−0.2940.783−0.256
Sl−0.742−0.743−0.276−0.2730.874−0.315
As−0.148−0.1490.1780.1790.1430.155
EDTS−0.198−0.1990.1520.1540.2610.083
CDTS−0.405−0.404−0.187−0.1850.577−0.152
EDTR−0.104−0.103−0.280−0.2790.100−0.242
CDTR−0.454−0.453−0.290−0.2880.636−0.214
400 m × 400 mDEM−0.585−0.584−0.245−0.2430.789−0.249
Sl−0.744−0.745−0.239−0.2370.876−0.309
As−0.157−0.1580.1910.1910.1620.163
EDTS−0.197−0.1990.2060.2070.2680.100
CDTS−0.405−0.405−0.151−0.1490.587−0.148
EDTR−0.106−0.105−0.312−0.3110.092−0.257
CDTR−0.455−0.454−0.253−0.2510.647−0.213
500 m × 500 mDEM−0.584−0.584−0.188−0.1860.793−0.247
Sl−0.748−0.749−0.203−0.2020.877−0.309
As−0.182−0.1830.2210.2220.1880.177
EDTS−0.192−0.1940.2580.2590.2690.112
CDTS−0.402−0.402−0.104−0.1030.591−0.146
EDTR−0.114−0.112−0.333−0.3320.089−0.268
CDTR−0.453−0.452−0.207−0.2050.652−0.213
islandDEM−0.420−0.4250.4570.4570.5570.013
Sl−0.528−0.5300.1040.1020.626−0.223
As−0.056−0.0580.1360.1360.2200.198
IA0.0280.0210.8610.8620.0940.282
ISA0.0240.0170.8600.8610.0980.281
ISI−0.089−0.0920.4860.4870.0640.089
DTM−0.184−0.1820.0810.082−0.0710.064
DTZ−0.196−0.1940.0340.035−0.0430.040
HII, human interference index; HITI, human interference three-dimensional index; LFI, landscape fragmentation index; LFTI, landscape fragmentation three-dimensional index; VTI, vegetation three-dimensional index; BTI, building three-dimensional index; DEM, mean elevation; Sl, mean slope; As, mean aspect; EDTS, Euclidean distance to the sea; CDTS, cost distance to the sea; EDTR, Euclidean distance to the main road; CDTR, cost distance to the main road; IA, island area; ISA, island surface area; ISI, island shape index; DTM, distance to the mainland; DTZ, distance to the Zhoushan Island. The landscape indices and environmental factors have been standardized, and their values range from 0 to 1. Positive correlation coefficients 0.1–0.3, 0.3–0.5, and 0.5–1 were labeled with light blue, blue, and dark blue background colors, respectively. Negative correlation coefficients −0.1–−0.3, −0.3–−0.5, and −0.5–−1 were labeled with light orange, orange, and dark orange background colors, respectively. The change in background color from light to dark indicates an increasing correlation.
Disclaimer/Publisher’s Note: The statements, opinions and data contained in all publications are solely those of the individual author(s) and contributor(s) and not of MDPI and/or the editor(s). MDPI and/or the editor(s) disclaim responsibility for any injury to people or property resulting from any ideas, methods, instructions or products referred to in the content.