

Effect of Grassland Fires on Dust Storms in Dornod Aimag, Mongolia


Abstract
:1. Introduction
2. Materials and Methods
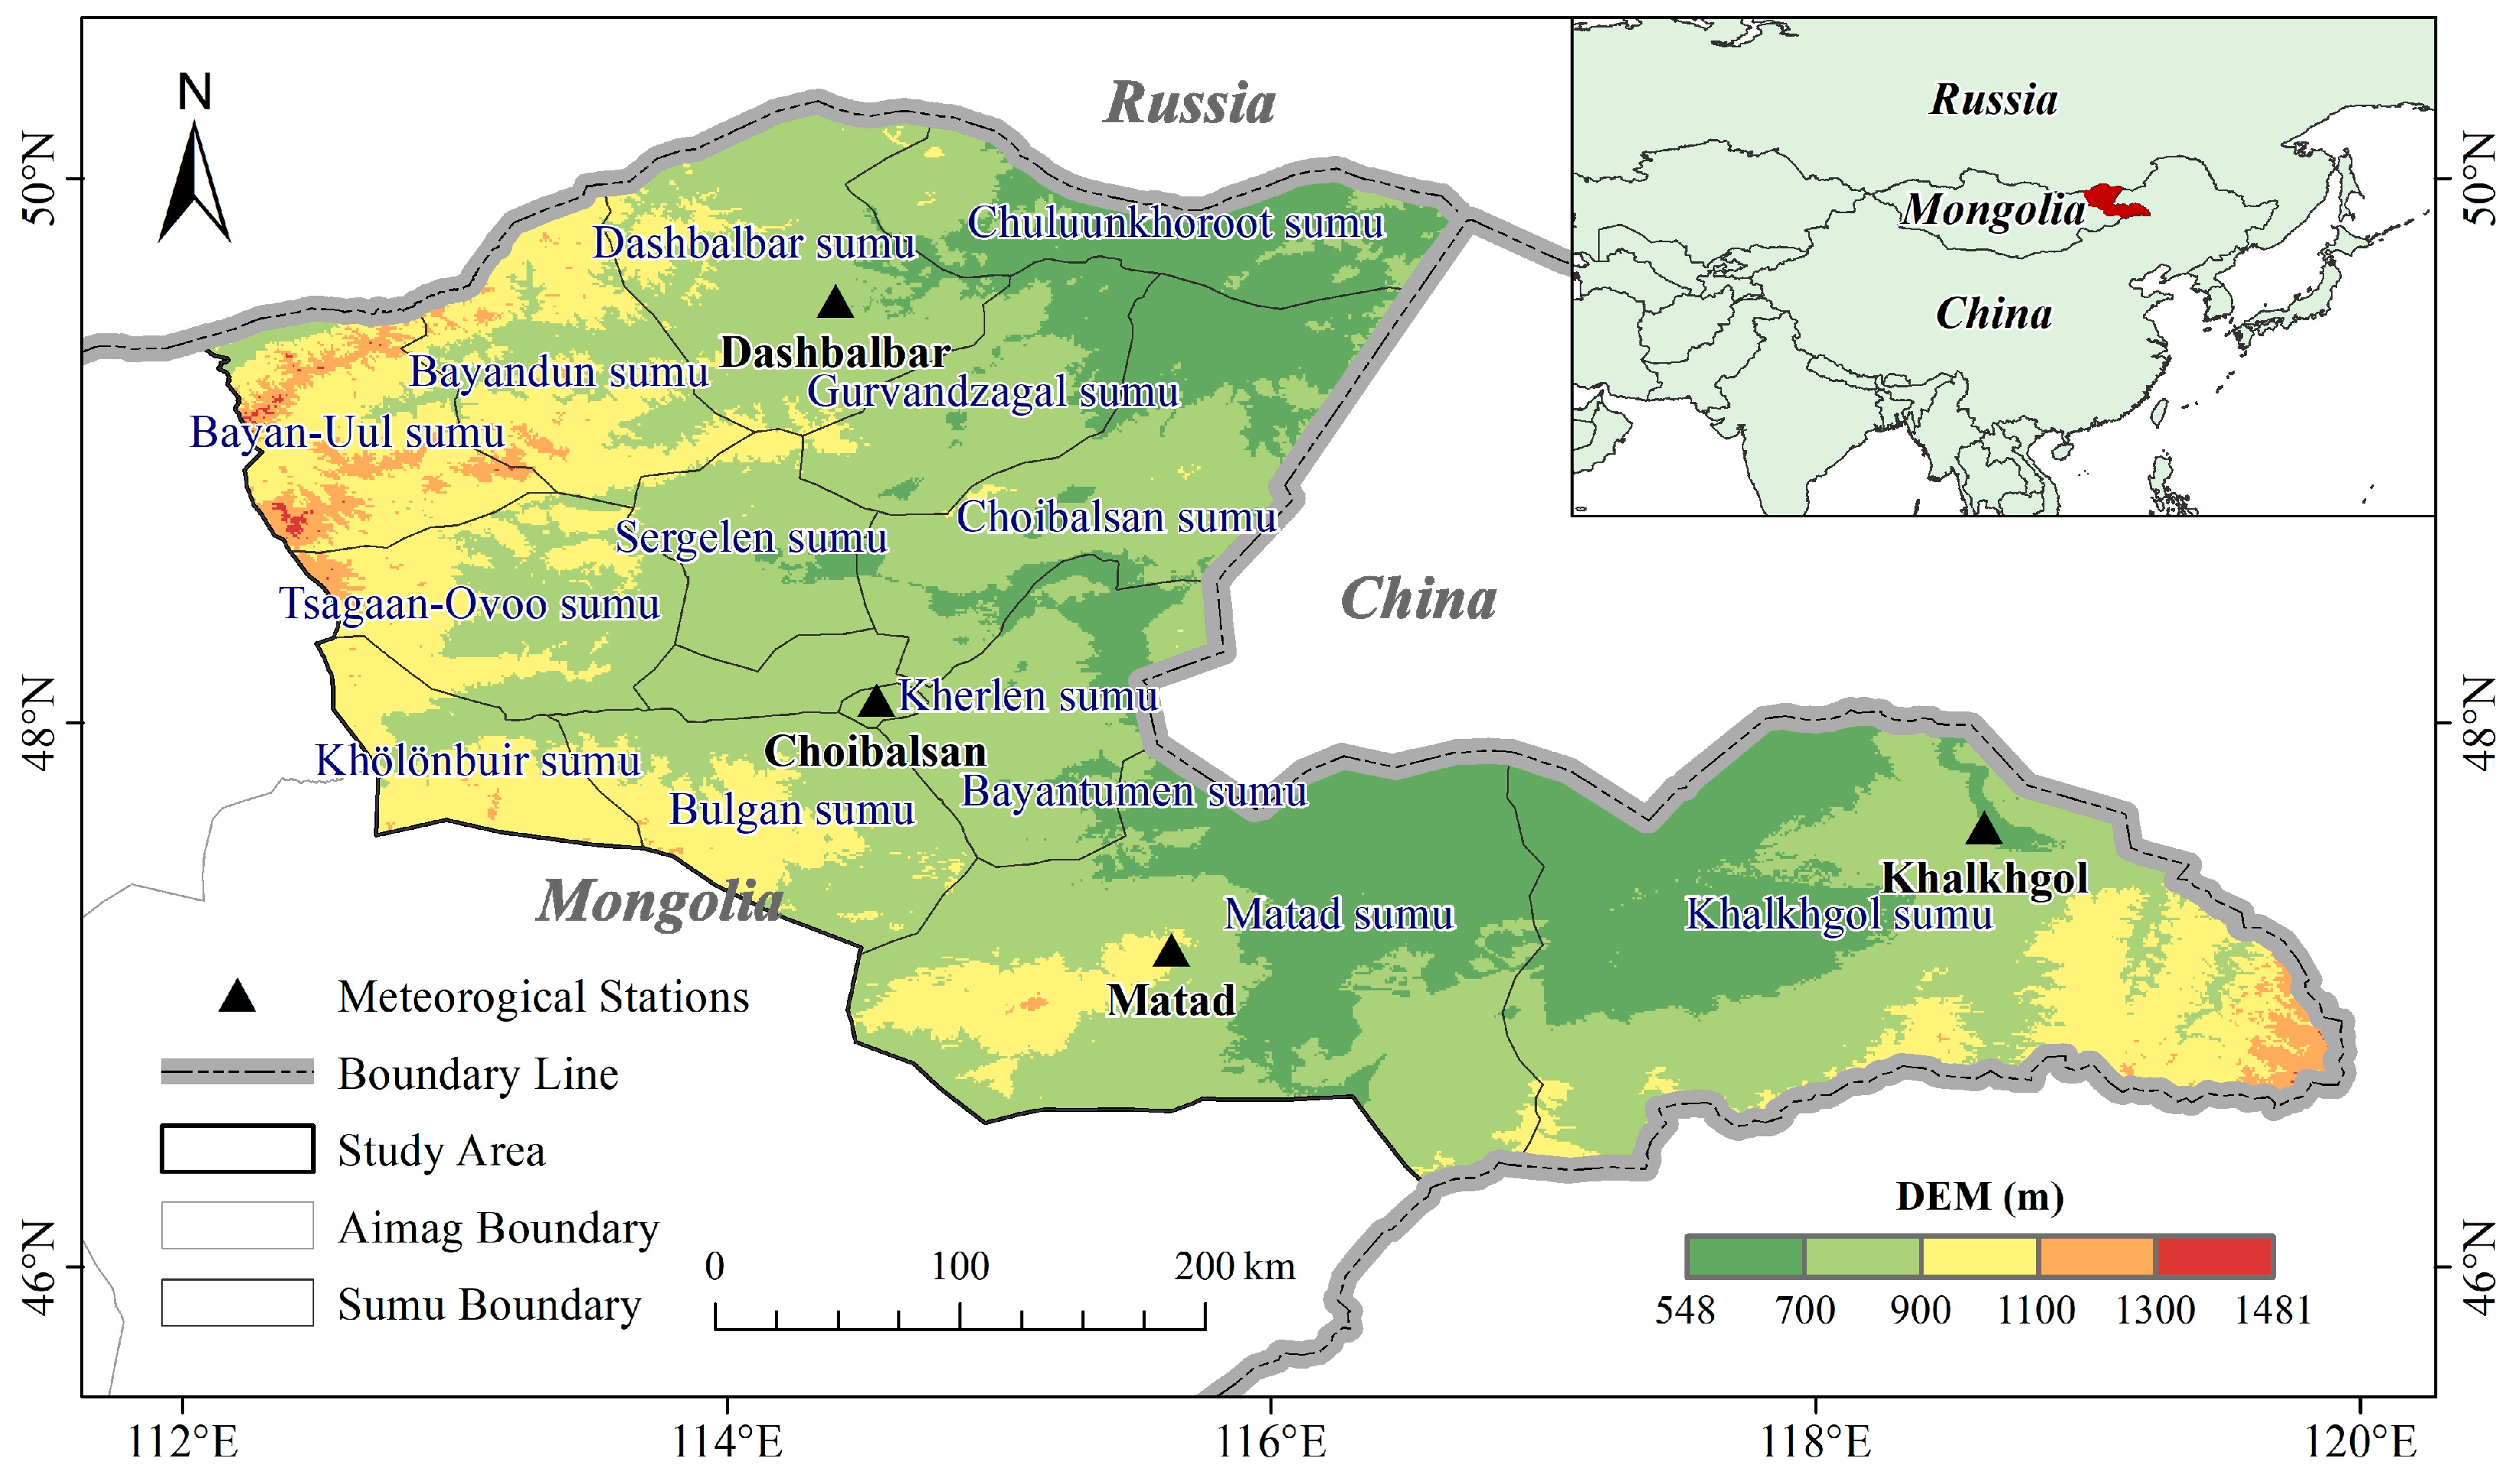
2.1. Study Area
2.2. Data Sources
2.2.1. MCD64A1 Burned-Area Data
2.2.2. SYNOP Dust Data
2.2.3. Auxiliary Data
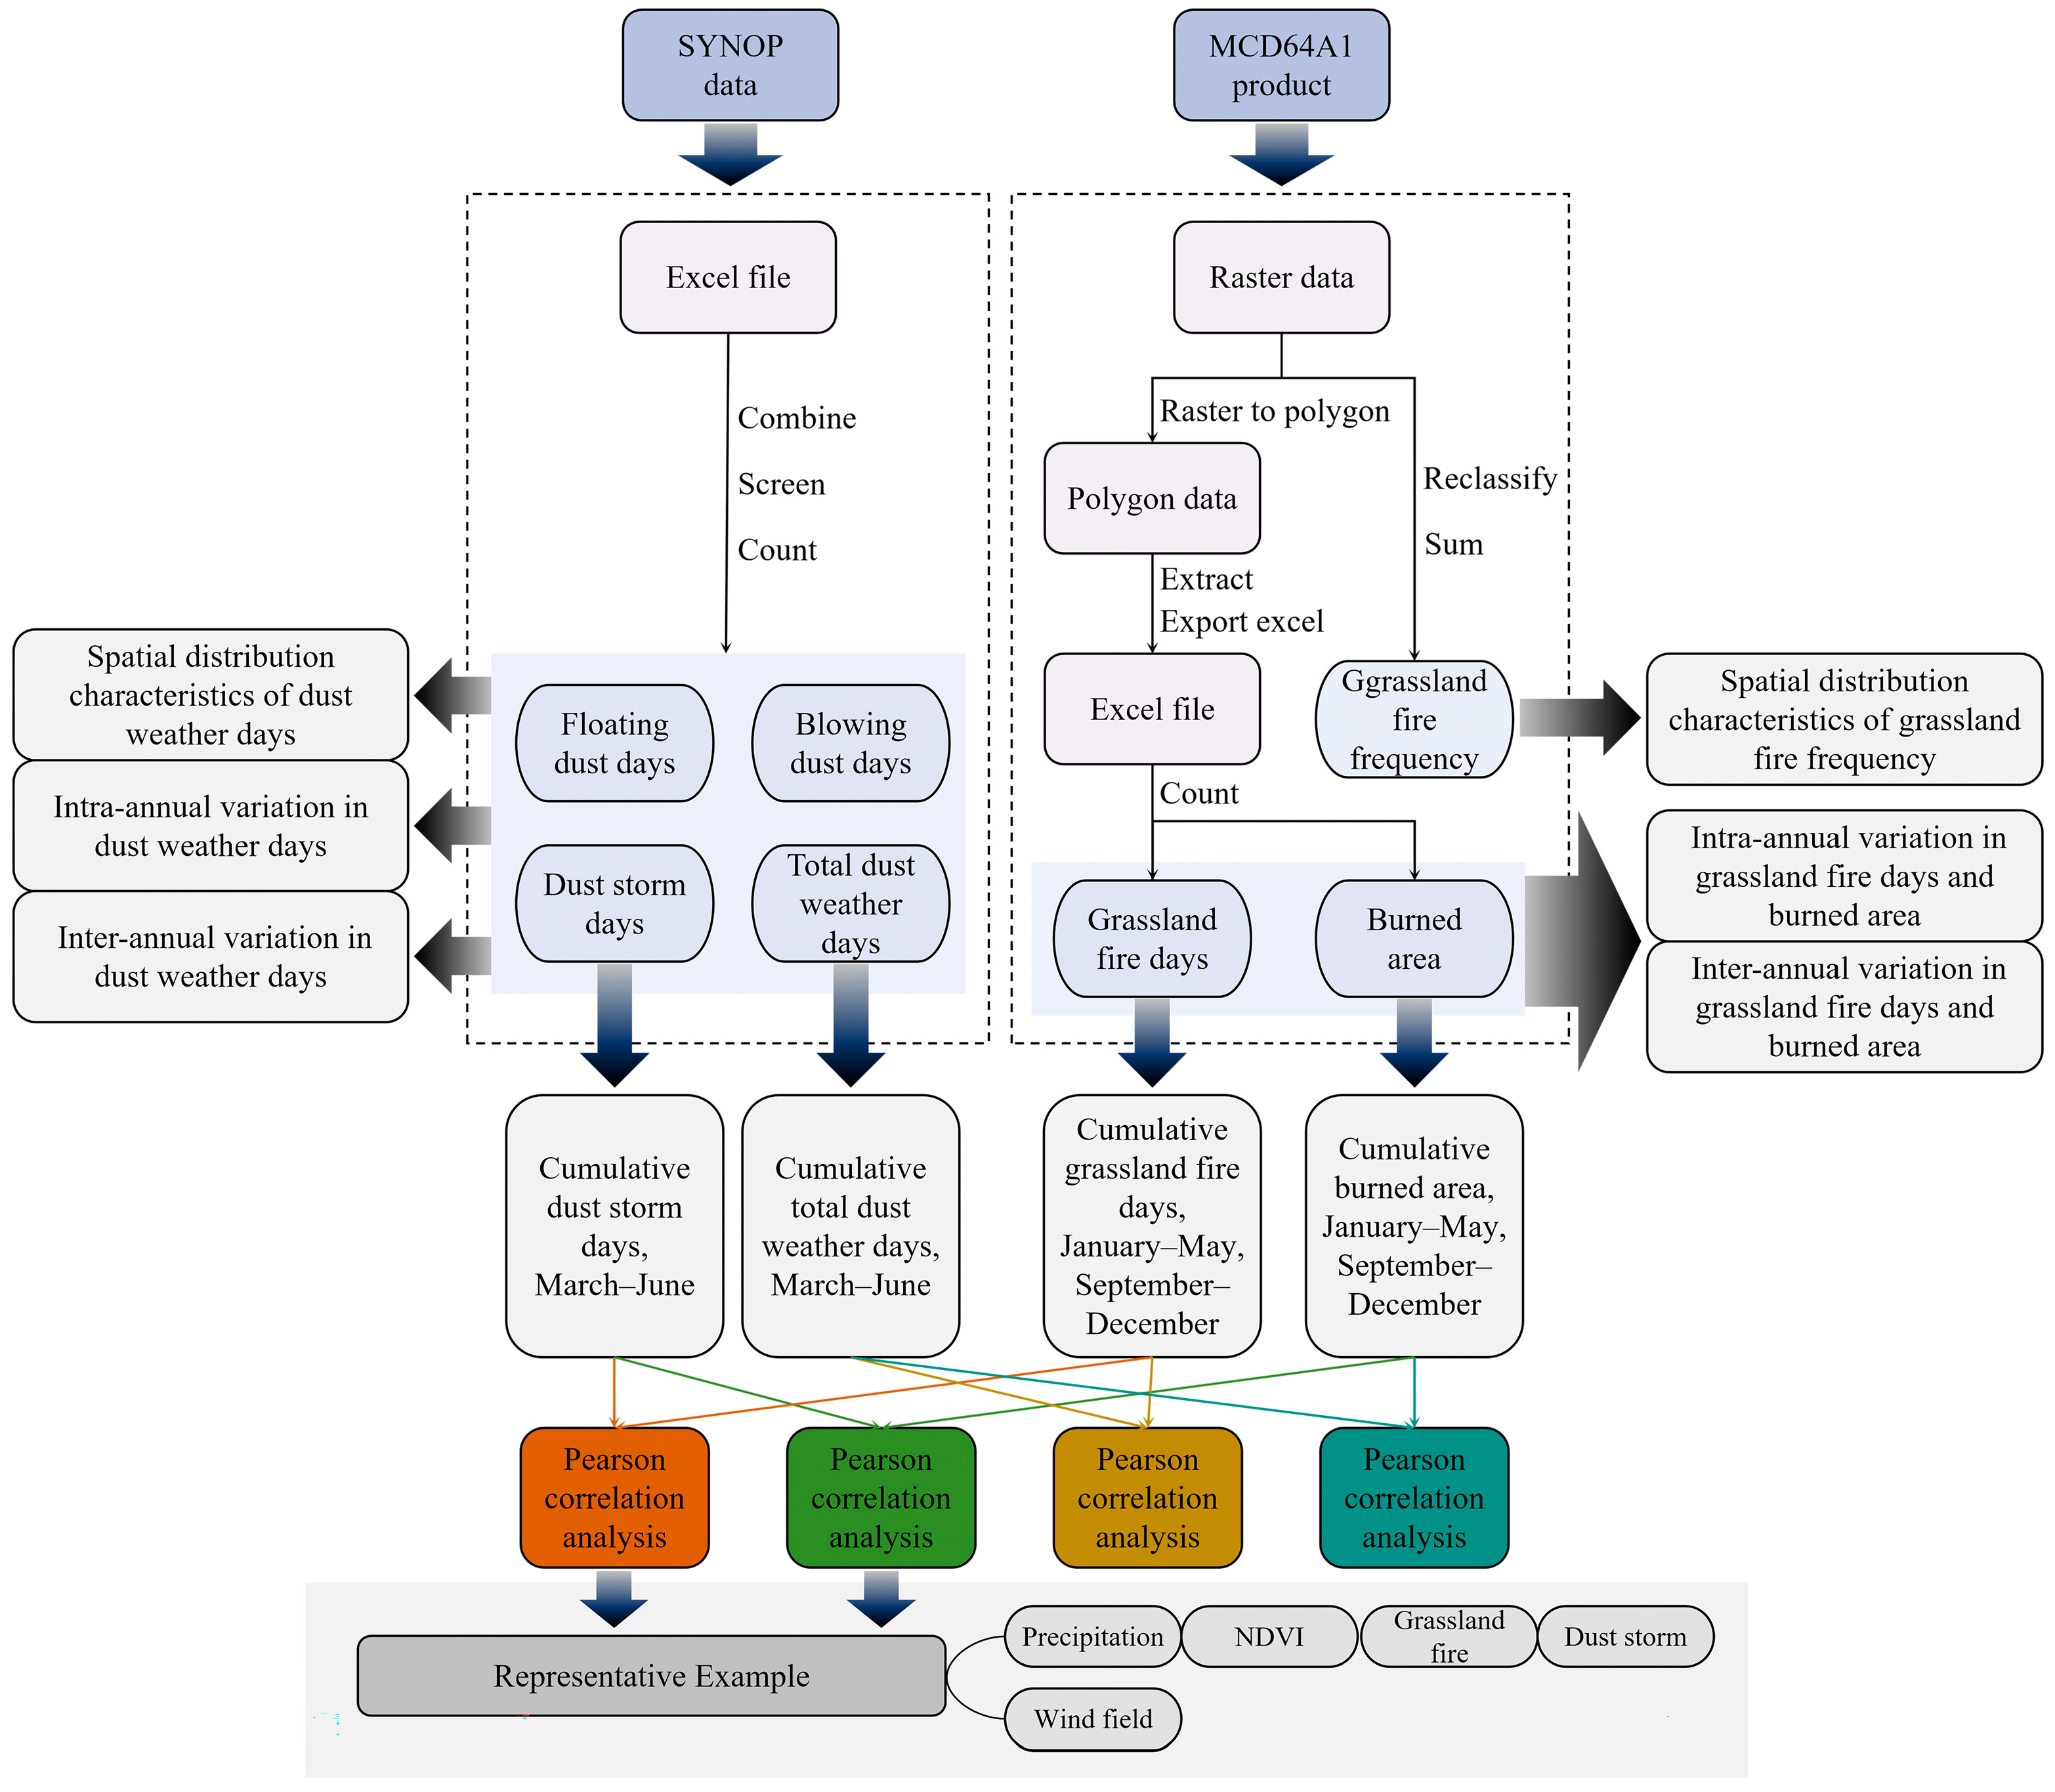
2.3. Methods
2.3.1. Statistics of Grassland Fire Days, Burned Area, and Frequency Based on MCD64A1 Burned-Area Data
2.3.2. Dust Weather Days Statistics Based on SYNOP Data
2.3.3. Analysis of Effect of Grassland Fire on Dust Weather
3. Results
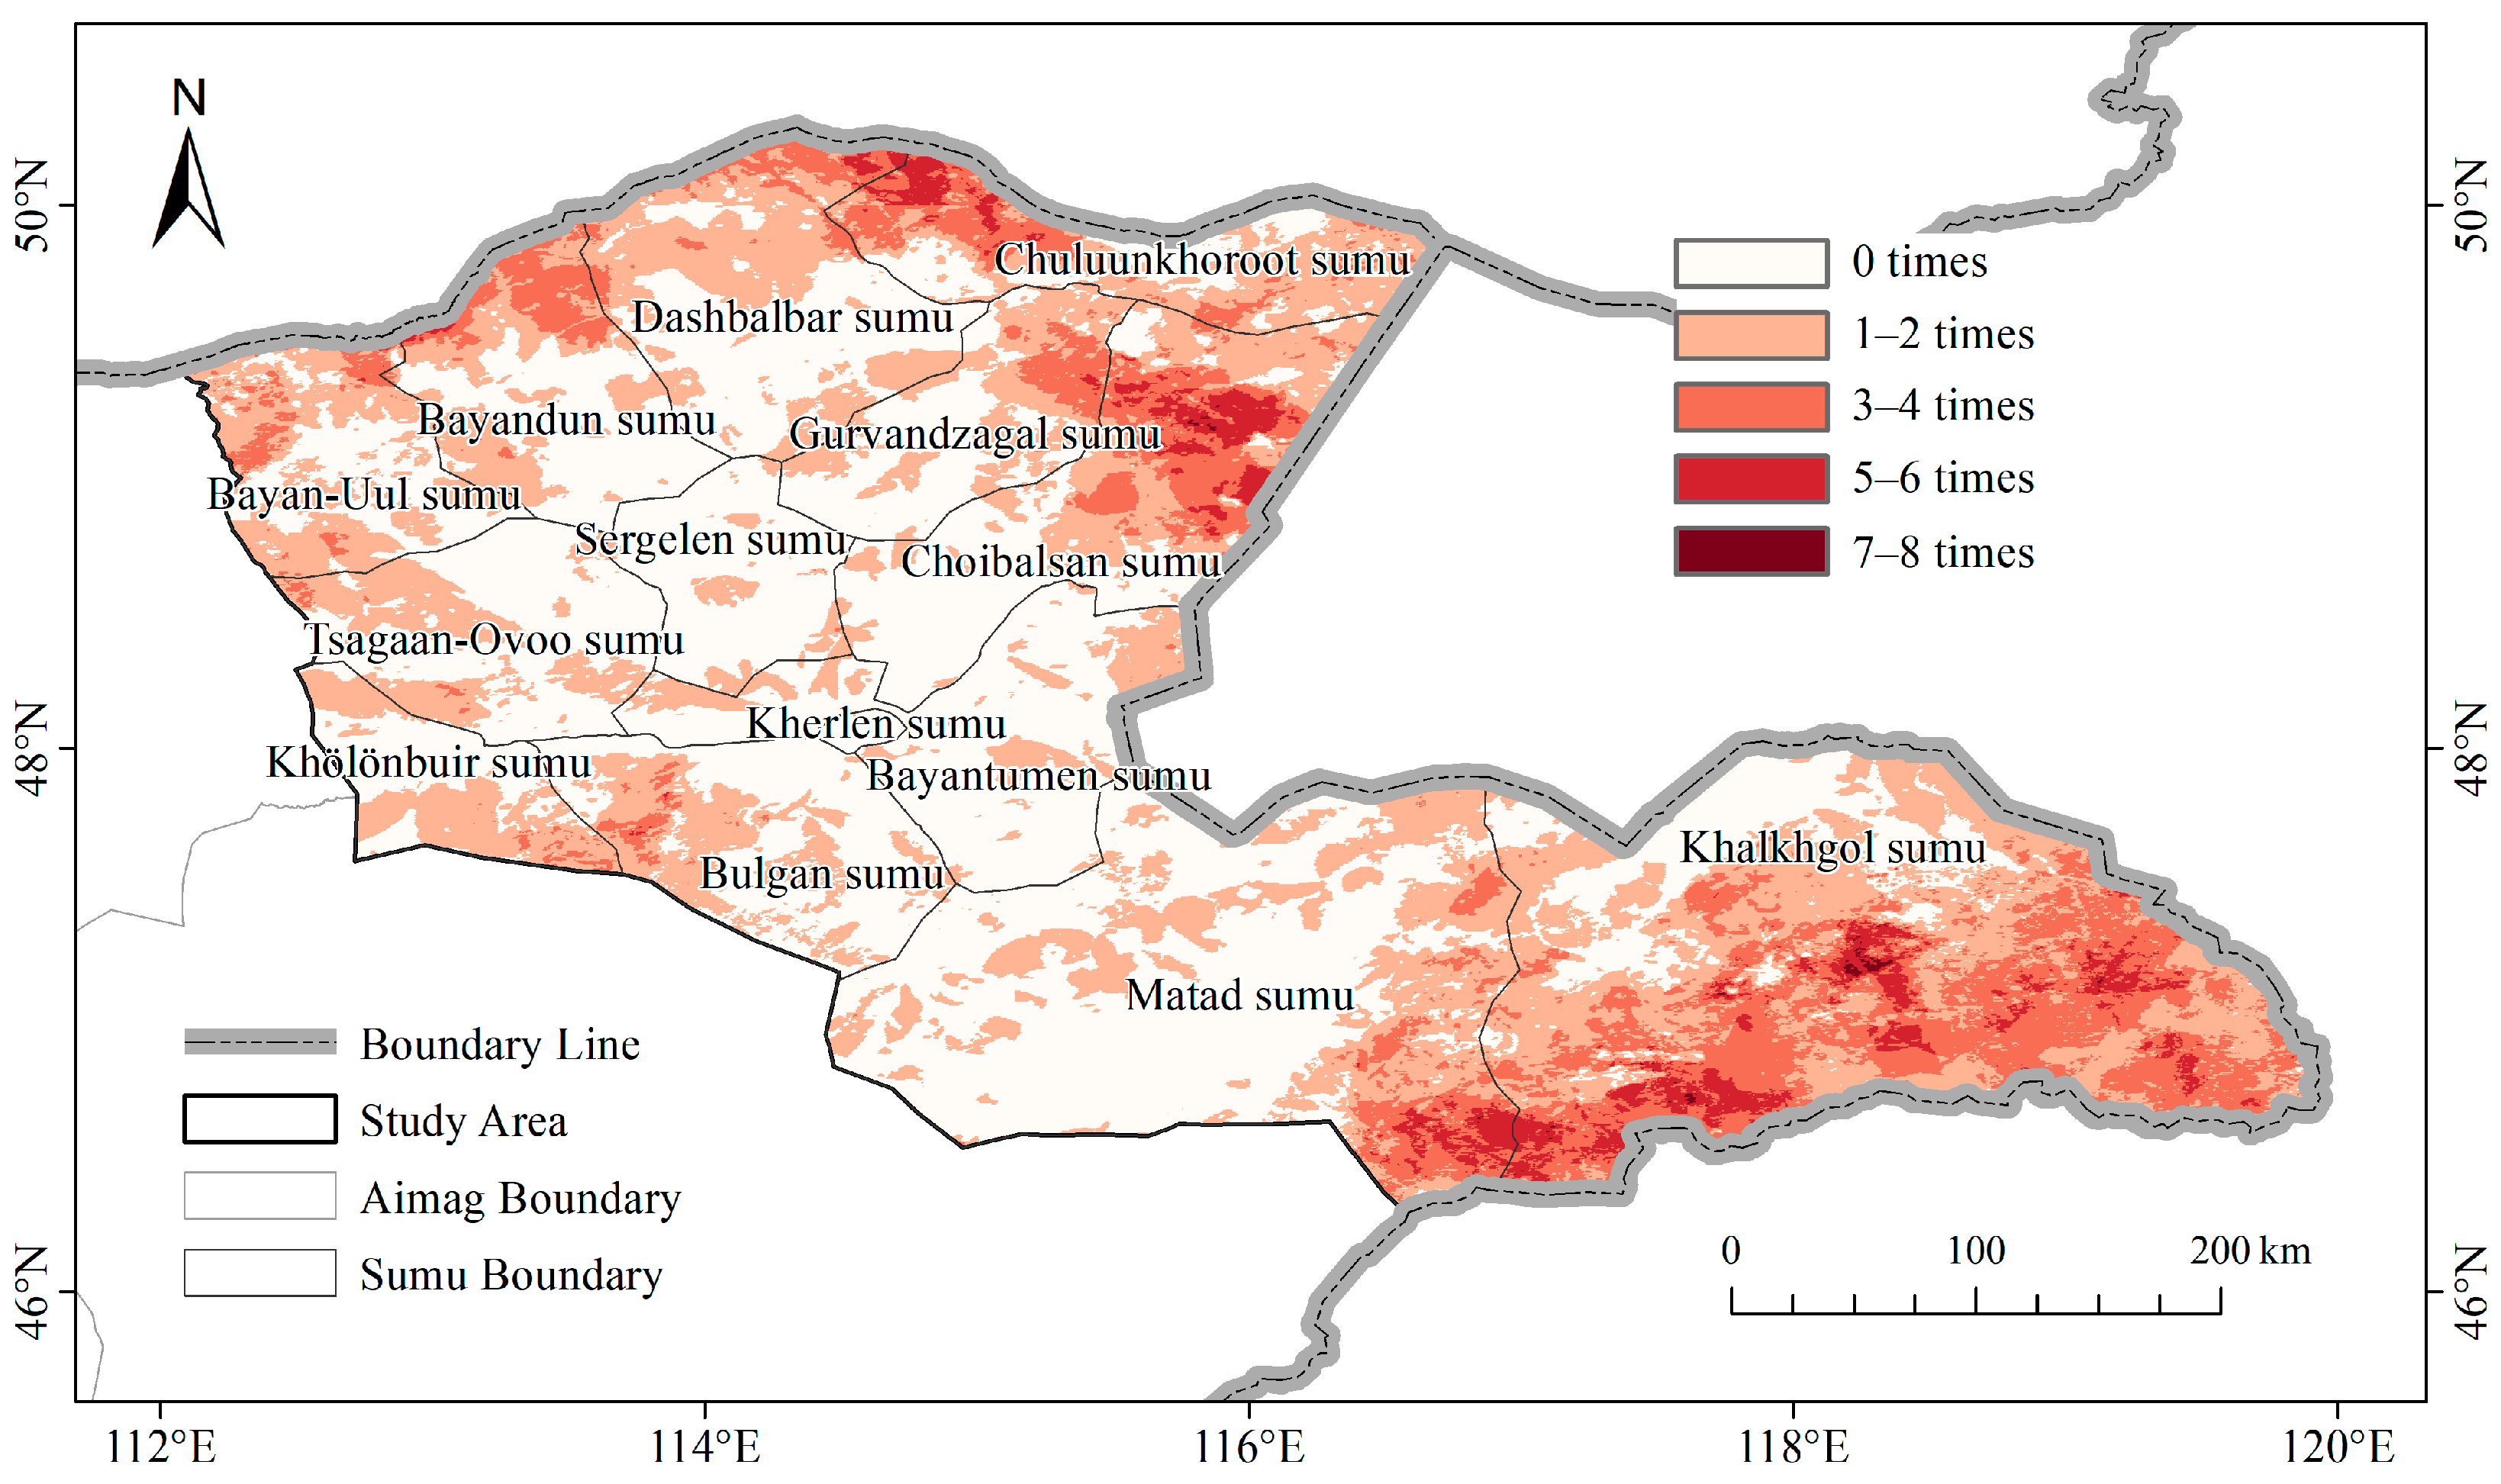
3.1. Spatiotemporal Characteristics of Grassland Fires
3.1.1. Spatial Distribution of Grassland Fire Frequency
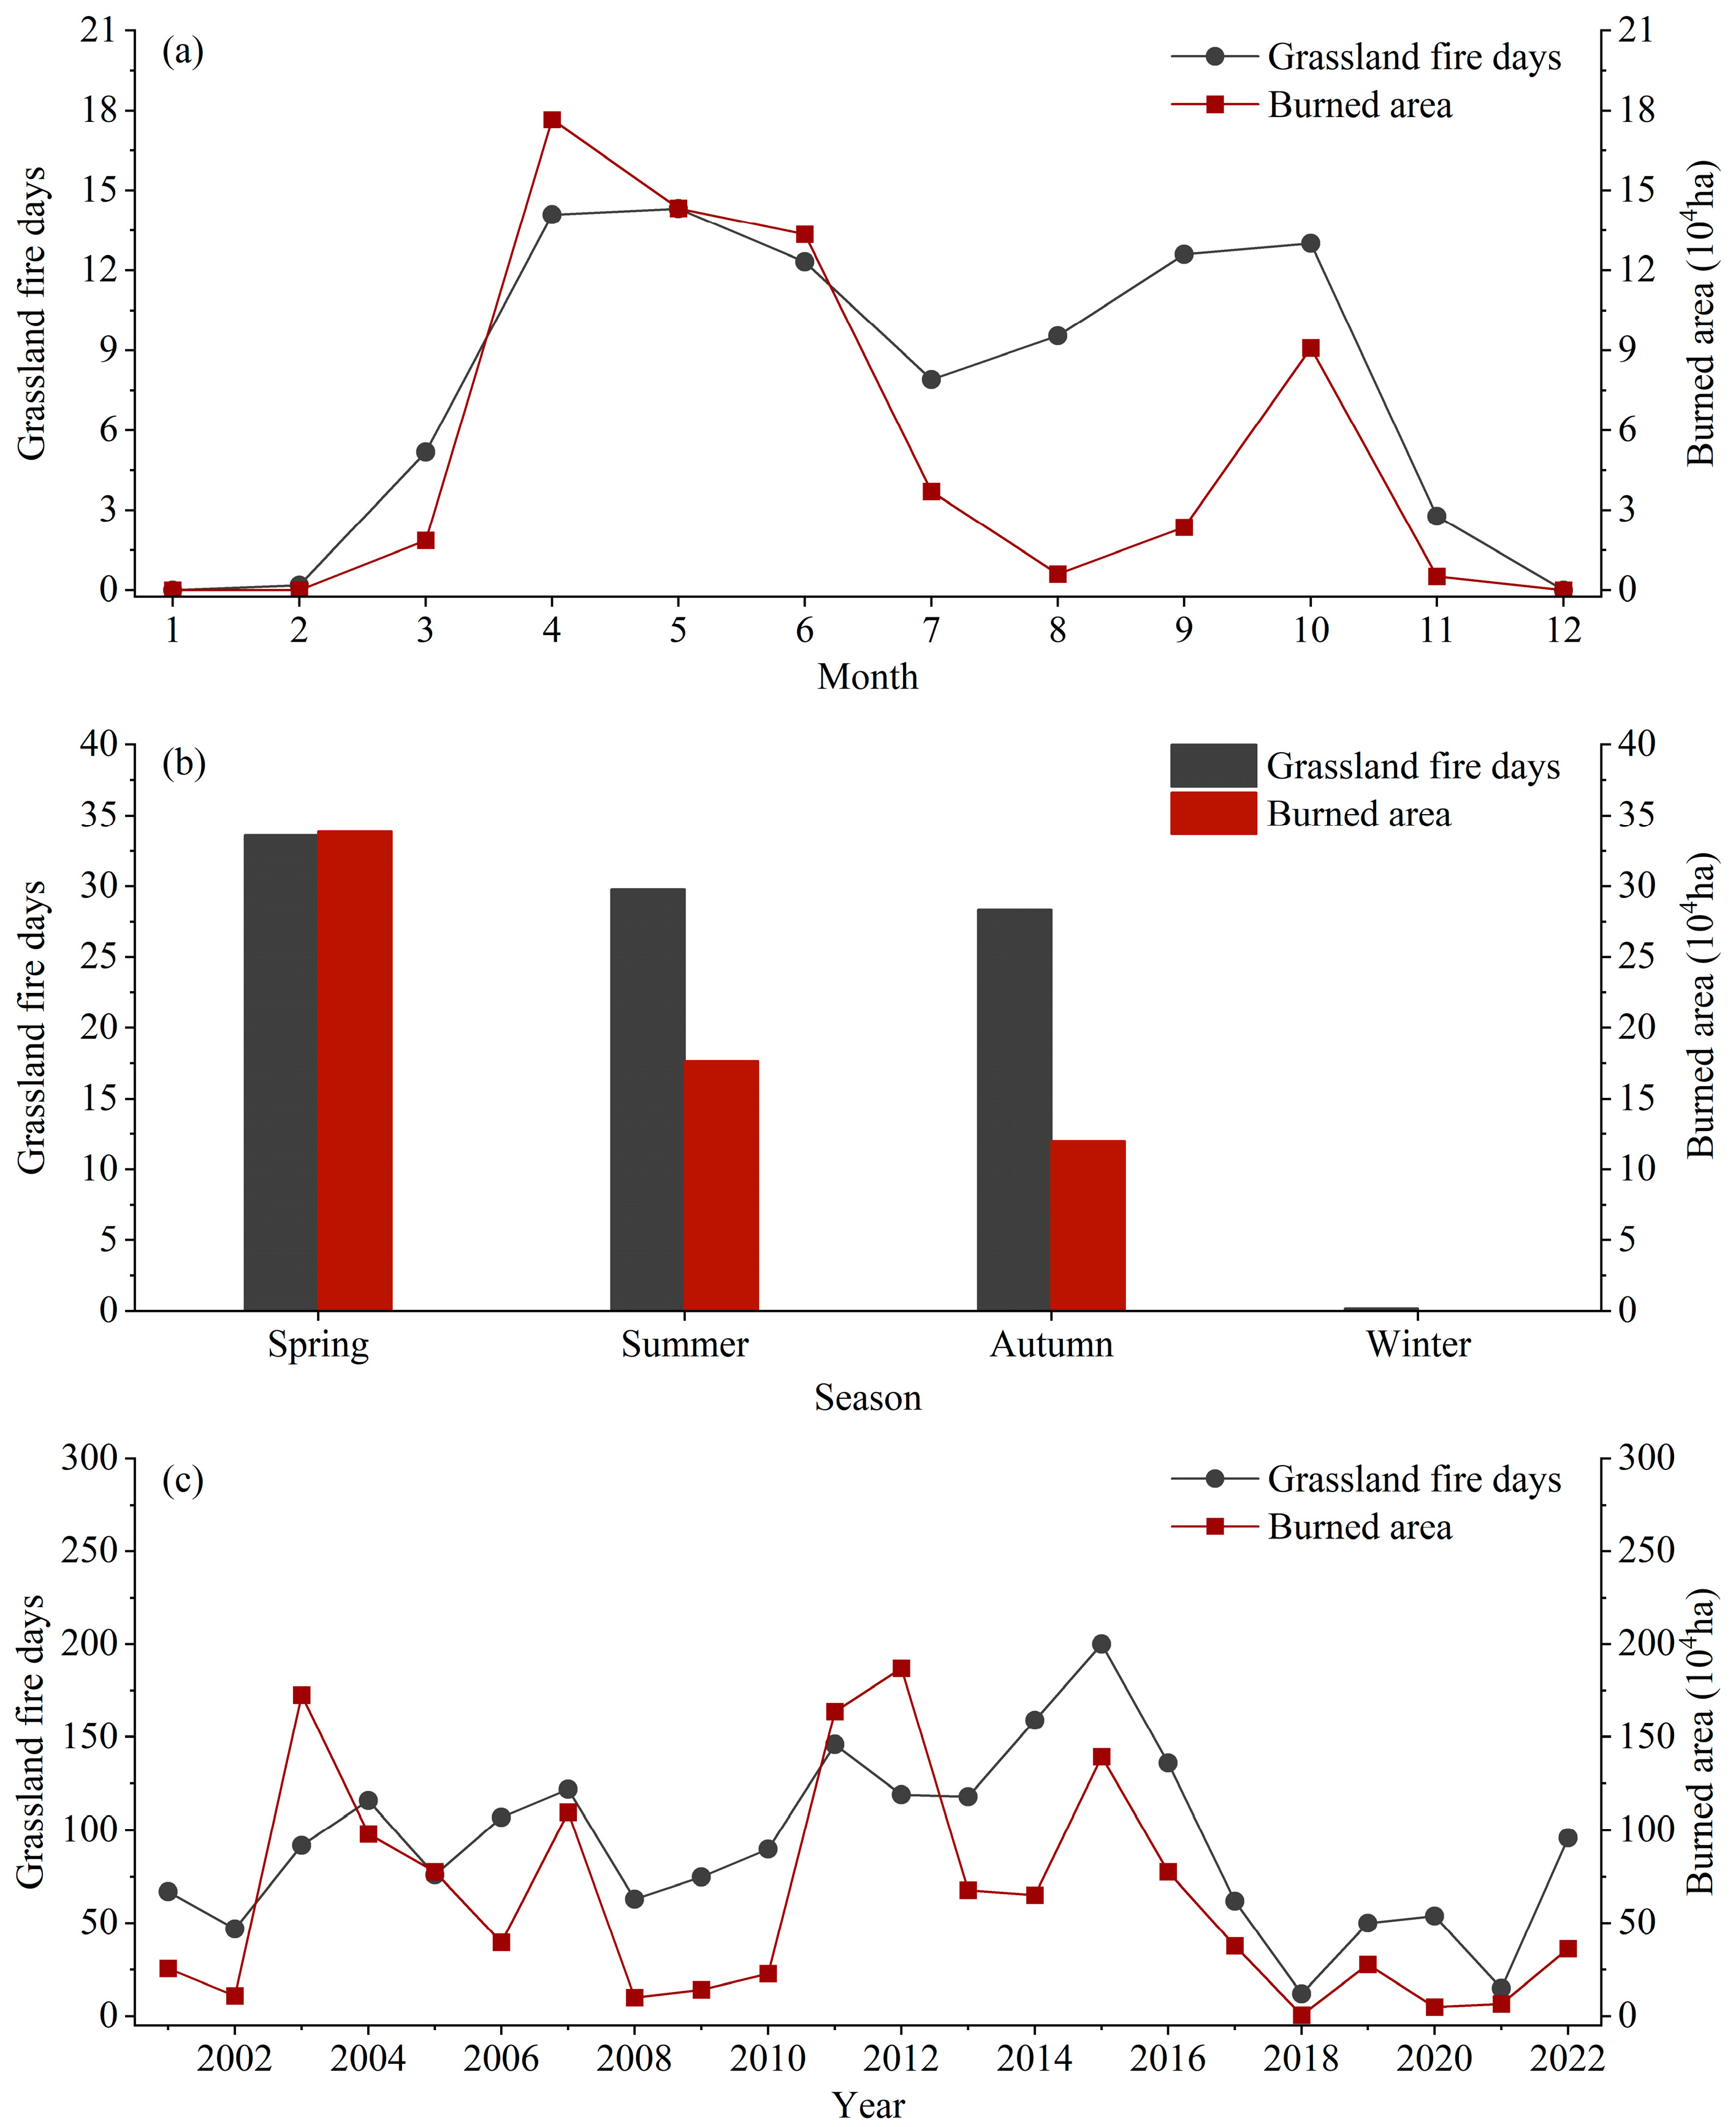
3.1.2. Intra-Annual Variation in Grassland Fire Days and Burned Area
3.1.3. Inter-Annual Variation in Grassland Fire Days and Burned Area
3.2. Spatiotemporal Variation Characteristics of Dust Weather
3.2.1. Spatial Distribution Characteristics of Dust Weather Days
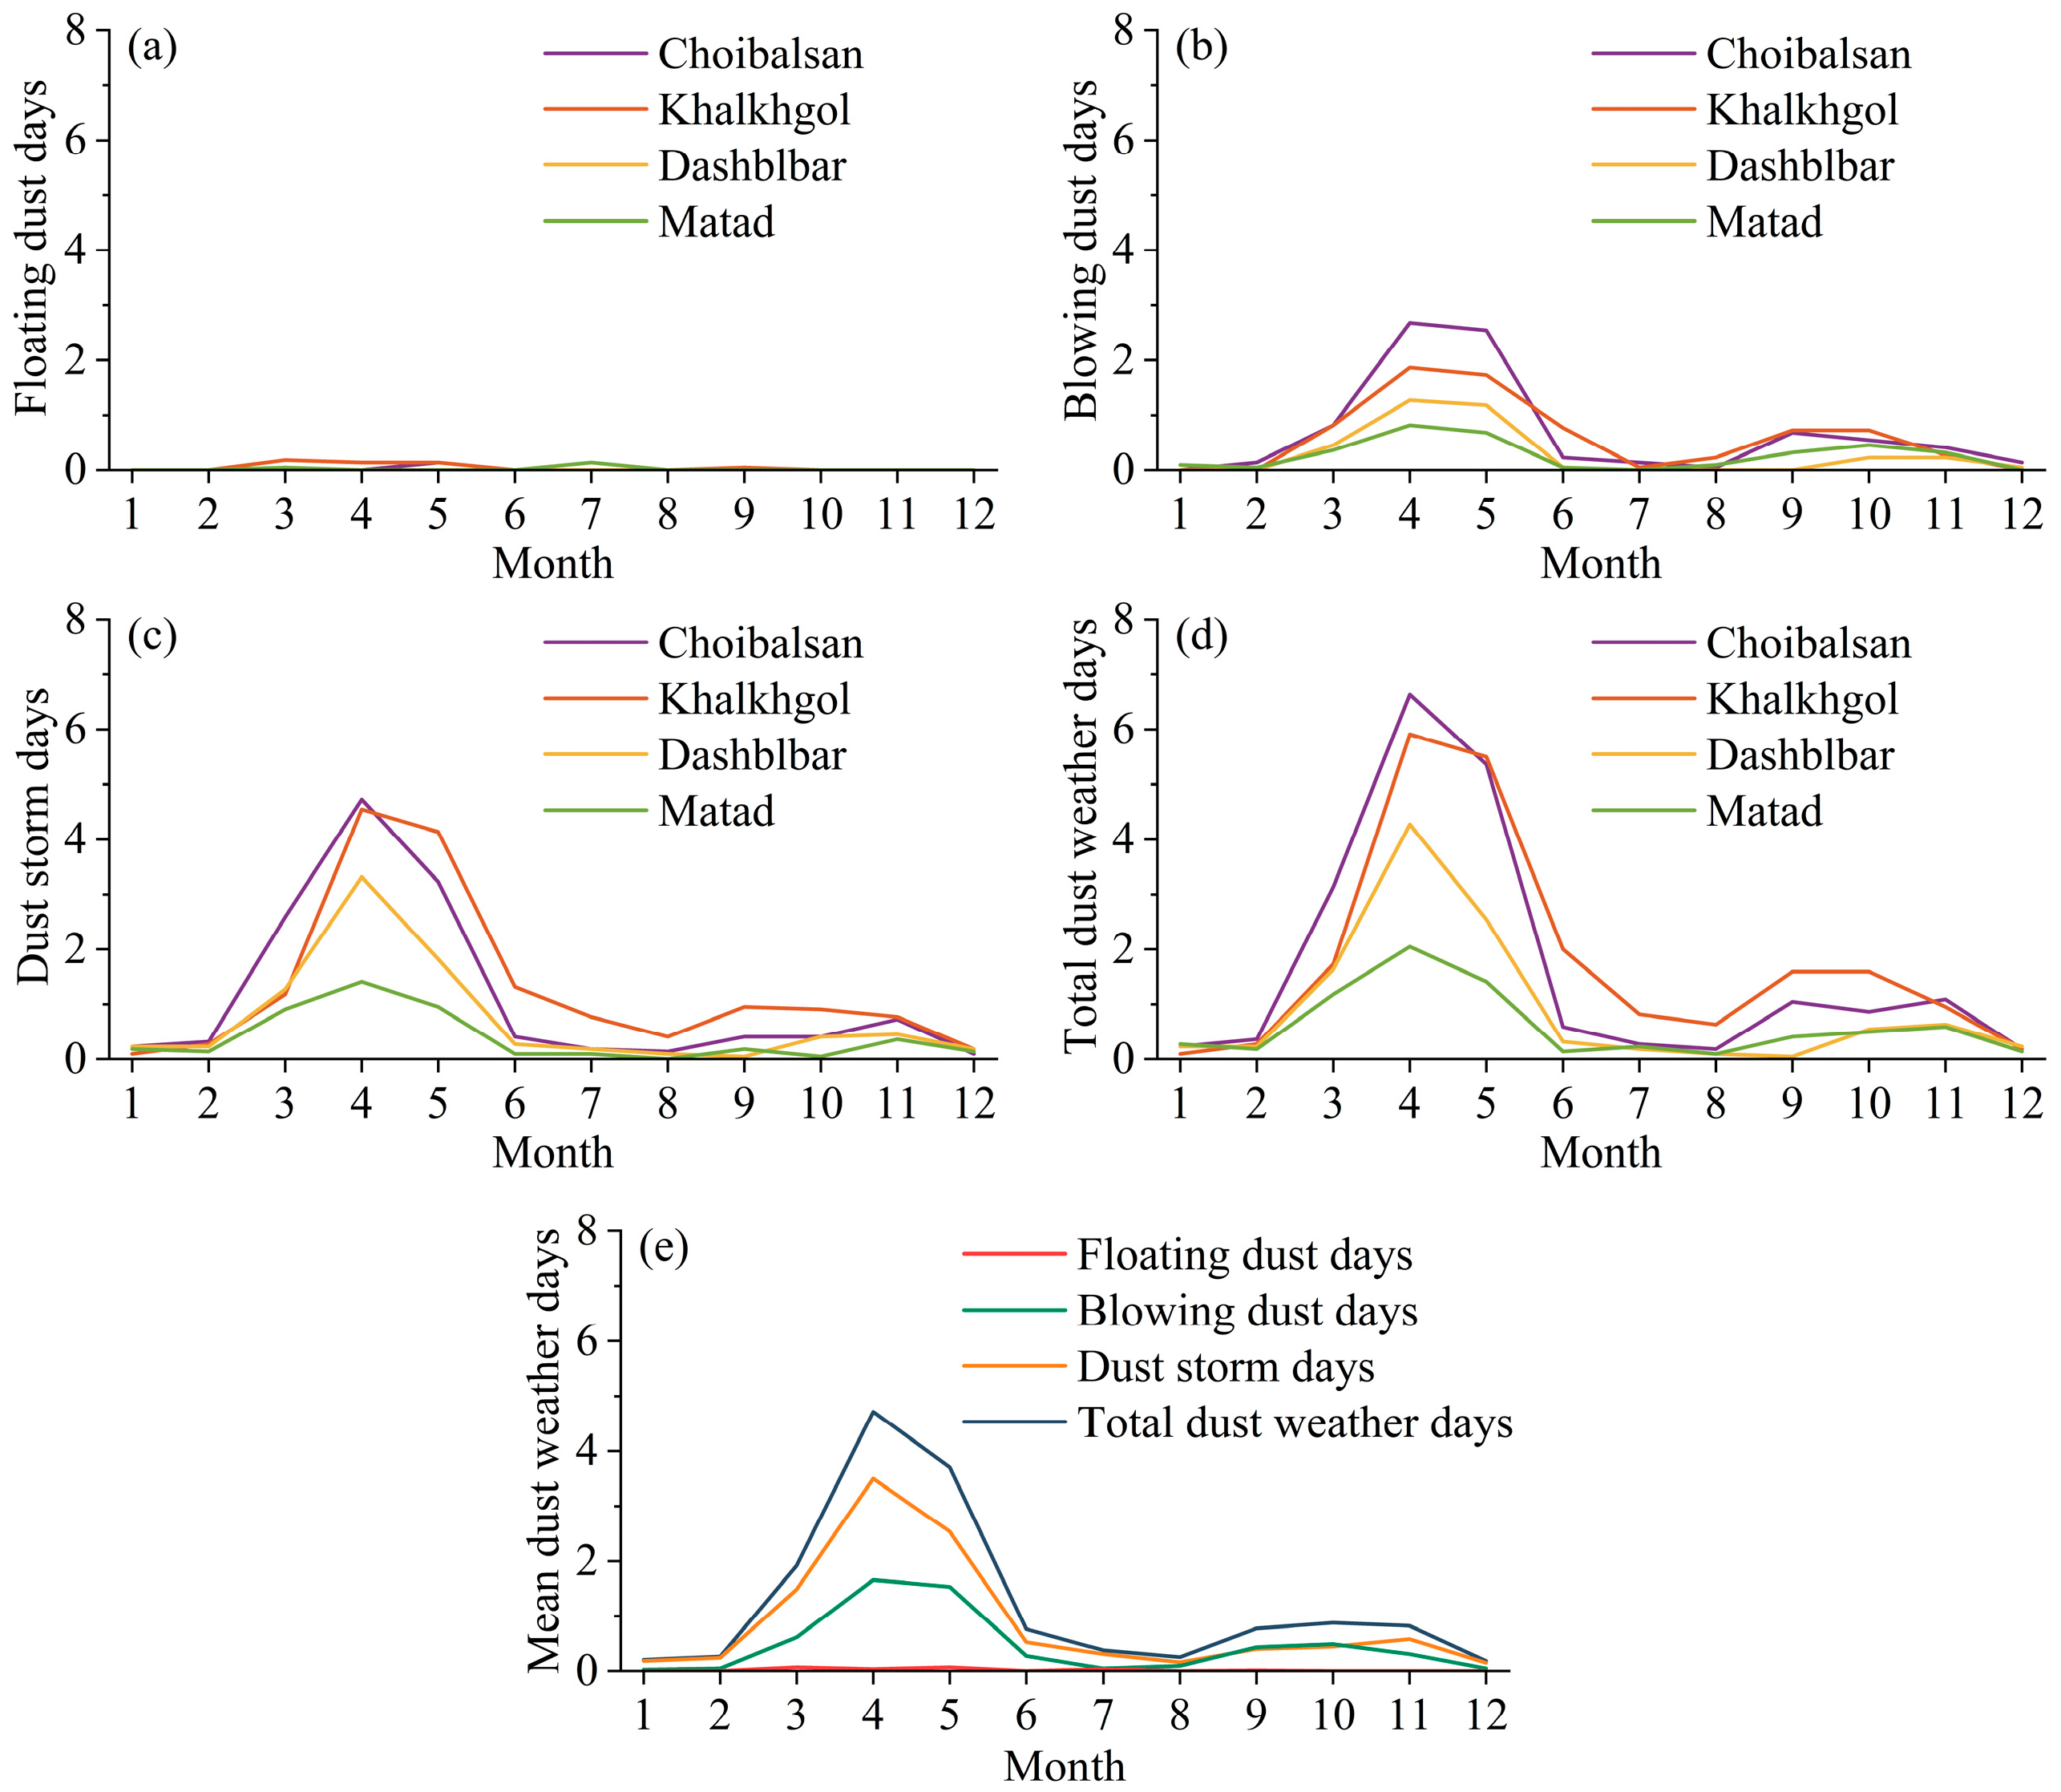
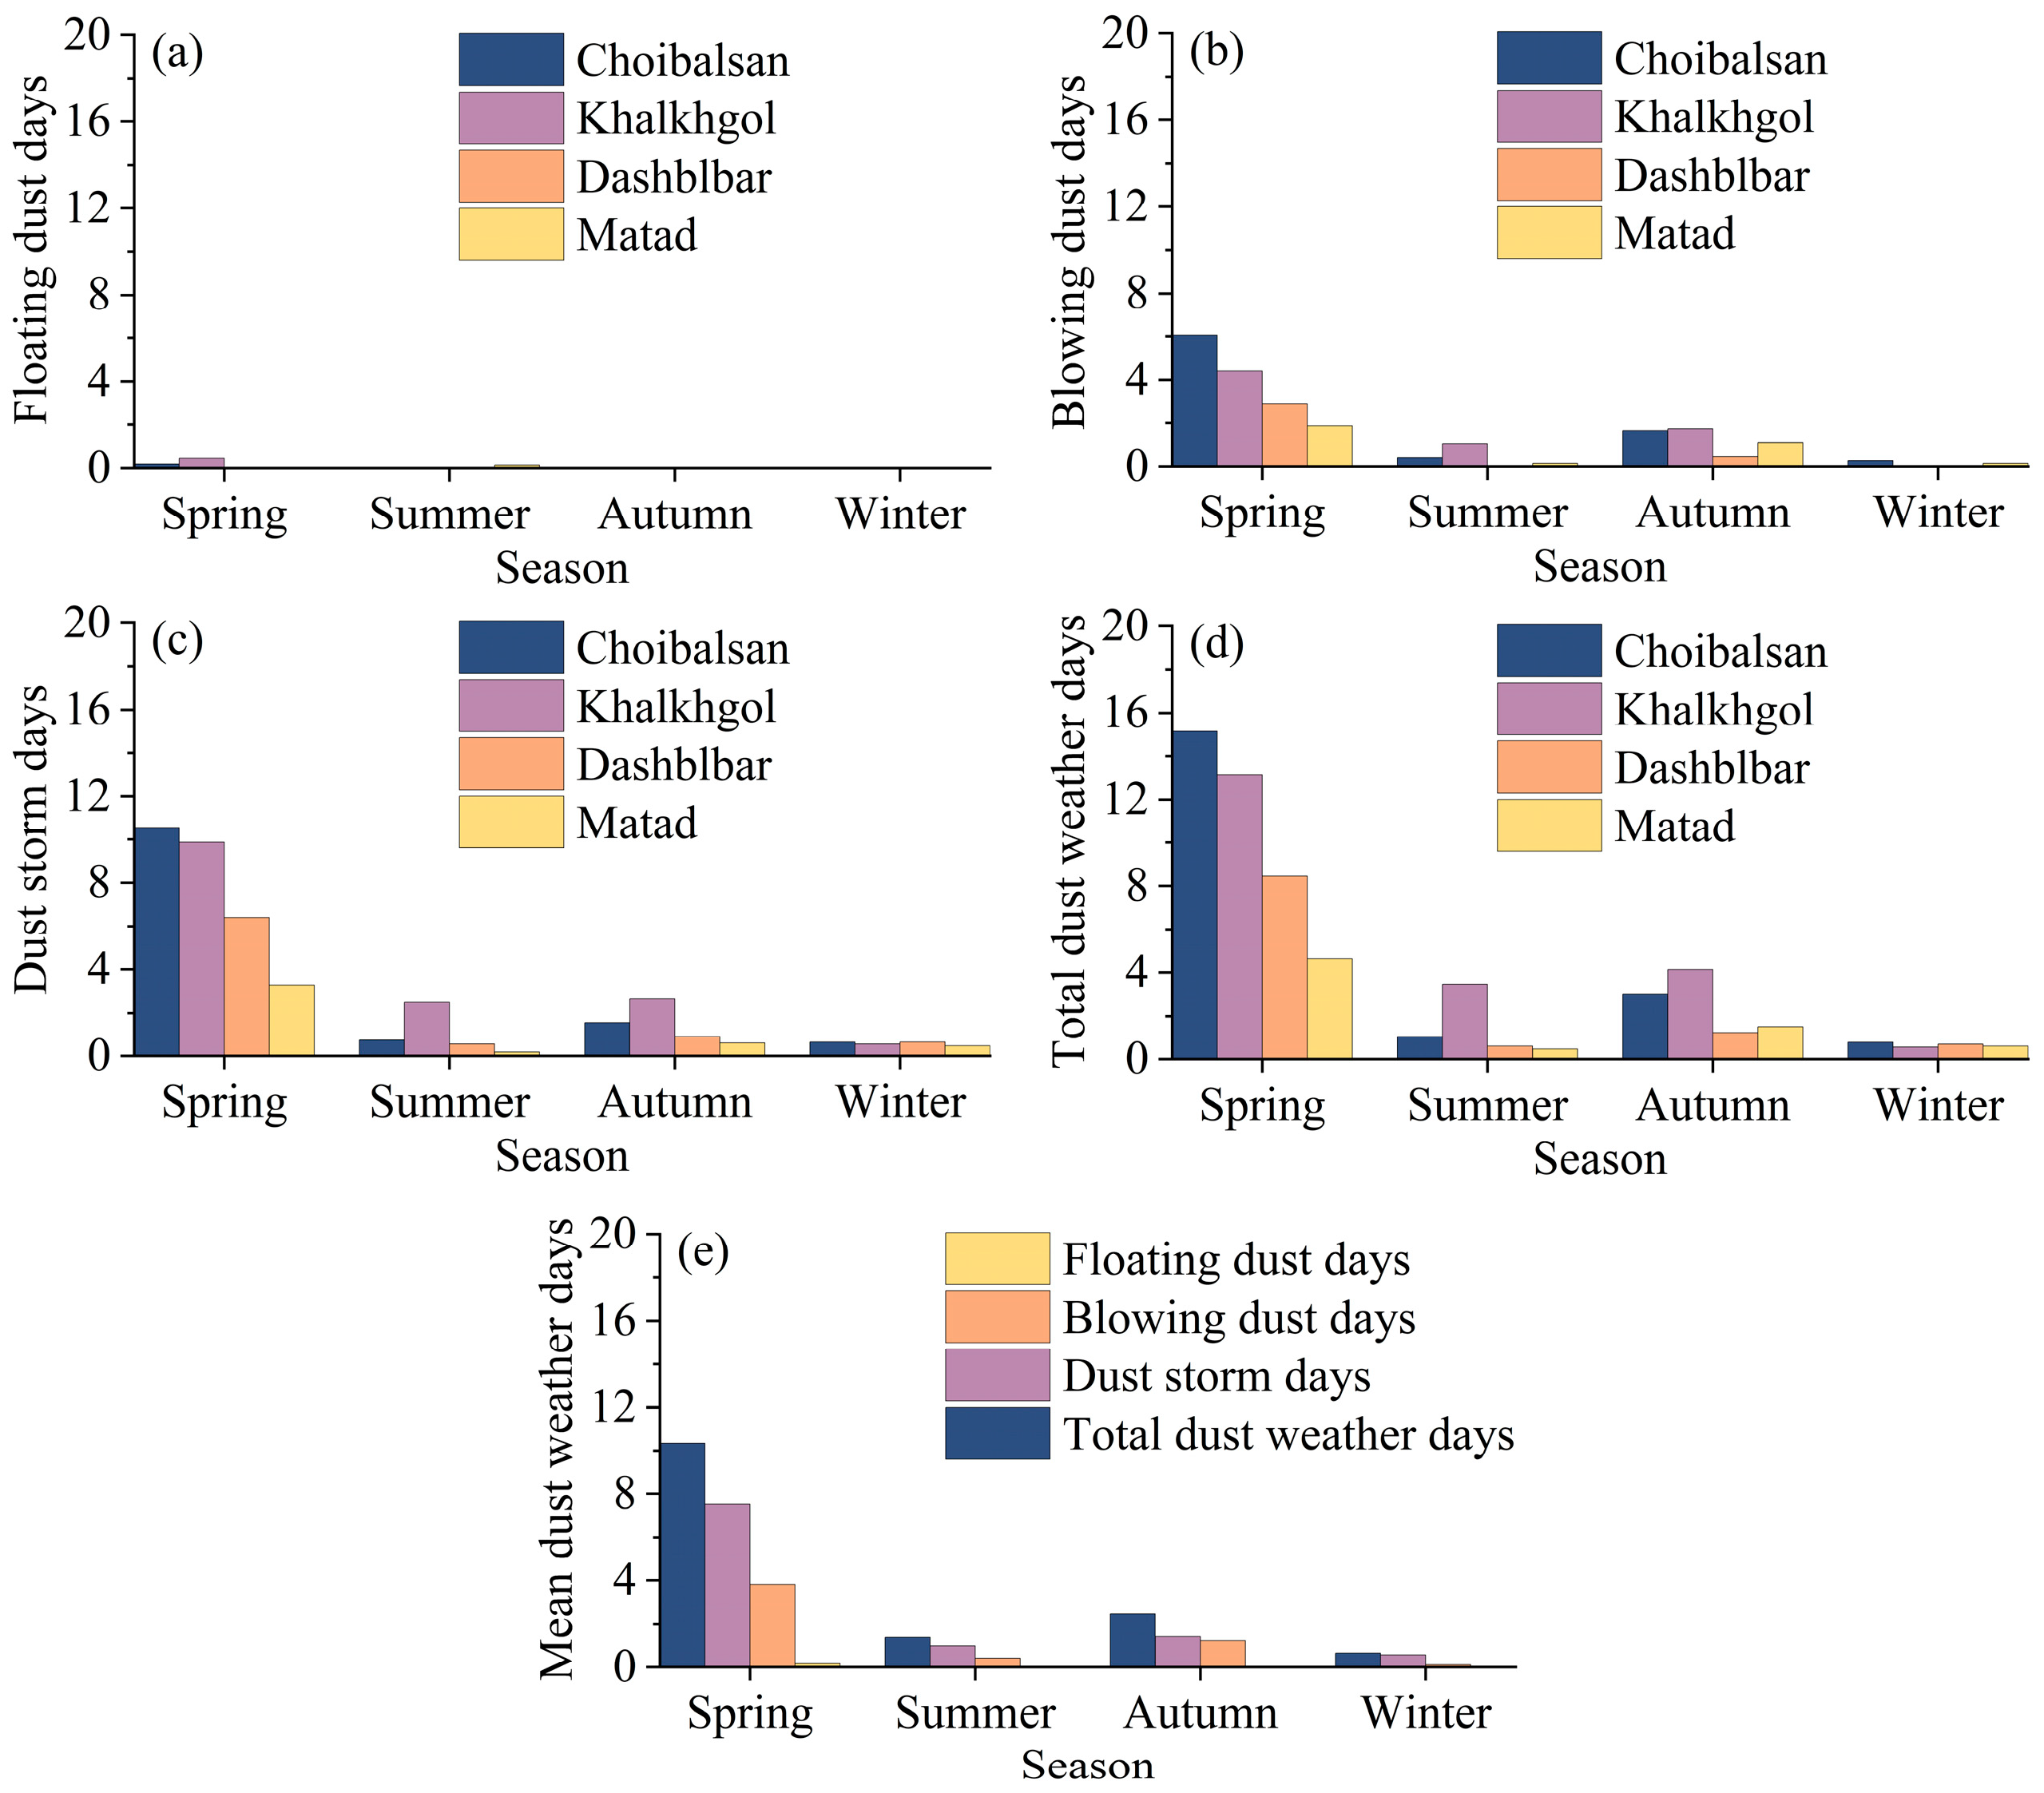
3.2.2. Intra-Annual Variation in Dust Weather Days
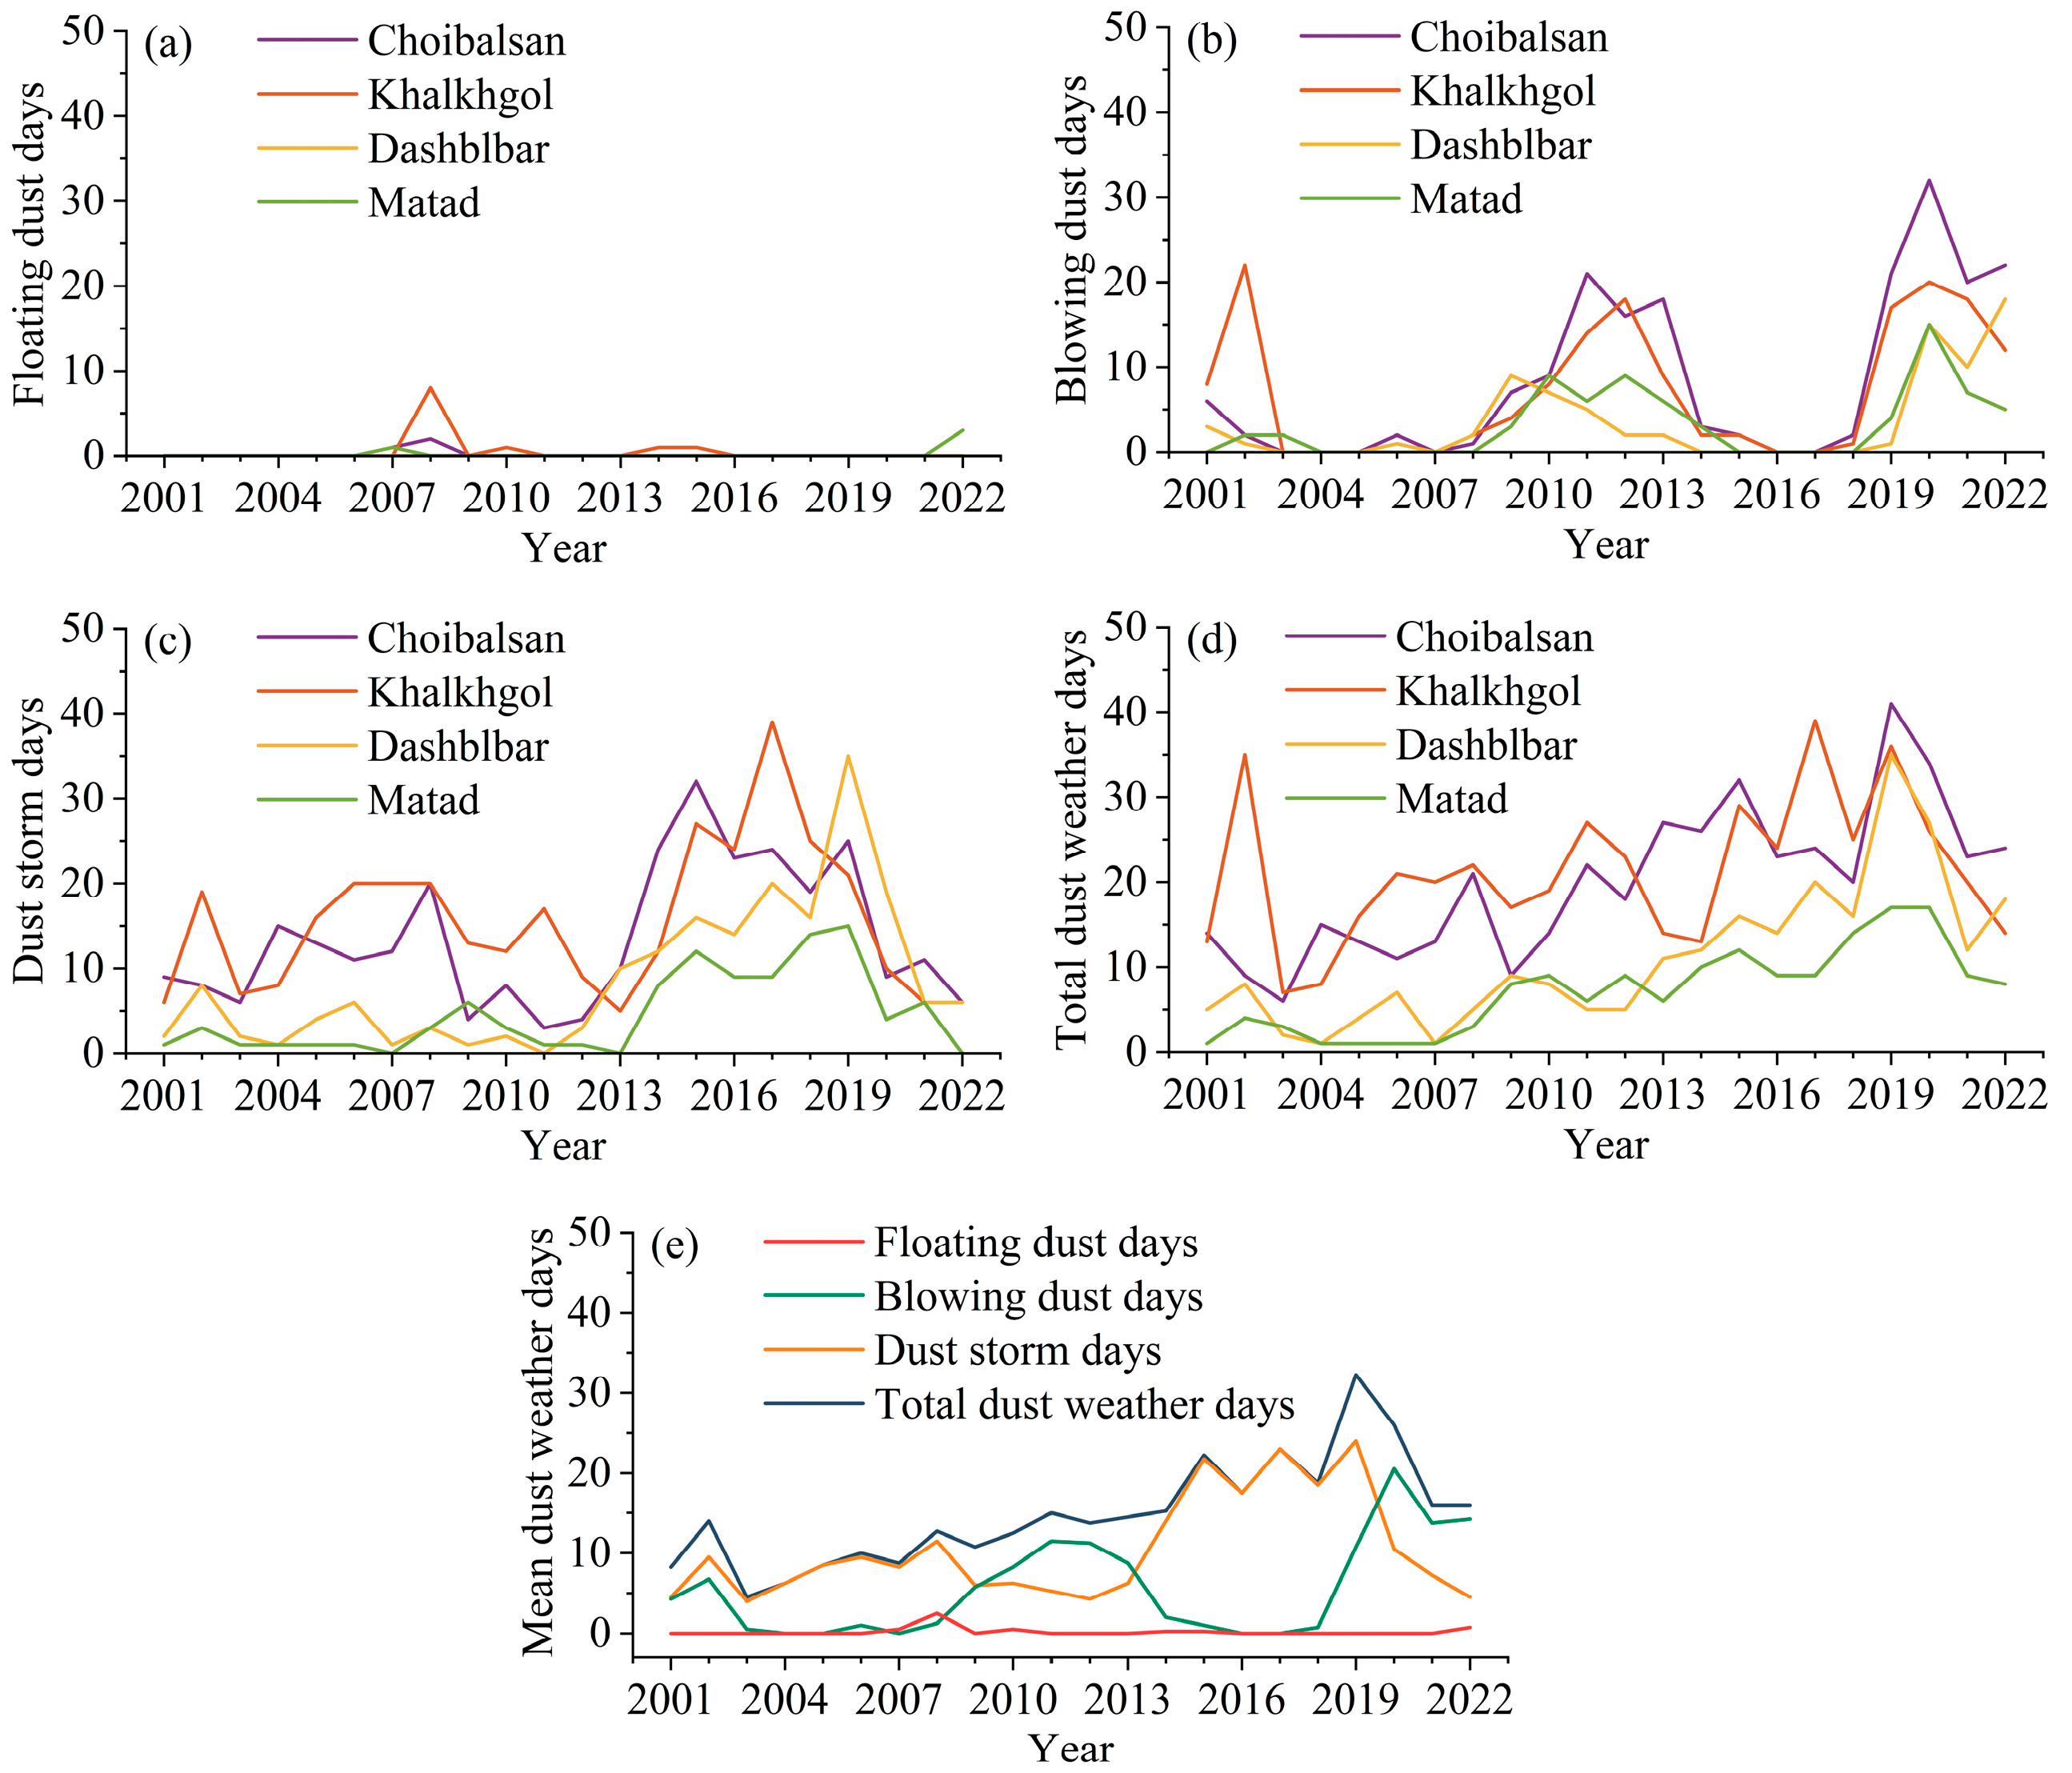
3.2.3. Inter-Annual Variation in Dust Weather Days
3.3. Effects of Grassland Fires on Dust Weather
3.3.1. Effects of Grassland Fires on Total Dust Weather
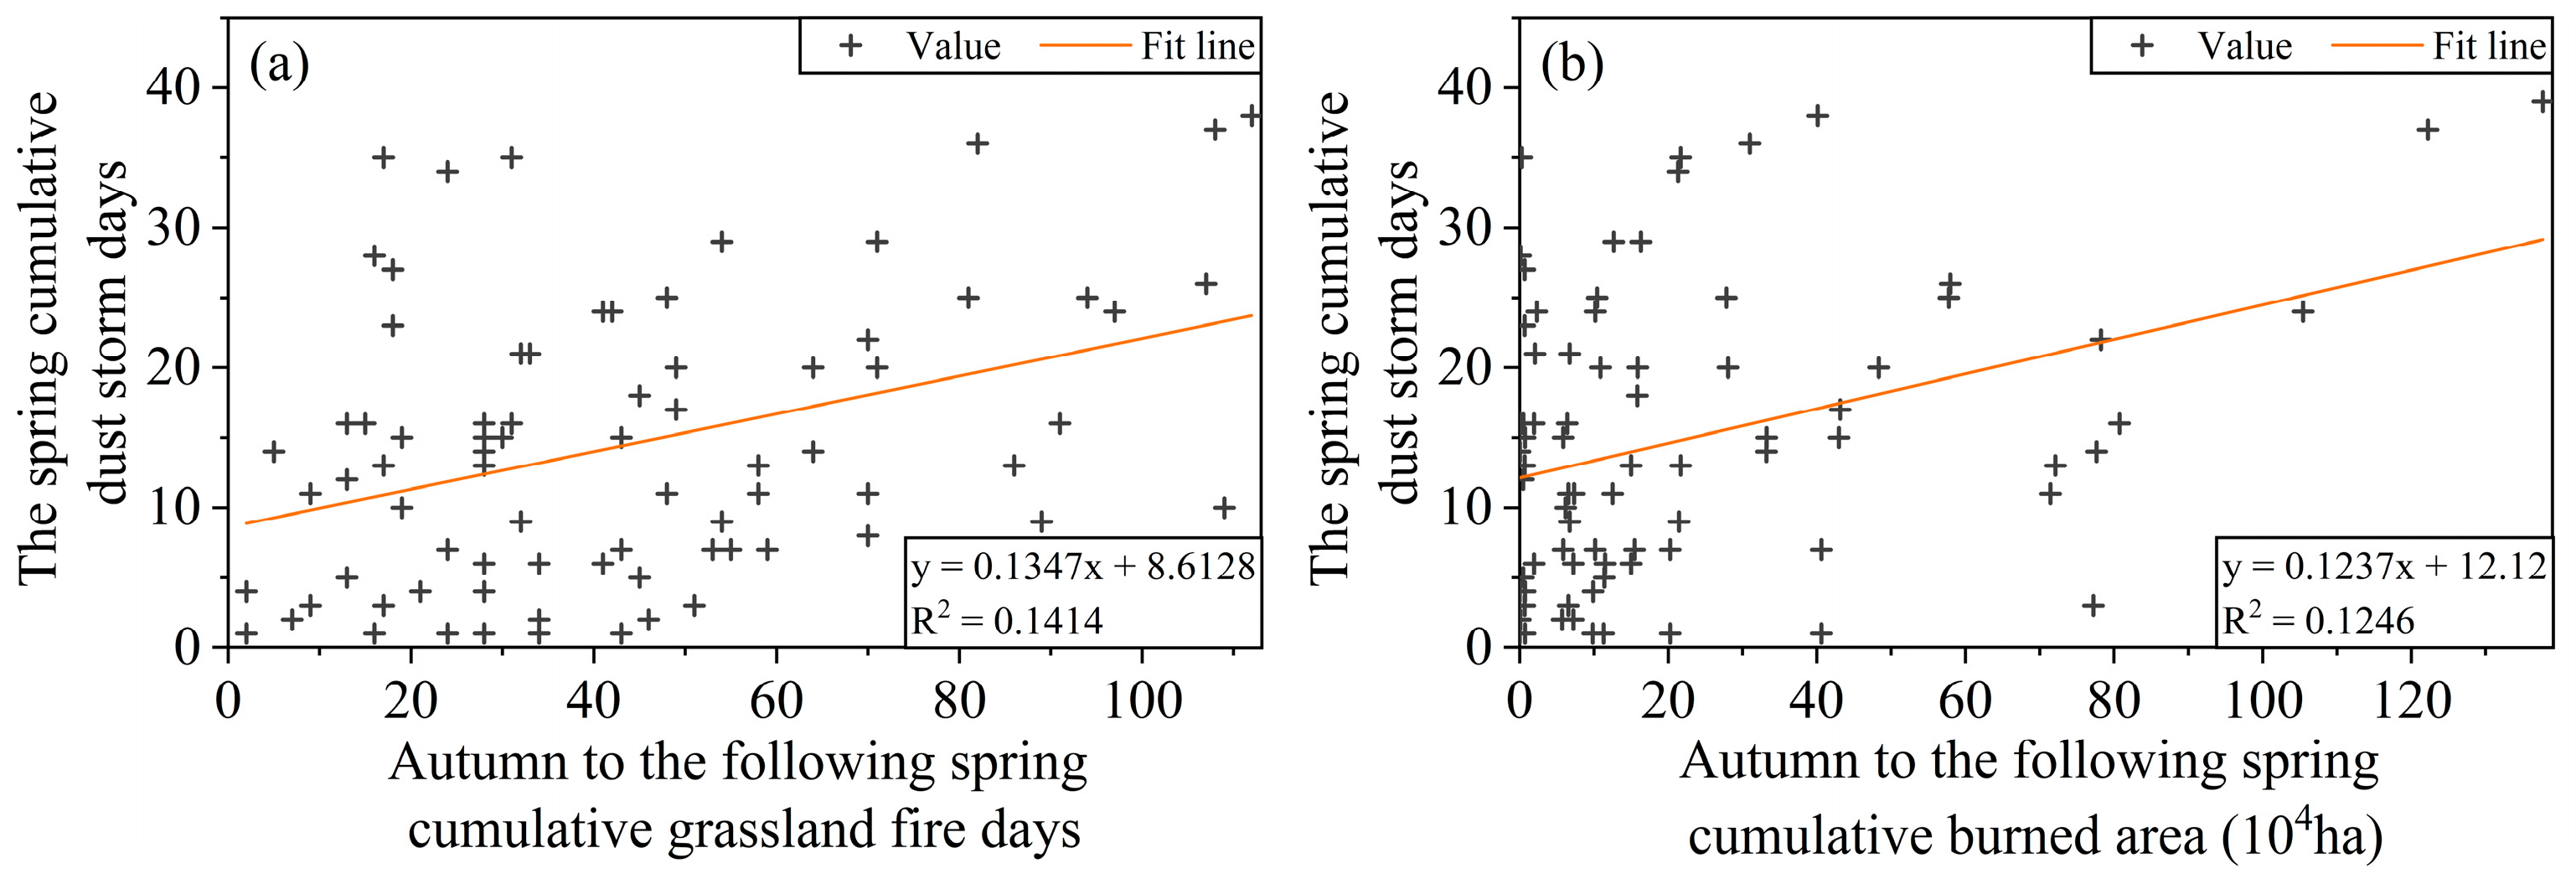
3.3.2. Effects of Grassland Fires on Dust Storms
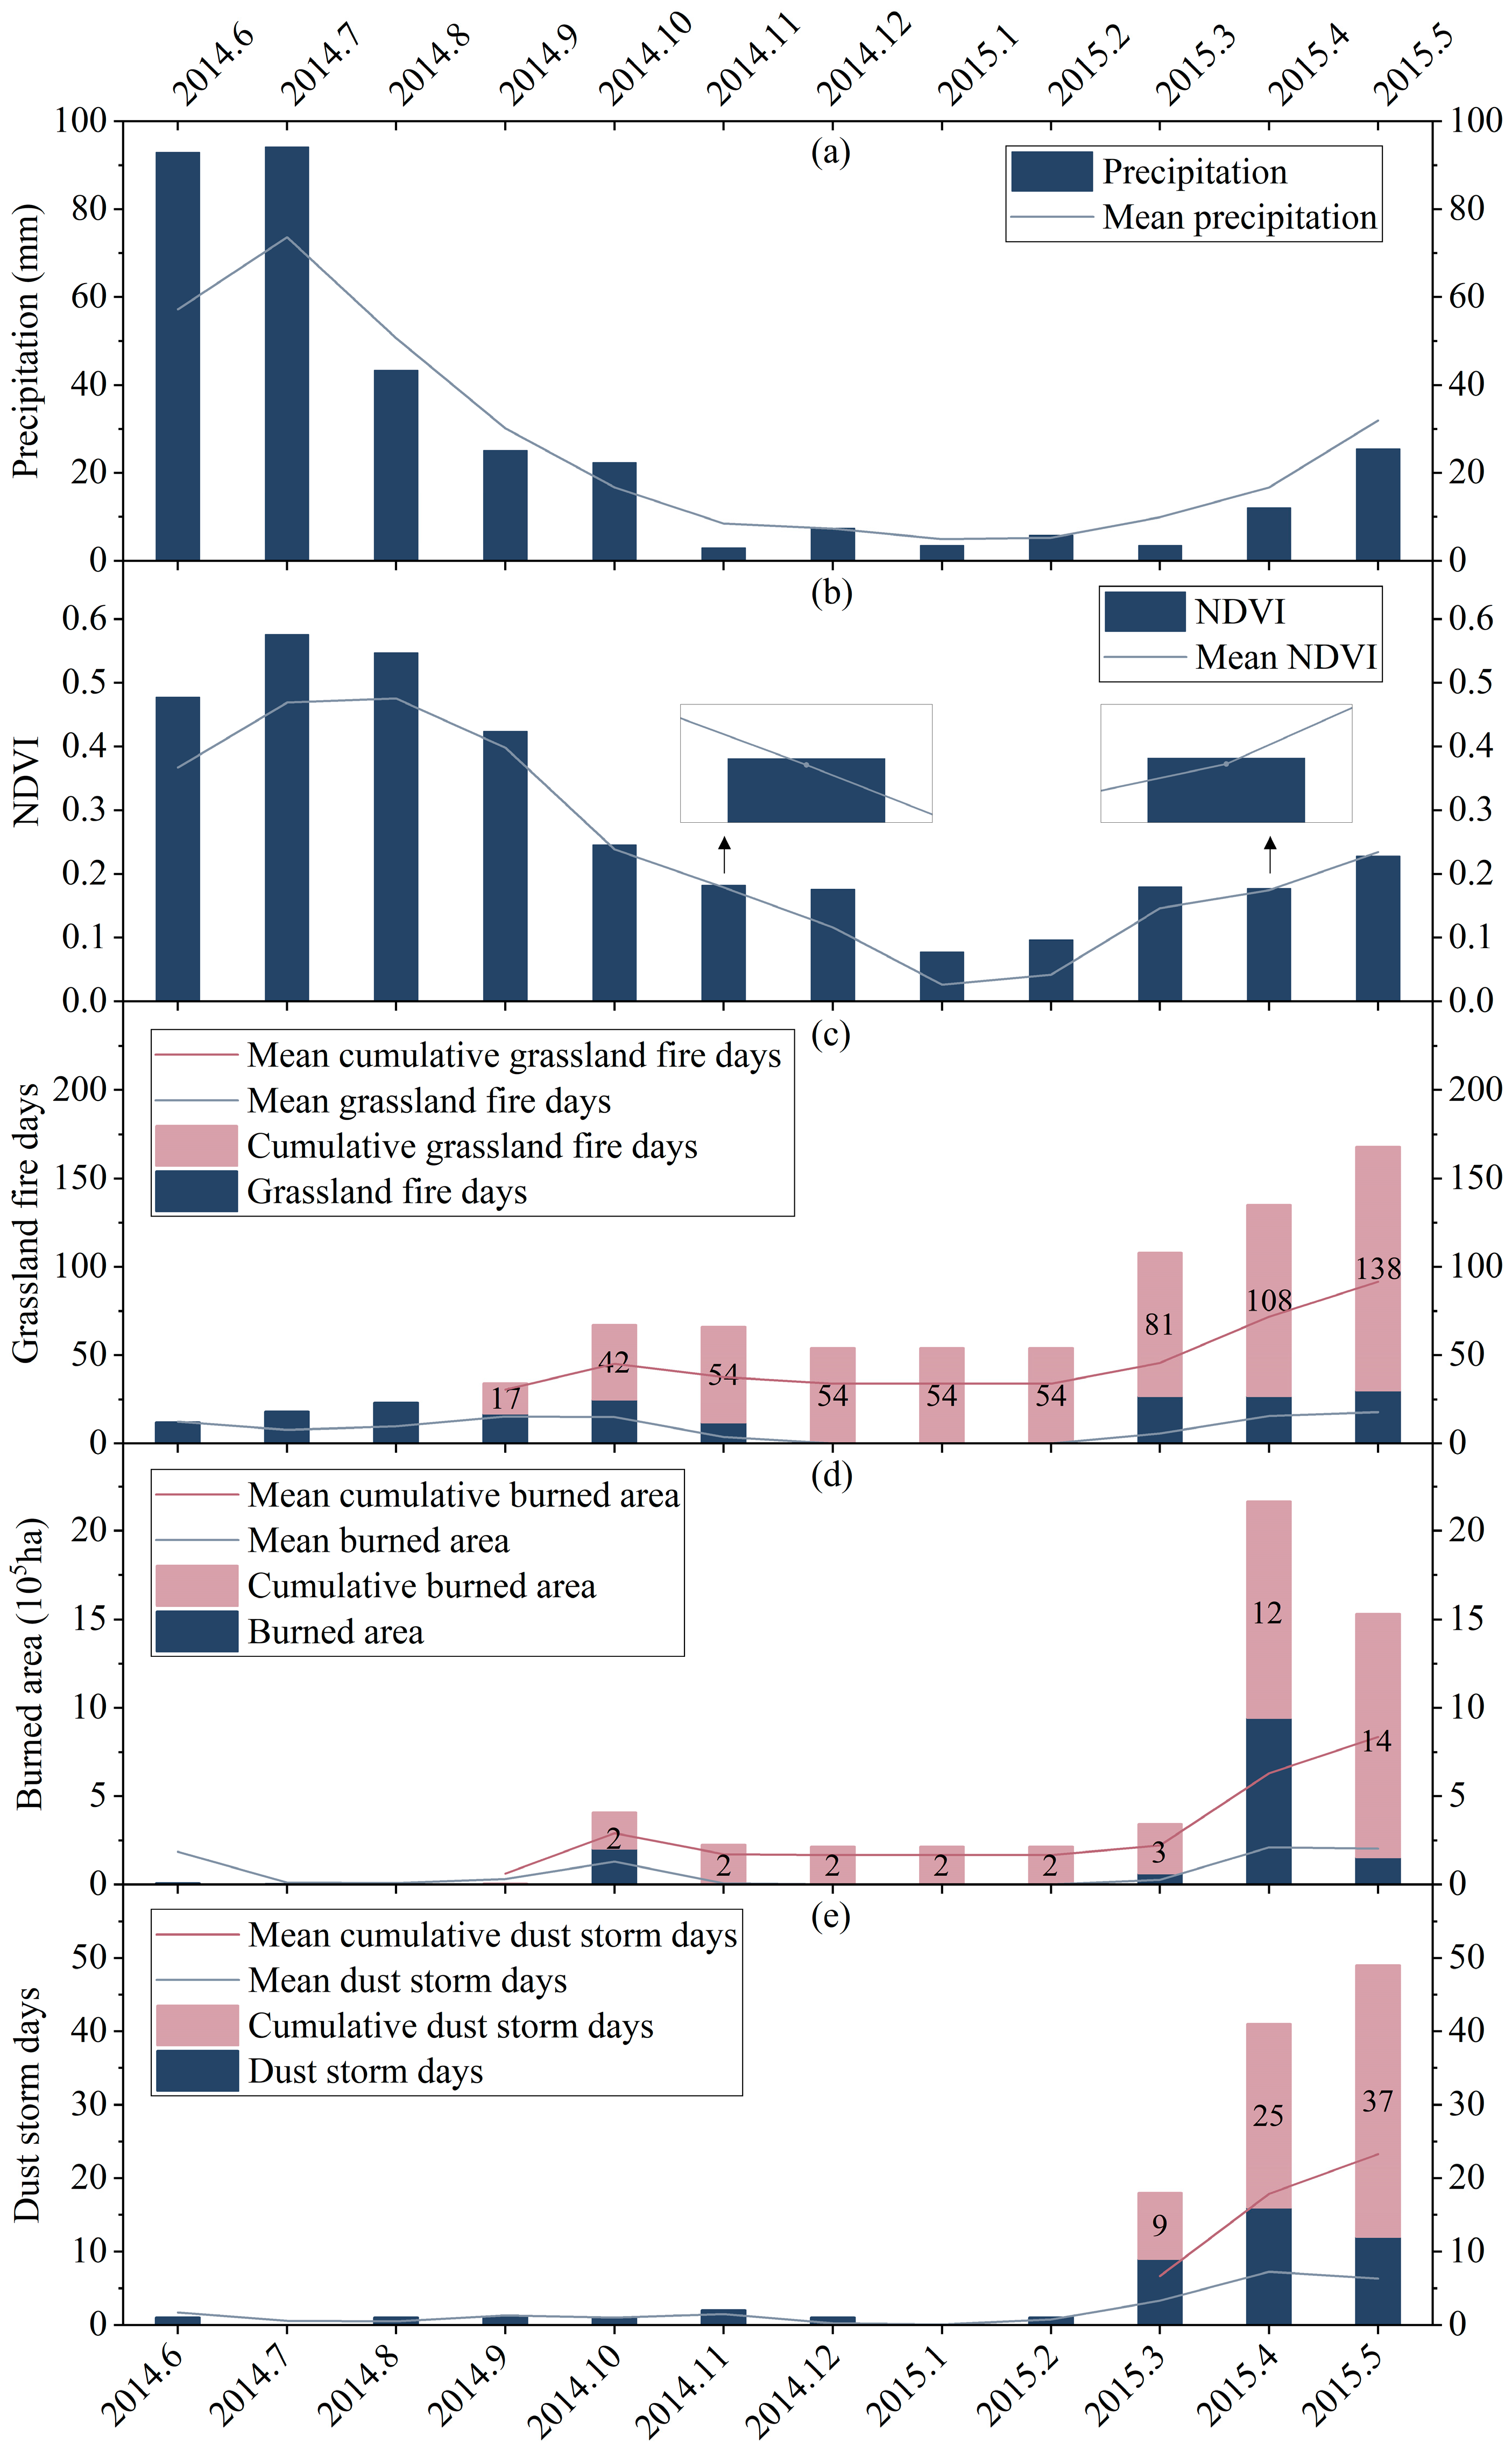
3.4. Analysis of the Mechanisms of the Effects of Grassland Fires on Dust Storms
4. Discussion
5. Conclusions
Author Contributions
Funding
Data Availability Statement
Acknowledgments
Conflicts of Interest
Appendix A

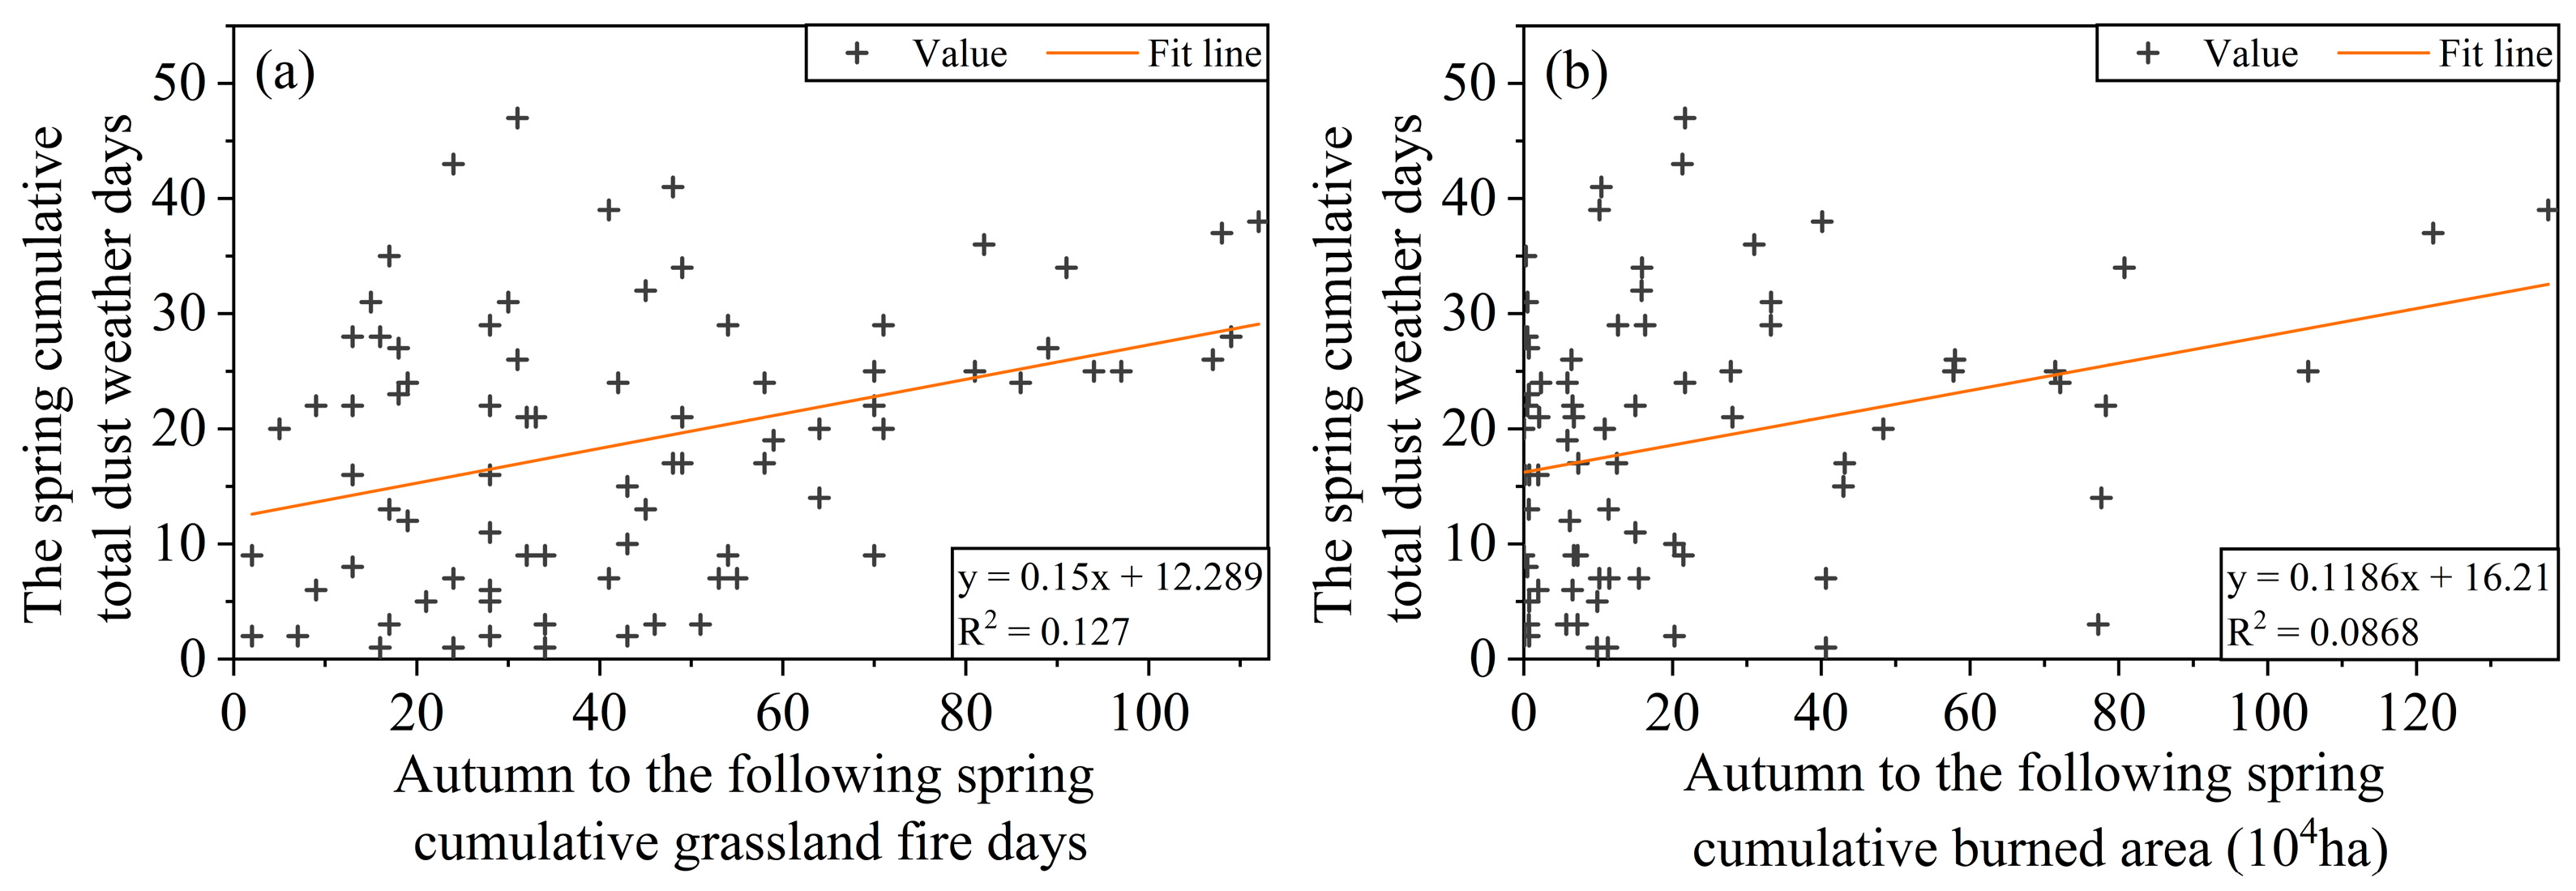
| Autumn to the Following Spring Cumulative Grassland Fire Days | Autumn to the Following Spring Cumulative Burned Area | |
|---|---|---|
| The spring cumulative total dust weather days | 0.356 *** | 0.295 *** |
| The spring cumulative dust storm days | 0.376 *** | 0.353 *** |
References
- Chen, J.; Wu, Y.; Wu, S.; Xie, L.; Tang, J.; Xu, Z.; Han, X.; Ma, X.; Zheng, W.; Sun, T.; et al. Application of FY-4B Geostationary Meteorological Satellite in Grassland Fire Dynamic Monitoring. IEEE Trans. Geosci. Remote Sens. 2023, 61, 1. [Google Scholar] [CrossRef]
- Zhang, R.P.; Zhou, J.H.; Guo, J.; Miao, Y.H.; Zhang, L.L. Inversion models of aboveground grassland biomass in Xinjiang based on multisource data. Front. Plant Sci. 2023, 14, 2. [Google Scholar] [CrossRef] [PubMed]
- Zhou, H.; Wang, Y.; Zhou, G. Temporal and spatial dynamics of grassland fires in Inner Mongolia. Acta Prataculturae Sin. 2016, 25, 16–25. [Google Scholar] [CrossRef]
- Qu, Z.; Zheng, S.; Bai, Y. Spatiotemporal patterns and driving factors of grassland fire on Mongolian Plateau. Chin. J. Appl. Ecol. 2010, 21, 807–813. [Google Scholar] [CrossRef]
- Cao, H.; Fu, C.; Zhang, W.; Liu, J. Characterizing Sand and Dust Storms (SDS) Intensity in China Based on Meteorological Data. Sustainability 2018, 10, 2372. [Google Scholar] [CrossRef]
- Bao, C.; Yong, M.; Bueh, C.; Bao, Y.; Jin, E.; Bao, Y.; Purevjav, G. Analyses of the Dust Storm Sources, Affected Areas, and Moving Paths in Mongolia and China in Early Spring. Remote Sens. 2022, 14, 3661. [Google Scholar] [CrossRef]
- Shao, Y.; Klose, M.; Wyrwoll, K.-H. Recent global dust trend and connections to climate forcing. J. Geophys. Res. Atmos. 2013, 118, 2. [Google Scholar] [CrossRef]
- Bao, C.; Yong, M.; Jin, E.; Bao, Y.; Tu, X.; Bao, Y. Regional spatial and temporal variation characteristics of dust in East Asia. Geogr. Res. 2021, 40, 3002–3015. [Google Scholar] [CrossRef]
- Goudie, A.S. Desert dust and human health disorders. Environ. Int. 2014, 63, 101–113. [Google Scholar] [CrossRef]
- Yu, S.; Jiang, L.; Du, W.; Zhao, J.; Zhang, H.; Zhang, Q.; Liu, H. Estimation and Spatio-temporal Patterns of Carbon Emissions from Grassland Fires in Inner Mongolia, China. Chin. Geogr. Sci. 2020, 30, 573. [Google Scholar] [CrossRef]
- Ginoux, P.; Prospero, J.M.; Gill, T.E.; Hsu, N.C.; Zhao, M. Global-scale attribution of anthropogenic and natural dust sources and their emission rates based on MODIS Deep Blue aerosol products. Rev. Geophys. 2012, 50, 1–2. [Google Scholar] [CrossRef]
- Rashki, A.; Kaskaoutis, D.G.; Sepehr, A. Statistical evaluation of the dust events at selected stations in Southwest Asia: From the Caspian Sea to the Arabian Sea. Catena 2018, 165, 590–591. [Google Scholar] [CrossRef]
- Wang, Z.; Huang, R.; Yao, Q.; Zong, X.; Tian, X.; Zheng, B.; Trouet, V. Strong winds drive grassland fires in China. Environ. Res. Lett. 2023, 18, 015005. [Google Scholar] [CrossRef]
- Idris, M.H.; Kuraji, K.; Suzuki, M. Evaluating vegetation recovery following large-scale forest fires in Borneo and northeastern China using multi-temporal NOAA/AVHRR images. J. For. Res. 2005, 10, 101–111. [Google Scholar] [CrossRef]
- Yu, Y.; Ginoux, P. Enhanced dust emission following large wildfires due to vegetation disturbance. Nat. Geosci. 2022, 15, 878–883. [Google Scholar] [CrossRef]
- Bao, C.; Yong, M.; Bi, L.; Gao, H.; Li, J.; Bao, Y. Impacts of Underlying Surface on the Dusty Weather in Central Inner Mongolian Steppe, China. Earth Space Sci. 2021, 8, 1–17. [Google Scholar] [CrossRef]
- Sankey, J.B.; Germino, M.J.; Glenn, N.F. Relationships of post-fire aeolian transport to soil and atmospheric conditions. Aeolian Res. 2009, 1, 75. [Google Scholar] [CrossRef]
- Whicker, J.J.; Breshears, D.D.; Wasiolek, P.T.; Kirchner, T.B.; Tavani, R.A.; Schoep, D.A.; Rodgers, J.C. Temporal and Spatial Variation of Episodic Wind Erosion in Unburned and Burned Semiarid Shrubland. J. Environ. Qual. 2002, 31, 599–612. [Google Scholar] [CrossRef]
- Faustino-Eslava, D.V.; Yumul, G.P.; Servando, N.T.; Dimalanta, C.B. The January 2009 anomalous precipitation associated with the “Tail-end of the Cold Front” weather system in Northern and Eastern Mindanao (Philippines): Natural hazards, impacts and risk reductions. Glob. Planet. Chang. 2011, 76, 85–94. [Google Scholar] [CrossRef]
- Wang, T.; Tu, X.; Singh, V.P.; Chen, X.; Lin, K.; Lai, R.; Zhou, Z. Socioeconomic drought analysis by standardized water supply and demand index under changing environment. J. Clean. Prod. 2022, 347, 131248. [Google Scholar] [CrossRef]
- Xu, S.; Wu, Q.; Qiao, D.; Mu, Y.; Zhang, X.; Liu, Y.; Yang, X.; Shi, Z. Spatiotemporal pattern and effecting factors of wildfire in eastern Mongolia. J. Desert Res. 2021, 41, 83–91. [Google Scholar] [CrossRef]
- Bao, T.; Gao, T.; Nandintsetseg, B.; Yong, M.; Jin, E. Variations in Frequency and Intensity of Dust Events Crossing the Mongolia–China Border. Sola 2021, 17, 147–149. [Google Scholar] [CrossRef]
- Li, Y.; Zhao, J.; Guo, X.; Zhang, Z.; Tan, G.; Yang, J. The Influence of Land Use on the Grassland Fire Occurrence in the Northeastern Inner Mongolia Autonomous Region, China. Sensors 2017, 17, 437. [Google Scholar] [CrossRef] [PubMed]
- Liu, M.; Zhao, J.; Guo, X.; Zhang, Z.; Tan, G.; Yang, J. Study on Climate and Grassland Fire in HulunBuir, Inner Mongolia Autonomous Region, China. Sensors 2017, 17, 616. [Google Scholar] [CrossRef]
- Hope, A.; Tague, C.; Clark, R. Characterizing post-fire vegetation recovery of California chaparral using TM/ETM+ time-series data. Int. J. Remote Sens. 2007, 28, 1339–1354. [Google Scholar] [CrossRef]
- Lacouture, D.L.; Broadbent, E.N.; Crandall, R.M. Detecting Vegetation Recovery after Fire in A Fire-Frequented Habitat Using Normalized Difference Vegetation Index (NDVI). Forests 2020, 11, 749. [Google Scholar] [CrossRef]
- An, L.; Che, H.; Xue, M.; Zhang, T.; Wang, H.; Wang, Y.; Zhou, C.; Zhao, H.; Gui, K.; Zheng, Y.; et al. Temporal and spatial variations in sand and dust storm events in East Asia from 2007 to 2016: Relationships with surface conditions and climate change. Sci Total Environ. 2018, 633, 452–462. [Google Scholar] [CrossRef]
- Bao, T.; Xi, G.; Deng, B.; Chang, I.S.; Wu, J.; Jin, E. Long-term variations in spatiotemporal clustering characteristics of dust events in potential dust sources in East Asia. Catena 2023, 232, 1–14. [Google Scholar] [CrossRef]
- Gavrouzou, M.; Hatzianastassiou, N.; Gkikas, A.; Korras-Carraca, M.-B.; Mihalopoulos, N. A Global Climatology of Dust Aerosols Based on Satellite Data: Spatial, Seasonal and Inter-Annual Patterns over the Period 2005–2019. Remote Sens. 2021, 13, 359. [Google Scholar] [CrossRef]
- Jugder, D.; Shinoda, M.; Sugimoto, N.; Matsui, I.; Nishikawa, M.; Park, S.-U.; Chun, Y.-S.; Park, M.-S. Spatial and temporal variations of dust concentrations in the Gobi Desert of Mongolia. Glob. Planet. Chang. 2011, 78, 14–22. [Google Scholar] [CrossRef]
- Liu, X.; Song, H.; Lei, T.; Liu, P.; Xu, C.; Wang, D.; Yang, Z.; Xia, H.; Wang, T.; Zhao, H. Effects of natural and anthropogenic factors and their interactions on dust events in Northern China. Catena 2021, 196, 104919. [Google Scholar] [CrossRef]
- Zhang, X.X.; Lei, J.Q.; Wu, S.X.; Li, S.Y.; Liu, L.Y.; Wang, Z.F.; Huang, S.Y.; Guo, Y.H.; Wang, Y.D.; Tang, X.; et al. Spatiotemporal evolution of aeolian dust in China: An insight into the synoptic records of 1984–2020 and nationwide practices to combat desertification. Land Degrad. Dev. 2023, 34, 2005–2023. [Google Scholar] [CrossRef]
- Aryal, Y.; Evans, S. Dust emission response to precipitation and temperature anomalies under different climatic conditions. Sci. Total Environ. 2023, 874, 162335. [Google Scholar] [CrossRef] [PubMed]
- Lee, E.-H.; Sohn, B.-J. Recent increasing trend in dust frequency over Mongolia and Inner Mongolia regions and its association with climate and surface condition change. Atmos. Environ. 2011, 45, 4611–4616. [Google Scholar] [CrossRef]
- Li, Y.; Hu, X.; Wang, X.; Ji, M. Impact of transient eddy fluxes on the dust storm event: Cases study in South Xinjiang, China. Atmos. Res. 2022, 269, 106054. [Google Scholar] [CrossRef]
- Liu, L.; Wang, D.; Wang, Z.; Zhong, J.; Zhang, Y.; Wu, R.; Zhang, X. Implications of North Atlantic warming for a possible increase of dust activity in northern East Asia. Atmos. Res. 2022, 271, 106092. [Google Scholar] [CrossRef]
- Du, J.; Bao, G.; Tong, S.; Huang, X.; Wen, D.; Mei, L.; Bao, Y. Variations in vegetation cover and its relationship with climate change and human activities in Mongolia during the period 1982–2015. Acta Prataculturae Sin. 2021, 30, 9–11. [Google Scholar] [CrossRef]
- Lai, Q. Simulation of GPP Based on Solar-induced Chlorophyll Fluorescence and its Response to Drought in Mongolian Plateau. Ph.D. Thesis, School of Environment, Northeast Normal University, Changchun, China, 2021. [Google Scholar]
- Sun, H.; Wang, W.J.; Liu, Z.; Zou, X.; Zhang, Z.; Ying, H.; Dong, Y.; Yang, R. The relative importance of driving factors of wildfire occurrence across climatic gradients in the Inner Mongolia, China. Ecol. Indic. 2021, 131, 108249. [Google Scholar] [CrossRef]
- Takemi, T. Dust storms and cyclone tracks over the arid regions in east Asia in spring. J. Geophys. Res. 2005, 110, 2. [Google Scholar] [CrossRef]
- Wu, J.; Kurosaki, Y.; Shinoda, M.; Kai, K. Regional Characteristics of Recent Dust Occurrence and Its Controlling Factors in East Asia. Sola 2016, 12, 187–188. [Google Scholar] [CrossRef]
- Na, L.; Zhang, J.; Bao, Y.; Bao, Y.; Na, R.; Tong, S.; Si, A. Himawari-8 Satellite Based Dynamic Monitoring of Grassland Fire in China-Mongolia Border Regions. Sensors 2018, 18, 276. [Google Scholar] [CrossRef] [PubMed]
- Rihan, W.; Zhao, J.; Zhang, H.; Guo, X.; Ying, H.; Deng, G.; Li, H. Wildfires on the Mongolian Plateau: Identifying Drivers and Spatial Distributions to Predict Wildfire Probability. Remote Sens. 2019, 11, 2361. [Google Scholar] [CrossRef]
- Bao, Y.; Shinoda, M.; Yi, K.; Fu, X.; Sun, L.; Nasanbat, E.; Li, N.; Xiang, H.; Yang, Y.; DavdaiJavzmaa, B.; et al. Satellite-Based Analysis of Spatiotemporal Wildfire Pattern in the Mongolian Plateau. Remote Sens. 2022, 15, 190. [Google Scholar] [CrossRef]
- Gerel, O.; Pirajno, F.; Batkhishig, B.; Dostal, J. Mineral Resources of Mongolia; Springer: Singapore, 2021; pp. 1–12. [Google Scholar]
- Xu, J. Sand-dust storms in and around the Ordos Plateau of China as influenced by land use change and desertification. Catena 2006, 65, 279–284. [Google Scholar] [CrossRef]
- Shen, Z.; Zhang, Q.; Chen, D.; Singh, V.P. Varying effects of mining development on ecological conditions and groundwater storage in dry region in Inner Mongolia of China. J. Hydrol. 2021, 597, 125759. [Google Scholar] [CrossRef]
- Fan, B.; Guo, L.; Li, N.; Chen, J.; Lin, H.; Zhang, X.; Shen, M.; Rao, Y.; Wang, C.; Ma, L. Earlier vegetation green-up has reduced spring dust storms. Sci. Rep. 2014, 4, 2–5. [Google Scholar] [CrossRef]
- Liu, Y.; Shi, F.; Liu, X.; Zhao, Z.; Jin, Y.; Zhan, Y.; Zhu, X.; Luo, W.; Zhang, W.; Sun, Y.; et al. Influence of Different Meteorological Factors on the Accuracy of Back Propagation Neural Network Simulation of Soil Moisture in China. Sustainability 2022, 14, 16381. [Google Scholar] [CrossRef]
- Li, X.; Liu, L.; Li, H.; Wang, S.; Heng, J. Spatiotemporal soil moisture variations associated with hydro-meteorological factors over the Yarlung Zangbo River basin in Southeast Tibetan Plateau. Int. J. Climatol. 2019, 40, 199–202. [Google Scholar] [CrossRef]
- Deng, Y.; Wang, S.; Bai, X.; Luo, G.; Wu, L.; Cao, Y.; Li, H.; Li, C.; Yang, Y.; Hu, Z.; et al. Variation trend of global soil moisture and its cause analysis. Ecol. Indic. 2020, 110, 5–9. [Google Scholar] [CrossRef]
- Zhang, H.; Gao, Y.; Sun, D.; Liu, L.; Cui, Y.; Zhu, W. Wind Erosion Changes in a Semi-Arid Sandy Area, Inner Mongolia, China. Sustainability 2019, 11, 188. [Google Scholar] [CrossRef]
- Tatarko, J.; van Donk, S.J.; Ascough, J.C., 2nd; Walker, D.G. Application of the WEPS and SWEEP models to non-agricultural disturbed lands. Heliyon 2016, 2, 2. [Google Scholar] [CrossRef] [PubMed]


| Variable x | Variable y |
|---|---|
| Cumulative grassland fire days (cumulative burned area), September 2001–February 2002 | Cumulative total dust weather days (cumulative dust storm days), March 2002 |
| Cumulative grassland fire days (cumulative burned area), September 2001–March 2002 | Cumulative total dust weather days (cumulative dust storm days), March–April 2002 |
| Cumulative grassland fire days (cumulative burned area), September 2001–April 2002 | Cumulative total dust weather days (cumulative dust storm days), March–May 2002 |
| Cumulative grassland fire days (cumulative burned area), September 2001–May 2002 | Cumulative total dust weather days (cumulative dust storm days), March–June 2002 |
| ⋮ | ⋮ |
| Cumulative grassland fire days (cumulative burned area), September 2021–May 2022 | Cumulative total dust weather days (cumulative dust storm days), March–June 2022 |
| Cumulative Grassland Fire Days | Cumulative Burned Area (105 ha) | |
|---|---|---|
| September 2004 to April 2005 | 33 | 0.2 |
| September 2014 to April 2015 | 108 | 12.22 |
| September 2016 to April 2017 | 16 | 0.01 |
| September 2020 to April 2021 | 13 | 0.05 |
Disclaimer/Publisher’s Note: The statements, opinions and data contained in all publications are solely those of the individual author(s) and contributor(s) and not of MDPI and/or the editor(s). MDPI and/or the editor(s) disclaim responsibility for any injury to people or property resulting from any ideas, methods, instructions or products referred to in the content. |
© 2023 by the authors. Licensee MDPI, Basel, Switzerland. This article is an open access article distributed under the terms and conditions of the Creative Commons Attribution (CC BY) license (https://creativecommons.org/licenses/by/4.0/).
Share and Cite
Wen, L.; Yong, M.; Bao, Y.; Fu, R.; Jin, E. Effect of Grassland Fires on Dust Storms in Dornod Aimag, Mongolia. Remote Sens. 2023, 15, 5629. https://doi.org/10.3390/rs15245629
Wen L, Yong M, Bao Y, Fu R, Jin E. Effect of Grassland Fires on Dust Storms in Dornod Aimag, Mongolia. Remote Sensing. 2023; 15(24):5629. https://doi.org/10.3390/rs15245629
Chicago/Turabian StyleWen, Ling, Mei Yong, Yulong Bao, Rong Fu, and Eerdemutu Jin. 2023. "Effect of Grassland Fires on Dust Storms in Dornod Aimag, Mongolia" Remote Sensing 15, no. 24: 5629. https://doi.org/10.3390/rs15245629
APA StyleWen, L., Yong, M., Bao, Y., Fu, R., & Jin, E. (2023). Effect of Grassland Fires on Dust Storms in Dornod Aimag, Mongolia. Remote Sensing, 15(24), 5629. https://doi.org/10.3390/rs15245629