


A Systematic Review of Radiative Transfer Models for Crop Yield Prediction and Crop Traits Retrieval

 ,
,  , ,
, ,
Abstract
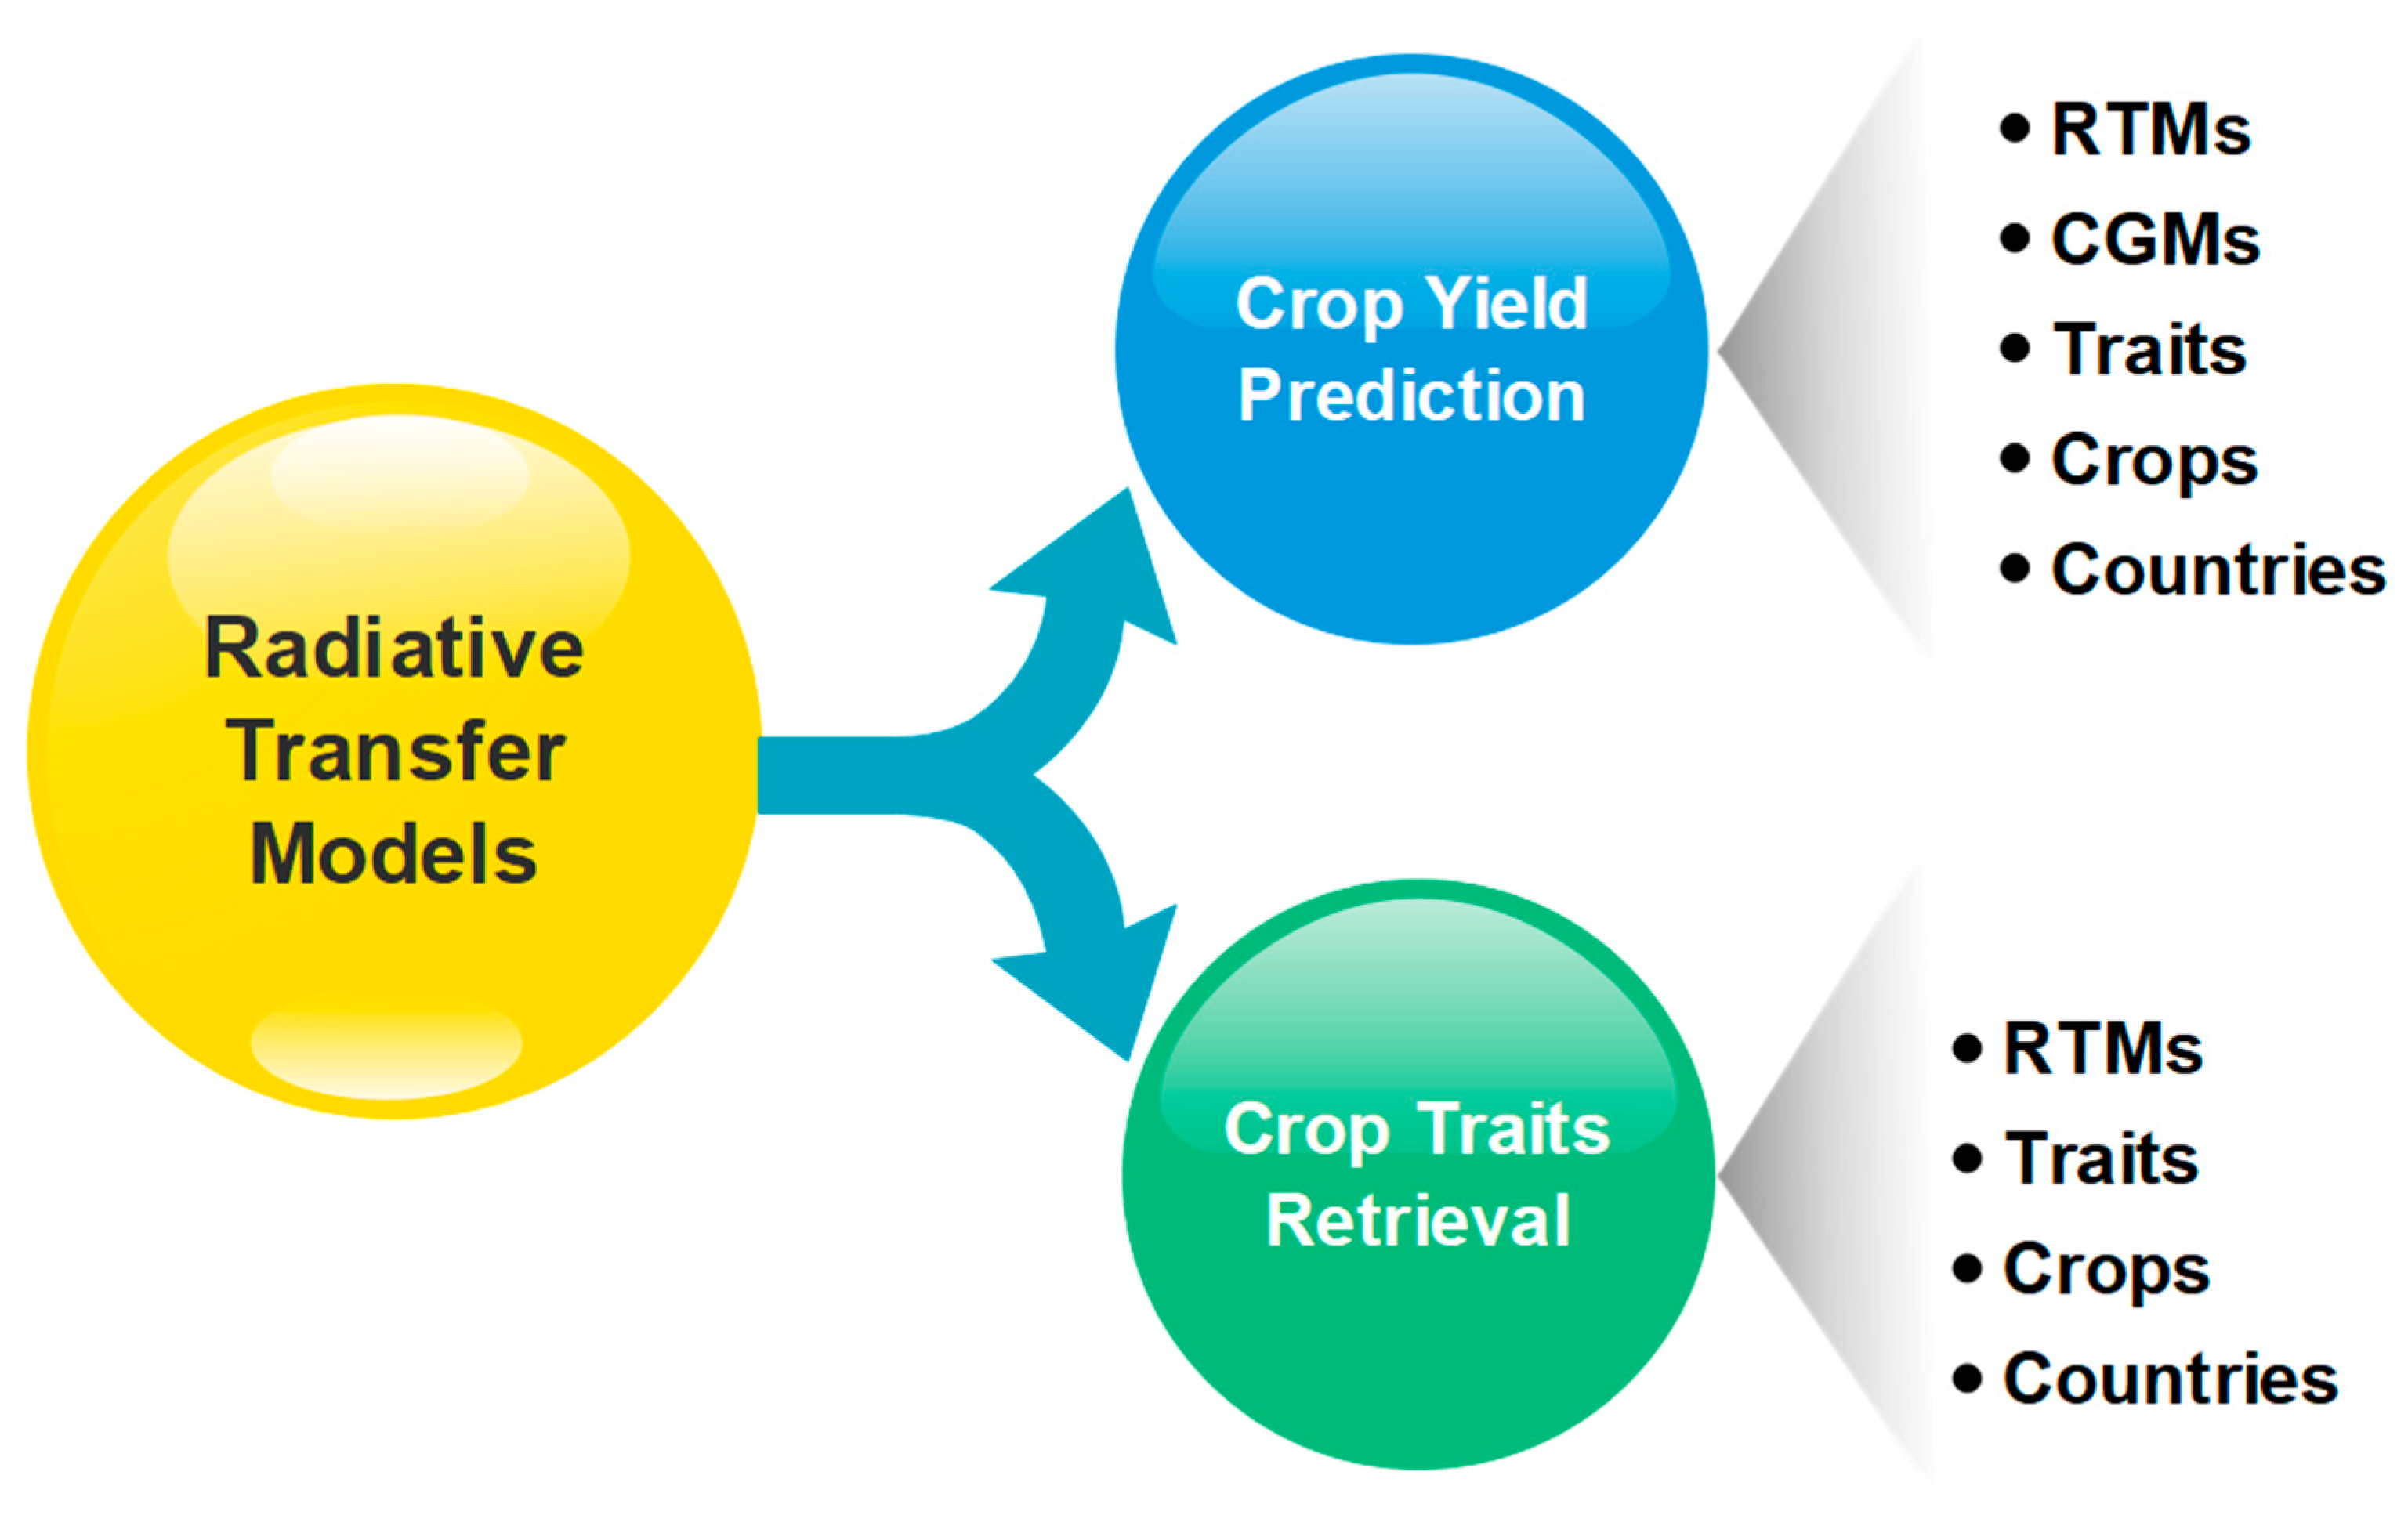
:1. Introduction
- To observe the current status of research studies pertaining to RTM applications for crop yield prediction and retrieval of crop traits.
- To evaluate the effect of integration of RTMs and CGMs on crop yield prediction
- To assess RTM-based crop traits retrieval.
2. Materials and Methods
2.1. Search Approach and Search Terms
2.2. Timeline and Data Sources
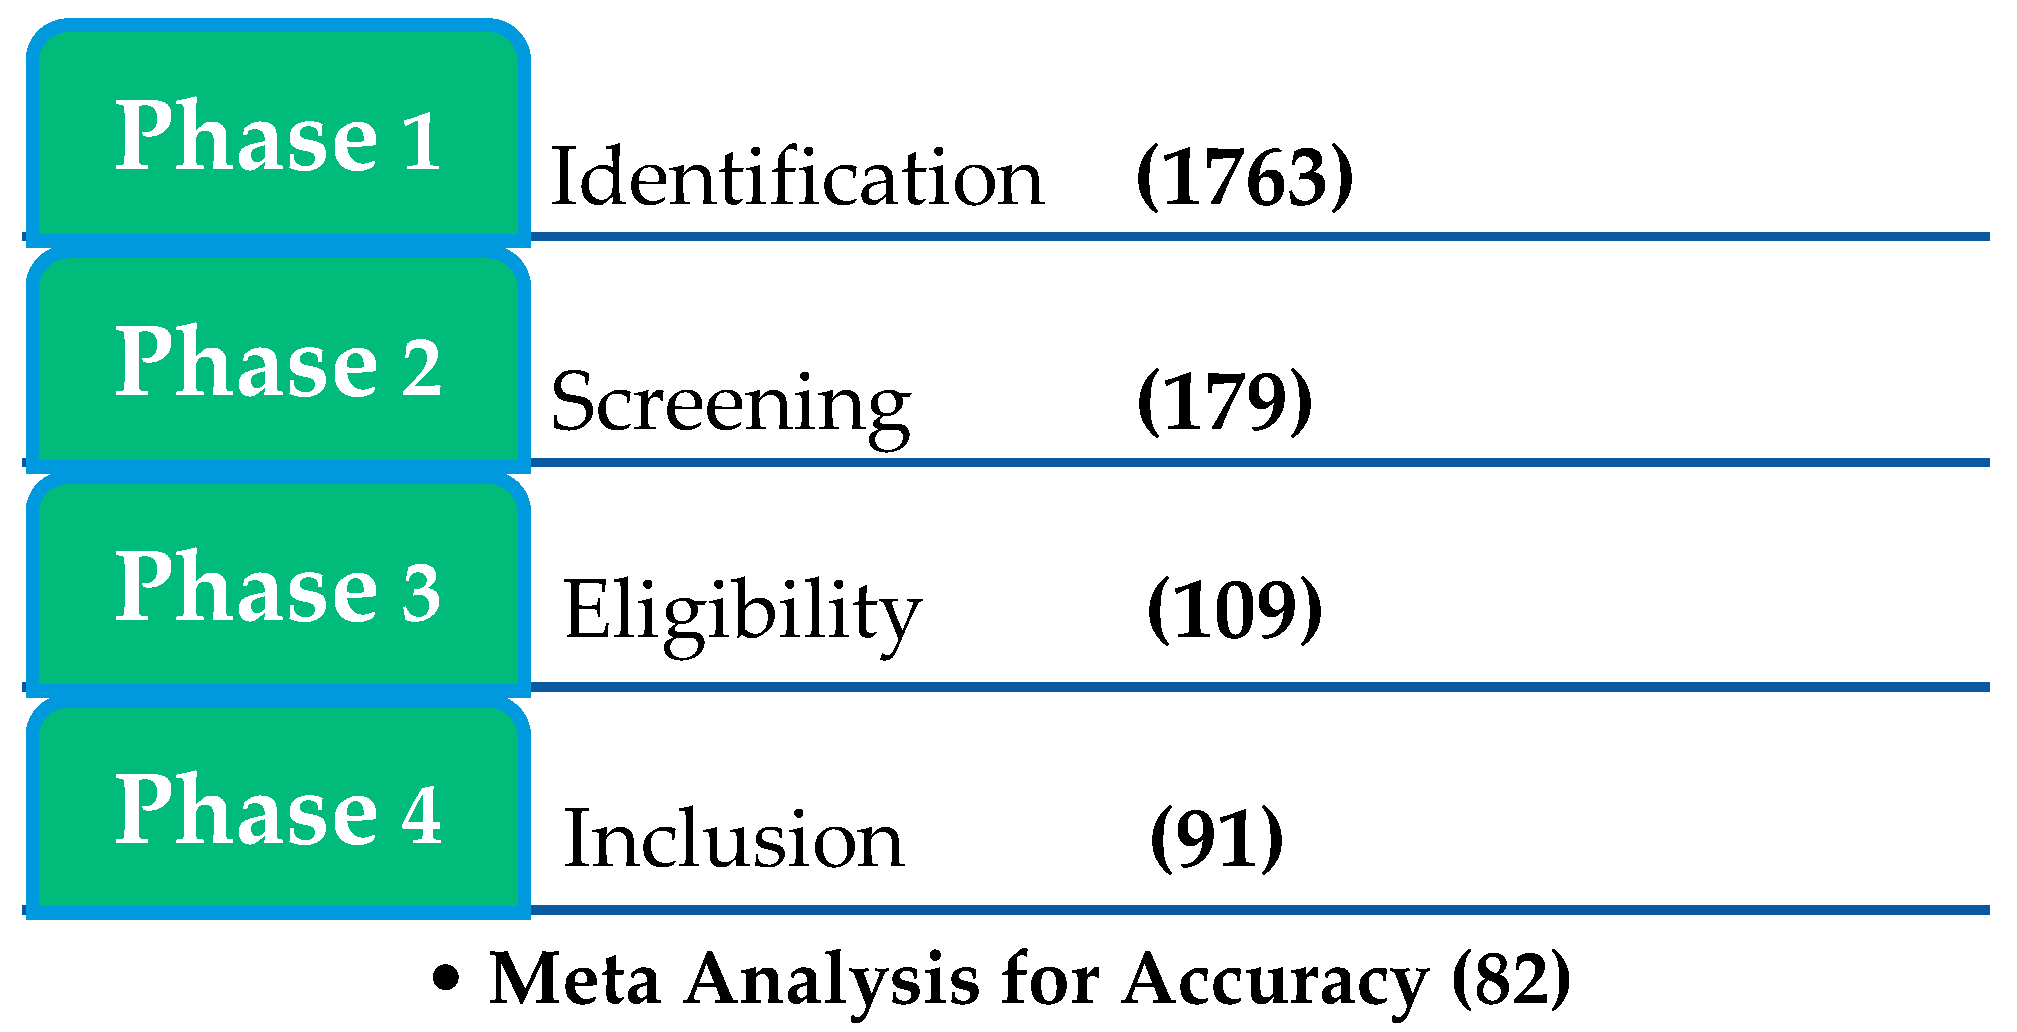
2.3. Selection Process
2.4. Inclusion and Exclusion Criteria
2.5. Quality Assessment Criteria
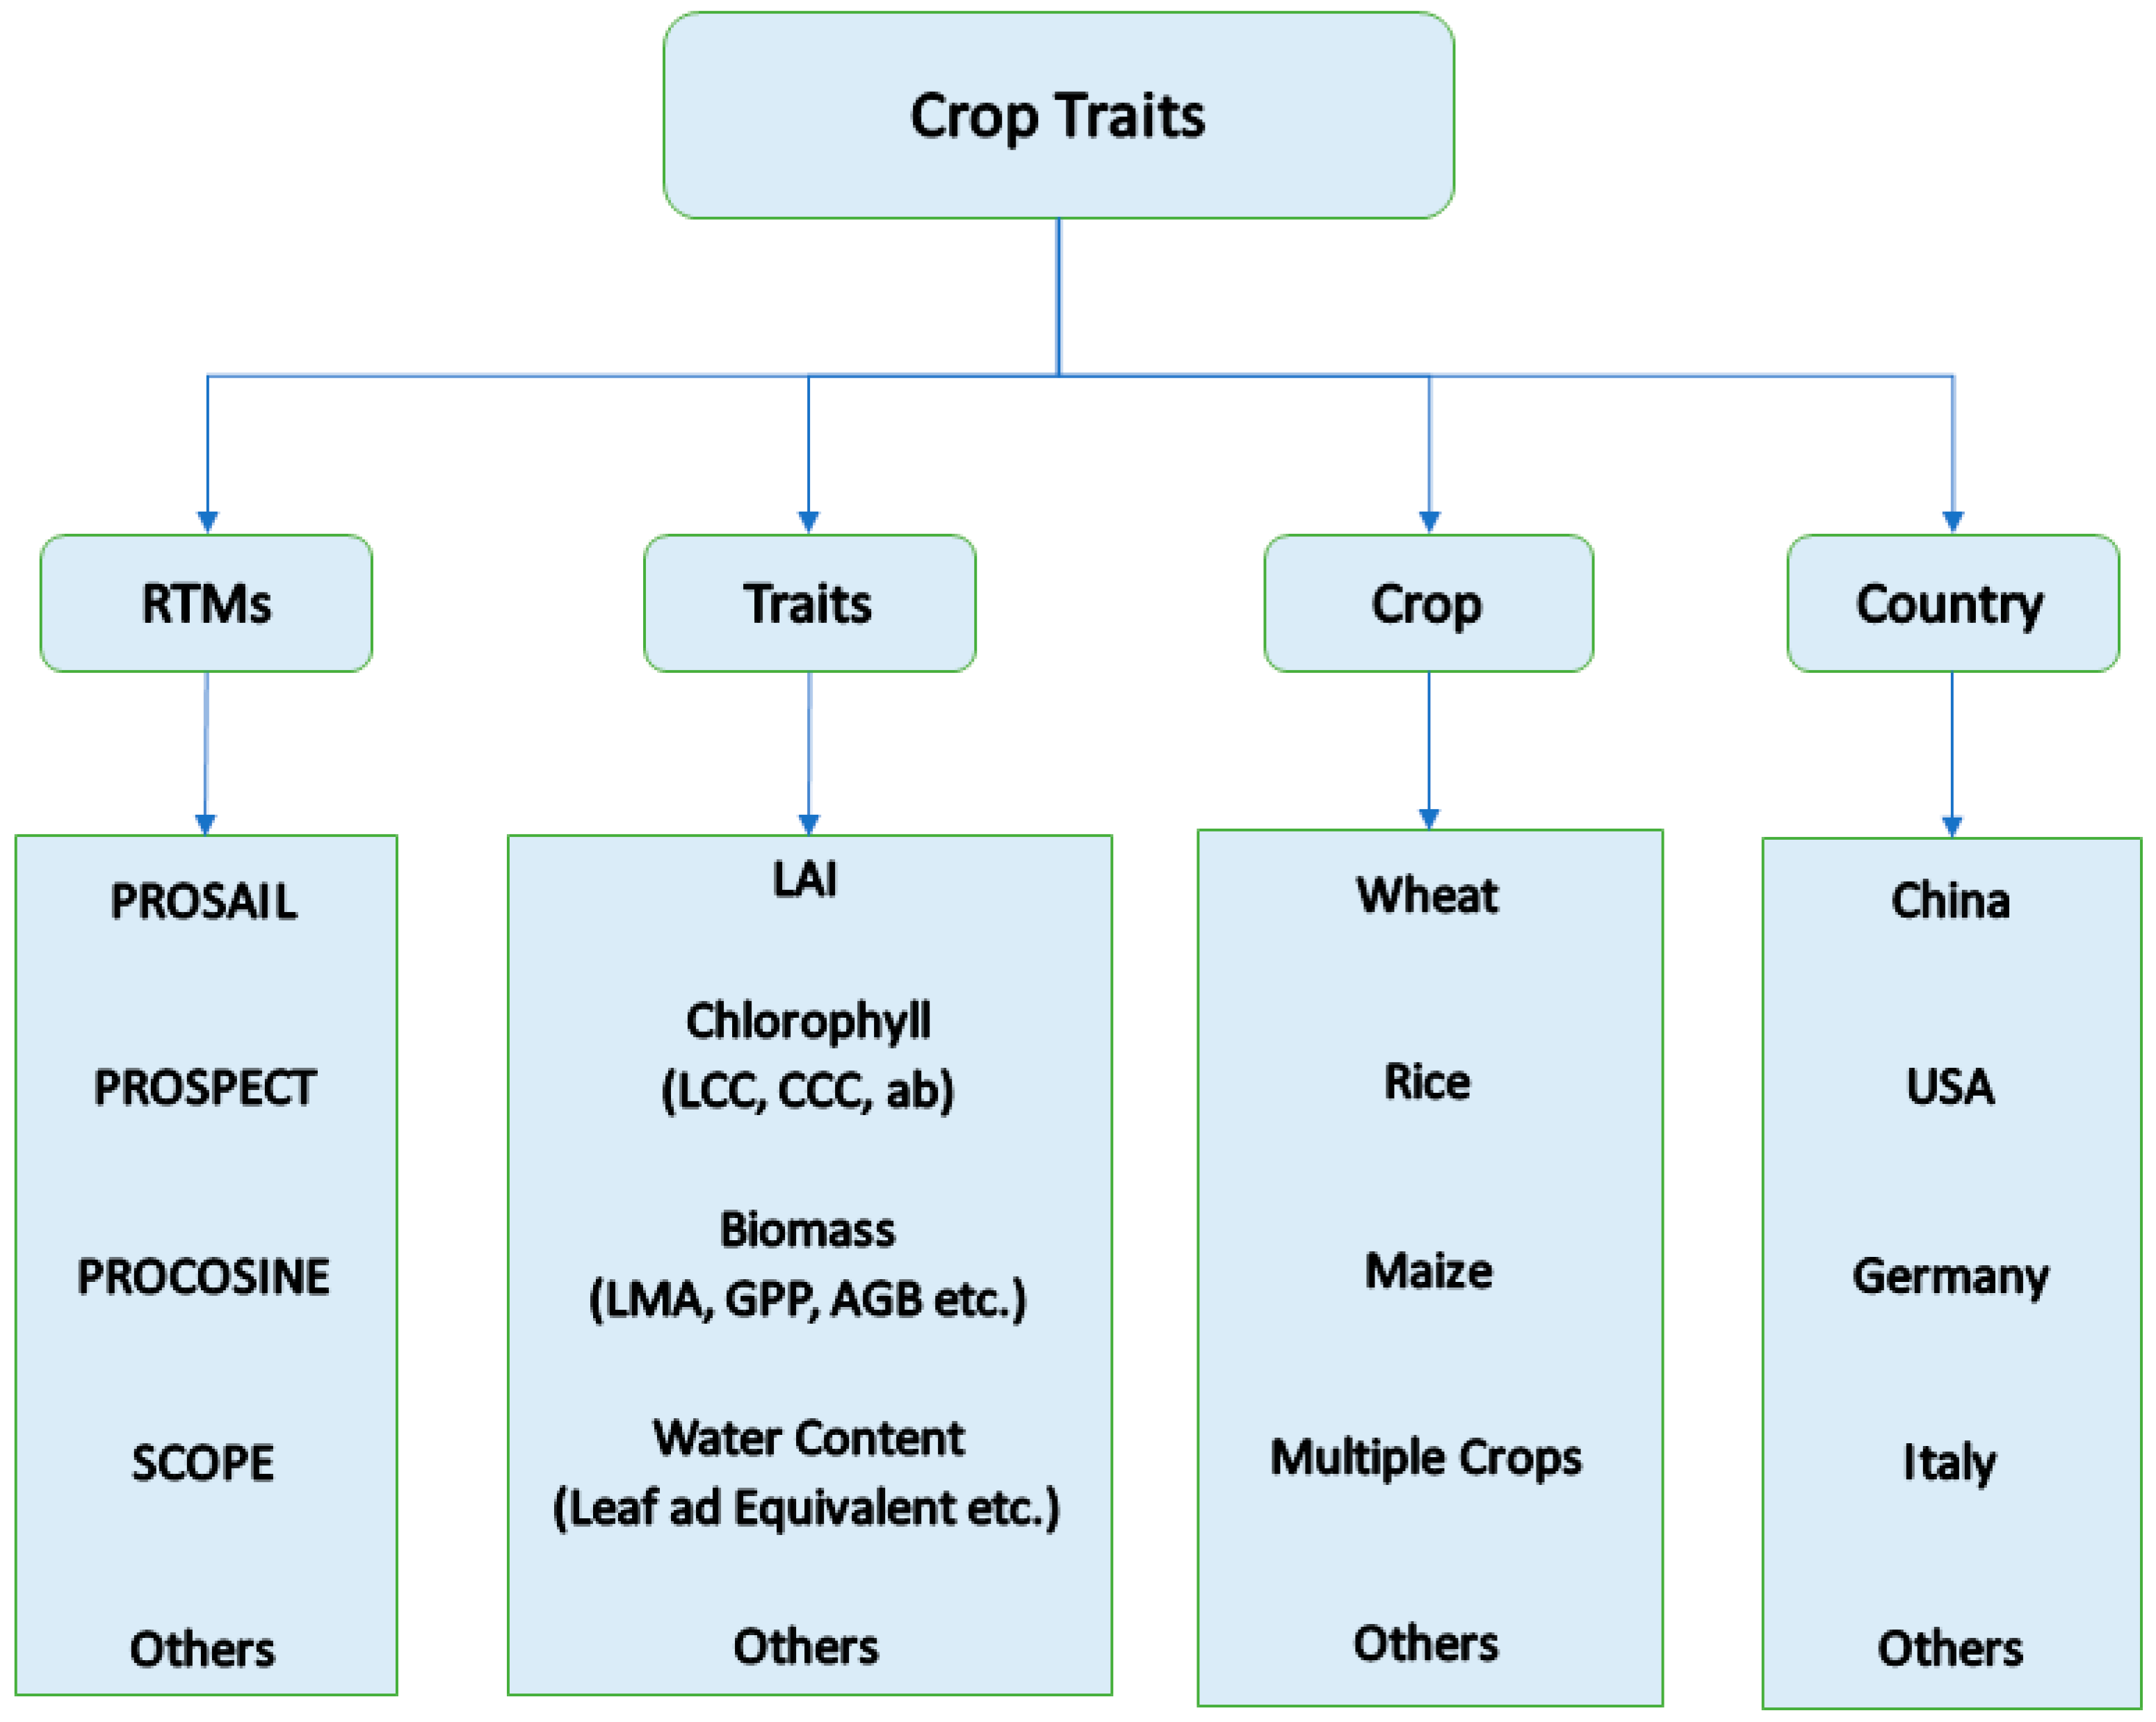
2.6. Segregation and Analytics
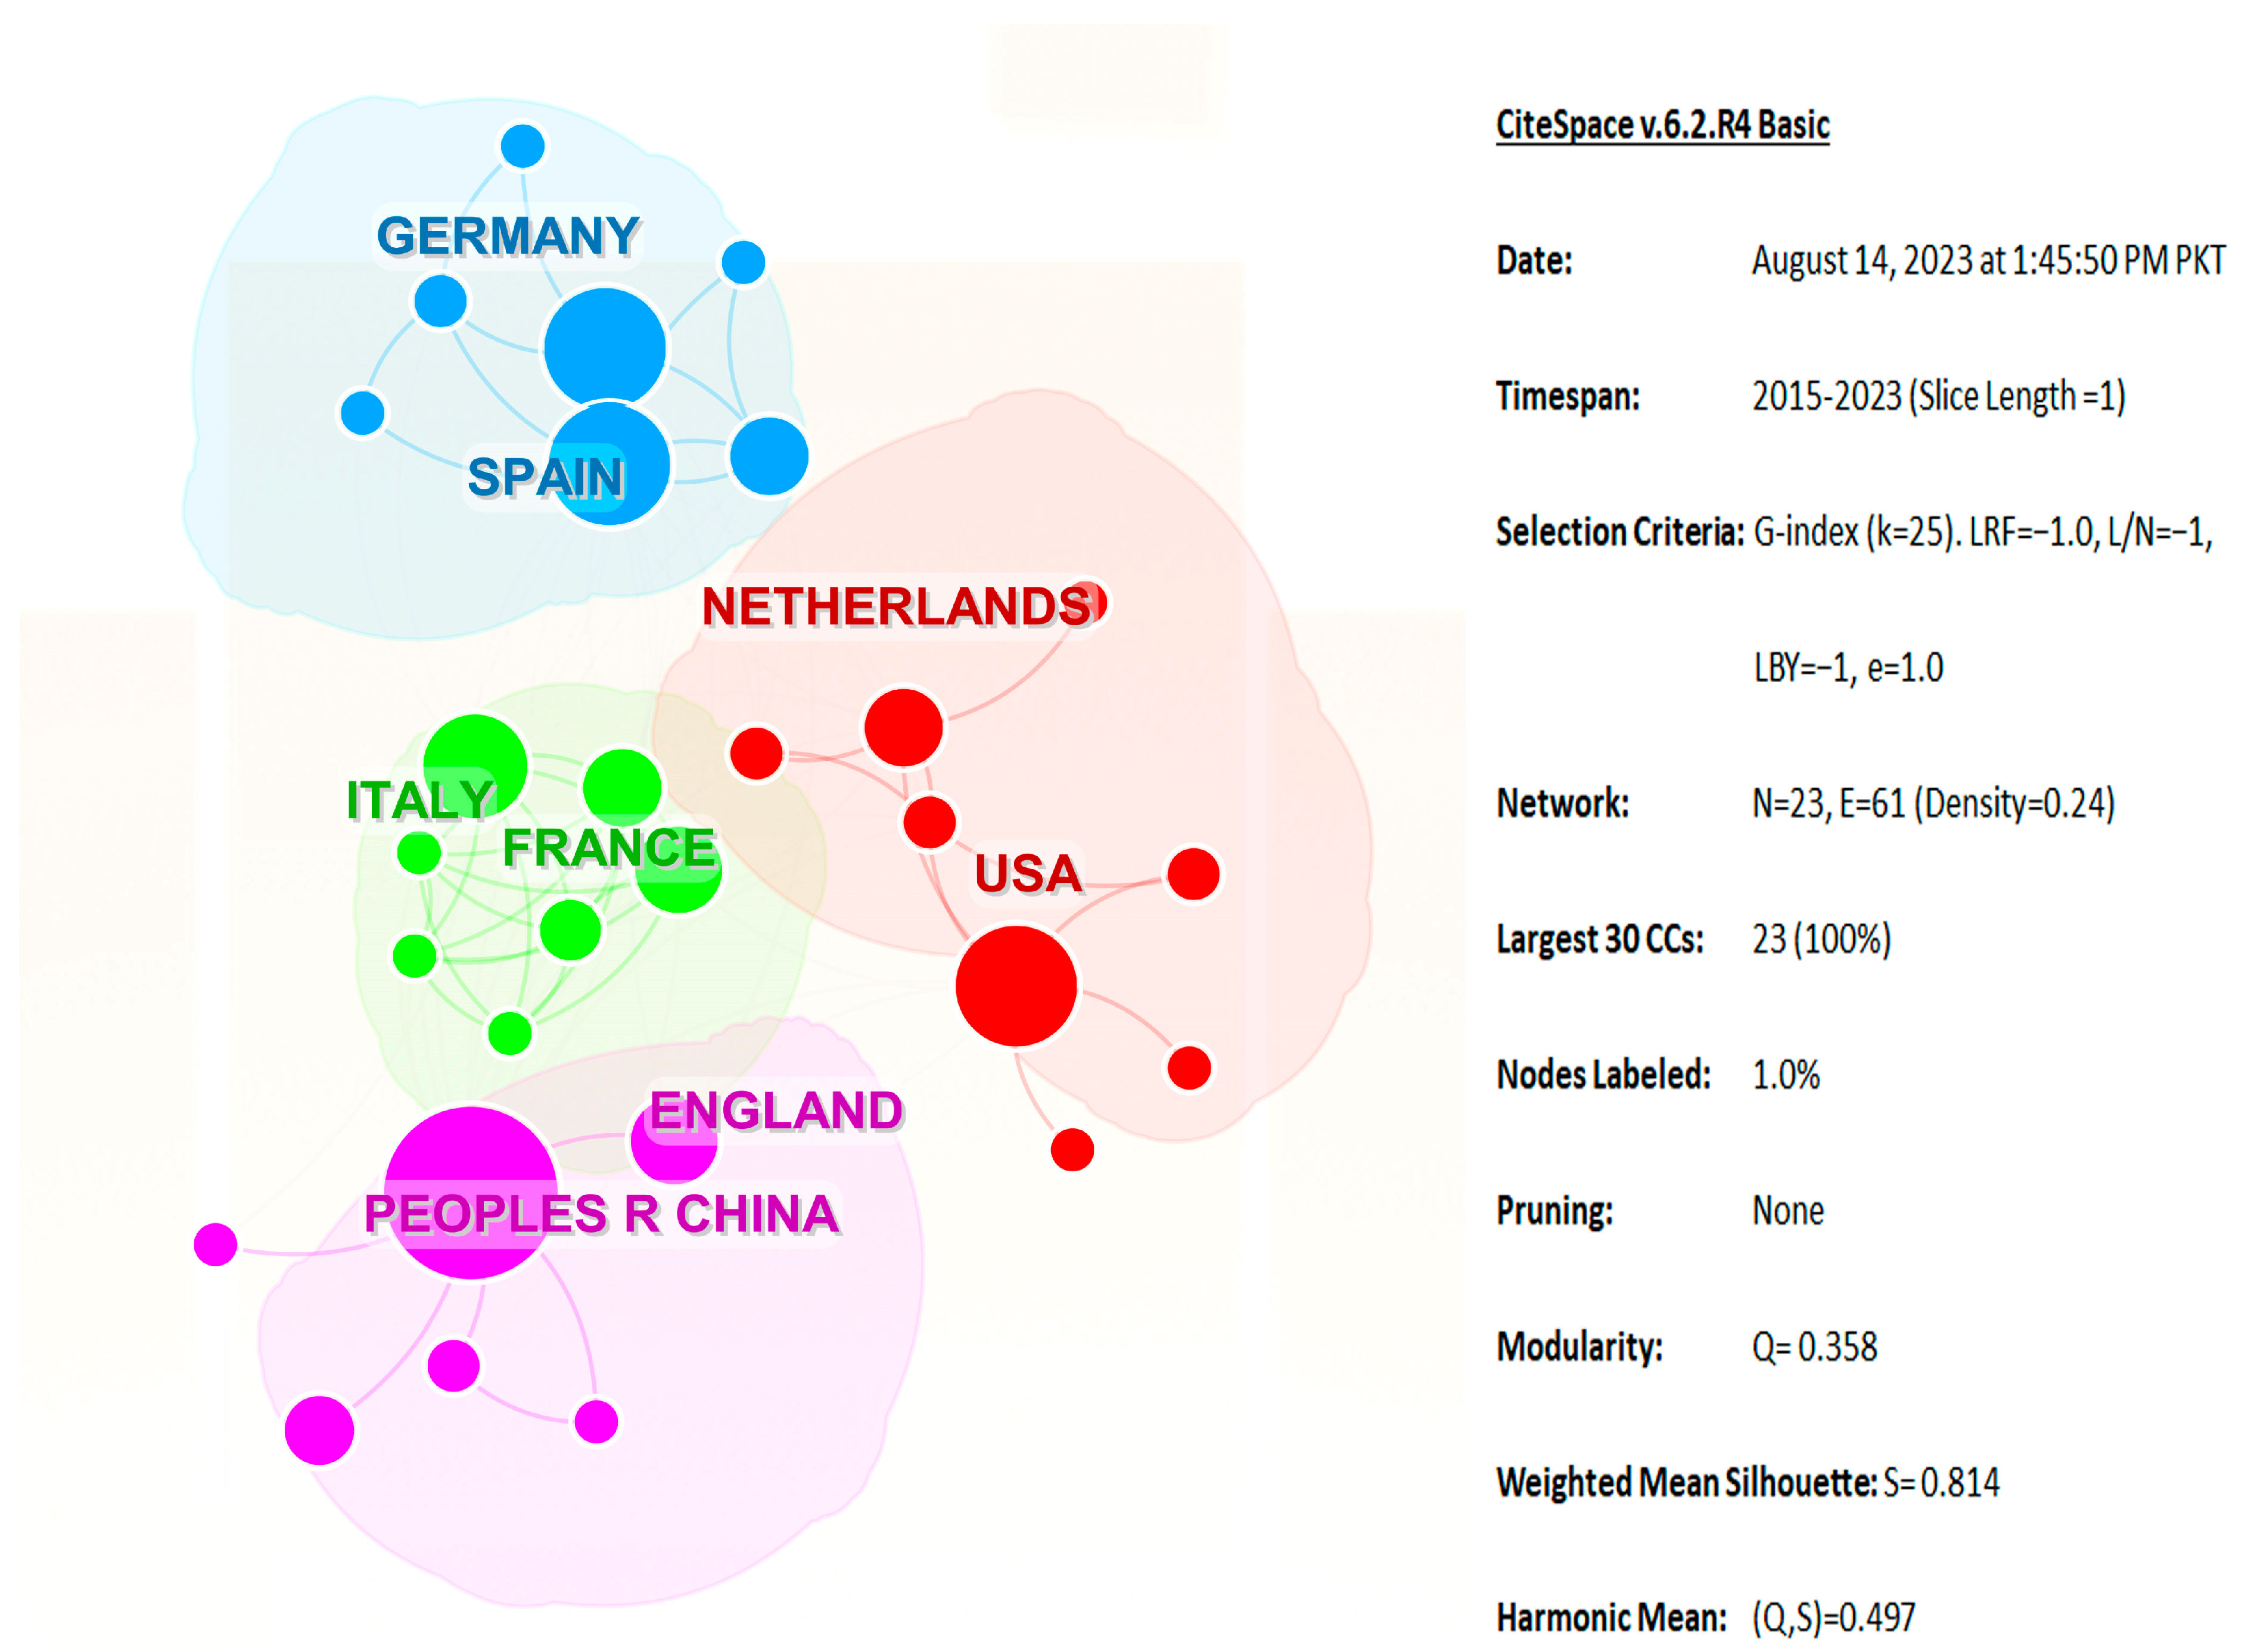
2.7. Scientometrics Analysis
3. Results
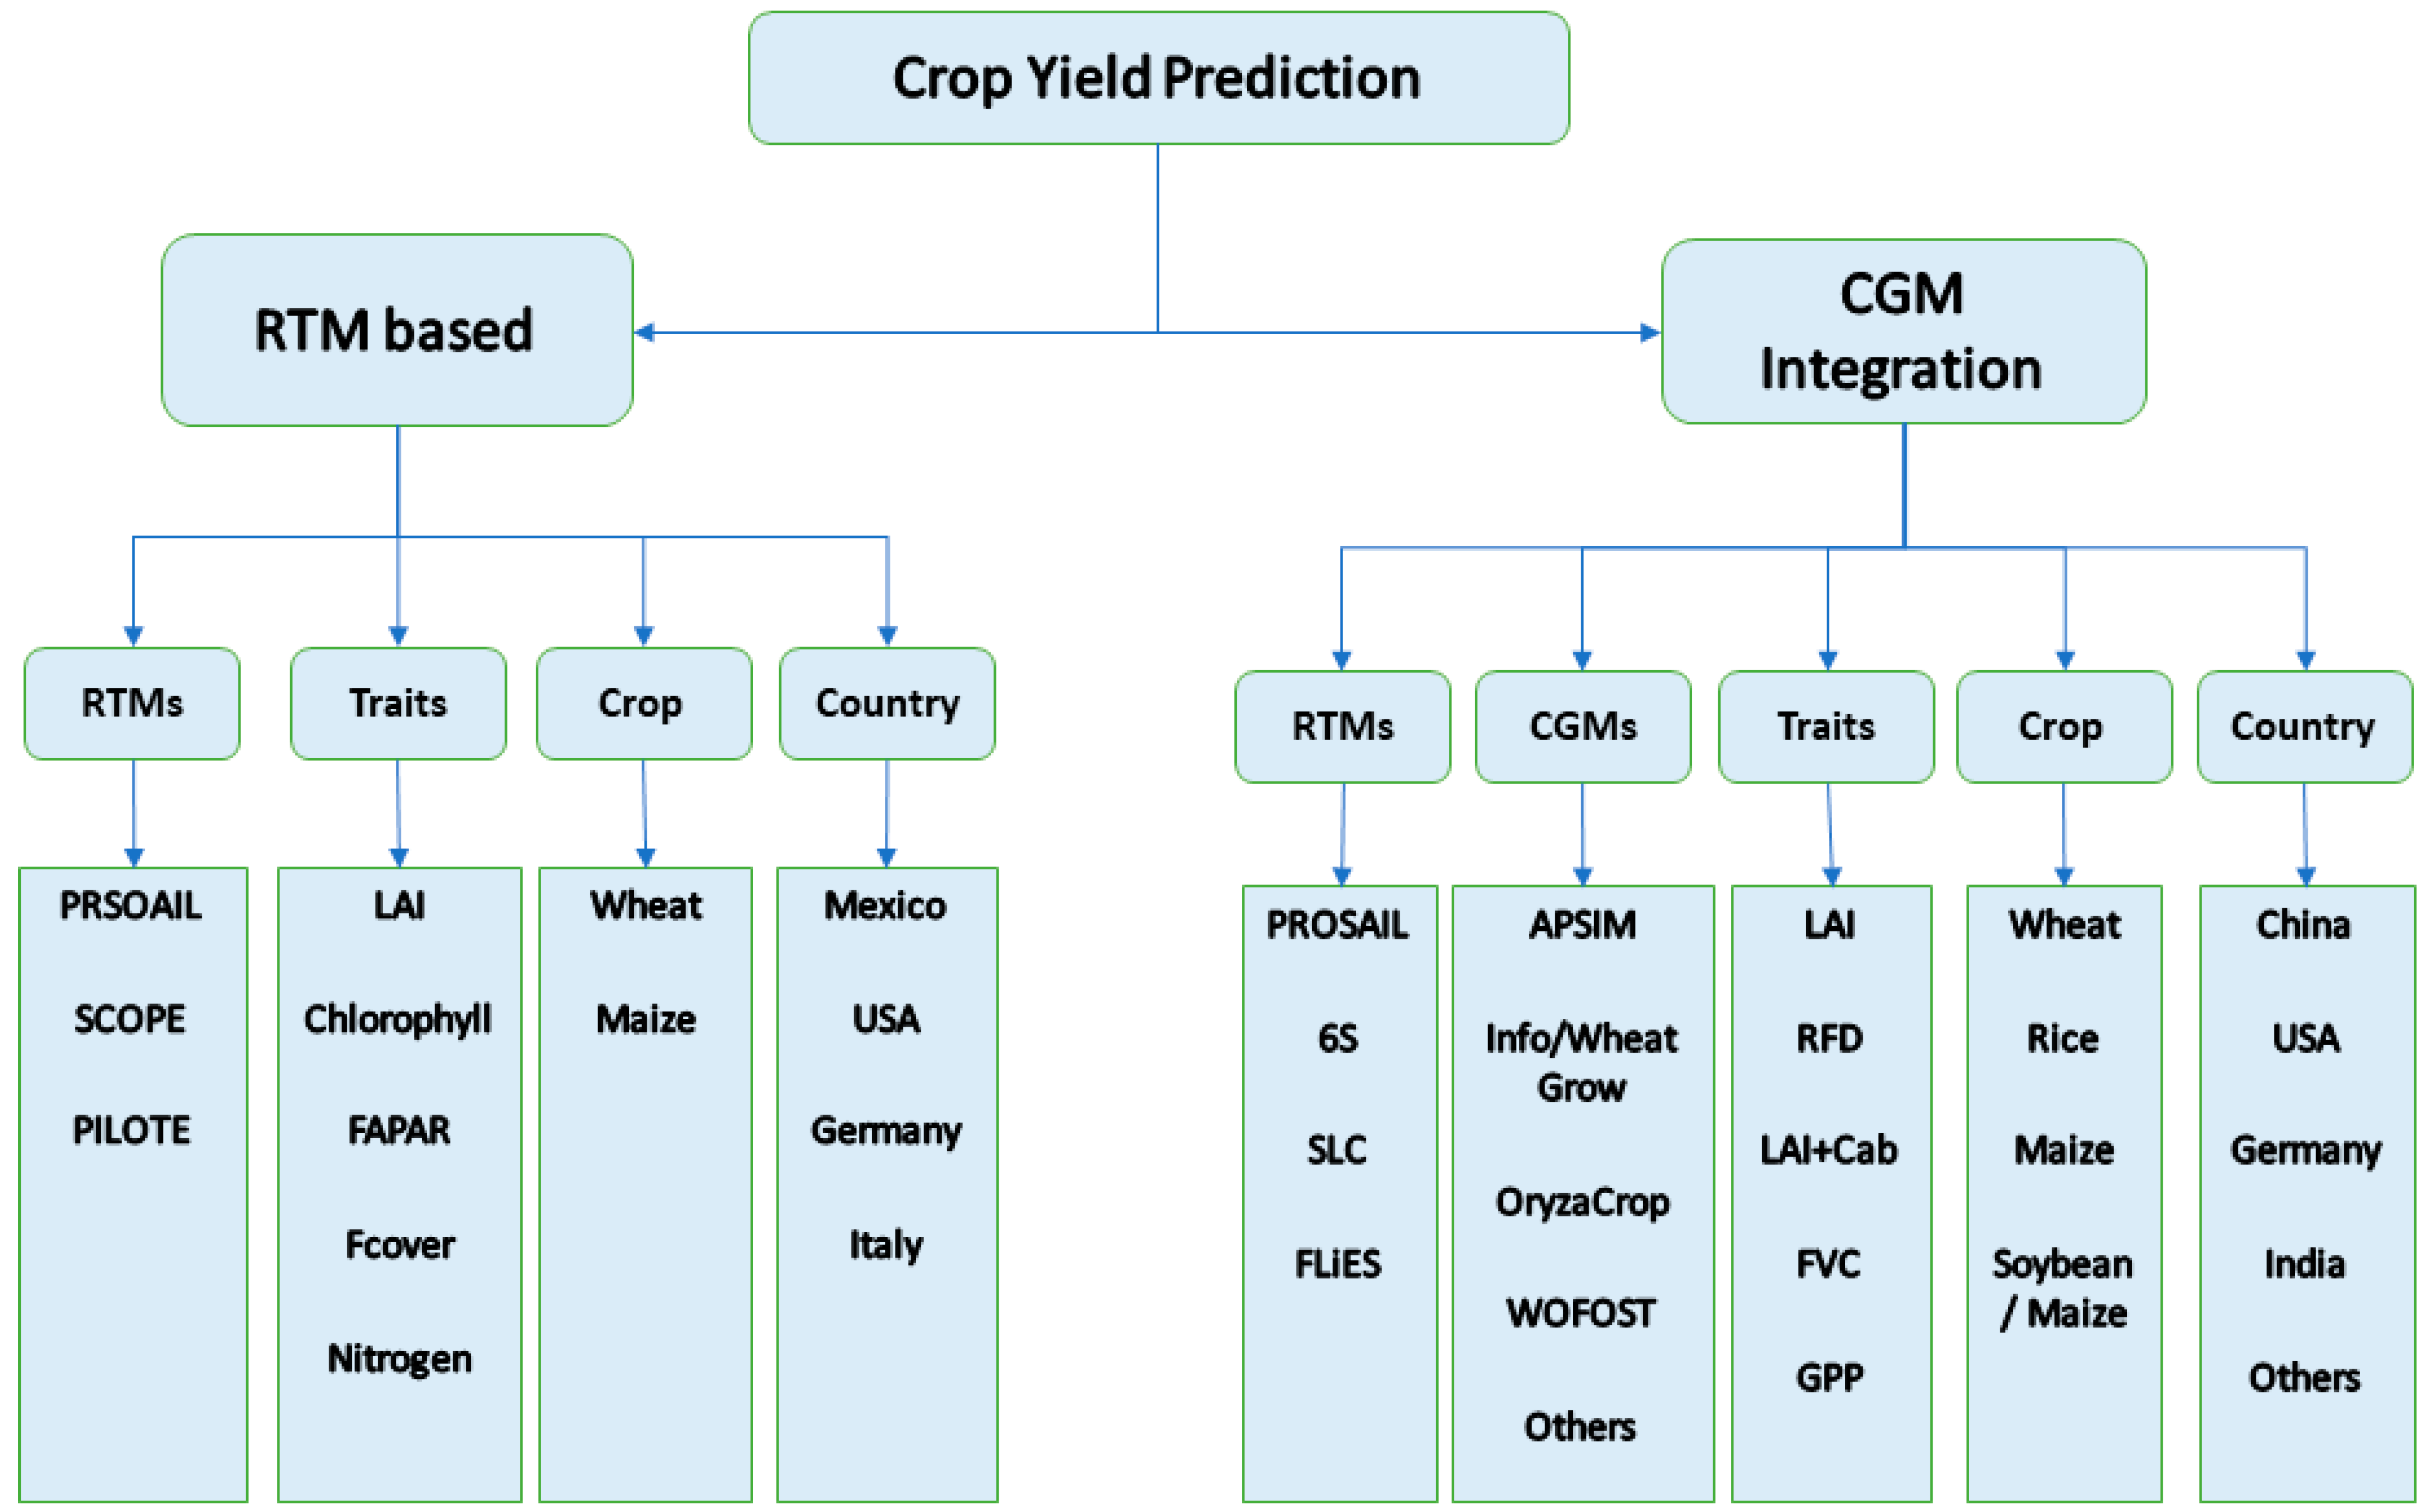
3.1. Crop Yield Prediction
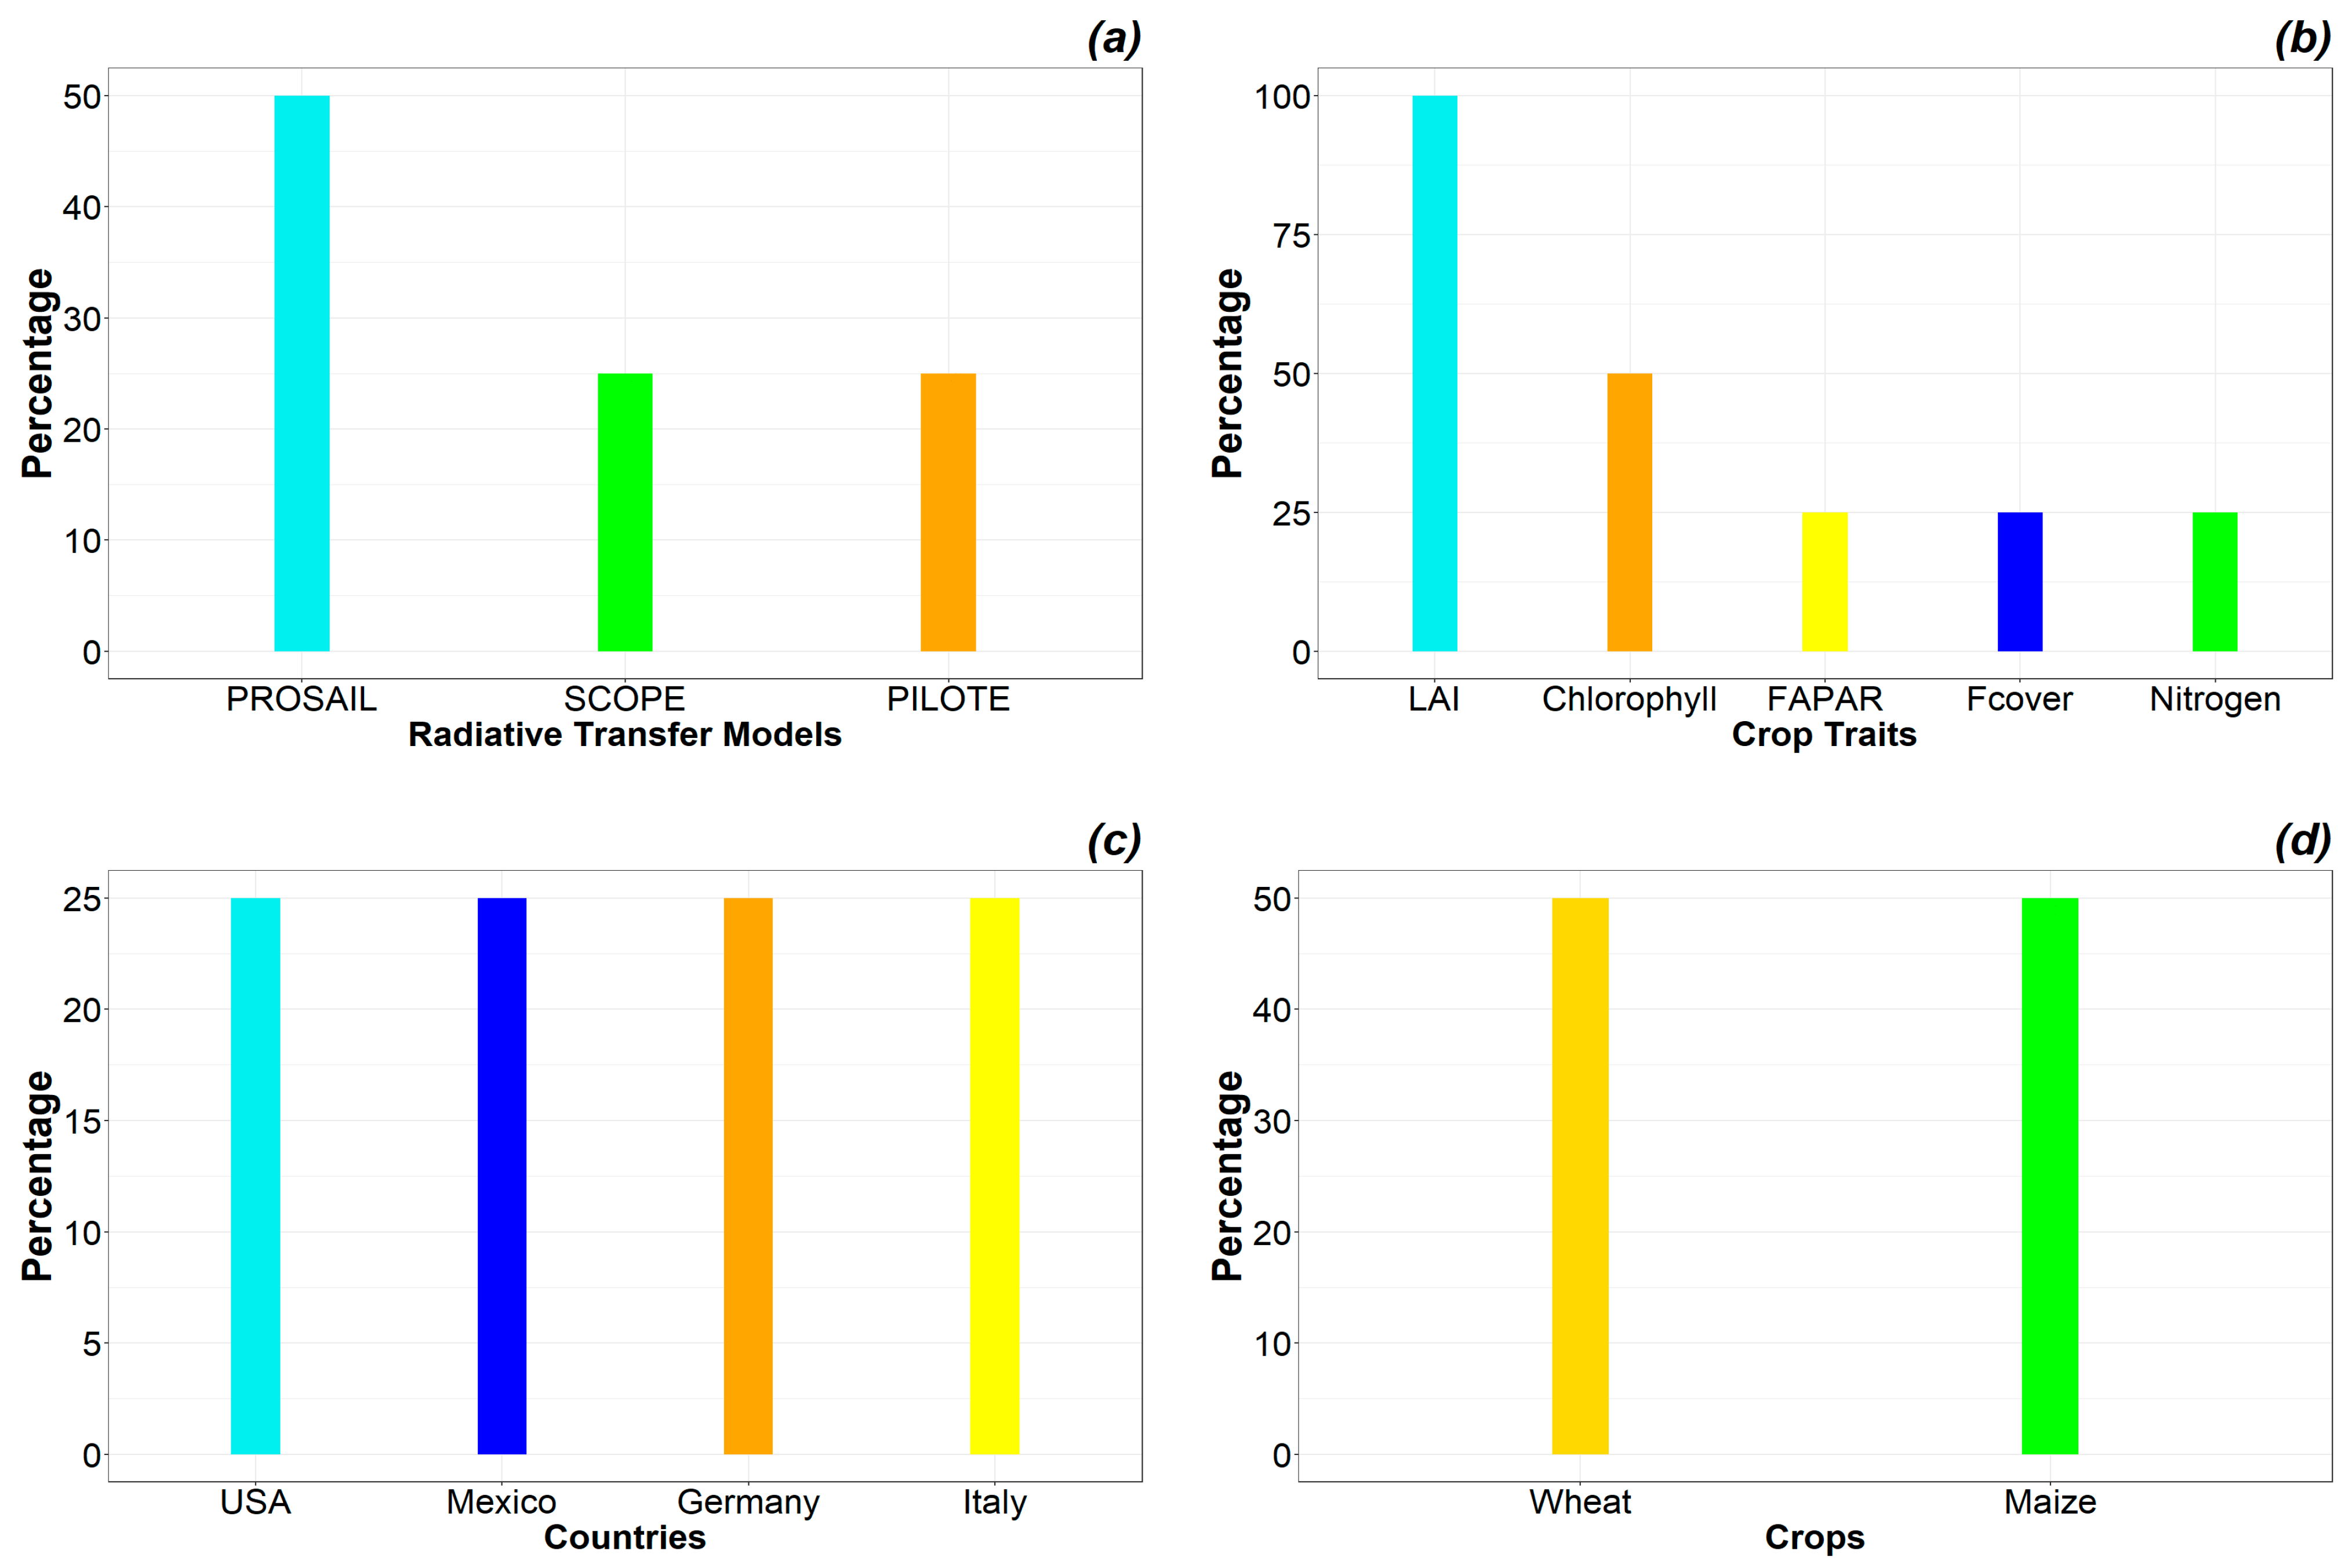
3.1.1. RTM Applications
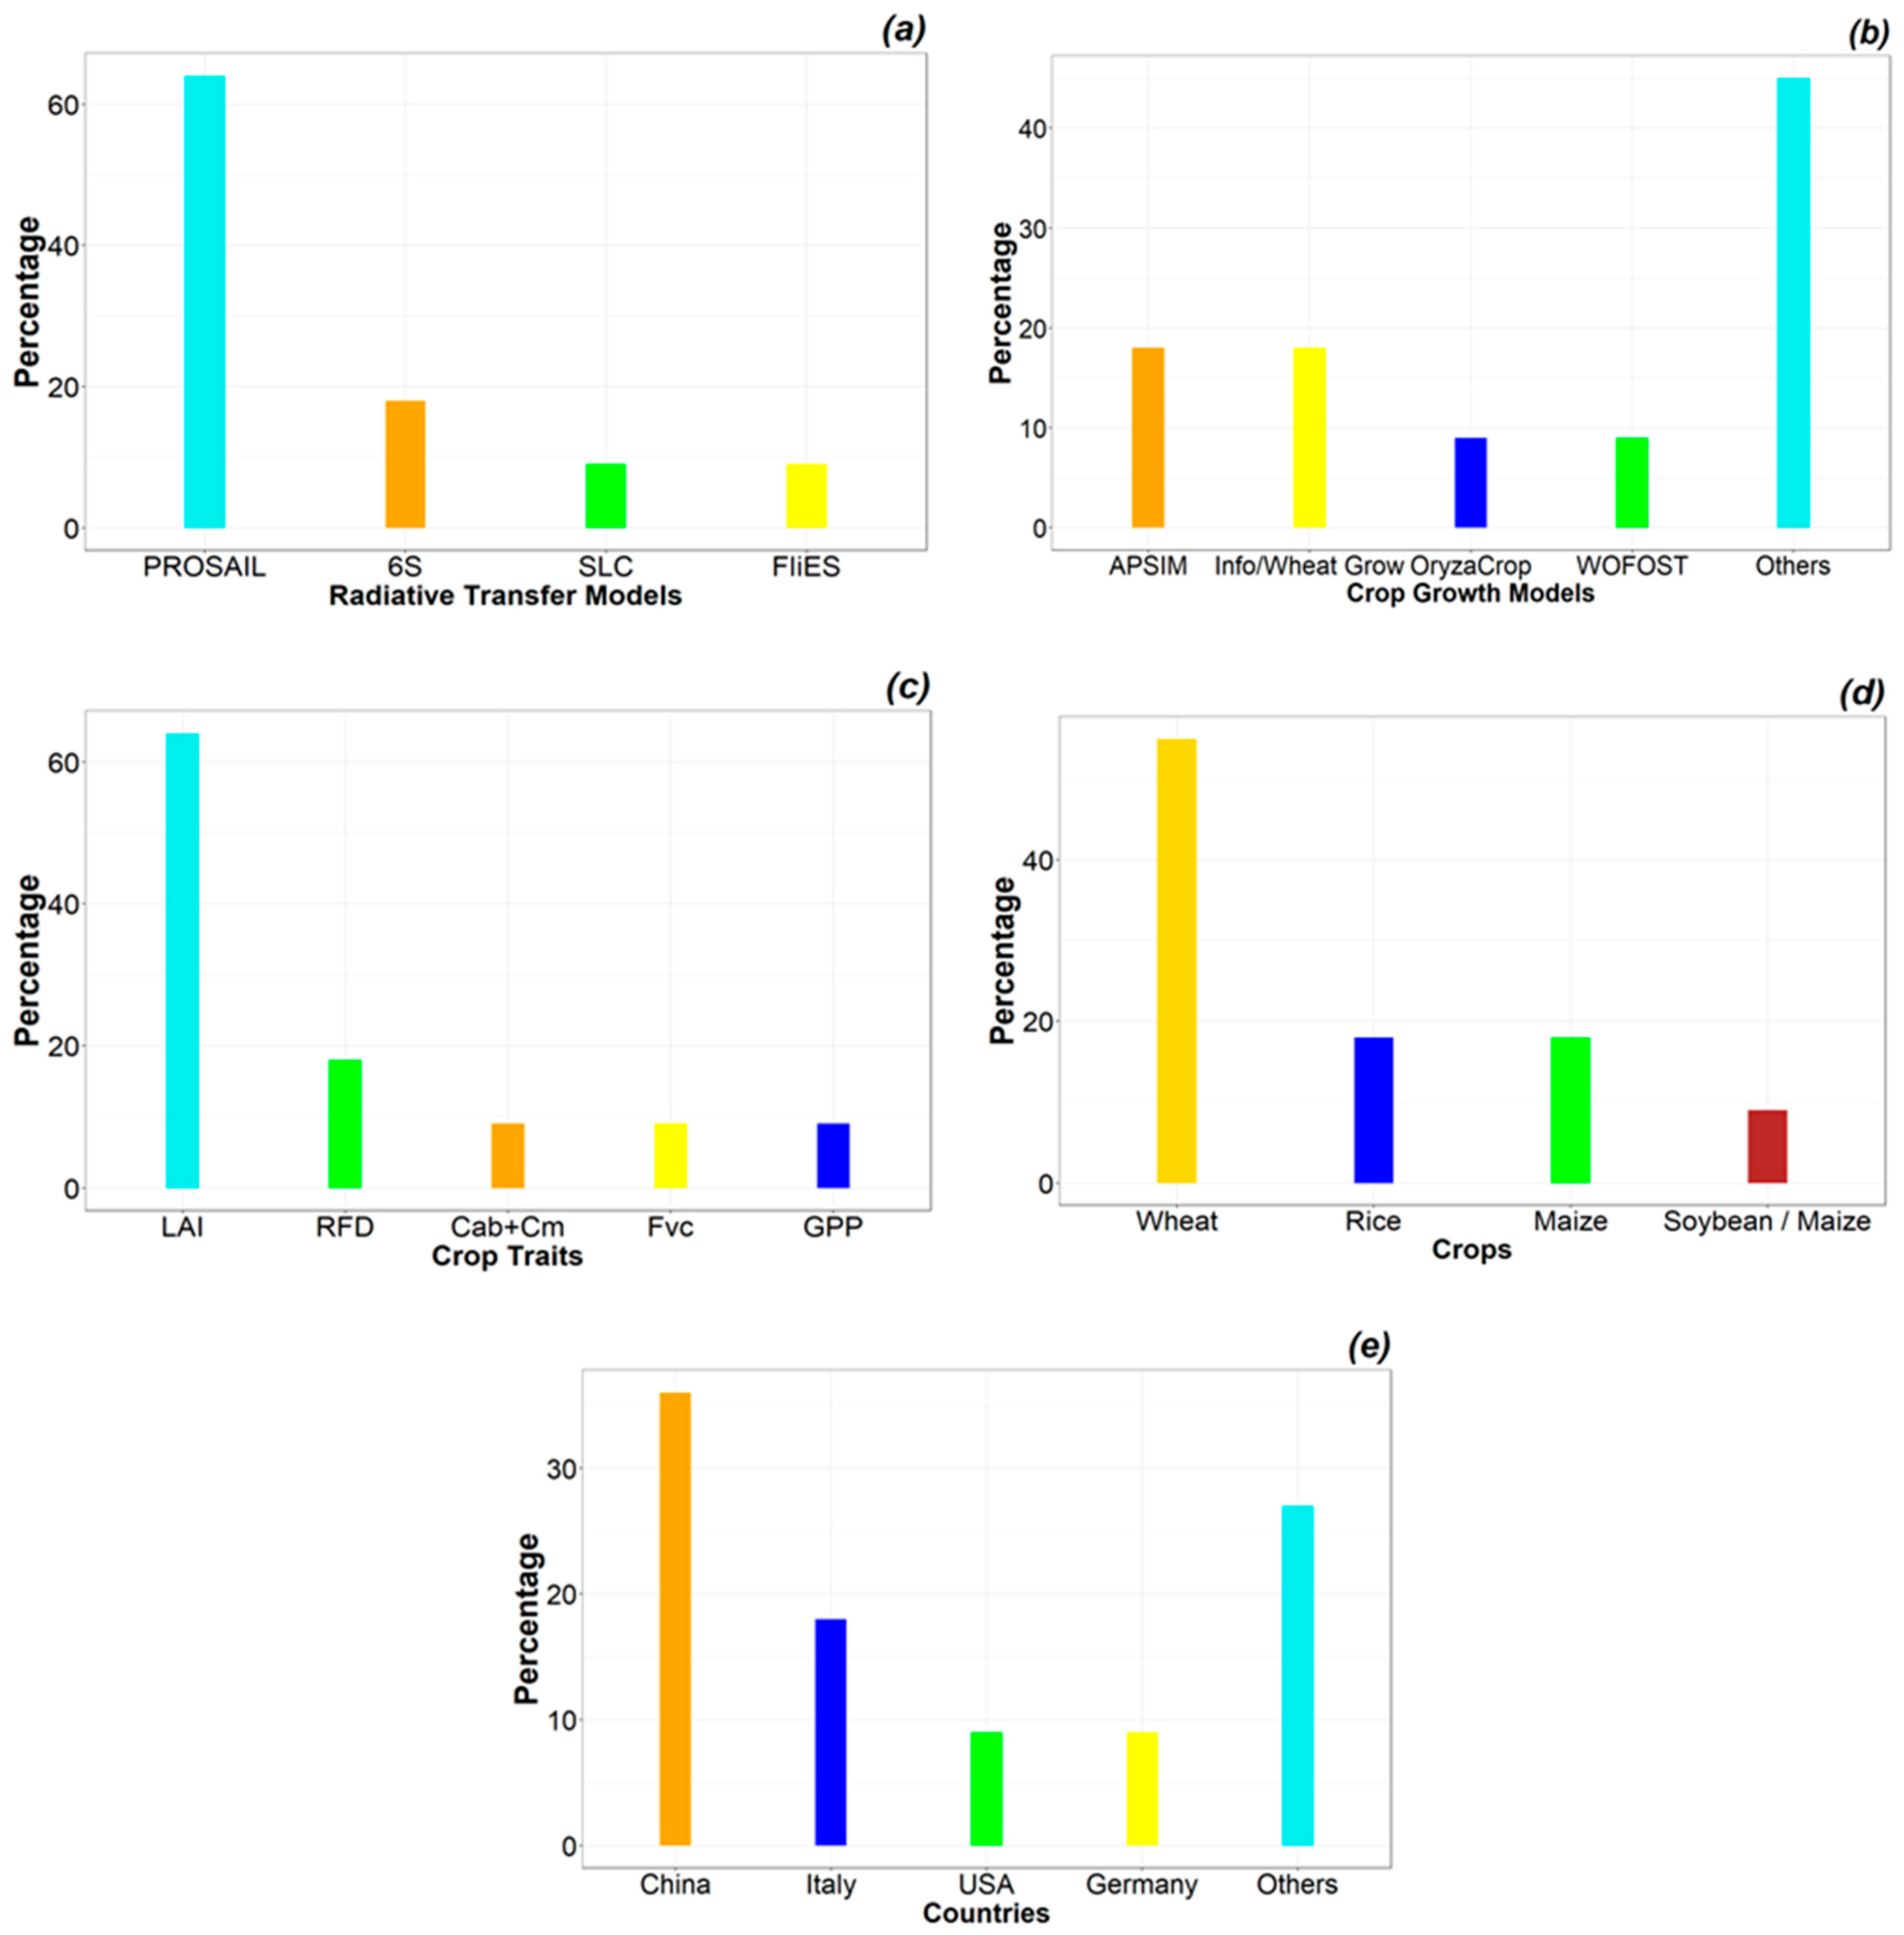
3.1.2. RTM Integration with CGMs
3.2. Crop Traits Retrieval
3.3. Accuracy Assessment Analytics
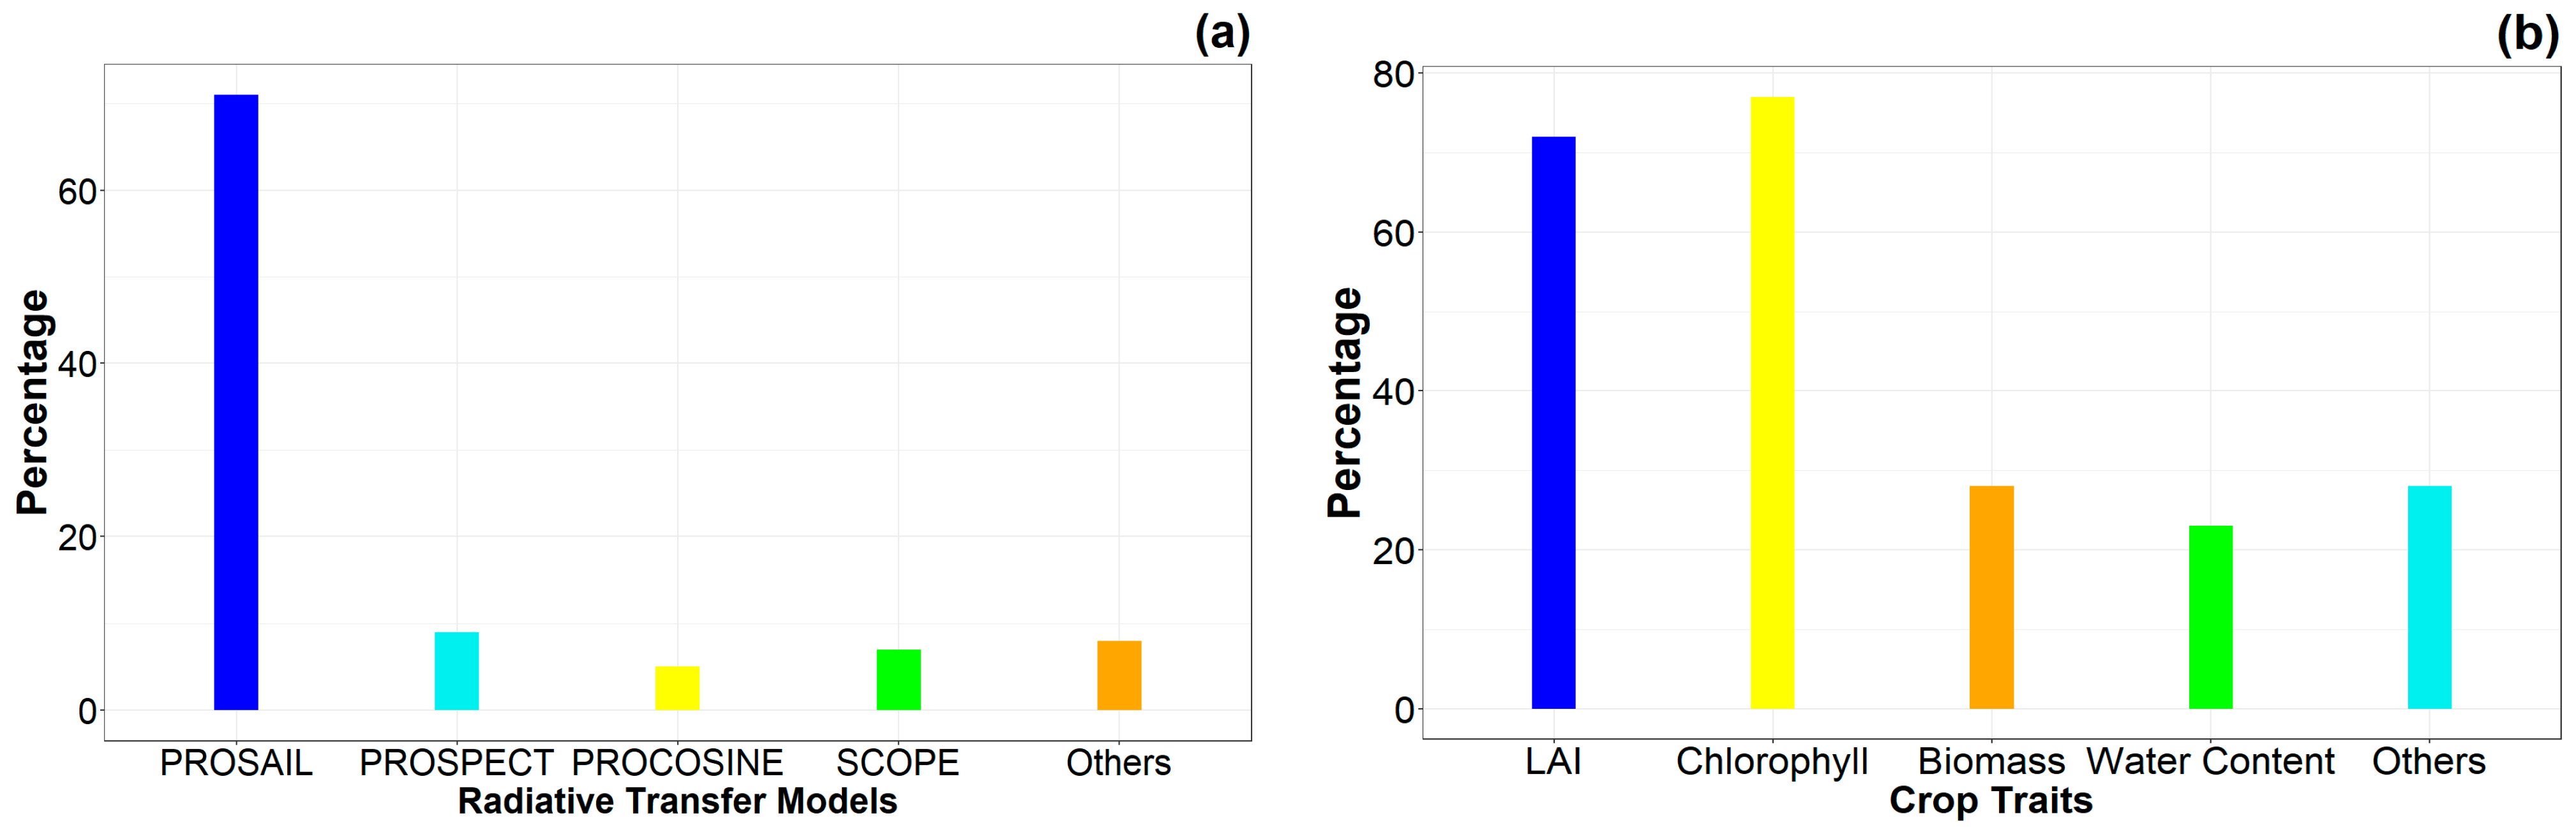
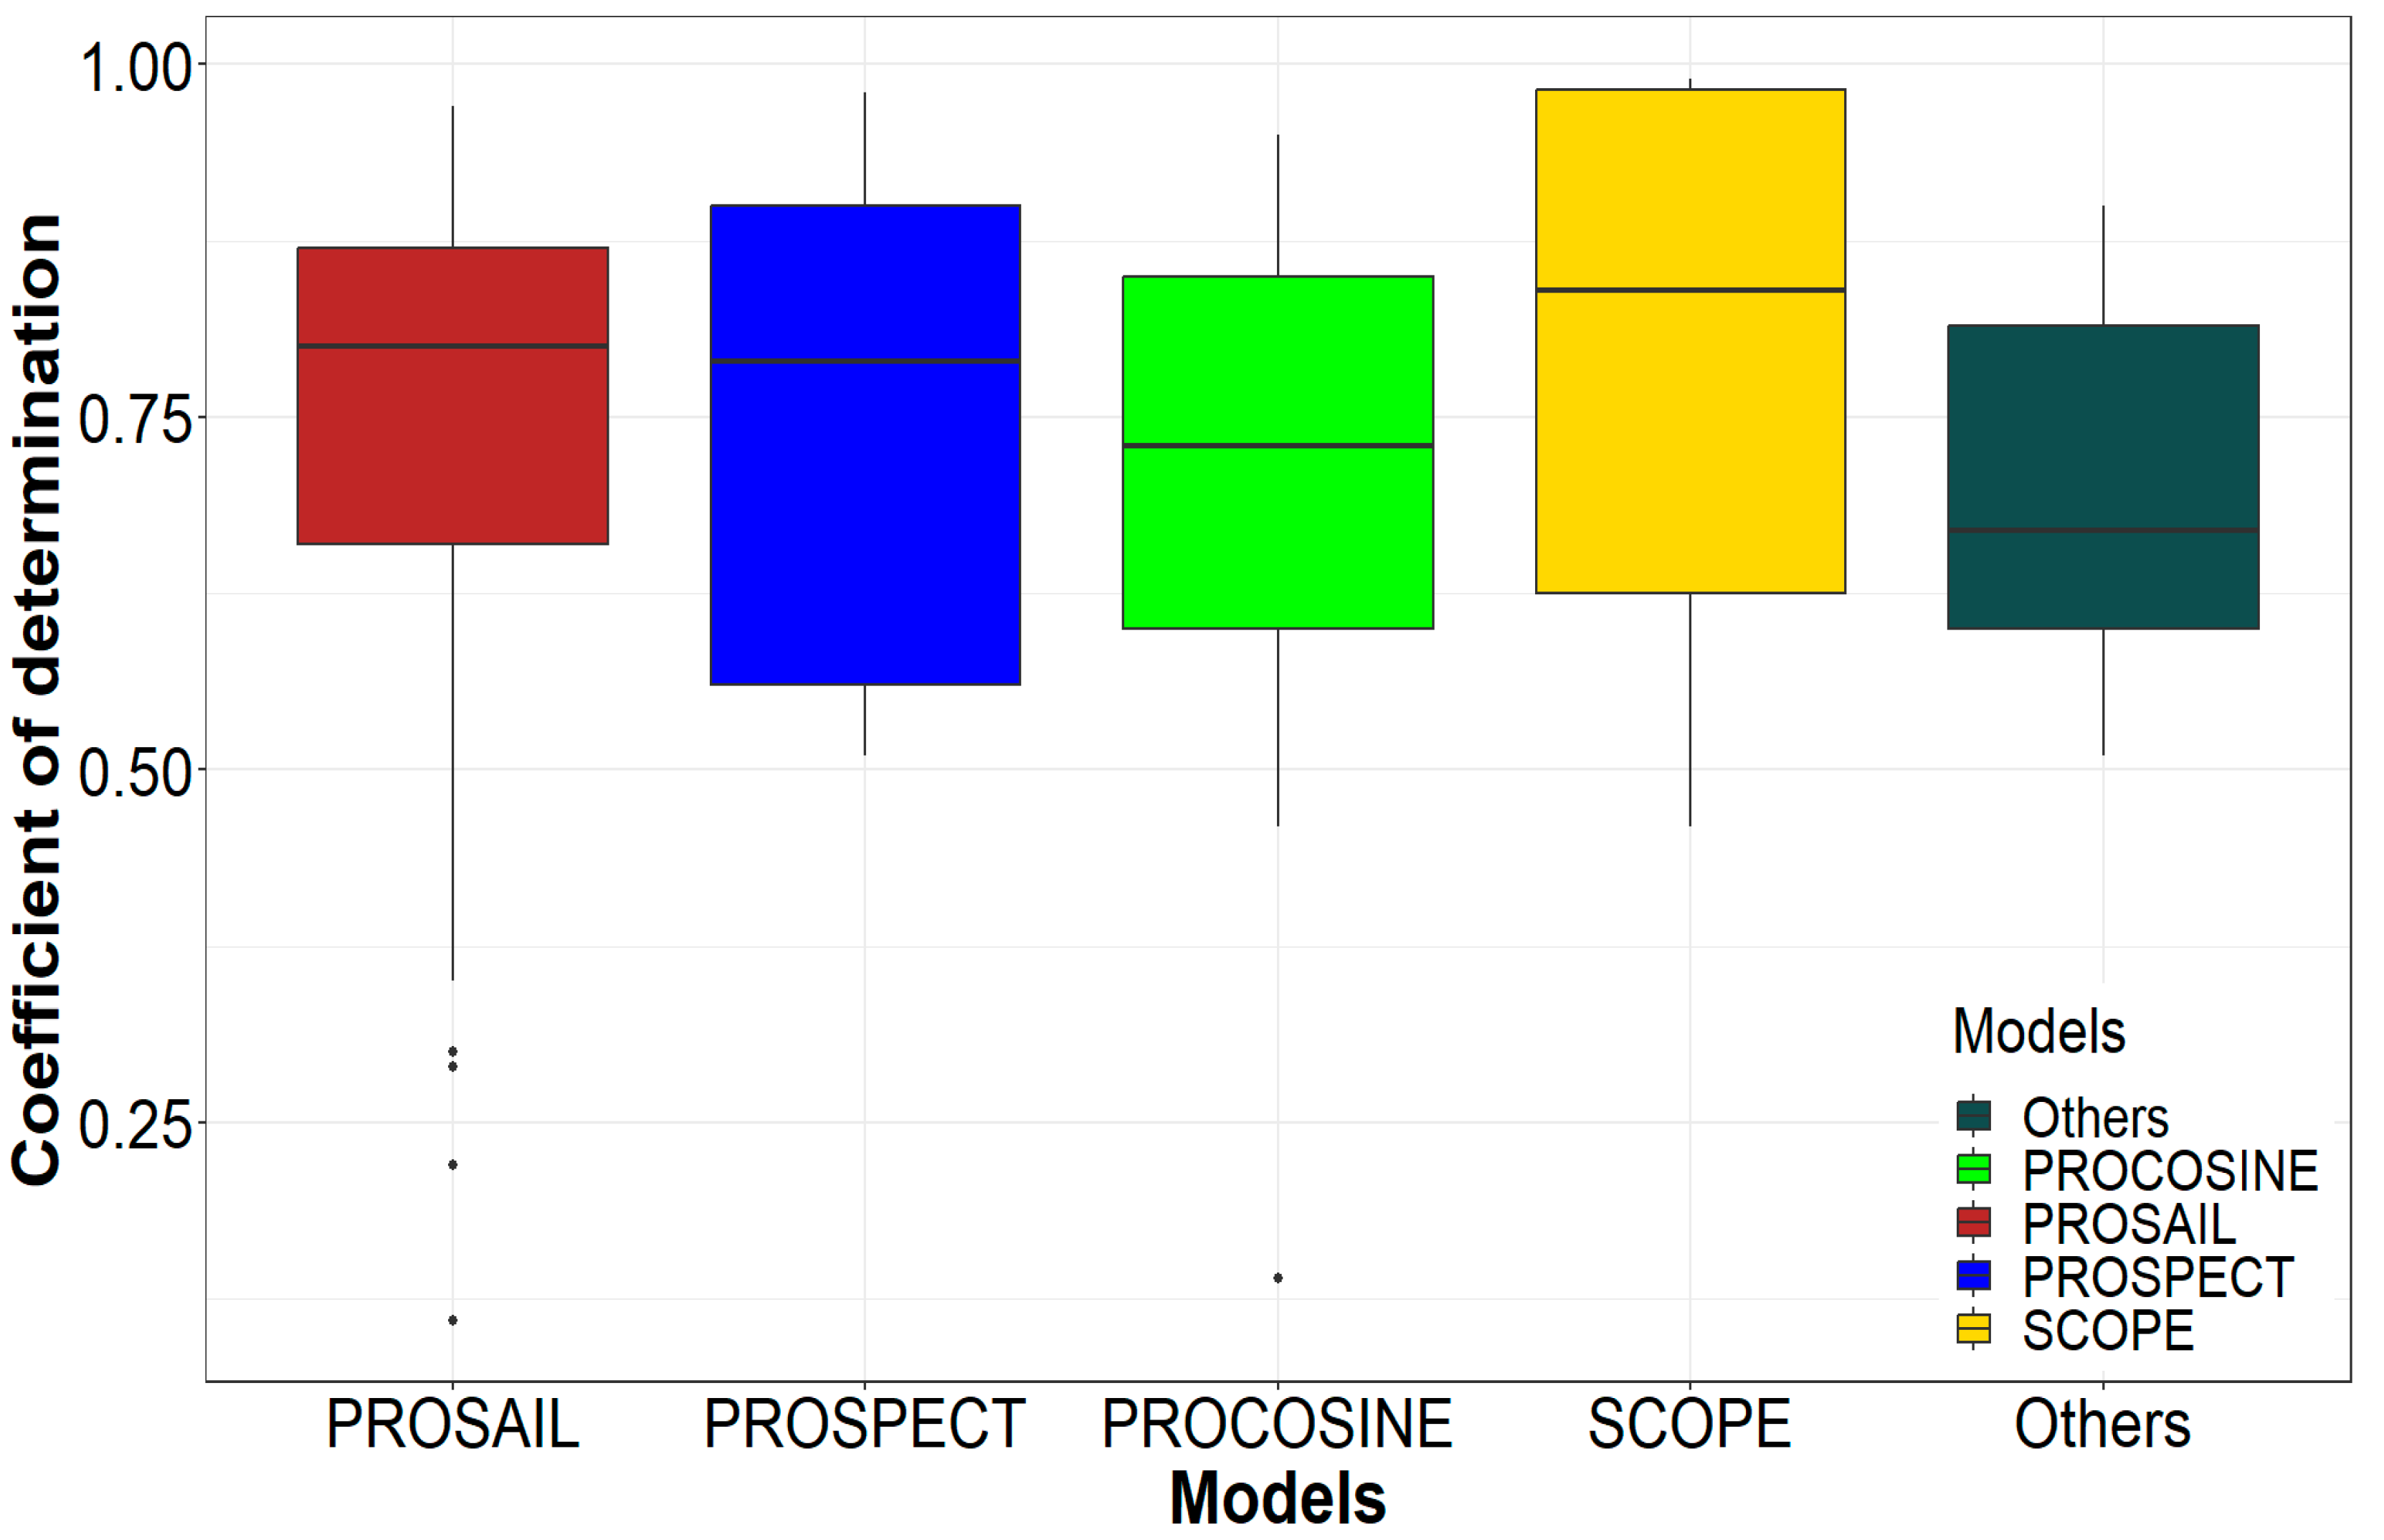
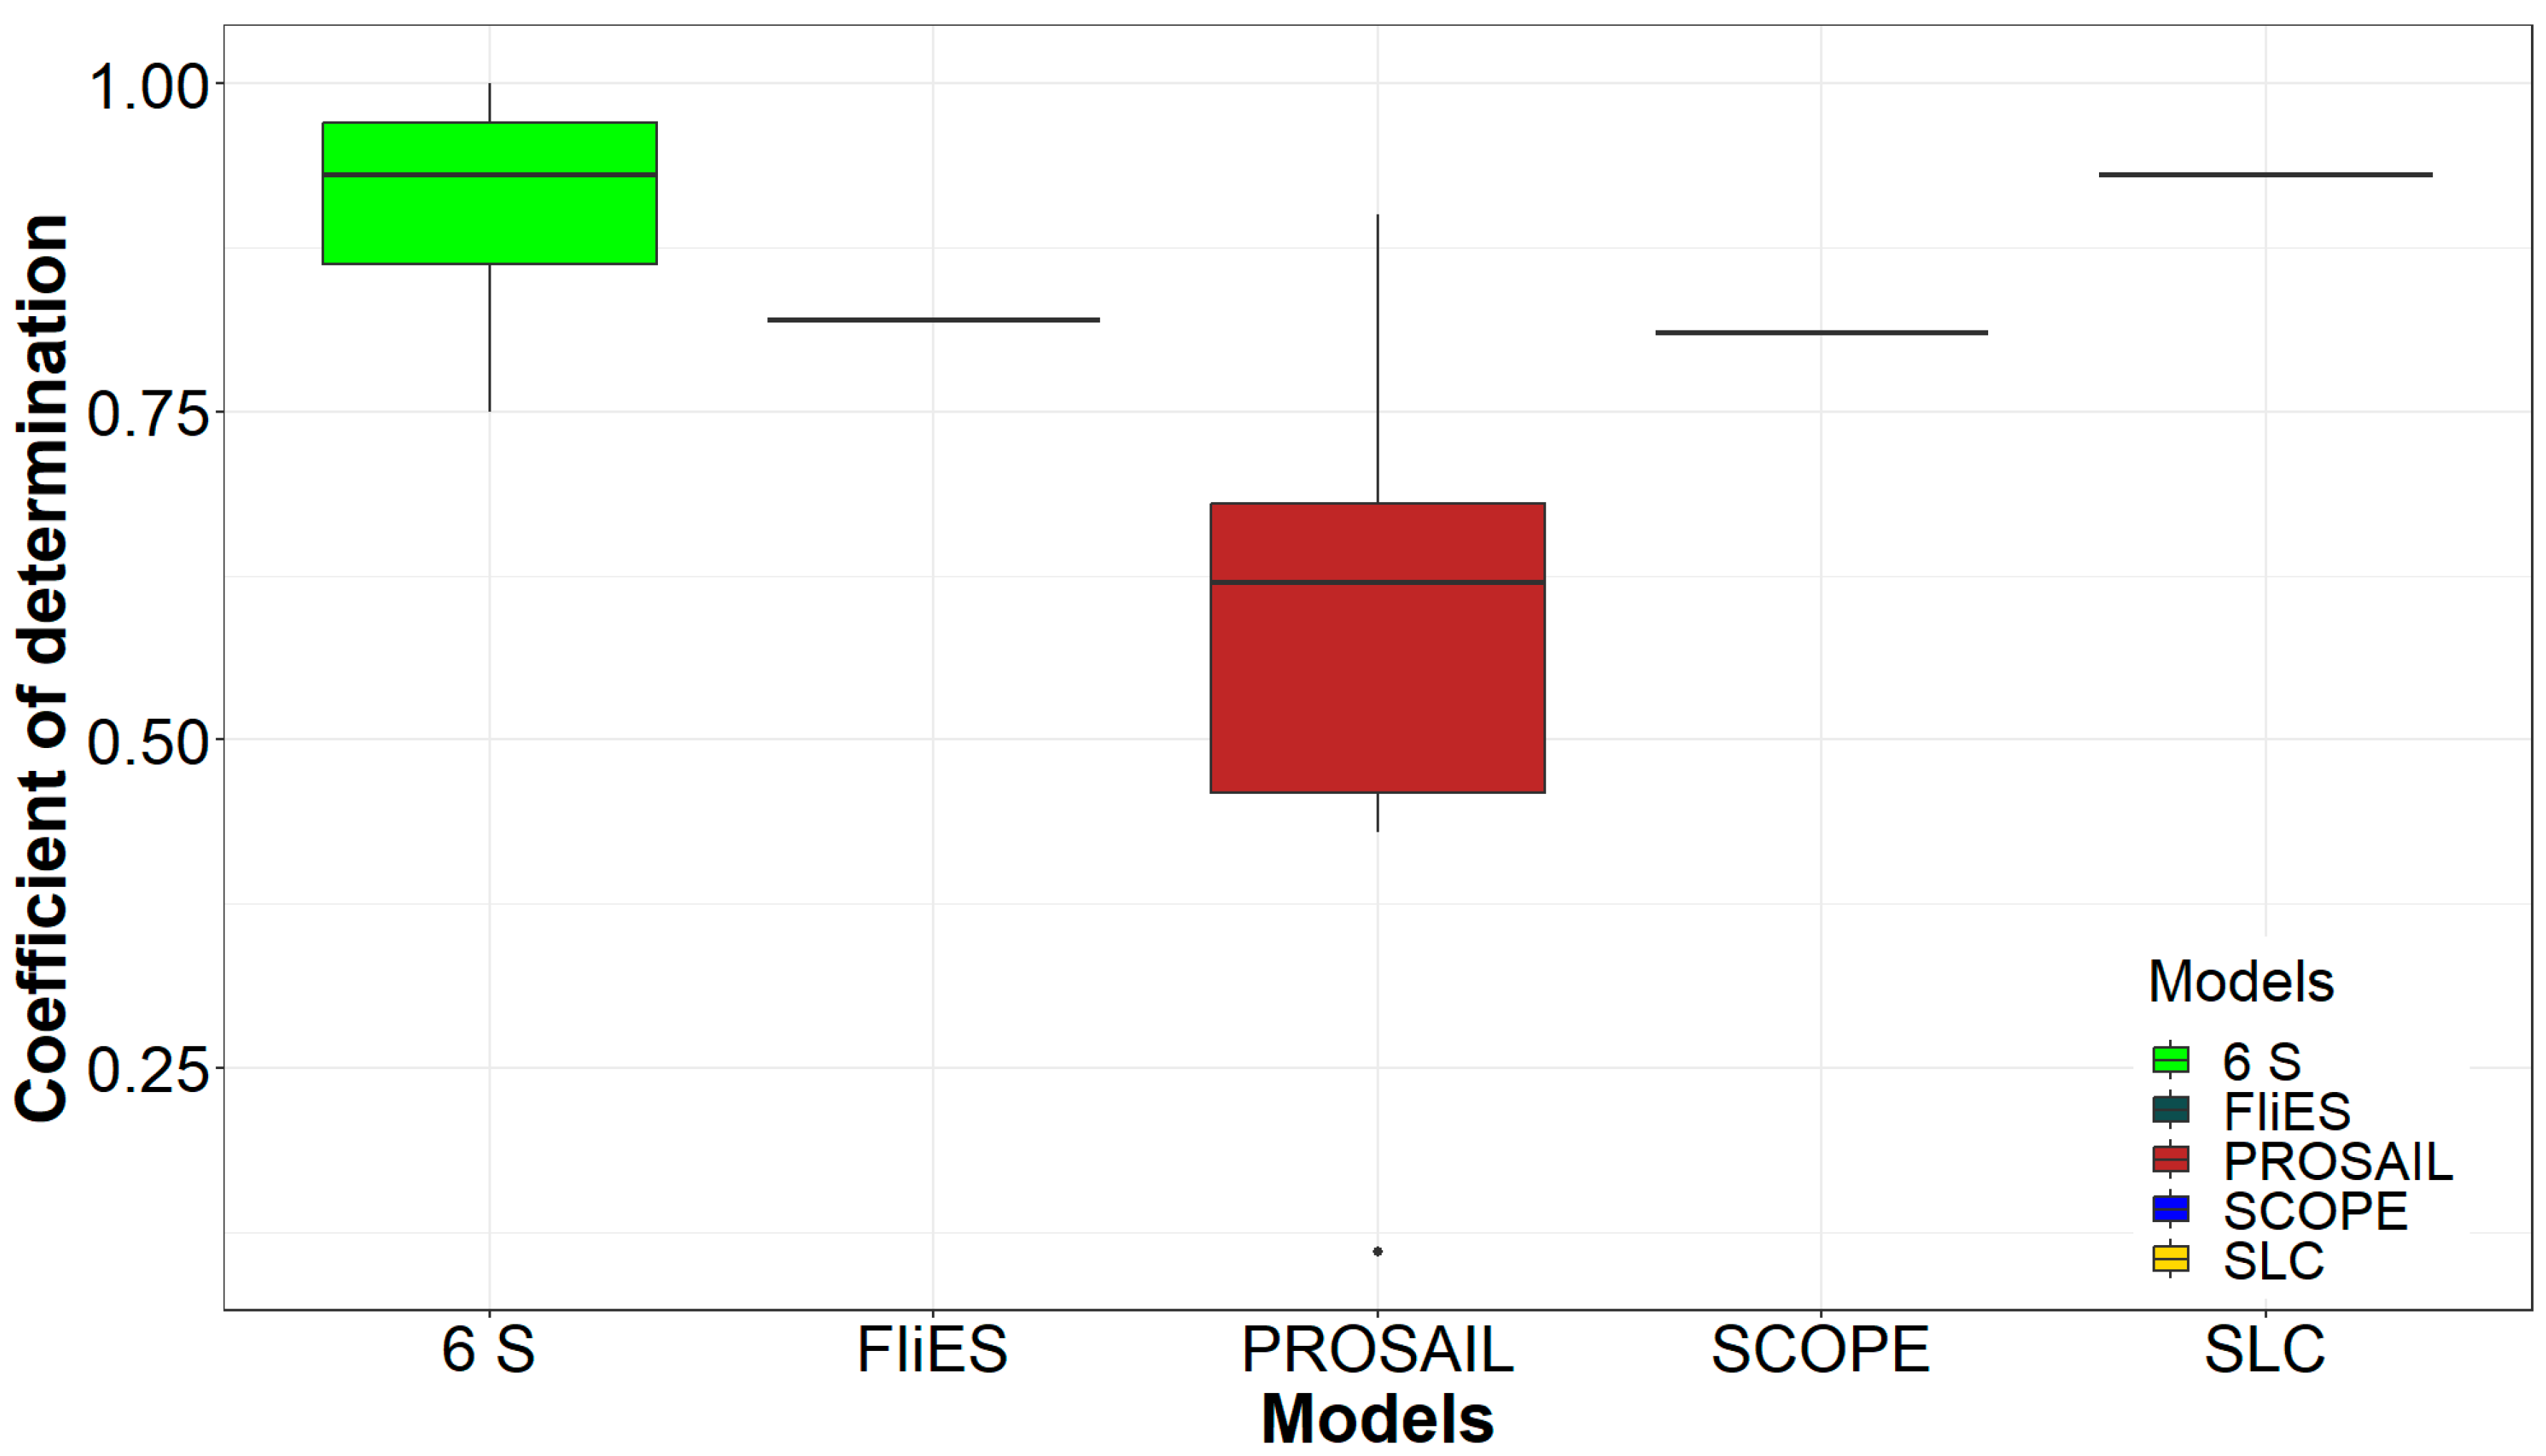
3.3.1. Radiative Transfer Models Used for CYP
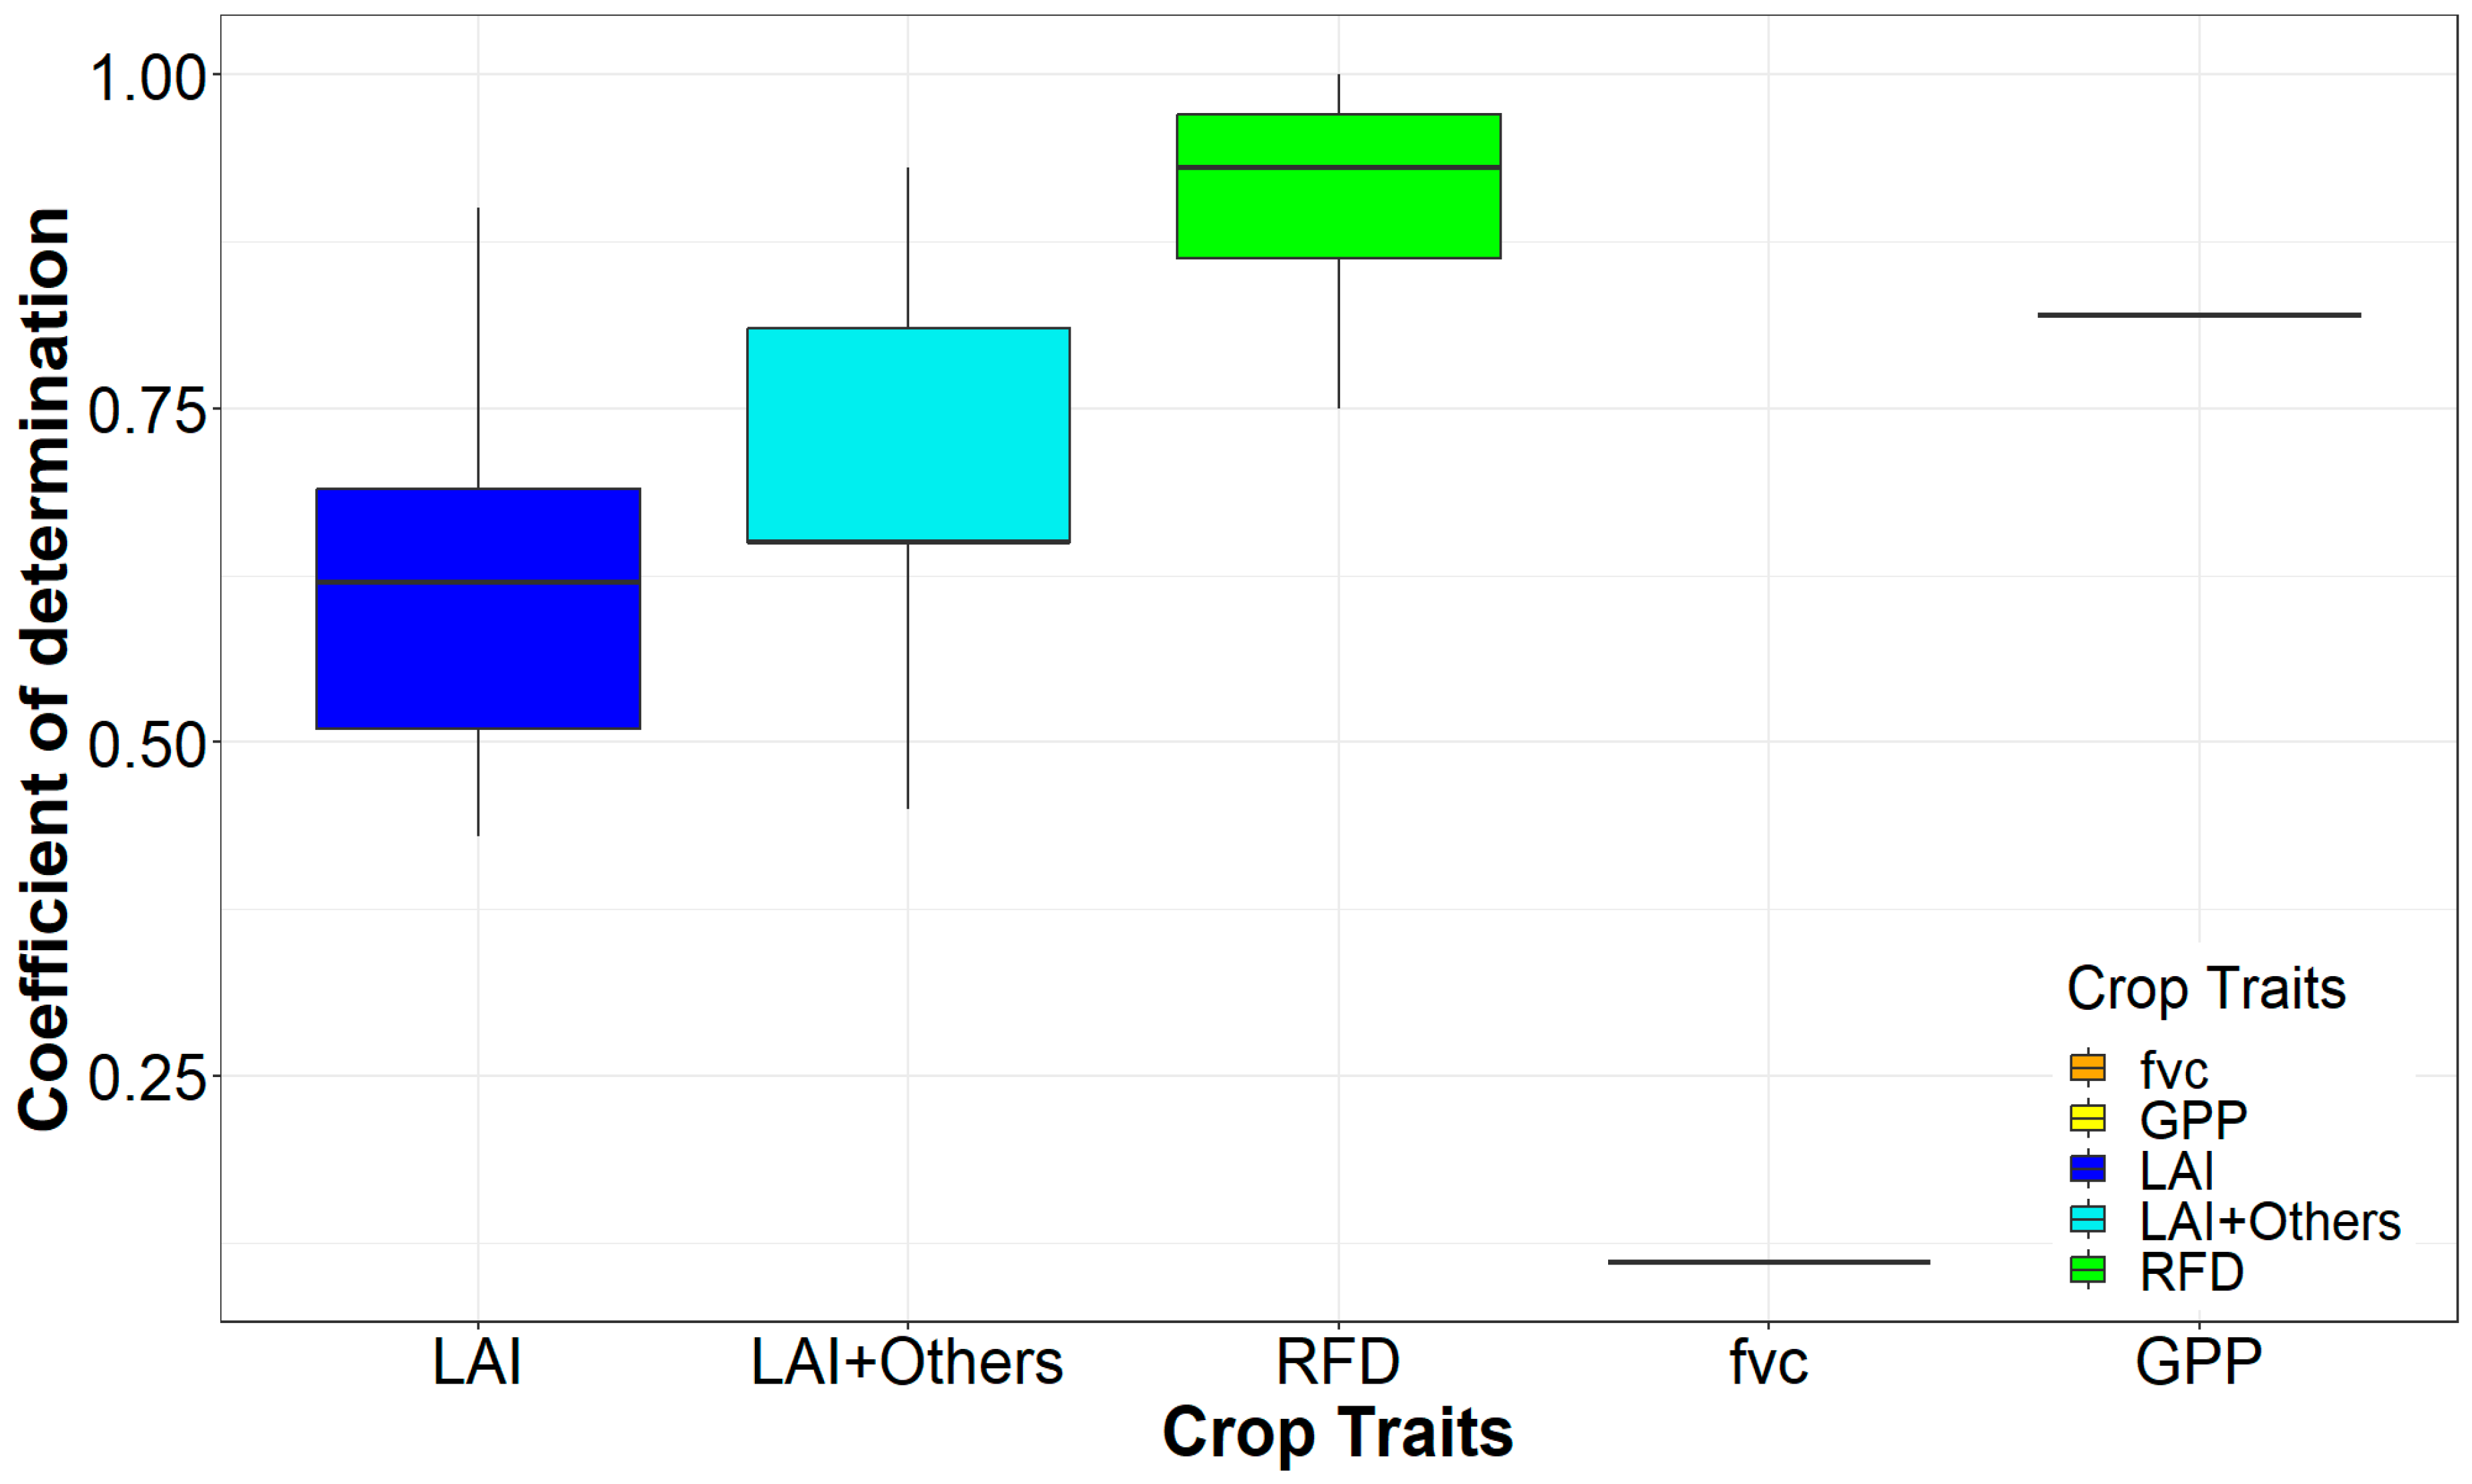
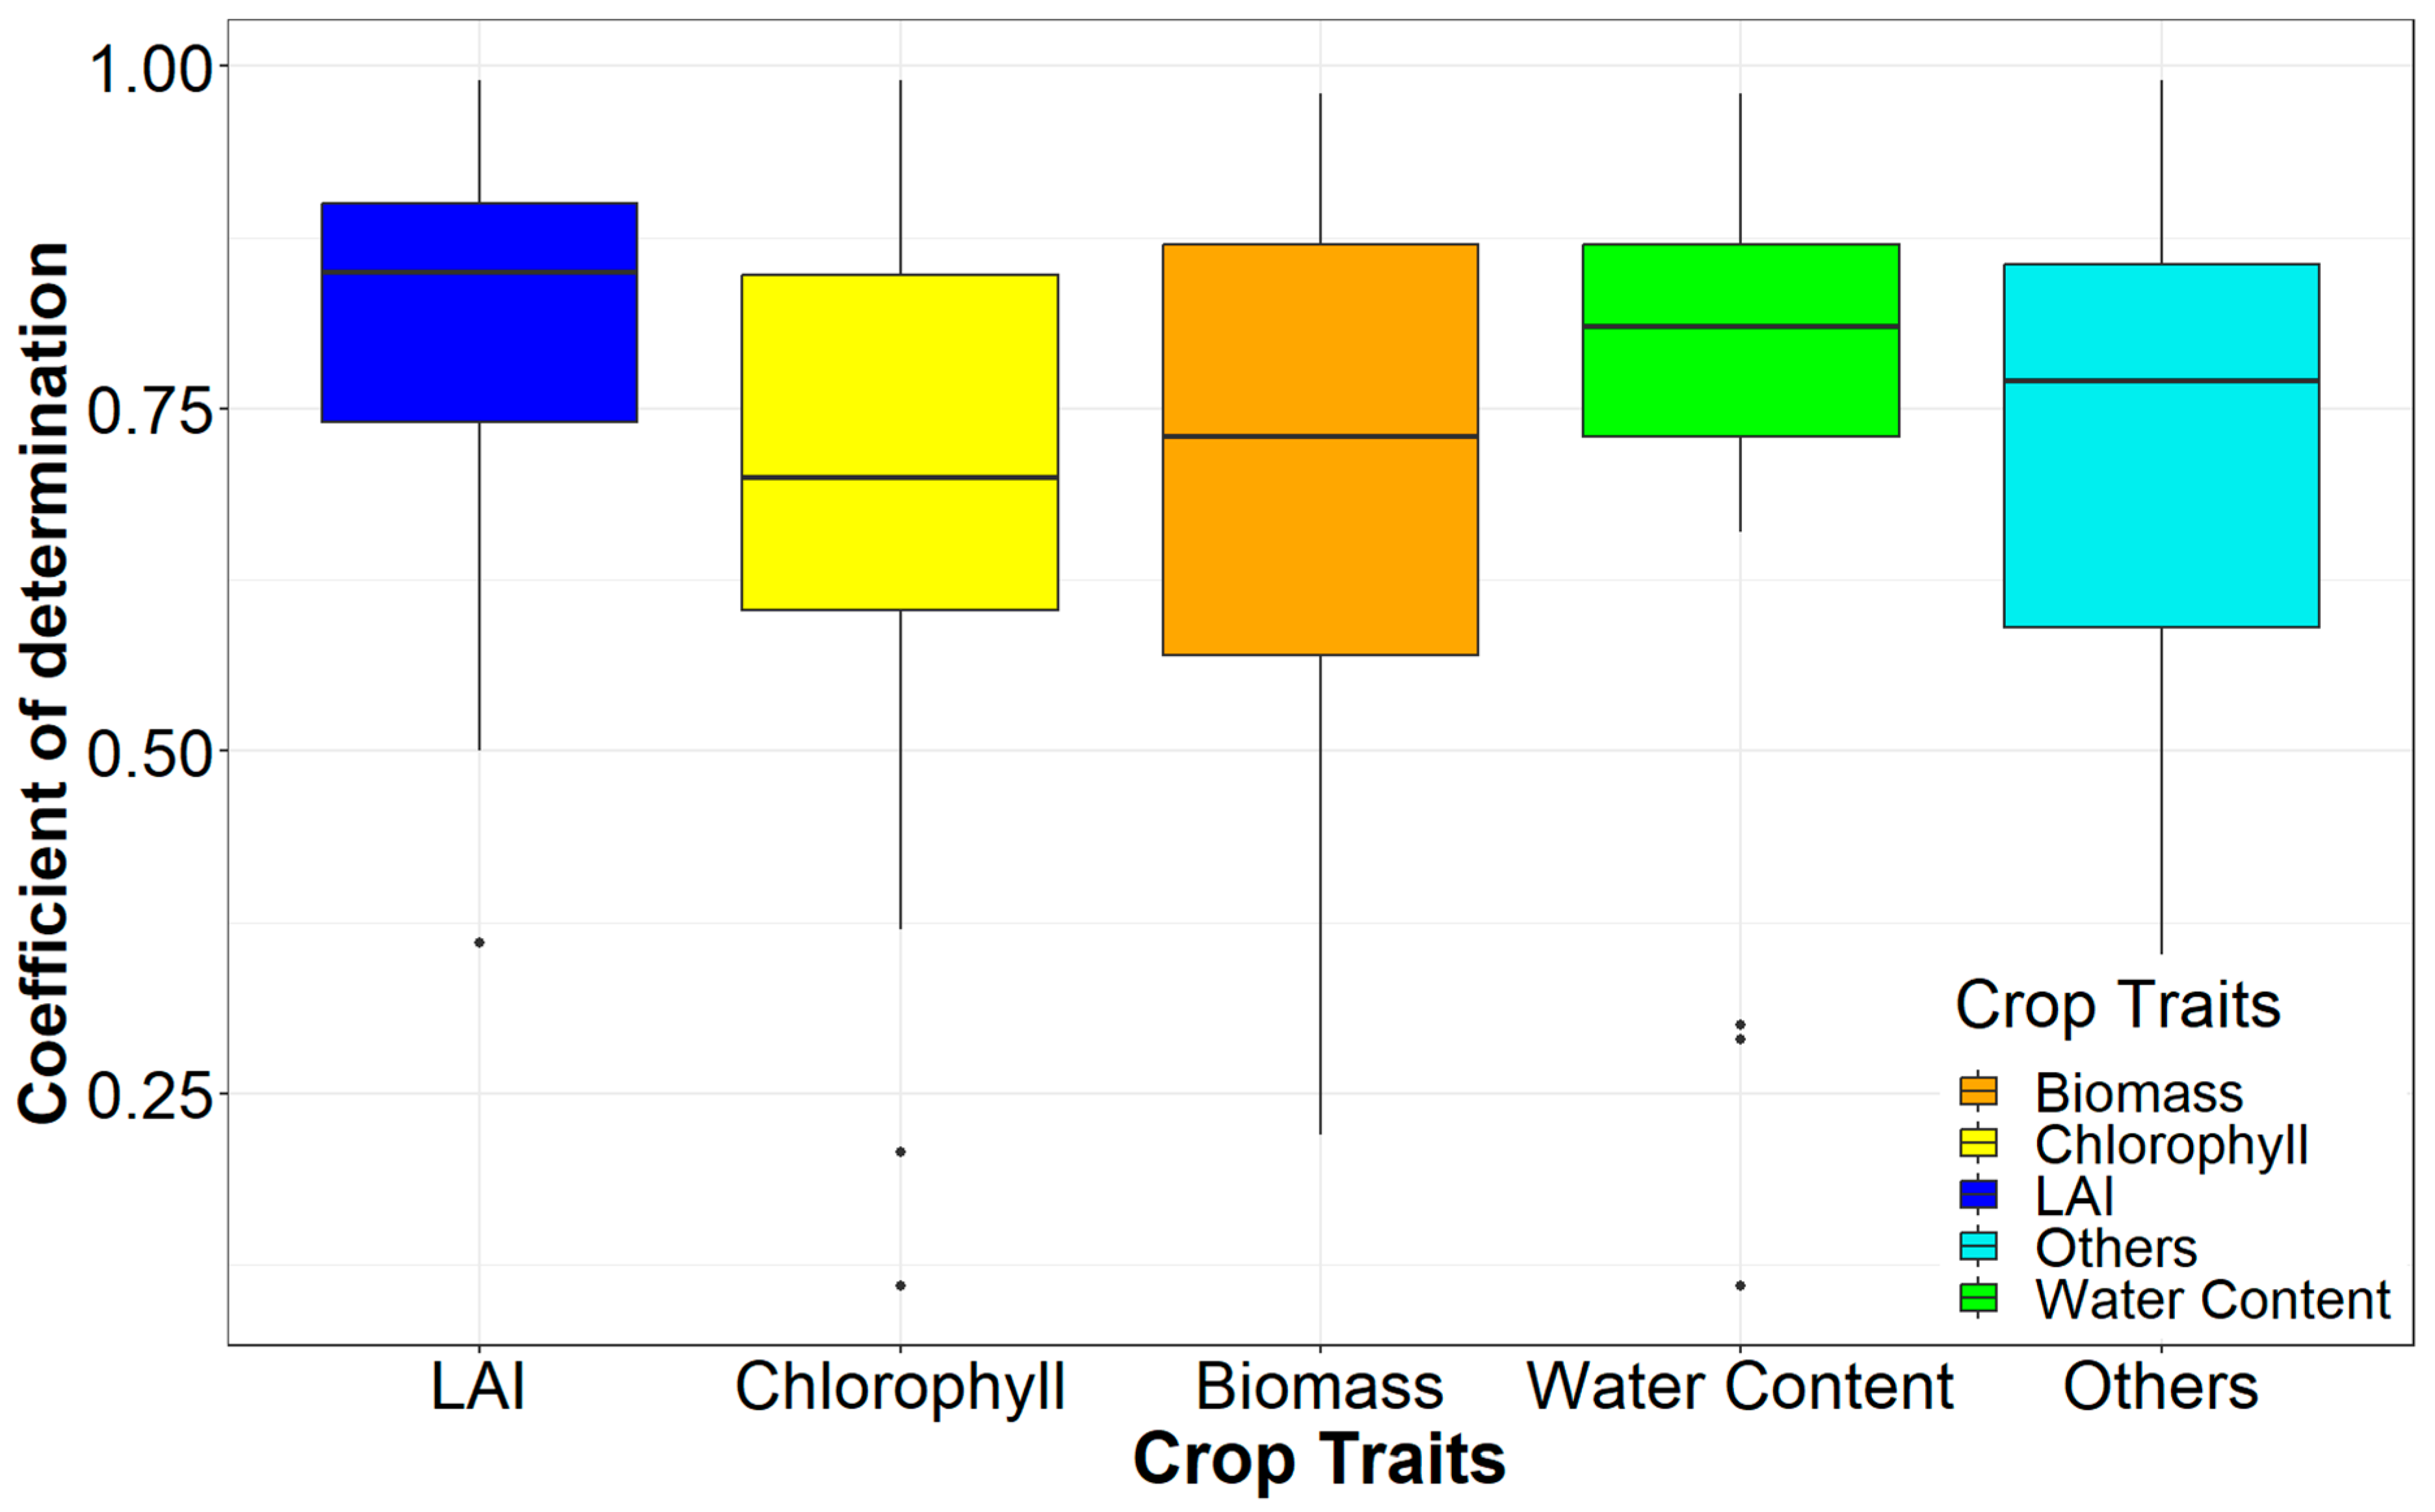
3.3.2. Crop Traits Used for CYP
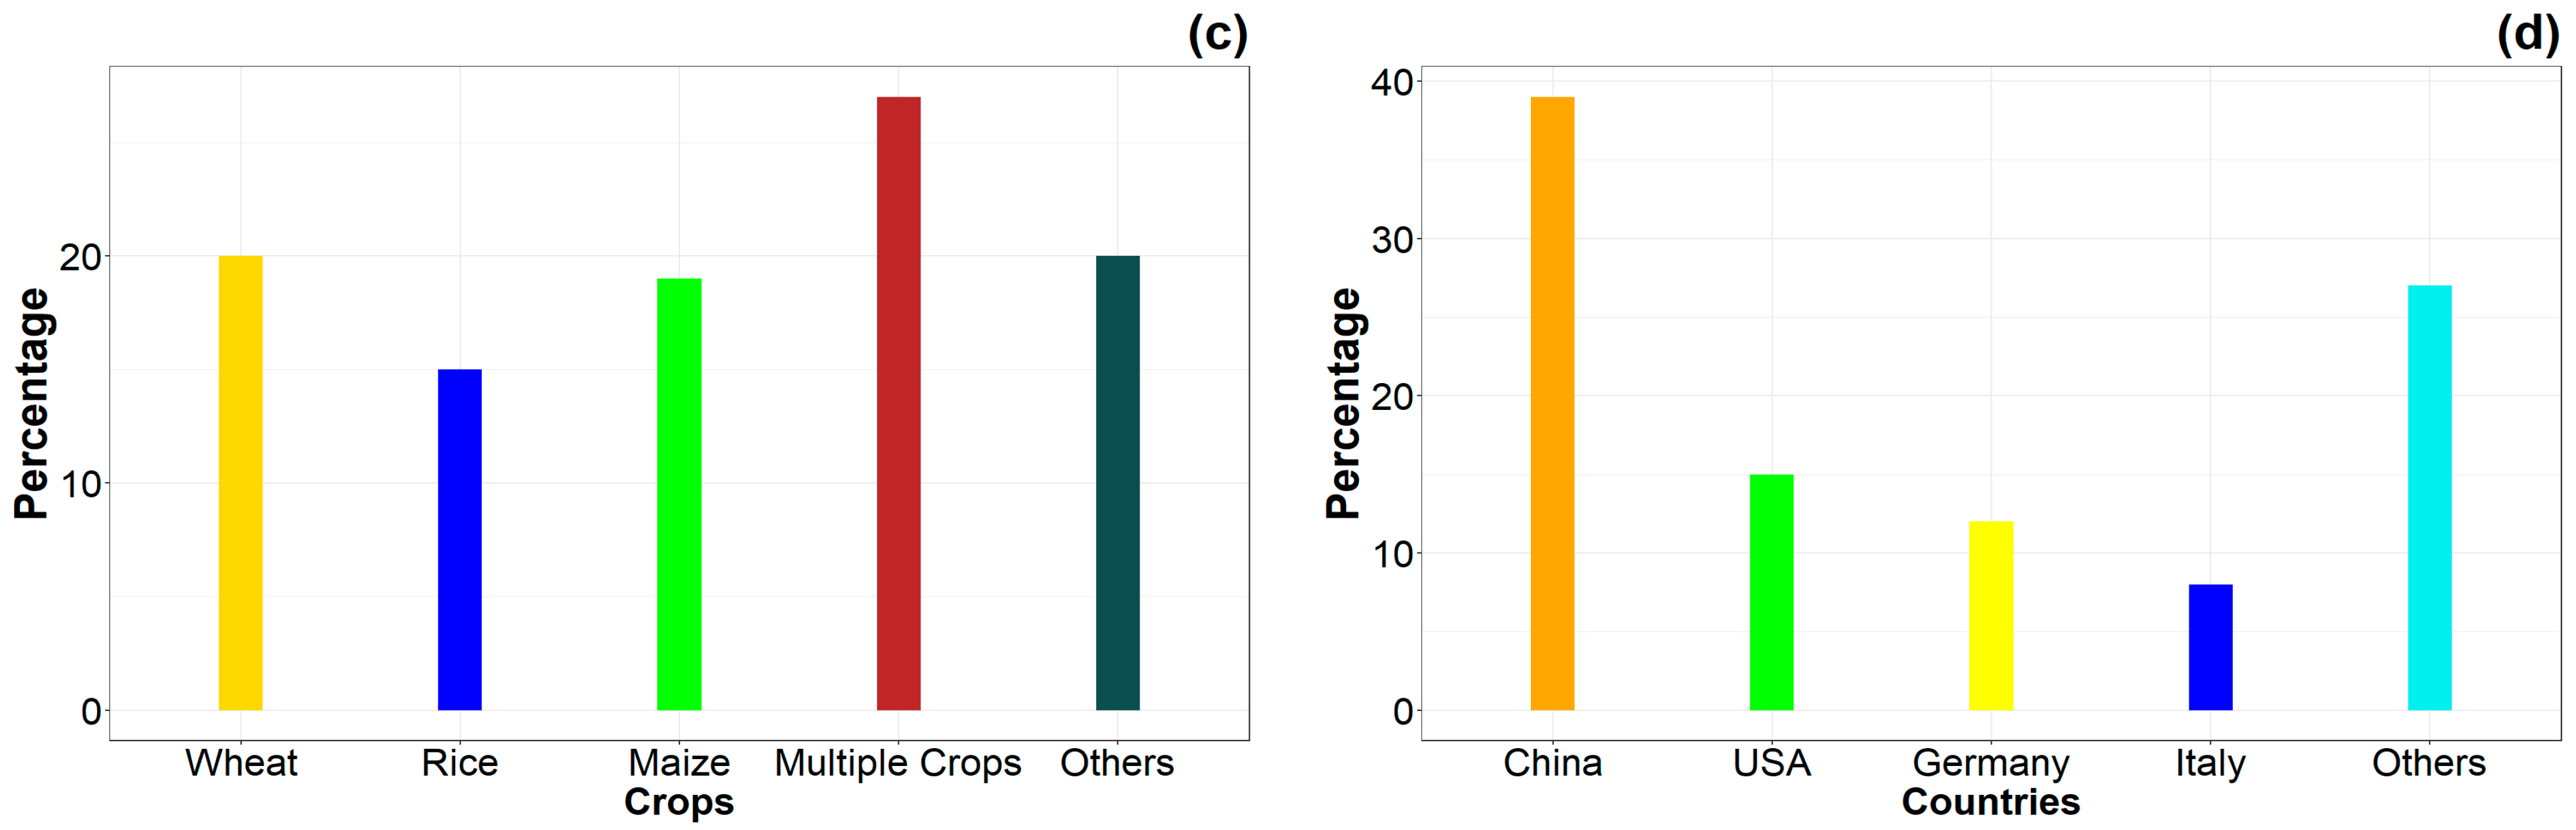
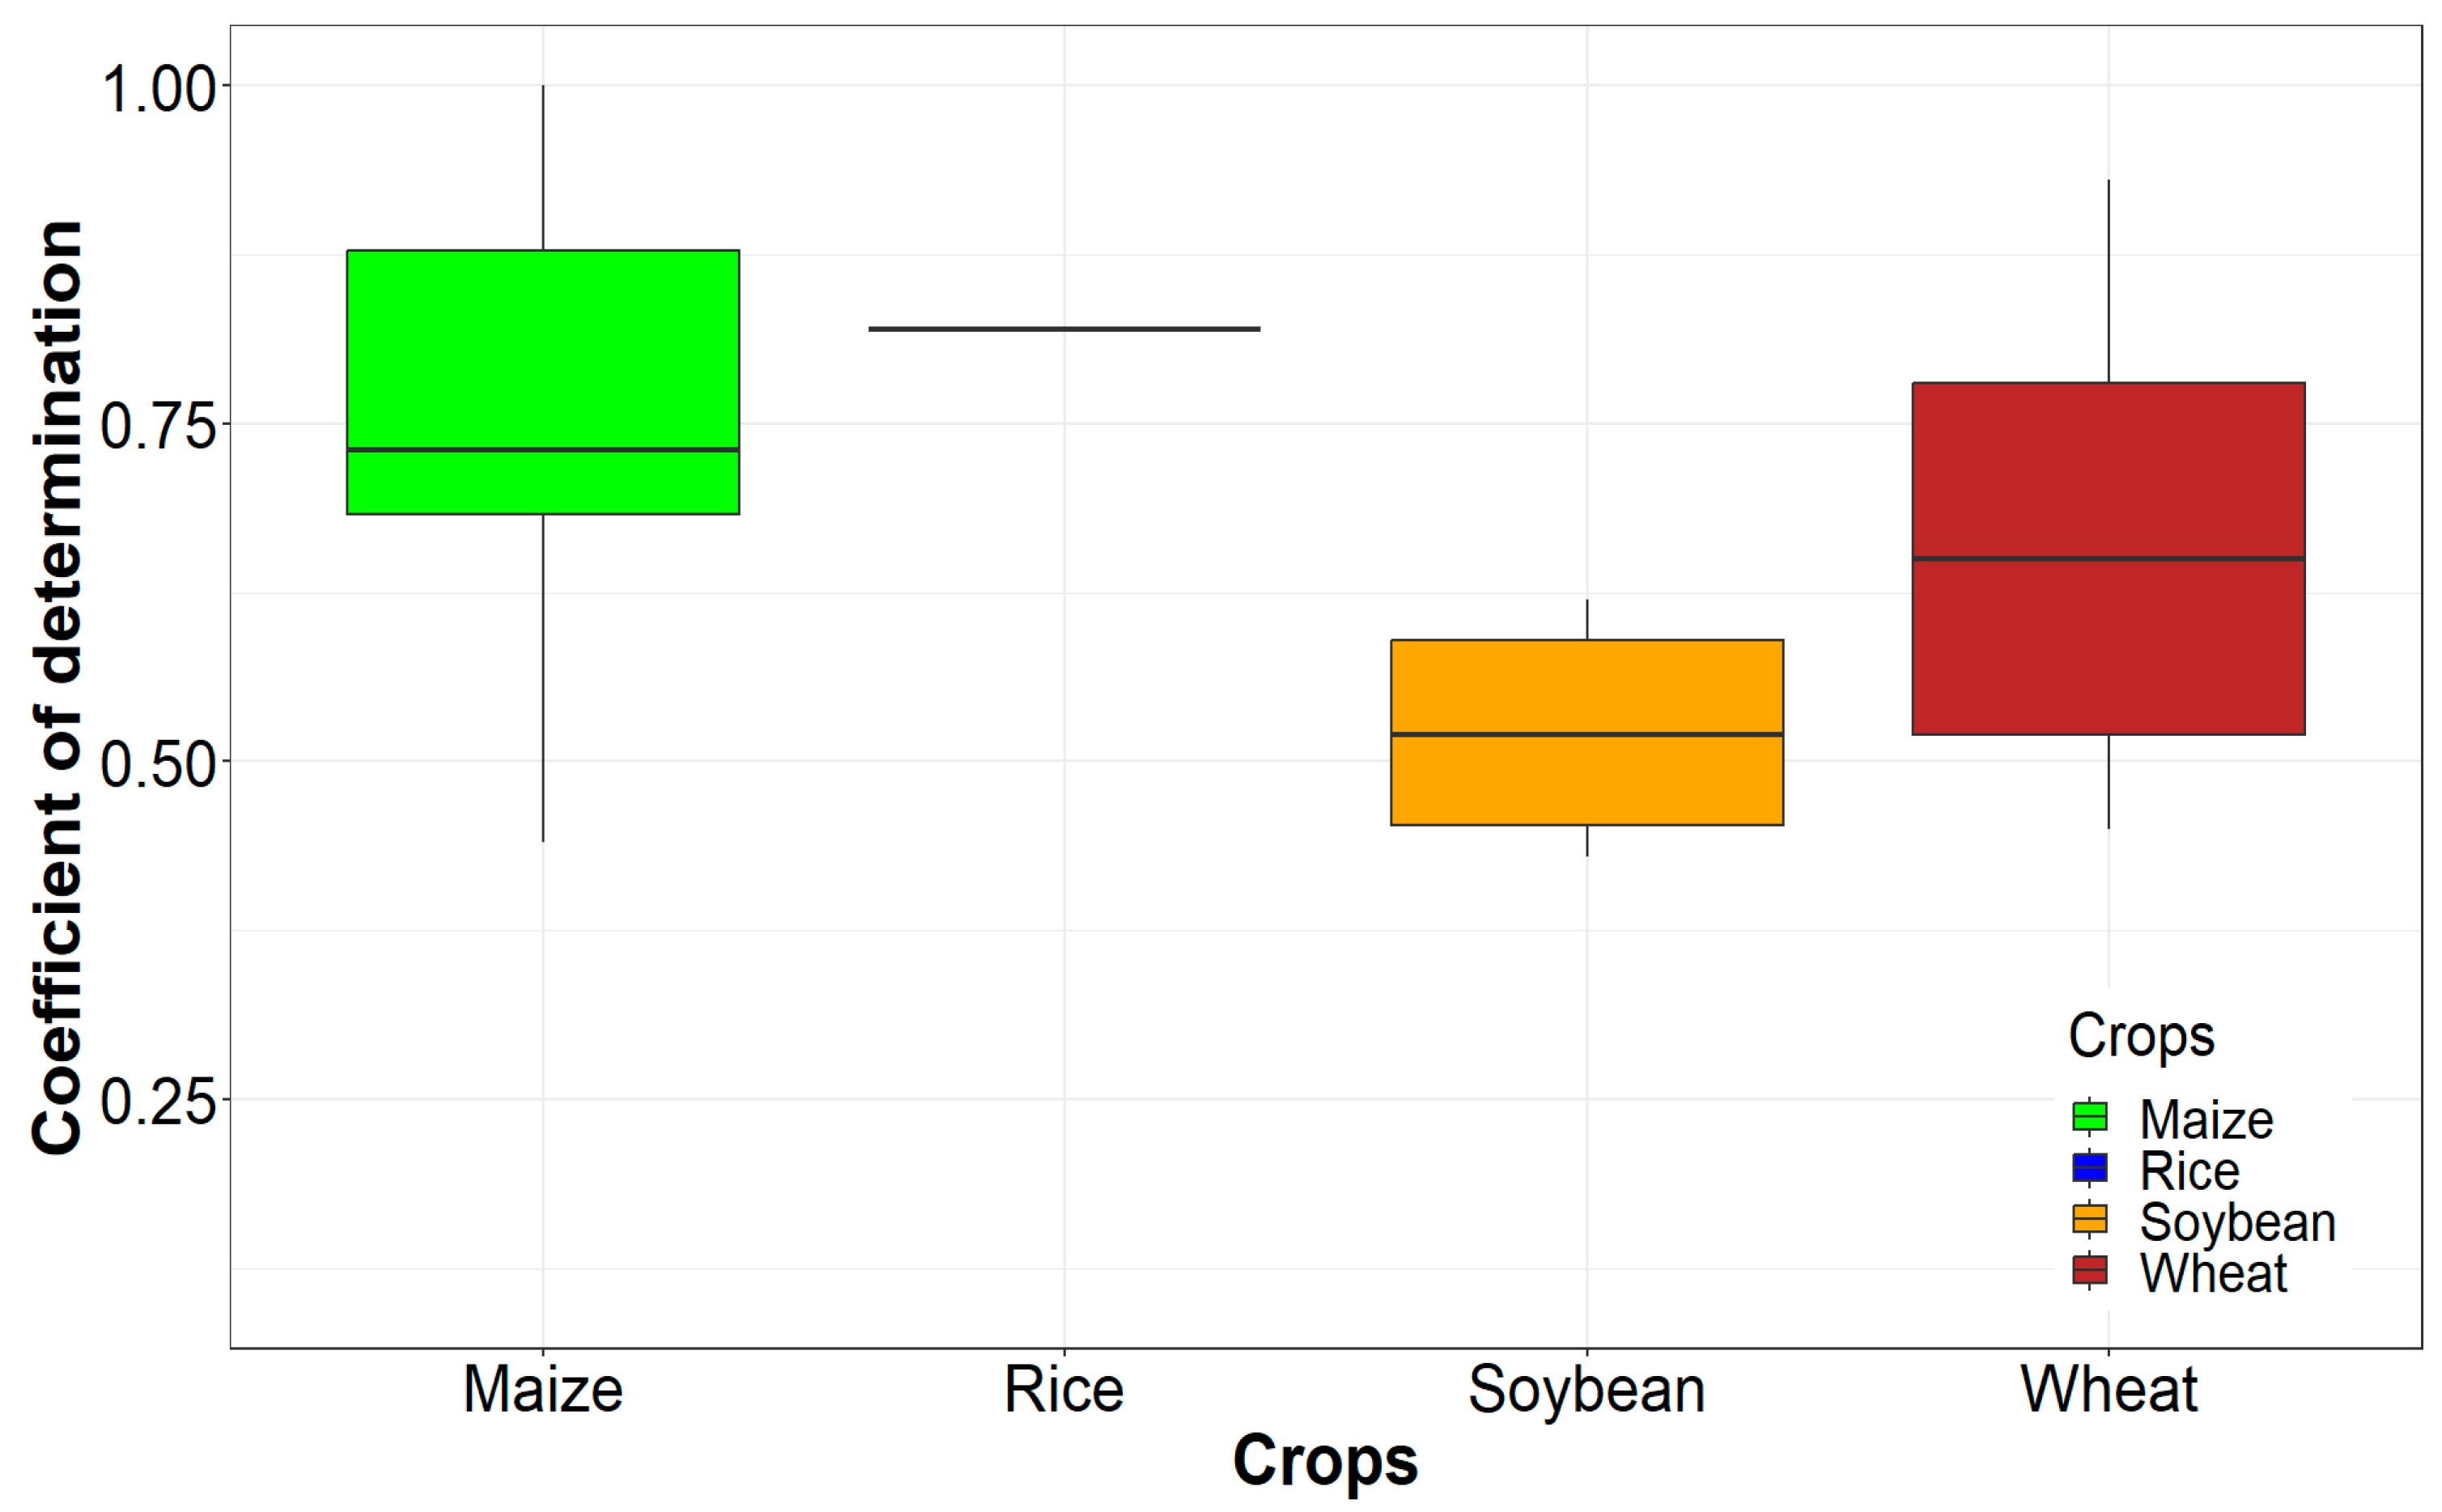
3.3.3. Crops Used for CYP
3.3.4. Radiative Transfer Models Used for Crop Traits Retrieval
3.3.5. Crop Traits Retrieval through RTMs
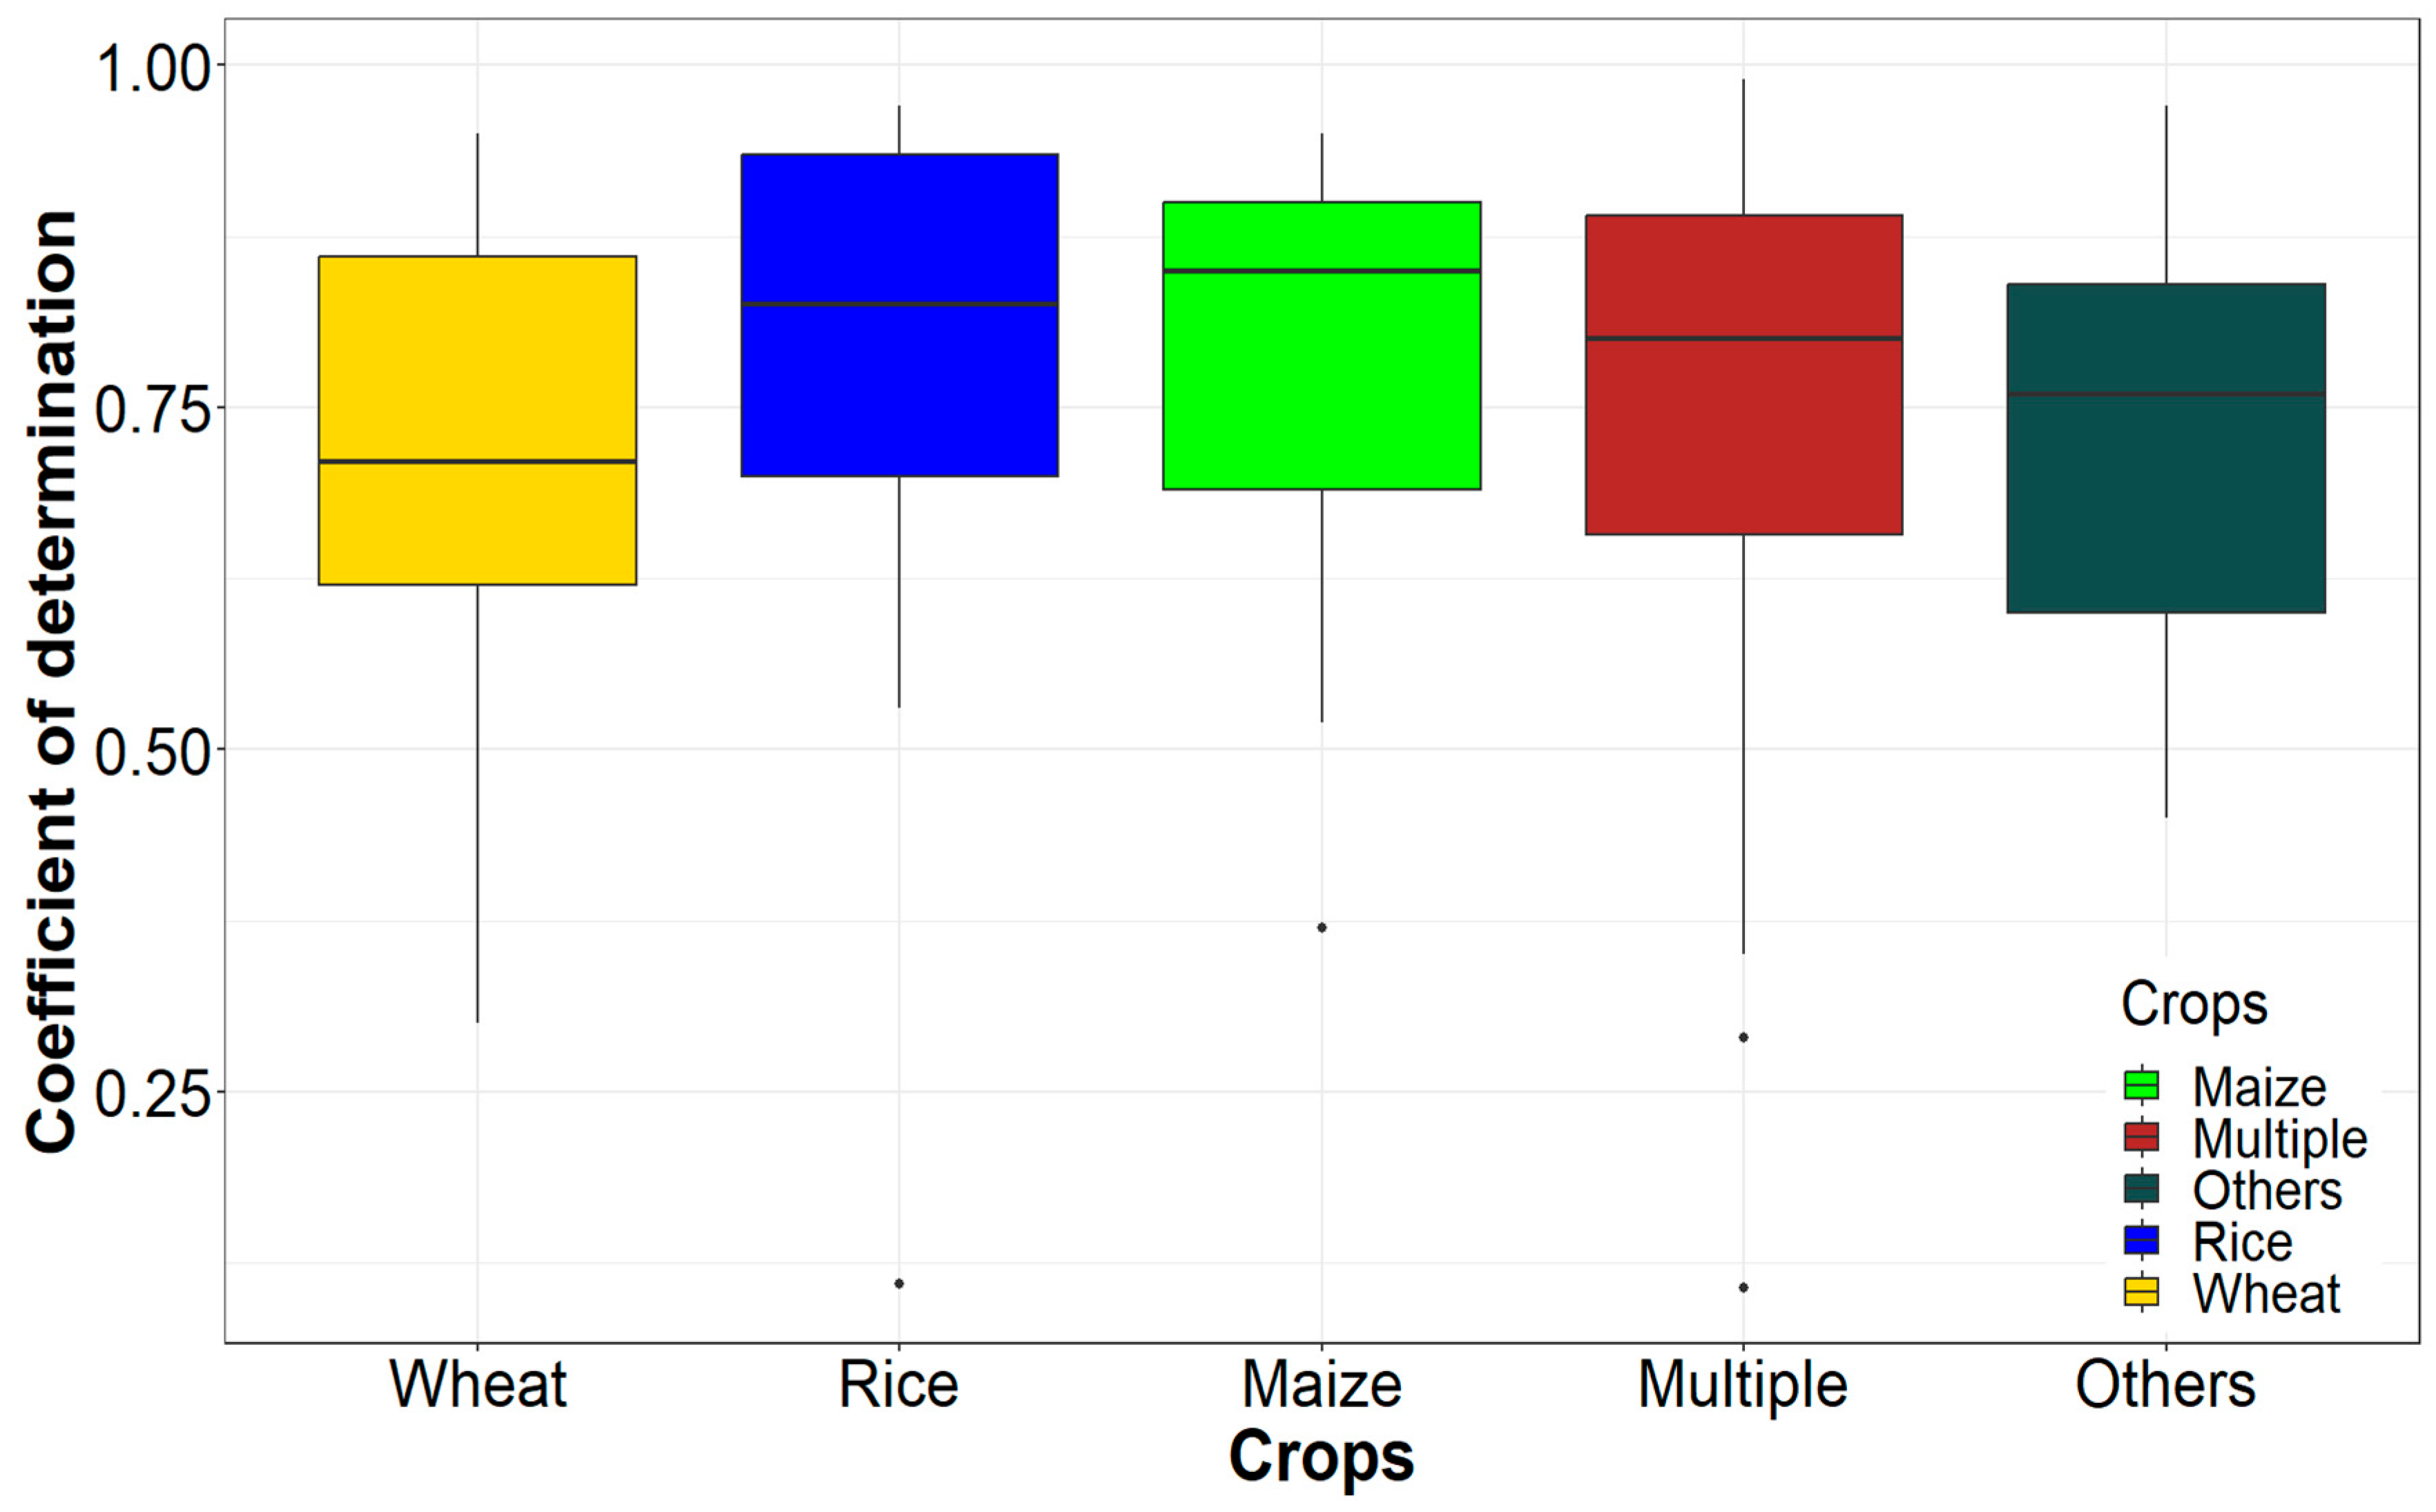
3.3.6. Crops Used for RTM-Based Crop Traits Retrieval
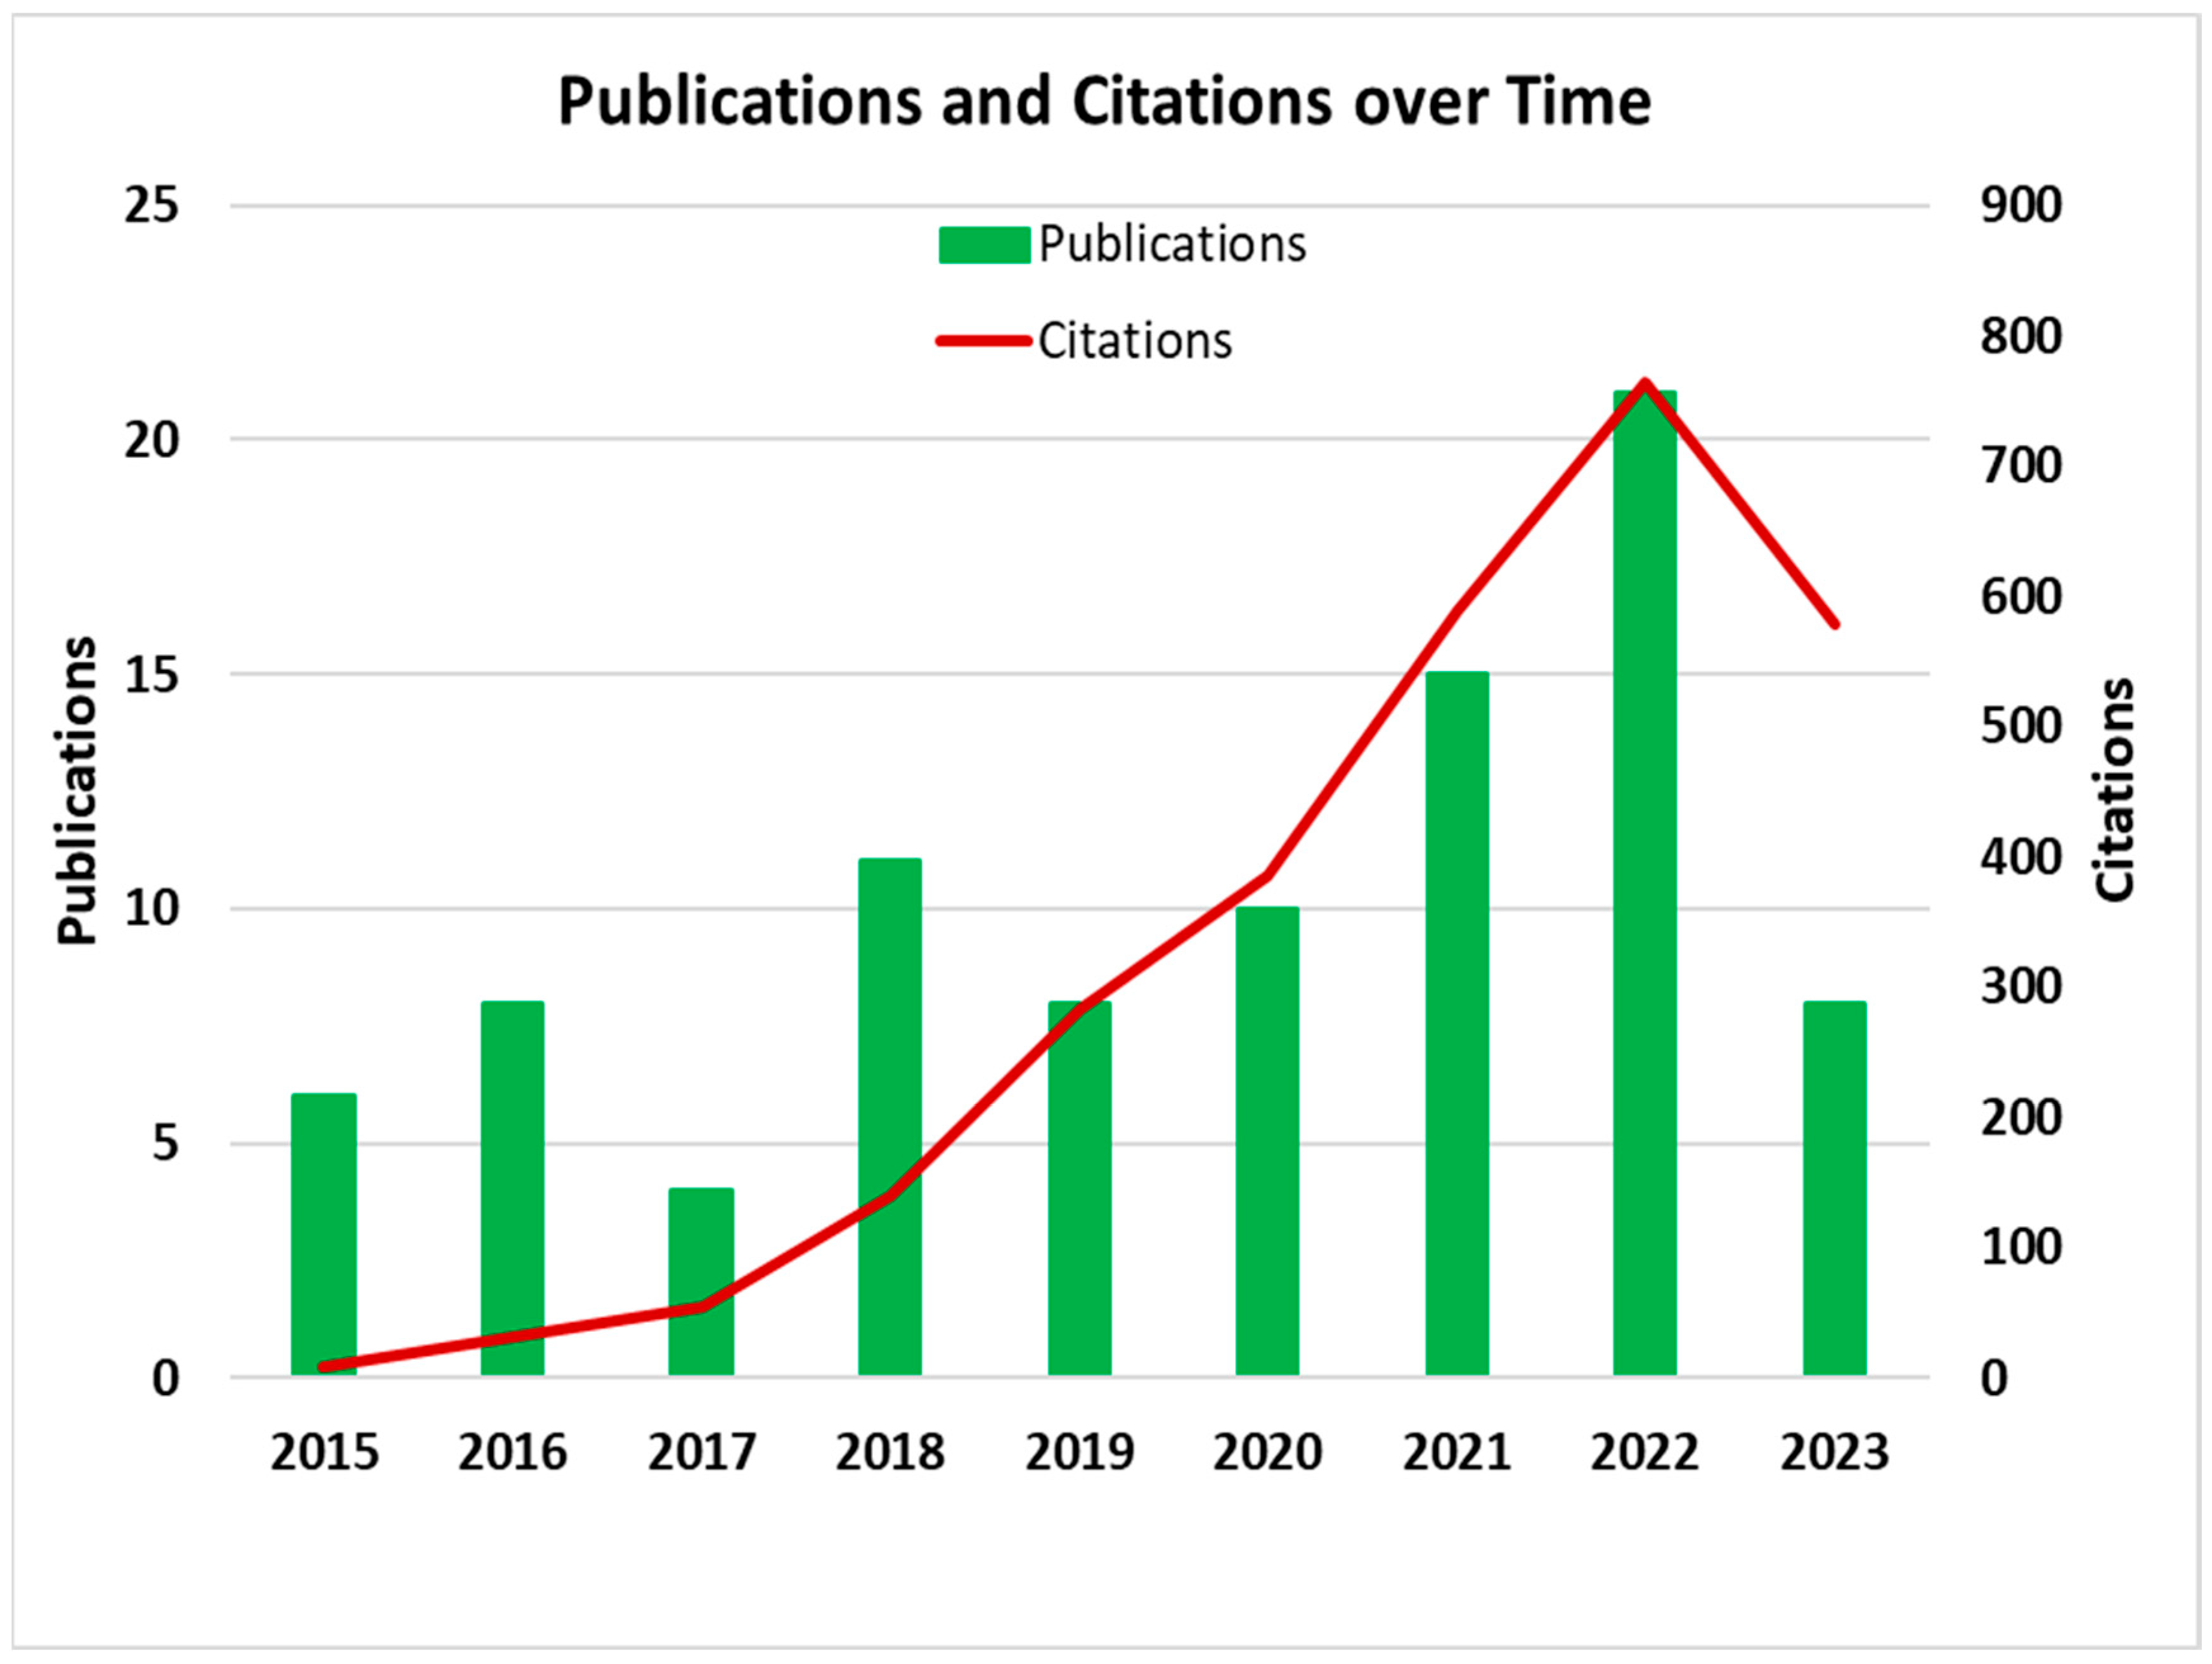
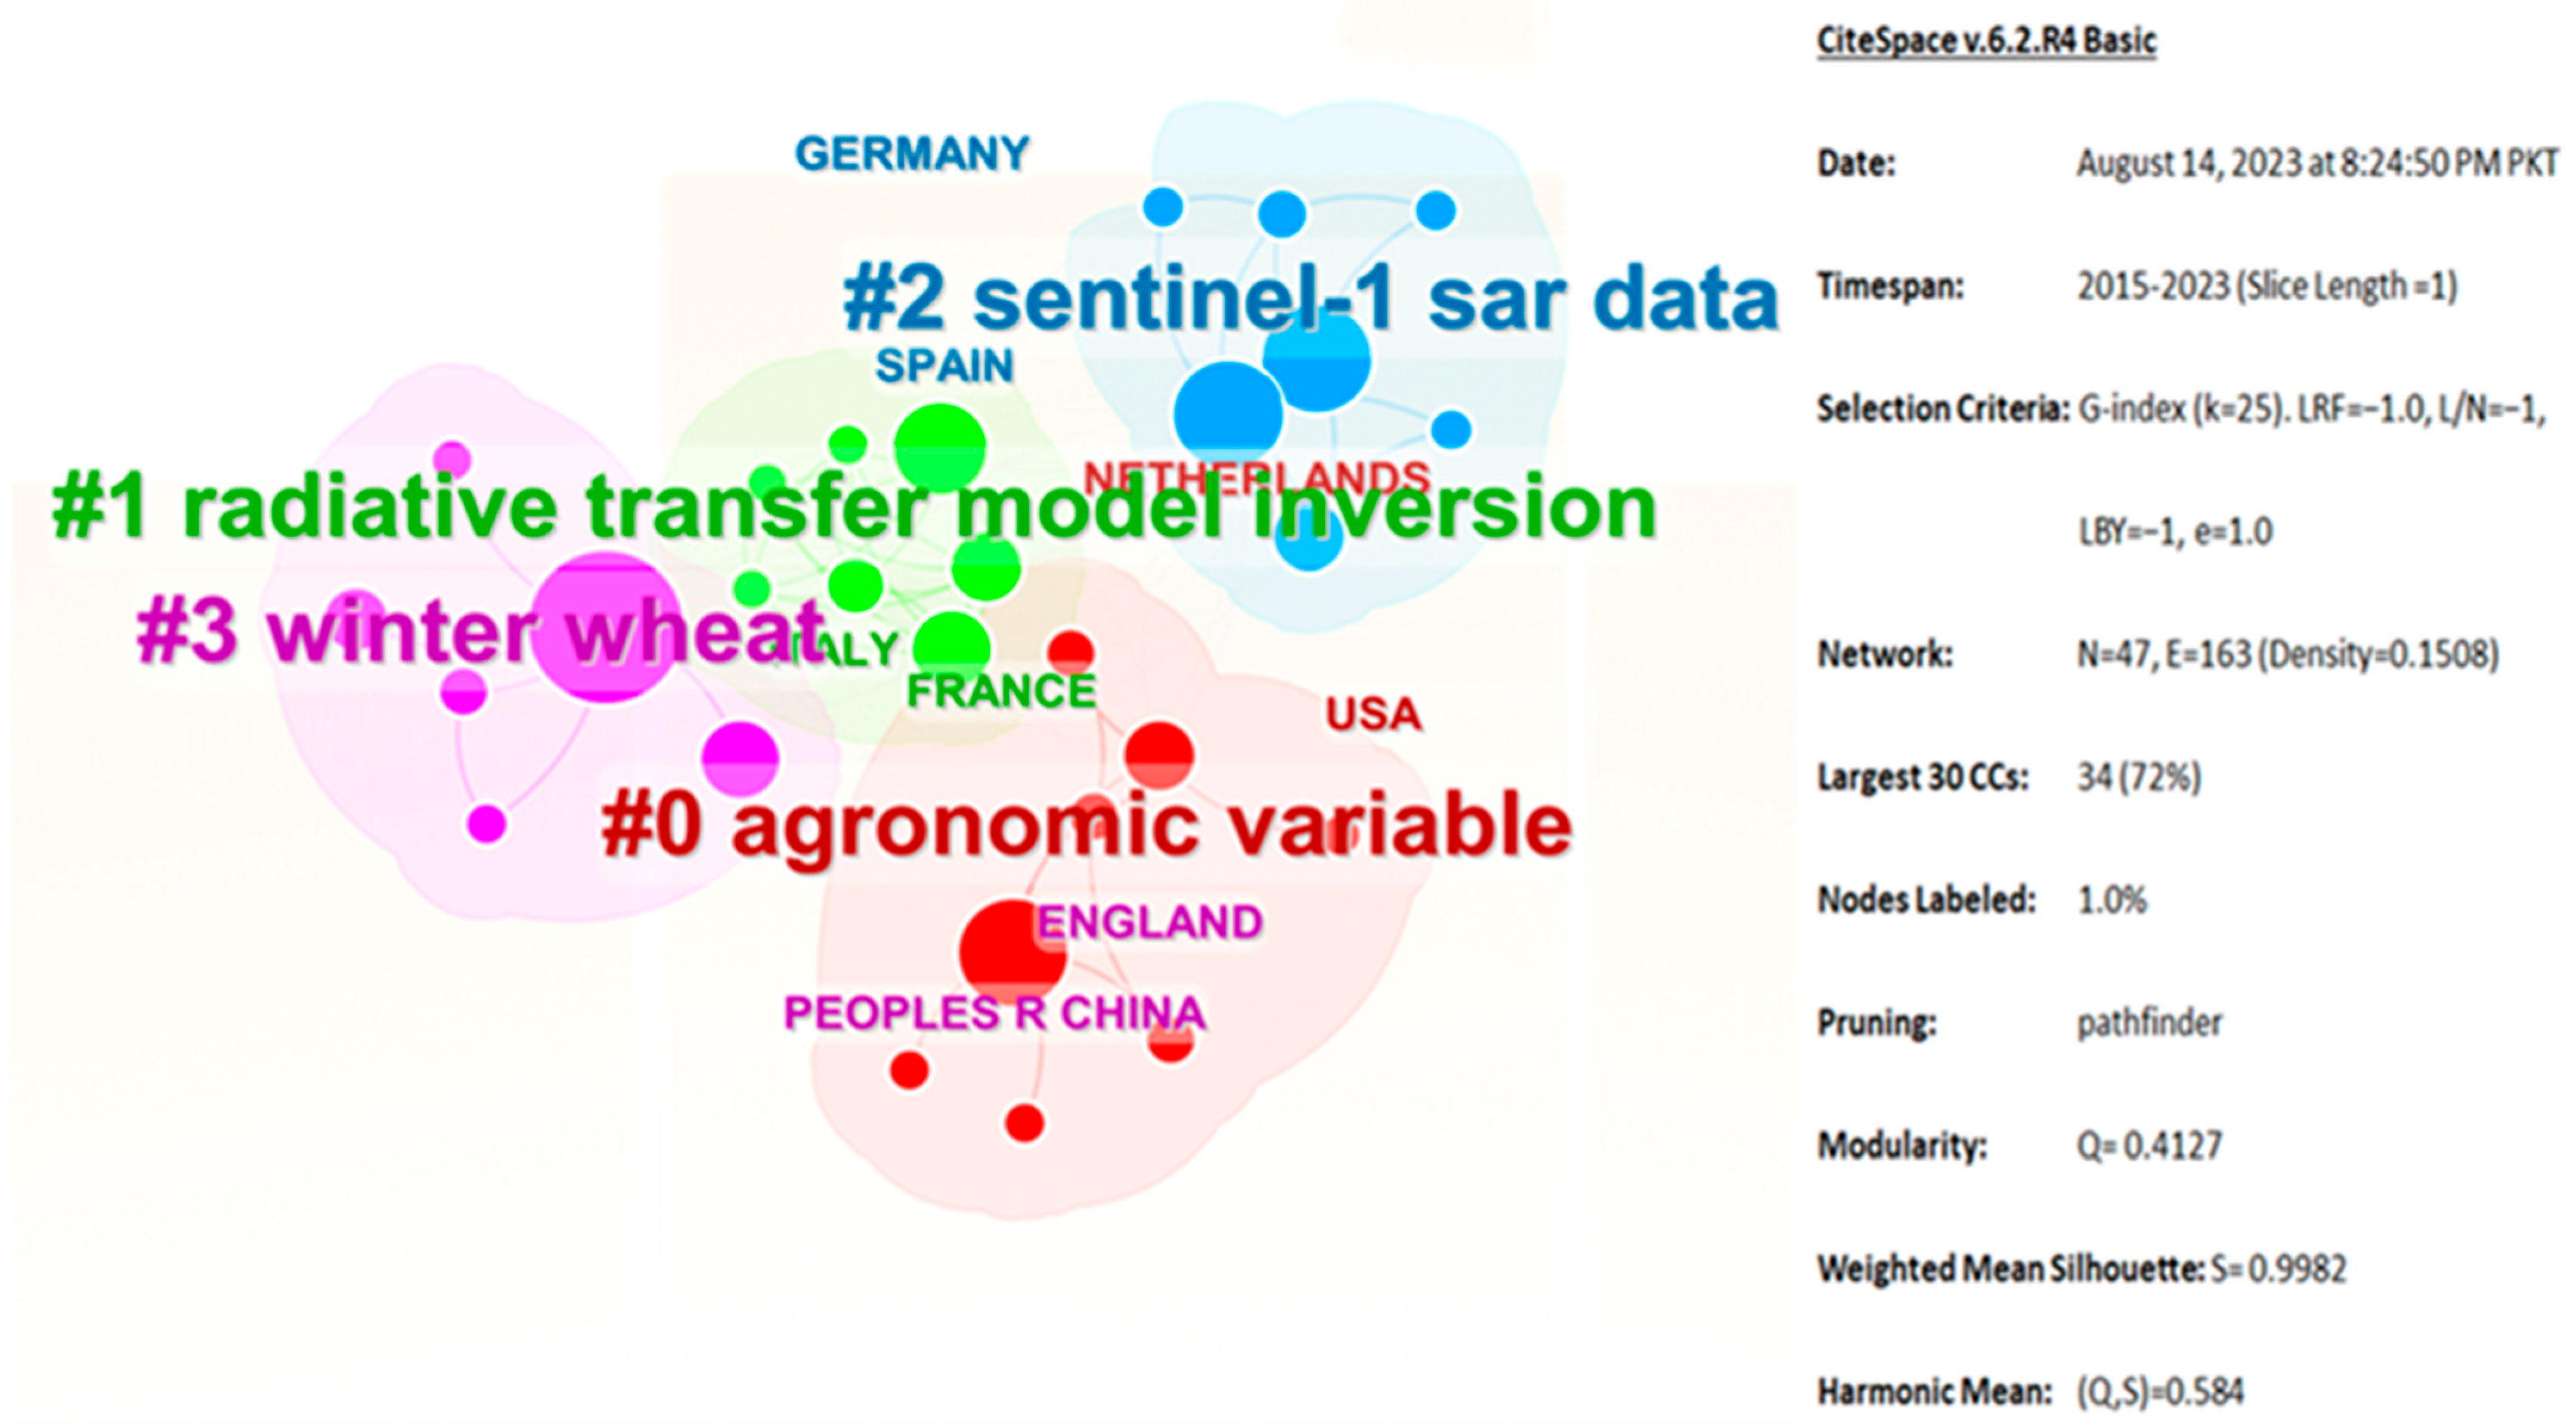
3.4. Scientometrics Analysis
4. Discussion
4.1. Crop Yield Prediction
4.2. Crop Traits Retrieval
4.3. Findings, Challenges, and Research Scope
- During this SLR, it was identified that there is a lack of consistent research for RTM-based crop yield modeling. Repeated research will improve RTMs and pave the way for more reliability and consistency for decision making.
- Most CGMs, like WOFOST, DSSAT, etc., have only LAI as a crop trait for integration with RTMs for CYP due to coupling problems. The addition of more crop traits along with efficient and accurate coupling techniques could provide scope for reliable CYP and further applications of CGM and RTM integration to assist in smart, precision agriculture.
- These limited parameters, mostly LAI and ground measurements, hinder model validation, particularly of canopy structure, leaf, and soil properties. Robust and efficient technique development will improve model validation.
- Among the available popular CGMs, APSIM is the only model that can provide a high number of crop traits, such as LAI, chlorophyll ab, leaf dry matter (Cm) and leaf water content (Cw). These crop traits can be integrated with RTMs for CYP. Currently, within the criteria of this SLR, two research studies [51,52] have used APSIM for CYP. These research studies used RFD instead of crop traits for CYP. A crop trait simulation through APSIM used as an input for an RTM can provide a straightforward specific solution to the problem of optimal solution search from the inversion techniques like LUT. No research is currently available for APSIM and RTM integration-based CYP, an area with the potential to provide viable solutions.
- Most RTM-based applications in agriculture are specific to cereals (wheat, rice and maize). Many crops are still not investigated for RTM-based estimation for crop traits and CYP. Cotton and sugarcane are cash crops, but still have no RTM-based CYP studies. This may be due to the limitations of models. Developing crop-specific or crop group-specific RTM can be very useful, robust and efficient for reliable CYP.
- Research studies are mostly confined to a few countries. In Asia, China is the major country working on RTM applications for agriculture. Other countries like Russia, India, Pakistan and Bangladesh should also be included for RTM applications in agriculture.
- The outlier of R2 = 0.11 in the study [47] for yield estimation was due to calibration against a few pixels for optimal parameter identification. Parcel-based calibration of RTM-based CYP is another area for further investigation.
- Spatial heterogeneity among fields due to crop density variations is another area not addressed by RTMs. RTM applications for parcel-based calibrations to account for crop density variations can improve RTM efficiency for CYP.
- RTMs have the limitation of not catering to the narrow variations in datasets, as in the case of [73], for retrieval of Cw (R2 = 0.30). RTMs should respond to narrow variations, as crops with narrow growth variations have different yields.
- Crop phenology development resulted in variations of crop traits dynamics. Capturing these crop traits dynamics over time is challenging but has a key role in enhancing model accuracy for CYP.
- New computational techniques like machine and deep learning have the potential to improve CYP. This, however, needs training datasets and ground information for model training. RTM integration with CGM outputs with state-of-the-art computational techniques [128] is another research focus area. The same approach could be effective in CYP subjected to research investigations in this field.
5. Conclusions
Author Contributions
Funding
Data Availability Statement
Acknowledgments
Conflicts of Interest
Abbreviations
| Sr | Abb | Word/Phrase |
| 1 | ALIA | Average Leaf Inclination Angle |
| 2 | APSIM | Agricultural Production Systems sIMulator |
| 3 | AGB | Above Ground Biomass |
| 4 | Cab | Chlorophyll a and b |
| 5 | Car | Carotenoid content |
| 6 | Cb | Brown Pigment |
| 7 | CCC | Canopy Chlorophyll Content |
| 8 | CCWC | Crop Canopy Water Content |
| 9 | CGM | Crop Growth Model |
| 10 | CMEM | Community Microwave Emission Model |
| 11 | Cw | Water Content |
| 12 | Cxc | Carotenoid |
| 13 | CYM | Crop Yield Modeling |
| 14 | CYP | Crop Yield Prediction |
| 15 | EWT | Equivalent Water Thickness |
| 16 | FAPAR | Fraction of Absorbed Photosynthetically Active Radiation |
| 17 | Fcover | Fractional Ground Cover |
| 18 | FCVI | Fluorescence Correction Vegetation Index |
| 19 | FVC | Fraction of vegetation cover |
| 20 | FLiES | Forest Light Environmental Simulator |
| 21 | Flusail | Fluspect-CX + SAIL |
| 22 | GPP | Gross Primary Productivity |
| 23 | GPR | Gaussian Process Regression |
| 24 | LAI | Leaf Area Index |
| 25 | LCC | Leaf Chlorophyll Content |
| 26 | LMA | Leaf Mass per Area |
| 27 | N | Nitrogen |
| 28 | NPP | Net Primary Productivity |
| 29 | PCE | Polynomial Chaos Expansion |
| 30 | PRISMA | Preferred Reporting Items for Systematic Reviews and Meta-Analyses |
| 31 | PROSAIL | PROSPECT (Leaf) and SAIL (Canopy) Models |
| 32 | R2 | Coefficient of Determination |
| 33 | REGFLEC | REGularized canopy reFLECtance |
| 34 | RFD | Radiation Flux Density |
| 35 | RPM | Rising Plate Meter |
| 36 | RTM | Radiative Transfer Model |
| 37 | SAFY | Simple Algorithm for Yield |
| 38 | SCOPE | Soil-Canopy Observation of Photochemistry and Energy fluxes |
| 39 | SLC | Soil Leaf Canopy |
| 40 | SLR | Systematic Literature Review |
| 41 | SS1 | SunScan |
| 42 | 6S | Second Simulation of a Satellite Signal in the Solar Spectrum |
| 43 | WoS | Web of Science |
| 44 | WOFOST | WOrld FOod STudies |
References
- Pantazi, X.E.; Moshou, D.; Alexandridis, T.; Whetton, R.L.; Mouazen, A.M. Wheat Yield Prediction Using Machine Learning and Advanced Sensing Techniques. Comput. Electron. Agric. 2016, 121, 57–65. [Google Scholar] [CrossRef]
- Holzman, M.E.; Carmona, F.; Rivas, R.; Niclòs, R. Early Assessment of Crop Yield from Remotely Sensed Water Stress and Solar Radiation Data. ISPRS J. Photogramm. Remote Sens. 2018, 145, 297–308. [Google Scholar] [CrossRef]
- Jones, E.J.; Bishop, T.F.A.; Malone, B.P.; Hulme, P.J.; Whelan, B.M.; Filippi, P. Identifying Causes of Crop Yield Variability with Interpretive Machine Learning. Comput. Electron. Agric. 2022, 192, 106632. [Google Scholar] [CrossRef]
- Whetton, R.; Zhao, Y.; Shaddad, S.; Mouazen, A.M. Nonlinear Parametric Modelling to Study How Soil Properties Affect Crop Yields and NDVI. Comput. Electron. Agric. 2017, 138, 127–136. [Google Scholar] [CrossRef]
- Dash, Y.; Mishra, S.K.; Panigrahi, B.K. Rainfall Prediction for the Kerala State of India Using Artificial Intelligence Approaches. Comput. Electr. Eng. 2018, 70, 66–73. [Google Scholar] [CrossRef]
- Li, S.; Peng, S.; Chen, W.; Lu, X. INCOME: Practical Land Monitoring in Precision Agriculture with Sensor Networks. Comput. Commun. 2013, 36, 459–467. [Google Scholar] [CrossRef]
- Rashid, M.; Bari, B.S.; Yusup, Y.; Kamaruddin, M.A.; Khan, N. A Comprehensive Review of Crop Yield Prediction Using Machine Learning Approaches with Special Emphasis on Palm Oil Yield Prediction. IEEE Access 2021, 9, 63406–63439. [Google Scholar] [CrossRef]
- Adhikary, S.; Biswas, B.; Kumar Naskar, M.; Mukherjee, B.; Pratap Singh, A.; Atta, K. Remote Sensing for Agricultural Applications. In Arid Environment—Perspectives, Challenges and Management; IntechOpen: London, UK, 2023. [Google Scholar] [CrossRef]
- Kasampalis, D.A.; Alexandridis, T.K.; Deva, C.; Challinor, A.; Moshou, D.; Zalidis, G. Contribution of Remote Sensing on Crop Models: A Review. J. Imaging 2018, 4, 52. [Google Scholar] [CrossRef]
- Jacquemoud, S.; Verhoef, W.; Baret, F.; Bacour, C.; Zarco-Tejada, P.J.; Asner, G.P.; François, C.; Ustin, S.L. PROSPECT + SAIL Models: A Review of Use for Vegetation Characterization. Remote Sens. Environ. 2009, 113, S56–S66. [Google Scholar] [CrossRef]
- Basso, B.; Liu, L. Seasonal Crop Yield Forecast: Methods, Applications, and Accuracies, 1st ed.; Elsevier: Amsterdam, The Netherlands, 2019; Volume 154. [Google Scholar]
- Shahhosseini, M.; Martinez-Feria, R.A.; Hu, G.; Archontoulis, S.V. Maize Yield and Nitrate Loss Prediction with Machine Learning Algorithms. Environ. Res. Lett. 2019, 14, 124026. [Google Scholar] [CrossRef]
- Thorp, K.R.; Wang, G.; West, A.L.; Moran, M.S.; Bronson, K.F.; White, J.W.; Mon, J. Estimating Crop Biophysical Properties from Remote Sensing Data by Inverting Linked Radiative Transfer and Ecophysiological Models. Remote Sens. Environ. 2012, 124, 224–233. [Google Scholar] [CrossRef]
- Wu, L.; Liu, X.; Wang, P.; Zhou, B.; Liu, M.; Li, X. The Assimilation of Spectral Sensing and the WOFOST Model for the Dynamic Simulation of Cadmium Accumulation in Rice Tissues. Int. J. Appl. Earth Obs. Geoinf. 2013, 25, 66–75. [Google Scholar] [CrossRef]
- Zhou, G.; Liu, X.; Zhao, S.; Liu, M.; Wu, L. Estimating FAPAR of Rice Growth Period Using Radiation Transfer Model Coupled with the WOFOST Model for Analyzing Heavy Metal Stress. Remote Sens. 2017, 9, 424. [Google Scholar] [CrossRef]
- Tao, H.; Feng, H.; Xu, L.; Miao, M.; Long, H.; Yue, J.; Li, Z.; Yang, G.; Yang, X.; Fan, L. Estimation of Crop Growth Parameters Using UAV- Based Hyperspectral Remote Sensing Data. Sensors 2020, 20, 1296. [Google Scholar] [CrossRef] [PubMed]
- Jay, S.; Maupas, F.; Bendoula, R.; Gorretta, N. Retrieving LAI, Chlorophyll and Nitrogen Contents in Sugar Beet Crops from Multi-Angular Optical Remote Sensing: Comparison of Vegetation Indices and PROSAIL Inversion for Field Phenotyping. Field Crops Res. 2017, 210, 33–46. [Google Scholar] [CrossRef]
- Impollonia, G.; Croci, M.; Martani, E.; Ferrarini, A.; Kam, J.; Trindade, L.M.; Clifton-Brown, J.; Amaducci, S. Moisture Content Estimation and Senescence Phenotyping of Novel Miscanthus Hybrids Combining UAV-Based Remote Sensing and Machine Learning. GCB Bioenergy 2022, 14, 639–656. [Google Scholar] [CrossRef]
- Dhakar, R.; Sehgal, V.K.; Chakraborty, D.; Sahoo, R.N.; Mukherjee, J.; Ines, A.V.M.; Kumar, S.N.; Shirsath, P.B.; Roy, S.B. Field Scale Spatial Wheat Yield Forecasting System under Limited Field Data Availability by Integrating Crop Simulation Model with Weather Forecast and Satellite Remote Sensing. Agric. Syst. 2022, 195, 103299. [Google Scholar] [CrossRef]
- Yang, Y.; Huang, Q.; Wu, Z.; Wu, T.; Luo, J.; Dong, W.; Sun, Y.; Zhang, X.; Zhang, D. Mapping Crop Leaf Area Index at the Parcel Level via Inverting a Radiative Transfer Model under Spatiotemporal Constraints: A Case Study on Sugarcane. Comput. Electron. Agric. 2022, 198, 107003. [Google Scholar] [CrossRef]
- Kayad, A.; Rodrigues, F.A.; Naranjo, S.; Sozzi, M.; Pirotti, F.; Marinello, F.; Schulthess, U.; Defourny, P.; Gerard, B.; Weiss, M. Radiative Transfer Model Inversion Using High-Resolution Hyperspectral Airborne Imagery—Retrieving Maize LAI to Access Biomass and Grain Yield. Field Crops Res. 2022, 282, 108449. [Google Scholar] [CrossRef]
- Wang, S.; Guan, K.; Wang, Z.; Ainsworth, E.A.; Zheng, T.; Townsend, P.A.; Li, K.; Moller, C.; Wu, G.; Jiang, C. Unique Contributions of Chlorophyll and Nitrogen to Predict Crop Photosynthetic Capacity from Leaf Spectroscopy. J. Exp. Bot. 2020, 72, 341–354. [Google Scholar] [CrossRef]
- Pignatti, S.; Casa, R.; Laneve, G.; Li, Z.; Liu, L.; Marzialetti, P.; Mzid, N.; Pascucci, S.; Silvestro, P.C.; Tolomio, M.; et al. Sino–EU Earth Observation Data to Support the Monitoring and Management of Agricultural Resources. Remote Sens. 2021, 13, 2889. [Google Scholar] [CrossRef]
- Zhou, G.; Niu, C.; Xu, W.; Yang, W.; Wang, J.; Zhao, H. Canopy Modeling of Aquatic Vegetation: A Radiative Transfer Approach. Remote Sens. Environ. 2015, 163, 186–205. [Google Scholar] [CrossRef]
- Zhou, G.; Yang, S.; Sathyendranath, S.; Platt, T. Canopy Modeling of Aquatic Vegetation: A Geometric Optical Approach (AVGO). Remote Sens. Environ. 2020, 245, 111829. [Google Scholar] [CrossRef]
- Abdelbaki, A.; Udelhoven, T. A Review of Hybrid Approaches for Quantitative Assessment of Crop Traits Using Optical Remote Sensing: Research Trends and Future Directions. Remote Sens. 2022, 14, 3515. [Google Scholar] [CrossRef]
- Li, L.; Mu, X.; Jiang, H.; Chianucci, F.; Hu, R.; Song, W.; Qi, J.; Liu, S.; Zhou, J.; Chen, L.; et al. Review of Ground and Aerial Methods for Vegetation Cover Fraction (FCover) and Related Quantities Estimation: Definitions, Advances, Challenges, and Future Perspectives. ISPRS J. Photogramm. Remote Sens. 2023, 199, 133–156. [Google Scholar] [CrossRef]
- Berger, K.; Machwitz, M.; Kycko, M.; Kefauver, S.C.; Van Wittenberghe, S.; Gerhards, M.; Verrelst, J.; Atzberger, C.; van der Tol, C.; Damm, A.; et al. Multi-Sensor Spectral Synergies for Crop Stress Detection and Monitoring in the Optical Domain: A Review. Remote Sens. Environ. 2022, 280, 113198. [Google Scholar] [CrossRef] [PubMed]
- Berger, K.; Verrelst, J.; Féret, J.B.; Wang, Z.; Wocher, M.; Strathmann, M.; Danner, M.; Mauser, W.; Hank, T. Crop Nitrogen Monitoring: Recent Progress and Principal Developments in the Context of Imaging Spectroscopy Missions. Remote Sens. Environ. 2020, 242, 111758. [Google Scholar] [CrossRef]
- Weiss, M.; Jacob, F.; Duveiller, G. Remote Sensing for Agricultural Applications: A Meta-Review. Remote Sens. Environ. 2020, 236, 111402. [Google Scholar] [CrossRef]
- Page, M.J.; McKenzie, J.E.; Bossuyt, P.M.; Boutron, I.; Hoffmann, T.C.; Mulrow, C.D.; Shamseer, L.; Tetzlaff, J.M.; Akl, E.A.; Brennan, S.E.; et al. The PRISMA 2020 Statement: An Updated Guideline for Reporting Systematic Reviews. BMJ 2021, 372, 105906. [Google Scholar] [CrossRef]
- Kitchenham, B.A.; Charters, S. Guidelines for Performing Systematic Literature Reviews in Software Engineering; Version 2.3, EBSE Technical Report, EBSE-2007-01; Keele University: Keele, UK; University of Durham: Durham, UK, 2007. [Google Scholar]
- Osman, R.; Ata-ul-karim, S.T.; Naveed, M.; Ishaque, W. Multi-Model Ensembles for Assessing the Impact of Future Climate Change on Rainfed Wheat Productivity under Various Cultivars and Nitrogen Levels. Eur. J. Agron. 2022, 139, 126554. [Google Scholar] [CrossRef]
- Kherif, O.; Seghouani, M.; Justes, E.; Plaza-bonilla, D.; Bouhenache, A.; Zemmouri, B.; Dokukin, P.; Latati, M. The First Calibration and Evaluation of the STICS Soil-Crop Model on Chickpea-Based Intercropping System under Mediterranean Conditions. Eur. J. Agron. 2022, 133, 126449. [Google Scholar] [CrossRef]
- Wang, B.; Deveson, E.D.; Waters, C.; Spessa, A.; Lawton, D.; Feng, P.; Liu, D.L. Science of the Total Environment Future Climate Change Likely to Reduce the Australian Plague Locust (Chortoicetes terminifera) Seasonal Outbreaks. Sci. Total Environ. 2019, 668, 947–957. [Google Scholar] [CrossRef] [PubMed]
- Emberson, L.D.; Pleijel, H.; Ainsworth, E.A.; Van den Berg, M.; Ren, W.; Osborne, S.; Mills, G.; Pandey, D.; Dentener, F.; Büker, P.; et al. Ozone e Ff Ects on Crops and Consideration in Crop Models. Eur. J. Agron. 2018, 100, 19–34. [Google Scholar] [CrossRef]
- Low, S. Science of the Total Environment Engineering Imaginaries: Anticipatory Foresight for Solar Radiation Management Governance. Sci. Total Environ. 2017, 580, 90–104. [Google Scholar] [CrossRef] [PubMed]
- Shan, N.; Zhang, Y.; Chen, J.M.; Ju, W.; Migliavacca, M.; Pe, J. A Model for Estimating Transpiration from Remotely Sensed Solar-Induced Chlorophyll Fluorescence. Remote Sens. Environ. 2021, 252, 112134. [Google Scholar] [CrossRef]
- Lukeš, P.; Neuwirthová, E.; Lhotáková, Z.; Janoutová, R.; Albrechtová, J. Remote Sensing of Environment Upscaling Seasonal Phenological Course of Leaf Dorsiventral Reflectance in Radiative Transfer Model. Remote Sens. Environ. 2020, 246, 111862. [Google Scholar] [CrossRef]
- Yang, P.; van der Tol, C.; Campbell, P.K.E.; Middleton, E.M. Fluorescence Correction Vegetation Index (FCVI): A Physically Based Reflectance Index to Separate Physiological and Non-Physiological Information in Far-Red Sun-Induced Chlorophyll Fluorescence. Remote Sens. Environ. 2020, 240, 111676. [Google Scholar] [CrossRef]
- Iskandar, I.; Patak, A.A. The Significance of Mendeley Usage on the Accuracy of Citation and References. Int. J. Humanit. Innov. 2019, 2, 108–114. [Google Scholar] [CrossRef]
- Zhang, Y.; Zhao, D.; Liu, H.; Huang, X.; Deng, J.; Jia, R.; He, X.; Tahir, M.N.; Lan, Y. Research Hotspots and Frontiers in Agricultural Multispectral Technology: Bibliometrics and Scientometrics Analysis of the Web of Science. Front. Plant Sci. 2022, 13, 955340. [Google Scholar] [CrossRef]
- Castaldi, F.; Casa, R.; Pelosi, F.; Yang, H. Influence of Acquisition Time and Resolution on Wheat Yield Estimation at the Field Scale from Canopy Biophysical Variables Retrieved from SPOT Satellite Data. Int. J. Remote Sens. 2015, 36, 2438–2459. [Google Scholar] [CrossRef]
- Wang, S.; Guan, K.; Wang, Z.; Ainsworth, E.A.; Zheng, T.; Townsend, P.A.; Liu, N.; Nafziger, E.; Masters, M.D.; Li, K.; et al. Airborne Hyperspectral Imaging of Nitrogen Deficiency on Crop Traits and Yield of Maize by Machine Learning and Radiative Transfer Modeling. Int. J. Appl. Earth Obs. Geoinf. 2021, 105, 102617. [Google Scholar] [CrossRef]
- Zare, H.; Weber, T.K.D.; Ingwersen, J.; Nowak, W.; Gayler, S.; Streck, T. Combining Crop Modeling with Remote Sensing Data Using a Particle Filtering Technique to Produce Real-Time Forecasts of Winter Wheat Yields under Uncertain Boundary Conditions. Remote Sens. 2022, 14, 1360. [Google Scholar] [CrossRef]
- Bandaru, V.; Yaramasu, R.; Jones, C.; César Izaurralde, R.; Reddy, A.; Sedano, F.; Daughtry, C.S.T.; Becker-Reshef, I.; Justice, C. Geo-CropSim: A Geo-Spatial Crop Simulation Modeling Framework for Regional Scale Crop Yield and Water Use Assessment. ISPRS J. Photogramm. Remote Sens. 2022, 183, 34–53. [Google Scholar] [CrossRef]
- Upreti, D.; Pignatti, S.; Pascucci, S.; Tolomio, M.; Huang, W.; Casa, R. Bayesian Calibration of the Aquacrop-OS Model for Durum Wheat by Assimilation of Canopy Cover Retrieved from VENμS Satellite Data. Remote Sens. 2020, 12, 1–23. [Google Scholar] [CrossRef]
- Huang, J.; Ma, H.; Sedano, F.; Lewis, P.; Liang, S.; Wu, Q.; Su, W.; Zhang, X.; Zhu, D. Evaluation of Regional Estimates of Winter Wheat Yield by Assimilating Three Remotely Sensed Reflectance Datasets into the Coupled WOFOST–PROSAIL Model. Eur. J. Agron. 2019, 102, 1–13. [Google Scholar] [CrossRef]
- Setiyono, T.D.; Quicho, E.D.; Gatti, L.; Campos-Taberner, M.; Busetto, L.; Collivignarelli, F.; García-Haro, F.J.; Boschetti, M.; Khan, N.I.; Holecz, F. Spatial Rice Yield Estimation Based on MODIS and Sentinel-1 SAR Data and ORYZA Crop Growth Model. Remote Sens. 2018, 10, 293. [Google Scholar] [CrossRef]
- Zhang, L.; Guo, C.L.; Zhao, L.Y.; Zhu, Y.; Cao, W.X.; Tian, Y.C.; Cheng, T.; Wang, X. Estimating Wheat Yield by Integrating the WheatGrow and PROSAIL Models. Field Crops Res. 2016, 192, 55–66. [Google Scholar] [CrossRef]
- Zhao, J.; Kong, X.; He, K.; Xu, H.; Mu, J. Assessment of the Radiation Effect of Aerosols on Maize Production in China. Sci. Total Environ. 2020, 720, 137567. [Google Scholar] [CrossRef]
- Zhao, J.; Kong, X.; Xu, H.; Zhang, Y.; Jiang, Y. Assessment of Biomass and Yield Loss of Maize Caused by Aerosols in Heavily Polluted Agricultural Areas of China Based on APSIM Model. Phys. Chem. Earth 2020, 115, 102835. [Google Scholar] [CrossRef]
- Hank, T.B.; Bach, H.; Mauser, W. Using a Remote Sensing-Supported Hydro-Agroecological Model for Field-Scale Simulation of Heterogeneous Crop Growth and Yield: Application for Wheat in Central Europe. Remote Sens. 2015, 7, 3934–3965. [Google Scholar] [CrossRef]
- Huang, Y.; Ryu, Y.; Jiang, C.; Kimm, H.; Kim, S.; Kang, M.; Shim, K. BESS-Rice: A Remote Sensing Derived and Biophysical Process-Based Rice Productivity Simulation Model. Agric. For. Meteorol. 2018, 256–257, 253–269. [Google Scholar] [CrossRef]
- Burgess, A.J.; Masclaux-Daubresse, C.; Strittmatter, G.; Weber, A.P.M.; Taylor, S.H.; Harbinson, J.; Yin, X.; Long, S.; Paul, M.J.; Westhoff, P.; et al. Improving Crop Yield Potential: Underlying Biological Processes and Future Prospects. Food Energy Secur. 2023, 12, e435. [Google Scholar] [CrossRef] [PubMed]
- Adeluyi, O.; Harris, A.; Verrelst, J.; Foster, T.; Clay, G.D. Estimating the Phenological Dynamics of Irrigated Rice Leaf Area Index Using the Combination of PROSAIL and Gaussian Process Regression. Int. J. Appl. Earth Obs. Geoinf. 2021, 102, 102454. [Google Scholar] [CrossRef] [PubMed]
- Li, D.; Chen, J.M.; Zhang, X.; Yan, Y.; Zhu, J.; Zheng, H.; Zhou, K.; Yao, X.; Tian, Y.; Zhu, Y.; et al. Improved Estimation of Leaf Chlorophyll Content of Row Crops from Canopy Reflectance Spectra through Minimizing Canopy Structural Effects and Optimizing Off-Noon Observation Time. Remote Sens. Environ. 2020, 248, 111985. [Google Scholar] [CrossRef]
- Liang, L.; Di, L.; Zhang, L.; Deng, M.; Qin, Z.; Zhao, S.; Lin, H. Estimation of Crop LAI Using Hyperspectral Vegetation Indices and a Hybrid Inversion Method. Remote Sens. Environ. 2015, 165, 123–134. [Google Scholar] [CrossRef]
- Wocher, M.; Berger, K.; Danner, M.; Mauser, W.; Hank, T. RTM-Based Dynamic Absorption Integrals for the Retrieval of Biochemical Vegetation Traits. Int. J. Appl. Earth Obs. Geoinf. 2020, 93, 102219. [Google Scholar] [CrossRef]
- Jin, H.; Xu, W.; Li, A.; Xie, X.; Zhang, Z.; Xia, H. Spatially and Temporally Continuous Leaf Area Index Mapping for Crops through Assimilation of Multi-Resolution Satellite Data. Remote Sens. 2019, 11, 2517. [Google Scholar] [CrossRef]
- He, L.I.; Chen, Z.X.; Jiang, Z.W.; Wu, W.B.; Ren, J.Q.; Bin, L.; Tuya, H. Comparative Analysis of GF-1, HJ-1, and Landsat-8 Data for Estimating the Leaf Area Index of Winter Wheat. J. Integr. Agric. 2017, 16, 266–285. [Google Scholar] [CrossRef]
- Li, Z.; Li, Z.; Fairbairn, D.; Li, N.; Xu, B.; Feng, H.; Yang, G. Multi-LUTs Method for Canopy Nitrogen Density Estimation in Winter Wheat by Field and UAV Hyperspectral. Comput. Electron. Agric. 2019, 162, 174–182. [Google Scholar] [CrossRef]
- Antonucci, G.; Impollonia, G.; Croci, M.; Potenza, E.; Marcone, A.; Amaducci, S. Evaluating Biostimulants via High-Throughput Field Phenotyping: Biophysical Traits Retrieval through PROSAIL Inversion. Smart Agric. Technol. 2023, 3, 100067. [Google Scholar] [CrossRef]
- Sun, Q.; Jiao, Q.; Chen, X.; Xing, H.; Huang, W.; Zhang, B. Machine Learning Algorithms for the Retrieval of Canopy Chlorophyll Content and Leaf Area Index of Crops Using the PROSAIL-D Model with the Adjusted Average Leaf Angle. Remote Sens. 2023, 15, 2264. [Google Scholar] [CrossRef]
- Chakhvashvili, E.; Siegmann, B.; Muller, O.; Verrelst, J.; Bendig, J.; Kraska, T.; Rascher, U. Retrieval of Crop Variables from Proximal Multispectral UAV Image Data Using PROSAIL in Maize Canopy. Remote Sens. 2022, 14, 1247. [Google Scholar] [CrossRef] [PubMed]
- Chen, Z.; Jia, K.; Wei, X.; Liu, Y.; Zhan, Y.; Xia, M.; Yao, Y.; Zhang, X. Improving Leaf Area Index Estimation Accuracy of Wheat by Involving Leaf Chlorophyll Content Information. Comput. Electron. Agric. 2022, 196, 106902. [Google Scholar] [CrossRef]
- Ravi, J.; Nigam, R.; Bhattacharya, B.K.; Desai, D.; Patel, P. Retrieval of Crop Biophysical-Biochemical Variables from Airborne AVIRIS-NG Data Using Hybrid Inversion of PROSAIL-D. Adv. Space Res. 2022, in press. [CrossRef]
- Wocher, M.; Berger, K.; Verrelst, J.; Hank, T. Retrieval of Carbon Content and Biomass from Hyperspectral Imagery over Cultivated Areas. ISPRS J. Photogramm. Remote Sens. 2022, 193, 104–114. [Google Scholar] [CrossRef] [PubMed]
- Danner, M.; Berger, K.; Wocher, M.; Mauser, W.; Hank, T. Efficient RTM-Based Training of Machine Learning Regression Algorithms to Quantify Biophysical & Biochemical Traits of Agricultural Crops. ISPRS J. Photogramm. Remote Sens. 2021, 173, 278–296. [Google Scholar] [CrossRef]
- Wan, L.; Zhang, J.; Dong, X.; Du, X.; Zhu, J.; Sun, D.; Liu, Y.; He, Y.; Cen, H. Unmanned Aerial Vehicle-Based Field Phenotyping of Crop Biomass Using Growth Traits Retrieved from PROSAIL Model. Comput. Electron. Agric. 2021, 187, 106304. [Google Scholar] [CrossRef]
- Xie, Q.; Dash, J.; Huete, A.; Jiang, A.; Yin, G.; Ding, Y.; Peng, D.; Hall, C.C.; Brown, L.; Shi, Y.; et al. Retrieval of Crop Biophysical Parameters from Sentinel-2 Remote Sensing Imagery. Int. J. Appl. Earth Obs. Geoinf. 2019, 80, 187–195. [Google Scholar] [CrossRef]
- Xu, J.; Meng, J.; Quackenbush, L.J. Use of Remote Sensing to Predict the Optimal Harvest Date of Corn. Field Crops Res. 2019, 236, 1–13. [Google Scholar] [CrossRef]
- Sehgal, V.K.; Chakraborty, D.; Sahoo, R.N. Inversion of Radiative Transfer Model for Retrieval of Wheat Biophysical Parameters from Broadband Reflectance Measurements. Inf. Process. Agric. 2016, 3, 107–118. [Google Scholar] [CrossRef]
- Xu, D.; He, B.; Quan, X. Retrieval of Canopy Water Content Using Objective Based Method. In Proceedings of the International Geoscience and Remote Sensing Symposium (IGARSS), Beijing, China, 10–15 July 2016; IEEE: Piscataway, NJ, USA, 2016; pp. 4343–4346. [Google Scholar]
- Zhang, Q.; Middleton, E.M.; Cheng, Y.B.; Huemmrich, K.F.; Cook, B.D.; Corp, L.A.; Kustas, W.P.; Russ, A.L.; Prueger, J.H.; Yao, T. Integrating Chlorophyll FAPAR and Nadir Photochemical Reflectance Index from EO-1/Hyperion to Predict Cornfield Daily Gross Primary Production. Remote Sens. Environ. 2016, 186, 311–321. [Google Scholar] [CrossRef]
- Campos-taberner, M.; García-haro, F.J.; Camps-valls, G.; Grau-muedra, G.; Nutini, F.; Crema, A.; Boschetti, M. Multitemporal and Multiresolution Leaf Area Index Retrieval for Operational Local Rice Crop Monitoring. Remote Sens. Environ. 2016, 187, 102–118. [Google Scholar] [CrossRef]
- Verrelst, J.; Rivera, J.P.; Veroustraete, F.; Muñoz-Marí, J.; Clevers, J.G.P.W.; Camps-Valls, G.; Moreno, J. Experimental Sentinel-2 LAI Estimation Using Parametric, Non-Parametric and Physical Retrieval Methods—A Comparison. ISPRS J. Photogramm. Remote Sens. 2015, 108, 260–272. [Google Scholar] [CrossRef]
- Thorp, K.R.; Gore, M.A.; Andrade-Sanchez, P.; Carmo-Silva, A.E.; Welch, S.M.; White, J.W.; French, A.N. Proximal Hyperspectral Sensing and Data Analysis Approaches for Field-Based Plant Phenomics. Comput. Electron. Agric. 2015, 118, 225–236. [Google Scholar] [CrossRef]
- Yang, L.; Deng, S.; Zhang, Z. New Spectral Model for Estimating Leaf Area Index Based on Gene Expression Programming. Comput. Electr. Eng. 2020, 83, 106604. [Google Scholar] [CrossRef]
- Su, W.; Zhang, M.; Bian, D.; Liu, Z.; Huang, J.; Wang, W. Phenotyping of Corn Plants Using Unmanned Aerial. Remote Sens. 2021, 11, 2021. [Google Scholar] [CrossRef]
- Chen, Q.; Zheng, B.; Chenu, K.; Chapman, S.C. A Generic Model to Estimate Wheat LAI over Growing Season Regardless of the Soil-Type Background. Plant Phenomics 2023, 5, 0055. [Google Scholar] [CrossRef] [PubMed]
- Dong, T.; Liu, J.; Liu, J.; He, L.; Wang, R.; Qian, B.; McNairn, H.; Powers, J.; Shi, Y.; Chen, J.M.; et al. Assessing the Consistency of Crop Leaf Area Index Derived from Seasonal Sentinel-2 and Landsat 8 Imagery over Manitoba, Canada. Agric. For. Meteorol. 2023, 332, 109357. [Google Scholar] [CrossRef]
- Xu, M.; Liu, R.; Chen, J.M.; Liu, Y.; Shang, R.; Ju, W.; Wu, C.; Huang, W. Retrieving Leaf Chlorophyll Content Using a Matrix-Based Vegetation Index Combination Approach. Remote Sens. Environ. 2019, 224, 60–73. [Google Scholar] [CrossRef]
- Zhang, M.; Su, W.; Fu, Y.; Zhu, D.; Xue, J.H.; Huang, J.; Wang, W.; Wu, J.; Yao, C. Super-Resolution Enhancement of Sentinel-2 Image for Retrieving LAI and Chlorophyll Content of Summer Corn. Eur. J. Agron. 2019, 111, 125938. [Google Scholar] [CrossRef]
- Punalekar, S.M.; Verhoef, A.; Quaife, T.L.; Humphries, D.; Bermingham, L.; Reynolds, C.K. Application of Sentinel-2A Data for Pasture Biomass Monitoring Using a Physically Based Radiative Transfer Model. Remote Sens. Environ. 2018, 218, 207–220. [Google Scholar] [CrossRef]
- Wang, S.; Gao, W.; Ming, J.; Li, L.; Xu, D.; Liu, S.; Lu, J. A TPE Based Inversion of PROSAIL for Estimating Canopy Biophysical and Biochemical Variables of Oilseed Rape. Comput. Electron. Agric. 2018, 152, 350–362. [Google Scholar] [CrossRef]
- Zhang, C.; Pattey, E.; Liu, J.; Cai, H.; Shang, J.; Dong, T. Retrieving Leaf and Canopy Water Content of Winter Wheat Using Vegetation Water Indices. IEEE J. Sel. Top. Appl. Earth Obs. Remote Sens. 2018, 11, 112–126. [Google Scholar] [CrossRef]
- Boschetti, M.; Busetto, L.; Ranghetti, L.; Haro, J.G.; Campos-Taberner, M.; Confalonieri, R. Testing Multi-Sensors Time Series of LAI Estimates to Monitor Rice Phenology: Preliminary Results. In Proceedings of the International Geoscience and Remote Sensing Symposium (IGARSS), Valencia, Spain, 22–27 July 2018; pp. 8221–8224. [Google Scholar]
- Danner, M.; Berger, K.; Wocher, M.; Mauser, W.; Hank, T. Retrieval of Biophysical Crop Variables from Multi-Angular Canopy Spectroscopy. Remote Sens. 2017, 9, 726. [Google Scholar] [CrossRef]
- Kimm, H.; Guan, K.; Jiang, C.; Peng, B.; Gentry, L.F.; Wilkin, S.C.; Wang, S.; Cai, Y.; Bernacchi, C.J.; Peng, J.; et al. Deriving High-Spatiotemporal-Resolution Leaf Area Index for Agroecosystems in the U.S. Corn Belt Using Planet Labs CubeSat and STAIR Fusion Data. Remote Sens. Environ. 2020, 239, 111615. [Google Scholar] [CrossRef]
- Jiang, J.; Weiss, M.; Liu, S.; Baret, F. Effective GAI Is Best Estimated from Reflectance Observations as Compared to GAI and LAI: Demonstration for Wheat and Maize Crops Based on 3D Radiative Transfer Simulations. Field Crops Res. 2022, 283, 108538. [Google Scholar] [CrossRef]
- Wang, L.; Chen, S.; Peng, Z.; Huang, J.; Wang, C.; Jiang, H.; Zheng, Q.; Li, D. Phenology Effects on Physically Based Estimation of Paddy Rice Canopy Traits from Uav Hyperspectral Imagery. Remote Sens. 2021, 13, 1792. [Google Scholar] [CrossRef]
- Longmire, A.R.; Poblete, T.; Hunt, J.R.; Chen, D.; Zarco-Tejada, P.J. Assessment of Crop Traits Retrieved from Airborne Hyperspectral and Thermal Remote Sensing Imagery to Predict Wheat Grain Protein Content. ISPRS J. Photogramm. Remote Sens. 2022, 193, 284–298. [Google Scholar] [CrossRef]
- Zhang, Y.; Hui, J.; Qin, Q.; Sun, Y.; Zhang, T.; Sun, H.; Li, M. Transfer-Learning-Based Approach for Leaf Chlorophyll Content Estimation of Winter Wheat from Hyperspectral Data. Remote Sens. Environ. 2021, 267, 112724. [Google Scholar] [CrossRef]
- Berger, K.; Verrelst, J.; Féret, J.B.; Hank, T.; Wocher, M.; Mauser, W.; Camps-Valls, G. Retrieval of Aboveground Crop Nitrogen Content with a Hybrid Machine Learning Method. Int. J. Appl. Earth Obs. Geoinf. 2020, 92, 102174. [Google Scholar] [CrossRef]
- Verrelst, J.; Rivera-Caicedo, J.P.; Reyes-Muñoz, P.; Morata, M.; Amin, E.; Tagliabue, G.; Panigada, C.; Hank, T.; Berger, K. Mapping Landscape Canopy Nitrogen Content from Space Using PRISMA Data. ISPRS J. Photogramm. Remote Sens. 2021, 178, 382–395. [Google Scholar] [CrossRef] [PubMed]
- Sun, J.; Wang, L.; Shi, S.; Li, Z.; Yang, J.; Gong, W.; Wang, S.; Tagesson, T. Leaf Pigment Retrieval Using the PROSAIL Model: Influence of Uncertainty in Prior Canopy-Structure Information. Crop J. 2022, 10, 1251–1263. [Google Scholar] [CrossRef]
- Tomíček, J.; Mišurec, J.; Lukeš, P. Prototyping a Generic Algorithm for Crop Parameter Retrieval across the Season Using Radiative Transfer Model Inversion and Sentinel-2 Satellite Observations. Remote Sens. 2021, 13, 3659. [Google Scholar] [CrossRef]
- Gutman, G.; Skakun, S.; Gitelson, A. Revisiting the Use of Red and Near-Infrared Reflectances in Vegetation Studies and Numerical Climate Models. Sci. Remote Sens. 2021, 4, 100025. [Google Scholar] [CrossRef]
- Cheng, J.; Han, S.; Verrelst, J.; Zhao, C.; Zhang, N.; Zhao, Y.; Lei, L.; Wang, H.; Yang, G.; Yang, H. Deciphering Maize Vertical Leaf Area Profiles by Fusing Spectral Imagery Data and a Bell-Shaped Function. Int. J. Appl. Earth Obs. Geoinf. 2023, 120, 103355. [Google Scholar] [CrossRef]
- Tagliabue, G.; Boschetti, M.; Bramati, G.; Candiani, G.; Colombo, R.; Nutini, F.; Pompilio, L.; Rivera-Caicedo, J.P.; Rossi, M.; Rossini, M.; et al. Hybrid Retrieval of Crop Traits from Multi-Temporal PRISMA Hyperspectral Imagery. ISPRS J. Photogramm. Remote Sens. 2022, 187, 362–377. [Google Scholar] [CrossRef] [PubMed]
- Gao, L.; Darvishzadeh, R.; Somers, B.; Johnson, B.A.; Wang, Y.; Verrelst, J.; Wang, X.; Atzberger, C. Hyperspectral Response of Agronomic Variables to Background Optical Variability: Results of a Numerical Experiment. Agric. For. Meteorol. 2022, 326, 109178. [Google Scholar] [CrossRef] [PubMed]
- Gitelson, A.; Arkebauer, T.; Viña, A.; Skakun, S.; Inoue, Y. Evaluating Plant Photosynthetic Traits via Absorption Coefficient in the Photosynthetically Active Radiation Region. Remote Sens. Environ. 2021, 258, 112401. [Google Scholar] [CrossRef]
- Estévez, J.; Salinero-Delgado, M.; Berger, K.; Pipia, L.; Rivera-Caicedo, J.P.; Wocher, M.; Reyes-Muñoz, P.; Tagliabue, G.; Boschetti, M.; Verrelst, J. Gaussian Processes Retrieval of Crop Traits in Google Earth Engine Based on Sentinel-2 Top-of-Atmosphere Data. Remote Sens. Environ. 2022, 273, 112958. [Google Scholar] [CrossRef]
- Roosjen, P.P.J.; Brede, B.; Suomalainen, J.M.; Bartholomeus, H.M.; Kooistra, L.; Clevers, J.G.P.W. Improved Estimation of Leaf Area Index and Leaf Chlorophyll Content of a Potato Crop Using Multi-Angle Spectral Data—Potential of Unmanned Aerial Vehicle Imagery. Int. J. Appl. Earth Obs. Geoinf. 2018, 66, 14–26. [Google Scholar] [CrossRef]
- Jay, S.; Baret, F.; Dutartre, D.; Malatesta, G.; Héno, S.; Comar, A.; Weiss, M.; Maupas, F. Exploiting the Centimeter Resolution of UAV Multispectral Imagery to Improve Remote-Sensing Estimates of Canopy Structure and Biochemistry in Sugar Beet Crops. Remote Sens. Environ. 2019, 231, 110898. [Google Scholar] [CrossRef]
- Féret, J.B.; Berger, K.; de Boissieu, F.; Malenovský, Z. PROSPECT-PRO for Estimating Content of Nitrogen-Containing Leaf Proteins and Other Carbon-Based Constituents. Remote Sens. Environ. 2021, 252, 112173. [Google Scholar] [CrossRef]
- Ren, Y.; Huang, W.; Ye, H.; Zhou, X.; Ma, H. International Journal of Applied Earth Observations and Geoinformation Quantitative Identification of Yellow Rust in Winter Wheat with a New Spectral Index: Development and Validation Using Simulated and Experimental Data. Int. J. Appl. Earth Obs. Geoinf. 2021, 102, 102384. [Google Scholar] [CrossRef]
- Wan, L.; Zhang, J.; Xu, Y.; Huang, Y.; Zhou, W.; Jiang, L.; He, Y.; Cen, H. PROSDM: Applicability of PROSPECT Model Coupled with Spectral Derivatives and Similarity Metrics to Retrieve Leaf Biochemical Traits from Bidirectional Reflectance. Remote Sens. Environ. 2021, 267, 112761. [Google Scholar] [CrossRef]
- Sun, J.; Shi, S.; Yang, J.; Chen, B.; Gong, W.; Du, L.; Mao, F.; Song, S. Estimating Leaf Chlorophyll Status Using Hyperspectral Lidar Measurements by PROSPECT Model Inversion. Remote Sens. Environ. 2018, 212, 1–7. [Google Scholar] [CrossRef]
- Li, D.; Cheng, T.; Yao, X.; Zhang, Z.; Tian, Y.; Zhu, Y.; Cao, W. Wavelet-Based PROSPECT Inversion for Retrieving Leaf Mass per Area (LMA) and Equivalent Water Thickness (EWT) from Leaf Reflectance. In Proceedings of the International Geoscience and Remote Sensing Symposium (IGARSS), Beijing, China, 10–15 July 2016; IEEE: Piscataway, NJ, USA, 2016; pp. 6910–6913. [Google Scholar]
- Candiani, G.; Tagliabue, G.; Panigada, C.; Verrelst, J.; Picchi, V.; Caicedo, J.P.R.; Boschetti, M. Evaluation of Hybrid Models to Estimate Chlorophyll and Nitrogen Content of Maize Crops in the Framework of the Future CHIME Mission. Remote Sens. 2022, 14, 1792. [Google Scholar] [CrossRef] [PubMed]
- Fang, M.; Ju, W.; Zhan, W.; Cheng, T.; Qiu, F.; Wang, J. A New Spectral Similarity Water Index for the Estimation of Leaf Water Content from Hyperspectral Data of Leaves. Remote Sens. Environ. 2017, 196, 13–27. [Google Scholar] [CrossRef]
- Wang, Z.; Féret, J.B.; Liu, N.; Sun, Z.; Yang, L.; Geng, S.; Zhang, H.; Chlus, A.; Kruger, E.L.; Townsend, P.A. Generality of Leaf Spectroscopic Models for Predicting Key Foliar Functional Traits across Continents: A Comparison between Physically- and Empirically-Based Approaches. Remote Sens. Environ. 2023, 293, 113614. [Google Scholar] [CrossRef]
- Morel, J.; Jay, S.; Féret, J.B.; Bakache, A.; Bendoula, R.; Carreel, F.; Gorretta, N. Exploring the Potential of PROCOSINE and Close-Range Hyperspectral Imaging to Study the Effects of Fungal Diseases on Leaf Physiology. Sci. Rep. 2018, 8, 15933. [Google Scholar] [CrossRef] [PubMed]
- Li, J.; Wijewardane, N.K.; Ge, Y.; Shi, Y. Improved Chlorophyll and Water Content Estimations at Leaf Level with a Hybrid Radiative Transfer and Machine Learning Model. Comput. Electron. Agric. 2023, 206, 107669. [Google Scholar] [CrossRef]
- Scodellaro, R.; Cesana, I.; D’Alfonso, L.; Bouzin, M.; Collini, M.; Chirico, G.; Colombo, R.; Miglietta, F.; Celesti, M.; Schuettemeyer, D.; et al. A Novel Hybrid Machine Learning Phasor-Based Approach to Retrieve a Full Set of Solar-Induced Fluorescence Metrics and Biophysical Parameters. Remote Sens. Environ. 2022, 280, 113196. [Google Scholar] [CrossRef]
- Shan, N.; Xi, L.; Zhang, Q.; Lin, N.; Xu, D.; Cao, B. Better Revisiting Chlorophyll Content Retrieval with Varying Senescent Material and Solar-Induced Chlorophyll Fluorescence Simulation on Paddy Rice during the Entire Growth Stages. Ecol. Indic. 2021, 130, 108057. [Google Scholar] [CrossRef]
- Pascual-Venteo, A.B.; Portalés, E.; Berger, K.; Tagliabue, G.; Garcia, J.L.; Pérez-Suay, A.; Rivera-Caicedo, J.P.; Verrelst, J. Prototyping Crop Traits Retrieval Models for CHIME: Dimensionality Reduction Strategies Applied to PRISMA Data. Remote Sens. 2022, 14, 2448. [Google Scholar] [CrossRef]
- Prikaziuk, E.; Ntakos, G.; ten Den, T.; Reidsma, P.; van der Wal, T.; van der Tol, C. Using the SCOPE Model for Potato Growth, Productivity and Yield Monitoring under Different Levels of Nitrogen Fertilization. Int. J. Appl. Earth Obs. Geoinf. 2022, 114, 102997. [Google Scholar] [CrossRef]
- Wang, S.; Guan, K.; Zhang, C.; Jiang, C.; Zhou, Q.; Li, K.; Qin, Z.; Ainsworth, E.A.; He, J.; Wu, J.; et al. Airborne Hyperspectral Imaging of Cover Crops through Radiative Transfer Process-Guided Machine Learning. Remote Sens. Environ. 2023, 285, 113386. [Google Scholar] [CrossRef]
- Saavedra, P.; Simmer, C.; Schalge, B. Evaluation of Modeled High Resolution Virtual Brightness Temperatures Compared to Space-Borne Observations for the Neckar Catchment. In Proceedings of the 14th Specialist Meeting on Microwave Radiometry and Remote Sensing of the Environment, MicroRad 2016—Proceedings, Espoo, Finland, 11–14 April 2016; IEEE: Piscataway, NJ, USA, 2016; pp. 85–90. [Google Scholar]
- Yuzugullu, O.; Erten, E.; Hajnsek, I. Morphology Estimation of Rice Fields Using X-Band PolSAR Data. In Proceedings of the International Geoscience and Remote Sensing Symposium (IGARSS), Beijing, China, 10–15 July 2016; IEEE: Piscataway, NJ, USA, 2016; pp. 7121–7124. [Google Scholar]
- Schirrmann, M.; Hamdorf, A.; Giebel, A.; Dammer, K.H.; Garz, A. A Mobile Sensor for Leaf Area Index Estimation from Canopy Light Transmittance in Wheat Crops. Biosyst. Eng. 2015, 140, 23–33. [Google Scholar] [CrossRef]
- Houborg, R.; McCabe, M.F. A Hybrid Training Approach for Leaf Area Index Estimation via Cubist and Random Forests Machine-Learning. ISPRS J. Photogramm. Remote Sens. 2018, 135, 173–188. [Google Scholar] [CrossRef]
- Suarez, L.; Zhang, P.; Sun, J.; Wang, Y.; Poblete, T.; Hornero, A.; Zarco-Tejada, P.J. Assessing Wine Grape Quality Parameters Using Plant Traits Derived from Physical Model Inversion of Hyperspectral Imagery. Agric. For. Meteorol. 2021, 306, 108445. [Google Scholar] [CrossRef]
- Wang, Y.; Suarez, L.; Poblete, T.; Gonzalez-Dugo, V.; Ryu, D.; Zarco-Tejada, P.J. Evaluating the Role of Solar-Induced Fluorescence (SIF) and Plant Physiological Traits for Leaf Nitrogen Assessment in Almond Using Airborne Hyperspectral Imagery. Remote Sens. Environ. 2022, 279, 113141. [Google Scholar] [CrossRef]
- Chen, Q.; Zheng, B.; Chen, T.; Chapman, S.C. Integrating a Crop Growth Model and Radiative Transfer Model to Improve Estimation of Crop Traits Based on Deep Learning. J. Exp. Bot. 2022, 73, 6558–6574. [Google Scholar] [CrossRef]


| Years | Crop Yield Prediction | Crop Traits Retrieval | Total | |||
|---|---|---|---|---|---|---|
| RTM | Integrated with CGM | LAI | LAI and Others (CWC, CCC, etc.) | Other than LAI | ||
| 2023 | 0 | 0 | 2 | 3 | 3 | 8 |
| 2022 | 2 | 2 | 3 | 9 | 5 | 21 |
| 2021 | 1 | 1 | 1 | 5 | 7 | 15 |
| 2020 | 0 | 3 | 2 | 0 | 5 | 10 |
| 2019 | 0 | 1 | 2 | 2 | 3 | 8 |
| 2018 | 0 | 2 | 2 | 4 | 3 | 11 |
| 2017 | 0 | 0 | 1 | 2 | 1 | 4 |
| 2016 | 0 | 1 | 1 | 1 | 5 | 8 |
| 2015 | 1 | 1 | 3 | 1 | 0 | 6 |
| Total | 4 | 11 | 17 | 27 | 32 | 91 |
| Database Source | Crop Yield Prediction | Crop Traits Retrieval | Total | |||
|---|---|---|---|---|---|---|
| RTM | Integrated with CGMs | LAI | LAI and Others (CWC, CCC, etc.) | Other than LAI | ||
| ScienceDirect | 2 | 5 | 11 | 16 | 19 | 53 |
| MDPI | 1 | 4 | 2 | 5 | 1 | 13 |
| Scopus | 1 | 2 | 3 | 6 | 6 | 18 |
| IEEEXplore | 0 | 0 | 1 | 0 | 5 | 6 |
| Nature | 0 | 0 | 0 | 0 | 1 | 1 |
| Total | 4 | 11 | 17 | 27 | 32 | 91 |
| Paper | Summary |
|---|---|
| Crop Yield Prediction based on RTMs | |
| [45] | The study proposed early winter wheat yield forecasting under low-information systems of crop cultivars, management practices and uncertain weather conditions. They used the semi-empirical radiative transfer model PILOTE to assimilate green LAI using the particle filtering method. This data assimilation resulted in accuracy improvements for LAI estimation (~1 to 0.2 m2/m2) and crop yield prediction (3 to 6%). |
| [44] | The Random Forest (RF) method was employed to emulate RTM (SCOPE) simulations using machine learning surrogate models (RTM-RF). RTM-RF-based analysis of LAI and PLSR leaf traits demonstrated impressive precision in predicting canopy-level traits (leaf traits × LAI) retrieval, including canopy chlorophyll (R2 = 0.80), nitrogen (R2 = 0.85) and Vmax,27 (R2 = 0.82), using airborne hyperspectral images. Notably, R2 between photosynthetic rate and maize grain yield was highest with 0.81 and lowest with 0.68 between soil nitrogen fertilization rates and yield. |
| [21] | The validation of PROSAIL for LAI retrieval yielded an R2 value of 0.5 with an RMSE of 0.8 m2/m2 against ground LAI using hyperspectral aerial images via vegetation index techniques. Grain yield based on normalized difference red edge (NDRE) showed the highest accuracies with R2 values in the range of 0.62 to 0.83 for two maize fields having different irrigation techniques. |
| [43] | Crop traits LAI, FAPAR, Fcover and Cab were estimated through applying neural network inversion of the PROSAIL model to observe SPOT data acquisition time and resolution (10 and 20 m) influence on wheat yield. Spatial resolution of 10 m and data acquisition between the stem elongation and booting stages of wheat were most suitable to obtain an RMSE of about 1 t ha−1. |
| Crop Yield Prediction based on RTM and CGM integration | |
| [23] | Within the framework of the ESA-MOST Dragon 4 program, findings indicated that LAI, obtained through the inversion of RTM and subsequently integrated into a crop growth model (e.g., SAFY), offered a more precise means of assessing yields. RMSE was substantially lower for assimilation, at 1.14 t ha−1, compared to 4.42 t ha−1 for the open-loop model. |
| [19] | A novel prototype system for forecasting wheat yields with minimal data inputs was created via integrating remote sensing data to retrieve LAI using PROSAIL model inversion, as well as weather forecasts, into the InfoCrop-Wheat crop simulation model (CSM). The PROSAIL inversion yielded an RMSE of 0.56 m2/m2 in LAI retrievals. A normalized error (NE) of 6–8% in grain yield was observed with measured inputs during model validation. The suggested framework demonstrated a higher NE of only 3% in dry matter and 1% in grain yield as compared to measured inputs. |
| [46] | A spatial modeling framework known as Geo-CropSim was developed, having three distinct features of pixel level model initialization, PROSAIL and EPIC growth model integration based on LAI and stress adjustment. The results indicated that the RMSE of Geo-CropSim’s yield estimates, based on USDA-NASS reported yields, was notably lower, with values of 1.22 Mg ha−1 for corn and 0.46 Mg ha−1 for soybeans, as compared to original EPIC estimates with RMSE values of 2.18 Mg ha−1 for corn and 0.98 Mg ha−1 for soybeans. |
| [51,52] | The radiation effect of aerosols on maize production was investigated from 2001 to 2014 using AErosol RObotic NETwork (AERONET) data, a radiative transfer model (6S) and the Agricultural Production Systems sIMulator (APSIM) model. Results revealed that the aerosols reduced direct solar radiation, causing maize yield reduction in the range of 1.55% for the Taihu station to 21.12% in the Nanjing AERONET station. |
| [47] | A hybrid approach to retrieving FVC was calibrated on 2017–18 data through the integration of PROSAIL and the Aquacrop-OS model. The retrieval accuracy of FVC during the validation process on 2018–19 data, based on VENµS images, yielded R2 values ranging from 0.69 to 0.86 and RMSE values between 0.15 and 0.44. Pixelwise predictions of durum wheat yield exhibited relatively low errors, with an RMSE of 1.51 t ha−1 and R2 of 0.11 with a tendency of overestimation. |
| [48] | Estimates of winter wheat (Triticum aestivum) yield at the country level in China were derived using three different datasets: 30 m Landsat reflectance, 8-day 1 km MODIS surface reflectance and 8-day 30 m synthetic KS reflectance. Data was fed into the coupled WOFOST–PROSAIL model using LAI. The results showed that synthetic KS reflectance data provided the most accurate yield estimates, with R2 values of 0.44, 0.39 and 0.30, and RMSE values of 598, 1288 and 595 kg ha−1 for the years 2009, 2013 and 2014, respectively. |
| [54] | The Breathing Earth System Simulator (BESS) was developed via incorporating an assimilate allocation module based on satellite remote sensing data and included FLiES, a one-dimensional atmospheric radiative transfer model. BESS-Rice simulated Gross Primary Productivity (GPP) and the dynamics of dry matter partitioning, and estimated rice yields with an average RMSE of 534.8 kg ha−1 (7.7%) for annual yield. |
| [49] | Multitemporal LAI maps were generated using MODIS reflectance data through the application of an inverted RTM. These LAI map products were masked out for non-rice areas identified via SAR data using MAPScape-RICE. The ORYZA crop growth model, assisted by the Rice Yield Estimation System (Rice-YES), effectively and accurately estimated rice yields with RMSE values of 0.30 and 0.46 t ha−1 for the spring and summer, respectively, in 2016. |
| [50] | The PROSAIL model was integrated with remote sensing data and a growth model (WheatGrow) to create a LUT that correlates Vegetation Indices (VIs) with parameters (sowing date, sowing rate and nitrogen rate) based on the coupling model. Accurate predictions were achieved with three to four high-resolution images acquired during the late jointing to initial filling stages. RRMSE values of 17.8%, 20.3% and less than 10% for LAI, leaf nitrogen accumulation and grain yield were observed, respectively. |
| [53] | A hydro-agroecological model (PROMET) was coupled with a radiative transfer model (SLC) to retrieve the temporal and spatial dynamics of crop growth, particularly of the leaf area index from Earth Observation (EO), on agriculturally managed fields. Field samples of winter wheat for the years 2004, 2010 and 2011 validated the temporal dynamics of the simulations (avg. R2 = 0.93) on a >700 ha area with a calibrated combine harvester to achieve spatial yield assessment with an avg. RMSE of 1.15 t ha−1. |
Disclaimer/Publisher’s Note: The statements, opinions and data contained in all publications are solely those of the individual author(s) and contributor(s) and not of MDPI and/or the editor(s). MDPI and/or the editor(s) disclaim responsibility for any injury to people or property resulting from any ideas, methods, instructions or products referred to in the content. |
© 2023 by the authors. Licensee MDPI, Basel, Switzerland. This article is an open access article distributed under the terms and conditions of the Creative Commons Attribution (CC BY) license (https://creativecommons.org/licenses/by/4.0/).
Share and Cite
Ishaq, R.A.F.; Zhou, G.; Tian, C.; Tan, Y.; Jing, G.; Jiang, H.; Obaid-ur-Rehman. A Systematic Review of Radiative Transfer Models for Crop Yield Prediction and Crop Traits Retrieval. Remote Sens. 2024, 16, 121. https://doi.org/10.3390/rs16010121
Ishaq RAF, Zhou G, Tian C, Tan Y, Jing G, Jiang H, Obaid-ur-Rehman. A Systematic Review of Radiative Transfer Models for Crop Yield Prediction and Crop Traits Retrieval. Remote Sensing. 2024; 16(1):121. https://doi.org/10.3390/rs16010121
Chicago/Turabian StyleIshaq, Rana Ahmad Faraz, Guanhua Zhou, Chen Tian, Yumin Tan, Guifei Jing, Hongzhi Jiang, and Obaid-ur-Rehman. 2024. "A Systematic Review of Radiative Transfer Models for Crop Yield Prediction and Crop Traits Retrieval" Remote Sensing 16, no. 1: 121. https://doi.org/10.3390/rs16010121
APA StyleIshaq, R. A. F., Zhou, G., Tian, C., Tan, Y., Jing, G., Jiang, H., & Obaid-ur-Rehman. (2024). A Systematic Review of Radiative Transfer Models for Crop Yield Prediction and Crop Traits Retrieval. Remote Sensing, 16(1), 121. https://doi.org/10.3390/rs16010121