

Polar Amplification in the Earth’s Three Poles Based on MODIS Land Surface Temperatures

Abstract
:1. Introduction
2. Materials and Methods
2.1. Data
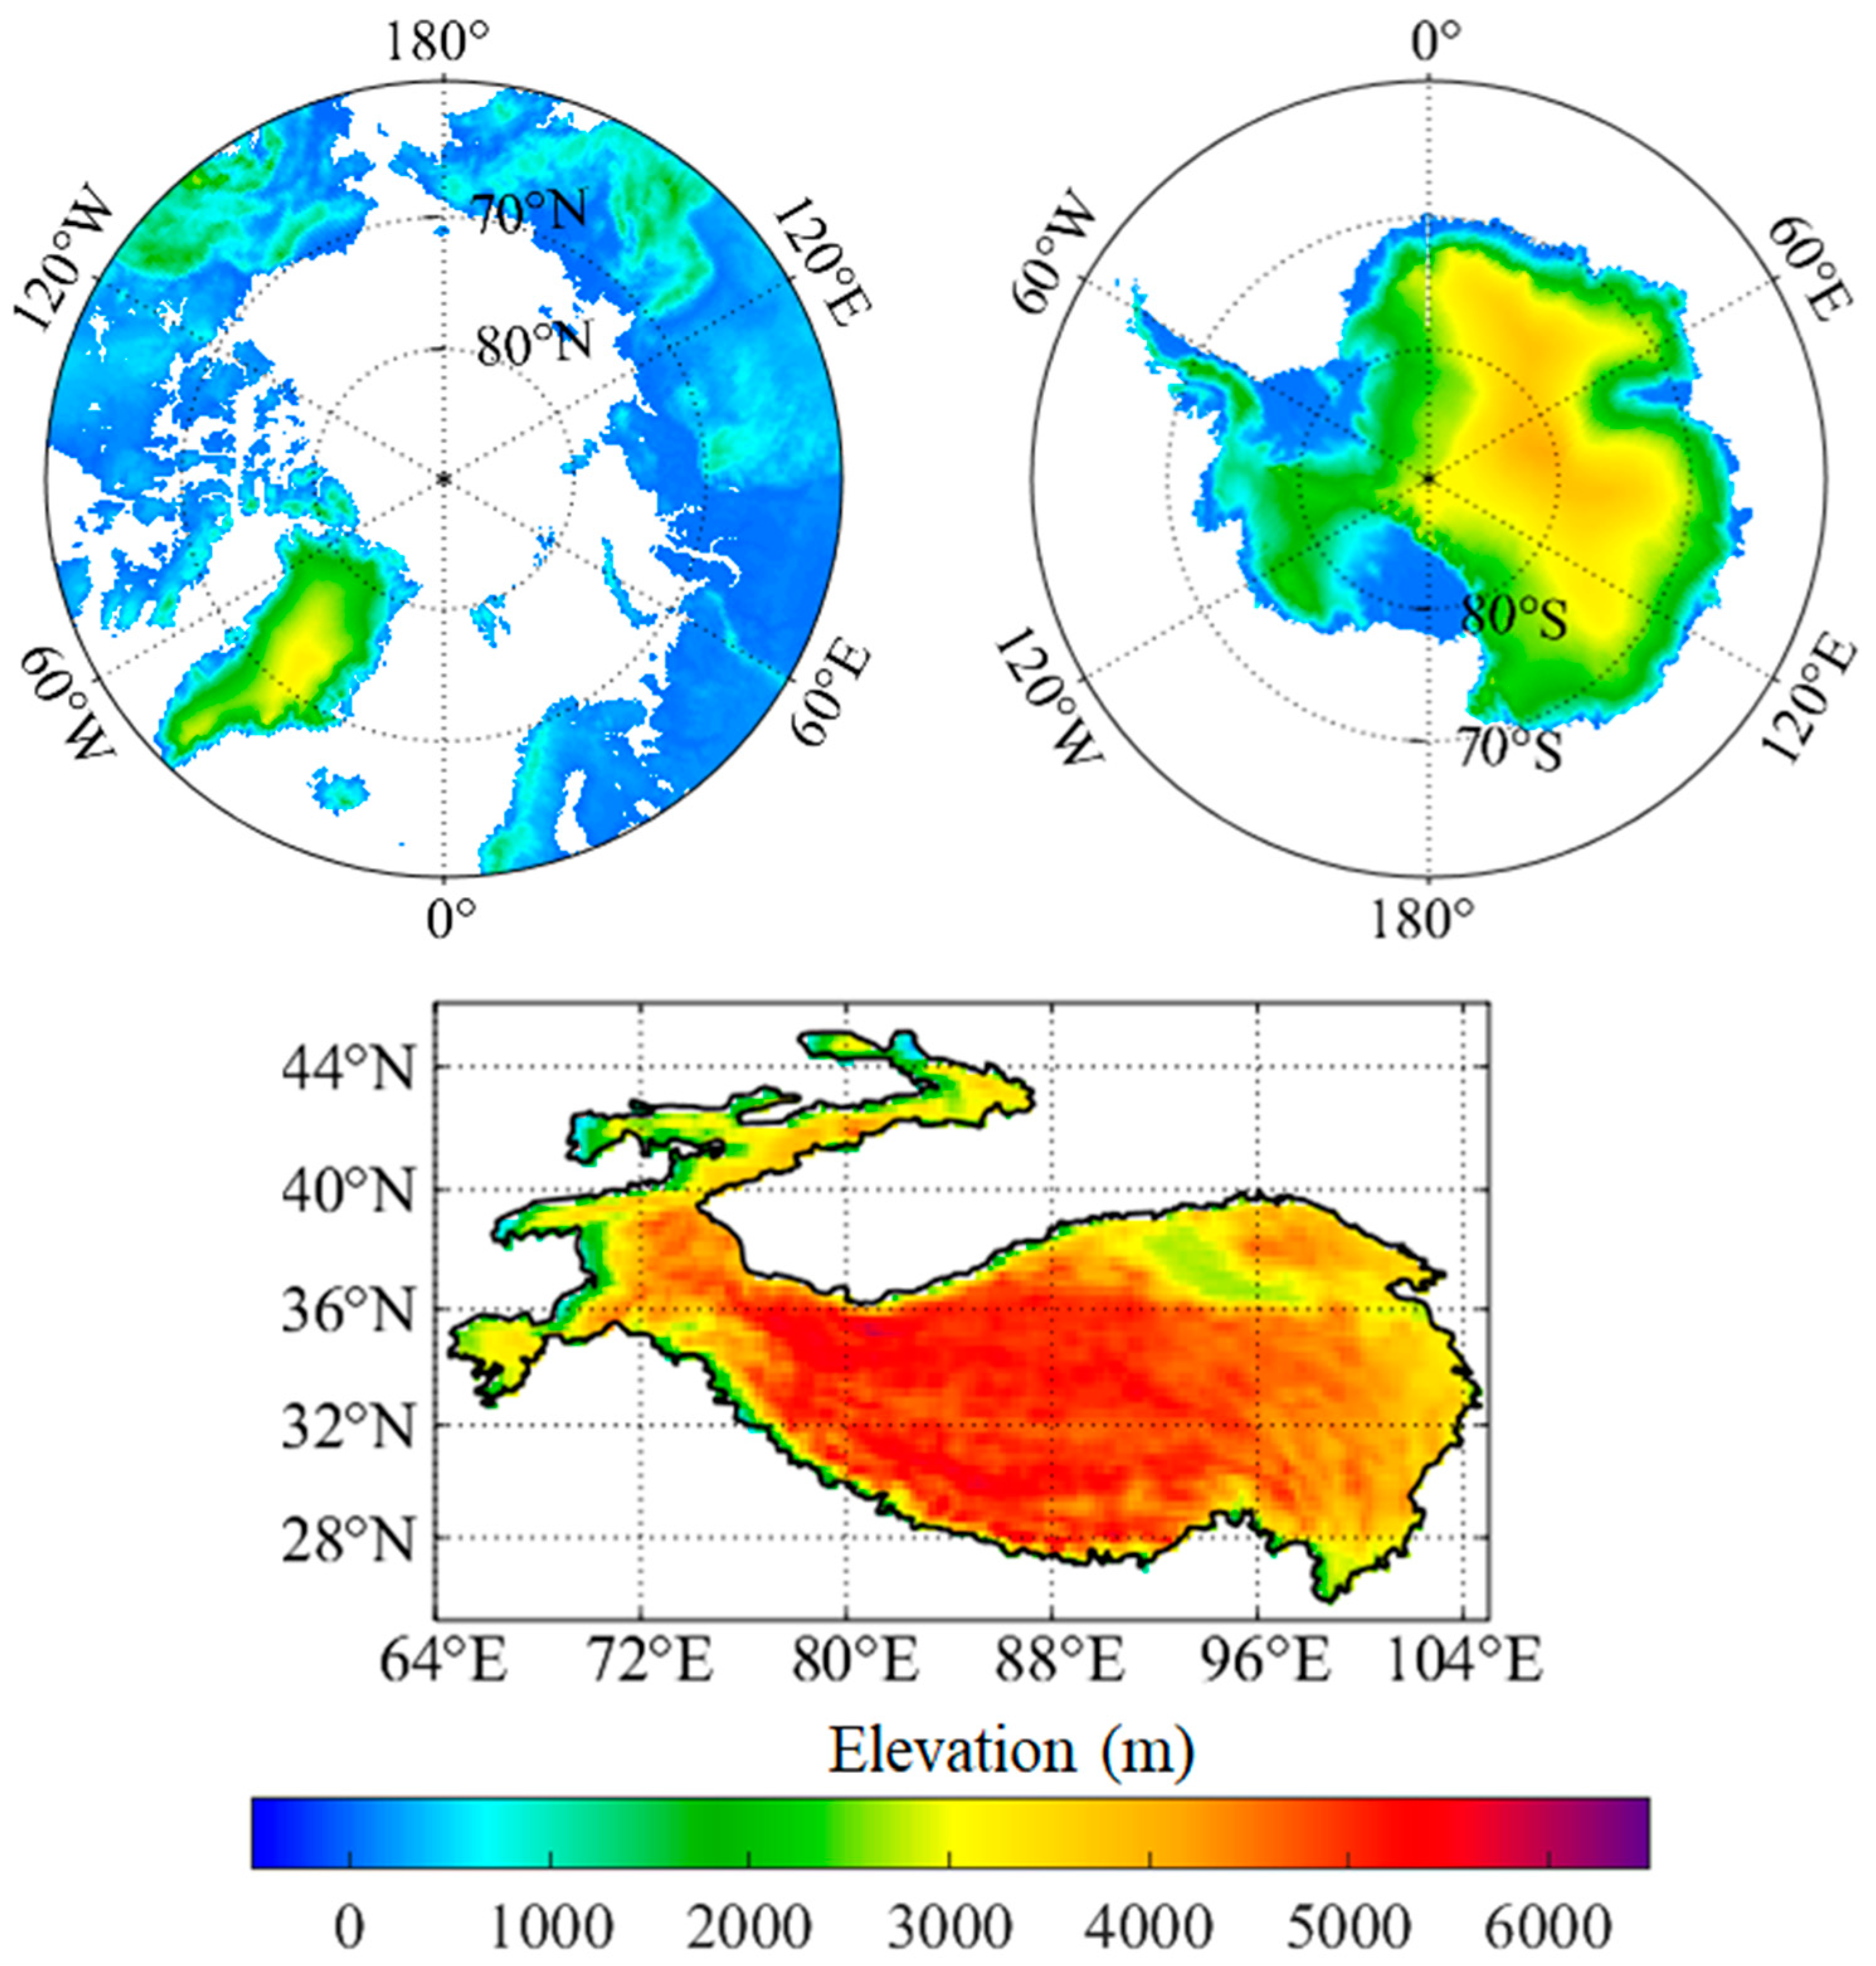
2.2. Study Areas
2.3. Methods
3. Results
3.1. Performance of MODIS Observations in Representing Land Surface Temperature at the Earth’s Three Poles
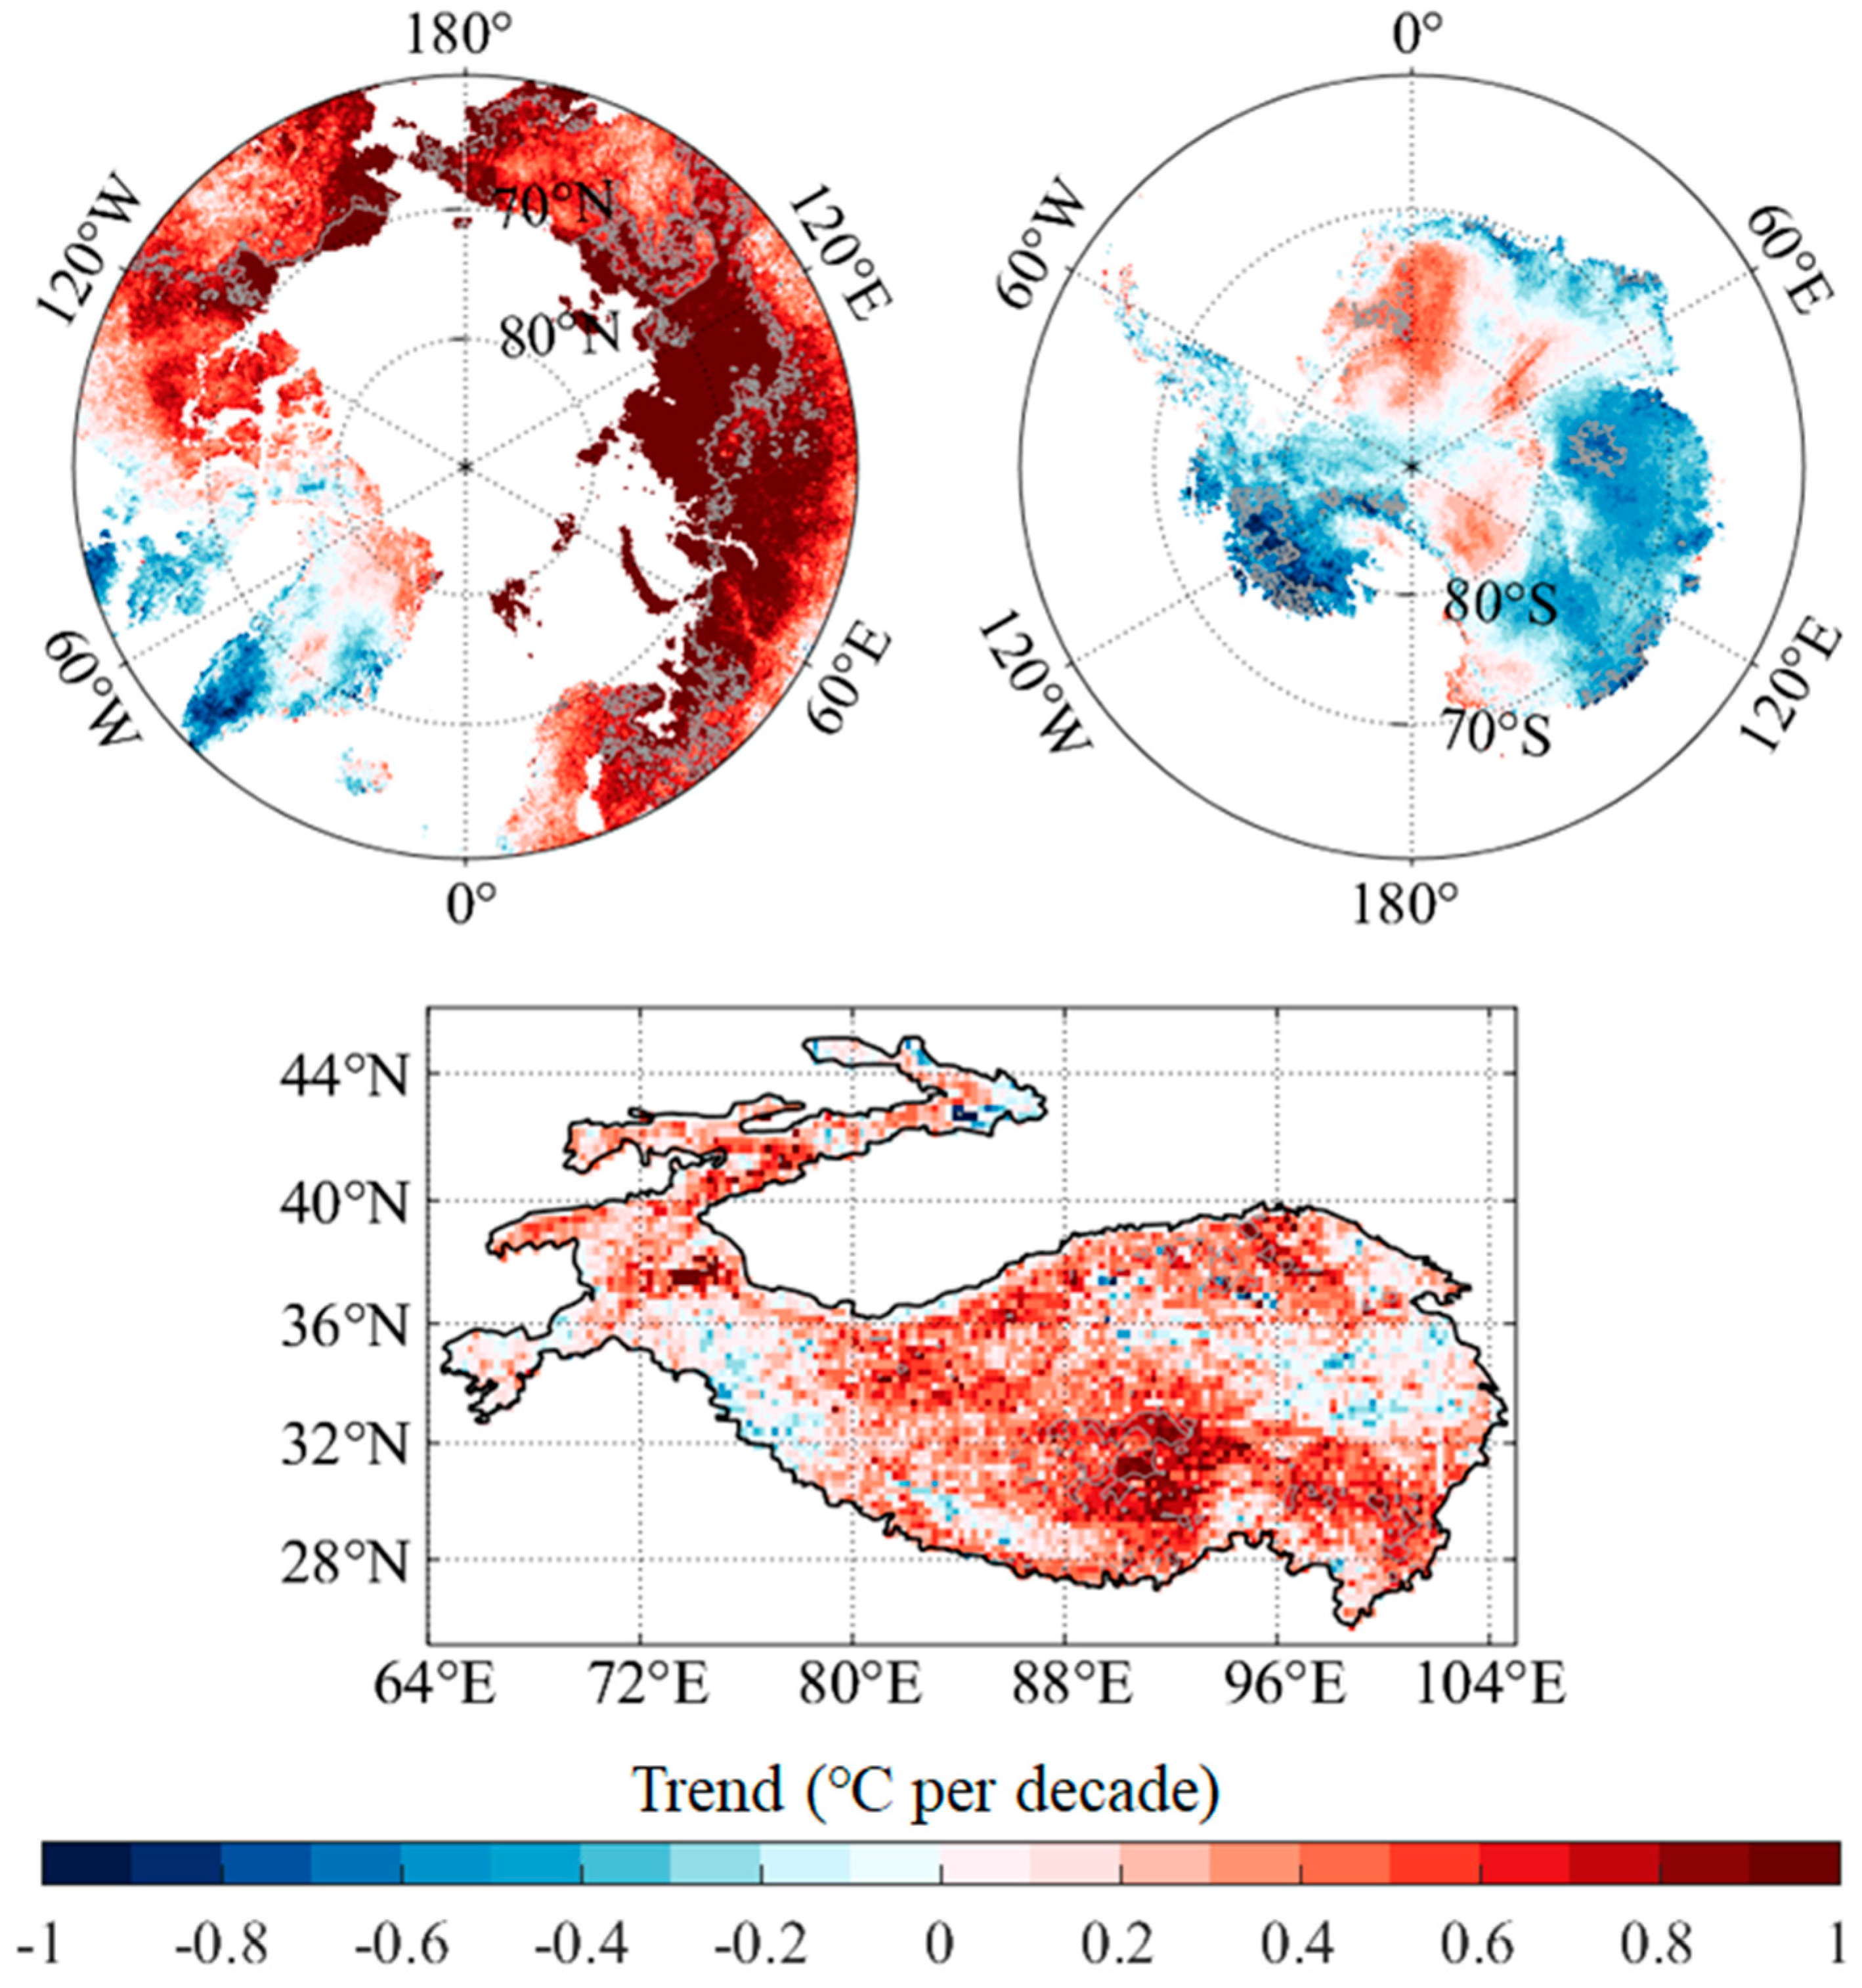
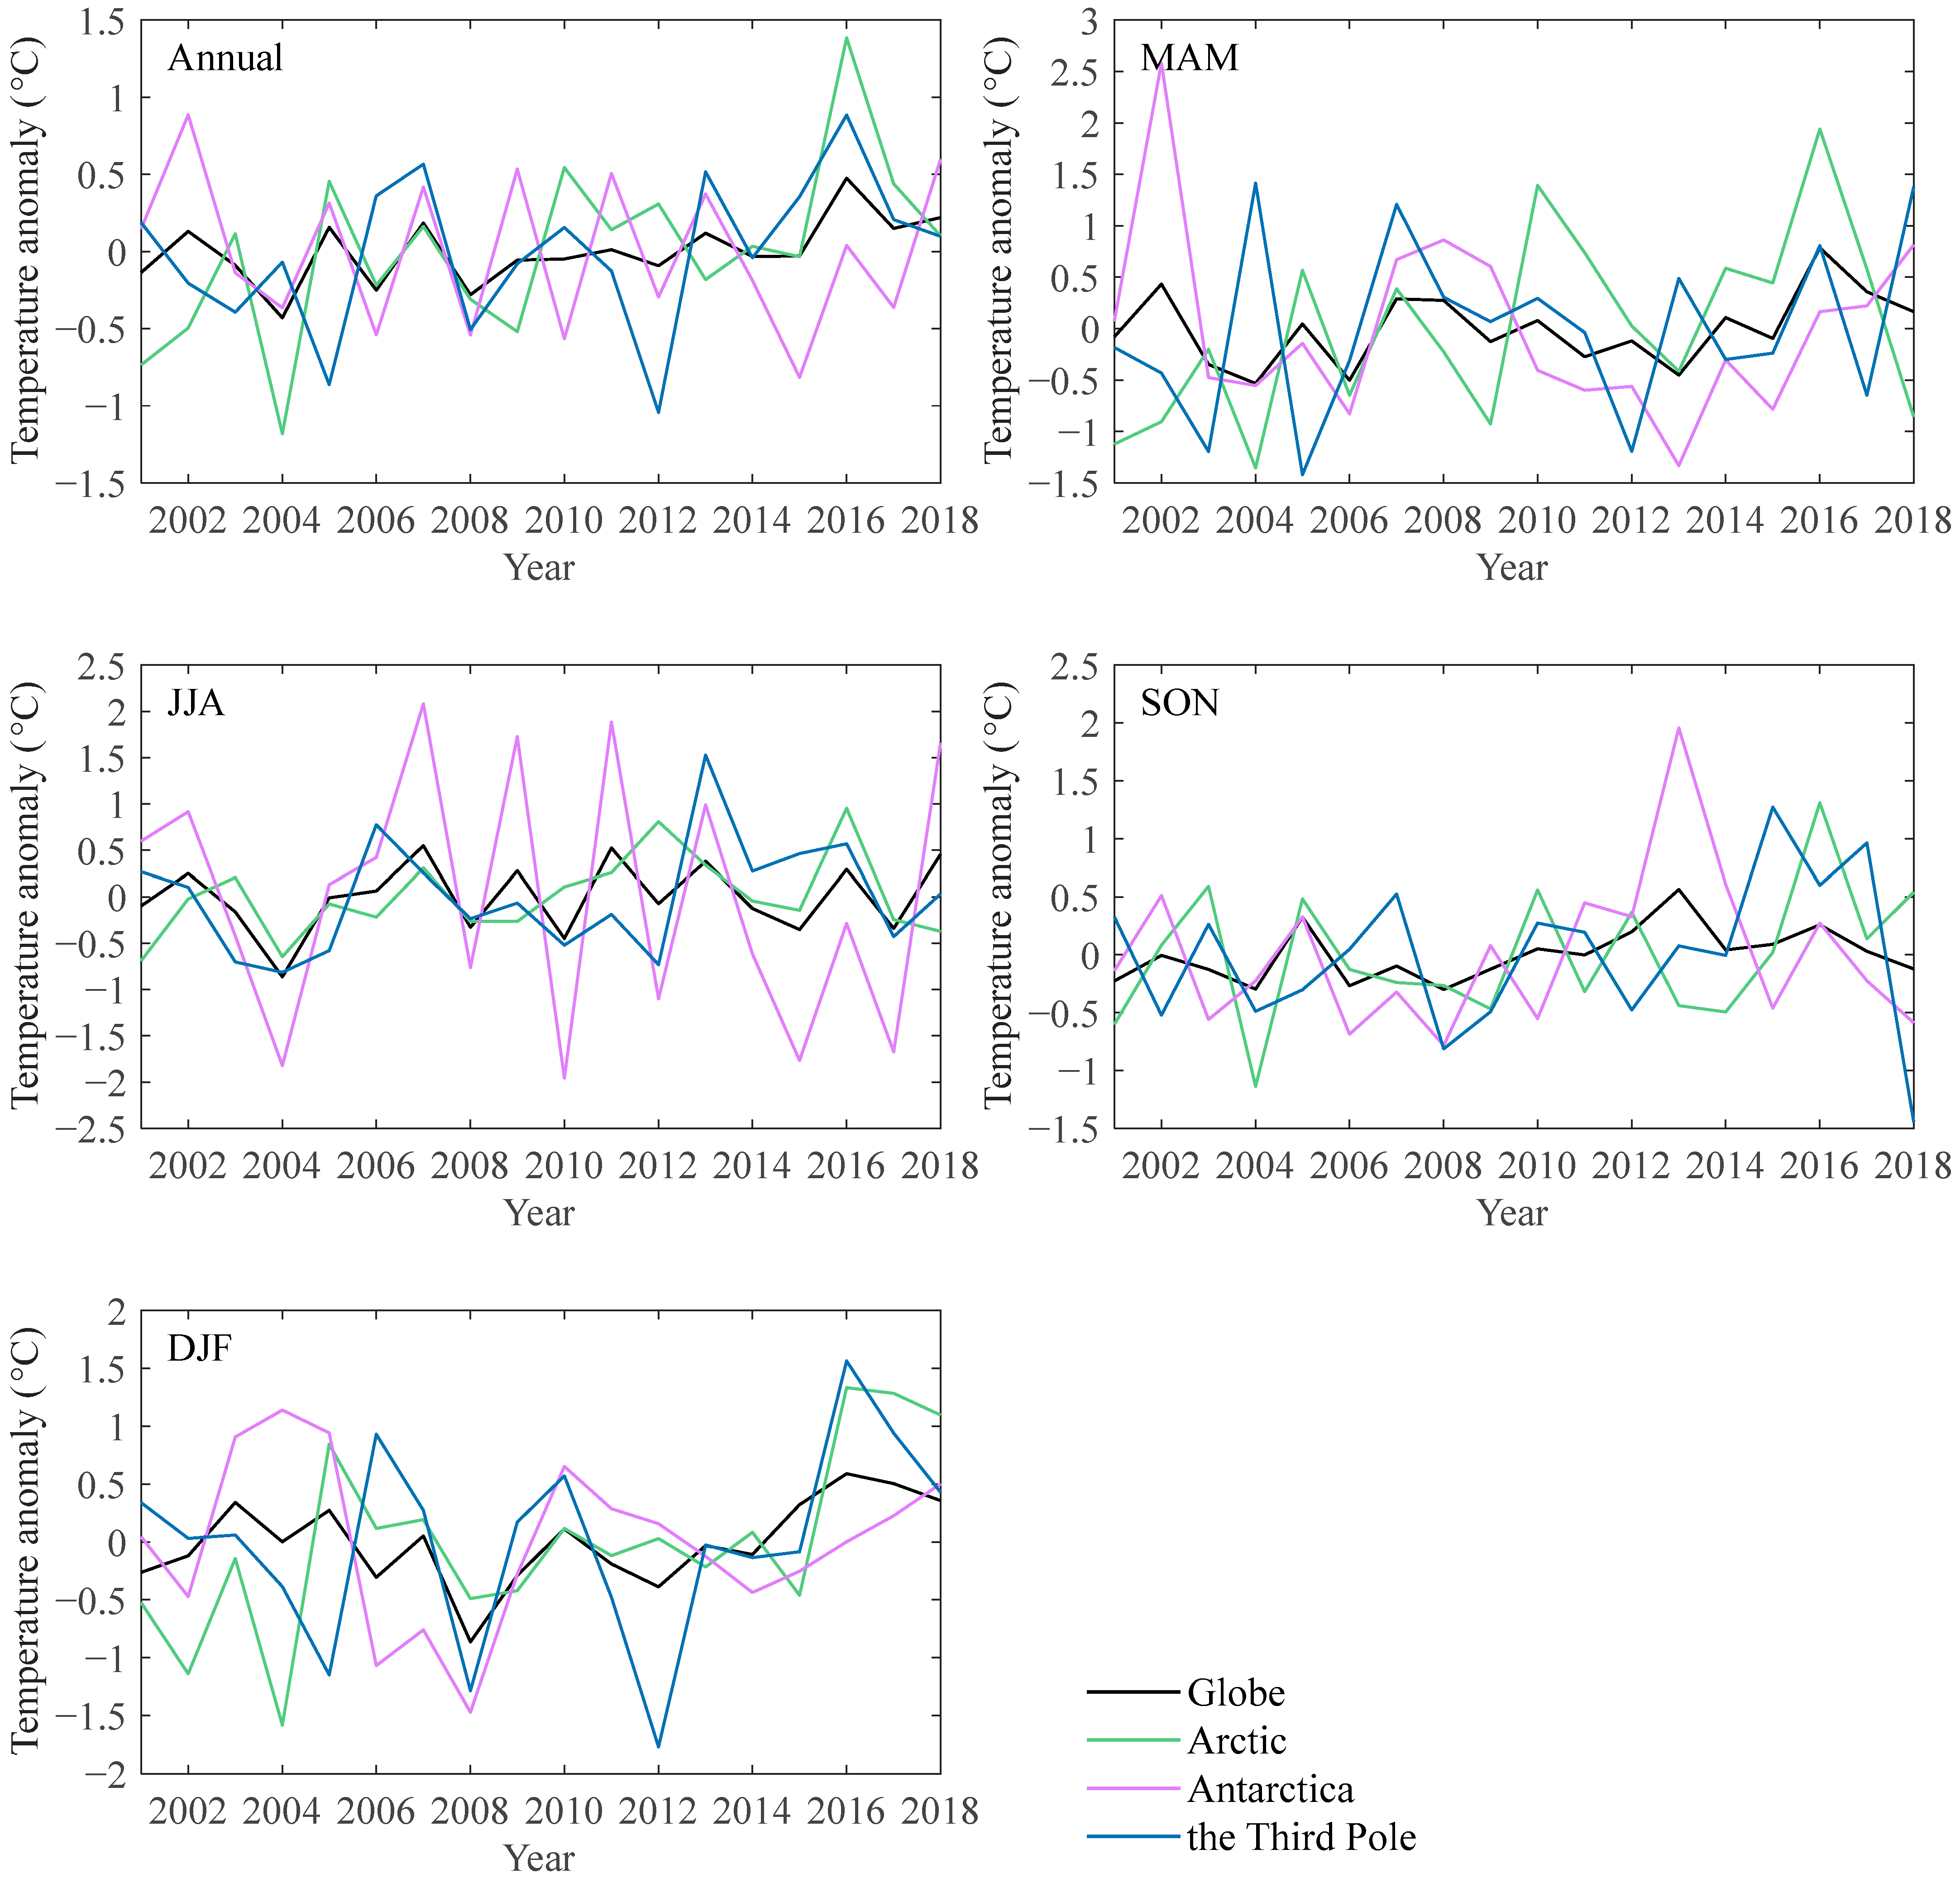
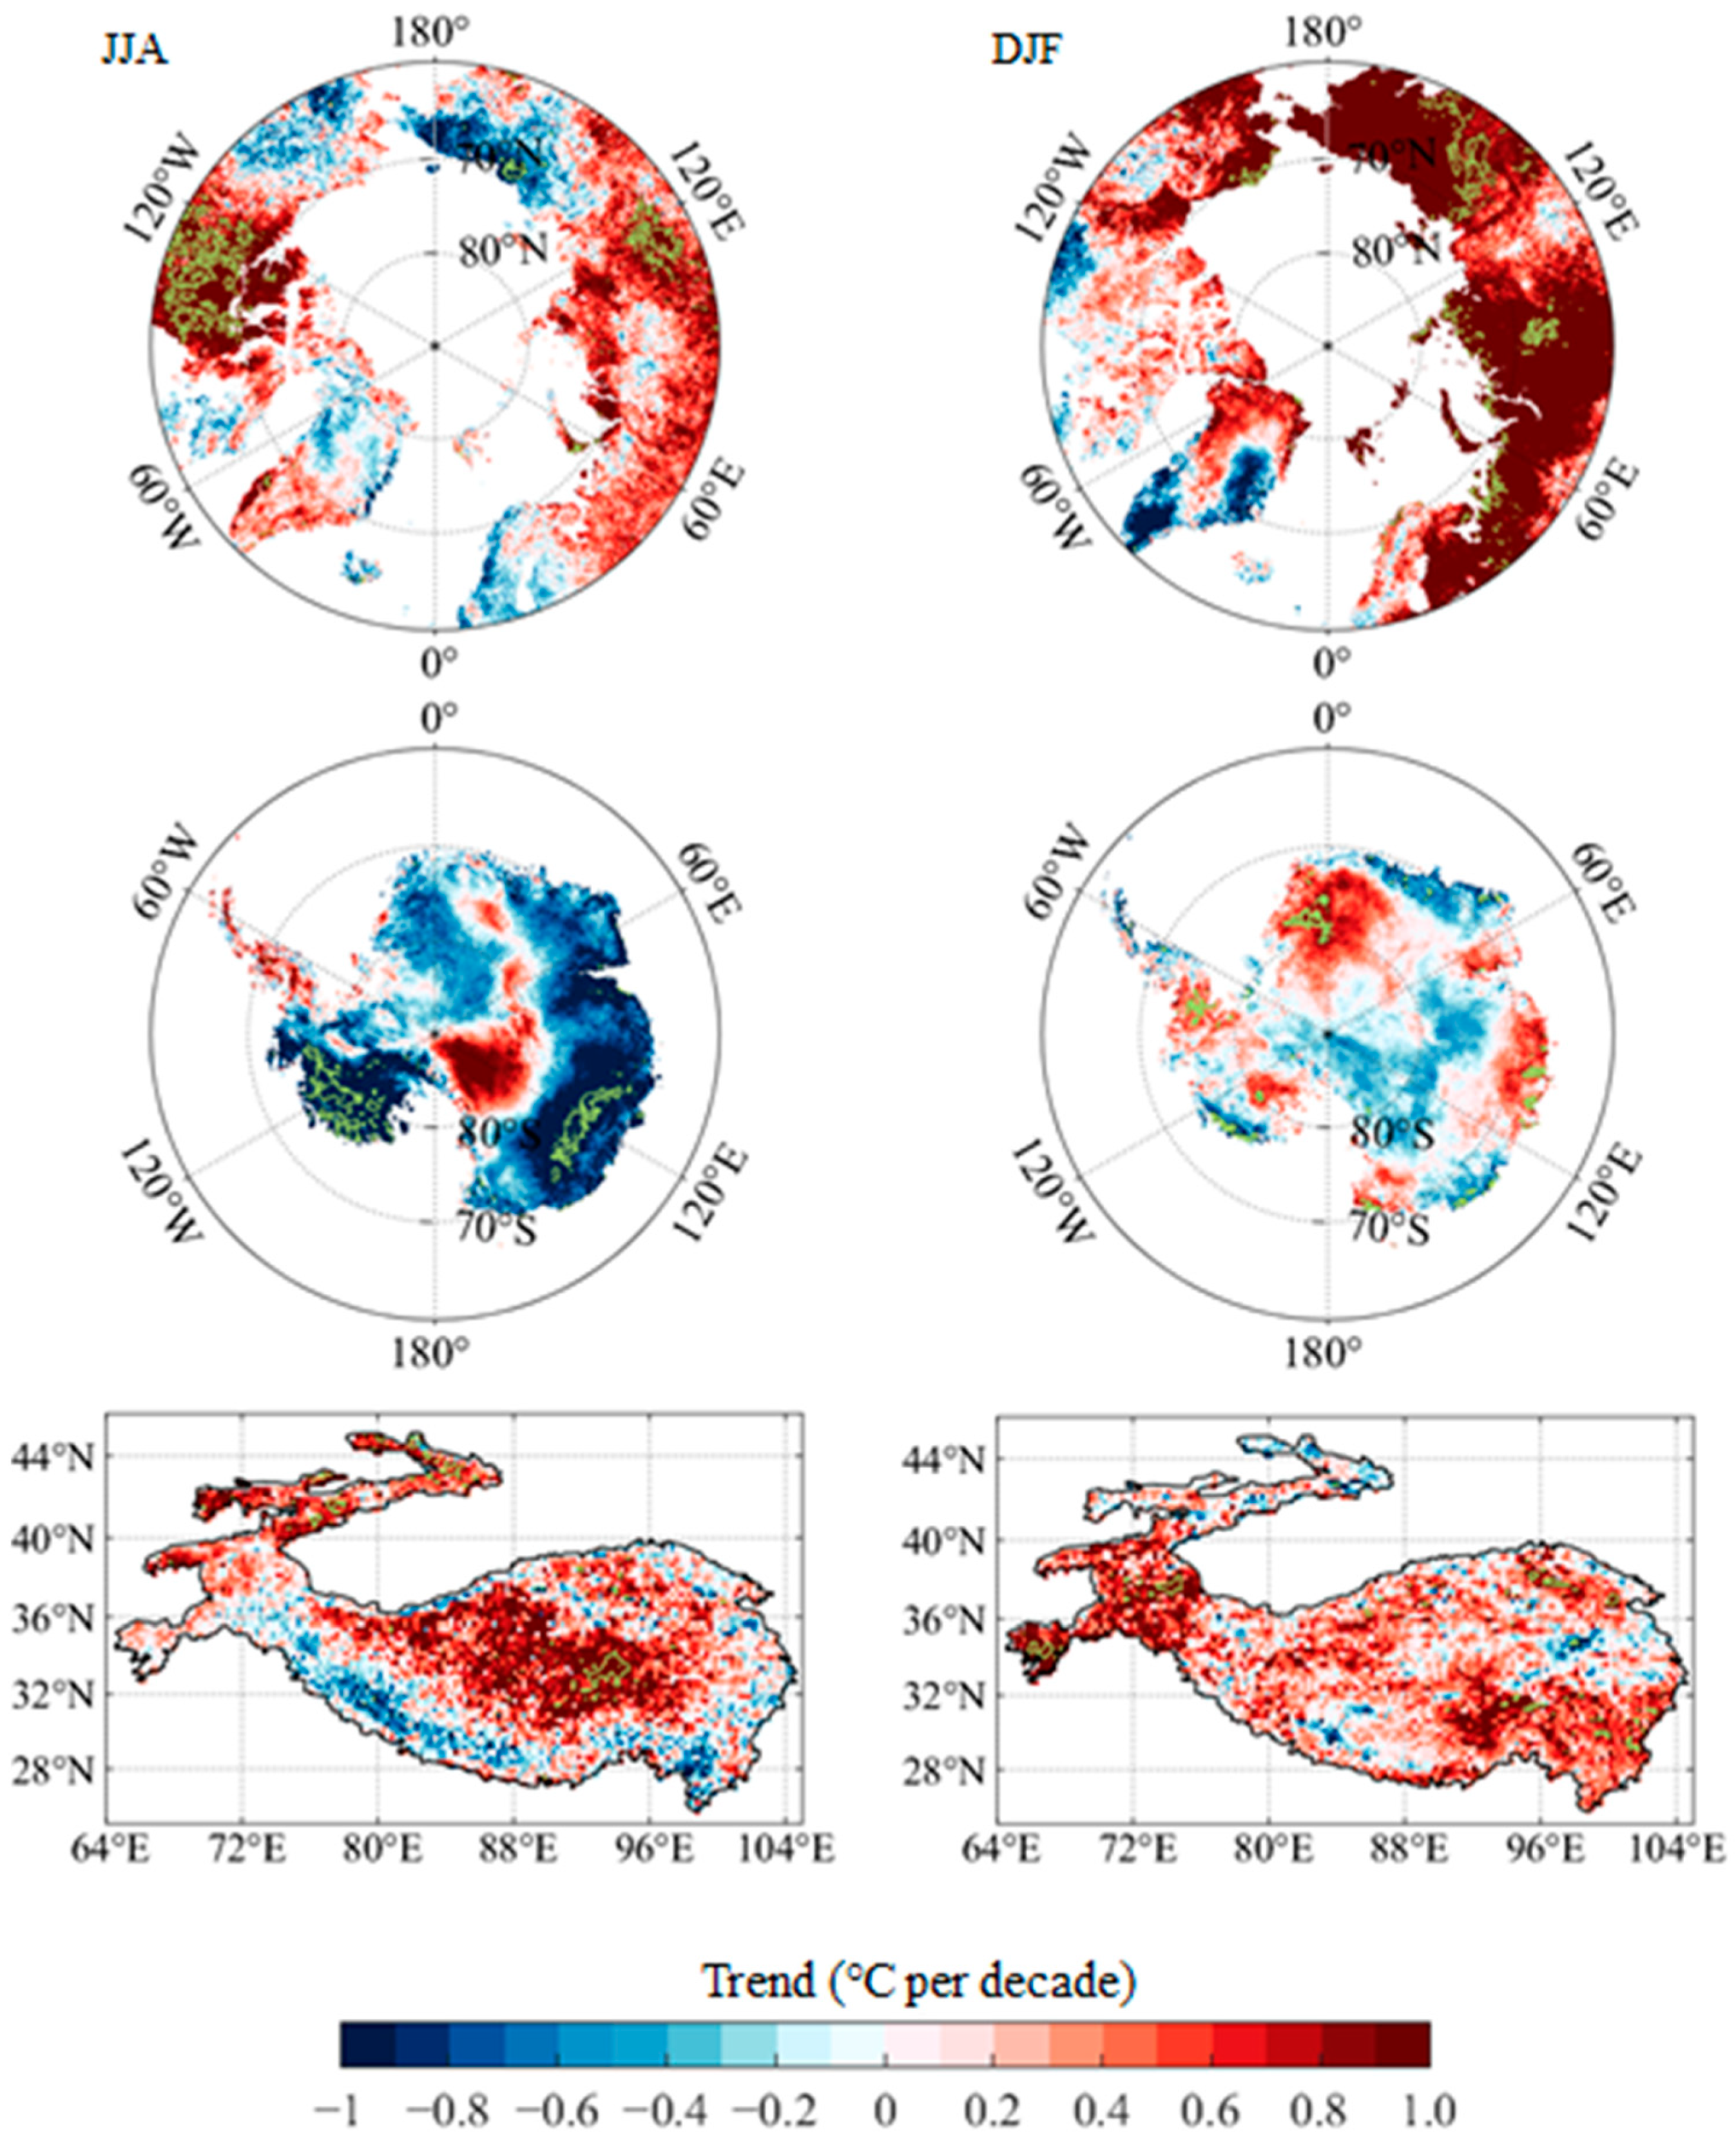
3.2. Trends in Temperatures over the Earth’s Three Poles
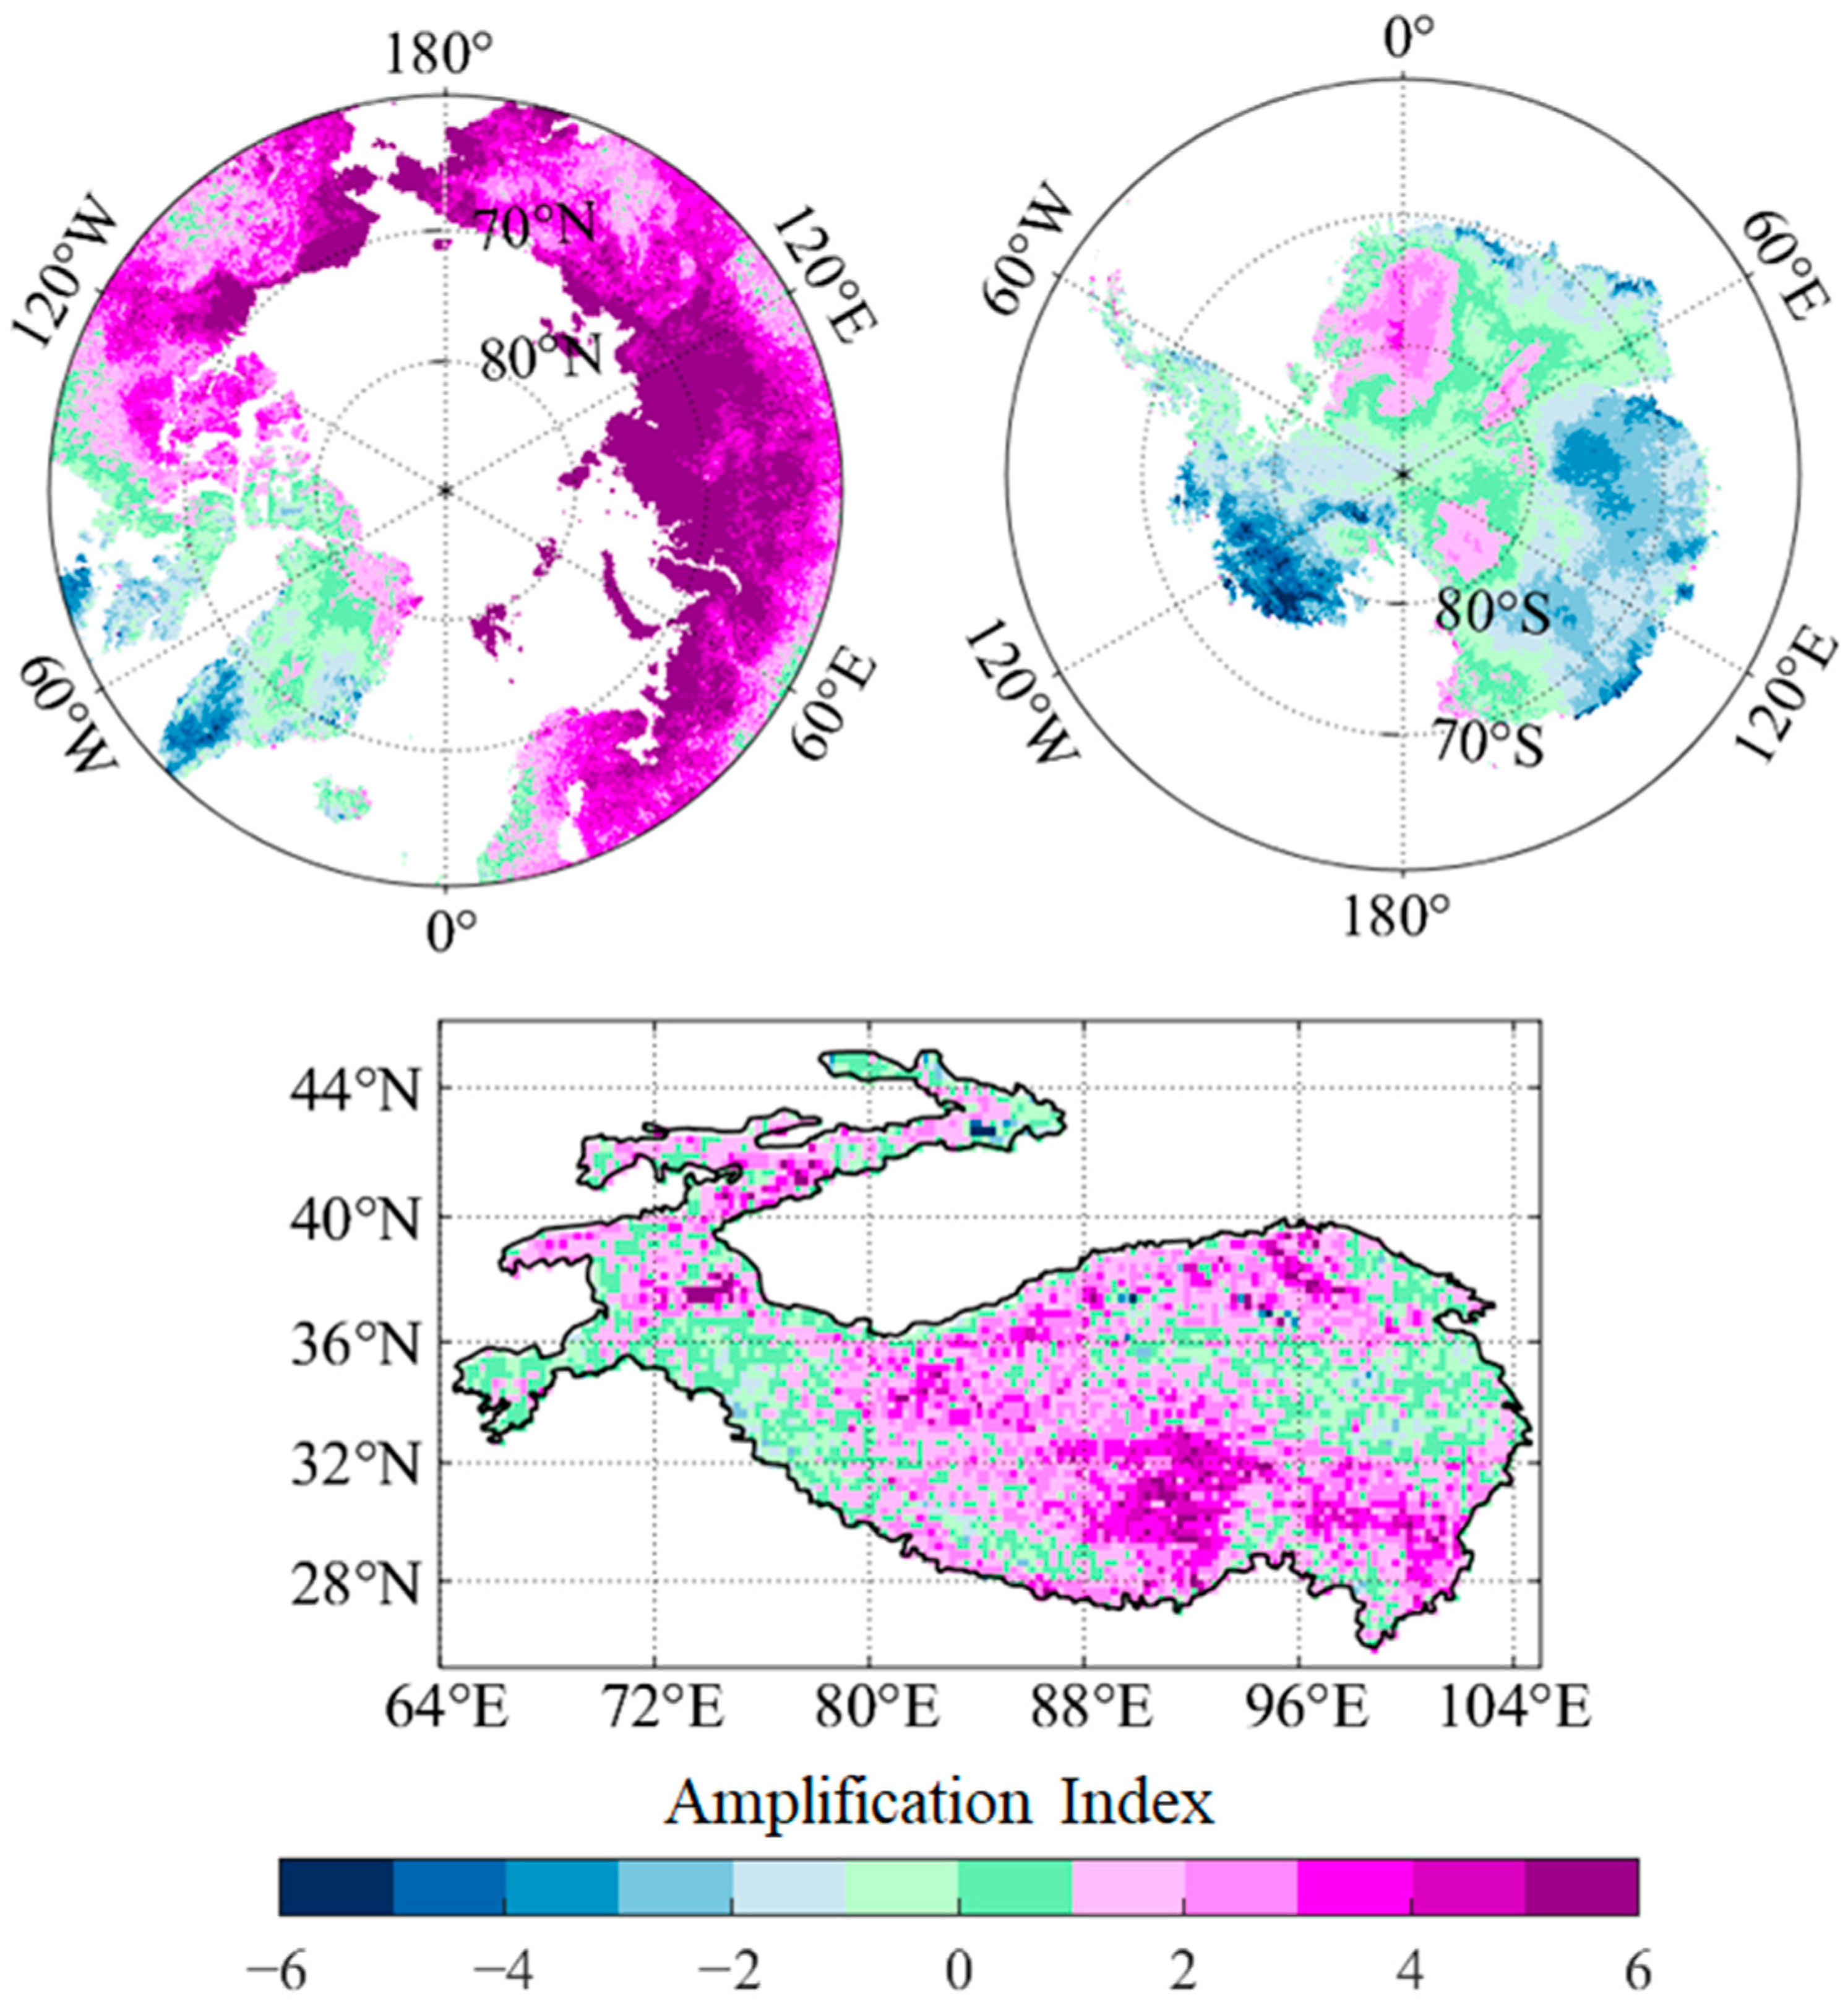
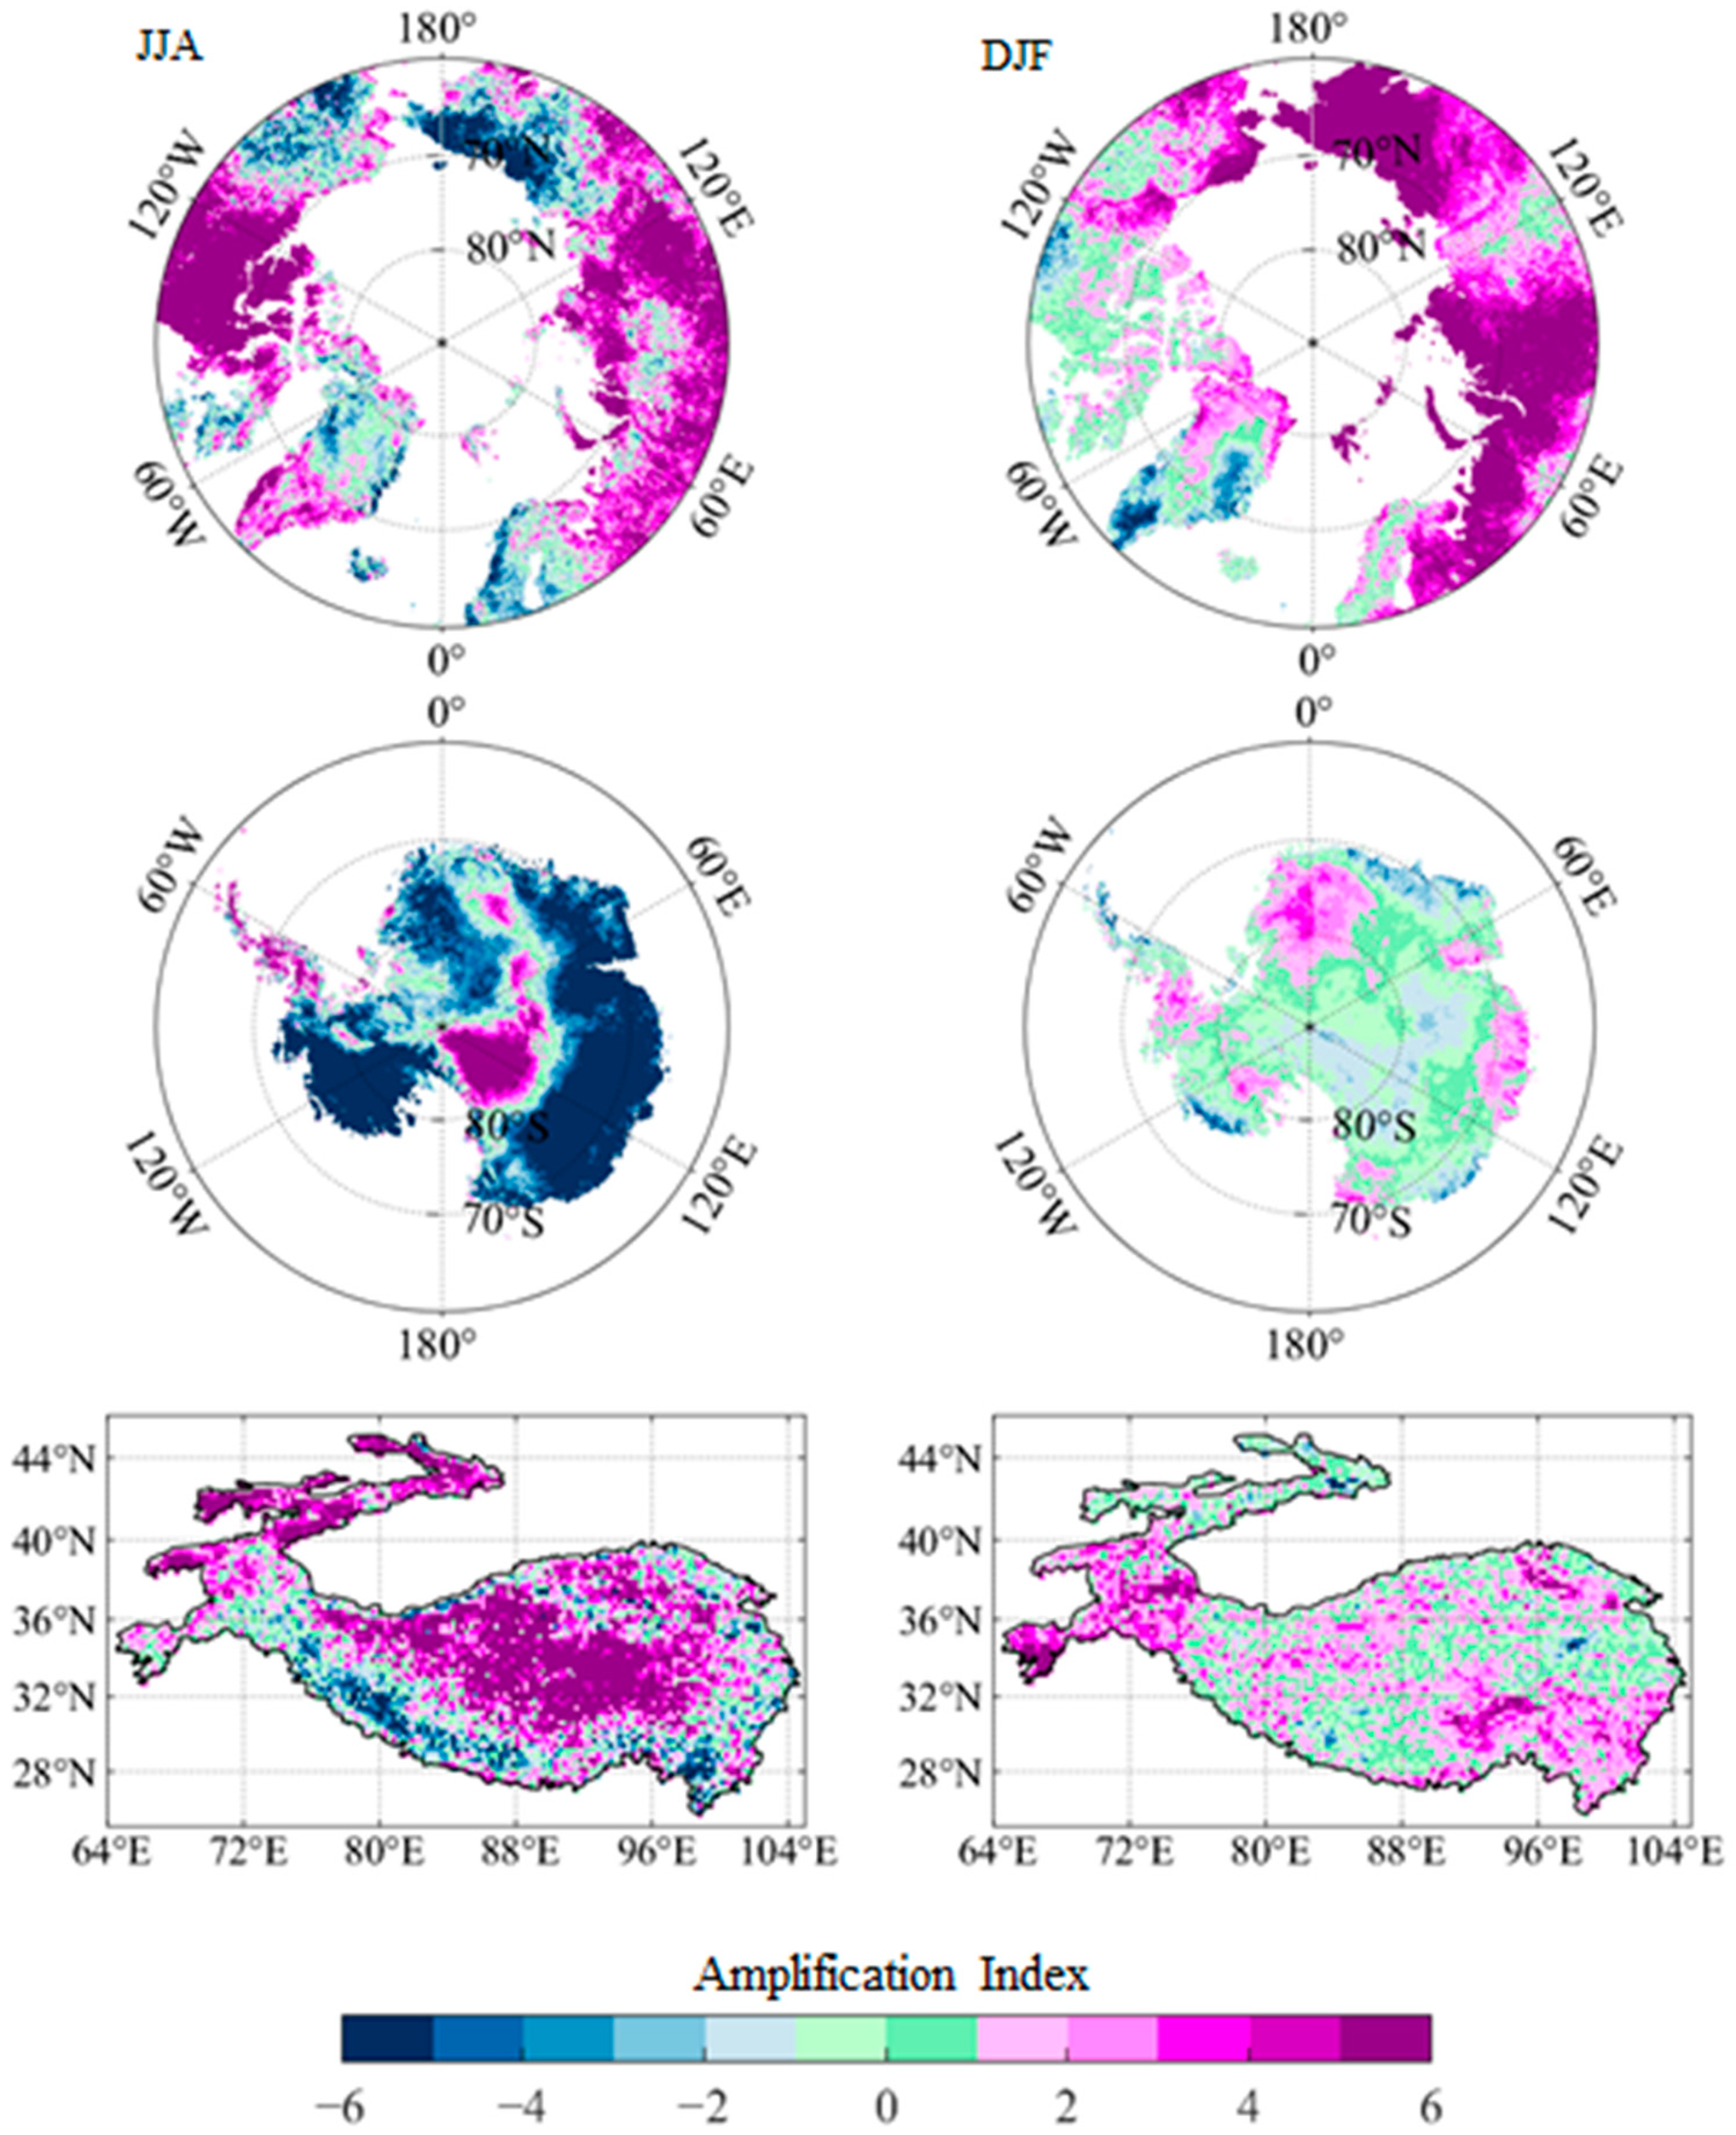
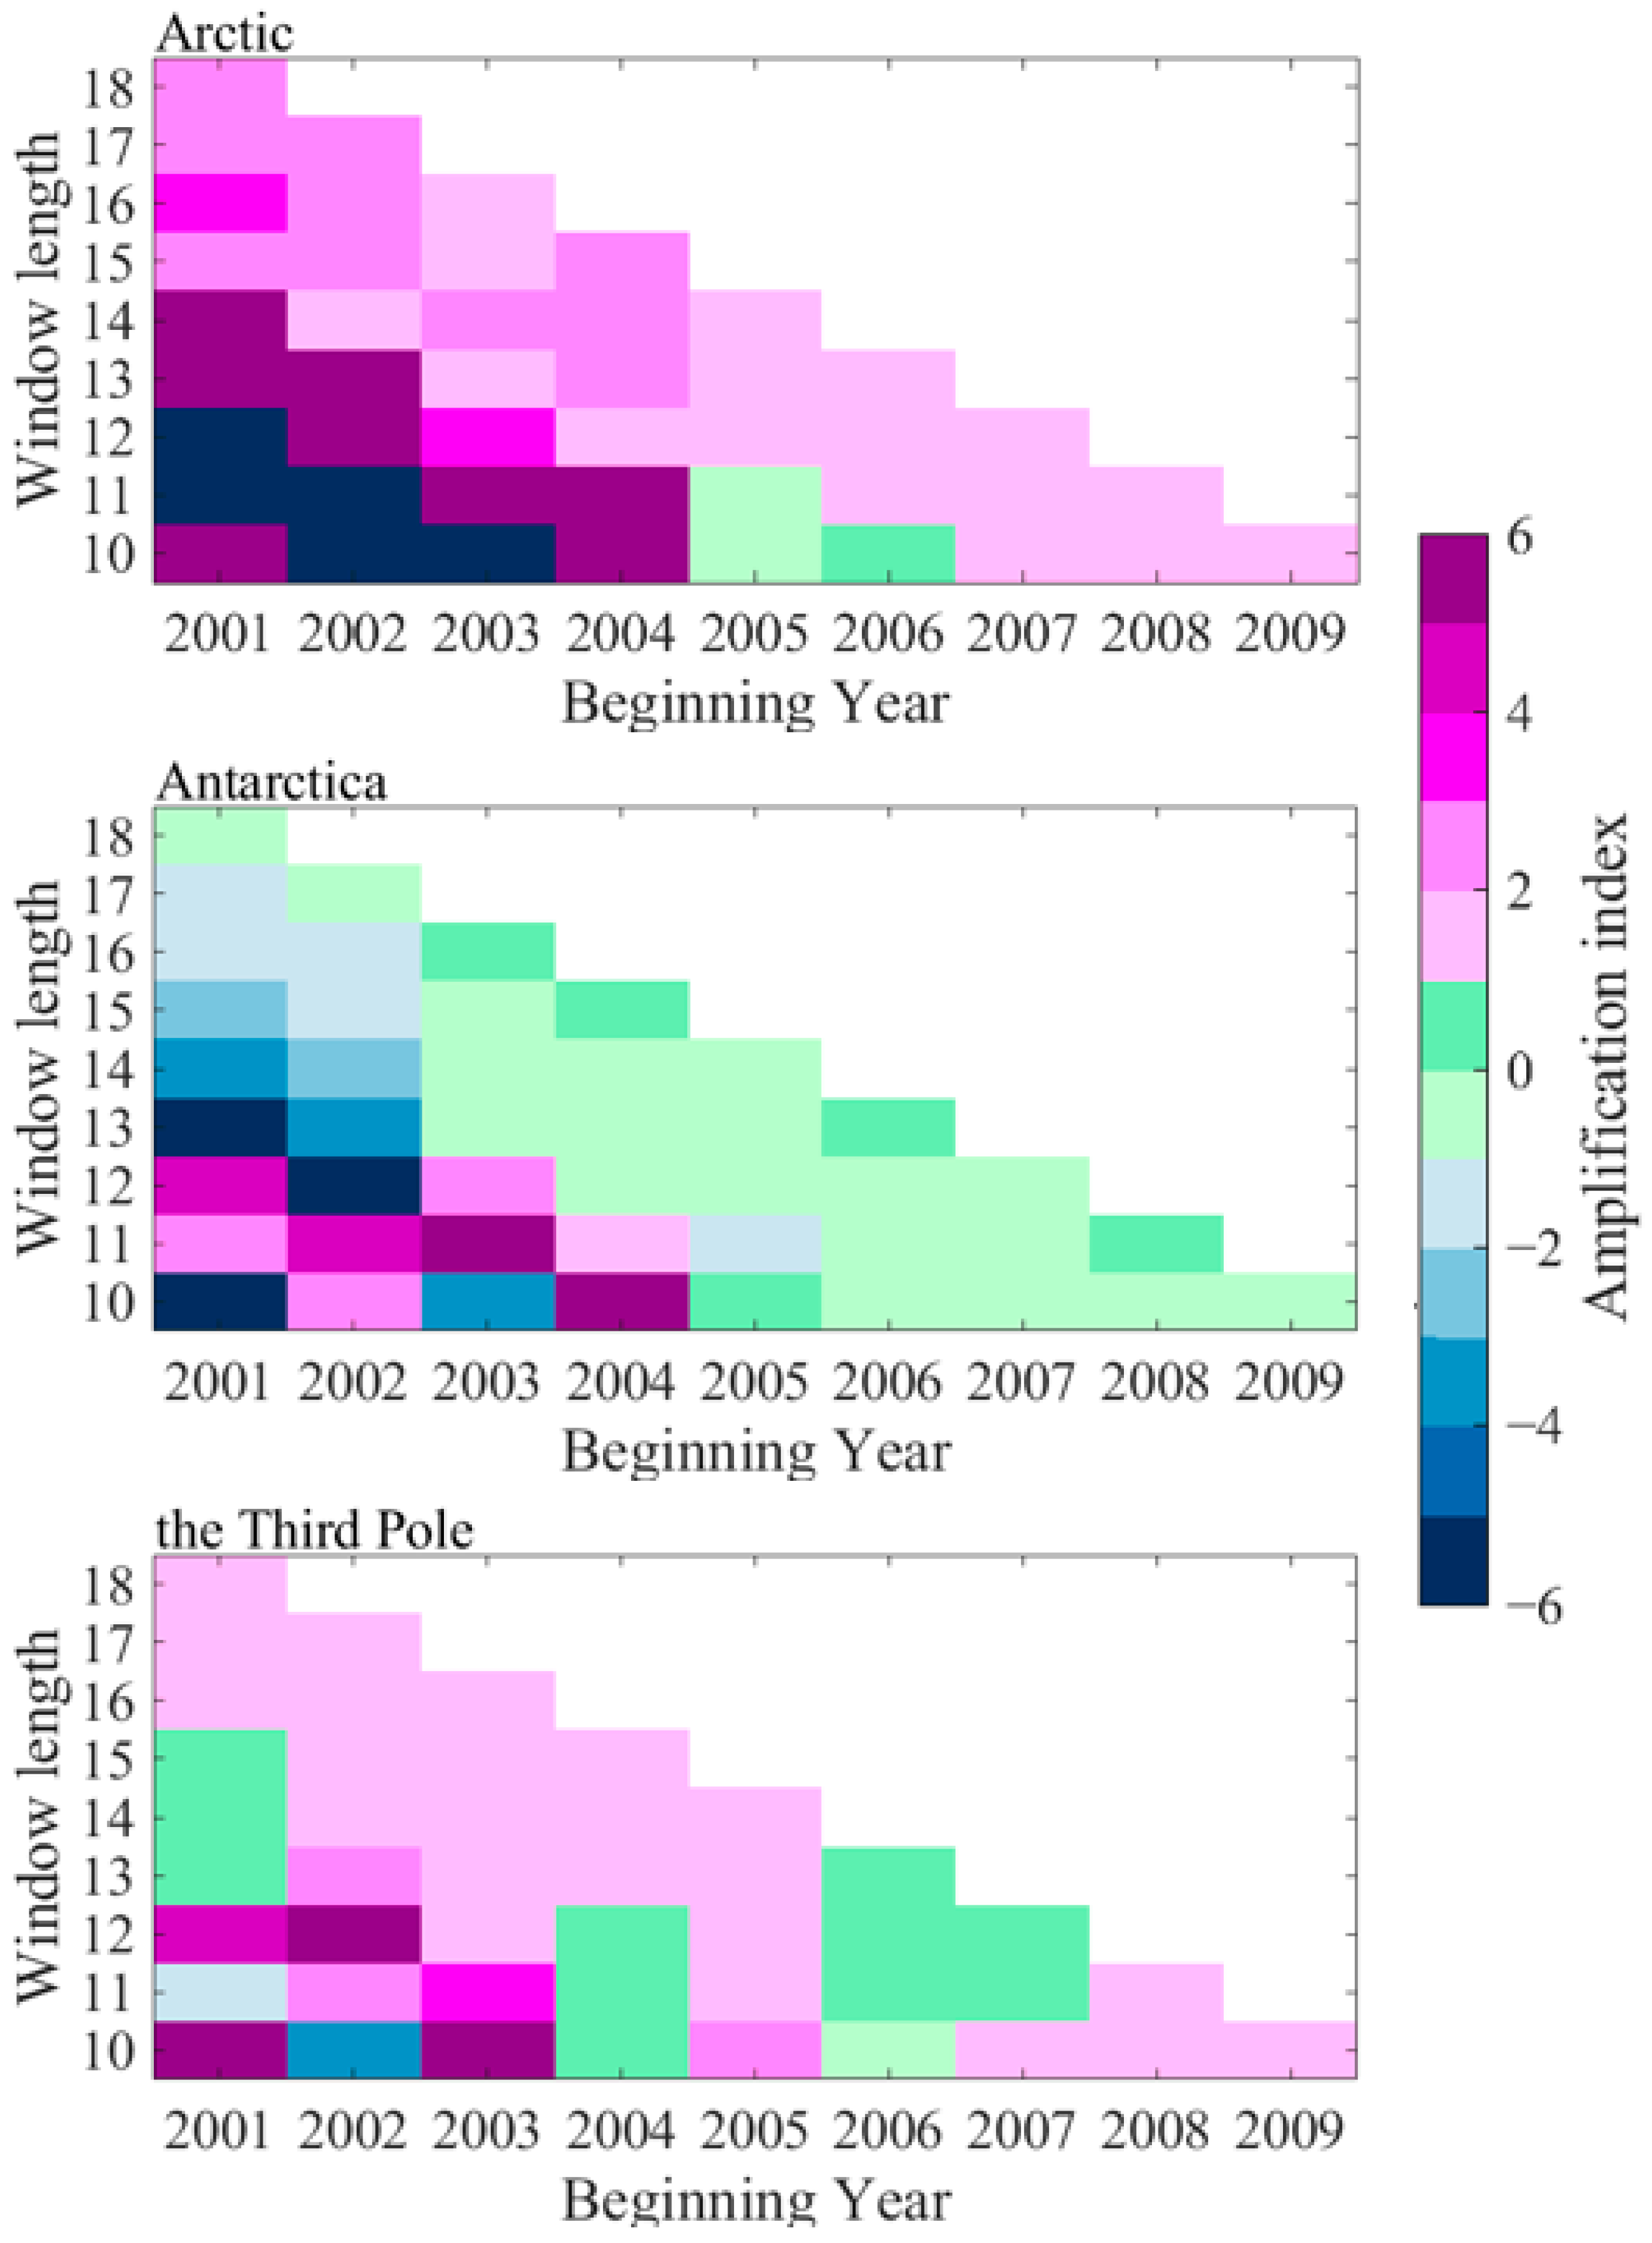
3.3. Comparison of Amplification at the Earth’s Three Poles
4. Discussion
5. Conclusions
Author Contributions
Funding
Data Availability Statement
Acknowledgments
Conflicts of Interest
References
- Fang, K.; Zhang, P.; Chen, J.; Chen, D. Co-varying temperatures at 200 hPa over the Earth’s three poles. Sci. China Earth Sci. 2021, 64, 340–350. [Google Scholar] [CrossRef]
- Gao, K.; Duan, A.; Chen, D.; Wu, G. Surface energy budget diagnosis reveals possible mechanism for the different warming rate among Earth’s three poles in recent decades. Sci. Bull. 2019, 64, 1140–1143. [Google Scholar] [CrossRef] [PubMed]
- IPCC. Climate Change 2022: Impacts, Adaptation, and Vulnerability; Contribution of Working Group II to the Sixth Assessment Report of the Intergovernmental Panel on Climate Change; Pörtner, H.-O., Roberts, D.C., Tignor, M., Poloczanska, E.S., Mintenbeck, K., Alegría, A., Craig, M., Langsdorf, S., Löschke, S., Möller, V., et al., Eds.; Cambridge University Press: Cambridge, UK; New York, NY, USA, 2022; 3056p. [Google Scholar] [CrossRef]
- Pratap, B.; Sharma, P.; Patel, L.; Singh, A.T.; Gaddam, V.K.; Oulkar, S.; Thamban, M. Reconciling High Glacier Surface Melting in Summer with Air Temperature in the Semi-Arid Zone of Western Himalaya. Water 2019, 11, 1561. [Google Scholar] [CrossRef]
- Peng, X.Q.; Zhang, T.J.; Frauenfeld, O.W.; Du, R.; Jin, H.D.; Mu, C.C. A Holistic assessment of 1979–2016 Global Cryospheric Extent. Earth’s Future 2021, 9, e2020EF001969. [Google Scholar] [CrossRef]
- Kahl, J.; Charlevoix, D.; Zaftseva, N.; Schnell, R.C.; Serreze, M.C. Absence of evidence for greenhouse warming over the Arctic Ocean in the past 40 years. Nature 1993, 361, 335–337. [Google Scholar] [CrossRef]
- Rogers, J.C. Seasonal temperature variability over the north Atlantic arctic. In Proceedings of the 13th Annual Climate Diagnostics Workshop, NOAA-NWS, Cambridge, MA, USA, 31 October–4 November 1988; pp. 170–178. [Google Scholar]
- Stjern, C.W.; Lund, M.T.; Samset, B.H.; Myhre, G.; Forster, P.M.; Andrews, T.; Boucher, O.; Faluvegi, G.; Flaschner, D.; Iversen, T.; et al. Arctic Amplification Response to Individual Climate Drivers. J. Geophys. Res. Atmos. 2019, 124, 6698–6717. [Google Scholar] [CrossRef]
- Rantanen, M.; Karpechko, A.Y.; Lipponen, A.; Nordling, K.; Hyvarinen, O.; Ruosteenoja, K.; Vihma, T.; Laaksonen, A. The Arctic has warmed nearly four times faster than the globe since 1979. Commun. Earth Environ. 2022, 3, 168. [Google Scholar] [CrossRef]
- Chylek, P.; Folland, C.; Klett, J.D.; Wang, M.Y.; Hengartner, N.; Lesins, G.; Dubey, M.K. Annual Mean Arctic Amplification 1970–2020: Observed and Simulated by CMIP6 Climate Models. Geophys. Res. Lett. 2022, 49, e2022GL099371. [Google Scholar] [CrossRef]
- Polyakov, I.V.; Alekseev, G.V.; Bekryaev, R.V.; Bhatt, U.; Colony, R.L.; Johnson, M.A.; Karklin, V.P.; Makshtas, A.P.; Walsh, D.; Yulin, A.V. Observationally based assessment of polar amplication of global warming, Geophys. Res. Lett. 2002, 29, 1878. [Google Scholar] [CrossRef]
- Xie, A.; Zhu, J.; Kang, S.; Qin, X.; Xu, B.; Wang, Y. Polar amplification comparison among Earth’s three poles under different socioeconomic scenarios from CMIP6 surface air temperature. Sci. Rep. 2022, 12, 16548. [Google Scholar] [CrossRef]
- Douville, H. Robust and perfectible constraints on human-induced Arctic amplification. Commun. Earth Environ. 2023, 4, 283e. [Google Scholar] [CrossRef]
- Liu, J.; Wu, D.Y.; Xu, X.Y.; Ji, M.X.; Chen, Q.L.; Wang, X. Projection of extreme precipitation induced by Arctic amplification over the Northern Hemisphere. Environ. Res. Lett. 2021, 16, 074012. [Google Scholar] [CrossRef]
- Cohen, J.; Screen, J.; Furtado, J.; Barlow, M.; Whittleston, D.; Coumou, D.; Francis, J.; Dethloff, K.; Entekhabi, D.; Overland, J.; et al. Recent Arctic amplification and extreme mid-latitude weather. Nature Geosci. 2014, 7, 627–637. [Google Scholar] [CrossRef]
- McCusker, K.E.; Fyfe, J.C.; Sigmond, M. Twenty-fve winters of unexpected Eurasian cooling unlikely due to arctic sea ice loss. Nat. Geosci. 2016, 9, 838–842. [Google Scholar] [CrossRef]
- Sun, L.; Perlwitz, J.; Hoerling, M. What caused the recent “warm Arctic, cold continents” trend pattern in winter temperatures? Geophys. Res. Lett. 2016, 43, 5345–5352. [Google Scholar] [CrossRef]
- Dai, A.; Song, M. Little influence of Arctic amplification on mid-latitude climate. Nat. Clim. Change 2020, 10, 231–237. [Google Scholar] [CrossRef]
- Chen, D.L. Assessment of past, present and future environmental changes on the Tibetan Plateau. Chin. Sci. Bull. 2015, 60, 3025–3035. (In Chinese) [Google Scholar]
- Hu, S.Z.; Hsu, P.C.; Li, W.K.; Wang, L.; Chen, H.S.; Zhou, B.T. Mechanisms of Tibetan Plateau Warming Amplification in Recent Decades and Future Projections. J. Clim. 2023, 36, 5775–5792. [Google Scholar] [CrossRef]
- Yan, Y.; You, Q.; Wu, F.; Pepin, N.; Kang, S. Surface mean temperature from the observational stations and multiple reanalyses over the Tibetan Plateau. Clim. Dyn. 2020, 55, 2405–2419. [Google Scholar] [CrossRef]
- Liu, Y.Y.; Li, D.; Hu, Z.Z.; Wu, R.G.; Wu, J.; Ding, Y.H. The extremely wet spring of 2022 in Southwest China was driven by La Nina and Tibetan Plateau warming. Atmos. Res. 2023, 289, 106758. [Google Scholar] [CrossRef]
- Turner, J.; Colwell, S.R.; Marshall, G.J.; Lachlan-Cope, T.A.; Carleton, A.M.; Jones, P.D.; Lagun, V.; Reid, P.A.; Iagovkina, S. Antarctic climate change during the last 50 years. Int. J. Climatol. 2005, 25, 279–294. [Google Scholar] [CrossRef]
- Steig, E.J.; Schneider, D.P.; Rutherford, S.D.; Mann, M.E.; Comiso, J.C.; Shindell, D.T. Warming of the Antarctic ice-sheet surface since the 1957 International Geophysical Year. Nature 2009, 457, 459–462. [Google Scholar] [CrossRef]
- Bromwich, D.H.; Nicolas, J.P.; Monaghan, A.J.; Lazzara, M.A.; Keller, L.M.; Weidner, G.A.; Wilson, A.B. Central West Antarctica among the most rapidly warming regions on Earth. Nature Geosci. 2013, 6, 139–145. [Google Scholar] [CrossRef]
- Doran, P.; Priscu, J.; Lyons, W.; Walsh, J.E.; Fountain, A.G.; McKnight, D.M.; Moorhead, D.L.; Virginia, R.A.; Wall, D.H.; Clow, G.D.; et al. Antarctic climate cooling and terrestrial ecosystem response. Nature 2002, 415, 517–520. [Google Scholar] [CrossRef] [PubMed]
- Turner, J.; Lu, H.; White, I.; King, J.C.; Phillips, T.; Hosking, J.S.; Bracegirdle, T.J.; Marshall, G.J.; Mulvaney, R.; Deb, P. Absence of 21st century warming on Antarctic Peninsula consistent with natural variability. Nature 2016, 535, 411–415. [Google Scholar] [CrossRef] [PubMed]
- Wang, S.M.; Xie, A.H.; Zhu, J.P. Does polar amplification exist in Antarctic surface during the recent four decades? J. Mt. Sci. 2021, 18, 2626–2634. [Google Scholar] [CrossRef]
- Zhang, X.Y.; Dong, X.; Zeng, J.; Hou, S.G.; Smeets, P.; Reijmer, C.H.; Wang, Y.T. Spatiotemporal Reconstruction of Antarctic Near-Surface Air Temperature from MODIS Observations. J. Clim. 2022, 35, 5537–5553. [Google Scholar] [CrossRef]
- Xie, A.; Zhu, J.; Qin, X.; Wang, S. The Antarctic Amplification Based on MODIS Land Surface Temperature and ERA5. Remote Sens. 2023, 15, 3540. [Google Scholar] [CrossRef]
- Xiong, X.; Chiang, K.; Sun, J.; Barnes, W.L.; Guenther, B.; Salomonson, V.V. NASA EOS Terra and Aqua MODIS on-orbit performance. Adv. Space Res. 2009, 43, 413–422. [Google Scholar] [CrossRef]
- Zhu, J.; Xie, A.; Qin, X.; Wang, Y.; Xu, B.; Wang, Y. An Assessment of ERA5 Reanalysis for Antarctic Near-Surface Air Temperature. Atmosphere 2021, 12, 217. [Google Scholar] [CrossRef]
- Graham, R.M.; Hudson, S.R.; Maturilli, M. Improved performance of ERA5 in Arctic gateway relative to four global atmospheric reanalyses. Geophys. Res. Lett. 2019, 46, 6138–6147. [Google Scholar] [CrossRef]
- Hersbach, H.; Bell, B.; Berrisford, P.; Hirahara, S.; Horanyi, A.; Munoz-Sabater, J.; Nicolas, J.; Peubey, C.; Radu, R.; Schepers, D.; et al. The ERA5 global reanalysis. Q. J. R. Meteorol. Soc. 2020, 146, 1999–2049. [Google Scholar] [CrossRef]
- Li, Y.; Qin, X.; Liu, Y.; Jin, Z.; Liu, J.; Wang, L.; Chen, J. Evaluation of Long-Term and High-Resolution Gridded Precipitation and Temperature Products in the Qilian Mountains, Qinghai–Tibet Plateau. Front. Environ. Sci. 2022, 10, 906821. [Google Scholar] [CrossRef]
- Fang, M.; Li, X.; Chen, H.W.; Chen, D. Arctic amplification modulated by Atlantic Multidecadal Oscillation and greenhouse forcing on multidecadal to century scales. Nat. Commun. 2022, 13, 1865. [Google Scholar] [CrossRef]
- Hind, A.; Zhang, Q.; Brattstrom, G. Problems encountered when defining Arctic amplification as a ratio. Sci. Rep. 2016, 6, 30469. [Google Scholar] [CrossRef]
- Wang, Y.; Huang, F.; Fan, T. Spatio-temporal variations of Arctic amplification and their linkage with the Arctic oscillation. Acta Oceanol. Sin. 2017, 36, 42–51. [Google Scholar] [CrossRef]
- Jiang, S.P.; Ye, A.Z.; Xiao, C.D. The temperature increase in Greenland has accelerated in the past five years. Glob. Planet. Chang. 2020, 194, 103297. [Google Scholar] [CrossRef]
- Davy, R.; Griewank, P. Arctic amplification has already peaked. Environ. Res. Lett. 2023, 18, 084003. [Google Scholar] [CrossRef]
- Lin, X.; Wen, J.; Liu, Q.; You, D.; Wu, S.; Hao, D.; Xiao, Q.; Zhang, Z.; Zhang, Z. Spatiotemporal Variability of Land Surface Albedo over the Tibet Plateau from 2001 to 2019. Remote Sens. 2020, 12, 1188. [Google Scholar] [CrossRef]
- Zhang, R.; Wang, H.; Fu, Q.; Rasch, P.J.; Wu, M.; Maslowski, W. Understanding the cold season Arctic surface warming trend in recent decades. Geophys. Res. Lett. 2021, 48, e2021GL094878. [Google Scholar] [CrossRef]
- Chung, E.-S.; Ha, K.-J.; Timmermann, A.; Stuecker, M.F.; Bodai, T.; Lee, S.-K. Cold-season Arctic amplification driven by Arctic ocean-mediated seasonal energy transfer. Earth’s Future 2021, 9, e2020EF001898. [Google Scholar] [CrossRef]
- Zhu, J.; Xie, A.; Qin, X.; Xu, B.; Wang, Y. Assessment of Antarctic Amplification Based on a Reconstruction of Near-Surface Air Temperature. Atmosphere 2023, 14, 218. [Google Scholar] [CrossRef]
- Marshall, J.; Armour, K.C.; Scott, J.R.; Kostov, Y.; Hausmann, U.; Ferreira, D.; Shepherd, T.G.; Bitz, C.M. The ocean’s role in polar climate change: Asymmetric Arctic and Antarctic responses to greenhouse gas and ozone forcing. Philos. T. R. Soc. A 2014, 372, 20130040. [Google Scholar] [CrossRef] [PubMed]
- Masson-Delmotte, V.; Schulz, M.; Abe-Ouchi, A.; Beer, J.; Ganopolski, A.; Rouco, J.F.G.; Jansen, E.; Lambeck, K.; Luterbacher, J.; Naish, T.; et al. Information from paleoclimate archives. In Climate Change 2013: The Physical Science Basis; Contribution of Working Group I to the Fifth Assessment Report of the Intergovernmental Panel on Climate Change; Stocker, T.F., Qin, D., Plattner, G.-K., Tignor, M., Allen, S.K., Boschung, J., Nauels, A., Xia, Y., Bex, V., Midgley, P.M., Eds.; Cambridge University Press: Cambridge, UK; New York, NY, USA, 2013. [Google Scholar]
- Salzmann, M. The polar amplification asymmetry: Role of Antarctic surface height. Earth Syst. Dyn. 2017, 8, 323–336. [Google Scholar] [CrossRef]
- Guo, D.L.; Wang, H.J. The significant climate warming in the northern Tibetan Plateau and its possible causes. Int. J. Climatol. 2012, 32, 1775–1781. [Google Scholar] [CrossRef]
- Wang, Y.; Yan, P.C.; Feng, T.C.; Ji, F.; Tang, S.K.; Feng, G.L. Detection of anthropogenically driven trends in Arctic amplification. Clim. Chang. 2021, 169, 41. [Google Scholar] [CrossRef]
- Xin, M.J.; Clem, K.R.; Turner, J.; Stammerjohn, S.E.; Zhu, J.; Cai, W.J.; Li, X.C. West-warming East-cooling trend over Antarctica reversed since early 21st century driven by large-scale circulation variation. Environ. Res. Lett. 2023, 18, 064034. [Google Scholar] [CrossRef]
- Zhang, X.Y.; Wang, Y.T.; Hou, S.G.; Heil, P. Significant West Antarctic Cooling in the Past Two Decades Driven by Tropical Pacific Forcing. Bull. Am. Meteorol. Soc. 2023, 104, E1154–E1165. [Google Scholar] [CrossRef]
- Hanna, E.; Mernild, S.H.; Cappelen, J.; Steffen, K. Recent warming in Greenland in a long-term instrumental (1881–2012) climatic context: I. Evaluation of surface air temperature records. Environ. Res. Lett. 2012, 7, 045404. [Google Scholar] [CrossRef]
- Ogi, M.; Rysgaard, S.; Barber, D.G. The influence of winter and summer atmospheric circulation on the variability of temperature and sea ice around Greenland. Tellus Ser. A Dyn. Meteorol. Oceanogr. 2016, 68, 31971. [Google Scholar] [CrossRef]
- Kong, L.L.; Zou, H.; Zhou, L.B.; Zhu, J.H. Surface heat transfer changes over Arctic land and sea connected to Arctic warming. Int. J. Climatol. 2022, 42, 9150–9165. [Google Scholar] [CrossRef]
- You, Q.; Cai, Z.; Pepin, N.; Chen, D.; Ahrens, B.; Jiang, Z.; Wu, F.; Kang, S.; Zhang, R.; Wu, T.; et al. Warming amplification over the Arctic Pole and Third Pole: Trends, mechanisms and consequences. Earth-Sci. Rev. 2021, 217, 103625. [Google Scholar] [CrossRef]
- Bintanja, R.; van der Linden, E.C.; Hazeleger, W. Boundary layer stability and Arctic climate change: A feedback study using EC-Earth. Clim. Dyn. 2012, 39, 2659–2673. [Google Scholar] [CrossRef]
- Huang, Y.; Xia, Y.; Tan, X. On the pattern of CO2 radiative forcing and poleward energy transport. J. Geophys. Res. Atmos. 2017, 122, 10578–10593. [Google Scholar] [CrossRef]
- Goosse, H.; Kay, J.E.; Armour, K.C.; Bodas-Salcedo, A.; Chepfer, H.; Docquier, D.; Jonko, A.; Kushner, P.J.; Lecomte, O.; Massonnet, F.; et al. Quantifying climate feedbacks in polar regions. Nat. Commun. 2018, 9, 1919. [Google Scholar] [CrossRef]
- Stuecker, M.F.; Bitz, C.M.; Armour, K.C.; Proistosescu, C.; Kang, S.M.; Xie, S.P.; Kim, D.; McGregor, S.; Zhang, W.; Zhao, S.; et al. Polar amplification dominated by local forcing and feedbacks. Nature Clim. Chang. 2018, 8, 1076–1081. [Google Scholar] [CrossRef]
- Pepin, N.; Deng, H.; Zhang, H.; Zhang, F.; Kang, S.; Yao, T. An examination of temperature trends at high elevations across the Tibetan Plateau: The use of MODIS LST to understand patterns of elevation-dependent warming. J. Geophys. Res. 2019, 124, 5738–5756. [Google Scholar] [CrossRef]
- You, Q.L.; Zhang, Y.Q.; Xie, X.; Wu, F. Robust elevation dependency warming over the Tibetan Plateau under global warming of 1.5 °C and 2 °C. Clim. Dyn. 2019, 53, 2047–2060. [Google Scholar] [CrossRef]
- Zhang, R.H.; Zhou, S. Air temperature changes over the Tibetan Plateau and other regions in the same latitudes and the role of ozone depletion. Acta Meteorol. Sin. 2009, 23, 290–299. [Google Scholar]
- Cai, S.L.; Hsu, P.C.; Liu, F. Changes in polar amplification in response to increasing warming in CMIP6. Atmos. Ocean. Sci. Lett. 2021, 14, 100043. [Google Scholar] [CrossRef]


| Annual | MAM | JJA | SON | DJF | |
|---|---|---|---|---|---|
| Arctic | 3.09 | 3.98 | 2.15 | 2.02 | 3.44 |
| Antarctica | −0.72 | −1.68 | −2.73 | 0.97 | −0.15 |
| Third Pole | 1.50 | 1.71 | 2.19 | 1.01 | 1.30 |
Disclaimer/Publisher’s Note: The statements, opinions and data contained in all publications are solely those of the individual author(s) and contributor(s) and not of MDPI and/or the editor(s). MDPI and/or the editor(s) disclaim responsibility for any injury to people or property resulting from any ideas, methods, instructions or products referred to in the content. |
© 2023 by the authors. Licensee MDPI, Basel, Switzerland. This article is an open access article distributed under the terms and conditions of the Creative Commons Attribution (CC BY) license (https://creativecommons.org/licenses/by/4.0/).
Share and Cite
Xie, A.; Zhu, J.; Wang, S.; Qin, X. Polar Amplification in the Earth’s Three Poles Based on MODIS Land Surface Temperatures. Remote Sens. 2023, 15, 5566. https://doi.org/10.3390/rs15235566
Xie A, Zhu J, Wang S, Qin X. Polar Amplification in the Earth’s Three Poles Based on MODIS Land Surface Temperatures. Remote Sensing. 2023; 15(23):5566. https://doi.org/10.3390/rs15235566
Chicago/Turabian StyleXie, Aihong, Jiangping Zhu, Shimeng Wang, and Xiang Qin. 2023. "Polar Amplification in the Earth’s Three Poles Based on MODIS Land Surface Temperatures" Remote Sensing 15, no. 23: 5566. https://doi.org/10.3390/rs15235566
APA StyleXie, A., Zhu, J., Wang, S., & Qin, X. (2023). Polar Amplification in the Earth’s Three Poles Based on MODIS Land Surface Temperatures. Remote Sensing, 15(23), 5566. https://doi.org/10.3390/rs15235566