Article

Intercomparison of Landsat OLI and JPSS VIIRS Using a Combination of RadCalNet Sites as a Common Reference

1
Science Systems & Applications, Inc., 10210 Greenbelt Road, Lanham, MD 20706, USA
2
NASA Goddard Space Flight Center, 8800 Greenbelt Road, Greenbelt, MD 20771, USA
*
Author to whom correspondence should be addressed.
Remote Sens. 2023, 15(23), 5562; https://doi.org/10.3390/rs15235562
Submission received: 26 April 2023 / Revised: 10 July 2023 / Accepted: 18 July 2023 / Published: 29 November 2023
(This article belongs to the Special Issue Initial Understanding of Landsat-9 Capabilities and Applications)

Abstract

:
Independent radiometric data collected from multiple ground sites as part of vicarious calibration activities can be combined to harmonize the data products of Earth observation sensors with different temporal, spectral, and spatial resolutions. Recent coordinated international efforts for open fiducial reference measurements have provided the worldwide user community with new ways to explore the calibration and harmonization of data produced by the sensors. To be correct, the results from each ground system must be traceable to the same well-understood standard system, and ideally to the international system of units (SI). Additionally, the calibration test site should be homogeneous over an area larger than the spatial resolutions of each sensor, so that ground measurements are representative of the area seen by the sensors being calibrated. Here, we use a combination of independent and SI-traceable radiometric data provided from two sites of the Radiometric Calibration Network (RadCalNet) to compare the radiometric response of sensors with different spectral and spatial resolutions that operate on different orbits. These sensors are Operational Land Imagers (OLI) of the Landsat-8 and Landsat-9 missions, and Visible Infrared Imaging Radiometer Suites (VIIRS) of the Suomi-National Polar-Orbiting Operational Environmental Satellite System Preparatory Project (SNPP) and Joint Polar Satellite System-1 (JPSS-1) missions. The sensor radiometric responses are compared via temporal averaging of the ratios of top-of-atmosphere reflectance values for each sensor to those reported by RadCalNet. Our intercomparison results show that these on-orbit sensors are calibrated within their absolute radiometric uncertainties. The absolute radiometric uncertainties of single-sensor over single-site intercomparisons at 550 nm is between 5% and 6%. Having the opportunity to look at the intercomparison results of Landsat-9 OLI compared to each calibration site individually and then in combination allowed us to investigate potential systematic site-dependent biases. We did not observe significant site-dependent biases in the behavior of the four on-orbit sensors compared to the calibration sites. The absolute radiometric uncertainty of a single sensor over multiple-site intercomparisons at 550 nm is 5.4%. We further investigated site-dependent biases by looking at the double-ratio calibration coefficients of the on-orbit sensors, calculated with reference to those sites.

Graphical Abstract

1. Introduction

The launch of Landsat 9 in September 2021 continues the long history of Landsat measurements, which dates back to the early 1970s with Landsats 1, 2, and 3, through the 1980s and 1990s with Landsat 4 and 5, and through the turn of the century with Landsats 7 and 8. The usefulness of these datasets has been well established as resulting from pre- and post-launch efforts toward the absolute radiometric calibration of the Landsat sensors.
Radiometrically calibrated satellite data are key elements for conducting Earth process studies and developing consistent climate records over decadal time frames. Ensuring that satellite data also conform to Fiducial Reference Measurements (FRM) guidelines provides the user community with further confidence in satellite data quality and the derived data products [1]. The FRM used in this work are ground-based measurements at selected radiometric calibration test sites that provide independent calibration results that can provide quantitative uncertainties for the satellite measurements over the entire duration of the mission’s lifetime. The sites are well characterized in terms of environmental conditions, and in situ measurements following rigorous metrological best practices are carried out within these sites in a near-continuous and sustained manner.
An additional reason for developing absolute radiometric calibrations that follow traceability to the International System of Units (SI) is that Earth science applications making use of Landsat data (e.g., land cover change monitoring, agricultural management, disaster response, and water resource management [2,3,4]) benefit from improved temporal resolutions that can be achieved using multiple sensors. Such combinations were the original motivation for launching Landsat 8 in an orbit that is eight days out of phase with the original Landsat 7 orbit that is now occupied by Landsat 9. Combining multi-mission data is not without challenges due to differences in (i) the sensor designs and characteristics; (ii) the data product definitions and algorithms; and (iii) the illumination and observation geometries of the land surface.
There exist relative radiometric calibration approaches that attempt to correct for sensor and view geometry differences, as well as using climatological and other assumptions about the temporal behavior of surface and atmospheric properties at selected sites. The methods, in essence, align the output of one sensor to that of another in order to improve the agreement between multiple sensors [5,6]. Such methods can produce consistent temporal datasets based on the images from multiple systems. A variation on these relative radiometric calibrations is to use methods that ensure the data are on an absolute, SI-traceable radiometric scale with documented uncertainties. Doing so allows for sensors that do not have overlapping operations to be combined, and gives confidence that the combined dataset resulting from a relative calibration is on an appropriate absolute radiometric scale for use in physical models, thus improving their value for use in higher-level data products.
Harmonizing data based on an absolute, SI-traceable radiometric scale requires documenting that the path from SI to geophysical products follows an unbroken chain of measurements with known uncertainties [7]. An example of an absolute, SI-traceable radiometric calibration scale is the Radiometric Calibration Network (RadCalNet) [8]. RadCalNet was initiated by the Committee on Earth Observation Satellites Working Group on Calibration and Validation (WGCV) as part of the Infrared and Visible Optical Sensors (IVOS) subgroup. The goal of RadCalNet is to provide top-of-atmosphere (TOA) reflectance data with known uncertainties from multiple participating ground sites to the worldwide user community.
This study uses RadCalNet in two ways. The first is by assessing the early on-orbit, absolute radiometric calibration of the Landsat 9 Operational Land Imager (OLI) sensor, and the second is by comparing both Landsat 8 and 9 OLIs to the Visible Infrared Imaging Radiometer Suites (VIIRS) sensors onboard the Suomi National Polar-Orbiting Partnership (Suomi NPP or SNPP) and the National Oceanic and Atmospheric Administration-20 (NOAA-20). Both calibration efforts make use of the RadCalNet system as a whole rather than a set of individual sites. That is, the work shown here builds on past efforts comparing Landsats 8 and 9 OLIs to each other [9], as well as the Landsat 8 OLI to VIIRS [10].
The utility of this work is threefold. The first and foremost is to provide results that demonstrate that the SI-traceability of Landsat series of satellites has continued with Landsat 9. The second is to use the well-behaved VIIRS sensors, the well-understood and 10-year archive of the Landsat 8 OLI, and the eight-day out-of-phase Landsat 9 OLI to assess the feasibility of incorporating a suite of RadCalNet sites into the calibration of a given sensor, as well as the intercomparison of sensors. The third aspect builds on the first two by then showing that the SNPP VIIRS, NOAA-20 VIIRS, Landsat 8 OLI, and Landsat 9 OLI all agree with the absolute radiometric scale of RadCalNet within the combined uncertainties of RadCalNet and the sensor radiometric calibrations. The reason for attempting the intercomparison of VIIRS and OLI is that while the numbers of bands, spatial resolutions, and orbits are significantly different, the added temporal sampling available from VIIRS can provide information for time series data produced from the Landsat’s eight day repeat. Figure 1 clearly shows this by providing the daily orbit swaths for Landsat missions and JPSS missions. The phasing of the Landsat-8 and Landsat-9 satellite orbits is obvious in Figure 1A, while the large swaths of VIIRS are evident in Figure 1B. The motivation for using RadCalNet in this work is that the differences between equator crossing times of Landsat and JPSS missions as well as the orbital altitudes and periods mean that the number of nearly coincident views at mid-latitudes is very small. Intercomparisons are still feasible using pseudo-invariant calibration sites [11] but this requires that the sensors overlap in their operations. RadCalNet’s SI-traceable hyperspectral data products allow the intercomparison of instruments with different spectral bands, revisit times, and spatial resolutions.

2. Materials and Methods

Landsat-8 was launched in February 2013 [12], and Landsat-9 was launched in September 2021 [13]. They were both placed in a sun-synchronous orbit, each providing a global revisit every 16 days. The OLI sensors onboard Landsat-8 and Landsat-9 satellites are multispectral and cover solar reflected wavelengths at 30 m resolutions [14,15]. The VIIRS sensors onboard SNPP and NOAA-20 satellites are multispectral and cover solar reflected wavelengths at 750 m resolution for the moderate-resolution channels (M-bands) and 375 m for the imagery channels (I-bands) [16,17]. We use the dual-gain VIIRS bands M1–M5 and M7 in this study. The relative spectral responses (RSR) of OLI and VIIRS in the 400 nm to 1000 nm range are listed in Table 1 and shown in Figure 2.
The SNPP platform was launched in October 2011 [18], and the NOAA-20 satellite was launched on December 2017 [19] in a sun-synchronous polar orbit behind the SNPP platform. The primary purpose of the JPSS missions is to provide global observations that serve as the backbone for numerical weather predictions. Both SNPP and NOAA-20 cross the equator 14 times daily, allowing the VIIRS instruments to provide full global coverage twice a day. VIIRS sensors are radiometers that collect multispectral observations from the land, atmosphere, cryosphere, and oceans in 22 spectral bands covering the visible and near-infrared (VNIR) to the thermal infrared (TIR) spectral regions between 0.4 µm to 12.6 µm. Although the spectral responses of the VIIRS sensors are similar to those of the OLI sensors, their differences must be considered for an absolute radiometric intercomparison and data harmonization.
Only the 30 m data from OLI and the 750 m data from VIIRS are used in the current work. Therefore, this is an intercomparison of a sensor with higher spatial resolution and lower temporal resolution (OLI) with a sensor with lower spatial resolution and higher temporal resolution (VIIRS). The combination of images from the two satellites enables applications that take advantage of the higher temporal resolution of the VIIRS instrument of the JPSS missions, and the higher spatial resolution of the OLI sensors of the Landsat missions, but only if they agree in a radiometric sense [20].

3. Data Products Used in the Study

SNPP VIIRS, NOAA-20 VIIRS, Landsat-8 OLI, and Landsat-9 OLI were calibrated prior to the launch with traceability to the radiance standard of the National Institute for Standards and Technology (NIST). The prelaunch test for these sensors indicated that their radiometric and spectral performance met specifications [21,22,23,24]. Multiple on-orbit calibration approaches have been implemented for both OLI and VIIRS to monitor and correct for changes in the radiometric response of the sensors [25,26,27,28]. However, on-orbit calibration techniques rely on diffusers known to degrade with time under the effect of the space environment and sunlight. Thus, it is essential to monitor the stability of the diffuser and the overall performance of the sensors using independent calibration methods that are quantifiable and traceable. Onboard approaches to do so include the solar diffuser stability monitor on VIIRS and the use of a combination of working and pristine diffusers for OLI. Vicarious radiometric calibrations can also be considered independent bridges that link the preflight and on-orbit calibrations [29,30,31,32,33,34,35]. The approach in this study uses ground-based measurements at well-understood test sites to predict TOA reflectance for comparison with values derived from the on-orbit sensor measurements [36,37,38,39,40,41,42].
As stated above, we use RadCalNet for in situ data [8] that, at the time of this study, included five radiometric calibration instrumented sites in the USA, France, China, and Namibia. RadCalNet provides TOA reflectance data and associated absolute uncertainties from 400 to 1000 nm. The independent sites collect bottom-of-atmosphere (BOA) reflectance with their associated absolute radiometric uncertainties according to standardized protocols formulated by the RadCalNet Working Group [8]. In addition to the nadir-viewing BOA reflectance data, each site operator also provides atmospheric parameters, including surface pressure and temperature, columnar water vapor, ozone, aerosol optical depth, and Angstrom coefficient. The RadCalNet team uses the provided BOA reflectance data and the associated atmospheric parameters from the site operators as inputs to the MODTRAN [43] radiative transfer code that is used for all of the sites to calculate TOA reflectance values. Uncertainties are provided for each TOA reflectance data point, and the reader is directed to the reference [44] for a more detailed discussion on the Monte Carlo technique used for generating the uncertainty look-up table of RadCalNet.
The five test sites in use at the time of the current work are Railroad Valley Playa in the United States (RVUS), La Crau in France (LCFR), Gobabeb in Namibia (GONA), Baotou artificial site in China (BTCN), and Baotou Sandy in China (BSCN). Coordinates and areas for the five sites are presented in Table 2.
Among the five test sites, only RVUS is instrumented over a large enough area to cover an entire pixel of moderate-resolution VIIRS imagery (750 m by 750 m). The site was originally chosen for the radiometric calibration of MODIS [45]. GONA, LCFR, BTCN, and BSCN sites are all smaller than a single pixel of VIIRS images. Previous work showed that GONA could be used in the reflectance-based vicarious radiometric calibration of moderate-resolution VIIRS images because the instrumented calibration site is representative of the surrounding extended area. It is also possible to use ground sites that are not representative of the extended surrounding area in a relative manner using double-ratio intercomparison methods that essentially include the effects of spatial heterogeneity in the sensor with high spatial resolution [46]. The earlier work shows that the double-ratio comparison of Landsat-8 OLI and NOAA-20 VIIRS with reference to BSCN is within the ~7.5% combined standard uncertainties of the comparison approach.
RVUS and GONA are spectrally flat in VNIR and spatially uniform over at least a 1 km2 area surrounding the sites. Both sites are in remote areas with limited access. RVUS is operated by the University of Arizona [32], and its BOA reflectance measurements rely on radiance measurements from several multispectral ground-viewing radiometers located randomly over a 1 km2 area centered at 38.497°N and 115.690°W at an altitude of 1435 m. GONA is operated by the National Physical Laboratory (NPL), and its data are processed by the Centre Nation d’Etude Spatiales (CNES), with funding provided by the European Space Agency (ESA) [36]. To date, it remains the only RadCalNet site to be selected through a global search, which relied on quantitative assessments including spectral characteristics, spatial uniformity, and the probability of clear skies [47]. GONA relies on radiance measurements at various viewing angles using a single RObotic Station for Atmosphere and Surface (ROSAS) instrument centered at 23.600°S and 15.120°E at an altitude of 520 m [48].

4. Conversion of Digital Numbers to TOA Reflectance

The OLI data used here are the Level 1T data products from the United States Geological Survey USGS Earth Resources Observation and Science (EROS) [37]. All scenes fully encompassing the coordinates of RVUS or GONA were obtained, and the 16-bit digital numbers (DNs) were converted to TOA reflectance using [49], as follows:
ρ λ = M p × Q c a l + A p cos θ S Z
where ρ (λ) is the spectral band-dependent top-of-atmosphere (TOA) equivalent reflectance of the scene, M p is the reflectance multiplicative scaling factor for the spectral band, A p is the reflectance additive scaling factor for the spectral band, Q c a l is the level 1B pixel value in DN, and θ S Z is the local solar zenith angle. Q c a l values were extracted from pixels covering the surface area of each site. M p , A p , and θ S Z values were extracted from metadata associated with each image. The Landsat-8 OLI images and Landsat-9 OLI images of RVUS and GONA were filtered based on the cloud flag and cloud shadow flag on the LandsatLook Quality Image data products [38]. We use 34 × 34 pixel arrays and 2 × 2 pixel arrays from Landsat-8 OLI and Landsat-9 OLI images to cover the surface area for RVUS and GONA, respectively. The arithmetic averaging on TOA reflectance values associated with those pixel arrays is then calculated to provide a single TOA reflectance value representing the TOA reflectance of each scene.
SNPP VIIRS and NOAA-20 VIIRS provide multispectral images of the RadCalNet sites with near daily coverage but with varying view geometries. VIIRS/JPSS1 Moderate Resolution 6 Min L1B Swath 750 m and VIIRS/JPSS1 Moderate Resolution Terrain Corrected Geolocation 6 min L1 Swath 750 m NetCDF4 product files encompassing coordinates of RVUS or GONA were obtained from the NASA Earthdata [39,40,41,42]. The 16-bit DN number integer values stored at each pixel in the NetCDF4 files are the product of the true reflectance and the cosine of the solar zenith angle at the pixel location. Therefore, we divide the reconstituted reflectance by the cosines of the solar zenith angles to obtain TOA reflectance values associated with VIIRS images. For SNPP, VIIRS, and NOAA-20 VIIRS moderate-resolution images, we only use a single pixel for each of the images to represent each site.

5. Scene Selection

Table 3 lists the number of all available matchups between clear-sky satellite images and RadCalNet data for January 2018 to December 2022. Using the method described in the previous section, it is possible to calculate a TOA reflectance value for every scene over RVUS and GONA. We filter the image–RadCalNet pairs based on (A) the time difference between the scene capture time and ground measurement time, (B) the view geometry, (C) the ground measurement variability, (D) the location ambiguity, and (E) atmospheric conditions, in order to remove pairs not suitable for radiometric intercomparison.
RadCalNet provides spectrally resolved reflectance for a nadir view at 30 min intervals [8]. For the time difference criterion, we omit images for which the difference between image capture time and RadCalNet surface reflectance collection time is larger than 30 min. This is because, if the time difference between an image captured by the on-orbit sensors and the RadCalNet data is larger than 30 min, it cannot be expected for the intercomparison to account for unpredictable changes in atmospheric transmittance (e.g., due to intermittent sub-visual clouds). Moreover, the solar angle changes over 30 min are significant for making an assumption of similarity between the atmospheric path at the time of on-orbit sensor capture and RadCalNet surface measurements. An alternative approach is to perform a temporal correction to the RadCalNet TOA reflectance data to account for that time difference. We also omit images with large ground measurement variabilities to ensure that temporal variations in the surface and the atmosphere above the surface on the time scales of minutes are not the dominant source of uncertainty.
For the sensor zenith angle, we omit images with values larger than 20 degrees to reduce impacts from bi-directional reflectance effects at the test sites and the use of the nadir-viewing RadCalNet data. For the location ambiguity, the distance between the pixel center and the ground site is calculated and then used to filter VIIRS images. The VIIRS/JPSS1 Moderate Resolution Terrain Corrected Geolocation files include latitude/longitude arrays associated with the radiometric data of VIIRS/JPSS1 Moderate Resolution files. For each RadCalNet site, we select a single 750 m resolution VIIRS pixel that includes the latitude/longitude of that RadCalNet site (see Table 2). The distance can be calculated based on the latitude/longitude of the selected VIIRS pixels and latitude/longitude of RVUS and GONA using the Haversine formula. Images with a distance larger than 375 m are filtered. For the atmospheric condition, we used anomalous atmospheric conditions flags reported by RadCalNet [44].
Table 3 also lists the number of all ‘good data’ (data that were not filtered using the above method). After filtering the matchups, the total number of RadCalNet matchups reduces from 1426 VIIRS and 173 OLI images to 432 VIIRS and 129 OLI images, respectively.
Finally, due to the respective launch dates (listed in Table 3) and differences in revisit time for each of Landsat-8, Landsat-9, SNPP, and NOAA-20, the size of the datasets used in this work are disproportionate. The intercomparisons results discussed in the following sections will be based on two time groupings: (i) data after January 2018, when the RadCalNet data for both RVUS and GONA are available; and (ii) data after December 2021 when the first Landsat-9 OLI images were released. We exclude data prior to December 2021. as then, Landsat-9 was not on the Worldwide Reference System-2 (WRS-2) orbit.
Table 4 and Table 5 show the number of scenes filtered by each of the scene selection criteria discussed above. They do not take the overlaps among the scene selection criteria into account. That is, a scene could be filtered by the time difference criterion as well as the atmospheric condition criterion. Therefore, simply adding the number of filtered scenes listed in the tables would overestimate the number of total filtered scenes. However, these Tables provide insights into the dominant and negligible effect(s) in the scene filtering process described above. Among the scene selection methods used in this study,
  • the view geometry criterion was the dominant effect in the filtering of NOAA-20 VIIRS scenes;
  • the view geometry criterion was the dominant effect in the filtering of SNPP VIIRS scenes;
  • the time difference criterion was the dominant effect in the filtering of Landsat-8 OLI scenes; and
  • the atmospheric condition criterion was the dominant effect in the filtering of Landsat-9 OLI scenes.
The large difference between RVUS (see Table 4) and GONA (see Table 5) for the number of filtered scenes based on the atmospheric condition does not suggest superiority of atmospheric condition of one site over the other. The difference happens because the choice of atmospheric condition flags by operators of RVUS is stricter than those of GONA.

6. Results and Discussions

We use the good data, selected by the above scene selection criteria, to compare the TOA reflectance of satellite images and TOA reflectance of ground site measurements. TOA reflectance values for Landsat-8 OLI, Landsat-9 OLI and their corresponding RadCalNet data are shown in Figure S1. TOA reflectance values for NOAA-20 VIIRS, SNPP VIIRS, and their corresponding RadCalNet data are shown in Figure S2. Landsat-8 OLI and Landsat-9 OLI collectively provide 50 images of RVUS and 79 images of GONA that meet the above scene selection criteria over five years (see Table 3). SNPP VIIRS and NOAA-20 VIIRS provide 200 images of RVUS and 214 images of GONA. The number of images from VIIRS instruments is larger than OLI because of the shorter revisit times due to the larger swath width of VIIRS.
Figure 3A shows the ratio of TOA reflectance values of the total 414 scenes as a function of time for similar spectral bands of the four sensors centered at about 865 nm (bands M7 of VIIRS and B5 of OLI). The lack of data, as seen in Figure 3A, for ratio values prior to 2021 from Landsat-9 is because Landsat-9 is a more recent EO mission launched in September 2021. A truncated version of Figure 3A using only the scenes captured on and after the release of Landsat-9′s initial calibrated images (December 2021) is shown in Figure 3B.
Satellite sensor datasets of this study are multispectral, and the RadCalNet dataset is hyperspectral. RadCalNet uses a triangular-shaped response with a 10 nm full width at half maximum for radiative transfer code calculations, and has a spectral sampling of 10 nm. The spectral resolutions were determined to ensure below a 0.5% impact on the TOA reflectance uncertainty budget [44]. Here, we used the trapezoidal rule to numerically convolve the RadCalNet spectra with the relative spectral responses (see Figure 2) of the satellite sensors. The convolution process simulates band-averaged values of RadCalNet spectra for comparison to those satellite sensors. The band-averaged TOA reflectance values are used as a denominator of Equation (2) to calculate TOA reflectance ratio values shown in Figure 3, Figure 4, Figure 5, Figure 6, Figure 7 and Figure 8.
For a statistical understanding of the TOA reflectance ratios across the spectral bands and for the four sensors, we calculate their average and standard deviation values (also referred to as ‘the intercomparison results’) over time (starting from 2018 or December 2021), labeled as the temporal average and standard deviation of the ratios in Figure 4, Figure 5, Figure 6, Figure 7 and Figure 8. The intercomparison results of Figure 4, Figure 5, Figure 6, Figure 7 and Figure 8 are population mean of calibration coefficients that, by convention, are shown as the division of TOA reflectance values from sensors ( ρ s e n s o r ) to TOA reflectance values from on-site measurements ( ρ s i t e ):
G = ρ s e n s o r ρ s i t e
Relying on temporal averaging over a long period of time implicitly assumes that the sensors are radiometrically stable (a measure of a sensor’s radiometric response over years) or that the TOA reflectance products have already been corrected for any changes in sensor behavior. This assumption is correct for the calibrated images of the Landsat-8 OLI and both VIIRS sensors used in this study. Landsat-8 OLI’s within-scene and between-scene 2σ stabilities were shown to be within 0.25% [25]. Most of the SNPP VIIRS reflective solar bands in VNIR were shown to be stable to within 1% using PICS-based approaches [27]. Early results from NOAA-20 VIIRS also indicate that calibration coefficients have been very stable [50]. However, the radiometric long-term stability of a sensor is not always negligible, as seen in case of Landsat-5′s Thematic Mapper (TM) and Terra platform’s Advanced Spaceborne Thermal Emission and Reflection Radiometer (ASTER) and Moderate Resolution Imaging Spectroradiometer (MODIS) [51,52]. As a result, the instability of the radiometric response of the sensors could potentially introduce noticeable shifts into the intercomparison results. One of the goals of this work was to validate the radiometric stability of Landsat-9 OLI through intercomparison with the three other sensors shown here.

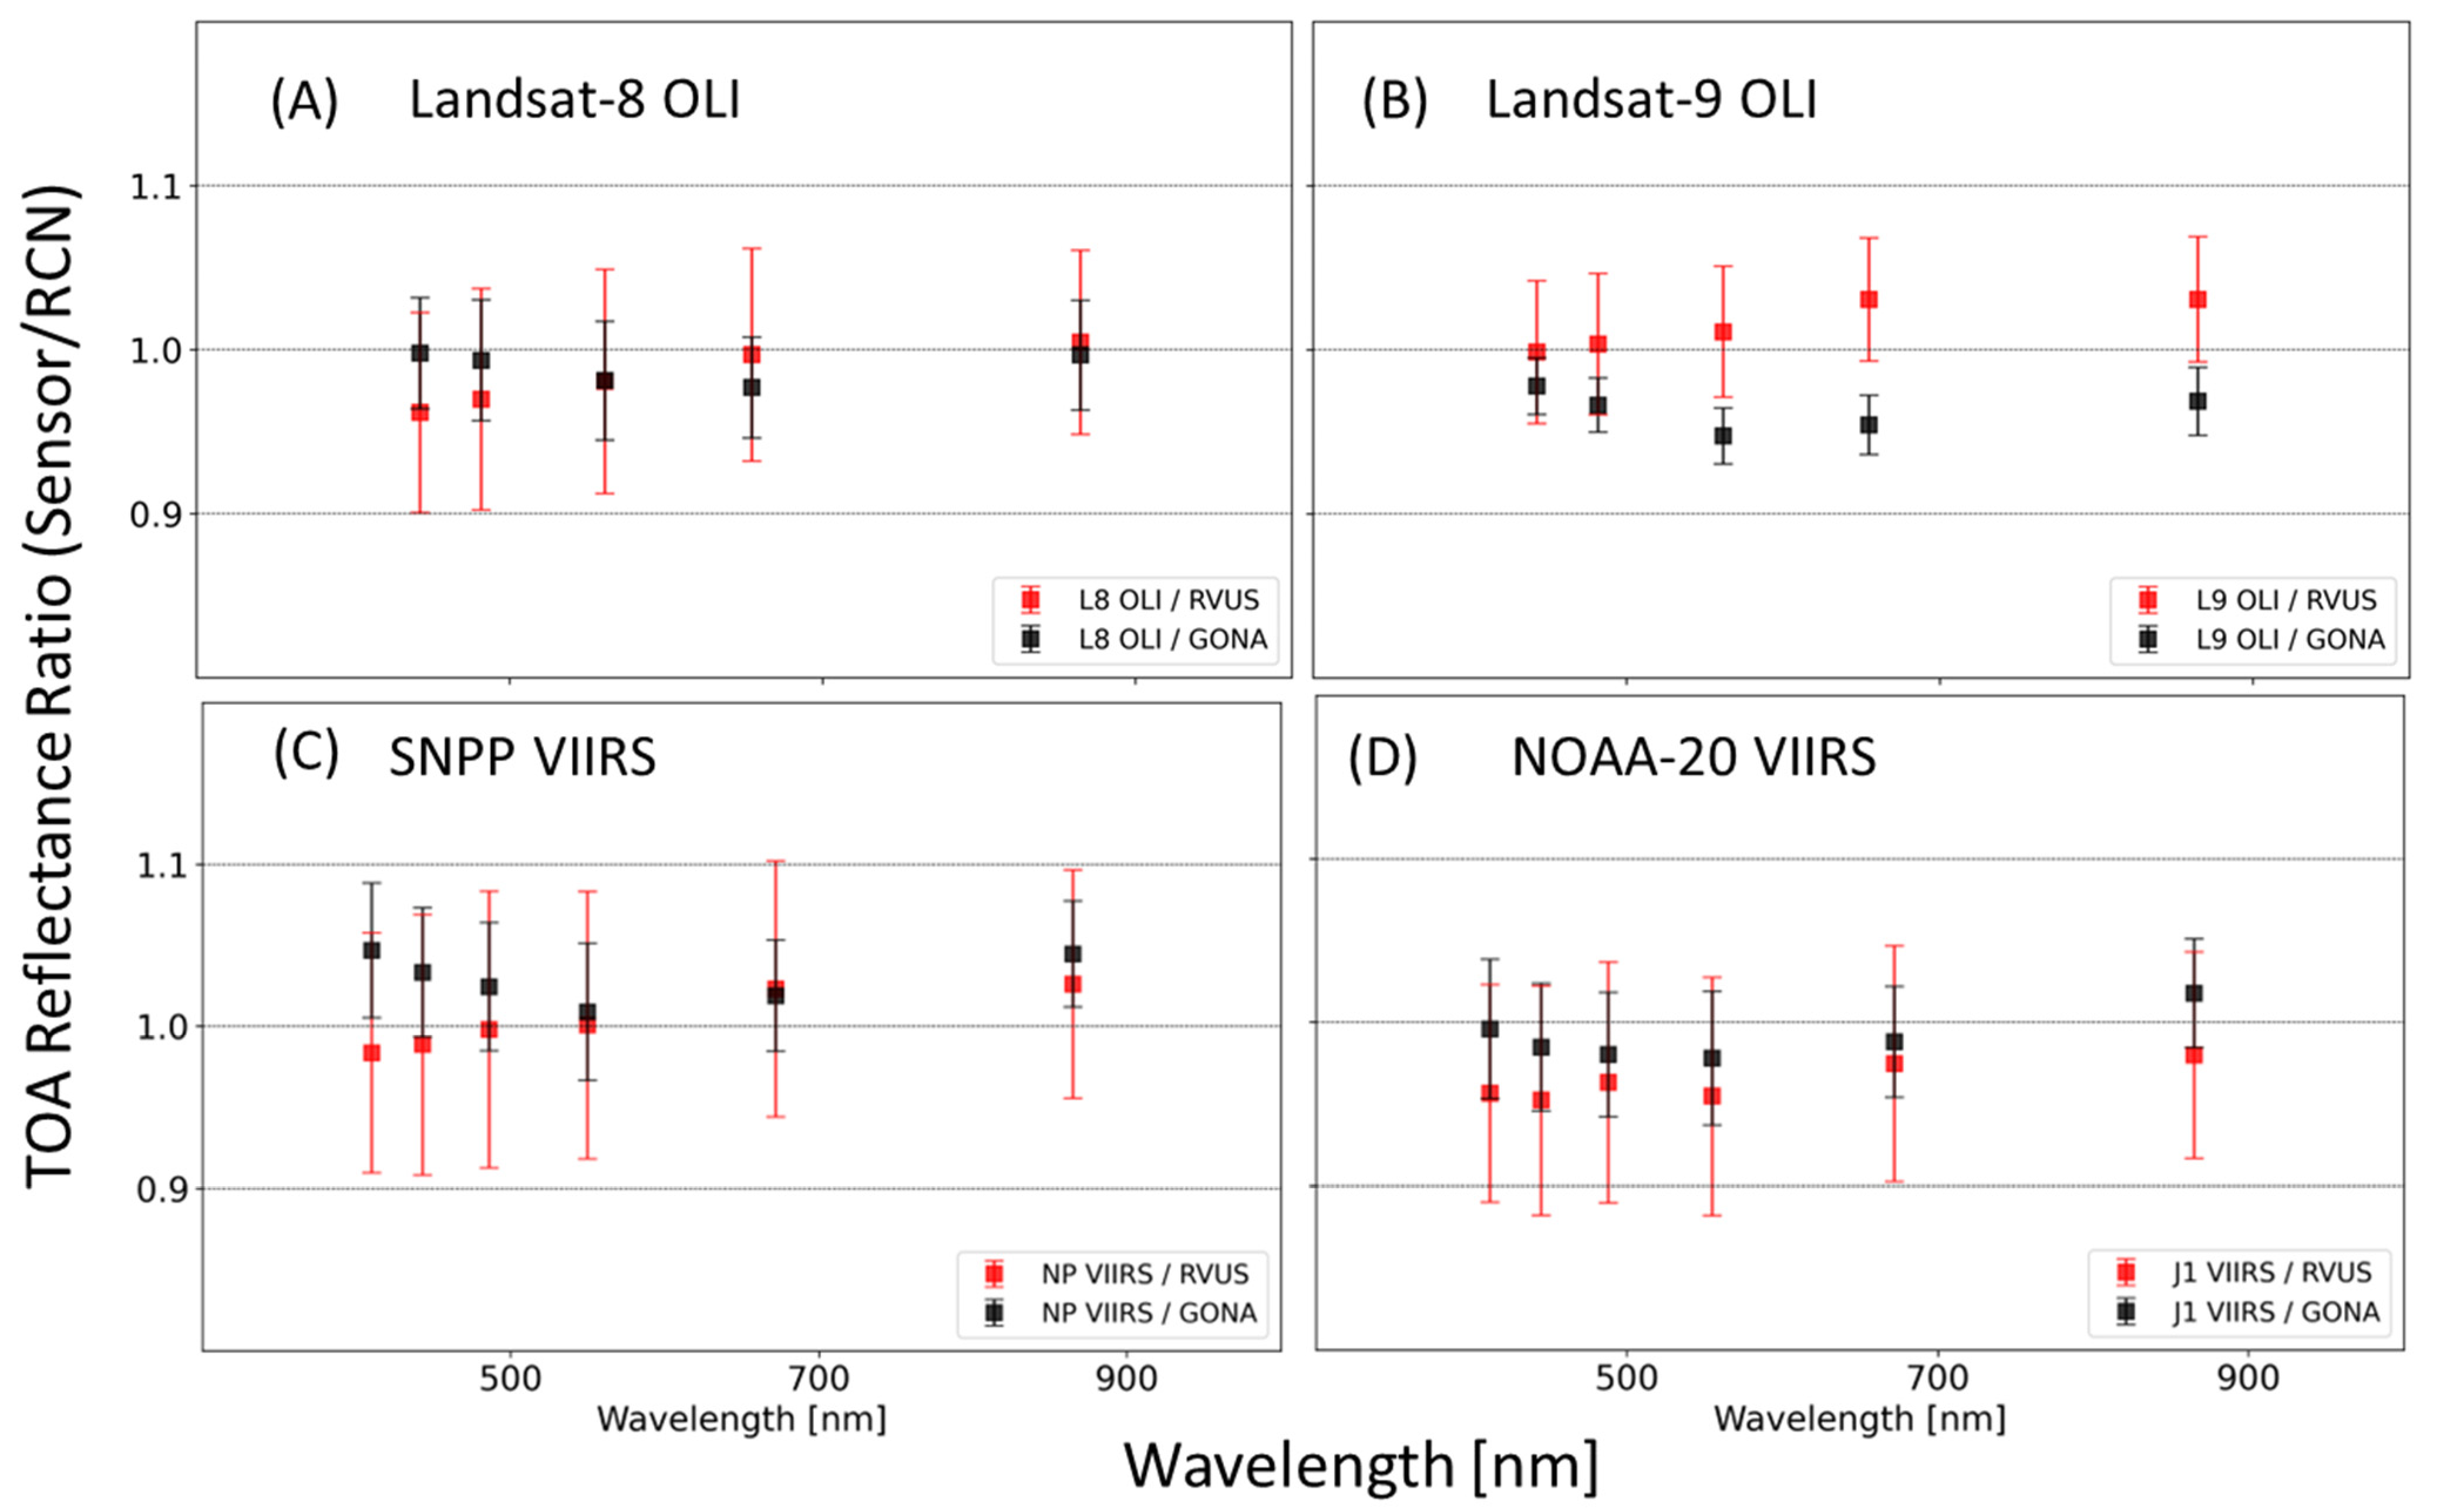
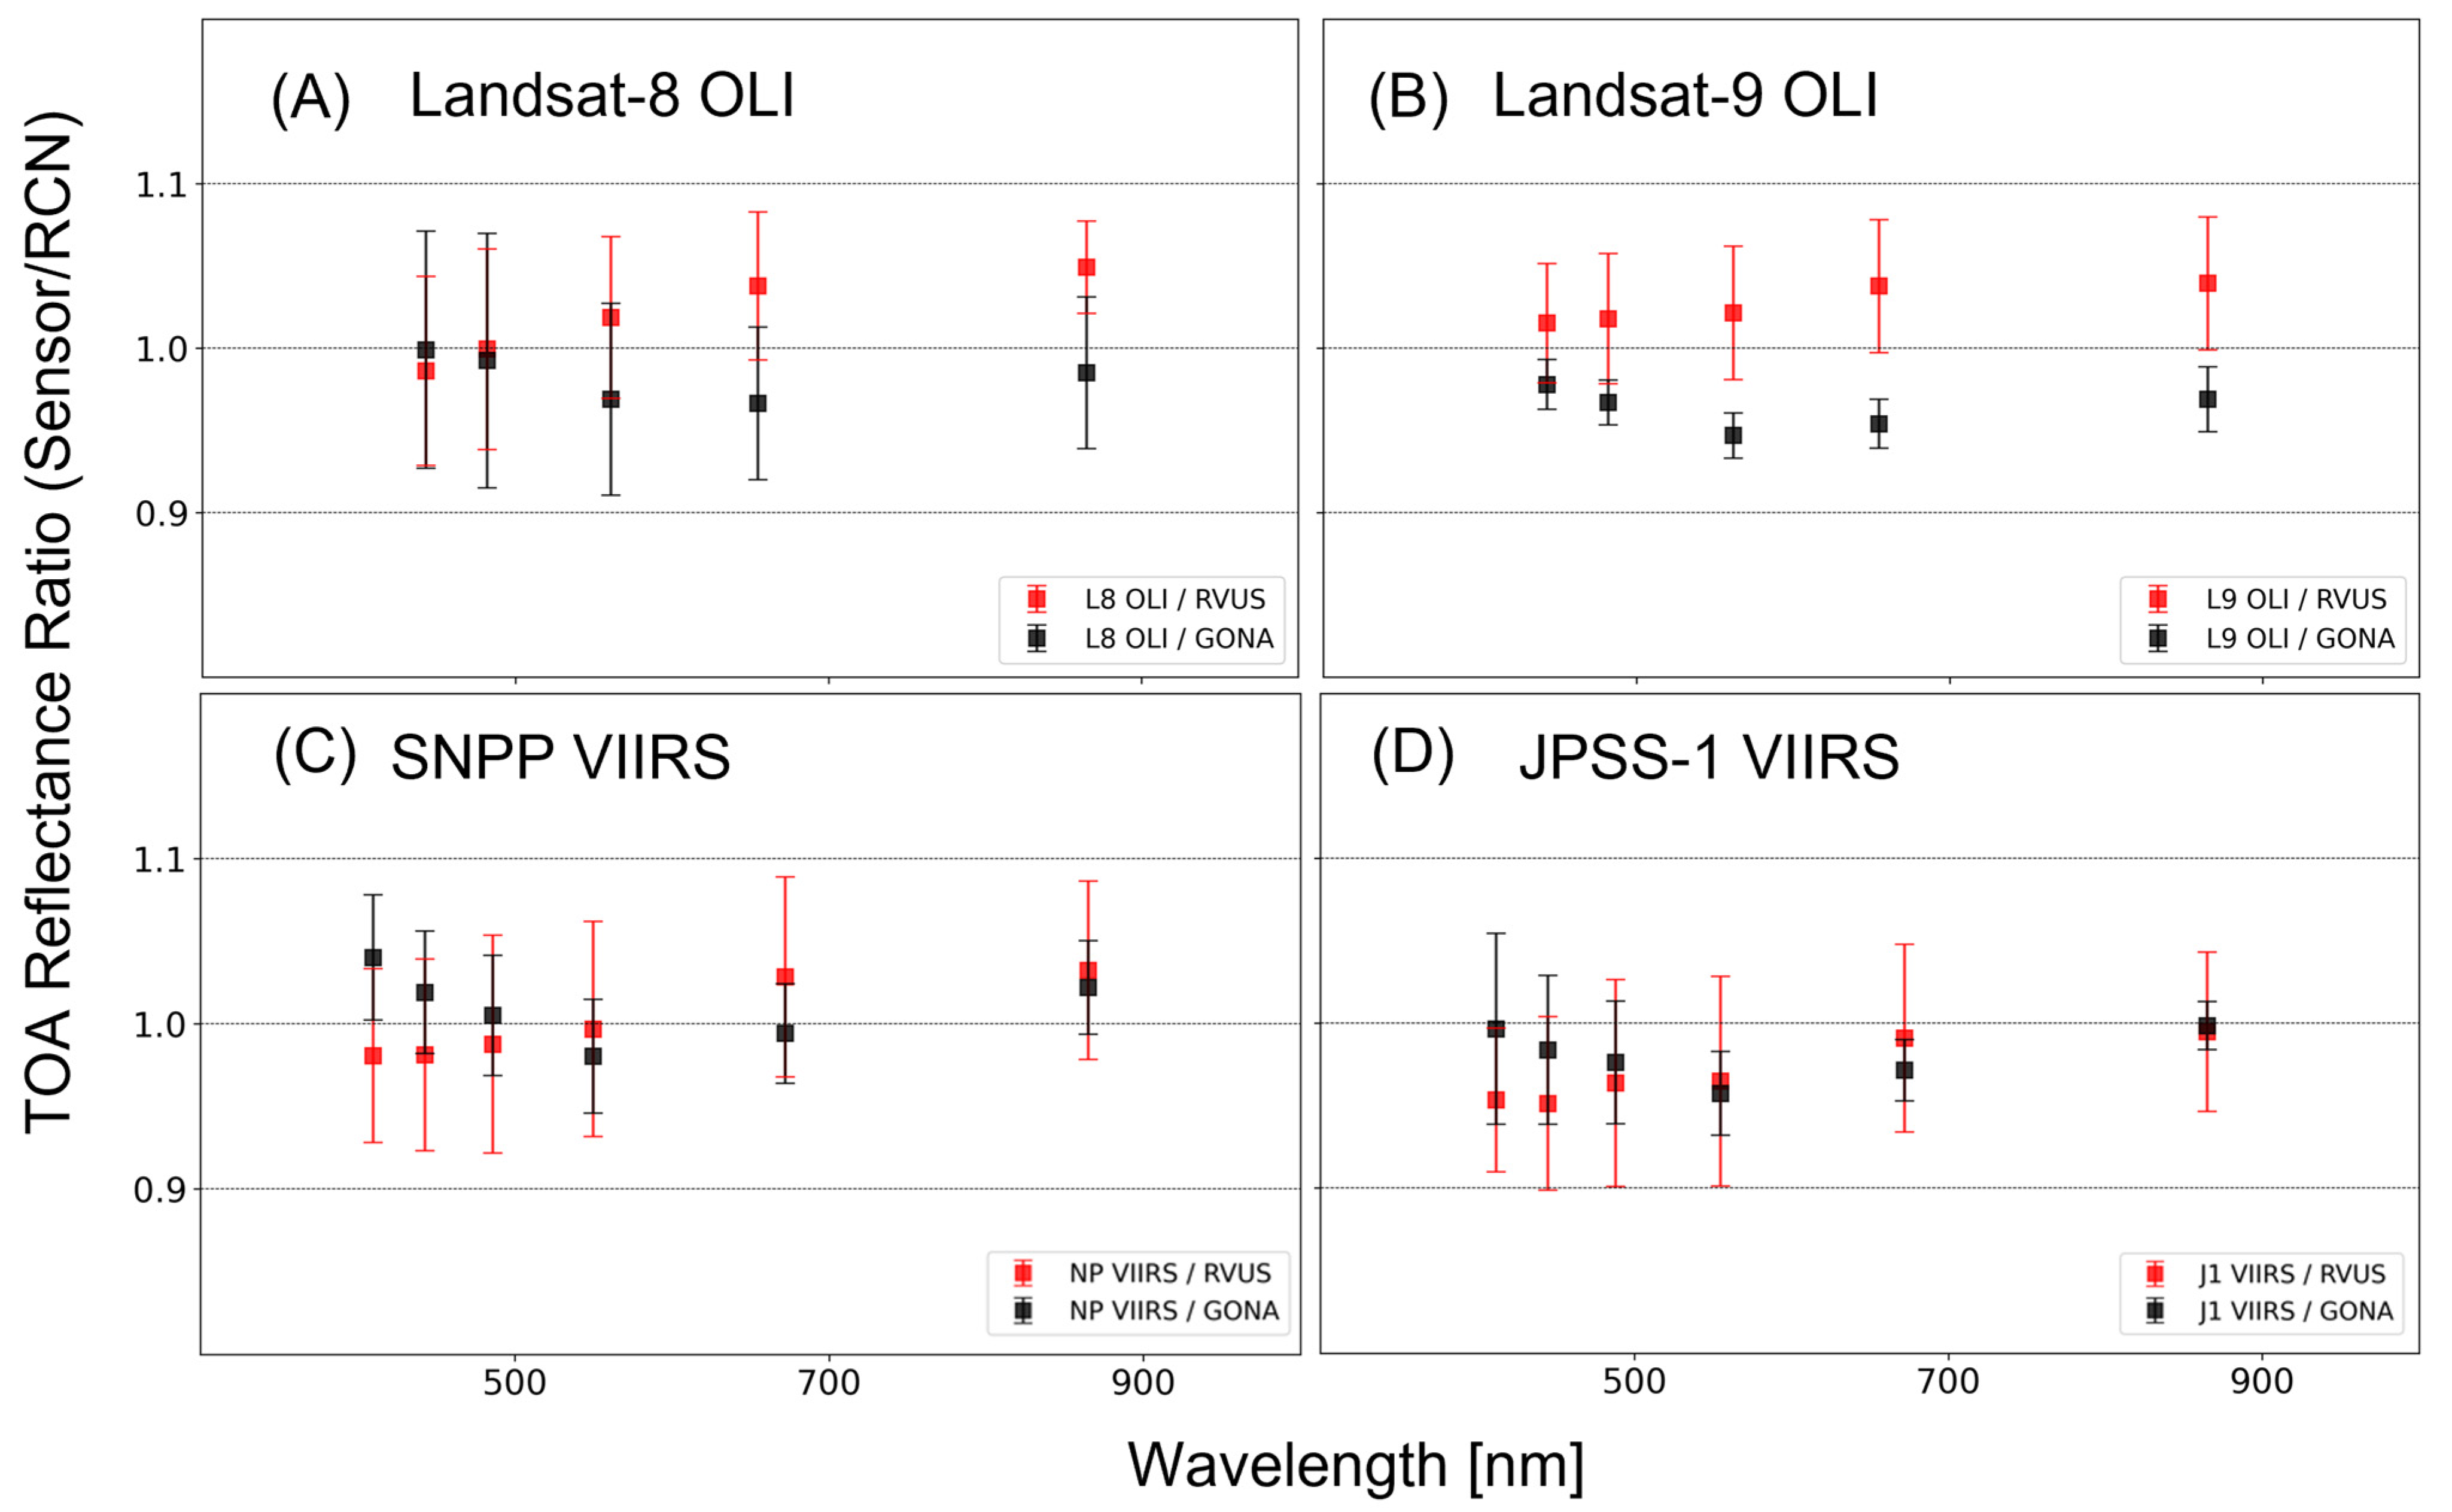
6.1. Single-Site Evaluation

Figure 4 shows the intercomparison results for the satellite sensors over (A) RVUS for images recorded since January 2018, (B) RVUS for images recorded since December 2021, (C) GONA for images recorded since January 2018, and (D) GONA for images recorded since December 2021. Each of the intercomparison results of Figure 4A–D is based on two sets of independent observations: (i) the TOA reflectance values reported by each EO sensor and (ii) the TOA reflectance values reported by RadCalNet. For the EO sensors of this study, the absolute standard uncertainty (k = 1) is ~3% across the VNIR bands. The absolute standard uncertainty of the hyperspectral TOA reflectance results of RadCalNet is reported for each wavelength [40]. Each intercomparison ratio is calculated by an arithmetic division of the two independent (uncorrelated) observations. Therefore, we can calculate the combined standard uncertainty u c G of the intercomparison results G by appropriately combining the standard uncertainties of the two independent observations using the law of propagation of uncertainties [53]:
u c G = i = 1 N f ρ i 2 u 2 ρ i
where f is the arithmetic division of the two independent observations (Equation (2)) and is used to evaluate the measurand G . f ρ s e n s o r = 1 ρ s i t e and f ρ s i t e = ρ s i t e ρ s e n s o r . Therefore, the combined standard uncertainty u c G from Equation (3) reduces to
u C G = ρ s e n s o r ρ s i t e u ρ s e n s o r ρ s e n s o r 2 + u ρ s i t e Y ρ s i t e 2
The temporal average of the ratios G ¯ is calculated by summing individual single-site ratios and then dividing them by the number of the ratios:
G ¯ = G 1 + G 2 + + G n n
where n is the population number. For each ratio, we can assume random effects and systematic effects:
G i = m + s + r
where m is the level of the intercomparison, s represents the systematic effects, and r represents the random effects. Both s and r are under repeatability conditions and are assumed to be normally distributed with expectation zero and unknown standard deviations. While the random effects from uncorrelated measurements may reduce by a factor of n , the uncertainties associated with systematic effects are considered to stay the same, because they do not change between observations. Although the uncertainty values of RadCalNet data slightly change from measurement to measurement, they are similar, and here, we consider an average of uncertainties calculated by Equation (4) to be representative of the combined standard uncertainty for the temporal average of ratios G ¯ . Since the uncertainties reported by RadCalNet are wavelength-dependent, the resultant combined standard uncertainties of these intercomparison results are also wavelength-dependent. The combined standard uncertainties of the intercomparison results are between 5% and 6% across the spectral bands of this study, as shown in Figure 4. The temporal average results of Figure 4A–D are all within 5% of unity, and therefore are within the combined standard uncertainties of the intercomparisons.
One goal of RadCalNet is to allow users to increase the number of available calibration opportunities by using data products from multiple sites [8]. Figure 5 helps to understand the significance of possible systematic differences between RVUS and GONA. Comparing the intercomparison of results for Landsat-8 OLI and NOAA-20 VIIRS over RVUS and GONA shows that the temporal averages for all bands are statistically similar at the 5% confidence level and agree within the combined standard uncertainties for these intercomparisons (~5–6% across bands). For B3–B5 of Landsat-9 OLI, the difference between the means of ratios between RVUS and GONA is greater than 5%. Additionally, the means of ratios for band M1 of the SNPP VIIRS between RVUS and GONA are also greater than 5%. Nevertheless, taken individually, every intercomparison result of Figure 5 is within 5% of unity, which is smaller the preceding combined standard uncertainties of ~5–6% across bands.
The arithmetic means and standard deviations of the intercomparison results change if we compare the sensors only based on scenes with temporal overlap (captured on and after the December 2021) to Landsat-9 OLI (see Figure 6). The conclusions, however, remain the same, except that we observe that the intercomparison results of Landsat-8 OLI become more similar to those of Landsat-9 OLI. This confirms the earlier calibration reports that the two Landsat instruments are radiometrically similar [54,55,56,57]. That is, the TOA reflectance ratio values for Landsat-8 OLI/RVUS increase, and the TOA reflectance ratio values for Landsat-8 OLI/GONA decrease, such that the separation between the means of the intercomparison results widens. These changes in the intercomparison results of Landsat-8 OLI over RadCalNet sites causes the difference between ratio means for bands B3-B5 of Landsat-8 OLI to become greater than 5% between the two sites. Taken individually, each of the intercomparison results of Figure 6 is within the combined standard uncertainties of ~5–6% across the spectral bands.
One way to confirm possible biases seen in the intercomparison results between sensors, shown in Figure 5 and Figure 6, is to compute the so-called “double ratios”. This involves dividing the calibration coefficients obtained for a pair of sensors [58]. Doing so reduces biases from the calibration sites. In Figure 7A,B we plot the double ratios of the calibration coefficients of Landsat-8 OLI and Landsat-9 OLI, each calculated with reference to RVUS (shown in Figure 4). In the same graphs, we plot the double ratios of the calibration coefficients of Landsat-8 OLI and Landsat-9 OLI, each calculated with reference to GONA (also shown in Figure 4). The double-ratio intercomparison results further divide the two intercomparison results for each sensor with reference to RadCalNet, and a value of unity in the double ratio indicates that the two sensors being compared agree with one another. The observed difference between the instruments in each of the plots of Figure 7 could be due to differences in their prelaunch radiometric calibration, differences in onboard diffuser bidirectional reflectance distribution function (BRDF) effects between them, or different behaviors in the sensors that are not captured by the onboard calibrations. In addition, the differences between Landsat-8 OLI and Landsat-9 OLI in Figure 7A could be in part influenced by disproportionate size of the datasets (see Table 3) used in the plot. Double ratio results for the same two instruments become more similar in Figure 7B compared to Figure 7A, because Landsat-8 OLI data are limited to those captured since December 2021, which is the date Landsat-9 began its operation on the WRS-2 orbit. We can calculate the combined standard uncertainty of the double-ratio intercomparison results by appropriately combining their standard uncertainties. The combined standard uncertainties for the double-ratio intercomparison results are ~7% for RVUS and ~8% for GONA. Therefore, the double-ratio intercomparison results for the OLI agree to within the combined standard uncertainties of this intercomparison.
Figure 7C,D show the double ratios of the calibration coefficients of SNPP VIIRS and NOAA-20 VIIRS, each calculated with reference to RVUS (in red) and with reference to GONA (in black). The calibration coefficients for both sensors are shown in Figure 4. We observe good agreement between the intercomparison results of the two sites, but this is lower than the unity across spectral bands. This suggests that SNPP VIIRS scenes are on average brighter than those of NOAA-20 VIIRS. Like the OLI sensors, the combined standard uncertainties for the double-ratio intercomparison results are ~7% for RVUS and ~8% for GONA. Therefore, the double-ratio intercomparison results for the VIIRS sensors also agree to within the combined standard uncertainties of this intercomparison.

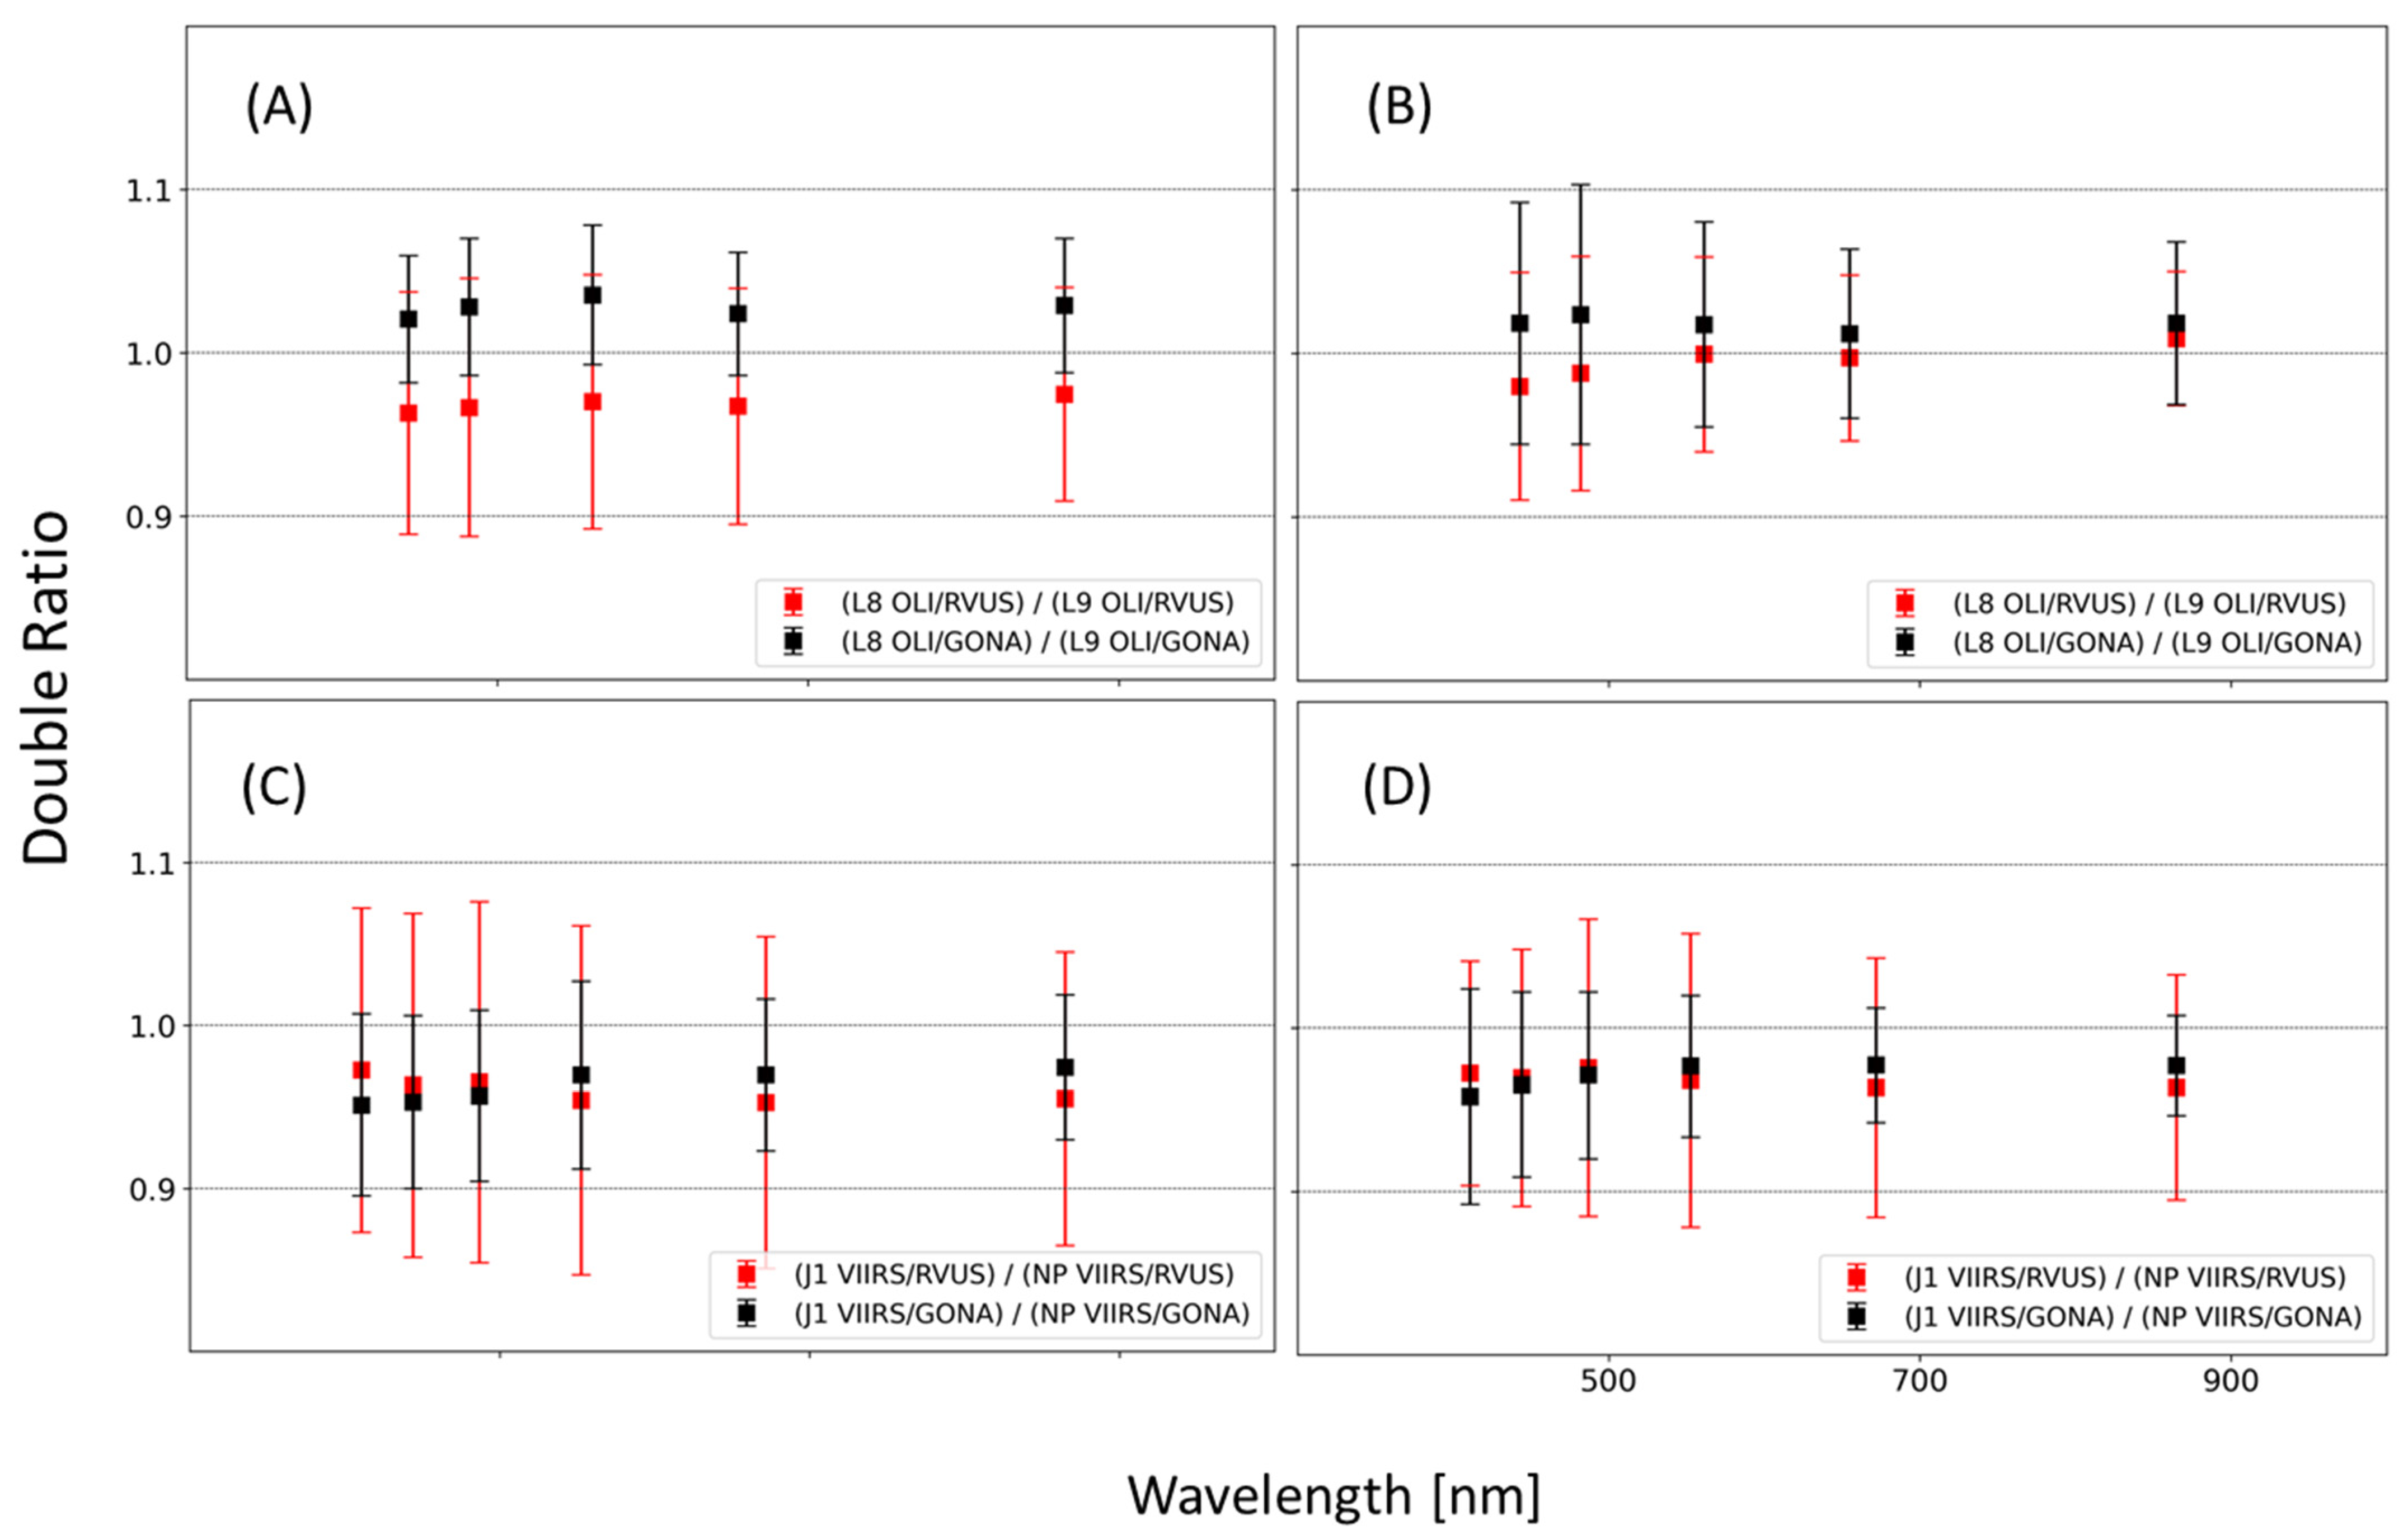
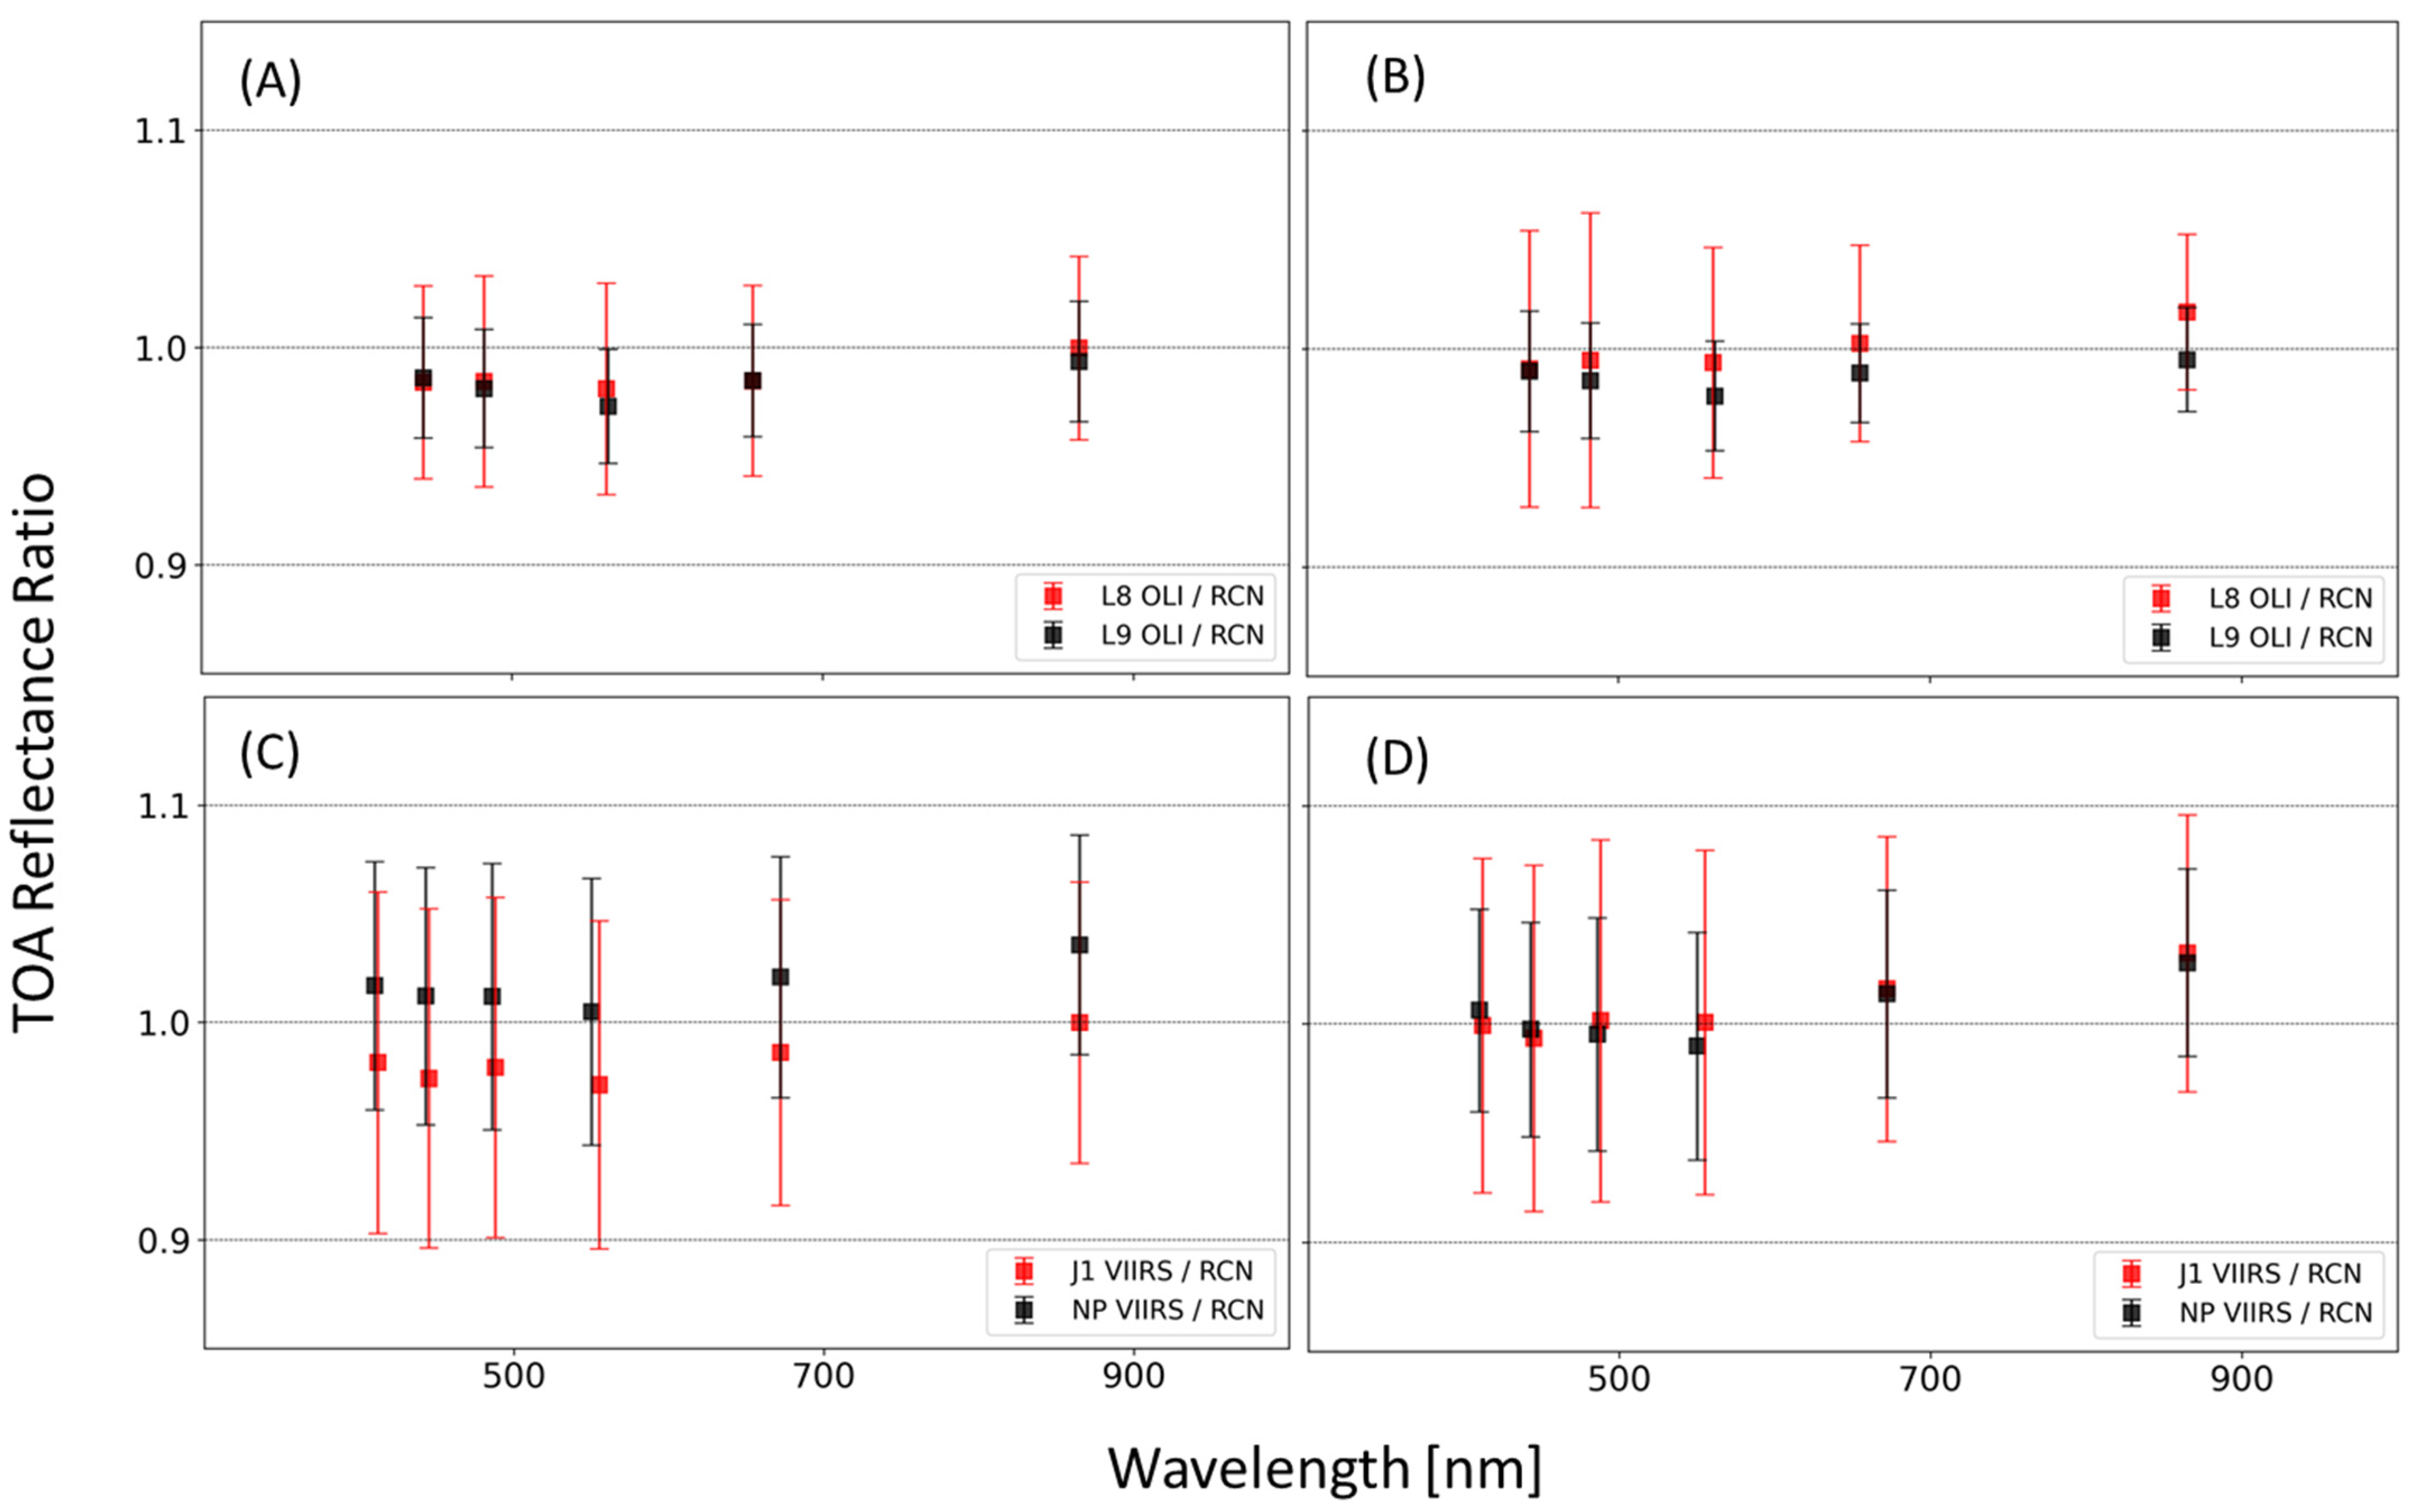
6.2. Multi-Site Evaluation

Intercomparison results of Figure 8A,B combine the data from both calibration sites. As discussed above with respect to Figure 3, Landsat-8 OLI, Landsat-9 OLI, SNPP VIIRS, and NOAA-20 VIIRS are well-understood sensors, and their calibrated data products do not change significantly over time. Therefore, we could assess the suitability of the method of combining the intercomparison results of these on-orbit instruments with reference to the RVUS and GONA sites. After this, we refer to the combination of RadCalNet sites RVUS and GONA as ‘RCN’.
The intercomparison results from Landsat-8 OLI and Landsat-9 OLI over RCN sites are very similar (with a bias of smaller than 1%). This again confirms the similarities between the two OLI instruments. On the other hand, the visual inspection of data in Figure 8C indicates the intercomparison results from NOAA-20 VIIRS over RCN appear to have lower ratios than those from SNPP VIIRS over RCN. This again suggests that SNPP VIIRS scenes are on average brighter than those of NOAA-20 VIIRS, with a bias of about 2% [59]. The observed difference between SNPP VIIRS and NOAA-20 VIIRS could be due to differences in the prelaunch radiometric calibration, differences in diffuser BRDF effects between the two sensors, or different behaviors in the sensors that are not captured by the onboard calibrations. The observed difference is not, however, statistically significant, and is well within the combined standard uncertainties for the intercomparison results (between ~5% and 6%). The intercomparison results with regard to RVUS and GONA are viewed as independent estimates, and the difference between the uncertainties of the intercomparison results from the two sites u c y 1 and u c y 2 are viewed as statistically insignificant. Therefore, we can use a pooled estimate of the standard uncertainty for each site to evaluate the standard uncertainty of results from the combined sites. That is, we take a weighted average of the intercomparison uncertainties for each site weighted by its respective degree of freedom [53]:
u c y D R = n 1 u c y 1 + n 2 u c y 2 n 1 + n 2
where the weights n 1 and n 2 are the number of scenes reported in Table 3. Since the intercomparison results are based on RadCalNet sites with a common atmospheric radiative transfer code, it is expected that differences caused by aerosol modelling discrepancies or spectral resolutions will be minimal.
The size of the datasets used for the intercomparison results of Landsat-9 with the other three sensors, shown in Figure 8A,C, are disproportionate. Figure 8B,D show a subset of the data for only those dates after December 2021. The means and the spreads of the intercomparison results for the subset of Landsat-8 OLI and Landsat-9 OLI images, shown in Figure 8B, are very similar to those from Figure 8A. This result suggests radiometric stability of the calibrated Landsat-8 OLI.

7. Conclusions

Using the spectral TOA reflectance data of RadCalNet enables this study to include instruments across the range of spectral bands and spatial sampling distances of OLI and VIIRS. The VNIR image products of Landsat-9 OLI were compared with the VNIR image products of Landsat-8 OLI, SNPP VIIRS, and NOAA-20 VIIRS, using the SI-traceable in situ data approach of RadCalNet as a common reference. Combining SI-traceable in situ data from multiple RadCalNet sites improved the number of available calibration opportunities in this study. The combined number of matchups between clear-sky Landsat-9 OLI satellite images and RadCalNet data for the period of December 2021 to December 2022 increased to a total of 30 possible matchups, of which 17 belonged to RVUS and 13 belonged to GONA. The work here excluded cases for which the time difference between the imagery and the RadCalNet data points exceeded more than 30 min, and this further reduced the Landsat 9 cases to 20. Including multiple RadCalNet sites in the evaluation of Landsat 9 nearly doubles the number of data points available from a single site, and the larger sample size leads to improved statistical confidence in Landsat-9 OLI’s stability over the time period for which it has been in orbit.
Using multiple independent calibration sites also reduced the possibility of systematic biases in our study. The two RadCalNet sites used in this study are widely separated (GONA is in the southern hemisphere, and RVUS is in the northern hemisphere), have different operators (GONA is operated by NPL, and CNES and RVUS are operated by the University of Arizona), and have independent traceability to the SI (the GONA instrument is ROSAS, and RVUS uses multiple ground viewing radiometers (GVRs)). Therefore, having the opportunity to look at the intercomparison results of Landsat-9 OLI compared to each calibration site individually and then in combination shows no significant site-dependent biases in the combination of data from RVUS and GONA.
Data from other RadCalNet sites (currently BTCN, BSCN, and LCFR) could also be used to increase the number of available datasets for the intercomparisons. The feasibility of combining data from the other sites, however, depends on the spatial resolution of the sensor under study and the calibration study approach (absolute or relative intercomparison). It is possible to use ground sites with footprints smaller than the spatial resolution of the EO sensors under study, in a relative manner [46]. Because this study included VIIRS data products with 750 m2 footprint, including BTCN, BSCN, and LCFR for that data would have been in the manner of a relative intercomparison (not an absolute one), but the use of the RadCalNet datasets would provide opportunities to take advantage of the atmospheric and surface data to improve the relative comparisons.
One of the challenges associated with using automated calibration sites is identifying the best criteria for filtering out the scenes not suitable for radiometric calibration due to anomalous atmospheric and surface conditions. For example, during the preparation of this intercomparison study, we noted the presence of snow and moisture in the proximity of the Railroad Valley Playa calibration site in December 2021 and January 2022. Events like this can temporarily impact the uncertainties of the TOA reflectance results of the calibration site and consequently shift the overall intercomparison results. One way to circumvent such temporary effects is adding additional scene selection criteria to filter out scenes that are impacted by such meteorological events. For example, one scene selection criterion may be eliminating scenes with BOA reflectance values below a threshold value indicative of present moisture at the calibration site.
The work shown here gives added confidence that the Landsat 9 OLI is continuing the Landsat legacy of high-quality radiometric data, and that users should have confidence in using the combination of the two OLI sensors to provide data products with eight-day repeats. The use of multiple RadCalNet sites has allowed such conclusions to be made with only a little more than one year of data. Future sensor teams will clearly benefit from the prospect of additional RadCalNet sites offering the possibility that SI-traceable, absolute radiometric calibrations with uncertainties <4% could be derived in a matter of months.

Supplementary Materials

The following supporting information can be downloaded at: https://www.mdpi.com/article/10.3390/rs15235562/s1, Figure S1: TOA reflectance and RadCalNet predicted TOA reflectance for Landsat-8 OLI and Landsat-9 OLI filtered using scene selec-tion criteria described in Section 4 of the manuscript; Figure S2: TOA reflectance and RadCalNet predicted TOA reflectance for NOAA-20 (JPSS-1) VIIRS and SNPP VIIRS filtered using scene selection criteria described in Section 4 of the manuscript; Data S1: intercomparison data from NOAA-20 VIIRS for GONA site, Data S2: intercomparison data from NOAA-20 VIIRS for RVUS site, Data S3: intercomparison data from SNPP VIIRS for GONA site, Data S4: intercomparison data from SNPP VIIRS for RVUS site, Data S5: intercomparison data from Landsat-8 OLI for GONA site, Data S6: intercomparison data from Landsat-8 OLI for RVUS site, Data S7: intercomparison data from Landsat-9 OLI for GONA site, Data S8: intercomparison data from Landsat-9 OLI for RVUS site.

Author Contributions

Conceptualization, M.H.T., B.N.W. and K.T.; methodology, M.H.T. and K.T.; software, M.H.T.; validation, M.Y. and N.V.; formal analysis, M.H.T.; investigation, M.H.T.; resources, M.H.T.; data curation, M.H.T.; writing—original draft preparation, M.H.T.; writing—review and editing, K.T. and B.N.W.; visualization, M.H.T.; supervision, B.N.W. and K.T.; project administration, B.N.W. and K.T.; funding acquisition, K.T. All authors have read and agreed to the published version of the manuscript.

Funding

This research was funded by the National Aeronautics and Space Administration (NASA).

Data Availability Statement

The data used in this study are openly available: (1) The SNPP data presented in this study are openly available at 10.5067/VIIRS/VNP02MOD.002 and 10.5067/VIIRS/VNP03MOD.002; (2) The NOAA-20 data presented in this study are openly available at 10.5067/VIIRS/VJ102MOD.002 and 10.5067/VIIRS/VJ103MOD.002; (3) The Landsat-8 data and Landsat-9 data presented in this study are openly available at 10.5066/P975CC9B; (4) The RadCalNet data presented in this study are openly available at www.radcalnet.org (accessed on 15 January 2023).

Acknowledgments

We would like to thank Radiometric Calibration Network Working Group (RadCalNet) within Committee on Earth Observation Satellites (CEOS) for making the radiometric calibration data free and open access for the user community. Jeffrey Czapla-Myers at the University of Arizona kindly provided information on the automated instrumentation of the RVUS site. We would also like to thank the reviewers for their comments which surely improved the quality of this article.

Conflicts of Interest

The authors declare no conflict of interest.

References

  1. Niro, F.; Goryl, P.; Dransfeld, S.; Boccia, V.; Gascon, F.; Adams, J.; Themann, B.; Scifoni, S.; Doxani, G. European Space Agency (ESA) Calibration/Validation Strategy for Optical Land-Imaging Satellites and Pathway towards Interoperability. Remote Sens. 2021, 13, 3003. [Google Scholar] [CrossRef]
  2. Claverie, M.; Ju, J.; Masek, J.G.; Dungan, J.L.; Vermote, E.F.; Roger, J.C.; Skakun, S.V.; Justice, C. The Harmonized Landsat and Sentinel-2 surface reflectance data set. Remote Sens. Environ. 2018, 219, 145–161. [Google Scholar] [CrossRef]
  3. Bounoua, L.; Zhang, P.; Mostovoy, G.; Thome, K.; Masek, J.; Imhoff, M.; Shepherd, M.; Quattrochi, D.; Santanello, J.; Silva, J.; et al. Impact of urbanization on US surface climate. Environ. Res. Lett. 2015, 10, 084010. [Google Scholar] [CrossRef]
  4. Schimel, D.S.; Poulter, B. The Earth in Living Color-NASA’s Surface Biology and Geology Designated Observable. In Proceedings of the 2022 IEEE Aerospace Conference (AERO), Big Sky, MT, USA, 5–12 March 2022; pp. 1–6. [Google Scholar] [CrossRef]
  5. Jiang, J.; Zhang, Q.; Wang, W.; Wu, Y.; Zheng, H.; Yao, X.; Zhu, Y.; Cao, W.; Cheng, T. MACA: A relative radiometric correction method for multiflight unmanned aerial vehicle images based on concurrent satellite imagery. IEEE Trans. Geosci. Remote Sens. 2022, 60, 1–14. [Google Scholar] [CrossRef]
  6. Moghimi, A.; Mohammadzadeh, A.; Celik, T.; Brisco, B.; Amani, M. Automatic Relative Radiometric Normalization of Bi-Temporal Satellite Images Using a Coarse-to-Fine Pseudo-Invariant Features Selection and Fuzzy Integral Fusion Strategies. Remote Sens. 2022, 14, 1777. [Google Scholar] [CrossRef]
  7. Newell, D.B.; Tiesinga, E. The International System of Units (SI); NIST Special Publication 330; National Institute of Standards and Technology: Gaithersburg, MD, USA, 2019. [CrossRef]
  8. Bouvet, M.; Thome, K.; Berthelot, B.; Bialek, A.; Czapla-Myers, J.; Fox, N.P.; Goryl, P.; Henry, P.; Ma, L.; Marcq, S.; et al. RadCalNet: A Radiometric Calibration Network for Earth Observing Imagers Operating in the Visible to Shortwave Infrared Spectral Range. Remote Sens. 2019, 11, 2401. [Google Scholar] [CrossRef]
  9. Micijevic, E.; Barsi, J.A.; Haque, O.; Levy, R.; Anderson, C.; Thome, K.; Czapla-Myers, J.; Helder, D. Radiometric performance of the Landsat 9 Operational Land Imager over the first 8 months on orbit. In Proceedings of the SPIE Optical Engineering + Applications, San Diego, CA, USA, 21–26 August 2022. [Google Scholar] [CrossRef]
  10. Jing, X.; Uprety, S.; Liu, T.-C.; Zhang, B.; Shao, X. Evaluation of SNPP and NOAA-20 VIIRS Datasets Using RadCalNet and Landsat 8/OLI Data. Remote Sens. 2022, 14, 3913. [Google Scholar] [CrossRef]
  11. Chander, G.; Xiong, X.J.; Choi, T.J.; Angal, A. Monitoring on-orbit calibration stability of the Terra MODIS and Landsat 7 ETM+ sensors using pseudo-invariant test sites. Remote Sens. Environ. 2010, 114, 925–939. [Google Scholar] [CrossRef]
  12. Markham, B.; Barsi, J.; Kvaran, G.; Ong, L.; Kaita, E.; Biggar, S.; Czapla-Myers, J.; Mishra, N.; Helder, D. Landsat-8 operational land imager radiometric calibration and stability. Remote Sens. 2014, 6, 12275–12308. [Google Scholar] [CrossRef]
  13. Kaita, E.; Markham, B.; Haque, M.O.; Dichmann, D.; Gerace, A.; Leigh, L.; Good, S.; Schmidt, M.; Crawford, C.J. Landsat 9 Cross Calibration Under-Fly of Landsat 8: Planning, and Execution. Remote Sens. 2022, 14, 5414. [Google Scholar] [CrossRef]
  14. Barsi, J.A.; Lee, K.; Kvaran, G.; Markham, B.L.; Pedelty, J.A. The Spectral Response of the Landsat-8 Operational Land Imager. Remote Sens. 2014, 6, 10232–10251. [Google Scholar] [CrossRef]
  15. Barsi, J.A.; Markham, B.L.; McCorkel, J.; McAndrew, B.; Donley, E.; Morland, E.; Pharr, J.; Rodriguez, M.; Shuman, T.; Sushkov, A.; et al. The operational land Imager-2: Prelaunch spectral characterization. In Proceedings of the SPIE Optical Engineering + Applications, San Diego, CA, USA, 11–15 August 2019; Volume 11127, pp. 35–45. [Google Scholar] [CrossRef]
  16. VIIRS Relative Spectral Response Functions (RSR). Available online: https://ncc.nesdis.noaa.gov/VIIRS/VIIRSSpectralResponseFunctions (accessed on 15 November 2022).
  17. Moeller, C.; Schwarting, T.; McIntire, J.; Moyer, D.I.; Zeng, J. JPSS-1 VIIRS version 2 at-launch relative spectral response characterization and performance. In Proceedings of the SPIE Optical Engineering + Applications, San Diego, CA, USA, 28 August–1 September 2016; Volume 9972, pp. 9–26. [Google Scholar] [CrossRef]
  18. Butler, J.J.; Xiong, X.; Barnes, R.A.; Patt, F.S.; Sun, J.; Chiang, K. An overview of Suomi NPP VIIRS calibration maneuvers. In Proceedings of the SPIE Optical Engineering + Applications, San Diego, CA, USA, 12–16 August 2012; Volume 8510, pp. 603–615. [Google Scholar] [CrossRef]
  19. Cao, C.; Blonski, S.; Wang, W.; Uprety, S.; Shao, X.; Choi, J.; Lynch, E.; Kalluri, S. NOAA-20 VIIRS on-orbit performance, data quality, and operational Cal/Val support. In Proceedings of the Earth Observing Missions and Sensors: Development, Implementation, and Characterization V, Honolulu, HI, USA, 24–26 September 2018; Volume 10781, pp. 63–71. [Google Scholar] [CrossRef]
  20. Wang, Z.; Schaaf, C.B.; Sun, Q.; Kim, J.; Erb, A.M.; Gao, F.; Román, M.O.; Yang, Y.; Petroy, S.; Taylor, J.R.; et al. Monitoring land surface albedo and vegetation dynamics using high spatial and temporal resolution synthetic time series from Landsat and the MODIS BRDF/NBAR/albedo product. Int. J. Appl. Earth Obs. Geoinf. 2017, 59, 104–117. [Google Scholar] [CrossRef] [PubMed]
  21. Irons, J.R.; Dwyer, J.L.; Barsi, J.A. The next Landsat satellite: The Landsat data continuity mission. Remote Sens. Environ. 2012, 122, 11–21. [Google Scholar] [CrossRef]
  22. Markham, B.; Barsi, J.; Donley, E.; Efremova, B.; Hair, J.; Jenstrom, D.; Kaita, E.; Knight, E.; Kvaran, G.; McCorkel, J.; et al. Landsat 9: Mission status and prelaunch instrument performance characterization and calibration. In Proceedings of the IGARSS 2019—2019 IEEE International Geoscience and Remote Sensing Symposium, Yokohama, Japan, 28 July–2 August 2019; pp. 5788–5791. [Google Scholar] [CrossRef]
  23. Iona, G.; Butler, J.; Guenther, B.; Graziani, L.; Johnson, E.; Kennedy, B.; Kent, C.; Lambeck, R.; Waluschka, E.; Xiong, X. VIIRS on-orbit optical anomaly: Investigation, analysis, root cause determination and lessons learned. In Proceedings of the SPIE Optical Engineering + Applications, San Diego, CA, USA, 12–16 August 2012; Volume 8510, pp. 506–520. [Google Scholar] [CrossRef]
  24. Oudrari, H.; McIntire, J.; Xiong, X.; Butler, J.; Ji, Q.; Schwarting, T.; Lee, S.; Efremova, B. JPSS-1 VIIRS Radiometric Characterization and Calibration Based on Pre-Launch Testing. Remote Sens. 2016, 8, 41. [Google Scholar] [CrossRef]
  25. Morfitt, R.; Barsi, J.; Levy, R.; Markham, B.; Micijevic, E.; Ong, L.; Scaramuzza, P.; Vanderwerff, K. Landsat-8 Operational Land Imager (OLI) Radiometric Performance On-Orbit. Remote Sens. 2015, 7, 2208–2237. [Google Scholar] [CrossRef]
  26. Moyer, D.; Uprety, S.; Wang, W.; Cao, C.; Guch, I. S-NPP/NOAA-20 VIIRS reflective solar bands on-orbit calibration bias investigation. In Proceedings of the SPIE Optical Engineering + Applications, San Diego, CA, USA, 1–5 August 2021; Volume 11829, pp. 319–331. [Google Scholar] [CrossRef]
  27. Sun, J.; Xiong, X.; Lei, N.; Li, S.; Twedt, K.; Angal, A. Ten Years of SNPP VIIRS Reflective Solar Bands On-Orbit Calibration and Performance. Remote Sens. 2021, 13, 2944. [Google Scholar] [CrossRef]
  28. Chen, H.; Oudrari, H.; Sun, C.; Schwarting, T.; Xiong, X. An early assessment of JPSS-1/NOAA-20 VIIRS day-night band on-orbit calibration and performance. In Proceedings of the Sensors, Systems, and Next-Generation Satellites XXII, Berlin, Germany, 10–13 September 2018; Volume 10785, pp. 227–239. [Google Scholar] [CrossRef]
  29. Slater, P.N.; Biggar, S.F.; Thome, K.J.; Gellman, D.I.; Spyak, P.R. Vicarious radiometric calibrations of EOS sensors. J. Atmos. Ocean. Technol. 1996, 13, 349–359. [Google Scholar] [CrossRef]
  30. Dinguirard, M.; Slater, P.N. Calibration of space-multispectral imaging sensors: A review. Remote Sens. Environ. 1999, 68, 194–205. [Google Scholar] [CrossRef]
  31. Thome, K.J.; Biggar, S.F.; Wisniewski, W. Cross comparison of EO-1 sensors and other Earth resources sensors to Landsat-7 ETM+ using Railroad Valley Playa. IEEE Trans. Geosci. Remote Sens. 2003, 41, 1180–1188. [Google Scholar] [CrossRef]
  32. Czapla-Myers, J.; McCorkel, J.; Anderson, N.; Thome, K.; Biggar, S.; Helder, D.; Aaron, D.; Leigh, L.; Mishra, N. The Ground-Based Absolute Radiometric Calibration of Landsat 8 OLI. Remote Sens. 2015, 7, 600–626. [Google Scholar] [CrossRef]
  33. Angal, A.; Xiong, X.; Thome, K.; Wenny, B.N. Cross-Calibration of Terra and Aqua MODIS Using RadCalNet. IEEE Geosci. Remote Sens. Lett. 2020, 18, 188–192. [Google Scholar] [CrossRef]
  34. Yamamoto, H.; Kamei, A.; Nakamura, R.; Tsuchida, S. Long-term cross-calibration of the Terra ASTER and MODIS over the CEOS calibration sites. In Proceedings of the SPIE Optical Engineering + Applications, San Diego, CA, USA, 21–25 August 2011; Volume 8153, pp. 440–446. [Google Scholar] [CrossRef]
  35. Kaufman, Y.J.; Holben, B.N. Calibration of the AVHRR visible and near-IR bands by atmosphéric scattering, ocean glint and desert reflection. Int. J. Remote Sens. 1993, 14, 21–52. [Google Scholar] [CrossRef]
  36. Greenwell, C.; Bialek, A.; Marks, A.; Woolliams, E.; Berthelot, B.; Meygret, A.; Marcq, S.; Bouvet, M.; Fox, N. Preparation of a new autonomous instrumented radiometric calibration site: Gobabeb, Namib Desert. In Proceedings of the Sensors, Systems, and Next-Generation Satellites XIX, Toulouse, France, 21–24 September 2015; Volume 9639, pp. 353–366. [Google Scholar] [CrossRef]
  37. Landsat 8-9 Operational Land Imager (OLI) and Thermal Infrared Sensor (TIRS) Collection 2 Level-1 15- to 30-Meter Multispectral Data. Available online: https://doi.org/10.5066/P975CC9B (accessed on 15 January 2023).
  38. Available online: https://www.usgs.gov/landsat-missions/landsat-collection-1-landsatlook-images (accessed on 1 May 2022).
  39. VIIRS/JPSS1 Moderate Resolution 6-Min L1B Swath 750 m. Available online: https://doi.org/10.5067/VIIRS/VJ102MOD.002 (accessed on 15 January 2023).
  40. VIIRS/JPSS1 Moderate Resolution Terrain-Corrected Geolocation 6-Min L1 Swath 750 m. Available online: https://doi.org/10.5067/VIIRS/VJ103MOD.002 (accessed on 15 January 2023).
  41. VIIRS/NPP Moderate Resolution 6-Min L1B Swath 750, m. Available online: https://doi.org/10.5067/VIIRS/VNP02MOD.002 (accessed on 15 January 2023).
  42. VIIRS/NPP Moderate Resolution Terrain-Corrected Geolocation 6-Min L1 Swath 750 m. Available online: https://doi.org/10.5067/VIIRS/VNP03MOD.002 (accessed on 15 January 2023).
  43. Berk, A.; Hawes, F. Validation of MODTRAN® 6 and its line-by-line algorithm. J. Quant. Spectrosc. Radiat. Transfer. 2017, 203, 542–556. [Google Scholar] [CrossRef]
  44. Wenny, B.N.; Thome, K. Look-up table approach for uncertainty determination for operational vicarious calibration of Earth imaging sensors. Appl. Opt. 2022, 61, 1357–1368. [Google Scholar] [CrossRef]
  45. Scott, K.P.; Thome, K.J.; Brownlee, M.R. Evaluation of the Railroad Valley playa for use in vicarious calibration. In Proceedings of the SPIE’s 1996 International Symposium on Optical Science, Engineering, and Instrumentation, Denver, CO, USA, 4–9 August 1996; Volume 2818. [Google Scholar] [CrossRef]
  46. Tahersima, M.H.; Wenny, B.N.; Voskanian, N.; Thome, K. Intercomparison of Landsat and Joint Polar Satellite System using RadCalNet. In Proceedings of the SPIE Optical Engineering + Applications, San Diego, CA, USA, 21–26 August 2022; Volume 12232, pp. 352–357. [Google Scholar] [CrossRef]
  47. Bialek, A.; Greenwell, C.; Lamare, M.; Meygret, A.; Marcq, S.; Lachérade, S.; Woolliams, E.; Berthelot, B.; Bouvet, M.; King, M.; et al. New radiometric calibration site located at Gobabeb, Namib desert. In Proceedings of the 2016 IEEE International Geoscience and Remote Sensing Symposium (IGARSS), Beijing, China, 10–15 July 2016; pp. 6094–6097. [Google Scholar] [CrossRef]
  48. Pegrum-Browning, H.; Fox, N.; Milton, E. The NPL Gonio RAdiometric Spectrometer System (GRASS). In Proceedings of the Remote Sensing and Photogrammetry Society Conference 2008, Falmouth, UK, 15–17 September 2008. [Google Scholar]
  49. Landsat, U.S. Landsat 8–9 Calibration and Validation (Cal/Val) Algorithm Description Document (ADD); United States Geological Society: Sioux Falls, SD, USA, 2021.
  50. Xiong, X.; Cao, C.; Lei, N.; Chiang, K.; Angal, A.; Li, Y.; Blonski, S.; Wang, W.; Choi, T. Early results from NOAA-20 (JPSS-1) VIIRS on-650 orbit calibration and characterization. In Proceedings of the IGARSS 2018—2018 IEEE International Geoscience and Remote Sensing Symposium, Valencia, Spain, 22–27 July 2018; pp. 1112–1115. [Google Scholar] [CrossRef]
  51. Helder, D.L.; Markham, B.L.; Thome, K.J.; Barsi, J.A.; Chander, G.; Malla, R. Updated radiometric calibration for the Landsat-5 Thematic Mapper reflective bands. IEEE Trans. Geosci. Remote Sens. 2008, 46, 3309–3325. [Google Scholar] [CrossRef]
  52. Obata, K.; Tsuchida, S.; Yamamoto, H.; Thome, K. Cross-Calibration between ASTER and MODIS Visible to Near-Infrared Bands for Improvement of ASTER Radiometric Calibration. Sensors 2017, 17, 1793. [Google Scholar] [CrossRef] [PubMed]
  53. Joint Committee for Guides in Metrology. Evaluation of Measurement Data—Guide to the Expression of Uncertainty in Measurement; JCGM: Sèvres, France, 2008. [Google Scholar]
  54. Niroumand-Jadidi, M.; Bovolo, F.; Bresciani, M.; Gege, P.; Giardino, C. Water Quality Retrieval from Landsat-9 (OLI-2) Imagery and Comparison to Sentinel-2. Remote Sens. 2022, 14, 4596. [Google Scholar] [CrossRef]
  55. Wenny, B.N.; Thome, K.; Czapla-Myers, J.; Anderson, N. Cross-calibration of Landsat 8 and 9 using measurements from an ultra-portable field transfer radiometer. In Proceedings of the Sensors, Systems, and Next-Generation Satellites XXVI, Berlin, Germany, 6–7 September 2022; p. PC122640C. [Google Scholar]
  56. Levy, R.; Miller, J.; Thome, K.J. Landsat 9 Operational Land Imager2 (OLI2) on-orbit results of new special characterizations. In Proceedings of the SPIE Optical Engineering + Applications, San Diego, CA, USA, 21–26 August 2022; Volume 12232, pp. 258–269. [Google Scholar] [CrossRef]
  57. Voskanian, N.; Wenny, B.N.; Tahersima, M.H.; Thome, K. Inter-calibration of Landsat 8 and 9 operational land imagers. In Proceedings of the SPIE Optical Engineering + Applications, San Diego, CA, USA, 21–26 August 2022; Volume 12232, pp. 270–274. [Google Scholar] [CrossRef]
  58. Revel, C.; Lonjou, V.; Marcq, S.; Desjardins, C.; Fougnie, B.; Coppolani-Delle Luche, C.; Guilleminot, N.; Lacamp, A.S.; Lourme, E.; Miquel, C.; et al. Sentinel-2A and 2B absolute calibration monitoring. Eur. J. Remote Sens. 2019, 52, 122–137. [Google Scholar] [CrossRef]
  59. Cao, C.; Zhang, B.; Shao, X.; Wang, W.; Uprety, S.; Choi, T.; Blonski, S.; Gu, Y.; Bai, Y.; Lin, L.; et al. Mission-Long Recalibrated Science Quality Suomi NPP VIIRS Radiometric Dataset Using Advanced Algorithms for Time Series Studies. Remote Sens. 2021, 13, 1075. [Google Scholar] [CrossRef]
Figure 1. Daily orbit swath for (A) the combination of Landsat-8 OLI (red) and Landsat-9 OLI (yellow), and (B) the combination of SNPP VIIRS (red) and NOAA-20 VIIRS (yellow). Landsat-8 OLI and Landsat-9 OLI have 30 m spatial resolutions with a 185 km swath width. Landsat satellites are on sun-synchronous orbits, each imaging every point on the Earth once every 16 days. SNPP and NOAA-20 VIIRS sensors produce 750 m moderate-resolution images with a 3060 km swath width. JPSS satellites are sun-synchronous, polar-orbiting operational environmental satellites, each providing full global coverage once a day.
Remotesensing 15 05562 g001
Figure 2. RSR of the Landsat-8 OLI (red), Landsat-9 OLI (black), SNPP VIIRS (green), and NOAA-20 VIIRS (blue) [14,15,16,17]. The shaded area shown for Landsat-8 OLI and Landsat-9 OLI RSR curves are the per-wavelength standard deviations of the RSRs across the OLI instrument’s 14 detector modules [14,15].
Remotesensing 15 05562 g002
Figure 3. The ratios of TOA reflectance values of Landsat-8 OLI, Landsat-9 OLI (shown in filled circles for better visibility), SNPP VIIRS, and NOAA-20 VIIRS to those reported by RadCalNet (A) from January 2018 (when RadCalNet data for both RVUS and GONA is available) and (B) from December 2021 (when the first Landsat-9 OLI images were released). The ratios are for similar spectral bands centered at 865 nm. The mean value over the whole period is reported in the figure legend.
Remotesensing 15 05562 g003
Figure 4. Temporal average and standard deviation of ratios for Landsat-8 OLI, Landsat-9 OLI, SNPP VIIRS, and NOAA-20 VIIRS, over (A) RVUS for scenes after January 2018, (B) RVUS for scenes after December 2021, (C) GONA for scenes after January 2018 2021, (D) GONA for scenes after December 2021. Square symbols are the temporal average of the ratios, and the error bars are their standard deviations.
Remotesensing 15 05562 g004
Figure 5. Temporal average and standard deviation of ratios for (A) Landsat-8 OLI, (B) Landsat-9 OLI, (C) SNPP VIIRS, and (D) NOAA-20 VIIRS, over RVUS and GONA for all available scenes since January 2018. Square symbols are the temporal averages of the ratios, and the error bars are their standard deviations.
Remotesensing 15 05562 g005
Figure 6. Temporal average and standard deviation of ratios for each of (A) Landsat-8 OLI, (B) Landsat-9 OLI, (C) SNPP VIIRS, and (D) NOAA-20 VIIRS, over RVUS and GONA for all available scenes since December 2021. Square symbols are the temporal averages of the ratios, and the error bars are the standard deviations of the temporal averages.
Remotesensing 15 05562 g006
Figure 7. Double ratio results for (A) L8/L9 since January 2018, (B) L8/L9 since December 2021, (C) J1/NP since January 2018, and (D) J1/NP since December 2021.
Remotesensing 15 05562 g007
Figure 8. Combination of GONA and RVUS (‘RCN’) for (A) Landsat-8 OLI and Landsat-9 OLI since January 2018, (B) Landsat-8 OLI and Landsat-9 OLI since December 2021, (C) SNPP VIIRS and NOAA-20 VIIRS since January 2018, and (D) SNPP VIIRS and NOAA-20 VIIRS since December 2021.
Remotesensing 15 05562 g008
Table 1. Band names and center wavelength values, in nanometers, for the VIIRS sensors and OLI sensors used in this intercomparison.
Band Centers (nm)
VIIRS Band NamesNOAA-20
VIIRS
SNPP
VIIRS
Landsat-8
OLI
Landsat-9
OLI
OLI Band Names
M1412410---
M2445443443443B1
M3488486482482B2
M4555550561562B3
M5672672655655B4
M7865865865865B5
Table 2. RadCalNet sites with their coordinates and surface footprints.
Site4-Letter NameLat/LonArea [m2]
Railroad ValleyRVUS(38.497, −115.690)1000 × 1000
GobabebGONA(−23.600, 15.120)π × 30 × 30
La CrauLCFR(43.5589, 4.8642)π × 30 × 30
BaotouBTCN(40.8514, 109.6280)48 × 48 Gravels
Baotou SandBSCN(40.8659, 109.6155)300 × 300
Table 3. Number of matchups between clear-sky satellite images and corresponding RadCalNet data for the period of January 2018 to December 2022.
SensorLaunchRVUSGONA
AvailableGoodAvailableGood
Landsat-8 OLI201373427067
Landsat-9 OLI20211781312
SNPP VIIRS2011349114411127
NOAA-20 VIIRS20173399832793
Table 4. Number of RVUS scenes filtered by each of the scene selection criteria. The numbers in parentheses are the percentage of filtered scenes over total number of RVUS scenes captured by each instrument.
SensorLandsat-8 OLILandsat-9 OLISNPP
VIIRS
NOAA-20 VIIRS
Time Difference20 (~30%)7 (47%)71 (~21%)73 (~23%)
View Geometry0 (0%)0 (0%)118 (~64%)188 (~41%)
Ground Variability8 (~12%)0 (~0%)15 (~4%)19 (~6%)
Location Ambiguity0 (~0%)0 (~0%)119 (~36%)98 (~31%)
Atmospheric Condition16 (~24%)8 (~53%)67 (~20%)68 (~21%)
Table 5. Number of GONA scenes filtered by each of the scene selection criteria. The numbers in parentheses are the percentage of filtered scenes over total number of GONA scenes captured by each instrument.
SensorLandsat-8 OLILandsat-9 OLISNPP
VIIRS
NOAA-20 VIIRS
Time Difference1 (~1%)0 (0%)1 (~0%)2 (~1%)
View Geometry0 (0%)0 (0%)227 (~57%)178 (~58%)
Ground Variability2 (~3%)1 (~7%)19 (~5%)13 (~4%)
Location Ambiguity0 (~0%)0 (~0%)133 (~34%)123 (~40%)
Atmospheric Condition1 (~1%)0 (~0%)2 (~1%)3 (~1%)
Disclaimer/Publisher’s Note: The statements, opinions and data contained in all publications are solely those of the individual author(s) and contributor(s) and not of MDPI and/or the editor(s). MDPI and/or the editor(s) disclaim responsibility for any injury to people or property resulting from any ideas, methods, instructions or products referred to in the content.

