


Comparative Analysis of Pixel-Level Fusion Algorithms and a New High-Resolution Dataset for SAR and Optical Image Fusion


Abstract
1. Introduction
- We systematically review the current pixel-level fusion algorithms for optical and SAR image fusion, and then we select eleven representative fusion methods, including CS methods, MSD methods, and model-based methods for comparison analysis.
- Based on the evaluation indicators of low-level visual tasks, we combine these with the evaluation indicators of subsequent high-level visual tasks to analyze the advantages and disadvantages of existing pixel-level fusion algorithms.
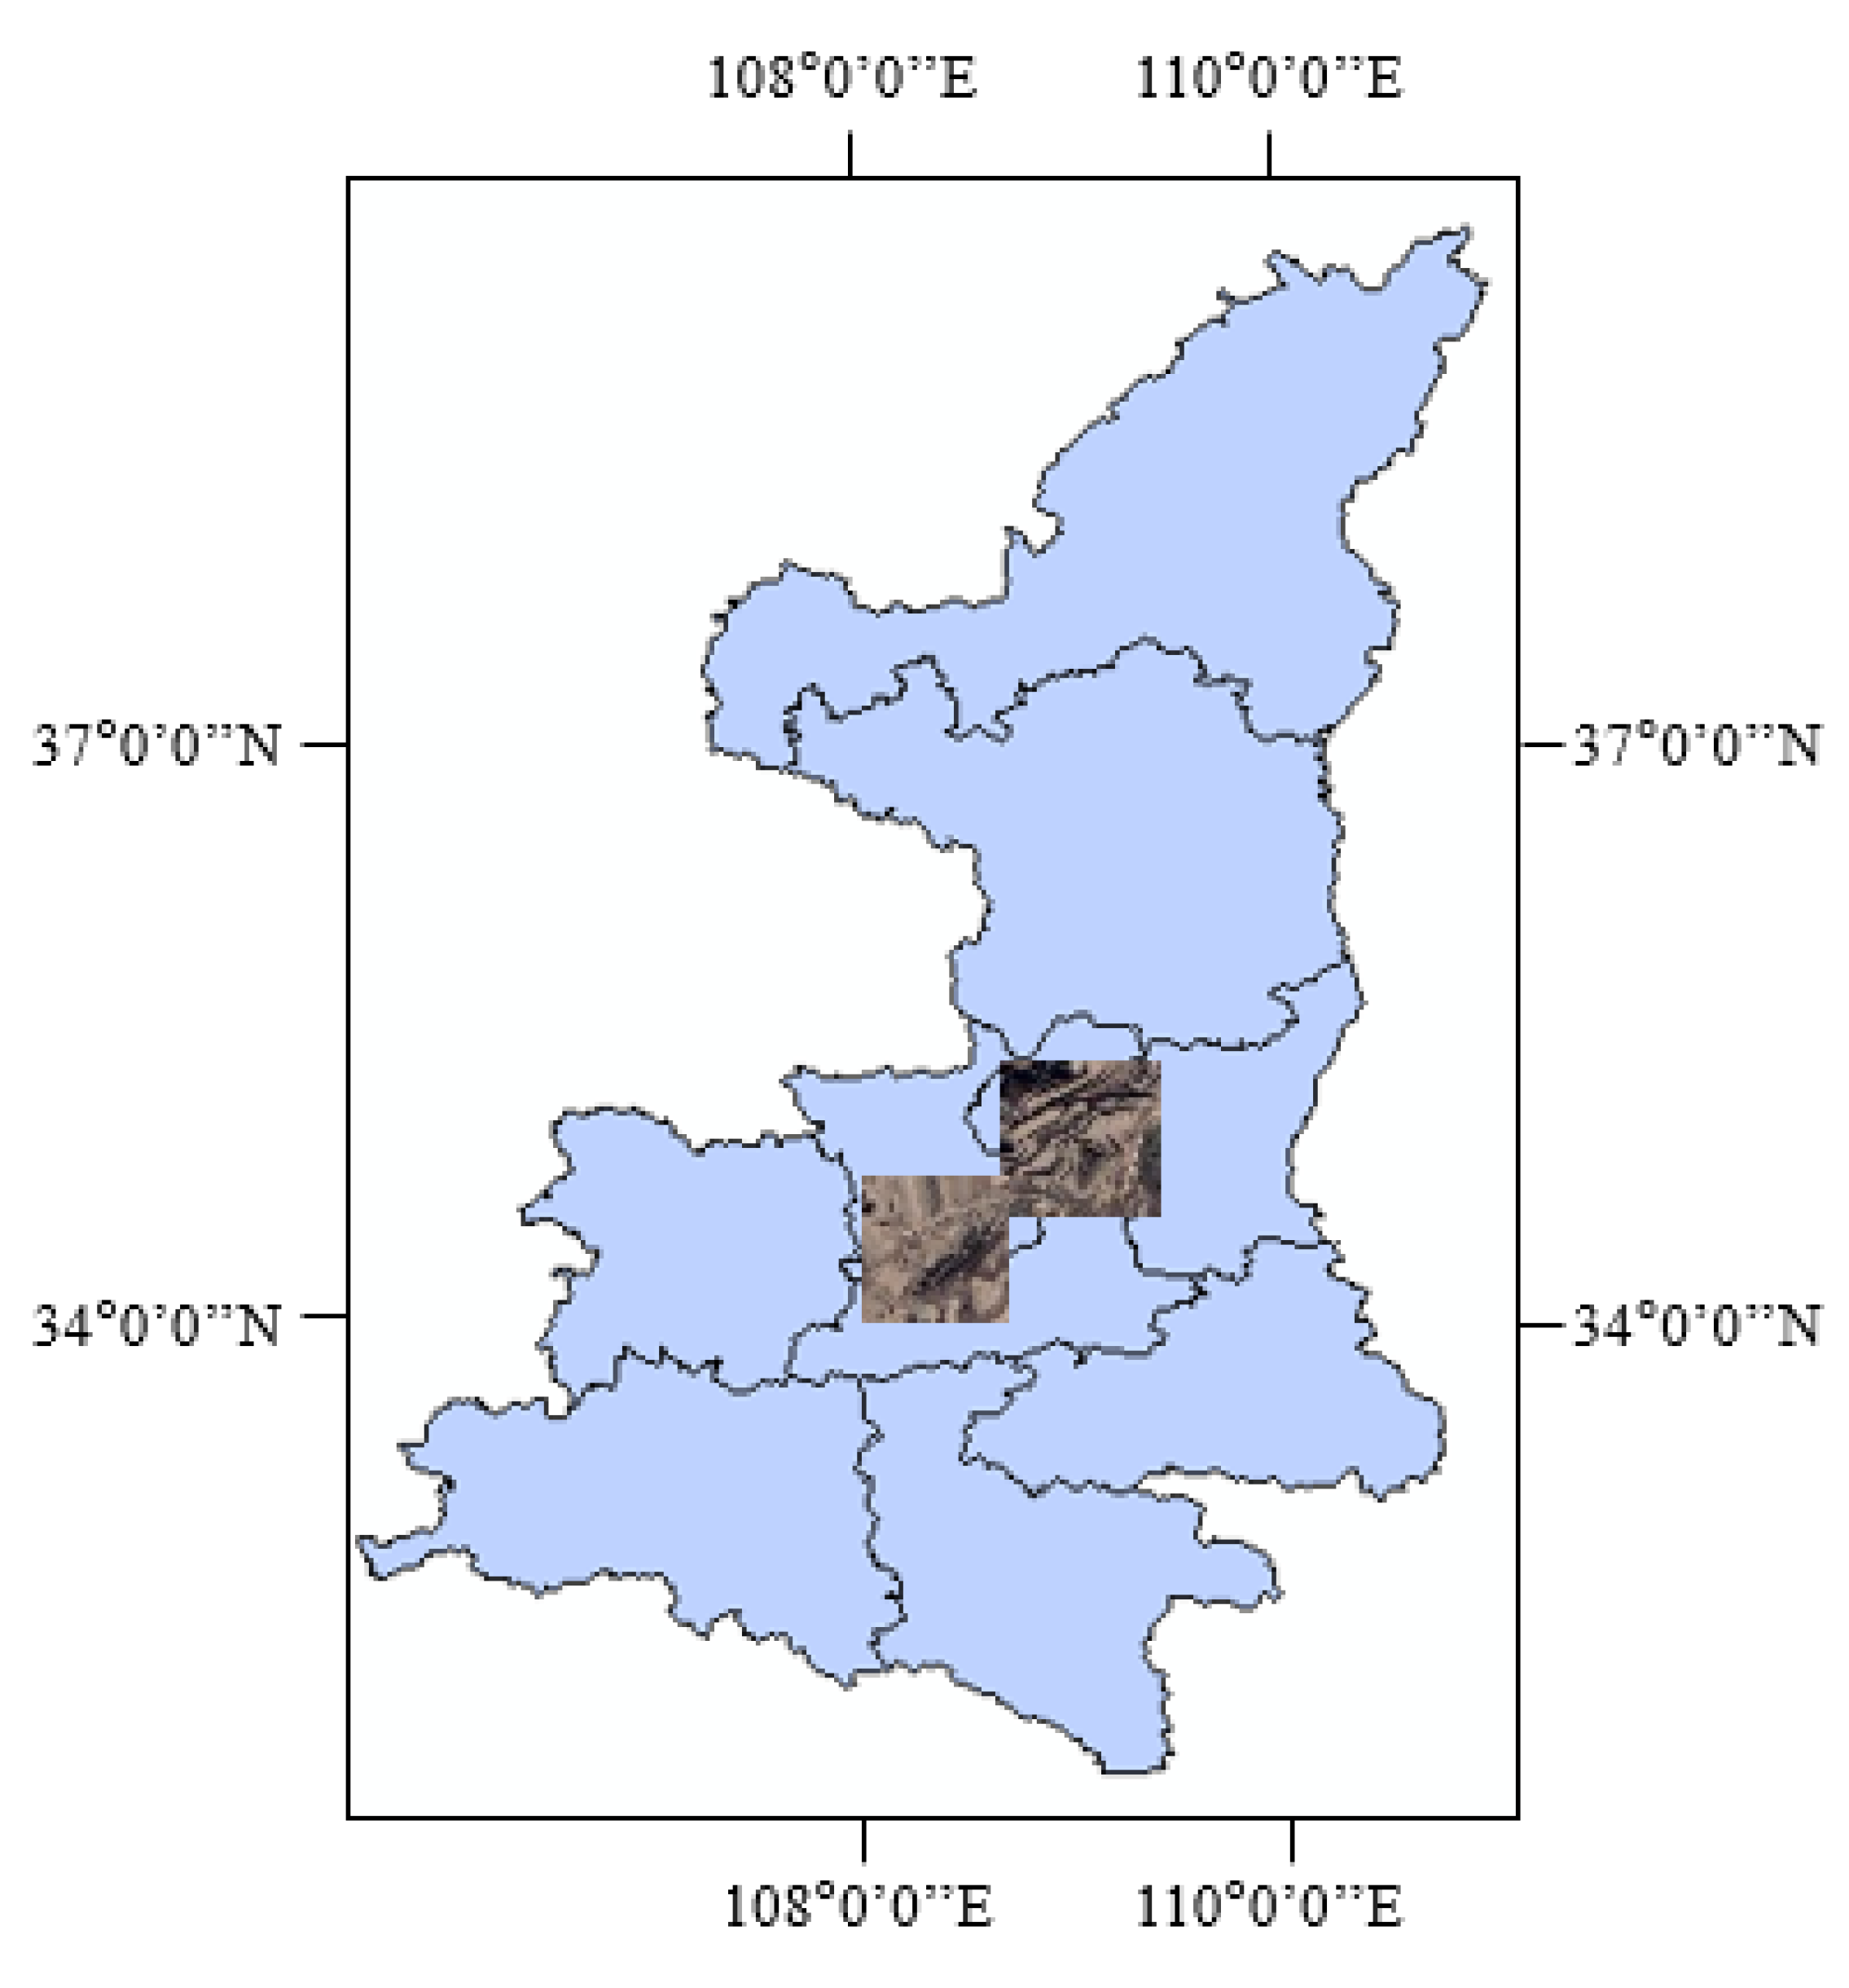
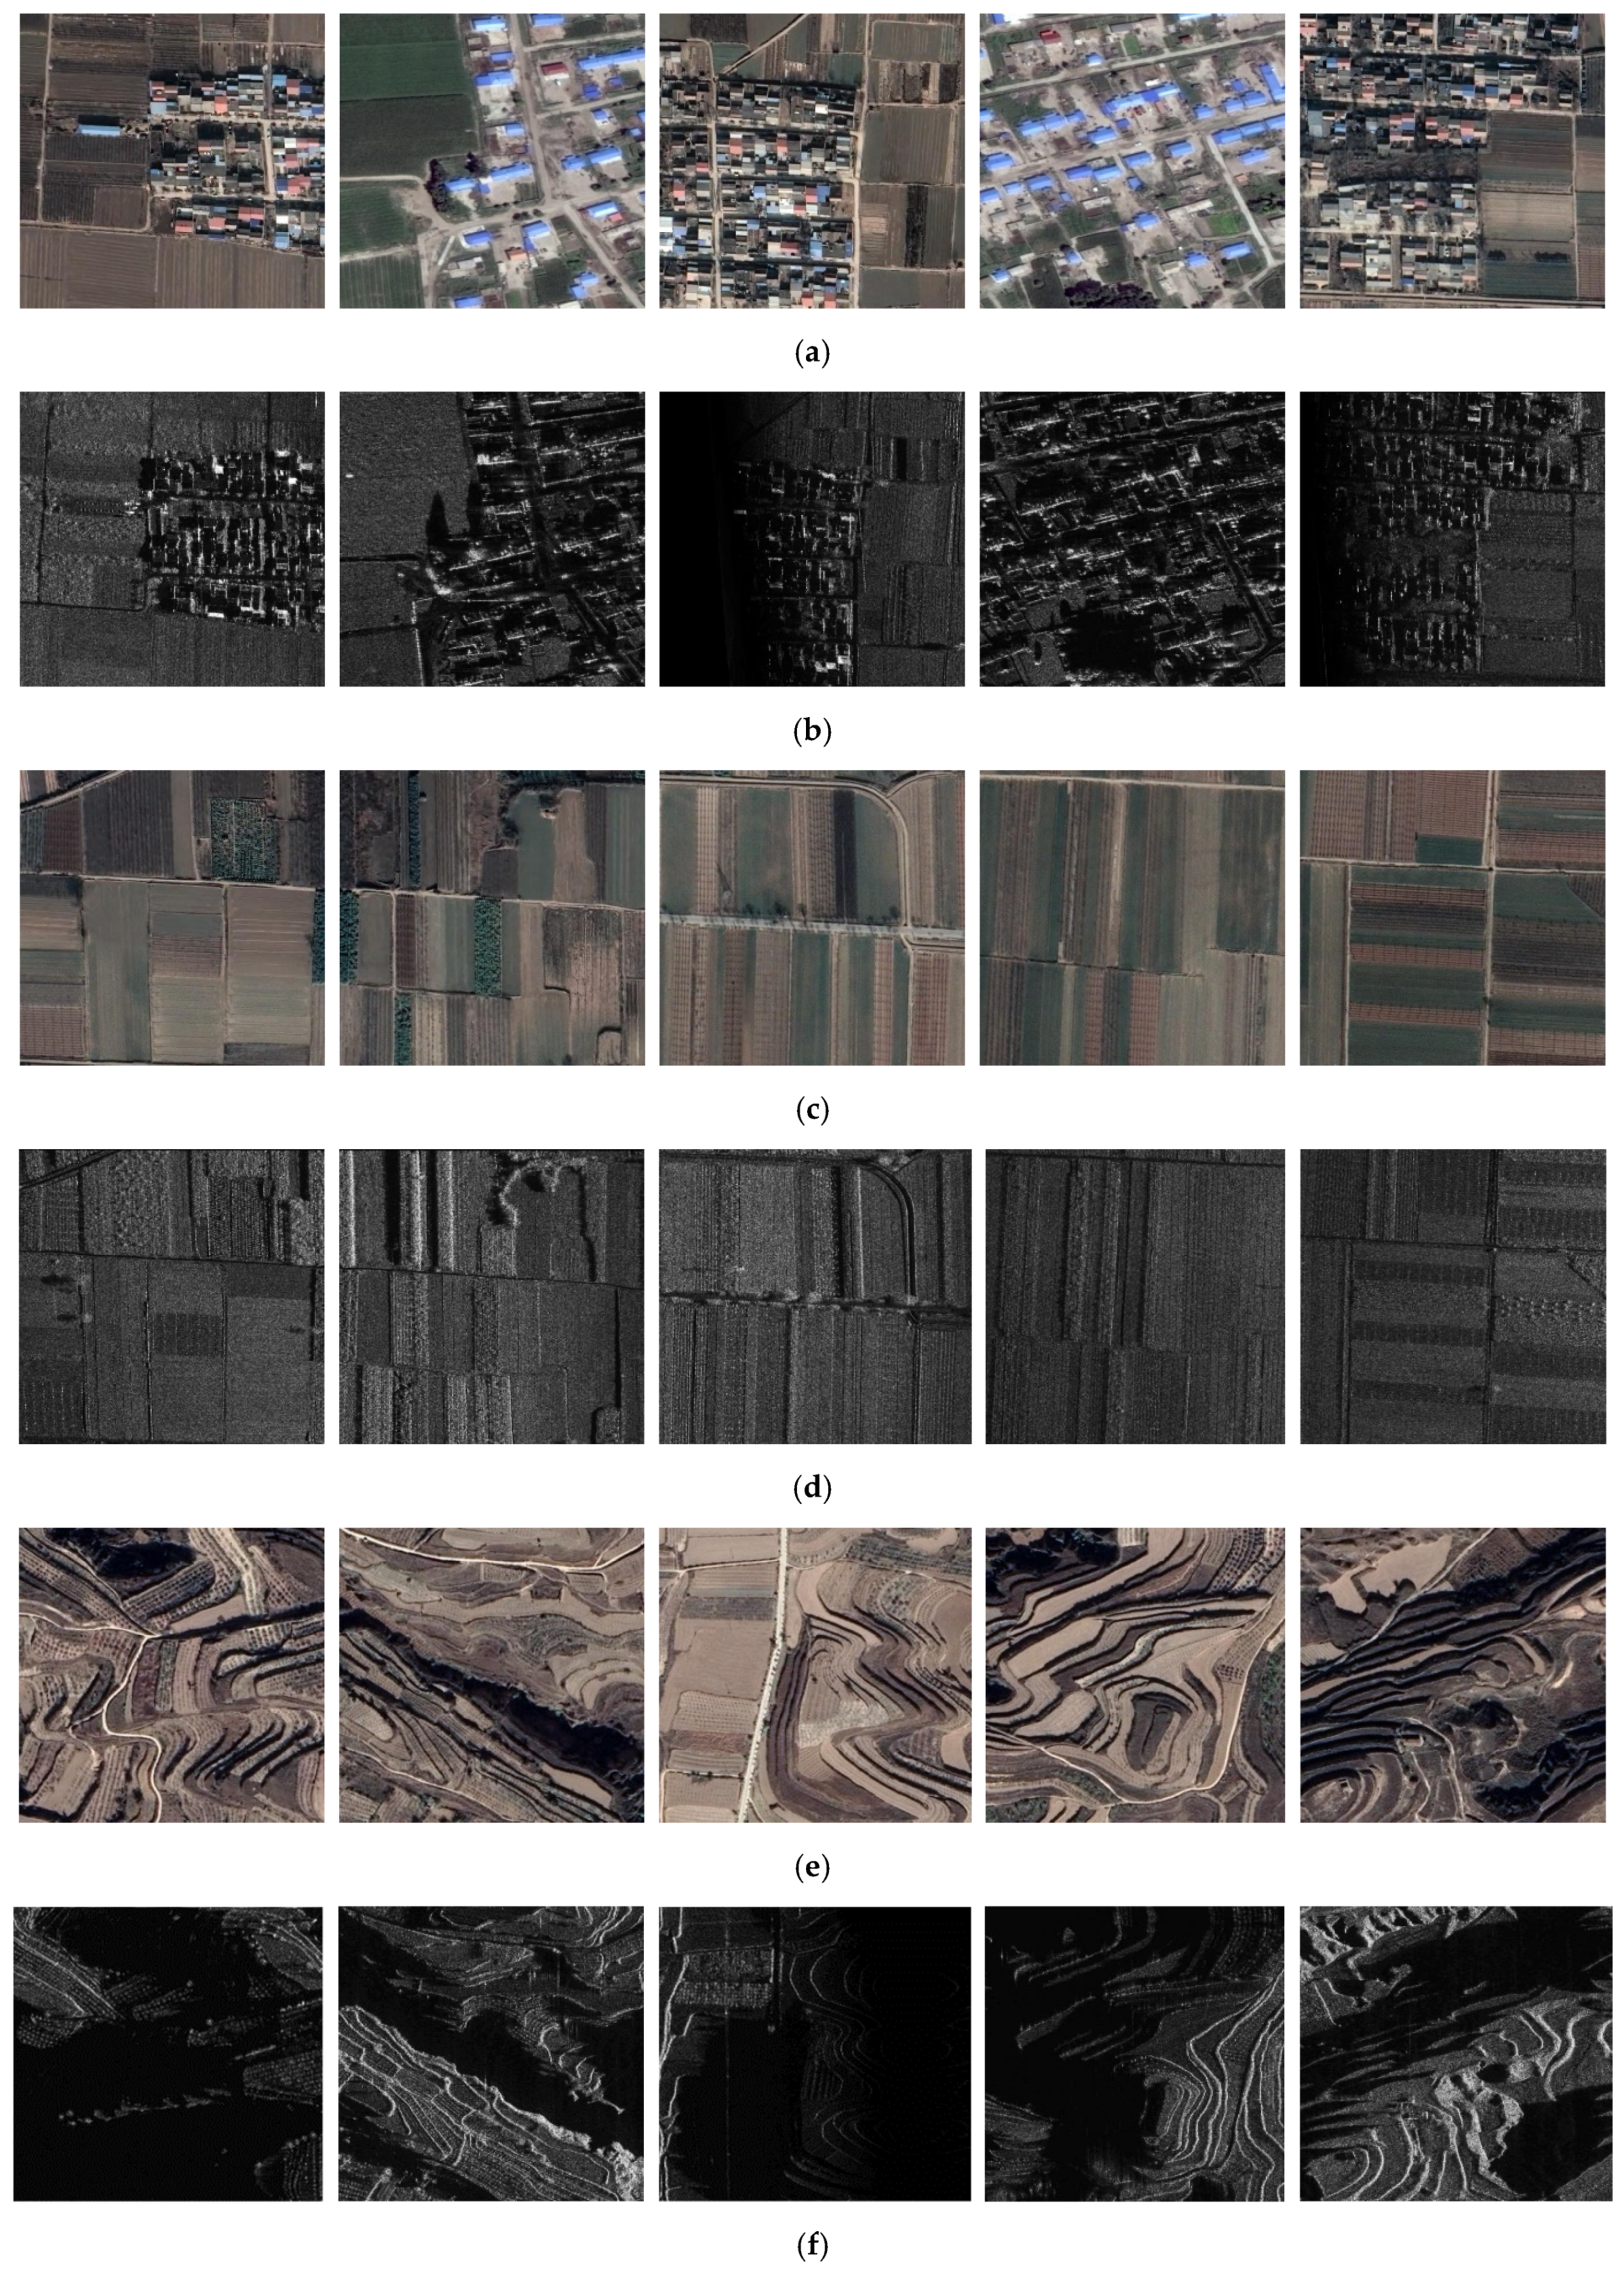
- We produce a high-resolution SAR and optical image fusion dataset, including 150 pairs of images of urban, suburban, and mountain settings, which can provide data support for relevant research. The download link for the dataset is https://github.com/yeyuanxin110/YYX-OPT-SAR (accessed on 21 January 2023).
2. Pixel-Level Methods of Optical–SAR Fusion
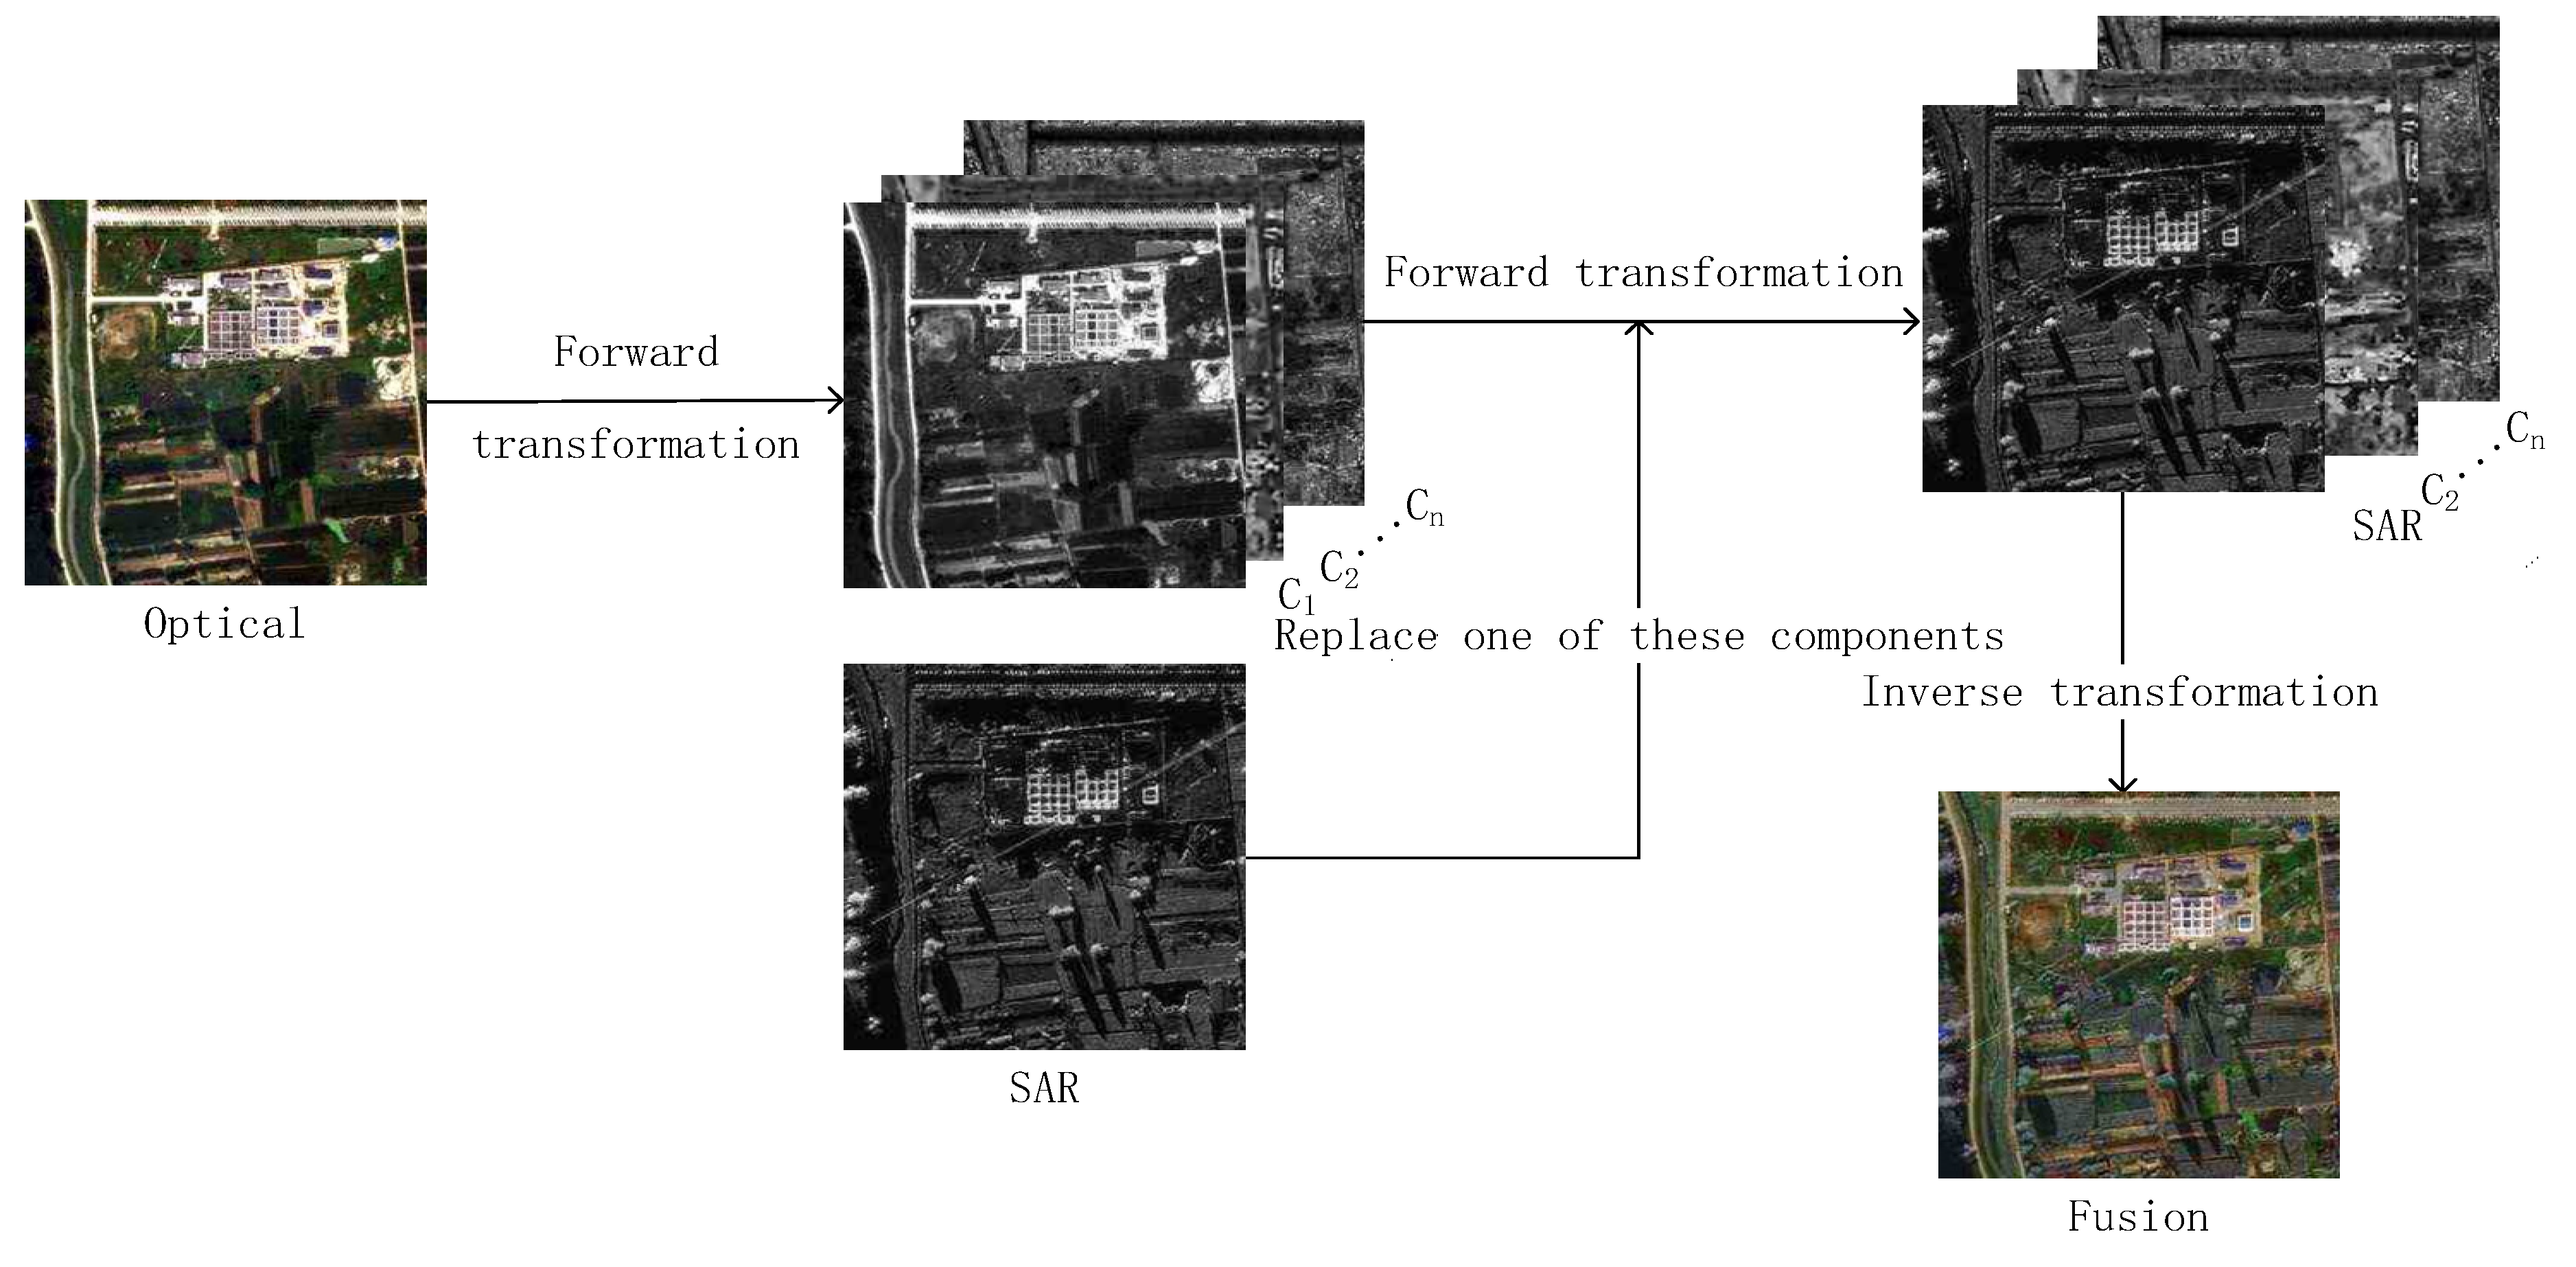
2.1. CS Methods
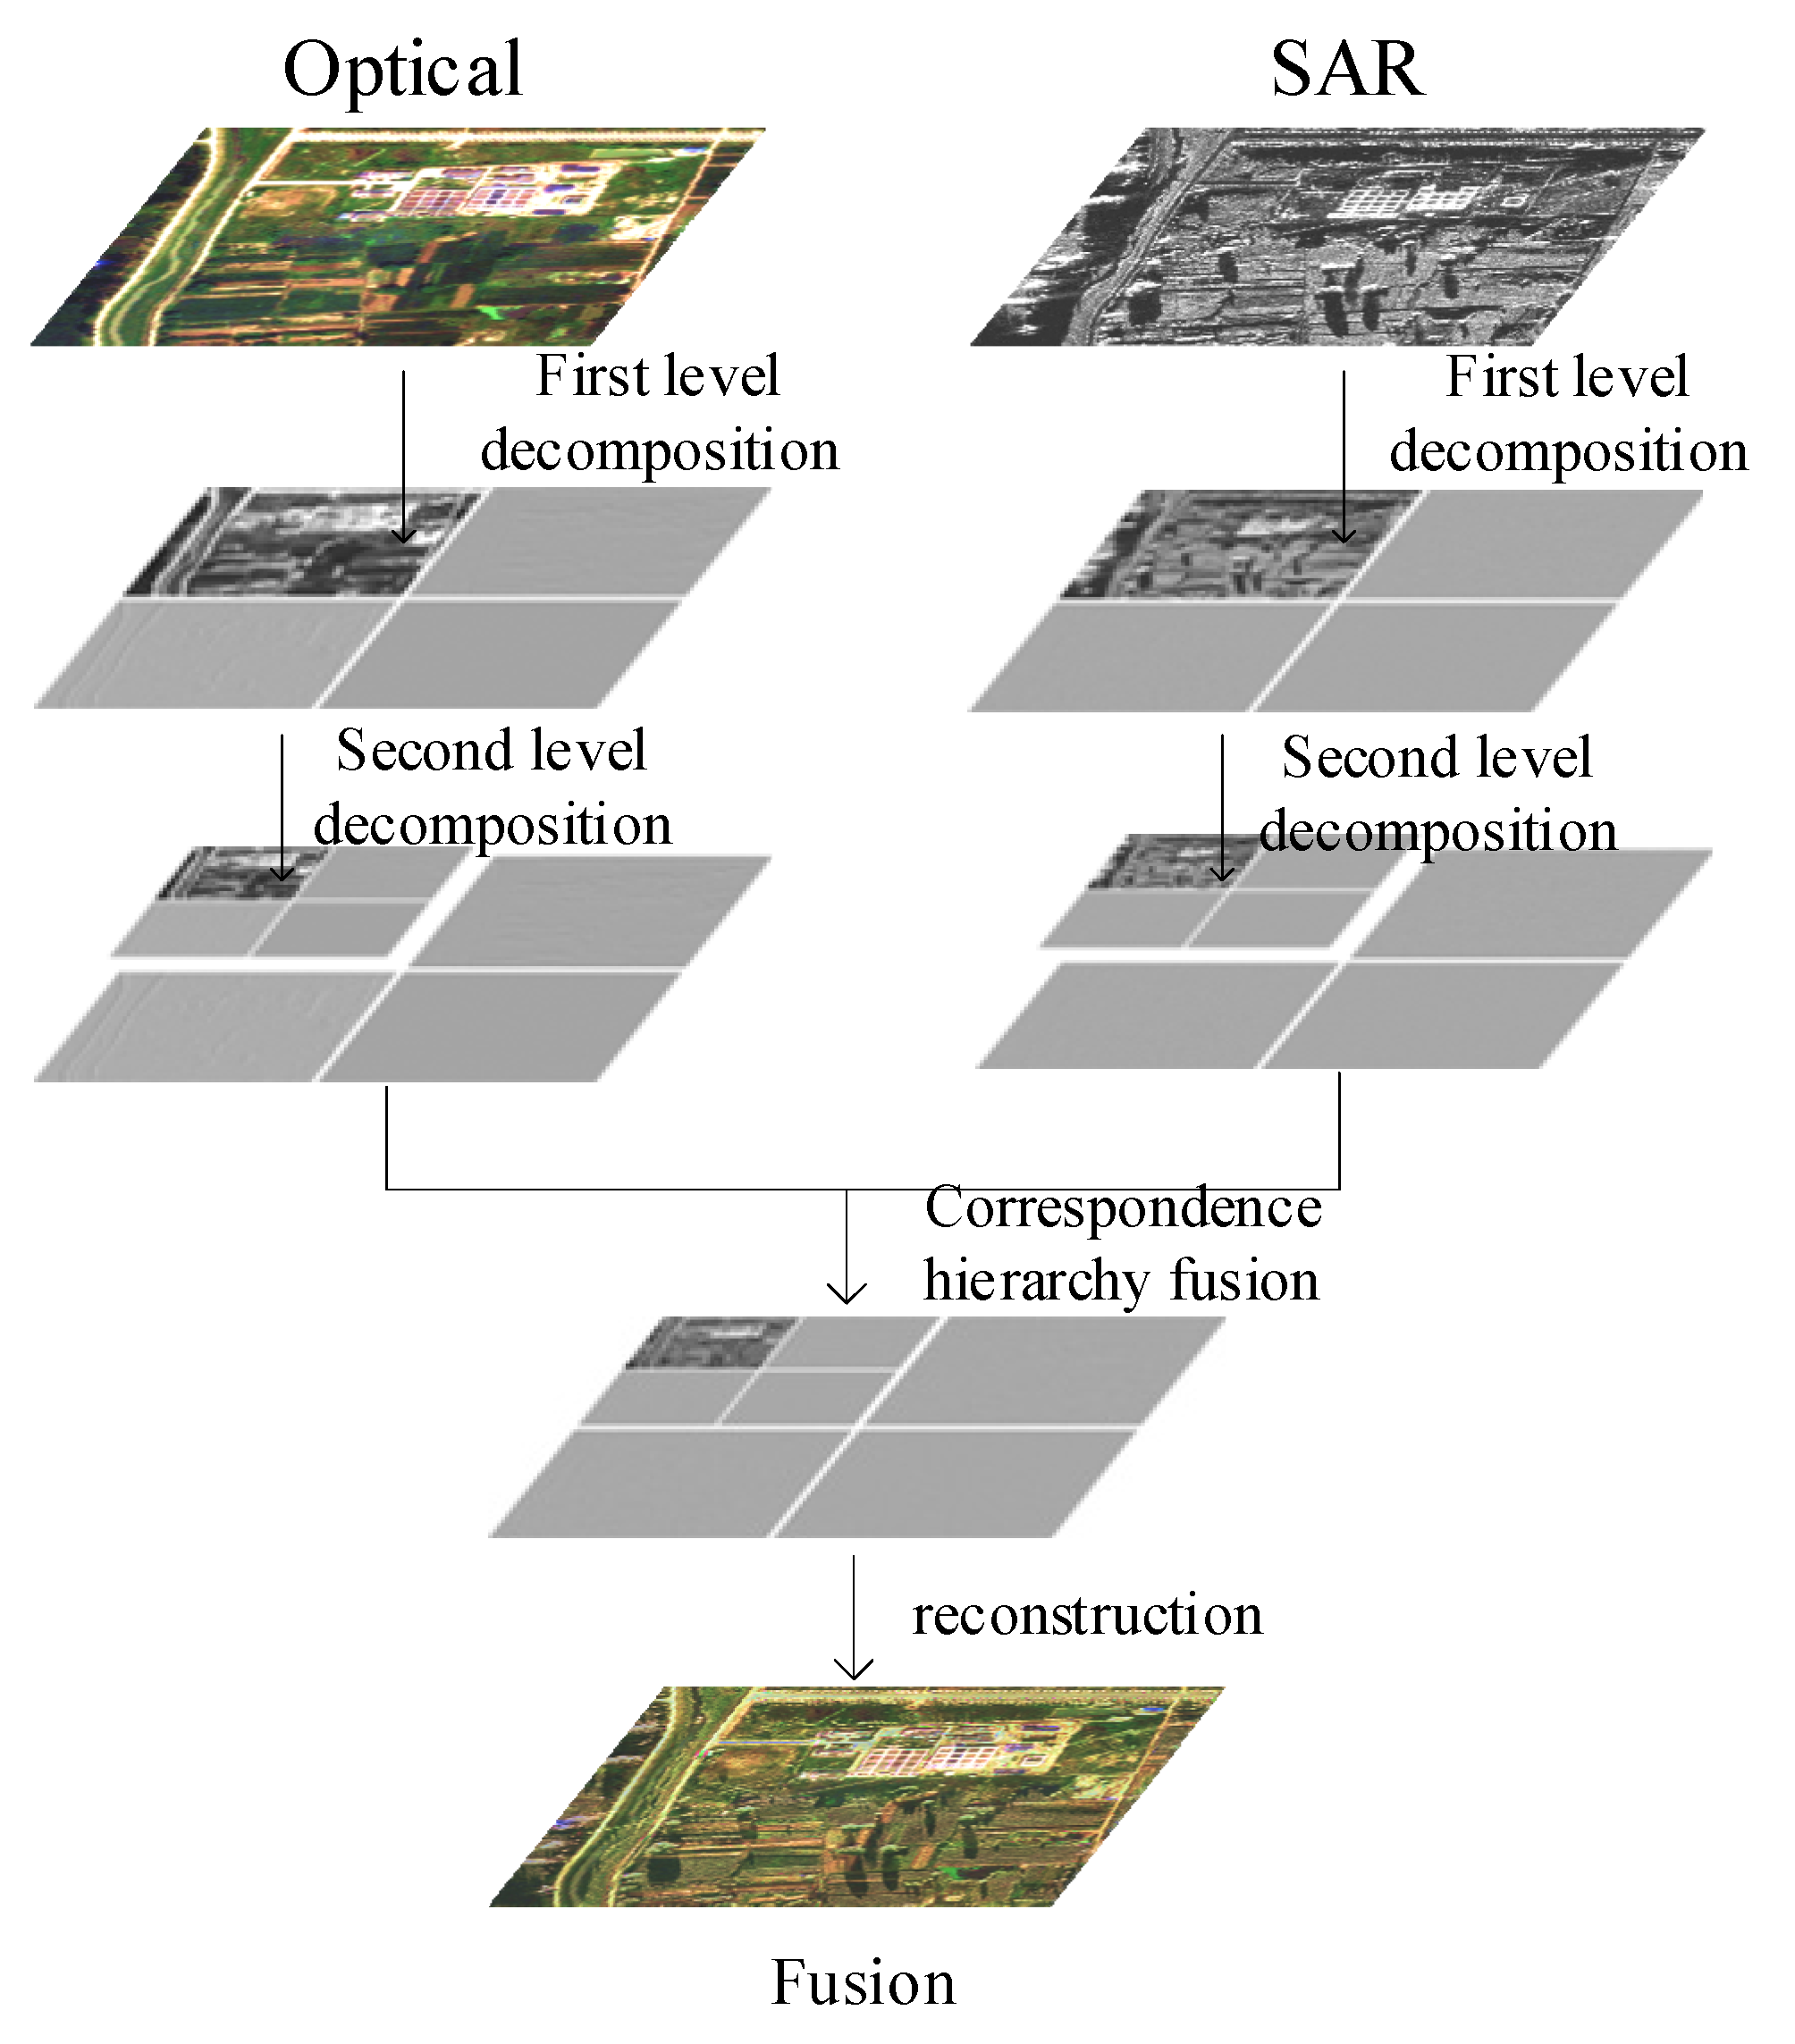
2.2. MSD Methods
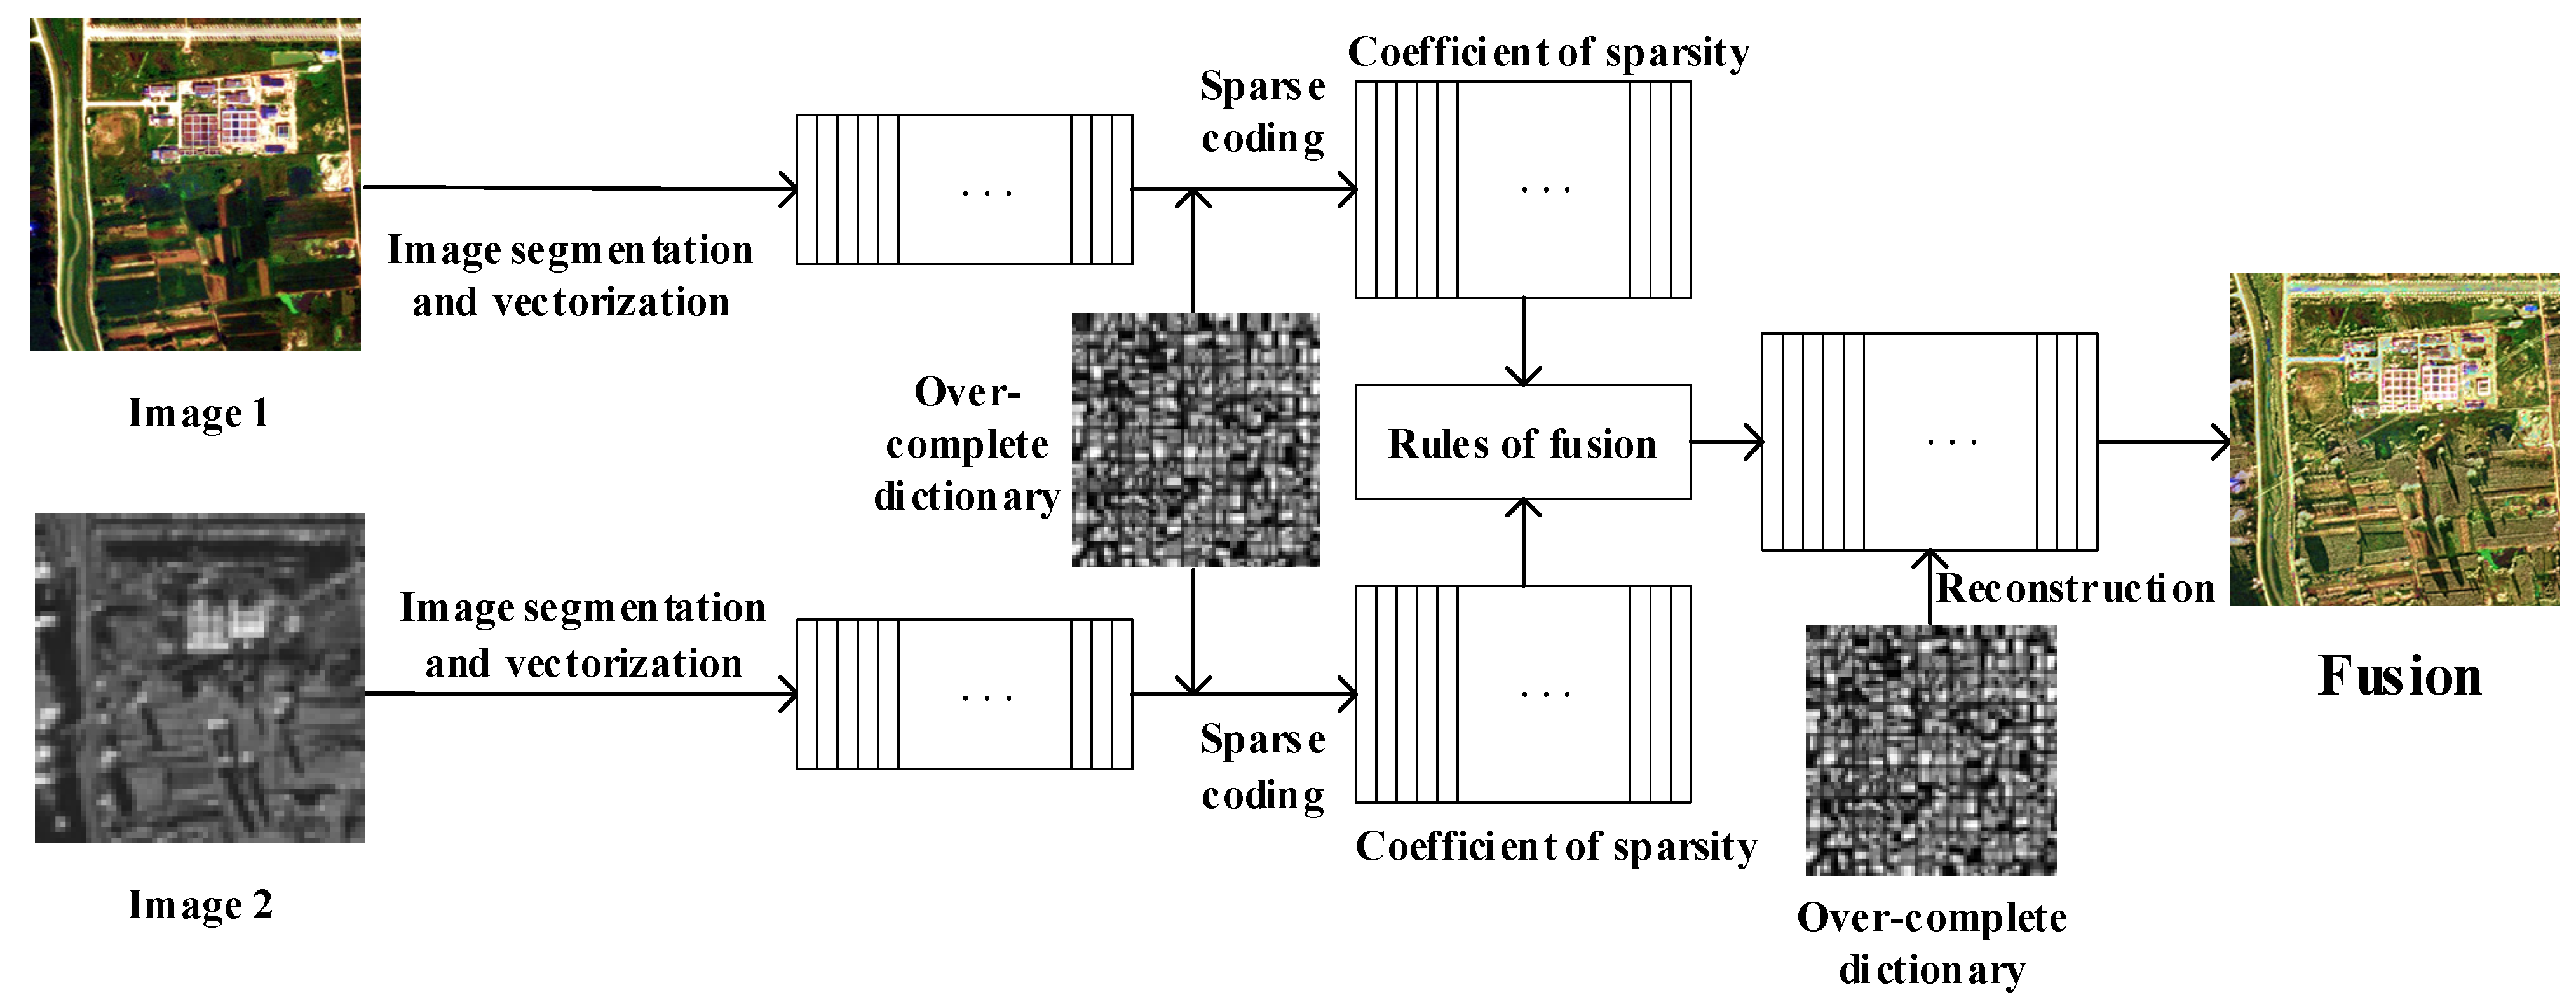
2.3. Model-Based Methods
2.4. Method Selection

| Category | Method | |
|---|---|---|
| CS | Intensity–Hue–Saturation (IHS) transform [36] Principal Component Analysis (PCA) [37] Gram–Schmidt (GS) transform [38] | |
| MSD | Pyramid-based | Laplacian pyramid (LP) [39] Gradient pyramid (GP) [40] |
| Wavelet-based | Discrete wavelet transform (DWT) [41] Dual tree complex wavelet transform (DTCWT) [42] | |
| MGA | Curvelet transform (CVT) [43] Non-subsampled contourlet transform (NSCT) [44] | |
| Model-based | SR [30] Gradient Transfer Fusion (GTF) [45] | |
3. Evaluation Criteria for Image Fusion Methods
3.1. Visual Evaluation
3.2. Statistical Evaluation
3.3. Fusion Evaluation According to Classification
4. Datasets
5. Experimental Analysis
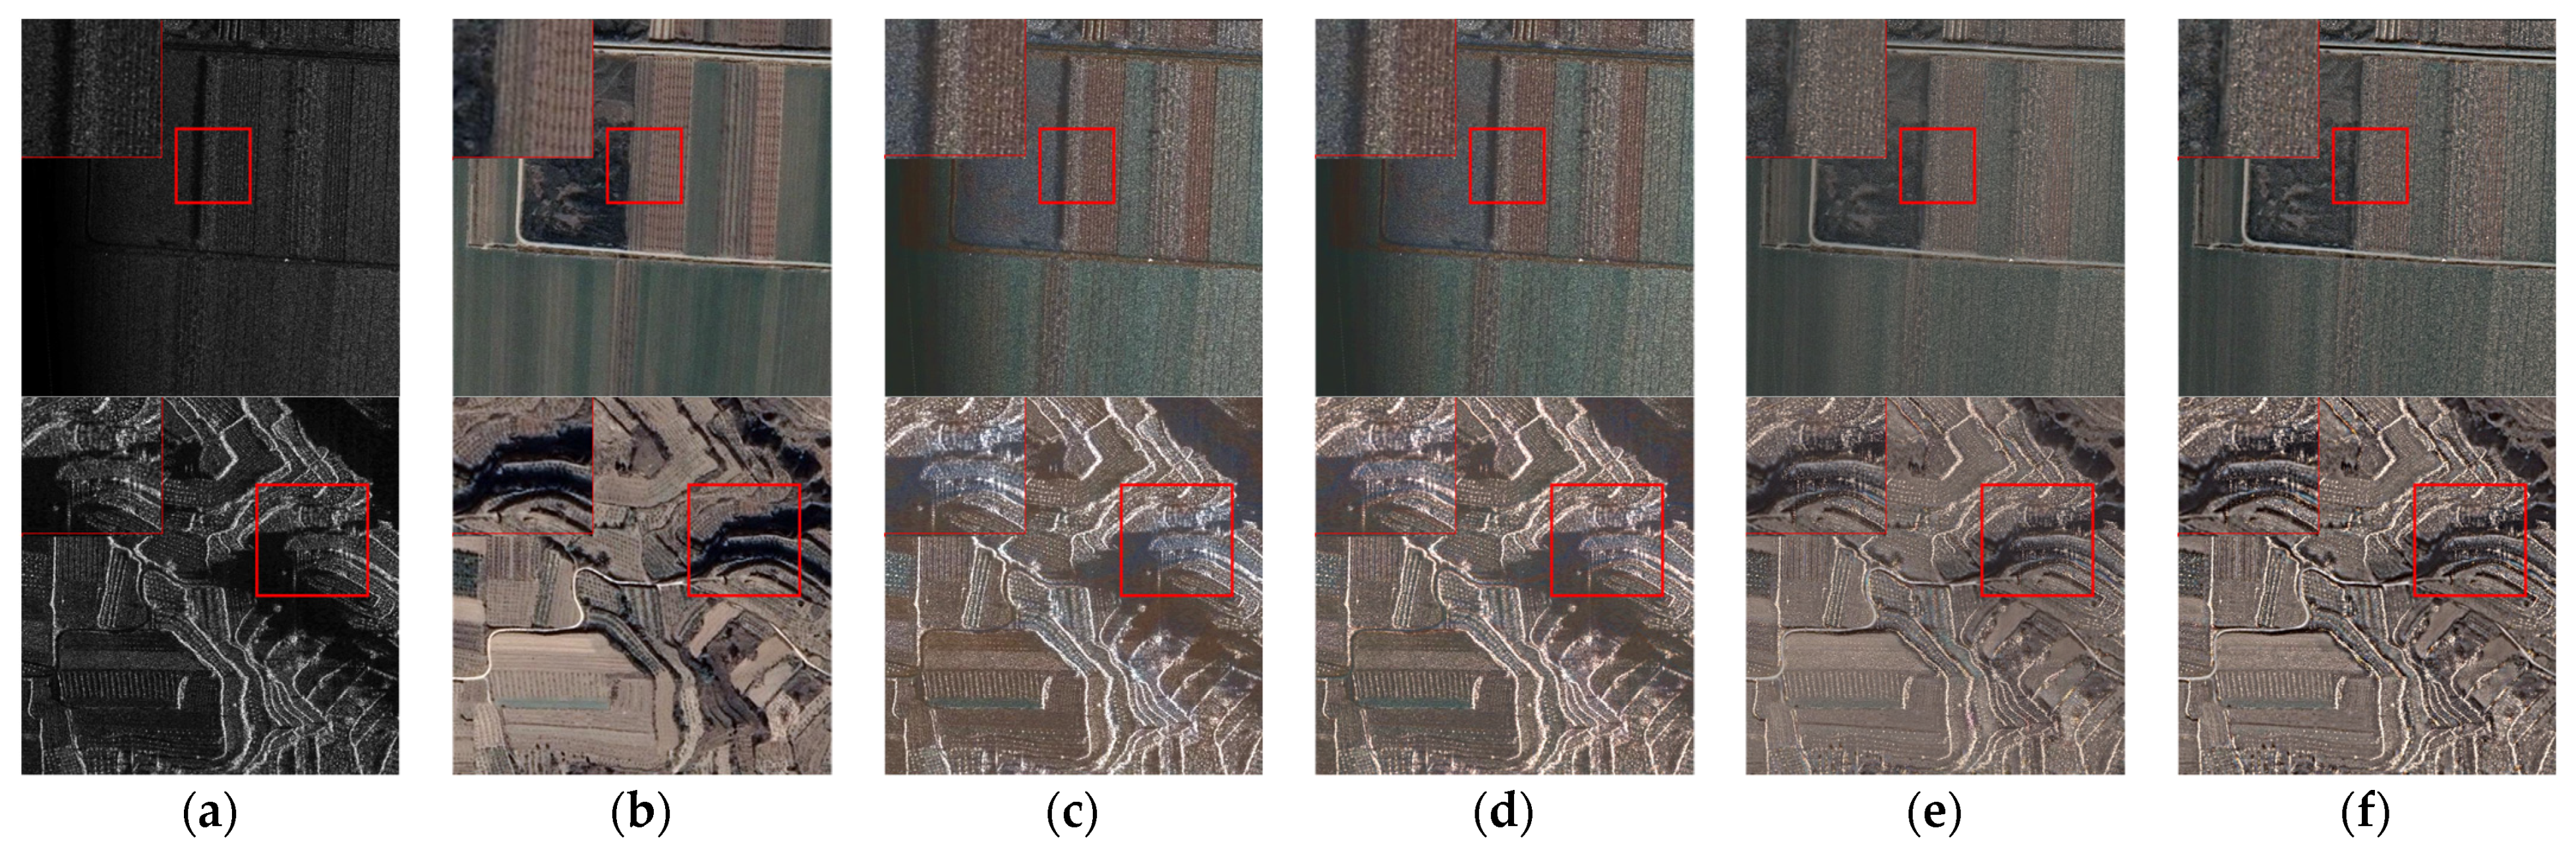
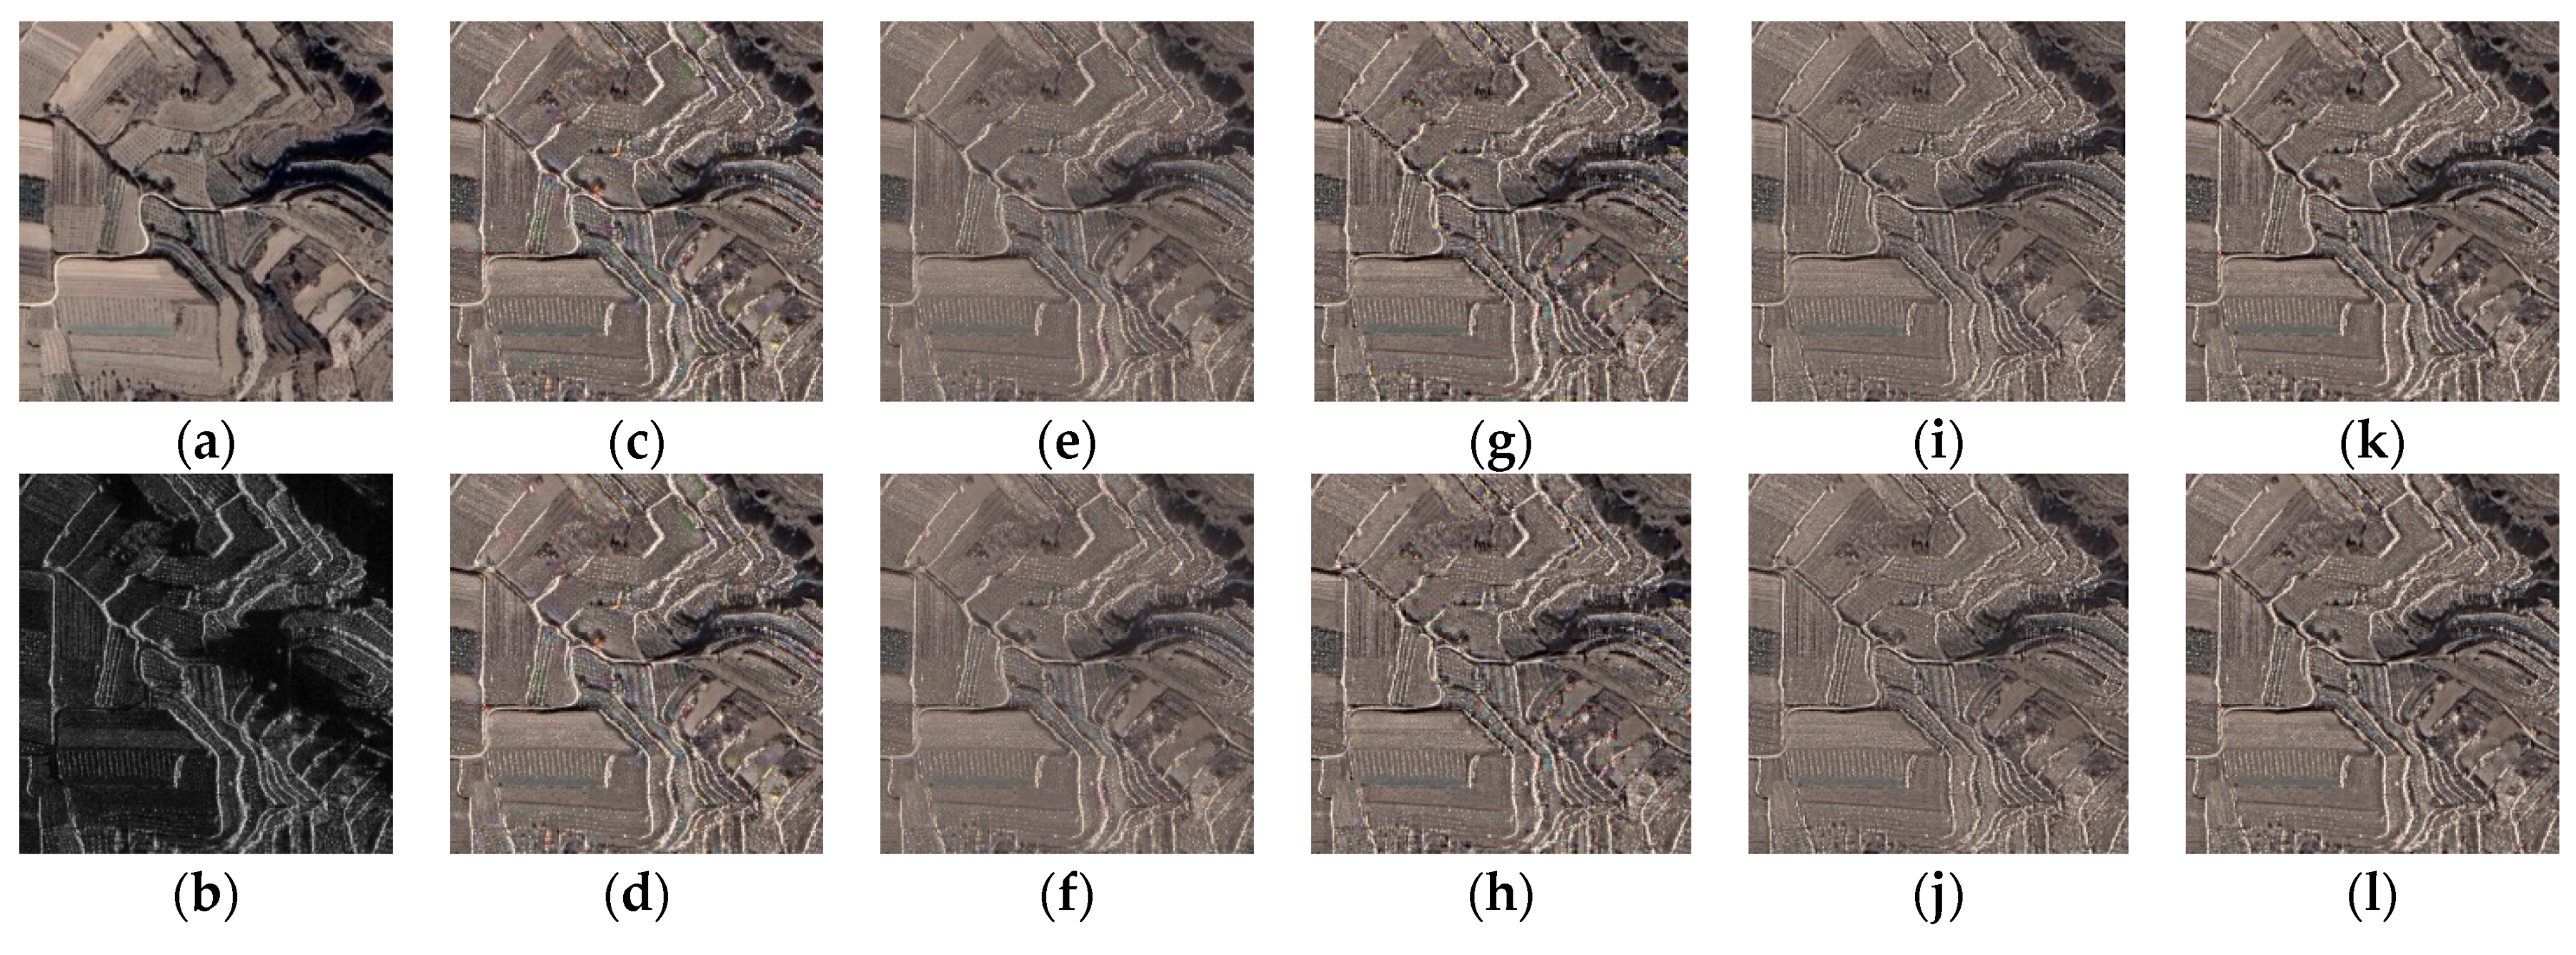
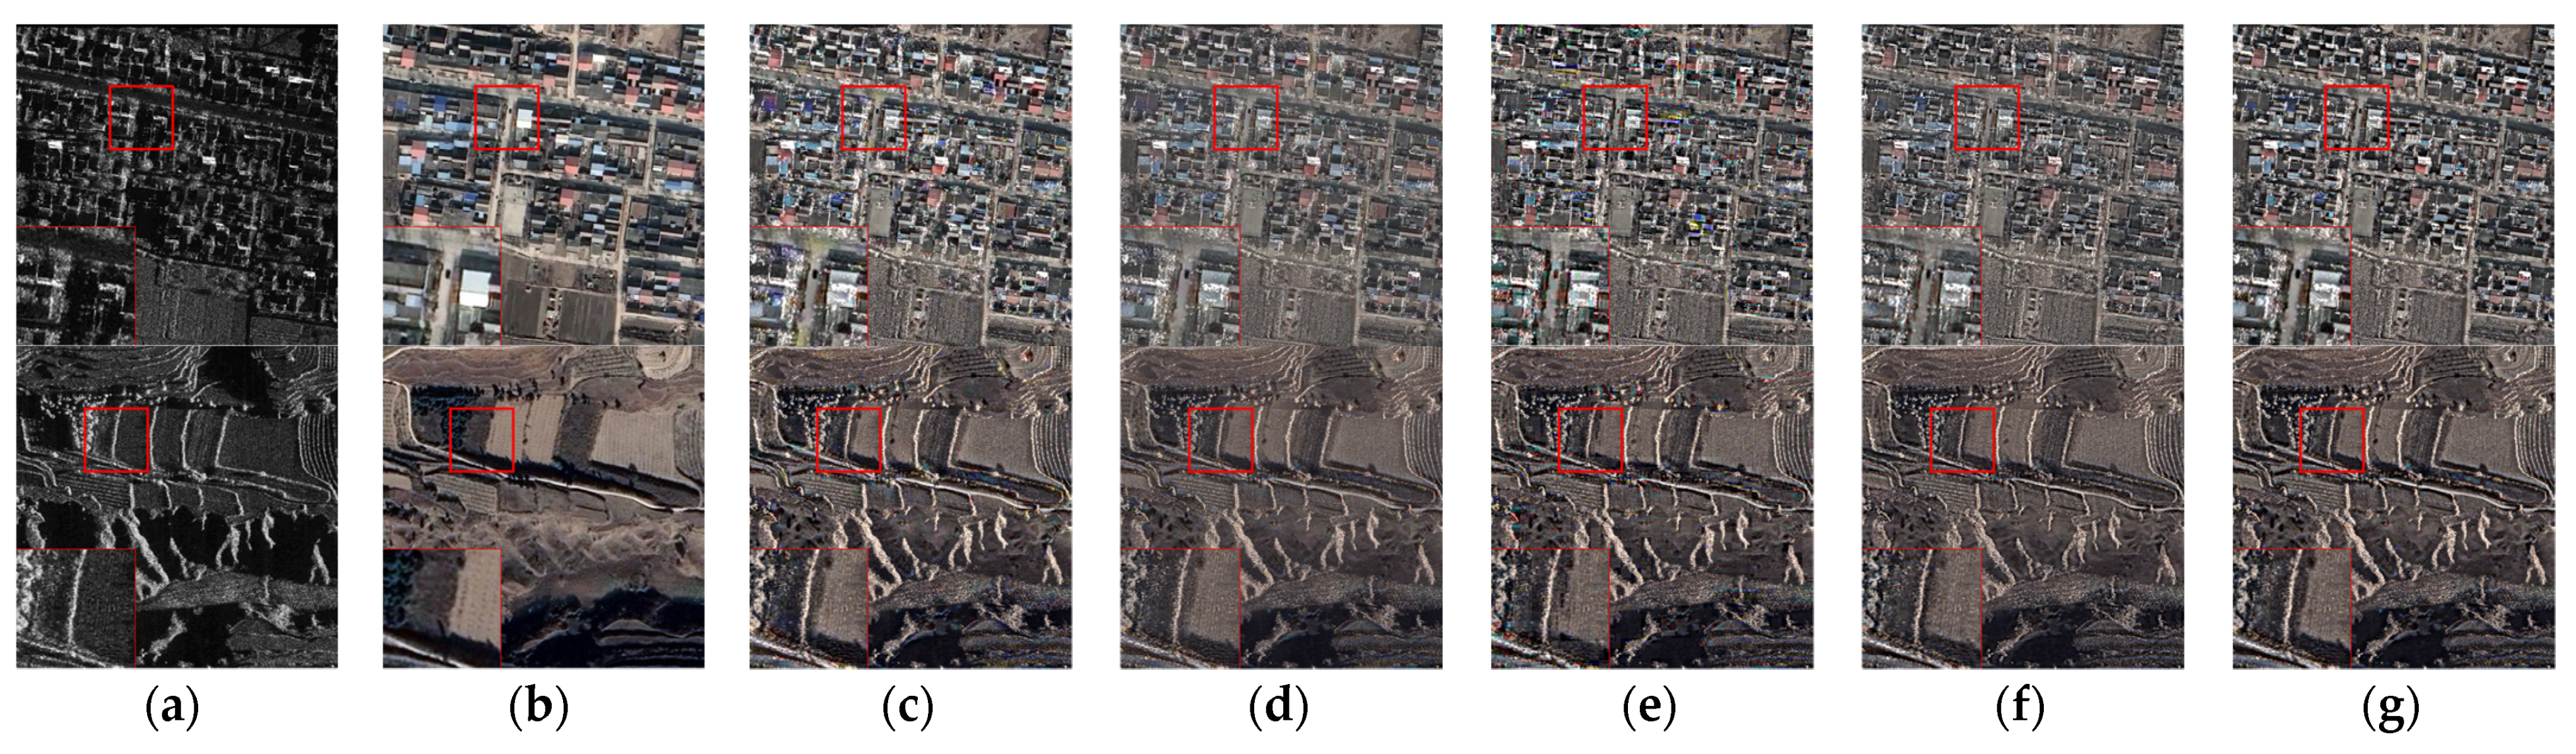
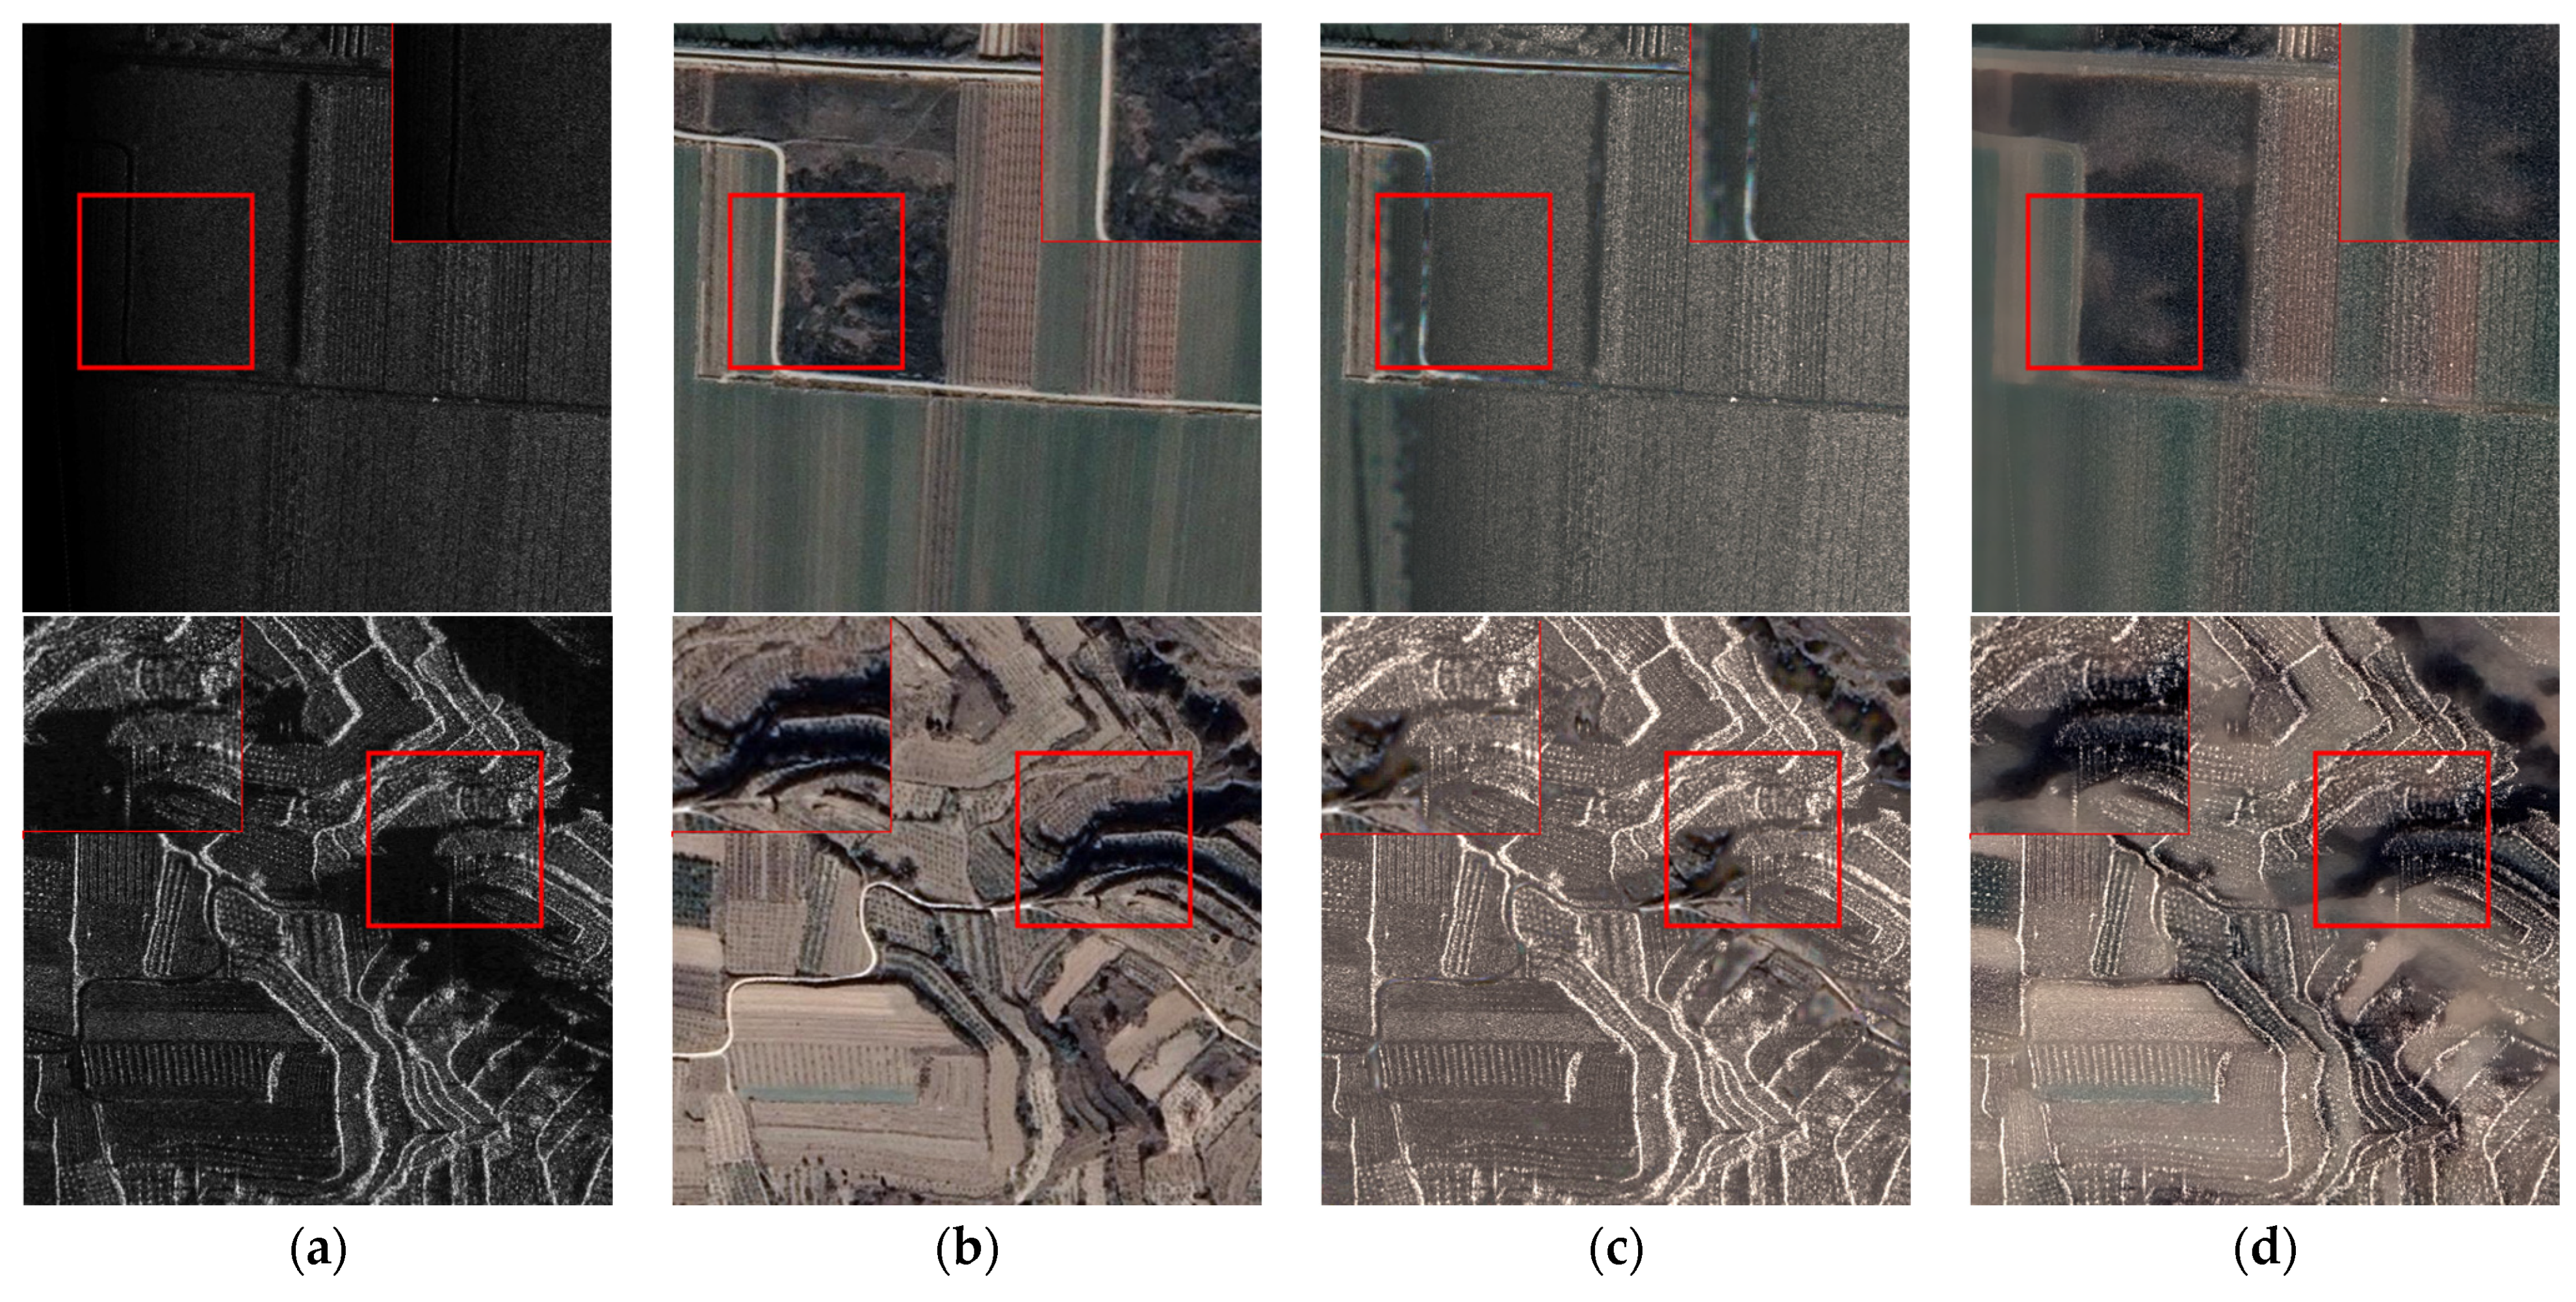
5.1. Visual Evaluation
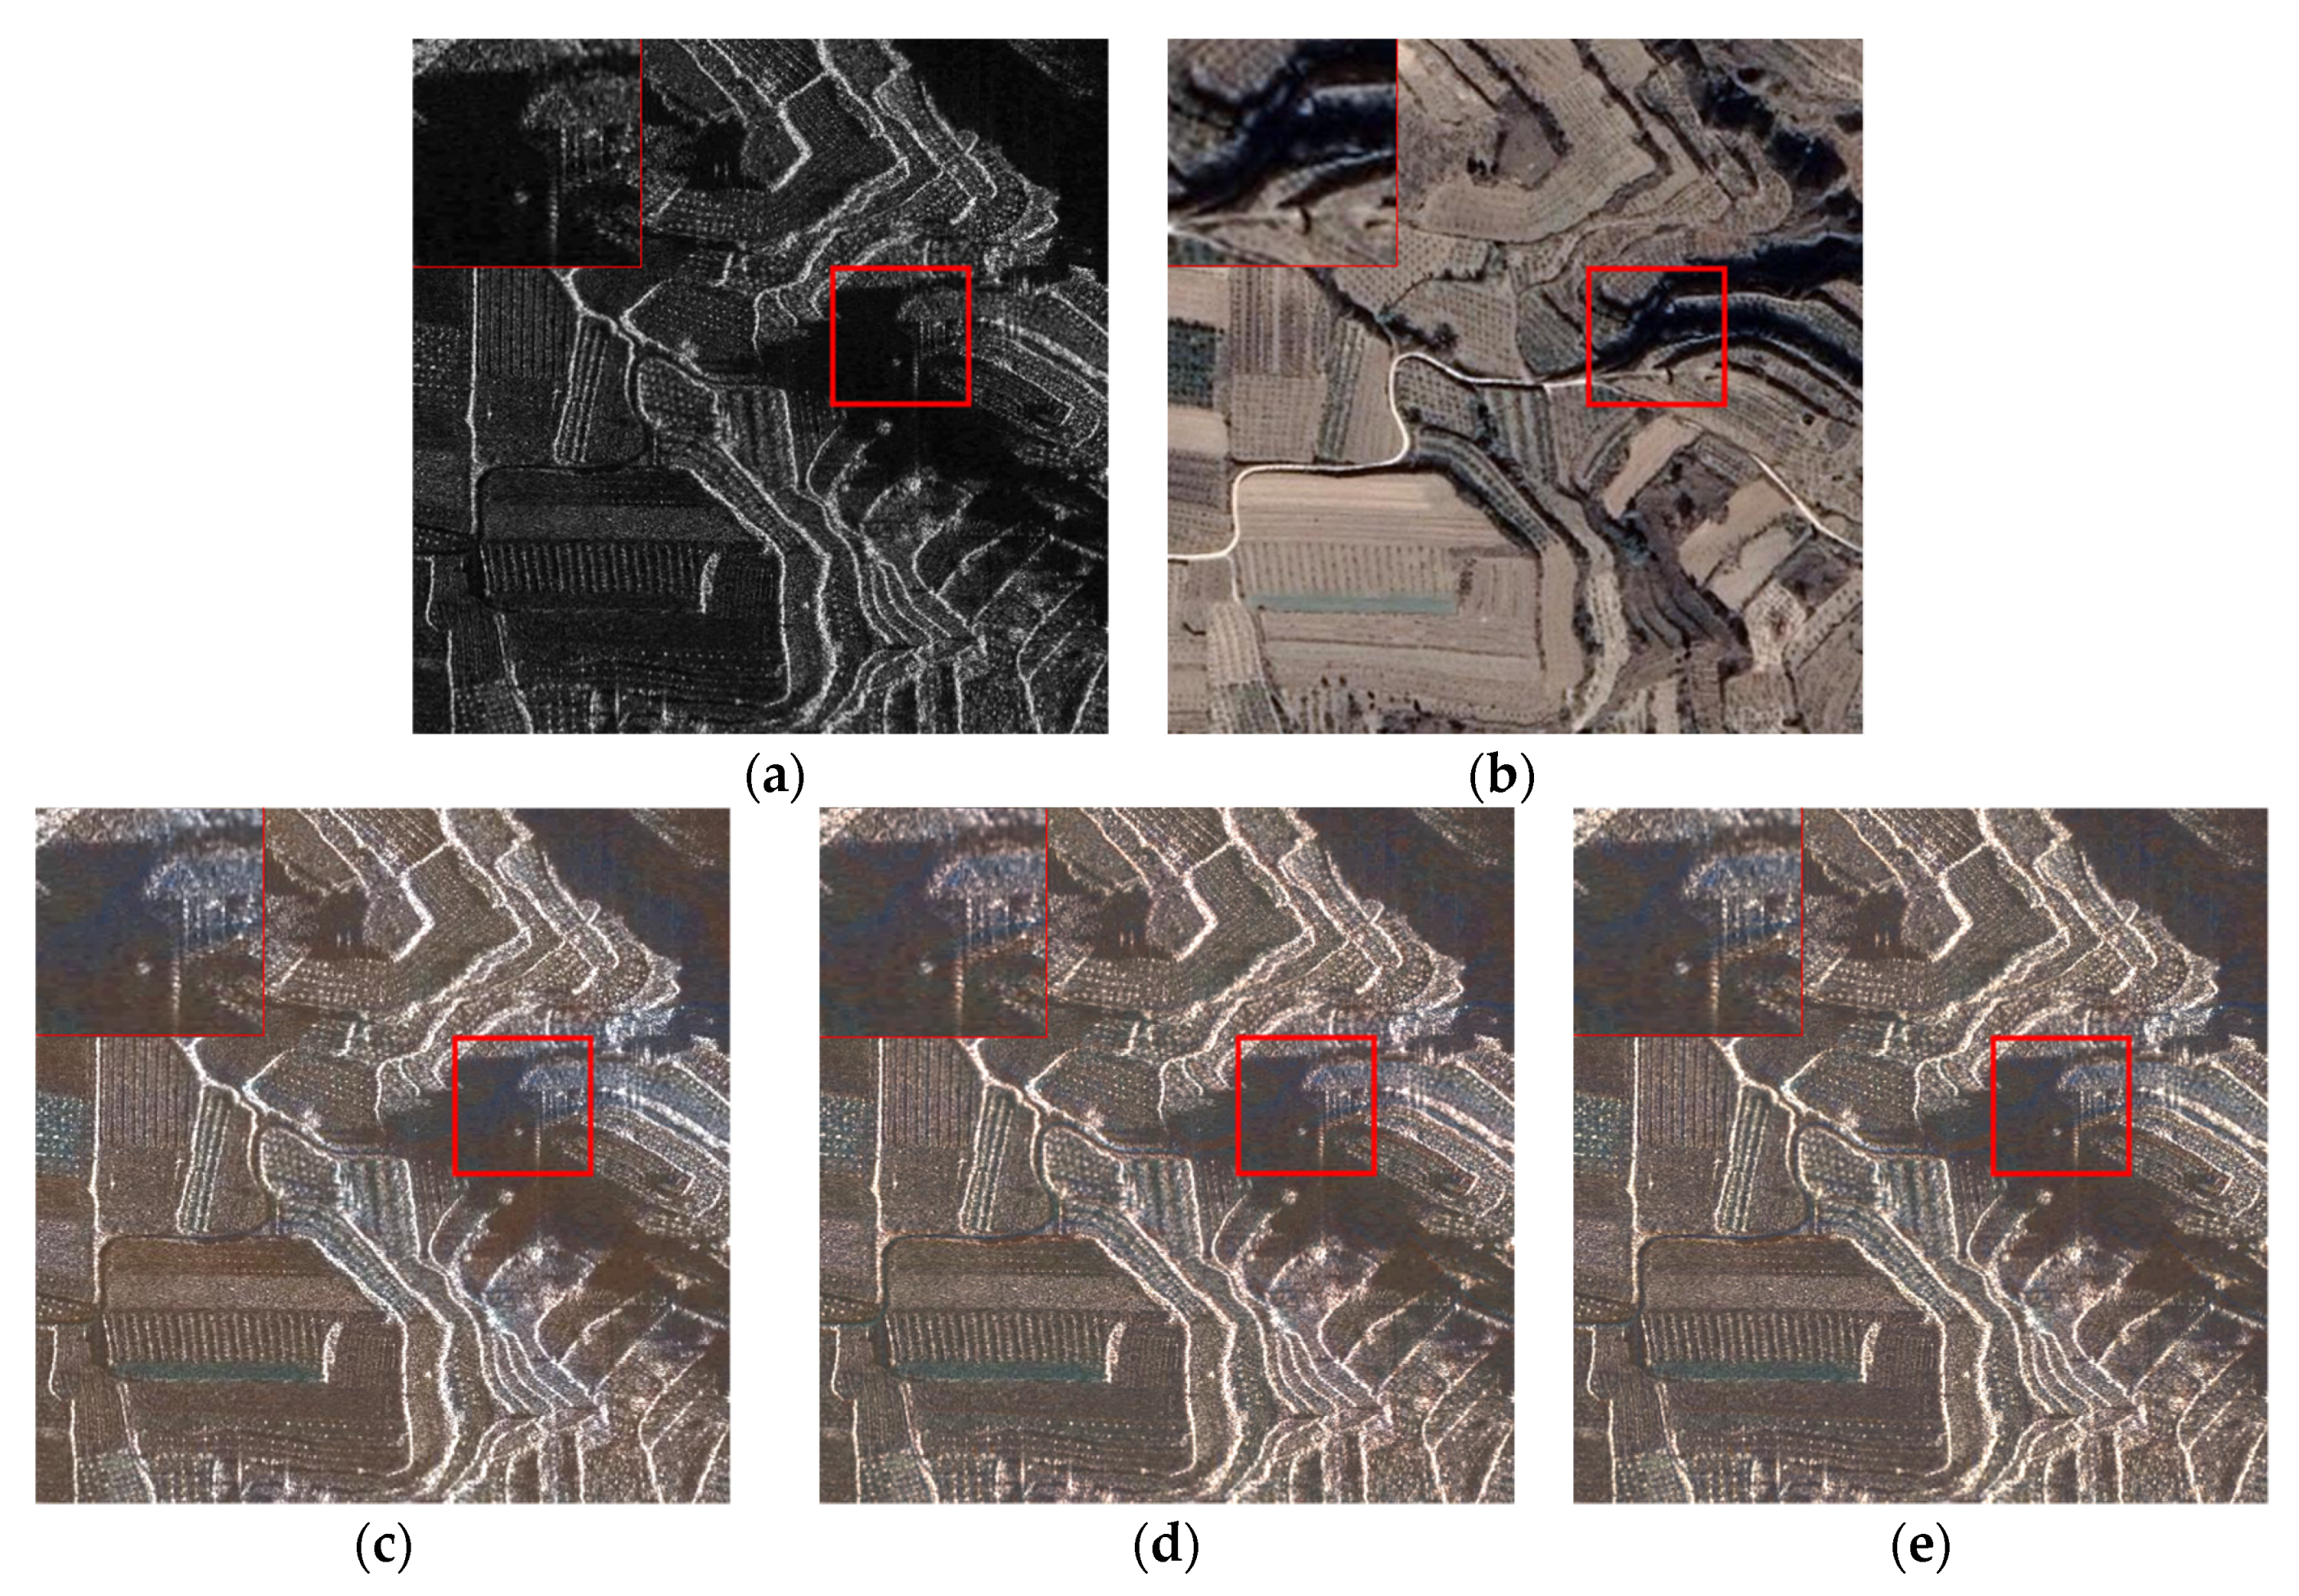
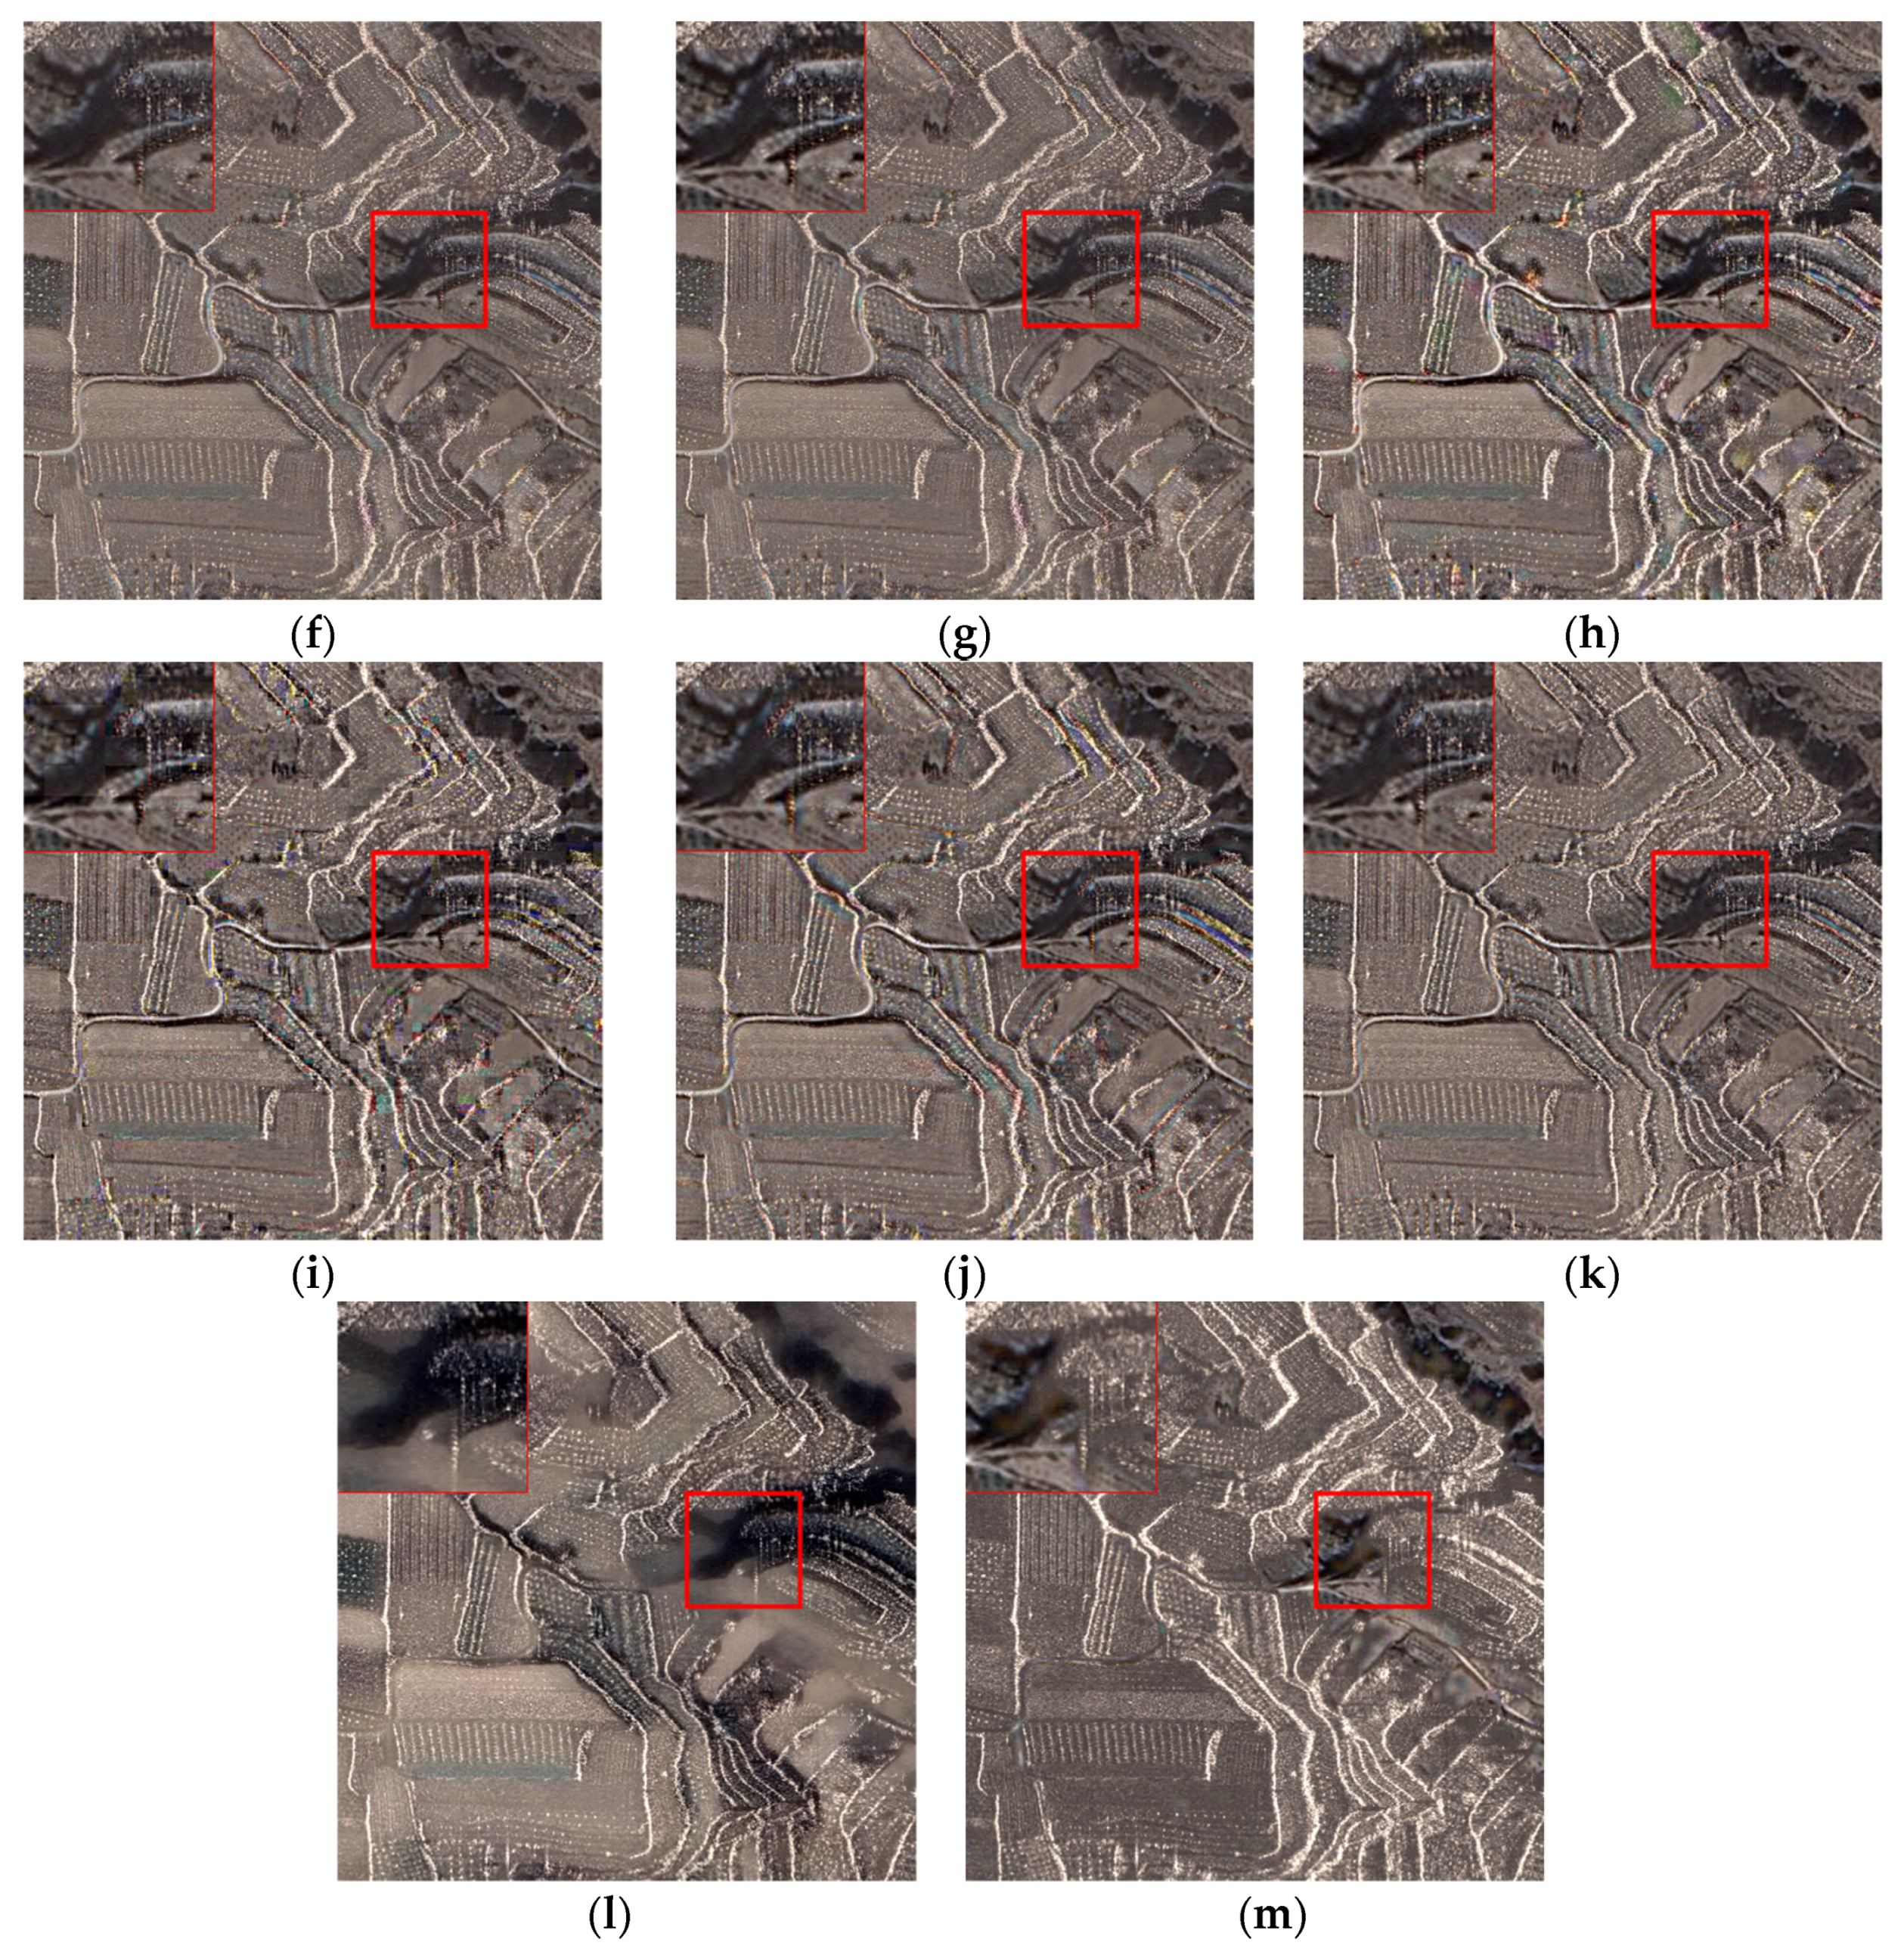
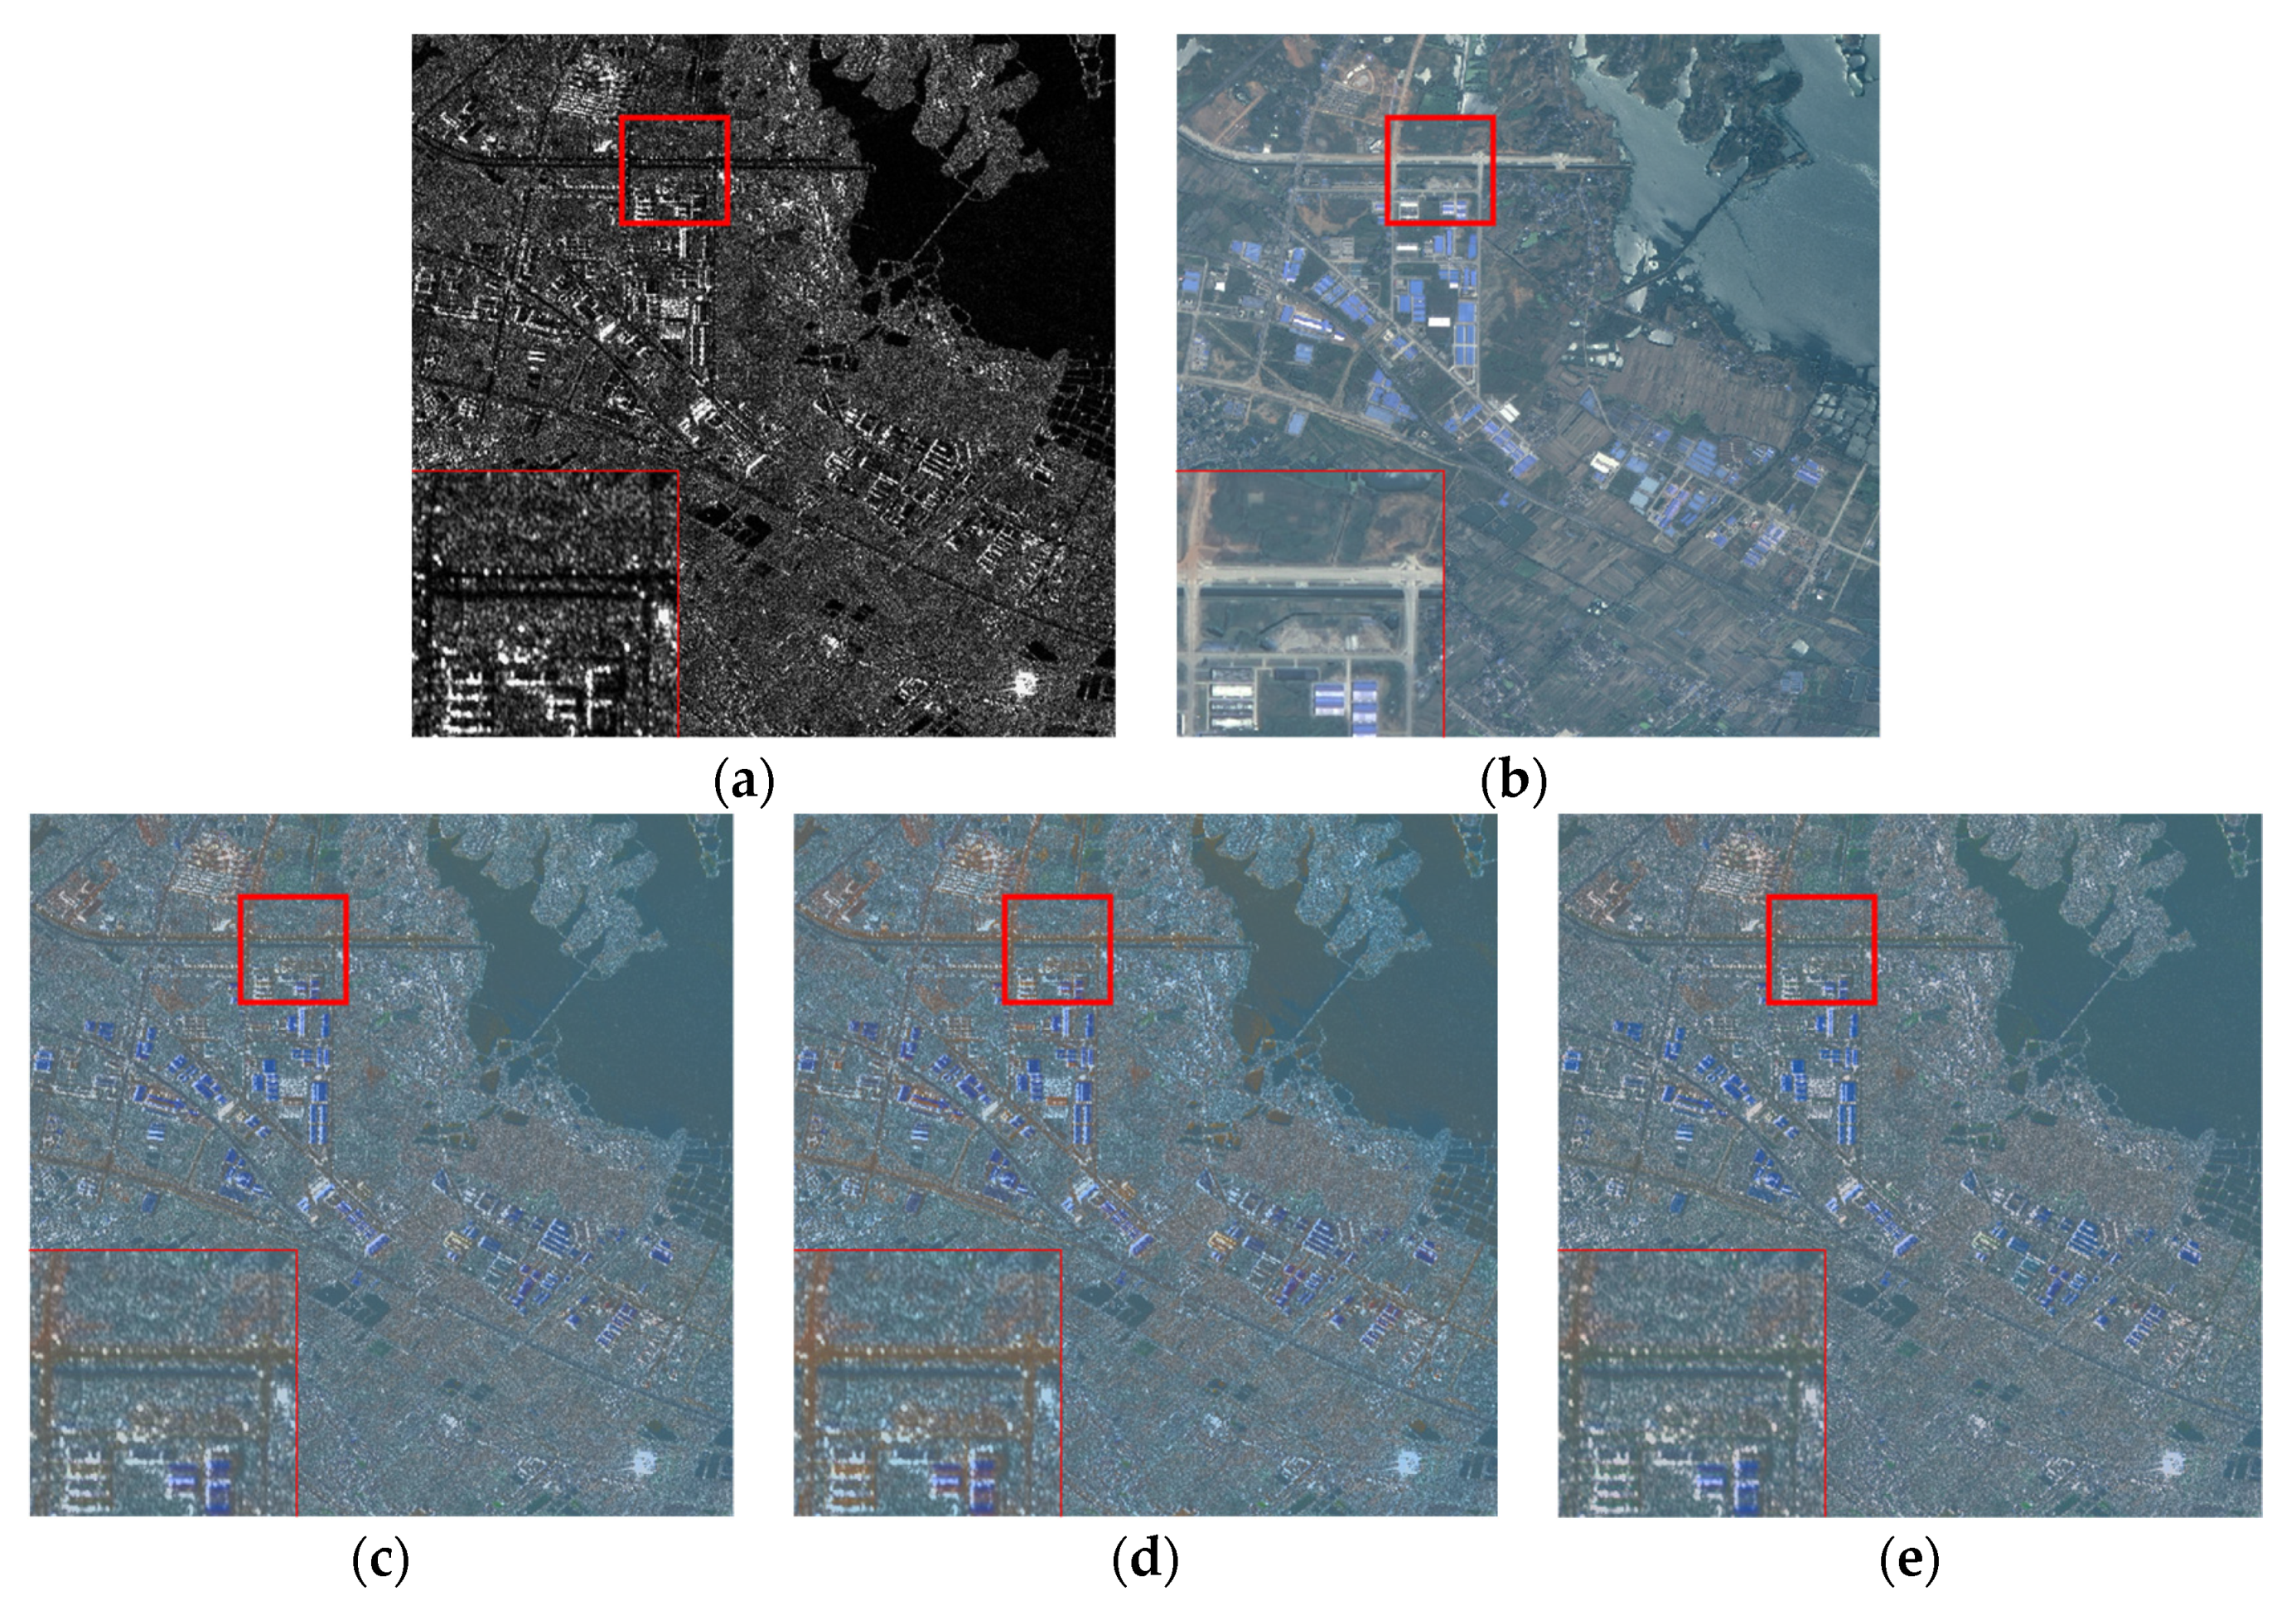
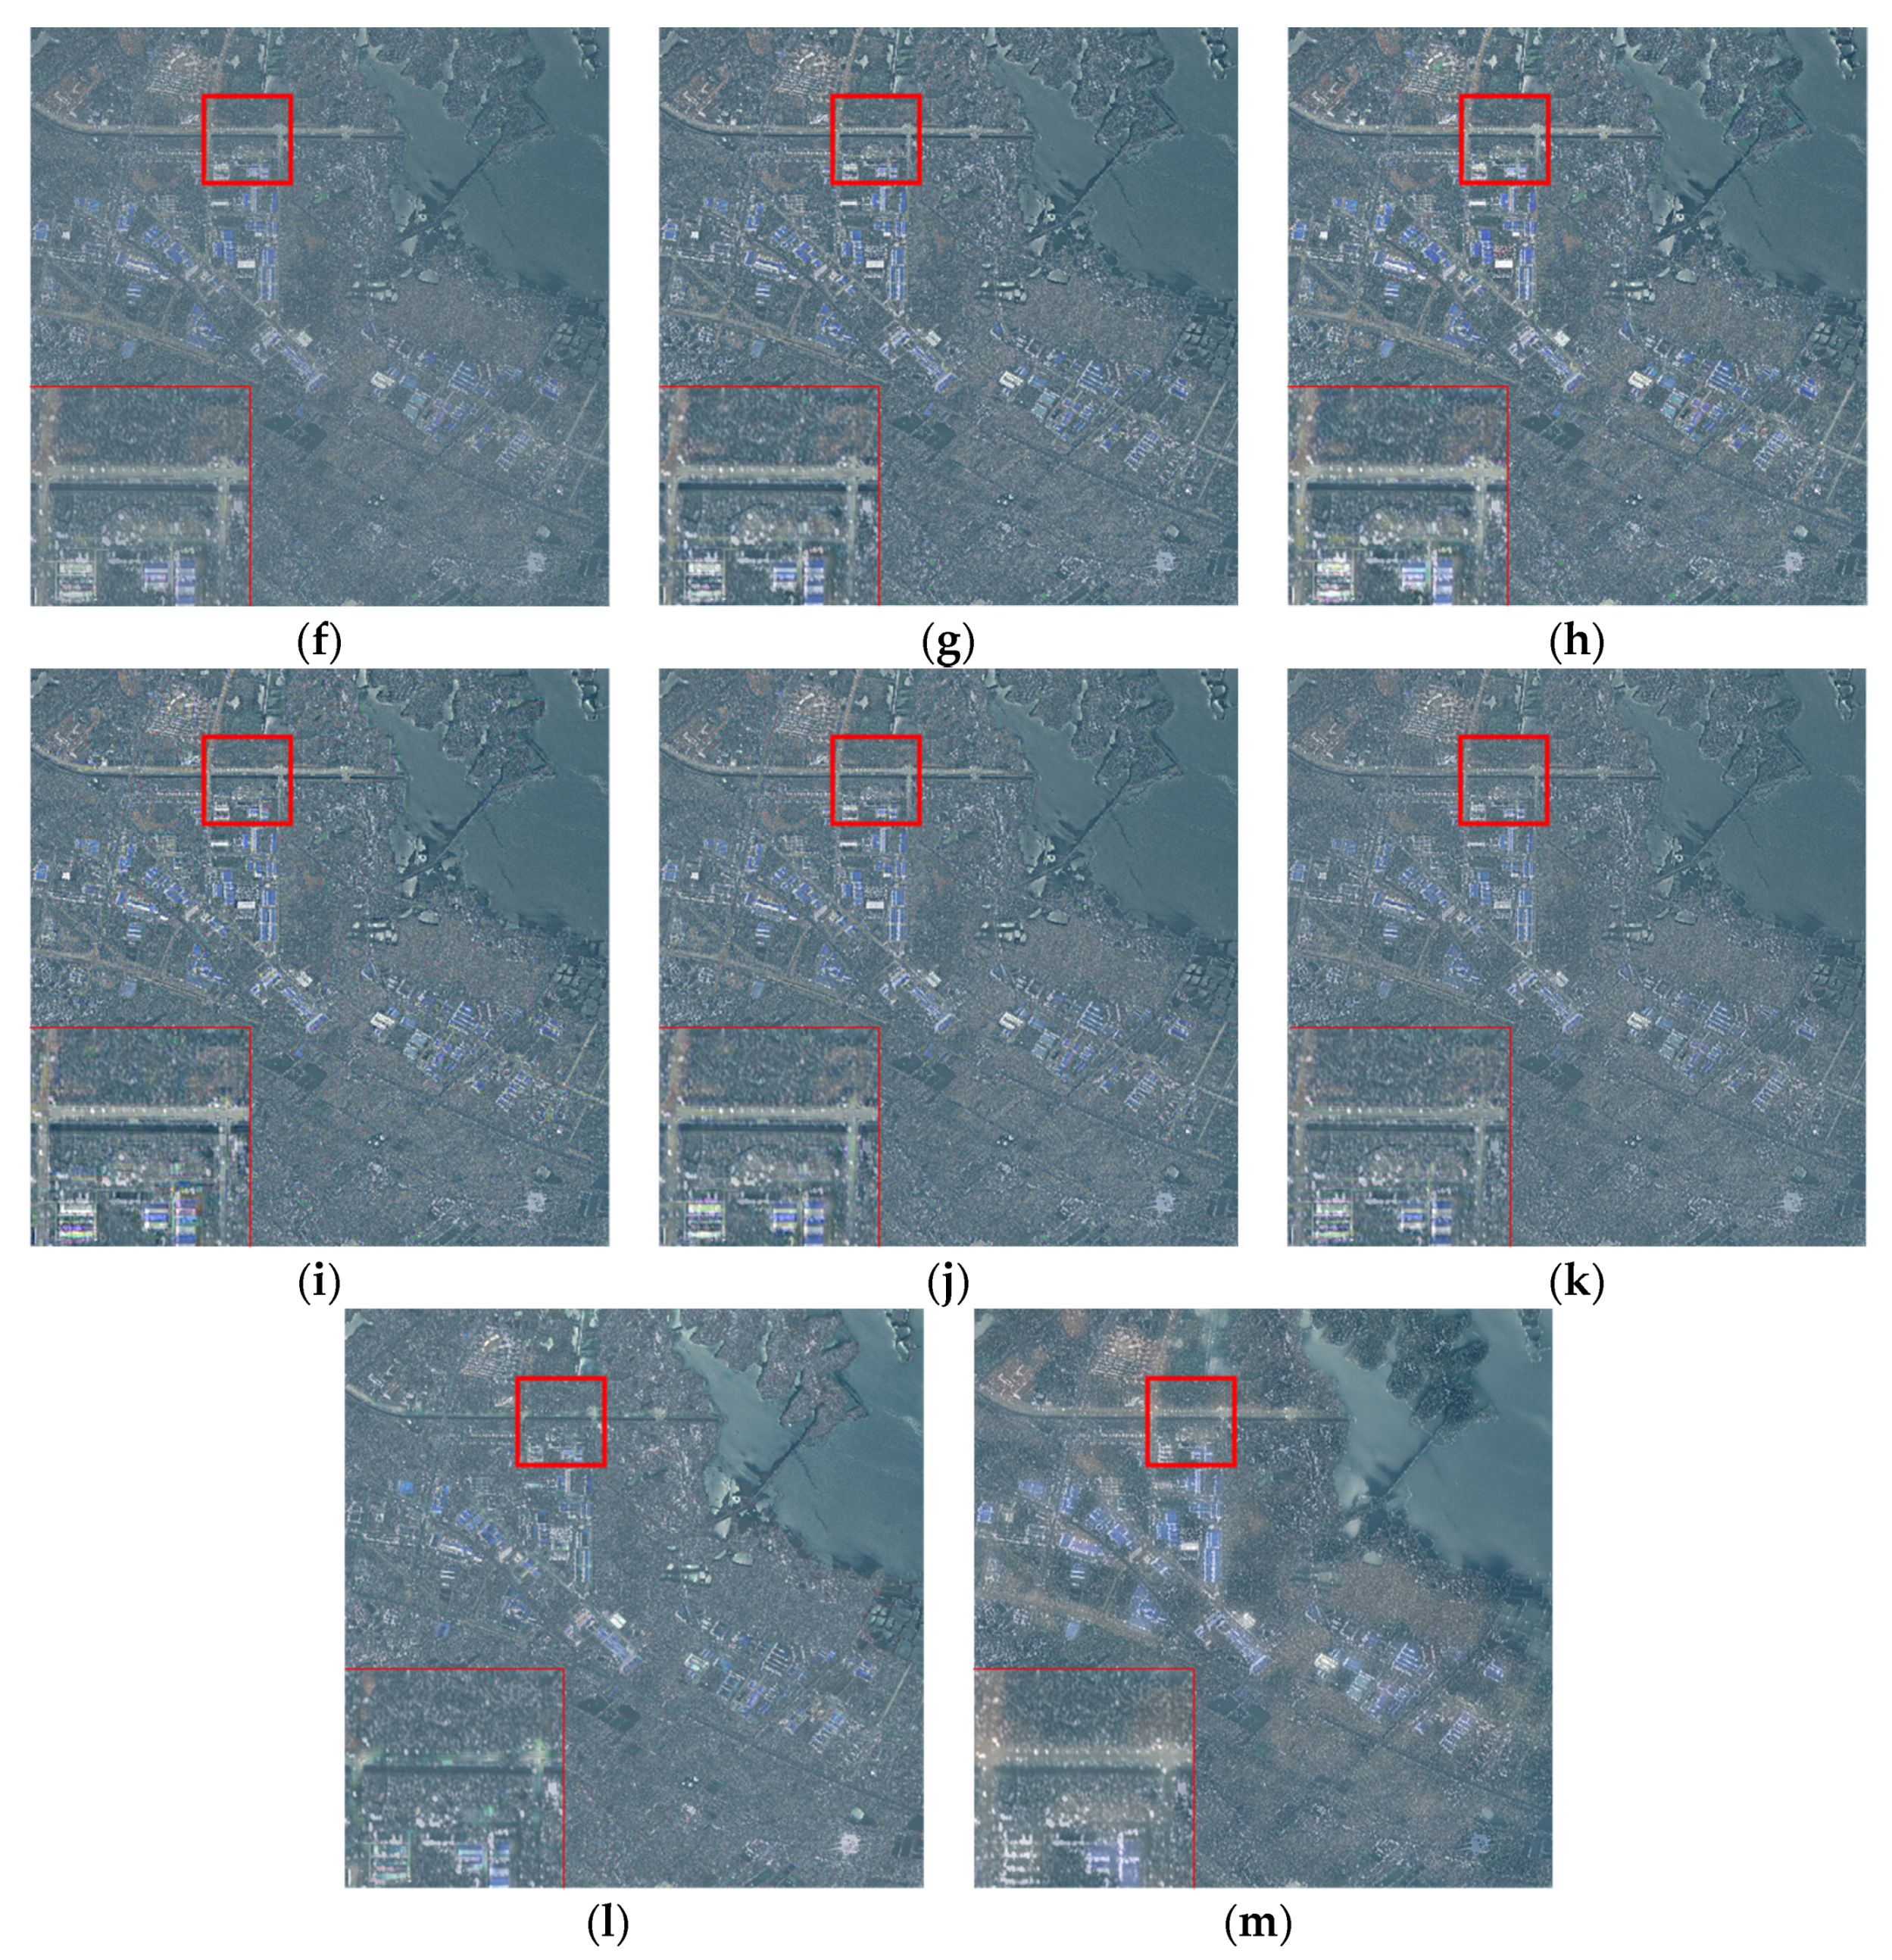
5.1.1. Visual Evaluation of High-Resolution Images
5.1.2. Visual Evaluation of Medium-Resolution Images
5.2. Statistical Evaluation
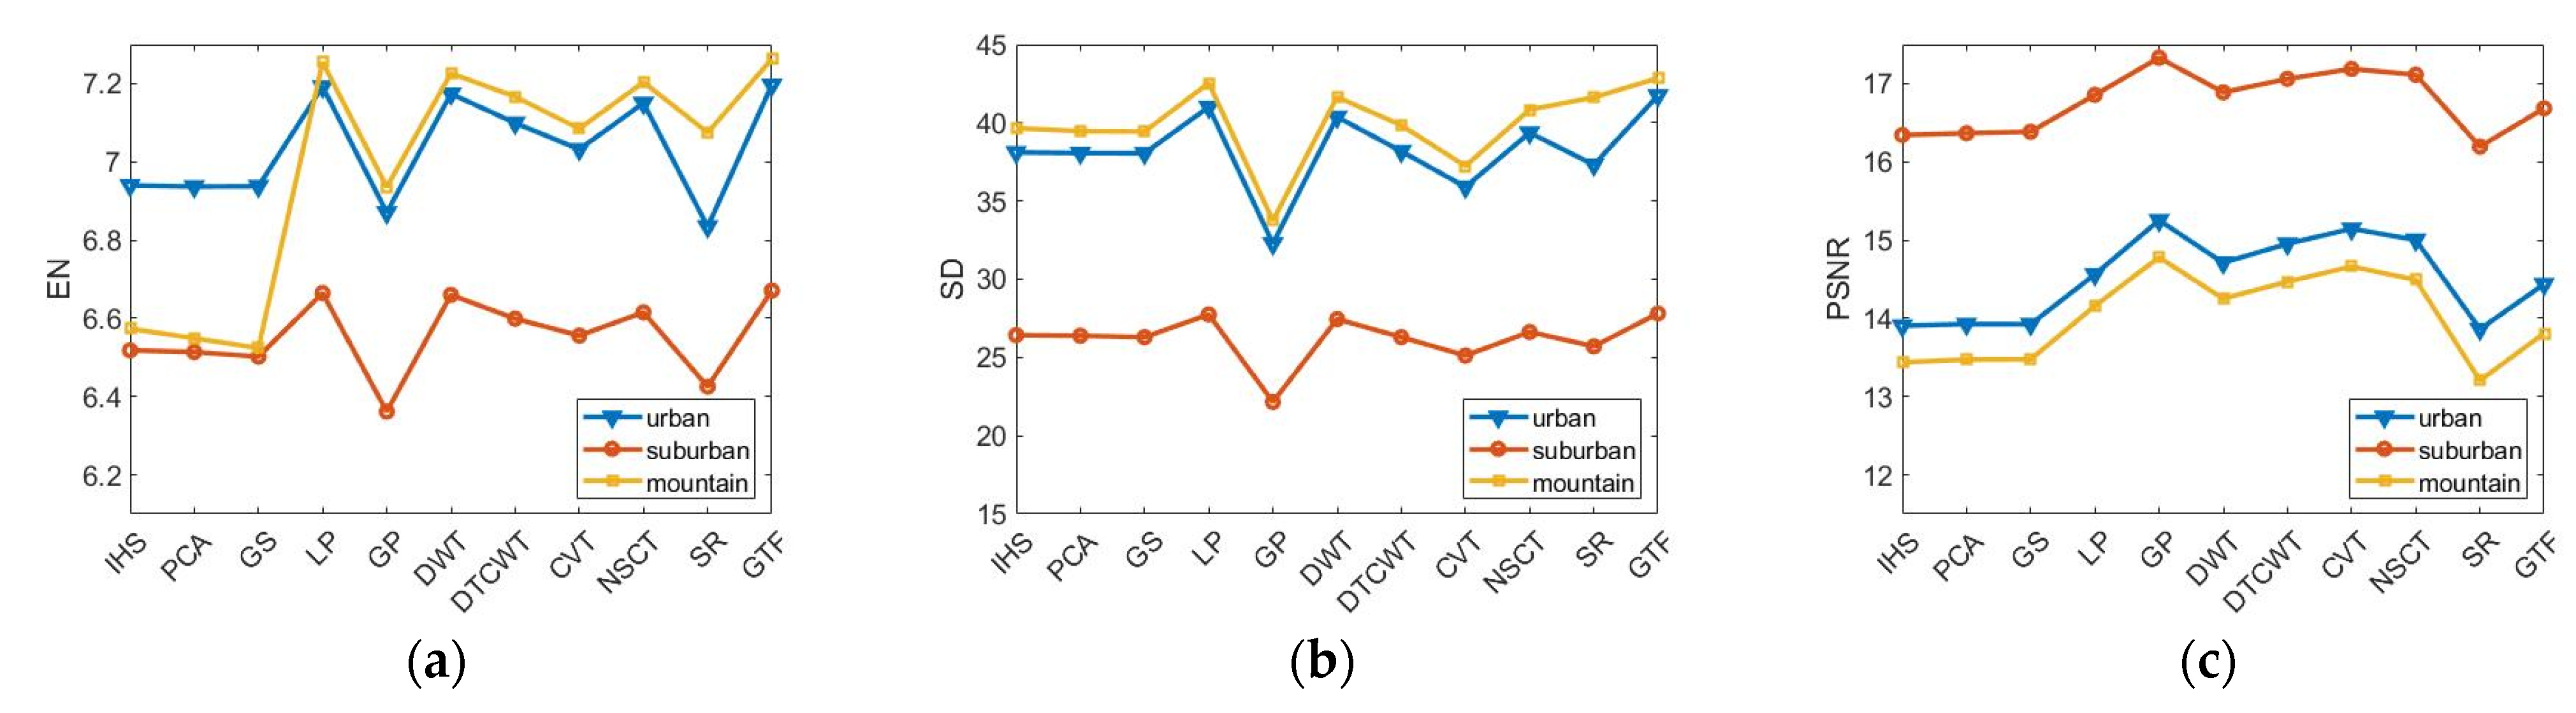
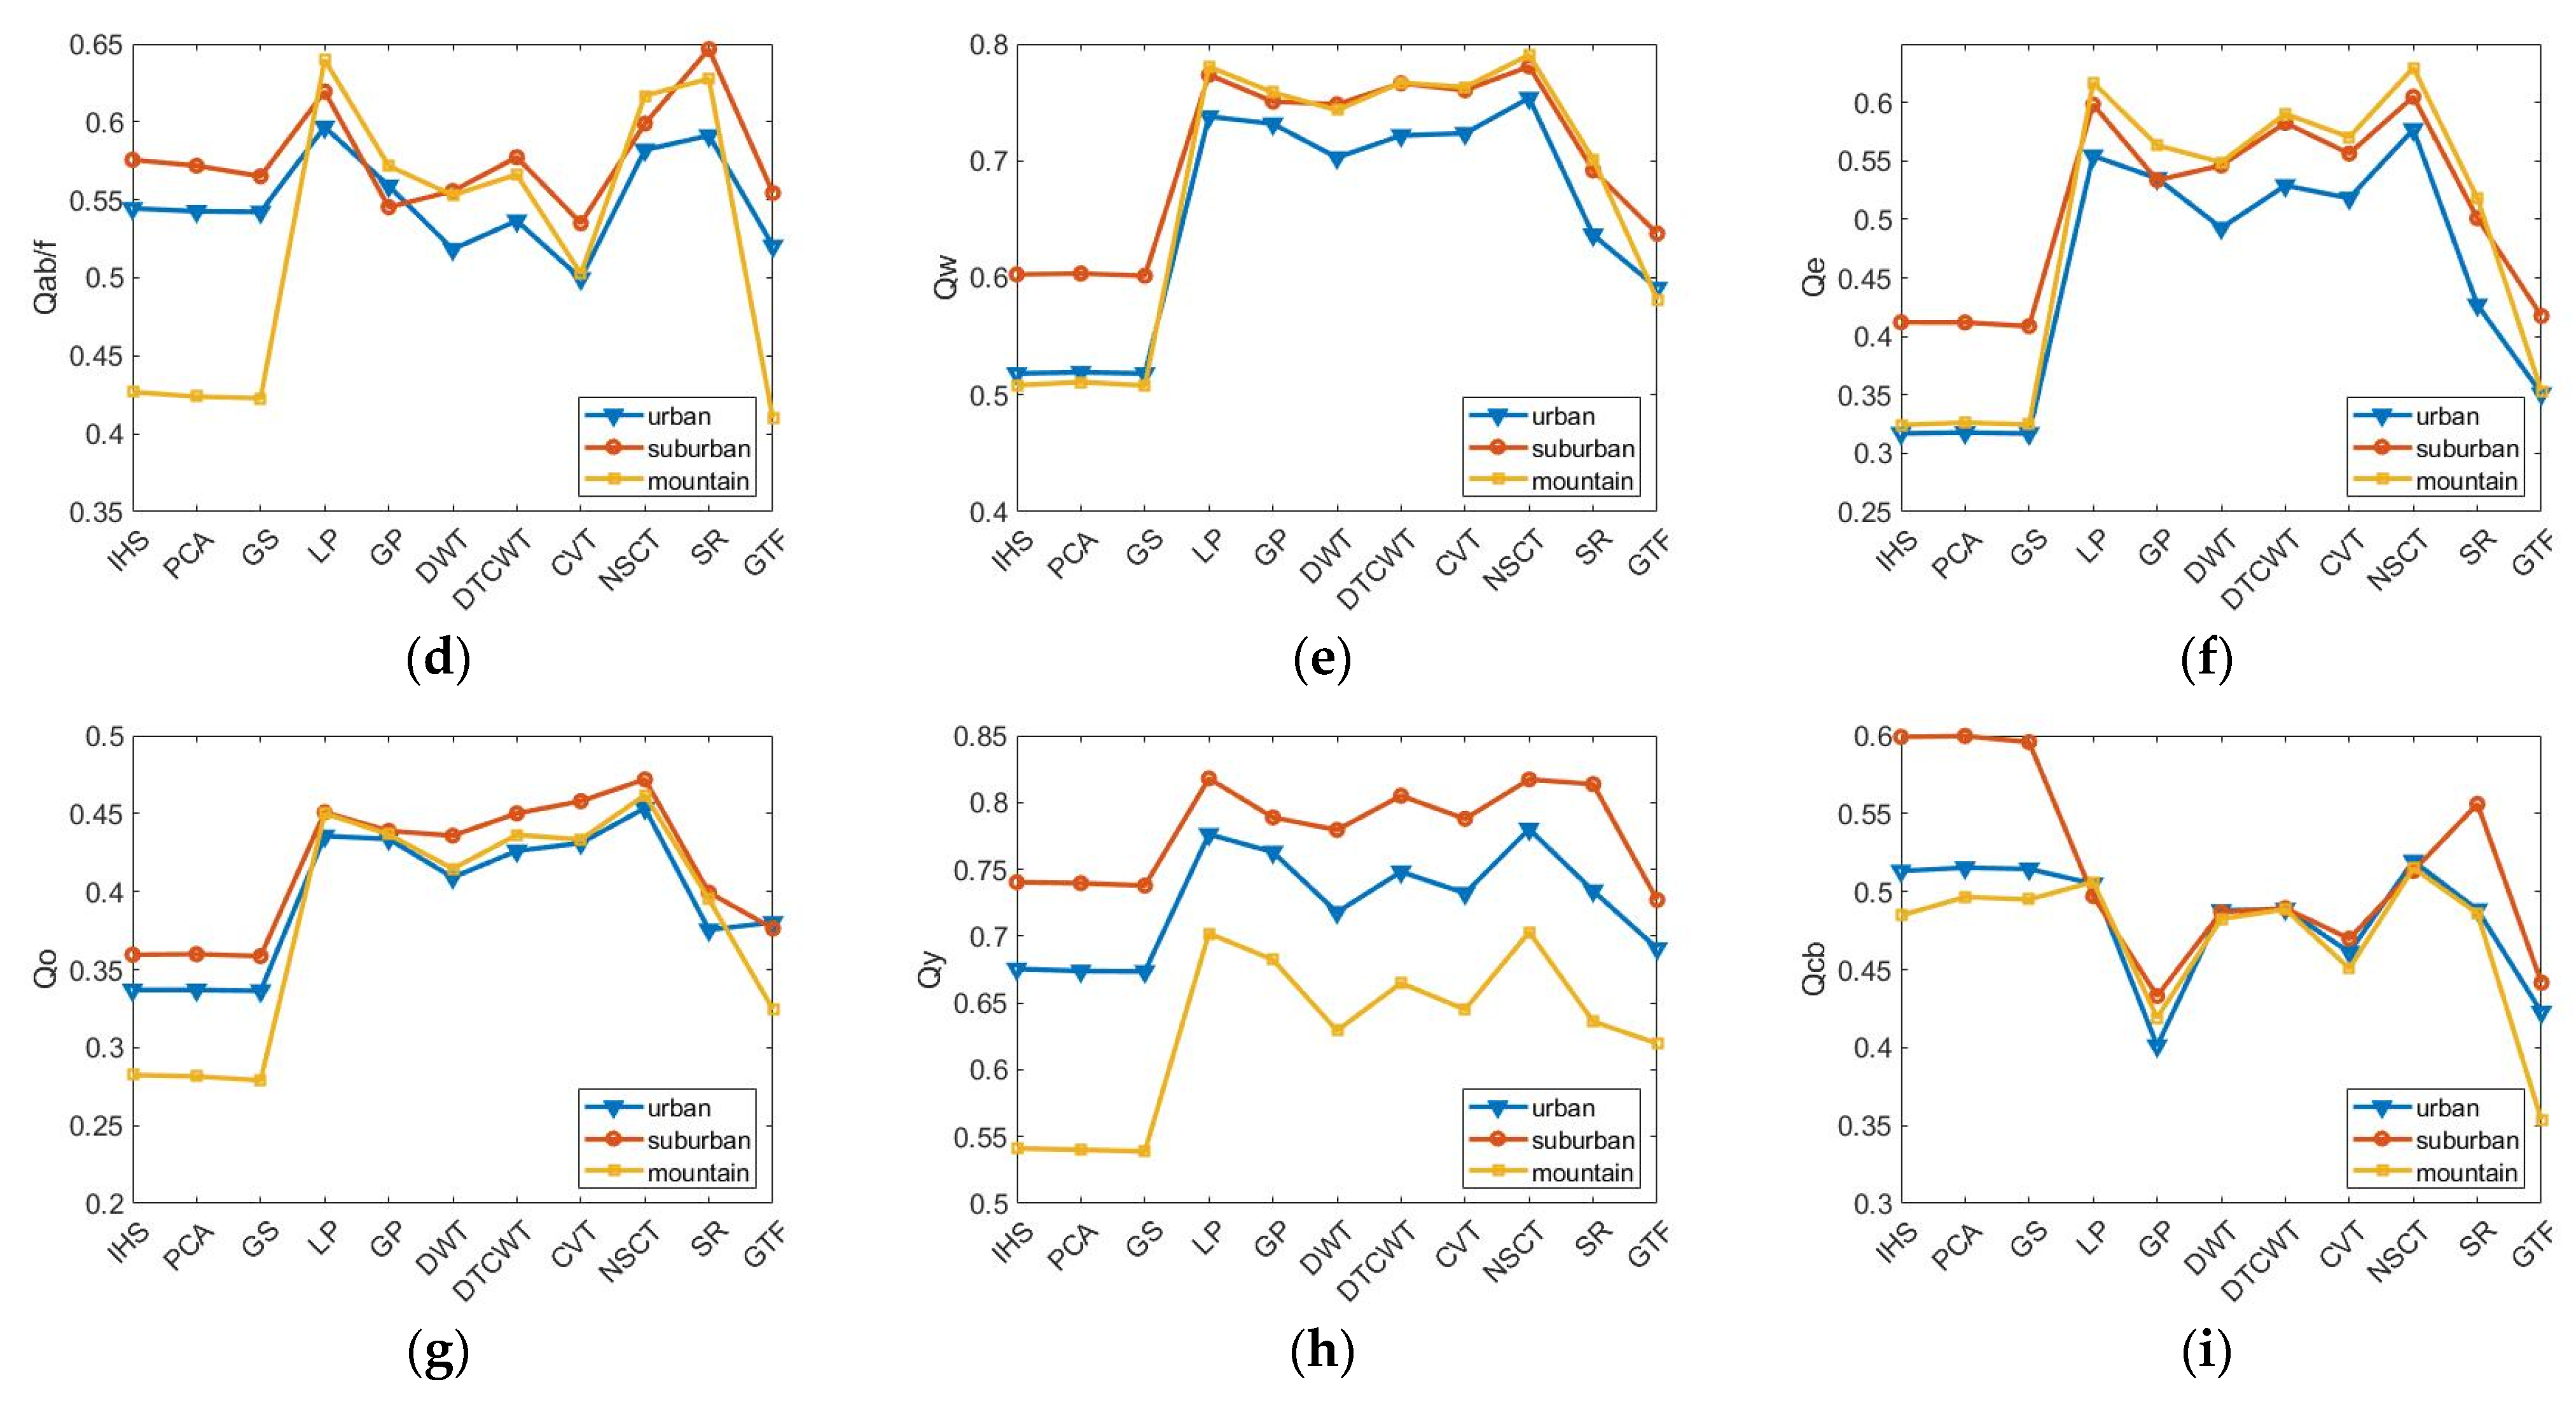
5.2.1. Statistical Evaluation of High-Resolution Images
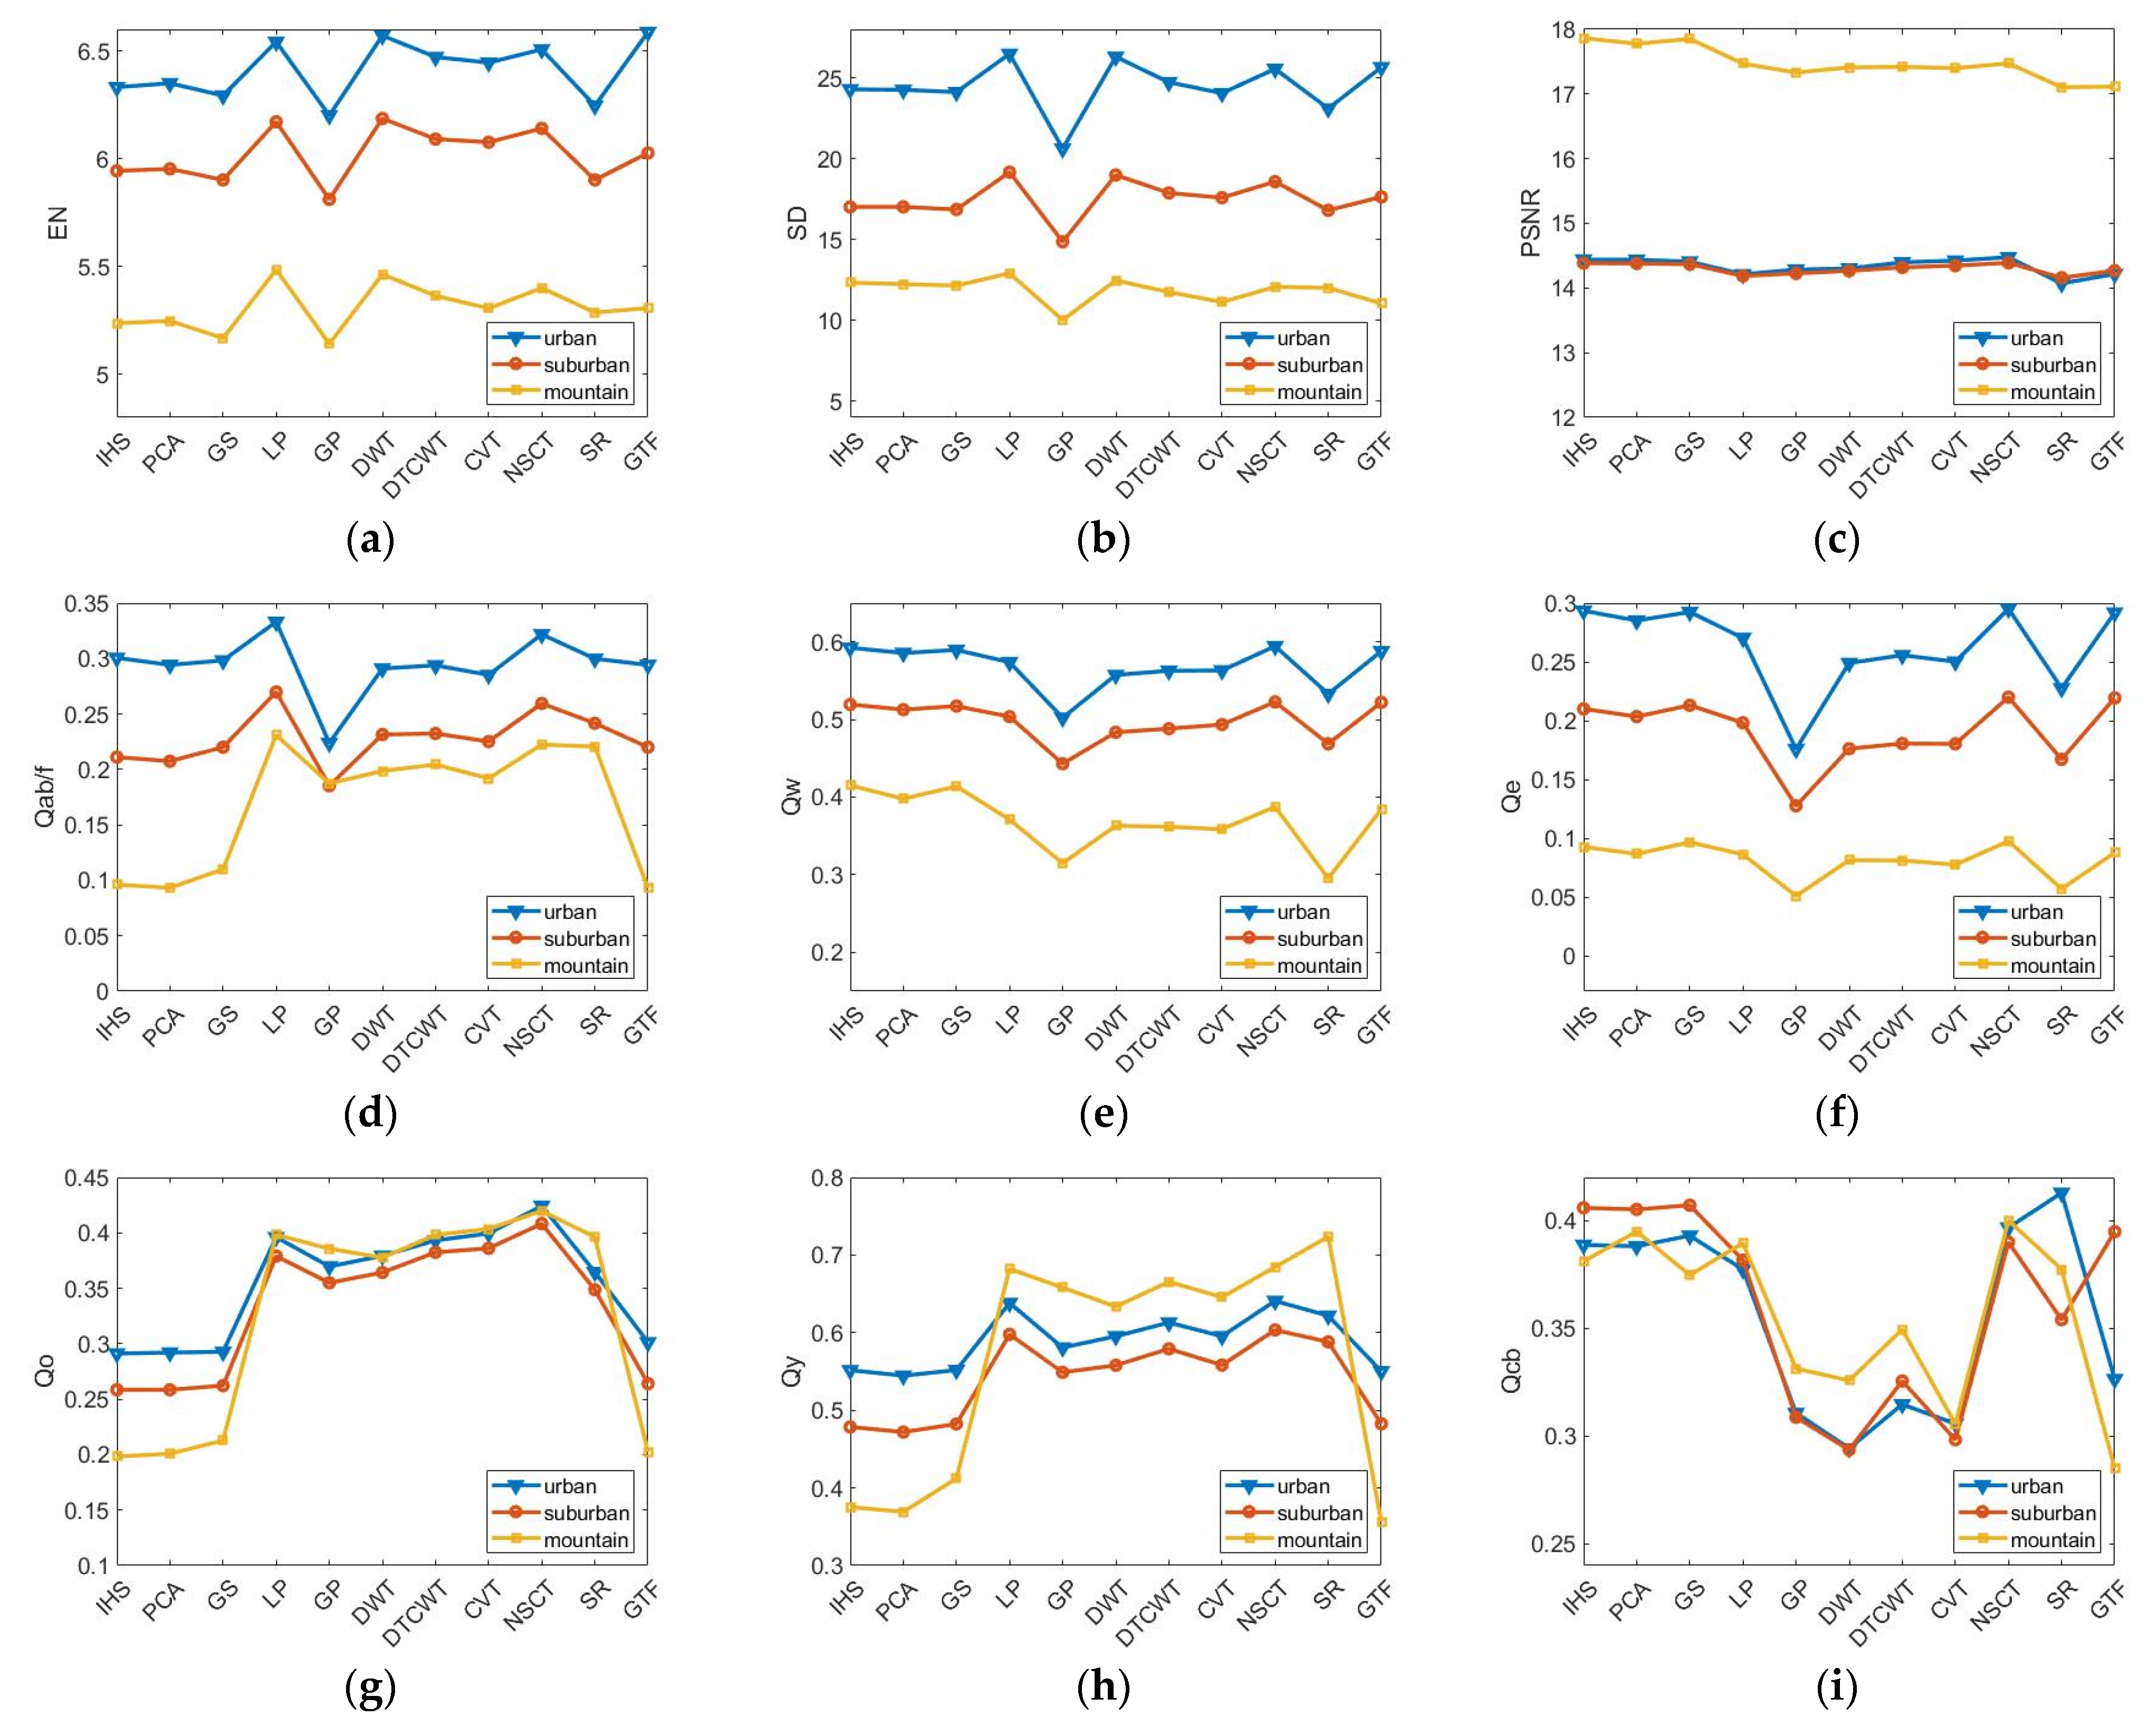
5.2.2. Statistical Evaluation of Medium-Resolution Images
5.3. Fusion Evaluation According to Classification
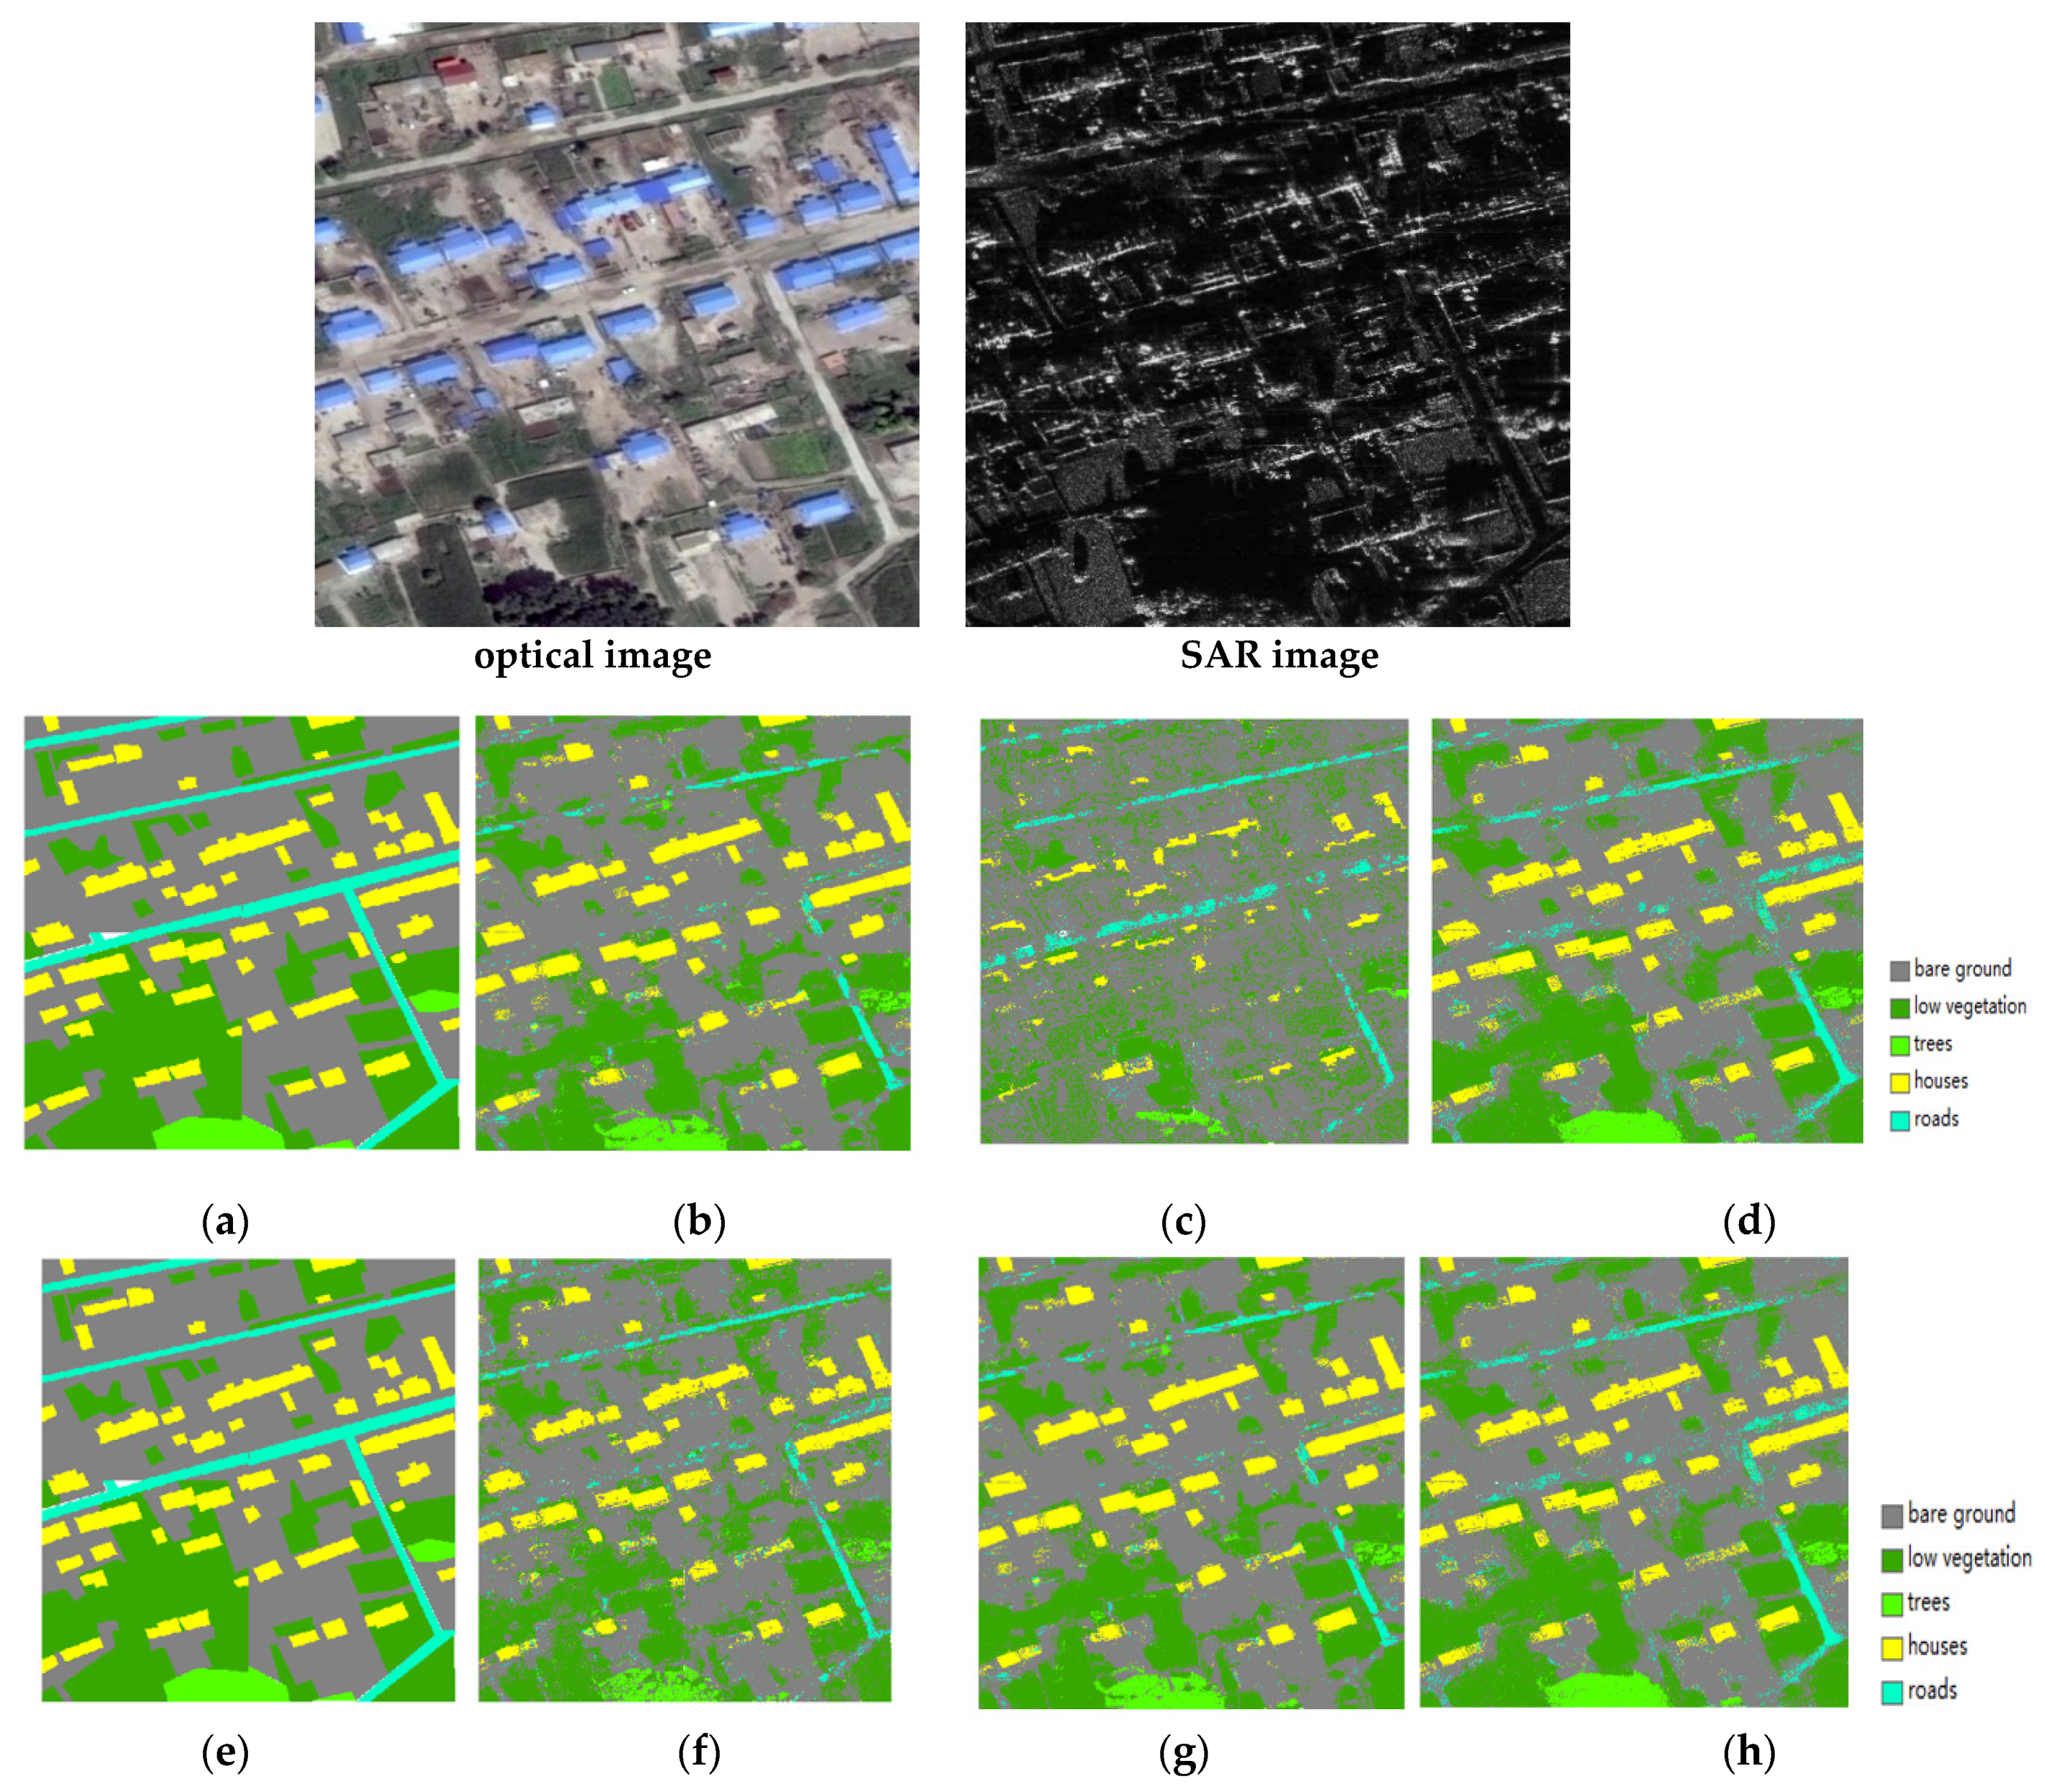
5.3.1. Fusion Evaluation of High-Resolution Images According to Classification
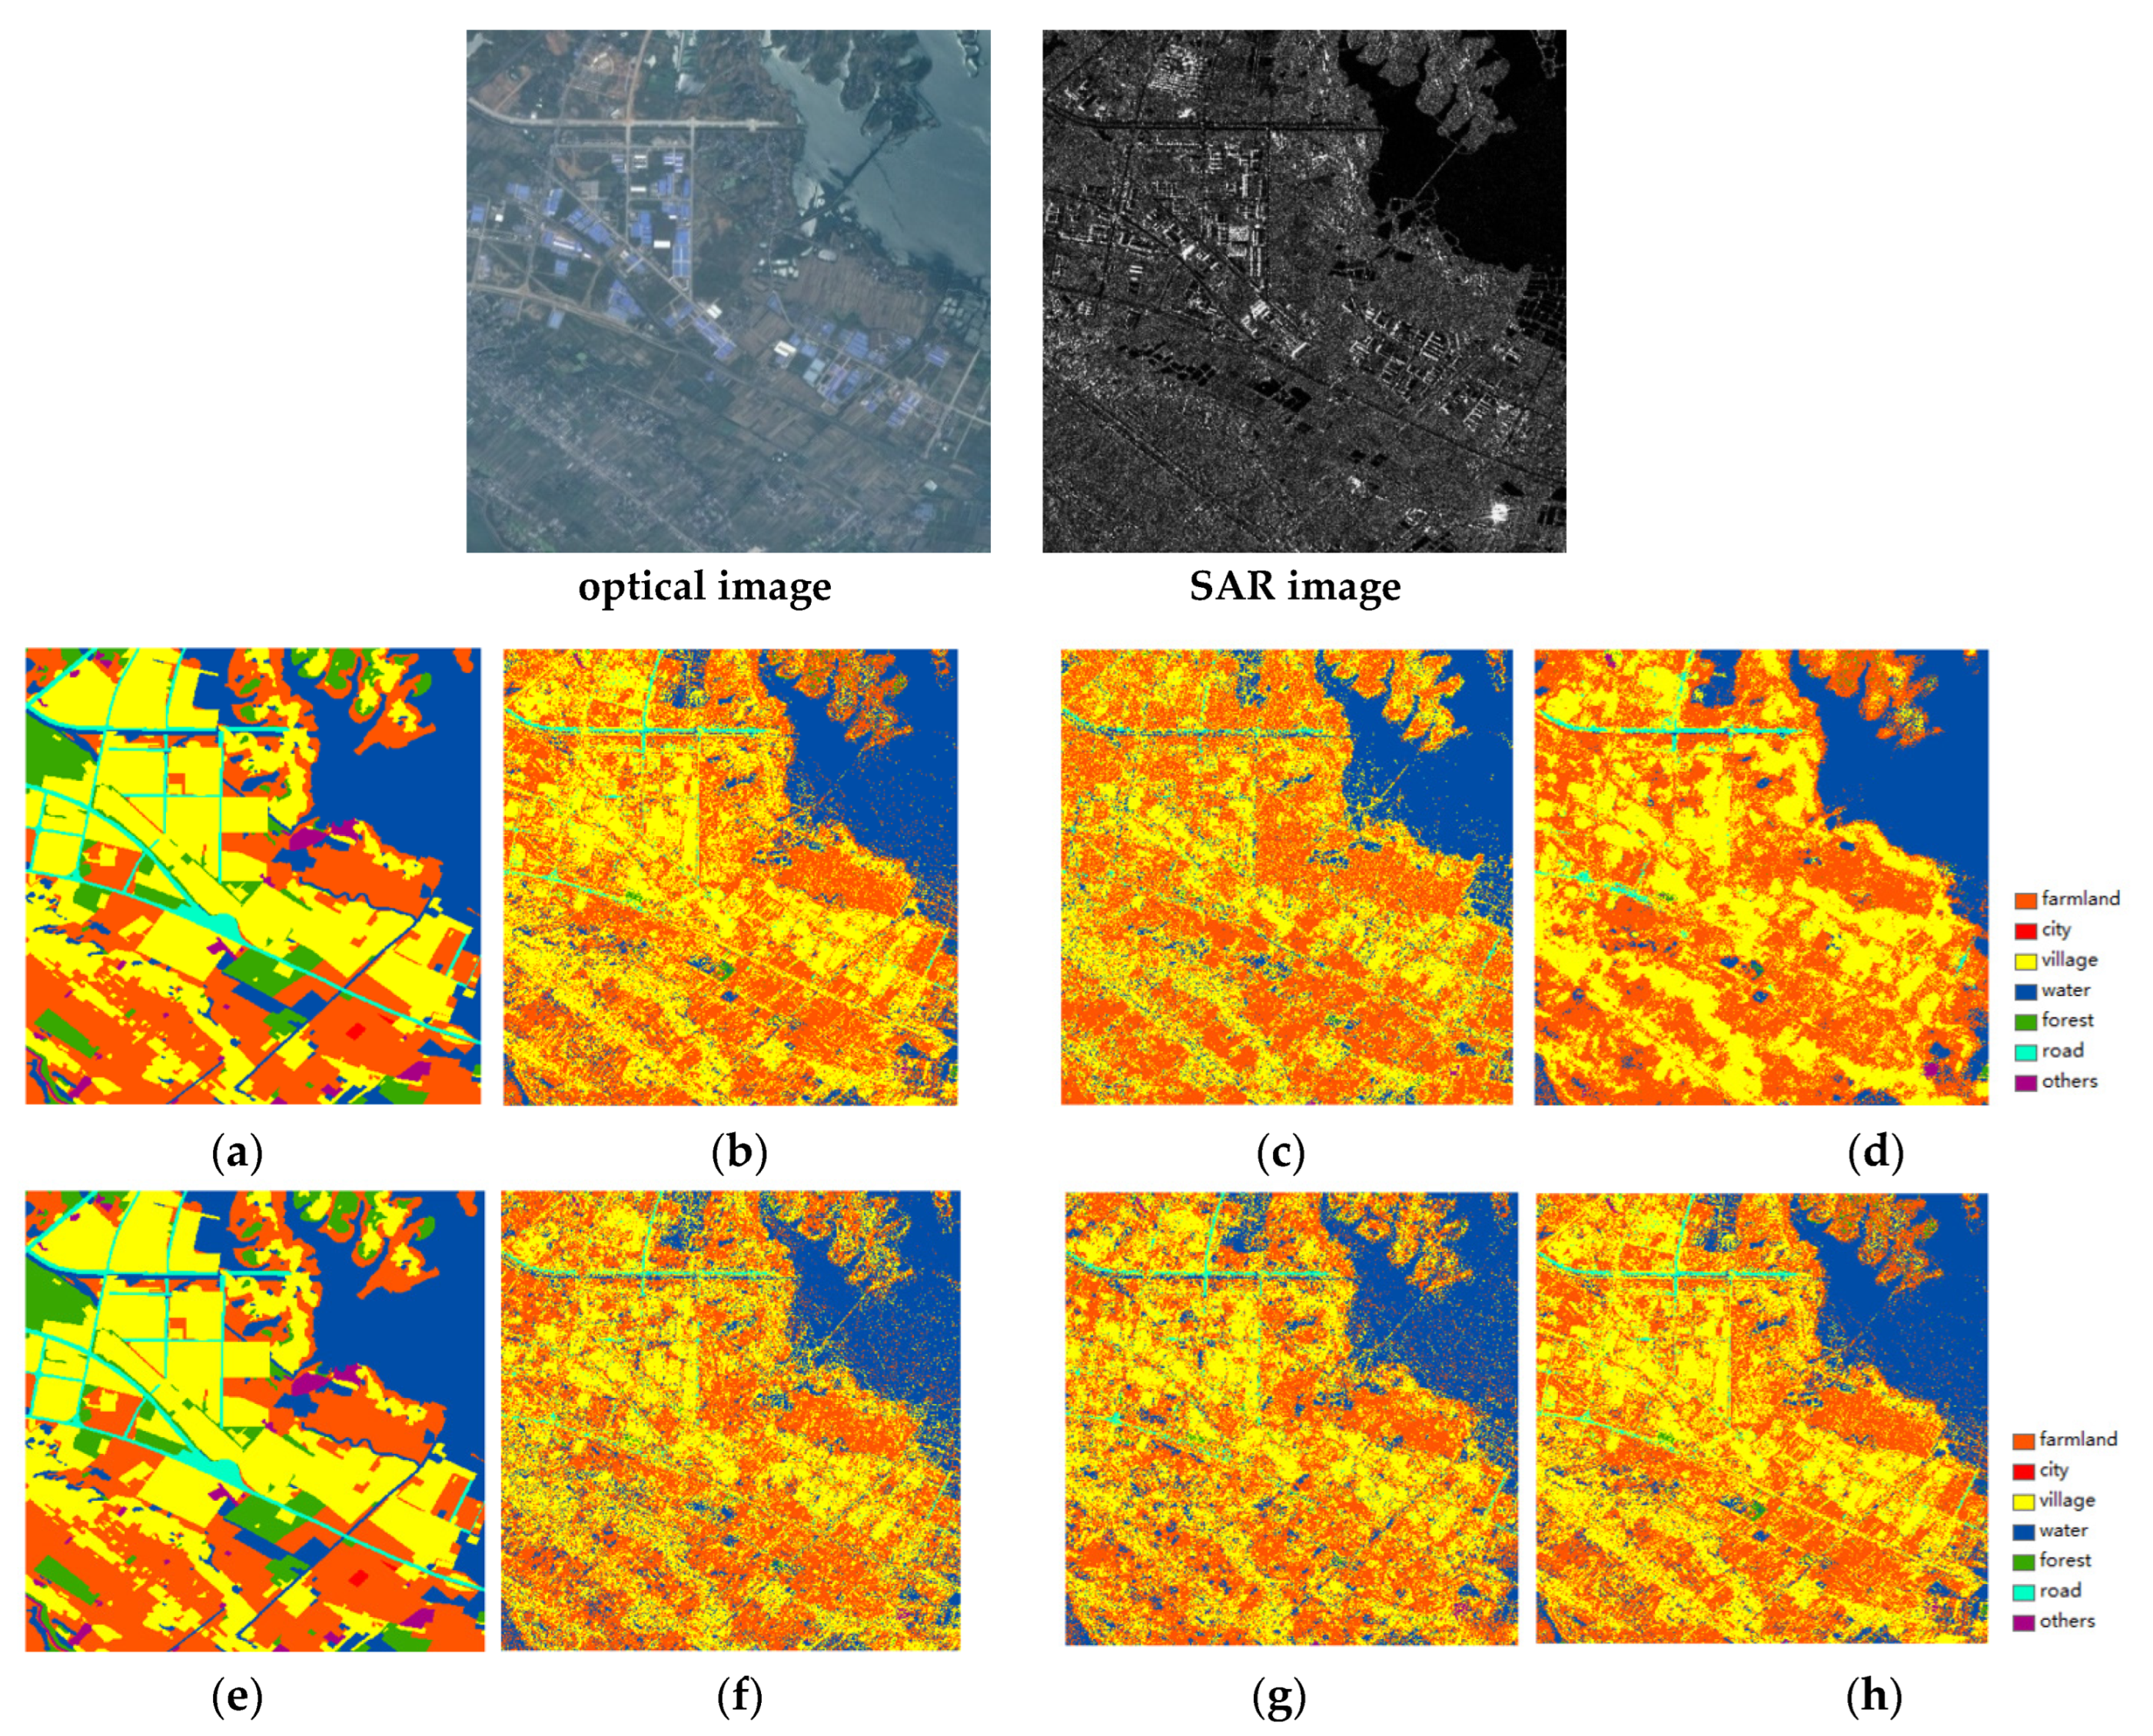
5.3.2. Fusion Evaluation of Medium-Resolution Images According to Classification
6. Conclusions
Author Contributions
Funding
Data Availability Statement
Conflicts of Interest
References
- Kulkarni, S.C.; Rege, P.P. Fusion of RISAT-1 SAR Image and Resourcesat-2 Multispectral Images Using Wavelet Transform. In Proceedings of the 2019 6th International Conference on Signal Processing and Integrated Networks (SPIN), Noida, India, 7–8 March 2019. [Google Scholar]
- Ghassemian, H. A review of remote sensing image fusion methods. Inf. Fusion 2016, 32, 75–89. [Google Scholar] [CrossRef]
- Pohl, C.; Van Genderen, J.L. Review article Multisensor image fusion in remote sensing: Concepts, methods and applications. Int. J. Remote Sens. 1998, 19, 823–854. [Google Scholar] [CrossRef]
- Battsengel, V.; Amarsaikhan, D.; Bat-Erdene, T.; Egshiglen, E.; Munkh-Erdene, A.; Ganzorig, M. Advanced Classification of Lands at TM and Envisat Images of Mongolia. Adv. Remote Sens. 2013, 2, 102–110. [Google Scholar] [CrossRef][Green Version]
- Sanli, F.B.; Abdikan, S.; Esetlili, M.T.; Sunar, F. Evaluation of image fusion methods using PALSAR, RADARSAT-1 and SPOT images for land use/land cover classification. J. Indian Soc. Remote Sens. 2016, 45, 591–601. [Google Scholar] [CrossRef]
- Abdikana, S.; Sanlia, F.B.; Balcikb, F.B.; Gokselb, C. Fusion of Sar Images (Palsar and Radarsat-1) with Multispectral Spot Image: A Comparative Analysis of Resulting Images. In Proceedings of the International Archives of the Photogrammetry, Remote Sensing and Spatial Information Sciences, Beijing, China, 3–11 July 2008. [Google Scholar]
- Klonus, S.; Ehlers, M. Pansharpening with TerraSAR-X and optical data, 3rd TerraSAR-X Science Team Meeting. In Proceedings of the 3rd TerraSAR-X Science Team Meeting, Darmstadt, Germany, 25–26 November 2008; pp. 25–26. [Google Scholar]
- Abdikan, S.; Sanli, F.B. Comparison of different fusion algorithms in urban and agricultural areas using sar (palsar and radarsat) and optical (spot) images. Bol. Ciênc. Geod. 2012, 18, 509–531. [Google Scholar] [CrossRef]
- Sanli, F.B.; Abdikan, S.; Esetlili, M.T.; Ustuner, M.; Sunar, F. Fusion of terrasar-x and rapideye data: A quality analysis. ISPRS—Int. Arch. Photogramm. Remote Sens. Spat. Inf. Sci. 2013, XL-7/W2, 27–30. [Google Scholar] [CrossRef]
- Clerici, N.; Calderón, C.A.V.; Posada, J.M. Fusion of Sentinel-1A and Sentinel-2A Data for Land Cover Mapping: A Case Study in the Lower Magdalena Region, Colombia. J. Maps 2017, 13, 718–726. [Google Scholar] [CrossRef]
- He, W.; Yokoya, N. Multi-Temporal Sentinel-1 and -2 Data Fusion for Optical Image Simulation. ISPRS Int. J. Geo-Inf. 2018, 7, 389. [Google Scholar] [CrossRef]
- Benedetti, P.D.; Ienco, R.; Gaetano, K.; Ose, R.G.; Pensa, S.D. M3Fusion: A Deep Learning Architecture for Multiscale Multimodal Multitemporal Satellite Data Fusion. IEEE J. Sel. Top. Appl. Earth Obs. Remote Sens. 2018, 11, 4939–4949. [Google Scholar] [CrossRef]
- Hughes, L.H.; Merkle, N.; Bürgmann, T.; Auer, S.; Schmitt, M. Deep Learning for SAR-Optical Image Matching. In Proceedings of the IEEE International Geoscience and Remote Sensing, Yokohama, Japan, 28 July–2 August 2019; pp. 4877–4880. [Google Scholar]
- Abdikan, S.; Bilgin, G.; Sanli, F.B.; Uslu, E.; Ustuner, M. Enhancing land use classification with fusing dual-polarized TerraSAR-X and multispectral RapidEye data. J. Appl. Remote Sens. 2015, 9, 096054. [Google Scholar] [CrossRef]
- Gaetano, R.; Cozzolino, D.; D’Amiano, L.; Verdoliva, L.; Poggi, G. Fusion of sar-optical data for land cover monitoring. In Proceedings of the 2017 IEEE International Geoscience and Remote Sensing Symposium (IGARSS), Fort Worth, TX, USA, 23–28 July 2017; pp. 5470–5473. [Google Scholar]
- Gibril, M.B.A.; Bakar, S.A.; Yao, K.; Idrees, M.O.; Pradhan, B. Fusion of RADARSAT-2 and multispectral optical remote sensing data for LULC extraction in a tropical agricultural area. Geocarto Int. 2017, 32, 735–748. [Google Scholar] [CrossRef]
- Hu, J.; Ghamisi, P.; Schmitt, A.; Zhu, X.X. Object based fusion of polarimetric SAR and hyperspectral imaging for land use classification. In Proceedings of the 2016 8th Workshop on Hyperspectral Image and Signal Processing: Evolution in Remote Sensing (WHISPERS), Los Angeles, CA, USA, 21–24 August 2016; pp. 1–5. [Google Scholar]
- Kulkarni, S.C.; Rege, P.P.; Parishwad, O. Hybrid fusion approach for synthetic aperture radar and multispectral imagery for improvement in land use land cover classification. J. Appl. Remote Sens. 2019, 13, 034516. [Google Scholar] [CrossRef]
- Dabbiru, L.; Samiappan, S.; Nobrega, R.A.A.; Aanstoos, J.A.; Younan, N.H.; Moorhead, R.J. Fusion of synthetic aperture radar and hyperspectral imagery to detect impacts of oil spill in Gulf of Mexico. In Proceedings of the 2015 IEEE International Geoscience and Remote Sensing Symposium (IGARSS), Milan, Italy, 26–31 July 2015; pp. 1901–1904. [Google Scholar]
- Gao, J.; Yuan, Q.; Li, J.; Zhang, H.; Su, X. Cloud Removal with Fusion of High Resolution Optical and SAR Images Using Generative Adversarial Networks. Remote Sens. 2020, 12, 191. [Google Scholar] [CrossRef]
- Kang, W.; Xiang, Y.; Wang, F.; You, H. CFNet: A Cross Fusion Network for Joint Land Cover Classification Using Optical and SAR Images. IEEE J. Sel. Top. Appl. Earth Obs. Remote Sens. 2022, 15, 1562–1574. [Google Scholar] [CrossRef]
- Ye, Y.; Liu, W.; Zhou, L.; Peng, T.; Xu, Q. An Unsupervised SAR and Optical Image Fusion Network Based on Structure-Texture Decomposition. IEEE Geosci. Remote Sens. Lett. 2022, 19, 1–5. [Google Scholar] [CrossRef]
- Liu, H.; Ye, Y.; Zhang, J.; Yang, C.; Zhao, Y. Comparative Analysis of Pixel Level Fusion Algorithms in High Resolution SAR and Optical Image Fusion. In Proceedings of the IGARSS 2022—2022 IEEE International Geoscience and Remote Sensing Symposium, Kuala Lumpur, Malaysia, 17–22 July 2022; pp. 2829–2832. [Google Scholar]
- Chen, C.-M.; Hepner, G.; Forster, R. Fusion of hyperspectral and radar data using the IHS transformation to enhance urban surface features. ISPRS J. Photogramm. Remote Sens. 2003, 58, 19–30. [Google Scholar] [CrossRef]
- Yin, N.; Jiang, Q.-G. Feasibility of multispectral and synthetic aperture radar image fusion. In Proceedings of the 6th International Congress on Image and Signal Processing (CISP), Hangzhou, China, 16–18 December 2013; pp. 835–839. [Google Scholar]
- Yang, J.; Ren, G.; Ma, Y.; Fan, Y. Coastal wetland classification based on high resolution SAR and optical image fusion. In Proceedings of the 2016 IEEE International Geoscience and Remote Sensing Symposium (IGARSS), Beijing, China, 10–15 July 2016. [Google Scholar]
- Liu, Y.; Liu, S.; Wang, Z. A general framework for image fusion based on multi-scale transform and sparse representation. Inf. Fusion 2015, 24, 147–164. [Google Scholar] [CrossRef]
- Eltaweel, G.S.; Helmy, A.K. Fusion of Multispectral and Full Polarimetric SAR Images in NSST Domain. Comput. Sci. J. 2014, 8, 497–513. [Google Scholar]
- Pajares, G.; de la Cruz, J.M. A wavelet-based image fusion tutorial. Pattern Recognit. 2004, 37, 1855–1872. [Google Scholar] [CrossRef]
- Yang, B.; Li, S. Multifocus image fusion and restoration with sparse representation. IEEE Trans. Instrum. Meas. 2009, 59, 884–892. [Google Scholar] [CrossRef]
- Zhang, W.; Yu, L. SAR and Landsat ETM+ image fusion using variational model. In Proceedings of the 2010 International Conference on Computer and Communication Technologies in Agriculture Engineering (CCTAE), Chengdu, China, 12–13 June 2010; pp. 205–207. [Google Scholar]
- Li, H.; Manjunath, B.S.; Mitra, S.K. Multisensor Image Fusion Using the Wavelet Transform. Graph. Models Image Process. 1995, 57, 235–245. [Google Scholar] [CrossRef]
- Li, S.; Yang, B.; Hu, J. Performance comparison of different multi-resolution transforms for image fusion. Inf. Fusion 2011, 12, 74–84. [Google Scholar] [CrossRef]
- Aharon, M.; Elad, M.; Bruckstein, A. K-SVD: An Algorithm for Designing Overcomplete Dictionaries for Sparse Representation. IEEE Trans. Signal Process. 2006, 54, 4311–4322. [Google Scholar] [CrossRef]
- Bruckstein, A.M.; Donoho, D.L.; Elad, M. From Sparse Solutions of Systems of Equations to Sparse Modeling of Signals and Images. SIAM Rev. 2009, 51, 34–81. [Google Scholar] [CrossRef]
- Tu, T.-M.; Huang, P.S.; Hung, C.-L.; Chang, C.-P. A Fast Intensity—Hue—Saturation Fusion Technique with Spectral Adjustment for IKONOS Imagery. IEEE Geosci. Remote Sens. Lett. 2004, 1, 309–312. [Google Scholar] [CrossRef]
- Wang, Z.; Ziou, D.; Armenakis, C.; Li, D.; Li, Q. A comparative analysis of image fusion methods. IEEE Trans. Geosci. Remote Sens. 2005, 43, 1391–1402. [Google Scholar] [CrossRef]
- Aiazzi, B.; Baronti, S.; Selva, M. Improving Component Substitution Pansharpening through Multivariate Regression of MS +Pan Data. IEEE Trans. Geosci. Remote Sens. 2007, 45, 3230–3239. [Google Scholar] [CrossRef]
- Burt, P.J.; Adelson, E.H. The Laplacian Pyramid as a Compact Image Code; Fischler, M.A., Firschein, O., Eds.; Readings in Computer Vision; Morgan Kaufmann: San Francisco, CA, USA, 1987; pp. 671–679. [Google Scholar]
- Burt, P.J. A Gradient Pyramid Basis for Pattern-Selective Image Fusion. Proc. SID 1992, 467–470. [Google Scholar]
- Mallat, S.G. A theory for multiresolution signal decomposition: The wavelet representation. IEEE Trans. Pattern Anal. Mach. Intell. 1989, 11, 674–693. [Google Scholar] [CrossRef]
- Selesnick, I.; Baraniuk, R.; Kingsbury, N. The dual-tree complex wavelet transform. IEEE Signal Process. Mag. 2005, 22, 123–151. [Google Scholar] [CrossRef]
- Candès, E.; Demanet, L.; Donoho, D.; Ying, L. Fast Discrete Curvelet Transforms. Multiscale Model. Simul. 2006, 5, 861–899. [Google Scholar] [CrossRef]
- Da Cunha, A.; Zhou, J.; Do, M. The Nonsubsampled Contourlet Transform: Theory, Design, and Applications. IEEE Trans. Image Process. 2006, 15, 3089–3101. [Google Scholar] [CrossRef] [PubMed]
- Ma, J.; Chen, C.; Li, C.; Huang, J. Infrared and visible image fusion via gradient transfer and total variation minimization. Inf. Fusion 2016, 31, 100–109. [Google Scholar] [CrossRef]
- Piella, G.; Heijmans, H. A new quality metric for image fusion. In Proceedings of the 2003 International Conference on Image Processing (Cat. No.03CH37429), Barcelona, Spain, 14–17 September 2003; p. III-173-6. [Google Scholar]
- Yang, C.; Zhang, J.-Q.; Wang, X.-R.; Liu, X. A novel similarity based quality metric for image fusion. Inf. Fusion 2008, 9, 156–160. [Google Scholar] [CrossRef]
- Jagalingam, P.; Hegde, A.V. A Review of Quality Metrics for Fused Image. Aquat. Procedia 2015, 4, 133–142. [Google Scholar] [CrossRef]
- Xydeas, C.; Petrović, V. Objective image fusion performance measure. Electron. Lett. 2000, 36, 308–309. [Google Scholar] [CrossRef]
- Wang, Z.; Bovik, A.C. A universal image quality index. IEEE Signal Process. Lett. 2002, 9, 81–84. [Google Scholar] [CrossRef]
- Chen, Y.; Blum, R.S. A new automated quality assessment algorithm for image fusion. Image Vis. Comput. 2007, 27, 1421–1432. [Google Scholar] [CrossRef]
- Liu, Z.; Blasch, E.; Xue, Z.; Zhao, J.; Laganiere, R.; Wu, W. Objective Assessment of Multiresolution Image Fusion Algorithms for Context Enhancement in Night Vision: A Comparative Study. IEEE Trans. Pattern Anal. Mach. Intell. 2011, 34, 94–109. [Google Scholar] [CrossRef]
- Zhang, X.; Ye, P.; Xiao, G. VIFB: A Visible and Infrared Image Fusion Benchmark. In Proceedings of the 2020 IEEE/CVF Conference on Computer Vision and Pattern Recognition Workshops (CVPRW), Seattle, WA, USA, 14–19 June 2020. [Google Scholar]
- Ye, Y.; Ren, X.; Zhu, B.; Tang, T.; Tan, X.; Gui, Y.; Yao, Q. An adaptive attention fusion mechanism convolutional network for object detection in remote sensing images. Remote Sens. 2022, 14, 516. [Google Scholar] [CrossRef]
- Melgani, F.; Bruzzone, L. Support vector machines for classification of hyperspectral remote-sensing images. In Proceedings of the IEEE International Geoscience and Remote Sensing Symposium, Toronto, ON, Canada, 4–28 June 2002; Volume 1, pp. 506–508. [Google Scholar]
- Feng, T.; Ma, H.; Cheng, X. Greenhouse Extraction from High-Resolution Remote Sensing Imagery with Improved Random Forest. In Proceedings of the IGARSS 2020—2020 IEEE International Geoscience and Remote Sensing Symposium, Waikoloa, HI, USA, 26 September–2 October 2020; pp. 553–556. [Google Scholar]
- Krizhevsky, A.; Sutskever, I.; Hinton, G.E. Imagenet Classification with Deep Convolutional Neural Networks. In Proceedings of the Conference on Neural Information Processing Systems, Lake Tahoe, NV, USA, 3–6 December 2012; pp. 1097–1105. [Google Scholar]
- Ye, Y.; Zhu, B.; Tang, T.; Yang, C.; Xu, Q.; Zhang, G. A robust multimodal remote sensing image registration method and system using steerable filters with first-and second-order gradients. ISPRS J. Photogramm. Remote Sens. 2022, 188, 331–350. [Google Scholar] [CrossRef]
- Ye, Y.; Tang, T.; Zhu, B.; Yang, C.; Li, B.; Hao, S. A multiscale framework with unsupervised learning for remote sensing image registration. IEEE Trans. Geosci. Remote Sens. 2022, 60, 1–15. [Google Scholar] [CrossRef]
- Ye, Y.; Bruzzone, L.; Shan, J.; Bovolo, F.; Zhu, Q. Fast and Robust Matching for Multimodal Remote Sensing Image Registration. IEEE Trans. Geosci. Remote Sens. 2019, 57, 9059–9070. [Google Scholar] [CrossRef]
- Li, X.; Zhang, G.; Cui, H.; Hou, S.; Wang, S.; Li, X.; Chen, Y.; Li, Z.; Zhang, L. MCANet: A joint semantic segmentation framework of optical and SAR images for land use classification. Int. J. Appl. Earth Obs. Geoinf. 2022, 106, 102638. [Google Scholar] [CrossRef]
- Ma, J.; Yu, W.; Liang, P.; Li, C.; Jiang, J. FusionGAN: A generative adversarial network for infrared and visible image fusion. Inf. Fusion 2018, 48, 11–26. [Google Scholar] [CrossRef]
- Tang, W.; He, F.; Liu, Y. TCCFusion: An infrared and visible image fusion method based on transformer and cross correlation. Pattern Recognit. 2023, 137, 109295. [Google Scholar] [CrossRef]


| Method | Rule |
|---|---|
| XX_1 | max-absolute |
| XX_2 | “max-absolute” rule with a local window-based consistency verification scheme |
| Category | Method | Filters | Levels |
|---|---|---|---|
| Pyramid-based | LP | / | 4 |
| RP | / | 4 | |
| Wavelet-based | DWT | Daubechies (db1) | 4 |
| DTCWT | First: LeGall 5-3 Other: Q-shift_06 | 4 | |
| MGA | CVT | / | 4 |
| NSCT | Pyramid: pyrexc Orientation: 7–9 | {4, 8, 8, 16} |
| Category | Definition | Range | Characteristic |
|---|---|---|---|
| Information-theory-based | is the normalized histogram of an image | Reflects the amount of information contained in the image | |
| Reflects the distortion | |||
| Image- feature-based | Reflects the distribution and contrast of the image | ||
; w is the weighting factor | Evaluates the edge information preserved in the fused image | ||
| Structural-similarity-based | is the weighting factor | Reflects the structural similarity between two images | |
| , | Reflects the loss of correlation, luminance distortion, and contrast distortion of the fused image | ||
is normalized salience, is saliency weight, and is Wang–Bovik image quality index | Indicates the amount of salient information transferred into the fused image | ||
is the adjustable parameter | Evaluates the edge information preserved in the fused image | ||
| Human-perception-inspired | is the saliency map, is the information preservation value | Assesses the image quality of the fused image |
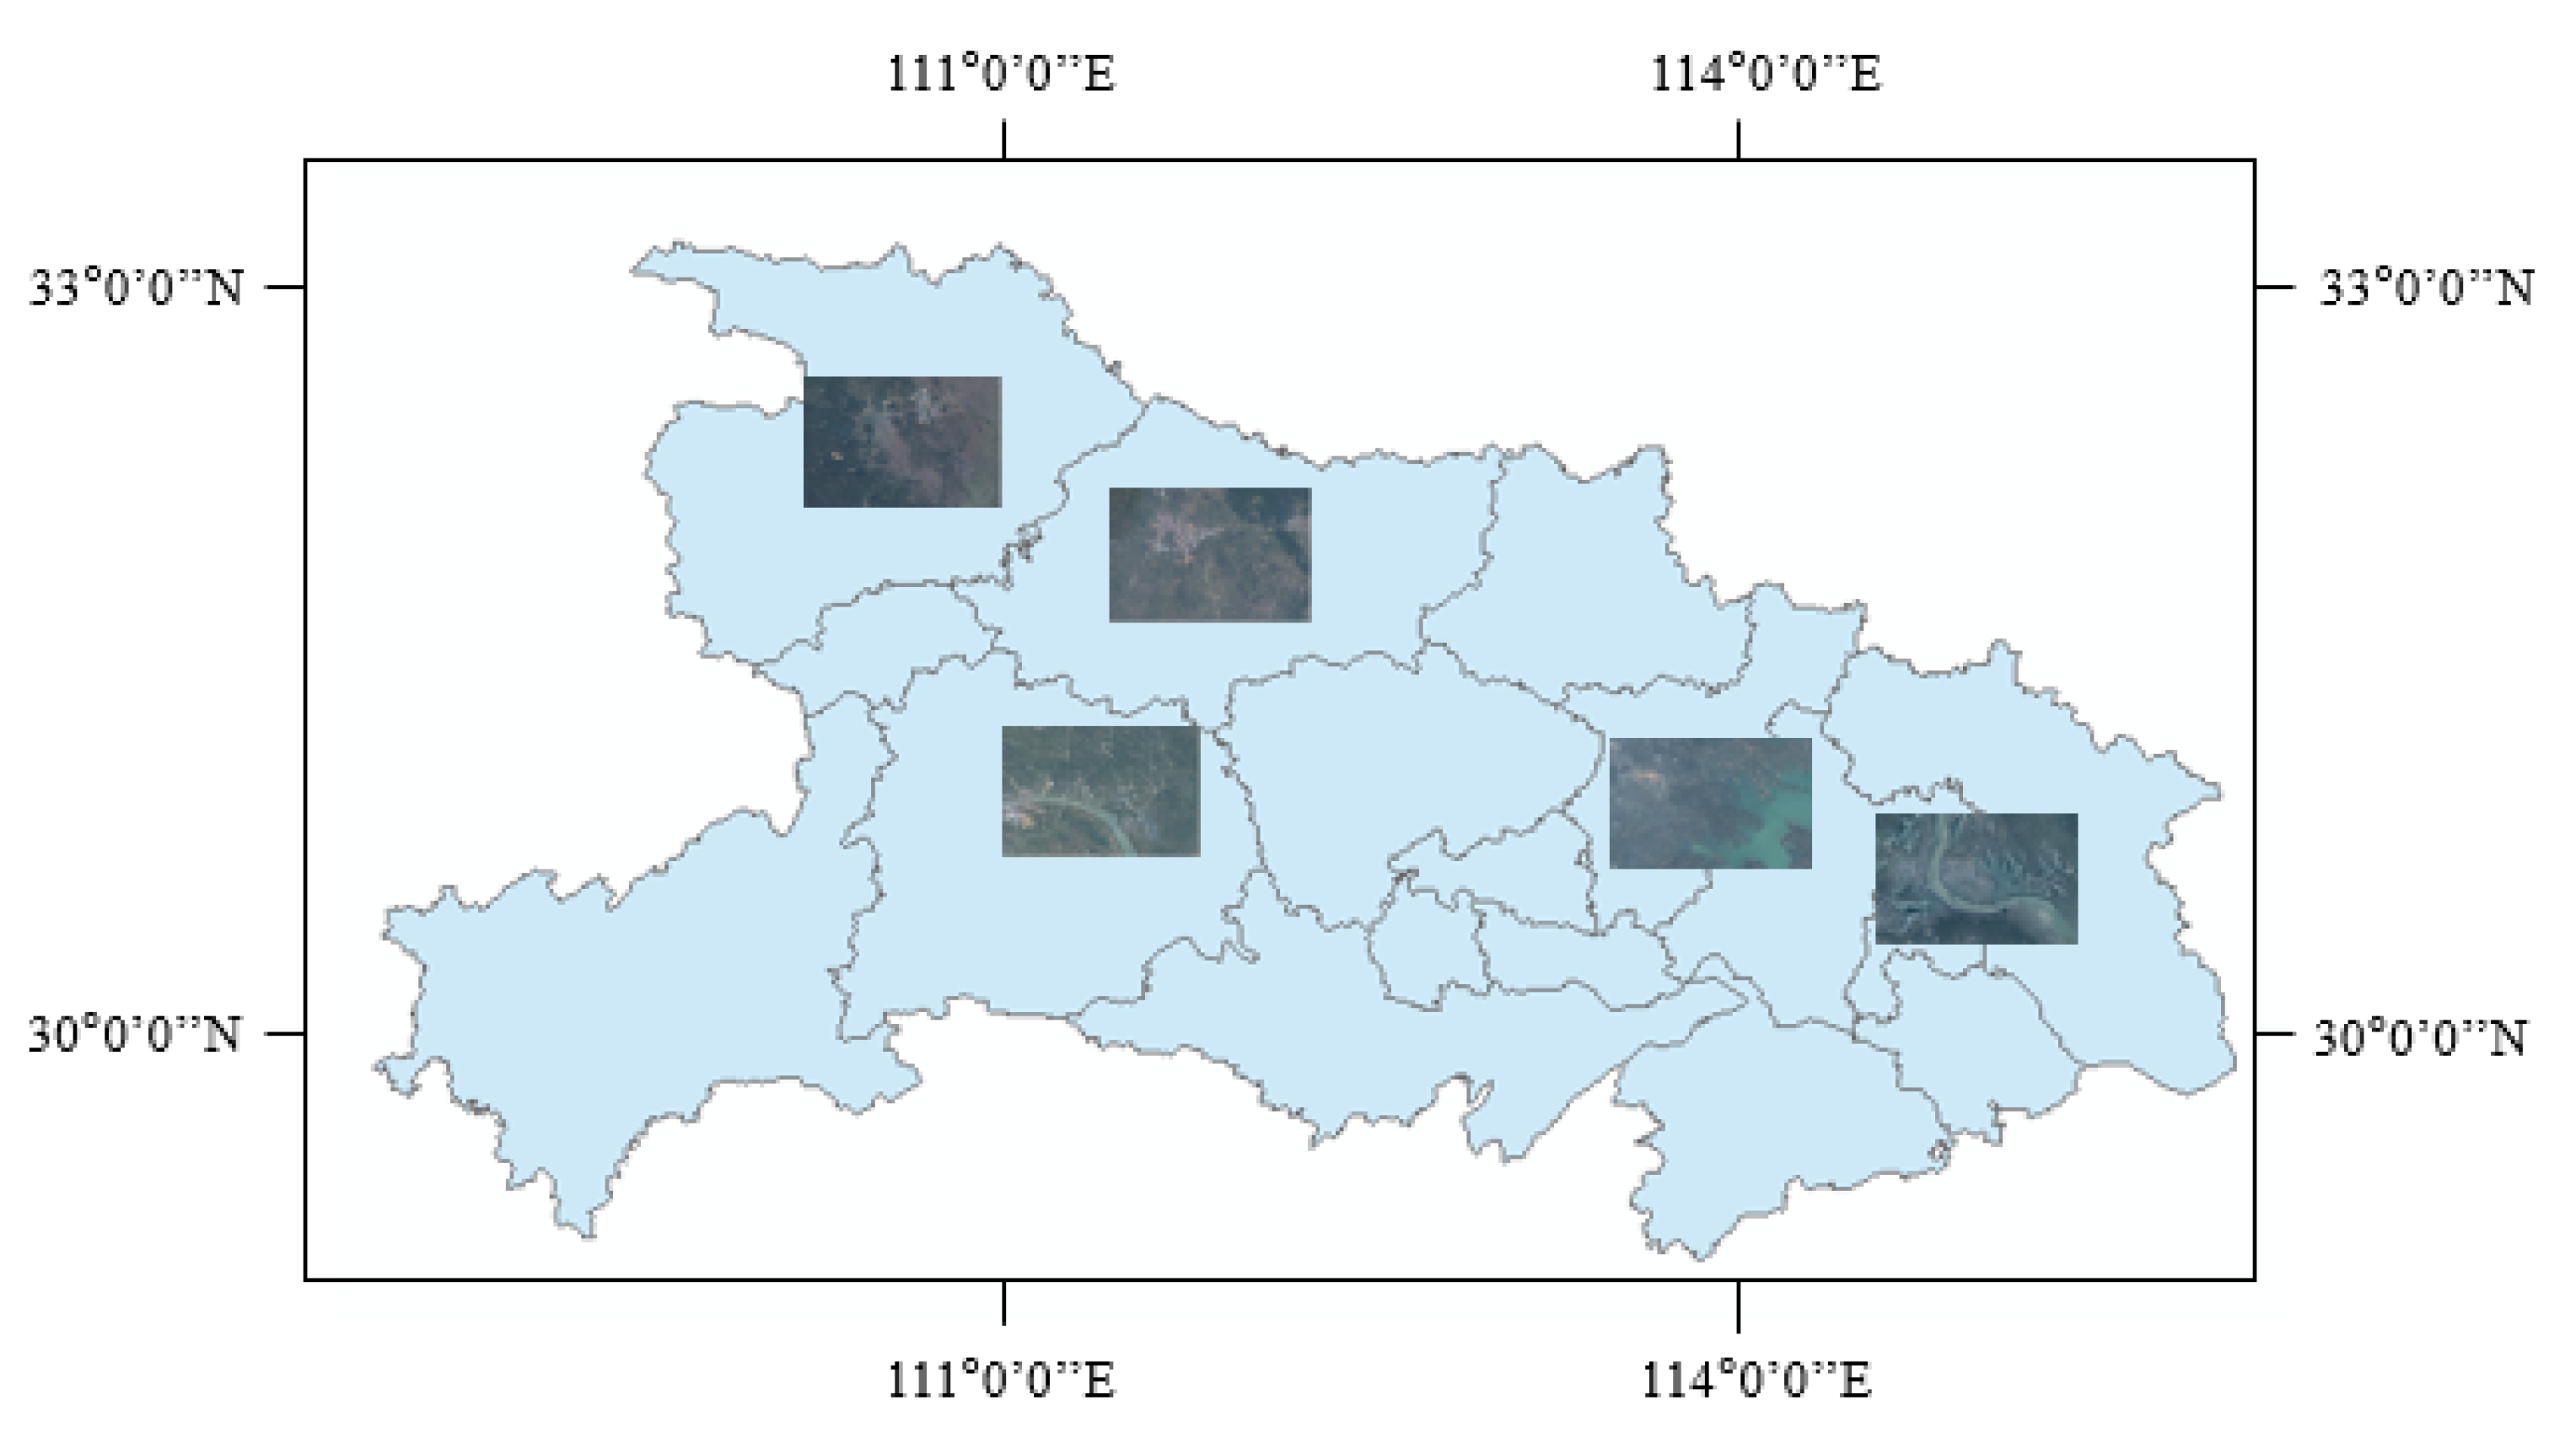
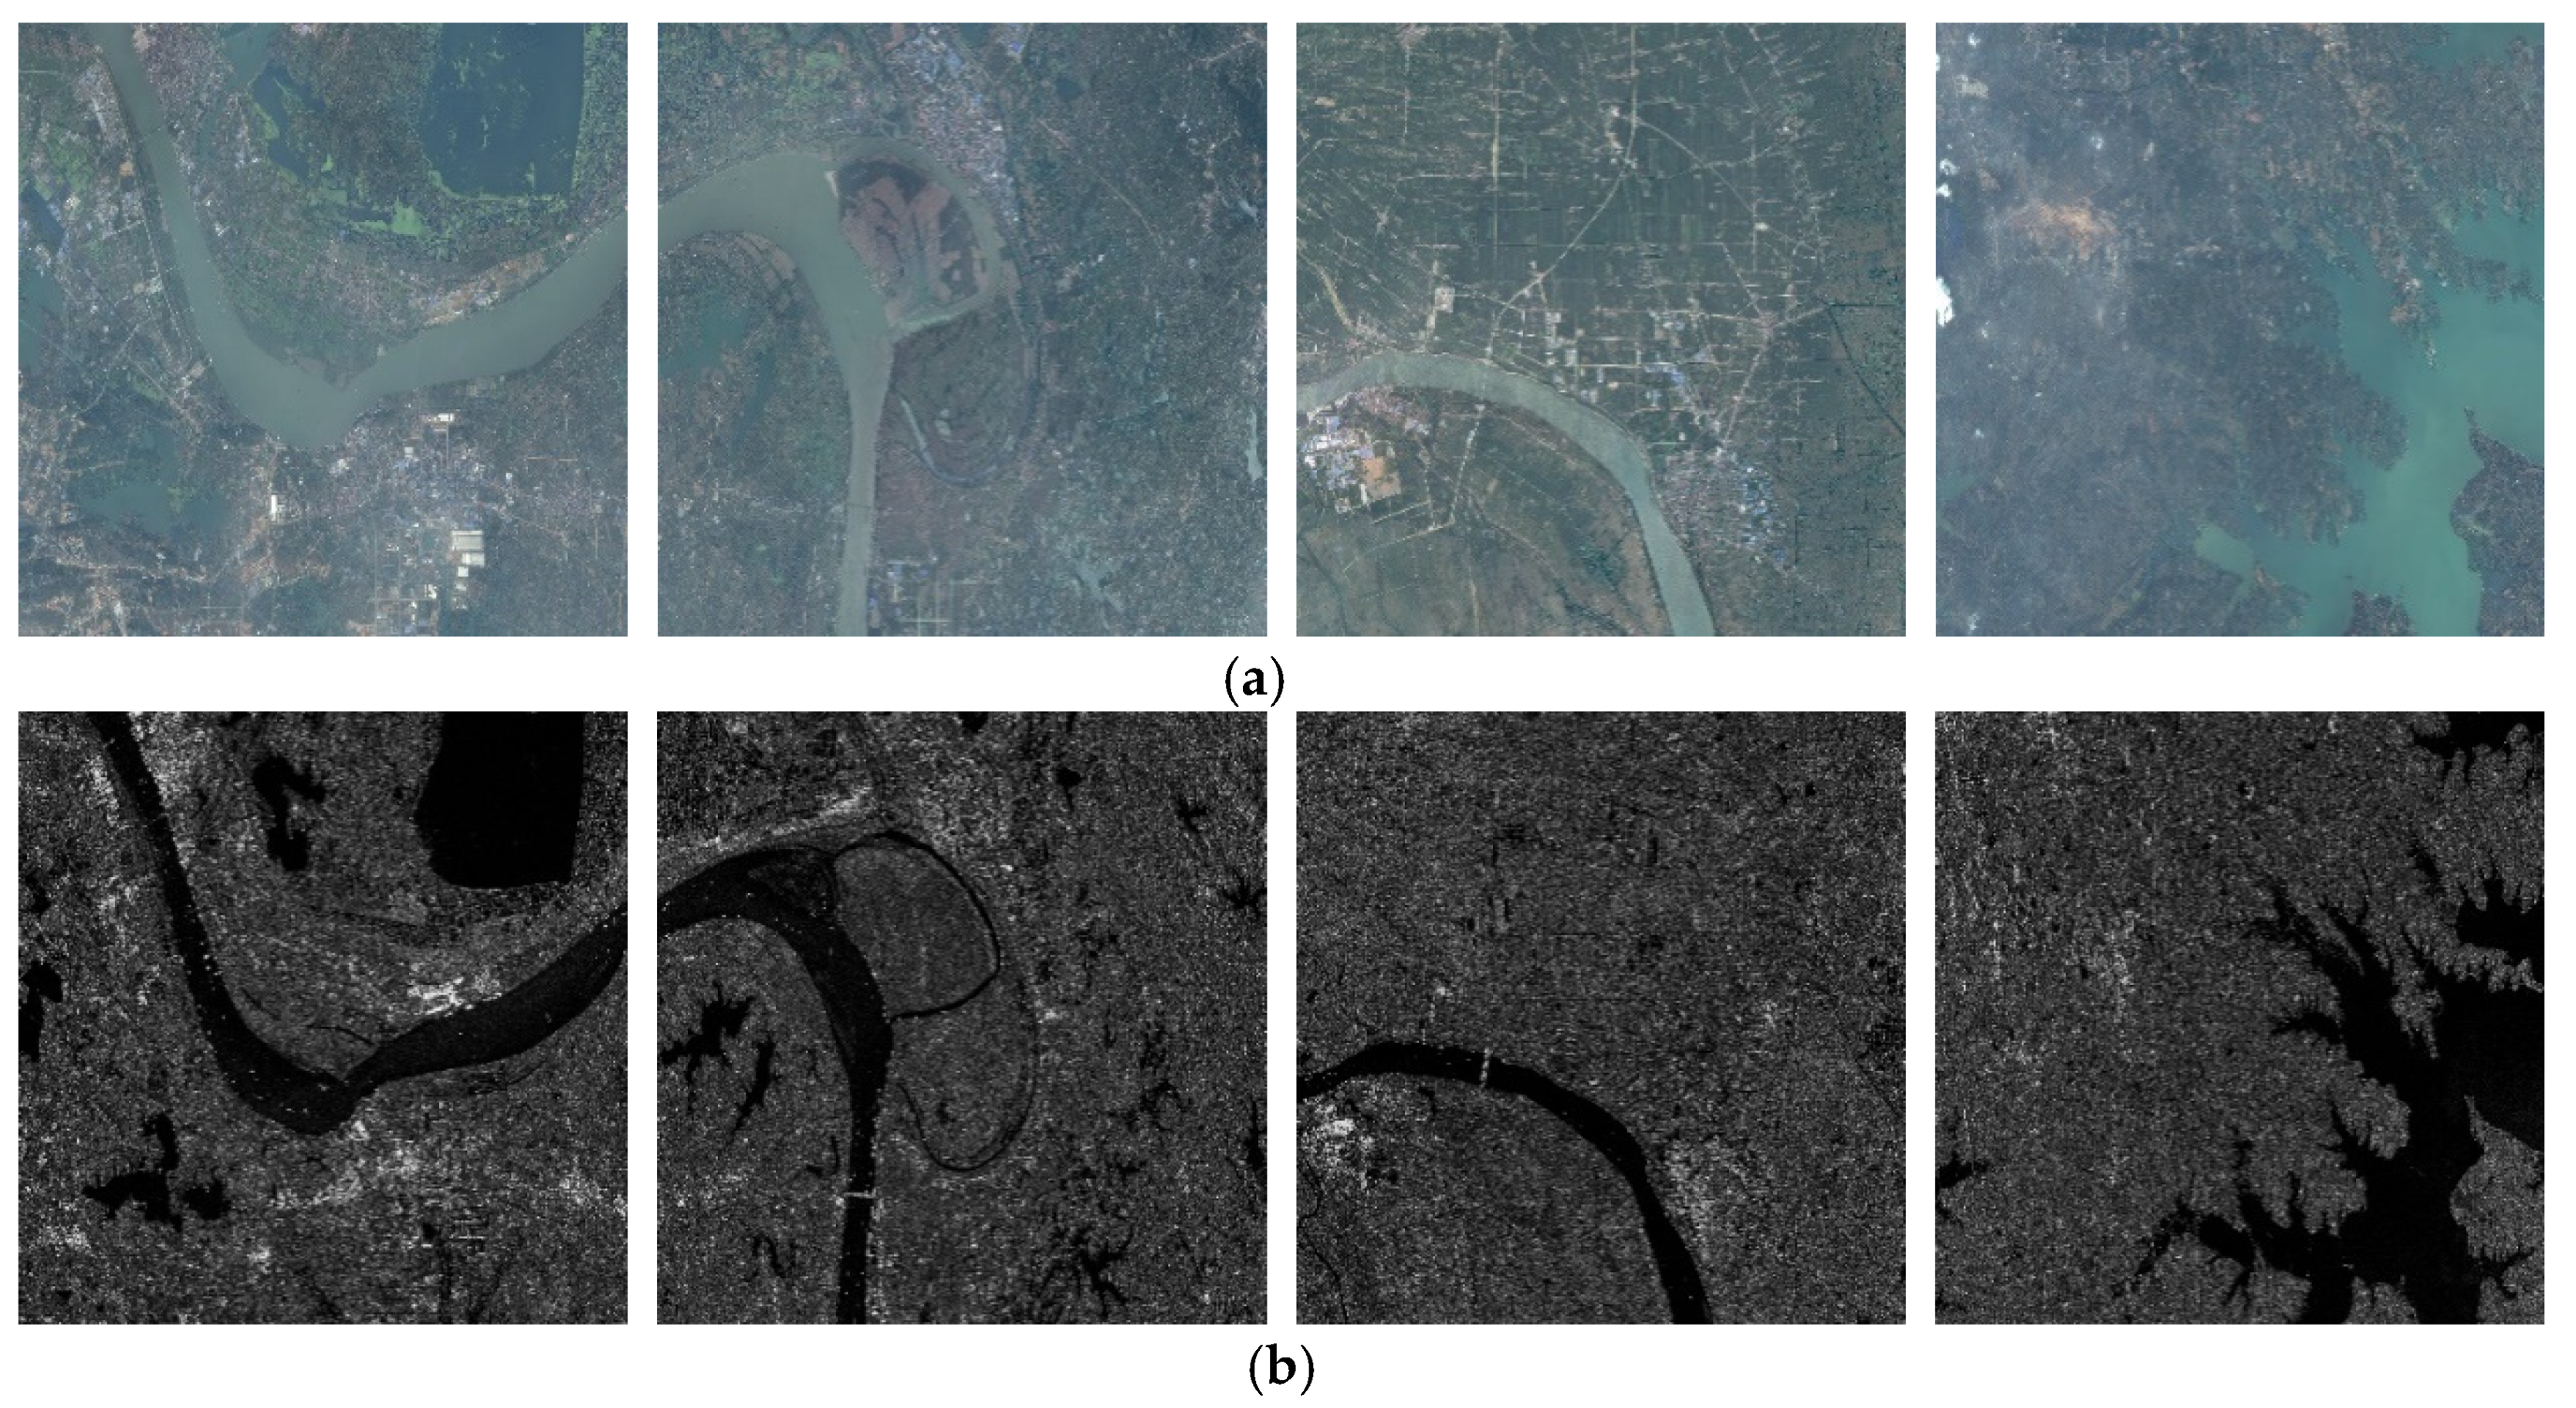
| YYX-OPT-SAR | WHU-OPT-SAR | |
|---|---|---|
| Number of images (pairs) | 150 | 100 |
| Image pixel size | 512 × 512 | 5556 × 3704 |
| Ground resolution (m) | 0.5 | 5 |
| The surrounding areas | Weinan City, Shaanxi Province in China | Wuhan City, Hubei Province in China |
| EN | SD | PSNR | |||||||
|---|---|---|---|---|---|---|---|---|---|
| Urban | GTF | GTF | GP | LP | NSCT | NSCT | NSCT | NSCT | NSCT |
| Suburban | GTF | GTF | GP | LP | NSCT | NSCT | NSCT | LP | PCA |
| Mountain | GTF | GTF | GP | LP | NSCT | NSCT | NSCT | NSCT | NSCT |
| EN | SD | PSNR | |||||||
|---|---|---|---|---|---|---|---|---|---|
| Urban | GTF | LP | NSCT | LP | NSCT | NSCT | NSCT | NSCT | NSCT |
| Suburban | DWT | LP | NSCT | LP | NSCT | NSCT | NSCT | NSCT | GS |
| Mountain | LP | LP | IHS | LP | NSCT | IHS | NSCT | NSCT | NSCT |
| SVM | Bare Ground | Low Vegetation | Trees | Houses | Roads | OA |
|---|---|---|---|---|---|---|
| RGB | 49.75% | 60.92% | 60.37% | 62.36% | 62.91% | 59.69% |
| SAR | 34.08% | 27.88% | 45.68% | 22.14% | 42.44% | 39.29% |
| CVT | 39.45% | 53.32% | 50.03% | 73.97% | 63.96% | 59.85% |
| DTCWT | 37.39% | 56.28% | 46.60% | 62.99% | 61.40% | 56.68% |
| DWT | 33.71% | 57.02% | 48.33% | 48.98% | 58.98% | 52.37% |
| GP | 40.08% | 59.70% | 57.16% | 73.61% | 65.13% | 61.98% |
| GS | 50.26% | 58.50% | 59.19% | 68.31% | 70.23% | 64.08% |
| GTF | 50.96% | 60.45% | 58.01% | 70.96% | 72.25% | 65.59% |
| IHS | 49.48% | 62.39% | 61.15% | 67.61% | 65.35% | 63.11% |
| LP | 37.68% | 57.15% | 50.77% | 58.96% | 66.57% | 57.46% |
| NSCT | 44.38% | 55.32% | 52.13% | 68.98% | 65.79% | 60.28% |
| PCA | 49.74% | 61.59% | 60.25% | 68.82% | 67.78% | 63.96% |
| SR | 36.08% | 29.89% | 45.41% | 60.20% | 46.13% | 42.24% |
| RF | Bare Ground | Low Vegetation | Trees | Houses | Roads | OA |
|---|---|---|---|---|---|---|
| RGB | 46.78% | 57.77% | 60.74% | 70.10% | 61.67% | 57.79% |
| SAR | 32.41% | 27.85% | 44.89% | 22.47% | 42.44% | 39.20% |
| CVT | 32.58% | 48.85% | 47.21% | 77.40% | 62.76% | 56.75% |
| DTCWT | 31.59% | 51.37% | 43.11% | 70.37% | 60.72% | 54.04% |
| DWT | 31.37% | 51.00% | 45.63% | 59.17% | 59.72% | 52.11% |
| GP | 33.88% | 55.27% | 53.09% | 74.74% | 64.45% | 58.57% |
| GS | 45.11% | 56.05% | 59.23% | 80.65% | 69.97% | 64.13% |
| GTF | 45.87% | 55.00% | 55.78% | 78.43% | 72.27% | 64.45% |
| IHS | 47.33% | 57.97% | 60.77% | 81.14% | 64.74% | 63.69% |
| LP | 34.29% | 52.22% | 47.32% | 70.71% | 66.73% | 56.68% |
| NSCT | 37.20% | 50.37% | 49.08% | 73.99% | 64.31% | 57.96% |
| PCA | 45.95% | 58.59% | 60.22% | 81.26% | 68.12% | 64.41% |
| SR | 34.49% | 29.48% | 44.42% | 58.35% | 48.54% | 42.77% |
| CNN | Bare Ground | Low Vegetation | Trees | Houses | Roads | OA |
|---|---|---|---|---|---|---|
| RGB | 56.39% | 71.32% | 72.54% | 81.01% | 73.61% | 70.07% |
| SAR | 35.37% | 62.39% | 70.44% | 57.78% | 55.14% | 57.86% |
| CVT | 50.42% | 66.82% | 67.55% | 82.74% | 75.67% | 71.41% |
| DTCWT | 47.07% | 67.81% | 66.73% | 78.46% | 74.64% | 69.79% |
| DWT | 44.96% | 65.50% | 62.32% | 73.21% | 73.00% | 66.76% |
| GP | 51.06% | 70.78% | 68.67% | 81.67% | 76.21% | 71.94% |
| GS | 53.85% | 72.02% | 79.72% | 86.69% | 78.24% | 75.74% |
| GTF | 58.43% | 72.05% | 74.97% | 83.75% | 77.87% | 75.83% |
| IHS | 52.88% | 74.11% | 80.35% | 85.32% | 72.60% | 73.89% |
| LP | 48.83% | 65.07% | 65.67% | 74.62% | 76.44% | 68.87% |
| NSCT | 53.05% | 65.89% | 65.33% | 82.72% | 77.40% | 71.18% |
| PCA | 53.76% | 74.74% | 80.20% | 85.68% | 75.40% | 75.12% |
| SR | 36.17% | 62.11% | 70.18% | 71.32% | 56.79% | 61.01% |
| SVM | Farmland | City | Village | Water | Forest | Road | Others | OA |
|---|---|---|---|---|---|---|---|---|
| RGB | 39.97% | 66.02% | 44.46% | 58.82% | 61.56% | 42.61% | 43.75% | 51.97% |
| SAR | 21.37% | 46.66% | 20.39% | 46.92% | 27.26% | 24.61% | 28.45% | 33.65% |
| CVT | 34.48% | 54.90% | 26.92% | 48.13% | 45.93% | 24.74% | 28.60% | 43.89% |
| DTCWT | 37.15% | 59.48% | 23.55% | 47.51% | 41.30% | 25.24% | 25.58% | 43.54% |
| DWT | 37.41% | 50.44% | 25.49% | 44.33% | 42.41% | 26.15% | 26.27% | 44.12% |
| GP | 27.03% | 54.97% | 28.11% | 45.74% | 33.75% | 20.73% | 28.53% | 45.19% |
| GS | 39.98% | 61.50% | 44.53% | 66.78% | 51.12% | 36.39% | 40.98% | 53.40% |
| GTF | 35.90% | 79.87% | 40.55% | 79.14% | 62.20% | 45.96% | 60.42% | 56.95% |
| IHS | 30.10% | 61.86% | 34.67% | 68.20% | 47.75% | 39.19% | 36.38% | 52.77% |
| LP | 29.48% | 45.80% | 26.94% | 53.76% | 48.20% | 30.86% | 30.62% | 48.53% |
| NSCT | 31.18% | 54.98% | 27.11% | 61.42% | 45.80% | 33.19% | 34.65% | 52.01% |
| PCA | 30.13% | 69.53% | 31.01% | 66.86% | 49.01% | 38.20% | 36.23% | 52.81% |
| SR | 27.29% | 34.26% | 25.64% | 47.45% | 27.95% | 29.12% | 29.19% | 32.61% |
| RF | Farmland | City | Village | Water | Forest | Road | Others | OA |
|---|---|---|---|---|---|---|---|---|
| RGB | 37.41% | 66.55% | 37.54% | 61.87% | 58.16% | 40.54% | 38.30% | 48.50% |
| SAR | 20.92% | 44.62% | 20.14% | 46.59% | 27.35% | 24.69% | 28.44% | 33.63% |
| CVT | 31.10% | 55.19% | 24.59% | 41.19% | 41.96% | 22.30% | 23.44% | 40.16% |
| DTCWT | 32.37% | 52.41% | 22.82% | 42.09% | 37.09% | 22.68% | 22.49% | 40.71% |
| DWT | 36.78% | 54.63% | 25.54% | 41.15% | 40.63% | 24.93% | 24.08% | 42.96% |
| GP | 26.51% | 55.10% | 26.83% | 45.92% | 41.06% | 31.84% | 27.61% | 43.62% |
| GS | 37.61% | 60.41% | 39.71% | 56.83% | 56.69% | 33.09% | 33.79% | 49.51% |
| GTF | 34.18% | 80.71% | 38.39% | 72.33% | 58.85% | 44.69% | 56.69% | 54.82% |
| IHS | 28.54% | 61.01% | 30.42% | 58.33% | 43.75% | 35.98% | 31.34% | 49.46% |
| LP | 27.45% | 48.89% | 25.83% | 49.26% | 44.14% | 28.16% | 27.92% | 46.36% |
| NSCT | 29.15% | 52.90% | 27.16% | 54.44% | 40.18% | 33.56% | 29.81% | 48.80% |
| PCA | 29.80% | 69.39% | 37.81% | 66.62% | 49.57% | 35.18% | 28.63% | 49.37% |
| SR | 25.93% | 44.14% | 26.21% | 49.20% | 27.69% | 27.81% | 28.96% | 34.47% |
| CNN | Farmland | City | Village | Water | Forest | Road | Others | OA |
|---|---|---|---|---|---|---|---|---|
| RGB | 52.83% | 81.49% | 61.08% | 72.85% | 70.89% | 70.25% | 67.85% | 65.23% |
| SAR | 30.49% | 53.45% | 35.20% | 62.07% | 31.84% | 41.26% | 29.70% | 39.00% |
| CVT | 44.48% | 75.19% | 56.32% | 69.73% | 64.91% | 51.44% | 57.65% | 53.91% |
| DTCWT | 48.35% | 79.58% | 54.52% | 67.41% | 61.56% | 56.86% | 55.43% | 53.76% |
| DWT | 47.81% | 71.64% | 56.71% | 65.38% | 63.62% | 56.61% | 57.37% | 54.26% |
| GP | 49.33% | 74.68% | 58.56% | 66.84% | 63.85% | 61.64% | 59.56% | 55.39% |
| GS | 51.38% | 80.91% | 66.70% | 83.02% | 66.07% | 69.20% | 66.87% | 68.11% |
| GTF | 53.14% | 85.05% | 65.94% | 78.39% | 73.33% | 72.45% | 67.97% | 69.49% |
| IHS | 40.62% | 71.46% | 54.82% | 68.12% | 67.78% | 59.29% | 56.43% | 66.56% |
| LP | 49.91% | 76.82% | 57.64% | 63.98% | 69.25% | 60.55% | 50.76% | 60.73% |
| NSCT | 42.73% | 75.78% | 58.17% | 72.56% | 67.18% | 63.73% | 55.69% | 66.98% |
| PCA | 50.28% | 86.13% | 64.26% | 80.53% | 68.96% | 70.11% | 66.43% | 68.19% |
| SR | 31.25% | 61.46% | 40.71% | 66.54% | 34.59% | 45.33% | 31.29% | 42.91% |
Disclaimer/Publisher’s Note: The statements, opinions and data contained in all publications are solely those of the individual author(s) and contributor(s) and not of MDPI and/or the editor(s). MDPI and/or the editor(s) disclaim responsibility for any injury to people or property resulting from any ideas, methods, instructions or products referred to in the content. |
© 2023 by the authors. Licensee MDPI, Basel, Switzerland. This article is an open access article distributed under the terms and conditions of the Creative Commons Attribution (CC BY) license (https://creativecommons.org/licenses/by/4.0/).
Share and Cite
Li, J.; Zhang, J.; Yang, C.; Liu, H.; Zhao, Y.; Ye, Y. Comparative Analysis of Pixel-Level Fusion Algorithms and a New High-Resolution Dataset for SAR and Optical Image Fusion. Remote Sens. 2023, 15, 5514. https://doi.org/10.3390/rs15235514
Li J, Zhang J, Yang C, Liu H, Zhao Y, Ye Y. Comparative Analysis of Pixel-Level Fusion Algorithms and a New High-Resolution Dataset for SAR and Optical Image Fusion. Remote Sensing. 2023; 15(23):5514. https://doi.org/10.3390/rs15235514
Chicago/Turabian StyleLi, Jinjin, Jiacheng Zhang, Chao Yang, Huiyu Liu, Yangang Zhao, and Yuanxin Ye. 2023. "Comparative Analysis of Pixel-Level Fusion Algorithms and a New High-Resolution Dataset for SAR and Optical Image Fusion" Remote Sensing 15, no. 23: 5514. https://doi.org/10.3390/rs15235514
APA StyleLi, J., Zhang, J., Yang, C., Liu, H., Zhao, Y., & Ye, Y. (2023). Comparative Analysis of Pixel-Level Fusion Algorithms and a New High-Resolution Dataset for SAR and Optical Image Fusion. Remote Sensing, 15(23), 5514. https://doi.org/10.3390/rs15235514