
Forest Loss Related to Brazil Nut Production in Non-Timber Forest Product Concessions in a Micro-Watershed in the Peruvian Amazon

 ,
, 
 ,
, 
Abstract
:
1. Introduction
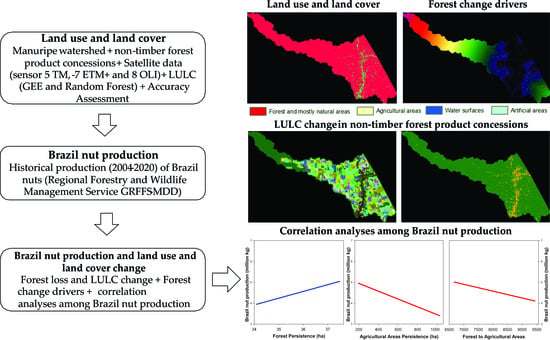
2. Materials and Methods
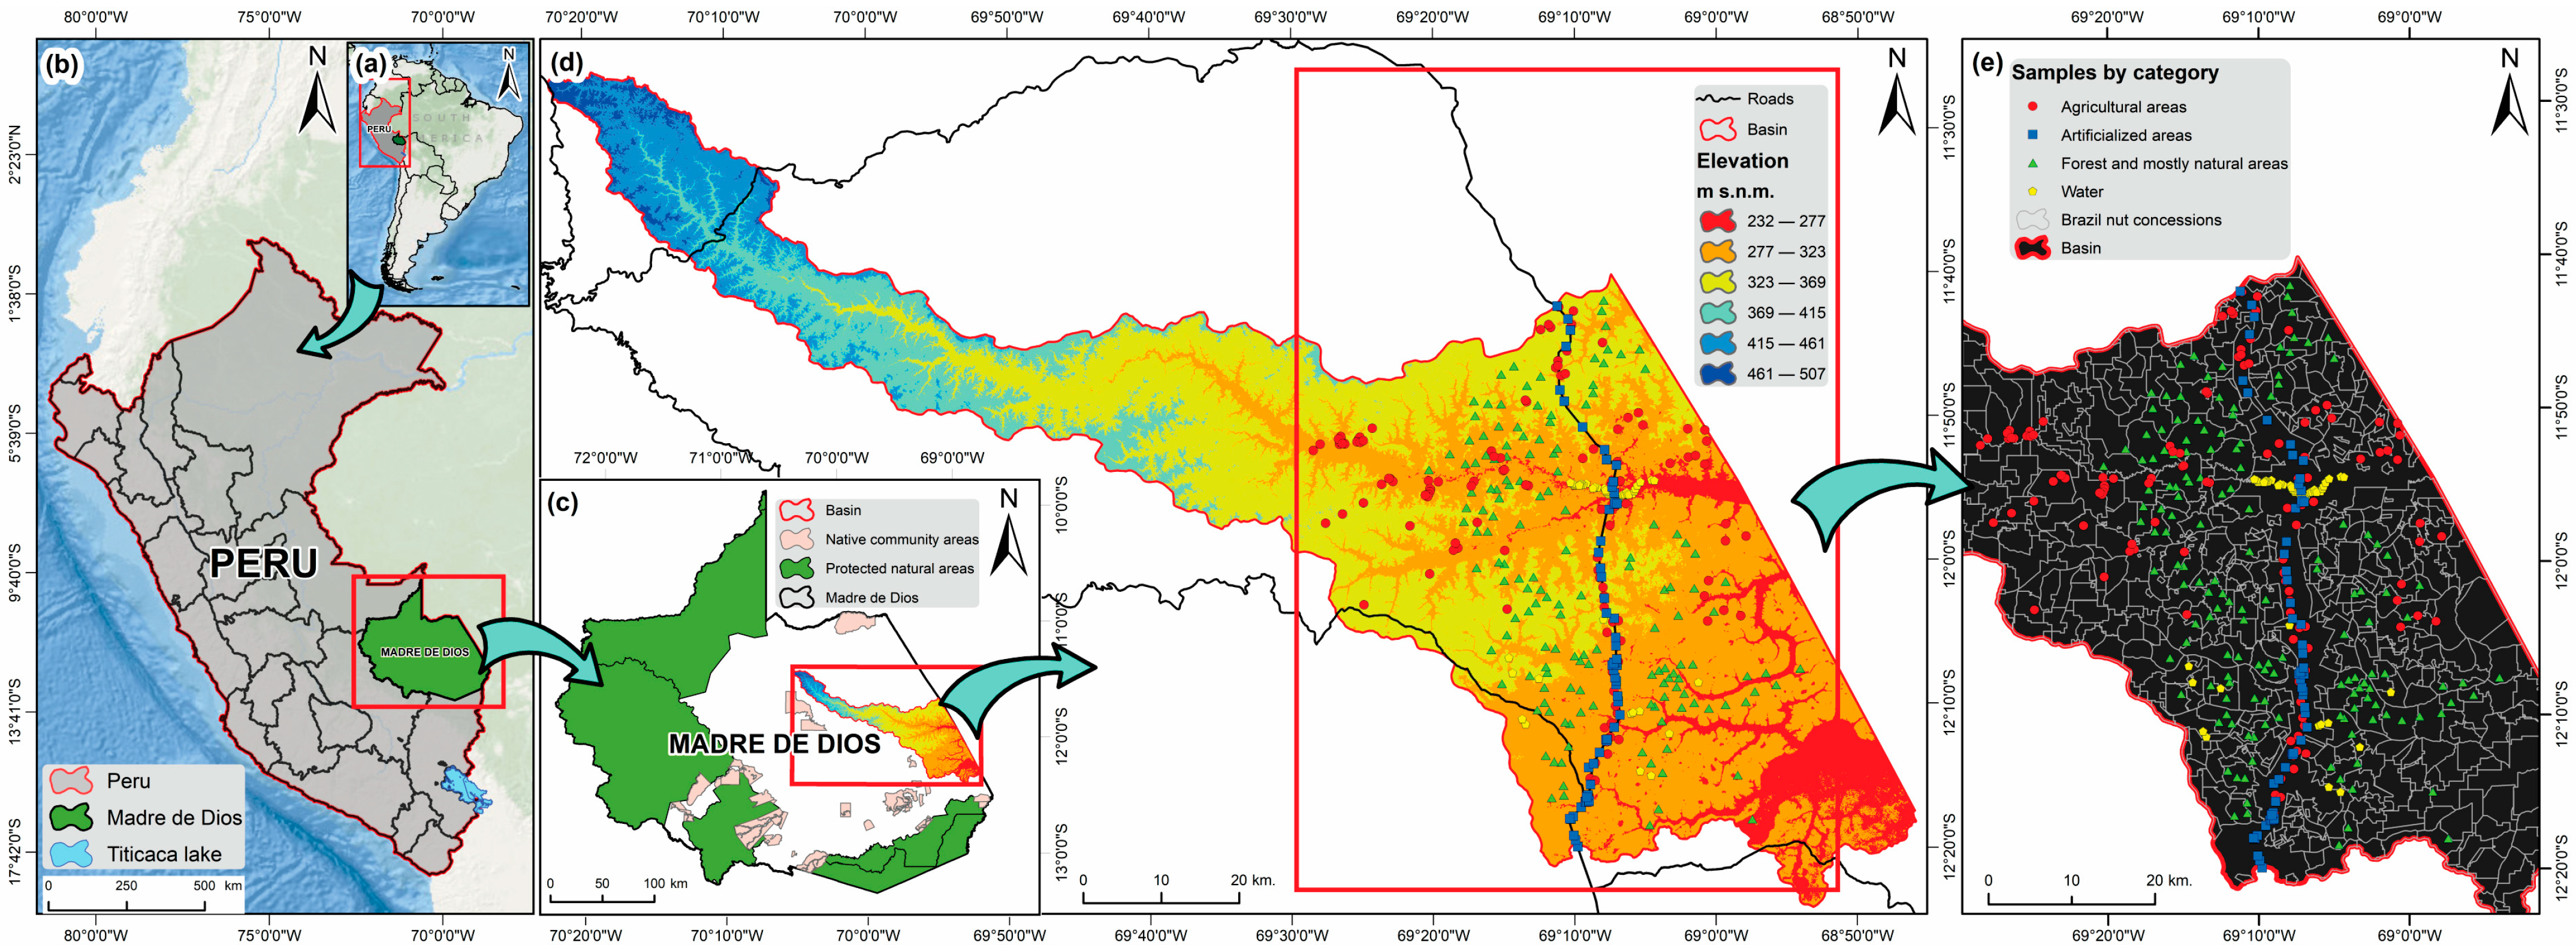
2.1. Study Area
2.2. Data Processing
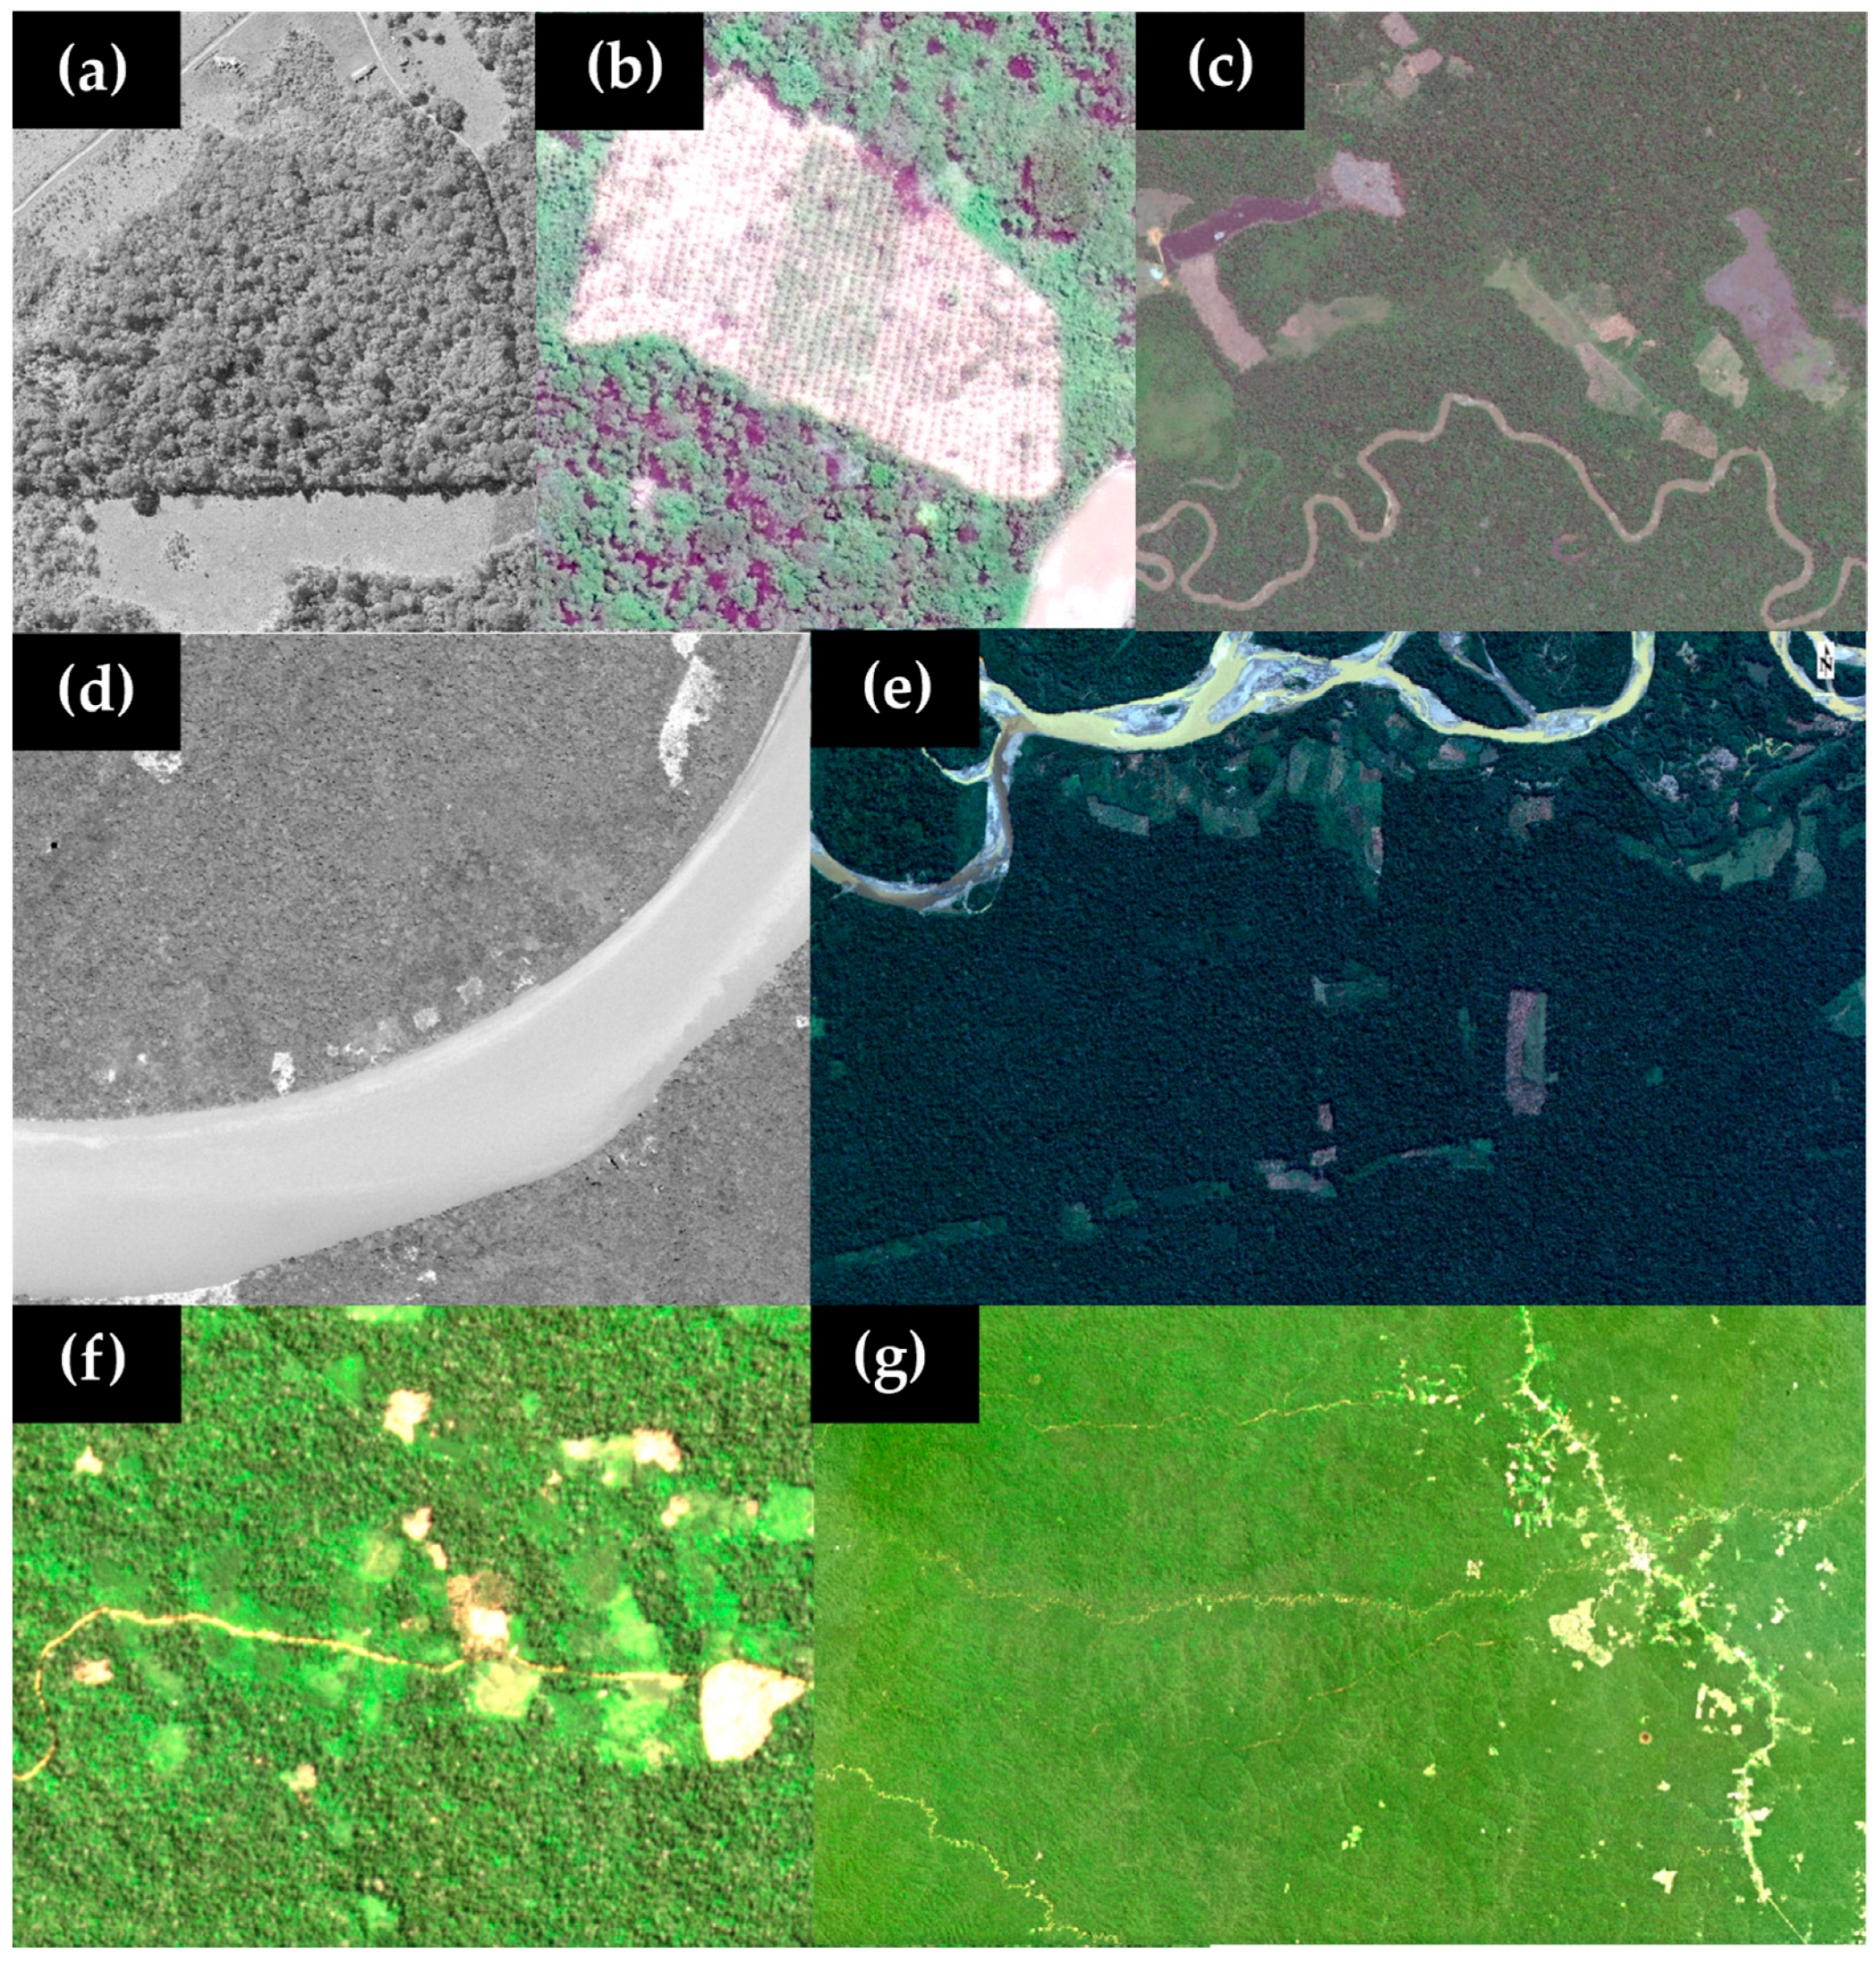
2.2.1. Landsat Imagery, Land Use, and Land Cover Change
2.2.2. Brazil Nut Production and Land Use and Land Cover Change
3. Results
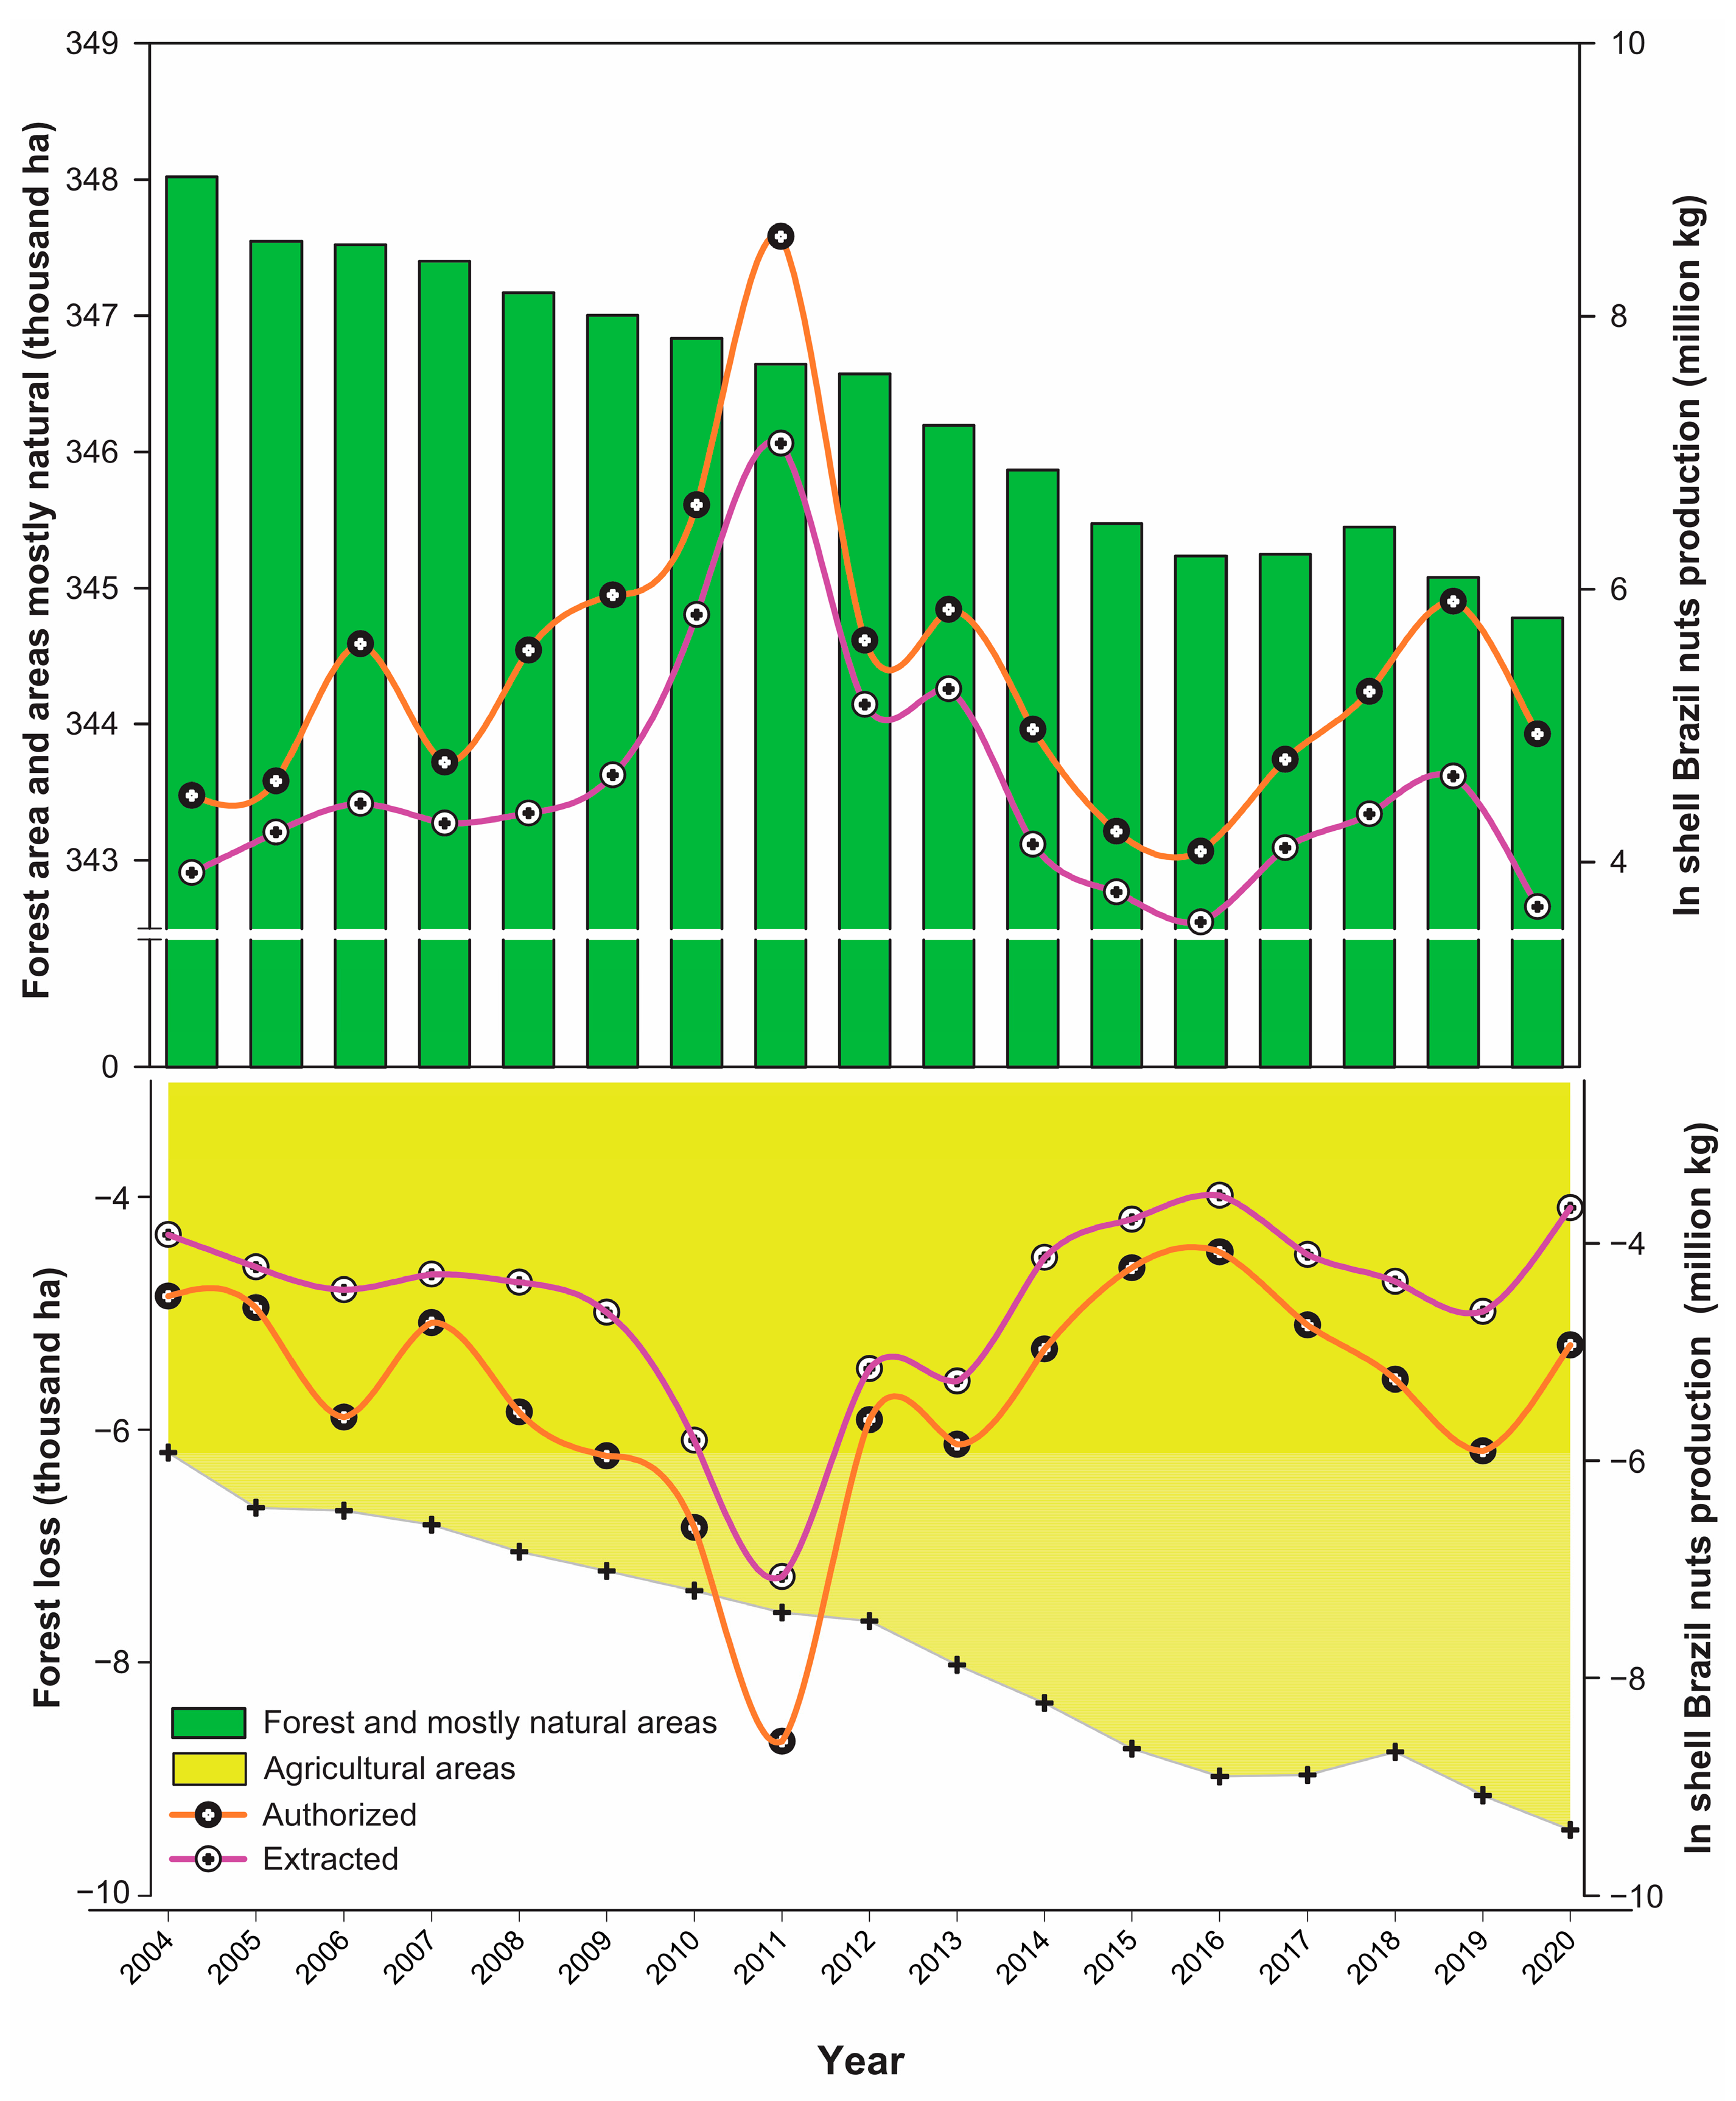
3.1. Forest Loss
Model Accuracy
3.2. Land Use and Land-Cover Change (LULC)
3.3. Land Use and Land-Cover Change and Brazil Nut Production
4. Discussion
4.1. Forest Loss
4.2. Land Use and Land-Cover Change
4.3. Land Use, Land-Cover Change, and Brazil Nut Production
5. Conclusions
Supplementary Materials
Author Contributions
Funding
Data Availability Statement
Acknowledgments
Conflicts of Interest
References
- Brandão, D.O.; Barata, L.E.S.; Nobre, I.; Nobre, C.A. The effects of Amazon deforestation on non-timber forest products. Reg. Environ. Chang. 2021, 21, 122. [Google Scholar] [CrossRef]
- Alarcon-Aguirre, G.; Canahuire, R.R.; Guevarra, F.M.G.; Rodriguez, L.; Gallegos, L.E.; Garate-Quispe, J. Dinámica de la pérdida de bosques en el sureste de la Amazonia peruana: Un estudio de caso en Madre de Dios. Ecosistemas 2021, 30, 2175. [Google Scholar] [CrossRef]
- Alarcon, G.; Zevallos, P.A.; Quispe, R.; Ramos, D.; Garate-Quispe, J.S. Valor de conservación de un bosque en el sureste de la Amazonia Peruana: El caso de Madre de Dios. Rev. Ecosistemas 2020, 29, 1947. [Google Scholar] [CrossRef]
- Alarcon-Aguirre, G.; Miranda Fidhel, R.F.; Ramos Enciso, D.; Canahuire-Robles, R.; Rodriguez-Achata, L.; Garate-Quispe, J. Burn Severity Assessment Using Sentinel-1 SAR in the Southeast Peruvian Amazon, a Case Study of Madre de Dios. Fire 2022, 5, 94. [Google Scholar] [CrossRef]
- Baldoni, A.B.; Ribeiro Teodoro, L.P.; Eduardo Teodoro, P.; Tonini, H.; Dessaune Tardin, F.; Alves Botin, A.; Hoogerheide, E.S.S.; de Carvalho Campos Botelho, S.; Lulu, J.; de Farias Neto, A.L.; et al. Genetic diversity of Brazil nut tree (Bertholletia excelsa Bonpl.) in southern Brazilian Amazon. For. Ecol. Manag. 2020, 458, 117795. [Google Scholar] [CrossRef]
- Asner, G.P.; Tupayachi, R. Accelerated losses of protected forests from gold mining in the Peruvian Amazon. Environ. Res. Lett. 2017, 12, 94–104. [Google Scholar] [CrossRef]
- Horn, C.M.; Vargas Paredes, V.H.; Gilmore, M.P.; Endress, B.A. Spatio-temporal patterns of Mauritia flexuosa fruit extraction in the Peruvian Amazon: Implications for conservation and sustainability. Appl. Geogr. 2018, 97, 98–108. [Google Scholar] [CrossRef]
- Menton, M.C.S.; Merry, F.D.; Lawrence, A.; Brown, N. Company–Community Logging Contracts in Amazonian Settlements Impacts on Livelihoods and NTFP Harvests. Ecol. Soc. 2009, 14, 39. [Google Scholar] [CrossRef]
- Urzedo, D.I.; Vidal, E.; Sills, E.O.; PiÑA-Rodrigues, F.C.M.; Junqueira, R.G.P. Tropical forest seeds in the household economy effects of market participation among three sociocultural groups in the Upper Xingu region of the Brazilian Amazon. Environ. Conserv. 2016, 43, 13–23. [Google Scholar] [CrossRef]
- Brouwer, R.G.; Zuidema, P.A.; Chiriboga-Arroyo, F.; Guariguata, M.R.; Kettle, C.J.; Ehrenberg-Azcárate, F.; Quaedvlieg, J.; García Roca, M.R.; Corvera-Gomringer, R.; Vargas Quispe, F.; et al. Establishment success of Brazil nut trees in smallholder Amazon forest restoration depends on site conditions and management. For. Ecol. Manag. 2021, 498, 119575. [Google Scholar] [CrossRef]
- Wadt, L.H.d.O.; Faustino, C.L.; Staudhammer, C.L.; Kainer, K.A.; Evangelista, J.S. Primary and secondary dispersal of Bertholletia excelsa: Implications for sustainable harvests. For. Ecol. Manag. 2018, 415–416, 98–105. [Google Scholar] [CrossRef]
- Quaedvlieg, J.; García, M.; Ros-Tonen, M.A.F. Is Amazon nut certification a solution for increased smallholder empowerment in Peruvian Amazonia? J. Rural Stud. 2014, 33, 41–55. [Google Scholar] [CrossRef]
- Salazar, S.V.; Muñoz, E.C.L.; Condori, M.H. Desarrollo de la exportación de castaña pelada de Madre de Dios-Perú al mercado de Estados Unidos. Kallpay 2020, 3, 139–143. [Google Scholar]
- Silva, Y.H.D. Exportaciones de castaña desde Perú hacia Estados Unidos y los factores económicos que influyen en su variación. Compend. Rev. Investig. Cient. 2021, 24, 3. [Google Scholar]
- Escobal, J.; Aldana, U. Are Nontimber Forest Products the Antidote to Rainforest Degradation? Brazil Nut Extraction in Madre De Dios, Peru. World Dev. 2003, 31, 1873–1887. [Google Scholar] [CrossRef]
- Tarazona, Y.; Miyasiro-López, M. Monitoring tropical forest degradation using remote sensing. Challenges and opportunities in the Madre de Dios region, Peru. Remote Sens. Appl. Soc. Environ. 2020, 19, 100337. [Google Scholar] [CrossRef]
- Sharma, R. Dominant Species-Physiognomy-Ecological (DSPE) System for the Classification of Plant Ecological Communities from Remote Sensing Images. Ecologies 2022, 3, 323–335. [Google Scholar] [CrossRef]
- Viscarra, F.E.; Zutta, B.R. Models of deforestation for setting reference levels in the context of REDD: A case study in the Peruvian Amazon. Environ. Sci. Policy 2022, 136, 198–206. [Google Scholar] [CrossRef]
- MINAM. Bosque y Perdida de Bosque del Perú; Ministerio del Ambiente (MINAM): Lima, Perú, 2022. [Google Scholar]
- Klarenberg, G.; Muñoz-Carpena, R.; Campo-Bescós, M.A.; Perz, S.G. Highway paving in the southwestern Amazon alters long-term trends and drivers of regional vegetation dynamics. Heliyon 2018, 4, e00721. [Google Scholar] [CrossRef]
- Adrah, E.; Mohd Jaafar, W.S.W.; Bajaj, S.; Omar, H.; Leite, R.V.; Silva, C.A.; Cardil, A.; Mohan, M. Analyzing canopy height variations in secondary tropical forests of Malaysia using NASA GEDI. IOP Conf. Ser. Earth Environ. Sci. 2021, 880, 012031. [Google Scholar] [CrossRef]
- Klucek, M.; Zagajewski, B.; Zwijacz-Kozica, T. Mountain Tree Species Mapping Using Sentinel-2, PlanetScope, and Airborne HySpex Hyperspectral Imagery. Remote Sens. 2023, 15, 844. [Google Scholar] [CrossRef]
- Rödig, E.; Cuntz, M.; Rammig, A.; Fischer, R.; Taubert, F.; Huth, A. The importance of forest structure for carbon fluxes of the Amazon rainforest. Environ. Res. Lett. 2018, 13, 054013. [Google Scholar] [CrossRef]
- de Mello, N.G.R.; Gulinck, H.; Van den Broeck, P.; Parra, C. A qualitative analysis of Non-Timber Forest Products activities as a strategy to promote sustainable land use in the Brazilian Cerrado. Land Use Policy 2023, 132, 106797. [Google Scholar] [CrossRef]
- Condé, T.M.; Tonini, H.; Higuchi, N.; Higuchi, F.G.; Lima, A.J.N.; Barbosa, R.I.; dos Santos Pereira, T.; Haas, M.A. Effects of sustainable forest management on tree diversity, timber volumes, and carbon stocks in an ecotone forest in the northern Brazilian Amazon. Land Use Policy 2022, 119, 106145. [Google Scholar] [CrossRef]
- Jansen, M.; Guariguata, M.R.; Chiriboga-Arroyo, F.; Quaedvlieg, J.; Vargas Quispe, F.M.; Arroyo Quispe, E.; García Roca, M.R.; Corvera-Gomringer, R.; Kettle, C.J. Forest Degradation and Inter-annual Tree Level Brazil Nut Production in the Peruvian Amazon. Front. For. Glob. Chang. 2021, 3, 525533. [Google Scholar] [CrossRef]
- Holdridge, L.R. Life zone ecology. In Life Zone Ecology; Tropical Science Center: San Jose, CA, USA, 1967. [Google Scholar]
- Senamhi. Mapa de Clasificación Climática del Perú; Servicio Nacional de Meteorología e Hidrología del Perú: Lima, Perú, 2012. [Google Scholar]
- Mutanga, O.; Kumar, L. Google Earth Engine Applications; MDPI: Basel, Switzerland, 2019. [Google Scholar]
- Dong, J.; Metternicht, G.; Hostert, P.; Fensholt, R.; Chowdhury, R.R. Remote sensing and geospatial technologies in support of a normative land system science: Status and prospects. Curr. Opin. Environ. Sustain. 2019, 38, 44–52. [Google Scholar] [CrossRef]
- Alarcón, G.; Díaz, J.; Vela, M.; García, M.; Gutiérrez, J. Deforestación en el sureste de la amazonia del Perú entre los años 1999–2013; caso Regional de Madre de Dios (Puerto Maldonado–Inambari). J. High Andean Res. 2016, 18, 319–330. [Google Scholar] [CrossRef]
- Breiman, L. Random forests. Mach. Learn. 2001, 45, 5–32. [Google Scholar] [CrossRef]
- IDEAM. Leyenda Nacional de Coberturas de la Tierra. Metodología CORINE Land Cover Adaptada Para Colombia Escala 1: 100.000; Instituto de Hidrología, Meteorología y Estudios Ambientales: Bogotá, Colombia, 2010. [Google Scholar]
- DGOT-MINAM. Informe Final del Proyecto: Análisis de las Dinámicas de Cambio de Cobertura de la Tierra en la Comunidad Andina, Componente Nacional Perú–Primera Etapa; Dirección General de Ordenamiento Territorial-Ministerio del Ambiente (DGOT-MINAM): Lima, Perú, 2012; Available online: http://repositoriodigital.minam.gob.pe/xmlui/handle/123456789/917 (accessed on 10 September 2023).
- Marquina, J.J.; Mogollón, A. Niveles y escalas de levantamiento de información geográfica en sensores remotos. Rev. Geogr. Venez. 2018, 59, 42–52. [Google Scholar]
- Azar, D.; Engstrom, R.; Graesser, J.; Comenetz, J. Generation of fine-scale population layers using multi-resolution satellite imagery and geospatial data. Remote Sens. Environ. 2013, 130, 219–232. [Google Scholar] [CrossRef]
- INRENA; SZF; CDC-UNALM. Hacia un Sistema de Monitoreo Ambiental Remoto Estandarizado para el SINANPE. Piloto V: Parque Nacional Manu, Parque Nacional Alto Purús, Reserva Comunal Purús y Santuario Nacional Megantoni (2000–2005); INRENA: Lima, Perú; SZF: Lima, Perú; CDC-UNALM: Lima, Perú, 2006; Volume 66. [Google Scholar]
- Secretaría General de la Comunidad Andina. CA. ¿ Y Por Dónde Comenzamos? Prioridades de la Comunidad Andina ante el Cambio Climático; Secretaría General de la Comunidad Andina: Lima, Peru, 2007. [Google Scholar]
- Puyravaud, J.-P. Standardizing the calculation of the annual rate of deforestation. For. Ecol. Manag. 2003, 177, 593–596. [Google Scholar] [CrossRef]
- GRFFS-MDD; Producción y movilización de castaña de la Microcuenca del Río Manuripe, Gerencia Forestal y de Fauna Silvestre, Puierto Maldonado, Madre de Dios, Peru. Private communication, 2021.
- Alturk, B.; Kurc, H.C.; Konukcu, F.; Kocaman, I. Multi-criteria land use suitability analysis for the spatial distribution of cattle farming under land use change modeling scenarios in Thrace Region, Turkey. Comput. Electron. Agric. 2022, 198, 107063. [Google Scholar] [CrossRef]
- Lesschen, J.P.; Verburg, P.H.; Staal, S.J. Statistical Methods for Analysing the Spatial Dimension of Changes in Land Use and Farming Systems; Citeseer: Princeton, NJ, USA, 2005. [Google Scholar]
- Southworth, J.; Marsik, M.; Qiu, Y.; Perz, S.; Cumming, G.; Stevens, F.; Rocha, K.; Duchelle, A.; Barnes, G. Roads as Drivers of Change: Trajectories across the Tri-National Frontier in MAP, the Southwestern Amazon. Remote Sens. 2011, 3, 1047–1066. [Google Scholar] [CrossRef]
- Perz, S.; Castro, W.; Rojas, R.; Castillo, J.; Chávez, A.; García, M.; Guadalupe, Ó.; Gutiérrez, T.; Hurtado, A.; Mamani, Z.; et al. La Amazonia como un sistema socio-ecológico: Las dinámicas de cambios complejos humanos y ambientales en una frontera trinacional. In Naturaleza y Sociedad: Perpectivas Socio-Ecológicas Sobre Cambios Globales en América Latina; Postigo, J., Young, K., Eds.; desco, IEP e INTE-PUCP: Lima, Perú, 2016; p. 444. [Google Scholar]
- Perz, S.; Qiu, Y.; Xia, Y.; Southworth, J.; Sun, J.; Marsik, M.; Rocha, K.; Passos, V.; Rojas, D.; Alarcón, G.; et al. Trans-boundary infrastructure and land cover change: Highway paving and community-level deforestation in a tri-national frontier in the Amazon. Land Use Policy 2013, 34, 27–41. [Google Scholar] [CrossRef]
- Al-Dousari, A.E.; Mishra, A.; Singh, S. Land use land cover change detection and urban sprawl prediction for Kuwait metropolitan region, using multi-layer perceptron neural networks (MLPNN). Egypt. J. Remote Sens. Space Sci. 2023, 26, 381–392. [Google Scholar] [CrossRef]
- Bax, V.; Francesconi, W. Environmental predictors of forest change: An analysis of natural predisposition to deforestation in the tropical Andes region, Peru. Appl. Geogr. 2018, 91, 99–110. [Google Scholar] [CrossRef]
- Bennett, A.; Ravikumar, A.; Paltán, H. The Political Ecology of Oil Palm Company-Community partnerships in the Peruvian Amazon: Deforestation consequences of the privatization of rural development. World Dev. 2018, 109, 29–41. [Google Scholar] [CrossRef]
- Tuesta, E. Prospectiva del Cambio de Uso de Suelo en el Distrito de Iberia, Tahuamanu—Madre de Dios, Periodo 2004–2030. Bachelor’s Thesis, Universidad Nacional Amazónica de Madre de Dios, Puerto Maldonado, 2018. [Google Scholar]
- Chávez, A.; Huamani, L.; Fernandez, R.; Bejar, N.; Valera, F.; Perz, S.; Brown, I.; Domínguez, S.; Pinedo, R.; Alarcón, G. Regional Deforestation Trends within Local Realities: Land-Cover Change in Southeastern Peru 1996–2011. Land 2013, 2, 131. [Google Scholar] [CrossRef]
- Recanati, F.; Allievi, F.; Scaccabarozzi, G.; Espinosa, T.; Dotelli, G.; Saini, M. Global Meat Consumption Trends and Local Deforestation in Madre de Dios: Assessing Land Use Changes and other Environmental Impacts. Procedia Eng. 2015, 118, 630–638. [Google Scholar] [CrossRef]
- Duff, P.M.; Downs, T.J. Frontline narratives on sustainable development challenges/opportunities in the ‘illegal’ gold mining region of Madre de Dios, Peru: Informing an integrative collaborative response. Extr. Ind. Soc. 2019, 6, 552–561. [Google Scholar] [CrossRef]
- Ofosu, G.; Dittmann, A.; Sarpong, D.; Botchie, D. Socio-economic and environmental implications of Artisanal and Small-scale Mining (ASM) on agriculture and livelihoods. Environ. Sci. Policy 2020, 106, 210–220. [Google Scholar] [CrossRef]
- Asner, G.P.; Llactayo, W.; Tupayachi, R.; Luna, E.R. Elevated rates of gold mining in the Amazon revealed through high-resolution monitoring. Proc. Natl. Acad. Sci. 2013, 110, 18454–18459. [Google Scholar] [CrossRef] [PubMed]
- Anderson, C.M.; Asner, G.P.; Lambin, E.F. Lack of association between deforestation and either sustainability commitments or fines in private concessions in the Peruvian Amazon. For. Policy Econ. 2019, 104, 1–8. [Google Scholar] [CrossRef]
- Baraloto, C.; Alverga, P.; Quispe, S.B.; Barnes, G.; Chura, N.B.; da Silva, I.B.; Castro, W.; da Souza, H.; de Souza Moll, I.E.; Chilo, J.D.A. Effects of road infrastructure on forest value across a tri-national Amazonian frontier. Biol. Conserv. 2015, 191, 674–681. [Google Scholar] [CrossRef]
- Arce, R. Bosques y seguridad nacional. Rev. Cienc. Investig. Def. 2021, 2, 73–86. [Google Scholar]
- Villacorta, Y.R. Manejo forestal de bosques comunales: Estrategia para la mitigación y adaptación al cambio climático en comunidades nativas amazónicas del perú. Braz. J. Dev. 2020, 6, 90462–90474. [Google Scholar] [CrossRef]
- Ehrenberg-Azcárate, F.; Peña-Claros, M. Twenty years of forest management certification in the tropics: Major trends through time and among continents. For. Policy Econ. 2020, 111, 102050. [Google Scholar] [CrossRef]
- Montalvo, V.B. Impacto del Manejo Forestal en la Conservación de la Biodiversidad en la Región Amazonas. Rev. Cient. Pakamuros 2015, 3, 6. [Google Scholar] [CrossRef]
- Araujo, E.C.G.; Sanquetta, C.R.; Dalla Corte, A.P.; Pelissari, A.L.; Orso, G.A.; Silva, T.C. Global review and state-of-the-art of biomass and carbon stock in the Amazon. J. Environ. Manag. 2023, 331, 117251. [Google Scholar] [CrossRef]
- Hooper, E.R.; Ashton, M.S. Fragmentation reduces community-wide taxonomic and functional diversity of dispersed tree seeds in the Central Amazon. Ecol. Appl. 2020, 30, e02093. [Google Scholar] [CrossRef] [PubMed]
- López, S. Deforestation, forest degradation, and land use dynamics in the Northeastern Ecuadorian Amazon. Appl. Geogr. 2022, 145, 102749. [Google Scholar] [CrossRef]
- Laurance, W.F.; Lovejoy, T.E.; Vasconcelos, H.L.; Bruna, E.M.; Didham, R.K.; Stouffer, P.C.; Gascon, C.; Bierregaard, R.O.; Laurance, S.G.; Sampaio, E. Ecosystem Decay of Amazonian Forest Fragments: A 22-Year Investigation. Conserv. Biol. 2002, 16, 605–618. [Google Scholar] [CrossRef]
- Brandão, D.O.; Arieira, J.; Nobre, C.A. Pathways from Deforestation to Restoration. NACLA Rep. Am. 2023, 55, 124–131. [Google Scholar] [CrossRef]
- Perz, S.G.; Mendoza, E.R.H.; dos Santos Pimentel, A. Seeing the broader picture: Stakeholder contributions to understanding infrastructure impacts of the Interoceanic Highway in the southwestern Amazon. World Dev. 2022, 159, 106061. [Google Scholar] [CrossRef]
- Bertwell, T.D.; Kainer, K.A.; Cropper Jr, W.P.; Staudhammer, C.L.; de Oliveira Wadt, L.H. Are Brazil nut populations threatened by fruit harvest? Biotropica 2018, 50, 50–59. [Google Scholar] [CrossRef]
- Cortegana, J. Factores Económicos que Influyen en las Exportaciones de Castaña Amazónica en el Departamento de Madre de Dios hacia EEUU. Periodo 2015 al 2020. Bachelor’s Thesis, César Vallejo University, Trujillo, Perú, 2021. [Google Scholar]
- Ruiz, M.C.; Paucar, A.J. Factores que influyeron en el incremento de las exportaciones de Nueces de Brasil (Castañas) de la Provincia de Tambopata–Madre de Dios hacia el mundo, periodo 2005–2018. Bachelor’s Thesis, Universidad Peruana de Ciencias Aplicadas (UPC), Lima, Perú, 2019. [Google Scholar]


| Years | Annual Rate of Forest Loss (%) | Average Annual Total Forest Loss (ha) (r) |
|---|---|---|
| 2004–2005 | 0.138 | 479.53 |
| 2005–2006 | 0.008 | 29.06 |
| 2006–2007 | 0.036 | 125.19 |
| 2007–2008 | 0.069 | 239.87 |
| 2008–2009 | 0.047 | 162.02 |
| 2009–2010 | 0.048 | 165.01 |
| 2010–2011 | 0.055 | 191.47 |
| 2011–2012 | 0.021 | 73.13 |
| 2012–2013 | 0.108 | 374.23 |
| 2013–2014 | 0.095 | 327.56 |
| 2014–2015 | 0.114 | 394.68 |
| 2015–2016 | 0.069 | 239.50 |
| 2016–2017 | −0.003 | (−) 10.35 * |
| 2017–2018 | −0.058 | (−) 200.16 * |
| 2018–2019 | 0.108 | 373.35 |
| 2019–2020 | 0.082 | 283.90 |
| 2004–2020 | 0.046 | 160.11 |
| Years | Overall Accuracy (%) | kappa Coefficient (κ) | User’s Accuracy (%) | |
|---|---|---|---|---|
| Forest and Mostly Natural Areas | Agricultural Areas | |||
| 2004 | 82.80 | 0.80 | 97.02 | 79.76 |
| 2005 | 85.39 | 0.82 | 94.43 | 77.17 |
| 2006 | 82.50 | 0.80 | 97.32 | 80.06 |
| 2007 | 82.50 | 0.80 | 97.32 | 79.86 |
| 2008 | 84.80 | 0.81 | 95.02 | 77.76 |
| 2009 | 85.80 | 0.78 | 94.02 | 76.72 |
| 2010 | 83.00 | 0.80 | 96.82 | 79.56 |
| 2011 | 85.50 | 0.81 | 94.32 | 77.06 |
| 2012 | 82.60 | 0.78 | 97.22 | 79.96 |
| 2013 | 84.00 | 0.81 | 95.82 | 78.56 |
| 2014 | 84.70 | 0.81 | 95.12 | 77.86 |
| 2015 | 84.90 | 0.80 | 94.92 | 77.66 |
| 2016 | 85.60 | 0.81 | 94.22 | 76.96 |
| 2017 | 86.00 | 0.80 | 93.82 | 76.56 |
| 2018 | 83.20 | 0.81 | 96.62 | 79.36 |
| 2019 | 84.65 | 0.80 | 95.17 | 77.91 |
| 2020 | 86.81 | 0.81 | 93.14 | 76.88 |
| Land-Use Change (ha) | ||||
|---|---|---|---|---|
| Years | Forest Persistence | Persistent Agricultural Areas | Forest to Agricultural Areas | Agricultural Areas to Secondary Vegetation |
| 2004–2005 | 347,486.70 | 6118.15 | 542.21 | 71.60 |
| 2005–2006 | 347,356.46 | 6495.10 | 196.39 | 170.71 |
| 2006–2007 | 347,307.68 | 6597.01 | 217.64 | 96.32 |
| 2007–2008 | 347,089.92 | 6682.37 | 333.08 | 113.28 |
| 2008–2009 | 346,896.63 | 6887.37 | 303.43 | 131.22 |
| 2009–2010 | 346,727.59 | 7098.96 | 279.86 | 112.24 |
| 2010–2011 | 346,570.44 | 7300.79 | 268.12 | 79.31 |
| 2011–2012 | 346,439.17 | 7430.69 | 210.47 | 138.33 |
| 2012–2013 | 346,146.40 | 7581.10 | 432.98 | 58.18 |
| 2013–2014 | 345,665.31 | 7806.30 | 536.50 | 210.56 |
| 2014–2015 | 345,335.79 | 8194.28 | 541.21 | 147.37 |
| 2015–2016 | 345,028.23 | 8517.14 | 454.37 | 218.92 |
| 2016–2017 | 344,971.61 | 8683.29 | 275.88 | 287.87 |
| 2017–2018 | 345,022.70 | 8523.94 | 236.20 | 435.81 |
| 2018–2019 | 345,069.57 | 8752.63 | 383.28 | 13.17 |
| 2019–2020 | 344,093.97 | 8370.37 | 1023.67 | 730.64 |
| 2004–2020 | 343,370.47 | 4711.07 | 4681.36 | 1455.76 |
| Forest Persistence | Agricultural Areas Persistence | Forest to Agricultural Areas | Agricultural Areas to Secondary Vegetation | Average Annual Forest Loss | Cumulate Forest Loss | |
|---|---|---|---|---|---|---|
| Agricultural area persistence | −0.95 *** | |||||
| Forest to agricultural areas | −0.29 | 0.22 | ||||
| Agricultural areas to secondary vegetation | −0.57 * | 0.39 | 0.02 | |||
| Average annual forest loss | 0.04 | −0.02 | 0.84 *** | −0.44 | ||
| Cumulative forest loss | −0.97 *** | 0.96 *** | 0.36 | 0.44 | 0.08 | |
| In-shell Brazil nut production | 0.44 | −0.33 | −0.52 * | −0.33 | −0.17 | −0.41 |
Disclaimer/Publisher’s Note: The statements, opinions and data contained in all publications are solely those of the individual author(s) and contributor(s) and not of MDPI and/or the editor(s). MDPI and/or the editor(s) disclaim responsibility for any injury to people or property resulting from any ideas, methods, instructions or products referred to in the content. |
© 2023 by the authors. Licensee MDPI, Basel, Switzerland. This article is an open access article distributed under the terms and conditions of the Creative Commons Attribution (CC BY) license (https://creativecommons.org/licenses/by/4.0/).
Share and Cite
Alarcon-Aguirre, G.; Mamani Mamani, M.; Canahuire-Robles, R.R.; Vasquez Zavaleta, T.; Peña Valdeiglesias, J.; Diaz Revoredo, J.; Rodríguez Achata, L.; Ramos Enciso, D.; Garate-Quispe, J. Forest Loss Related to Brazil Nut Production in Non-Timber Forest Product Concessions in a Micro-Watershed in the Peruvian Amazon. Remote Sens. 2023, 15, 5438. https://doi.org/10.3390/rs15235438
Alarcon-Aguirre G, Mamani Mamani M, Canahuire-Robles RR, Vasquez Zavaleta T, Peña Valdeiglesias J, Diaz Revoredo J, Rodríguez Achata L, Ramos Enciso D, Garate-Quispe J. Forest Loss Related to Brazil Nut Production in Non-Timber Forest Product Concessions in a Micro-Watershed in the Peruvian Amazon. Remote Sensing. 2023; 15(23):5438. https://doi.org/10.3390/rs15235438
Chicago/Turabian StyleAlarcon-Aguirre, Gabriel, Maritza Mamani Mamani, Rembrandt Ramiro Canahuire-Robles, Telesforo Vasquez Zavaleta, Joel Peña Valdeiglesias, Jorge Diaz Revoredo, Liset Rodríguez Achata, Dalmiro Ramos Enciso, and Jorge Garate-Quispe. 2023. "Forest Loss Related to Brazil Nut Production in Non-Timber Forest Product Concessions in a Micro-Watershed in the Peruvian Amazon" Remote Sensing 15, no. 23: 5438. https://doi.org/10.3390/rs15235438
APA StyleAlarcon-Aguirre, G., Mamani Mamani, M., Canahuire-Robles, R. R., Vasquez Zavaleta, T., Peña Valdeiglesias, J., Diaz Revoredo, J., Rodríguez Achata, L., Ramos Enciso, D., & Garate-Quispe, J. (2023). Forest Loss Related to Brazil Nut Production in Non-Timber Forest Product Concessions in a Micro-Watershed in the Peruvian Amazon. Remote Sensing, 15(23), 5438. https://doi.org/10.3390/rs15235438