1. Introduction
Drought, as one of the major disasters, is a complex and multi-faceted climatic event with serious environmental, social, and economic implications [
1,
2]. Drought directly leads to rampant wildfires, crop failures, and interruptions in river transportation, triggering a global food security crisis and resulting in ecological damage [
3,
4,
5]. The effects of drought are profound and widespread, and the damage and costs it causes are often seriously underestimated [
6,
7]. In the summer of 2022, many regions of the Northern Hemisphere, including Central and Western Europe, North America, and China, experienced prolonged extreme temperatures and reduced rainfall, leading to severe droughts. China suffered from its most severe prolonged drought since 1961. The Intergovernmental Panel on Climate Change (IPCC)’s Sixth Assessment Report states that under the current climate conditions, approximately once every 10 years, more extreme temperatures and droughts will become the “new normal”, threatening humanity [
8,
9]. It is estimated that by 2050, 4 billion people worldwide will live in areas with severe drought and water scarcity [
10]. Scientific management of disaster prevention and mitigation, and an approach of “early warning and early action”, have become effective solutions. We urgently need to utilize scientific methods to effectively monitor and give early warnings before, during, and after disasters and do everything possible to minimize the loss from droughts, or even prevent them from occurring.
The monitoring and assessment of drought conditions is of critical importance for understanding climatic patterns and their implications on environmental and socio-economic facets [
11]. Given the vast geographical expanse of China, combined with its highly diverse climate, the incidence of drought varies extensively across different regions, in terms of both intensity and frequency [
12]. The application of robust, accurate, and efficient monitoring systems is paramount for early detection, effective management, and mitigation of the adverse effects associated with drought.
The Meteorological-drought Composite Index (MCI) established by the National Climate Center is a comprehensive index used by the China Meteorological Administration to monitor climatic drought. It has been included in the national standard for meteorological drought levels (GB/T-20481-2017) [
13,
14]. The MCI drought index, based on data from over 2500 ground stations nationwide, takes into account effective precipitation within 60 days, evaporation within 30 days, and the combined impact of quarterly and semi-annual precipitation. It has processed more than a decade of meteorological drought monitoring data from 2010 to the present and is the authoritative index for meteorological drought monitoring domestically.
In recent years, advancements in satellite remote sensing technologies have offered an alternative approach to traditional drought monitoring systems [
15]. Owing to their relatively low cost and continuous spatial coverage, satellite remote sensing has been increasingly applied to monitor regional and global droughts. The satellite drought product has the advantage of large-scale, real-time, high-resolution continuous monitoring. It does not rely on empirical parameters or input of precipitation information and can provide a more accurate spatial distribution in areas where ground stations are sparse. The data from these remote sensing efforts feed numerical weather, climate, and hydrological prediction models, thereby enhancing their reliability and practicality.
The Fengyun satellite series has been at the forefront of advancing environmental monitoring capabilities, and three of its remarkable satellites, namely Fengyun-2G, Fengyun-2F, and Fengyun-4A, stand out for their unique characteristics and contributions to Earth observation [
16]. This study proposed a new drought monitoring product leveraging thermal channel observations from the Fengyun (FY) satellite series. Specifically, a data fusion method was developed to bias-correct thermal observations from the FY-2 and FY-4 satellites, resulting in a long-term, consistent land surface temperature (LST) data set. Furthermore, based on the established LST data set, an operational system was developed to offer daily drought monitoring with a spatial resolution of 4 km. The FY-based drought monitoring product spans over a decade, marking it as a unique data resource for drought monitoring applications.
This paper aims to present a comparative evaluation of the FY-based drought monitoring system and the MCI, highlighting the capabilities, strengths, and limitations of both methodologies. Moreover, it also provides a comprehensive assessment of the FY system’s effectiveness in detecting and monitoring drought conditions in different regions of China. The research not only adds to our understanding of drought patterns in China over the past decade but also contributes to the refinement of drought monitoring and management strategies.
3. Methodology
3.1. Satellite Drought Index Generated from FY Remote Sensing Observations
A surface–atmospheric energy balance model is utilized to segregate the surface net radiative energy into the components of latent heat, sensible heat, and surface radiation for both soil and vegetation [
23,
24]. The flux components are calculated using thermal observations from the FY satellite platform combined with meteorological forcing data sets. The evaporation derived from the latent heat component is then compared with a long-term meteorological baseline—constructed over a decade—to assess drought conditions.
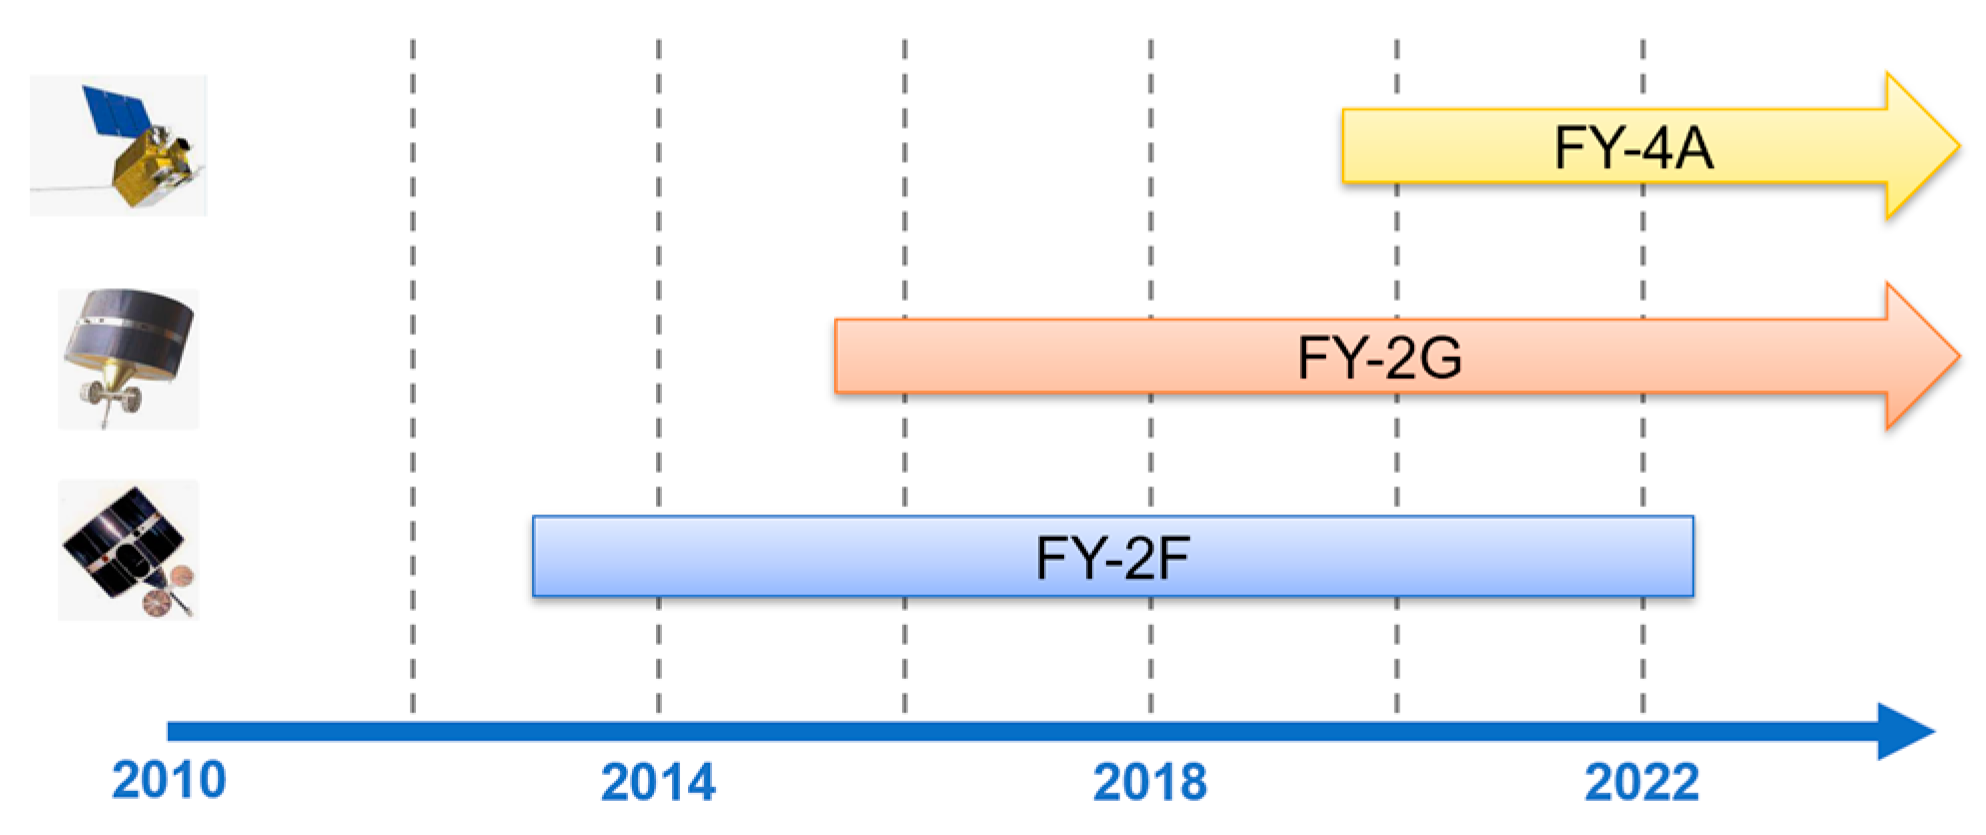
For precise drought information extraction, an extended climatology estimate series, ideally spanning over 10 years, is essential. However, the average operational lifetime of satellites is typically 3–5 years. This limitation necessitates the amalgamation of data from multiple satellite records for long-term observation. As illustrated in
Figure 1, the FY-2F, FY-2G, and FY-4A satellites can be collectively used to produce a comprehensive 10-year drought monitoring record. To synchronize the coverage between FY-East and FY-West and ensure consistent land surface temperature records, pre-processing the raw data from the FY-2G, FY-2F, and FY-4A is crucial.
This subsection elaborates on the critical steps required to produce a systematic bias-free thermal data set from the FY satellite series and to set up the FY drought monitoring system.
3.1.1. System Correction among Different FY Satellite Series
Observations from various satellite platforms can diverge due to differences in orbiting, viewing angles, channel configuration, and sensor response function, among other factors. To ensure data consistency, systematic deviations resulting from different platforms were corrected. In this study, the thermal infrared observational data from the FY-2G, FY-2F, and FY-4A platforms were normalized using a simple regression model prior to integration into the surface–atmospheric energy exchange model.
The FY-4A is the latest Chinese geostationary weather satellite, and it is recognized for its superior spatial and temporal resolution imagery. Considering its quality and integration of future FY satellite series, the FY-4A is selected as a benchmark to bias-correct observations from the FY-2G and FY-2F. Since the bias of sensor observations is influenced by the surface type, regression models are established separately for each surface type. The 13-class surface classification map by the University’s Global Land Cover Facility (GLCF) is employed for this process.
Samples between the FY-4A and the other satellites were established during common observational periods. The FY-4A and FY-2F overlapped from August 2019 to March 2022, whereas the FY-2F had a longer overlap until the end of 2022. Linear regression models were established for each of the 13 surface types, with coefficients determined based on the least square principle. After establishing the regression coefficients, all historical FY-2G and -2F observations were corrected before integration into the atmosphere–land model for surface energy component partitioning.
3.1.2. Data Fusion of FY-East and -West Satellites
Given China’s geographic span, reaching over 60 degrees from east to west, a single geostationary satellite’s viewing angle may exceed 70 degrees at its extreme, resulting in increased atmospheric interference and significant observational data errors. To tackle this, we employed two satellites, positioned in the east and the west.
This dual-satellite strategy compensated for larger observation angles and minimized calibration and shadowing impact. Selection from the satellite with a smaller viewing angle, when both sensors are available, enhances the number of effective observed pixels and optimizes the spatial coverage of daily products.
3.1.3. Drought Index Generated from FY Observations
Retrieval of daily drought conditions is based on the decomposition of the surface–atmospheric energy balance model (Equation (1)). The net radiative energy (
Rn) at the surface equals the combined total of the sensible heat flux from the surface to the atmosphere (
H), the latent heat flux from the surface to the atmosphere (
LE), and the surface radiation component (
G). This energy exchange is further decomposed into soil and vegetation components [
23]. According to the two-source energy balance model (TSEB), the latent heat, sensible heat, and surface radiation components of soil and vegetation are calculated separately (Equations (2) and (3)) [
24,
25,
26].
where ‘
s’ and ‘
c’ donate the soil and canopy components of the system, respectively. With the support of satellite radiation products and meteorological driving data, each component in the energy balance equation is further detailed individually [
27,
28]. The surface net radiation energy, sensible heat flux, and surface radiative energy can be successively calculated based on Equations (4)–(6).
In these equations, and represent the downward and upward long-wave radiation, respectively, and and are the downward and upward short-wave radiation, respectively. T is temperature, R is an exchange resistance coefficient, is air density, and is the heat capacity of air at constant pressure. The subscripts ‘a’ and ‘ac’ characterize properties of the air above and within the canopy, respectively.
The ground heat flux is then parameterized using a formula proposed by Choudhury [
29], which calculates it as thirty percent of the net radiation accessible to the soil component.
Subsequent to breaking down the components of surface net radiative energy, the latent heat flux is assessed as a partial residual to the energy budget [
28,
30,
31,
32]. Crucially, this latent heat flux is an outcome of the multiplication of the latent heat of vaporization (
λ) and evapotranspiration, as shown in Equation (7):
Upon determining for the actual
ET, the potential evapotranspiration (
PET) of the system is further calculated [
33], which is also decomposed into vegetation and soil parts (Equation (8)). Notably, the ratio of the actual
ET to the potential evapotranspiration from the surface can reflect the moisture stress condition of the surface vegetation and bare soil system.
In practice, the daily inverted ratio will then be compared with the long-term meteorological baseline to gauge the drought condition. Specifically, the drought index stretches from −3.5 to 3.5. Values ranging between −3.5 and 0 signify drought conditions, whereas those between 0 and 3.5 denote regions with abundant moisture, free from drought.
3.1.4. FY Remote Sensing Drought Monitoring System
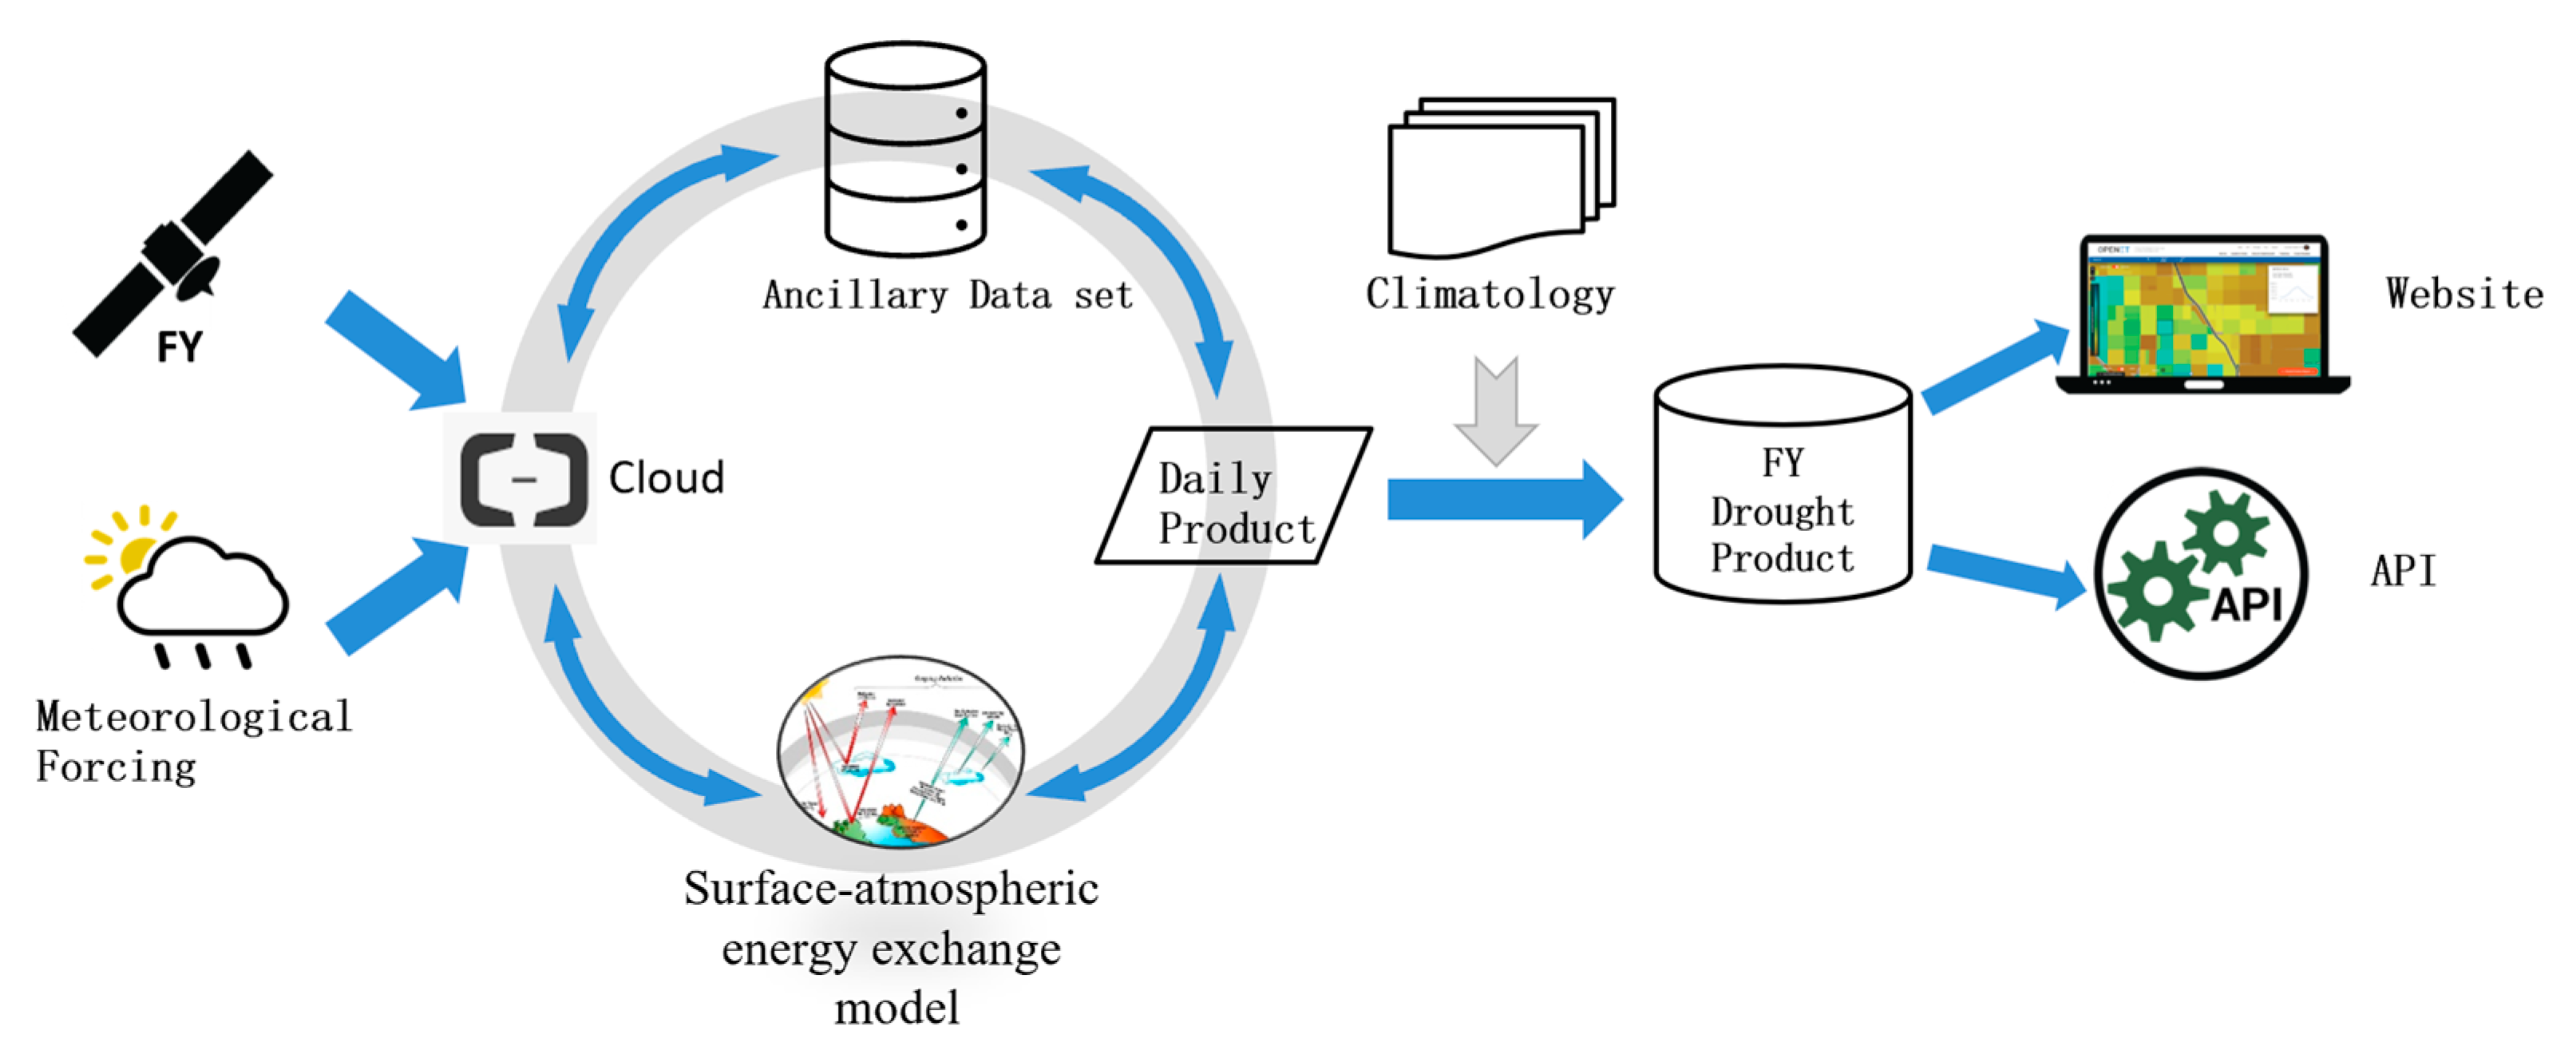
The FY remote sensing drought monitoring system, operating on cloud computational platforms, facilitates the routine production of daily drought monitoring data. This system harnesses the power of the geostationary FY-2 and -4 satellites to cover both China and its neighboring regions, delivering drought maps at a 4 km spatial resolution. A detailed design blueprint of the FY drought monitoring system is illustrated in
Figure 2.
The pre-processed thermal infrared surface temperature data from the FY satellite series, outlined in
Section 3.1.1 and
Section 3.1.2, are free from systematic bias and span a long duration. These optimized thermal infrared observation data from the FY geostationary satellite series are used for the inversion of surface and atmospheric energy exchange models, calculating components of the surface net radiative energy and drought index, as indicated in
Section 3.1.3.
Upon its creation, the insightful drought product is instantaneously made available on the official website and dedicated customer app. Users thus have real-time access to this pivotal information. Remarkably, this groundbreaking remote sensing drought monitoring system has processed close to a decade of drought data, offering a 4 km resolution. Consequently, it has become an indispensable tool for timely and precise long-term tracking of both drought manifestations and their subsequent alleviations.
3.2. MCI Generated from Meteorological Monitoring Data
Since 2012, the MCI has been employed for drought monitoring services in China. It effectively reflects the frequency distribution of droughts in different regions of China and the seasonal distribution characteristics of droughts of varying severity within a year (according to GB/T20481-2017, China) [
14]. The MCI is calculated based on the following formula:
where
represents the standardized weighted precipitation index for the previous 60 days;
stands for the relative humidity index over approximately 30 days;
and correspond to the 90-day and 150-day standardized precipitation indices, respectively;
denotes the seasonal adjustment coefficient; and
a, b, c, and d are the weight coefficients for these components, respectively.
A list of coefficients for each parameter in the MCI is provided in
Table S1 with a brief description.
The MCI method primarily enhances two aspects: (1) Representation of Precipitation Events: To address the issue of precipitation events being overly sensitive and leading to unreasonable jumps in drought development, a standardized weighted precipitation index () has been introduced, significantly reducing such inconsistencies during drought progression; and (2) Reflecting Major Drought Events: Particularly for drought events characterized by prolonged periods of low precipitation exceeding 90 days, the influence of longer-term precipitation is considered (), making the cumulative effects of drought development more prominent and improving the detection of major drought events.
Additionally, a seasonal adjustment factor,
, has been introduced to tailor the empirical coefficients according to different regions and seasons, making drought monitoring services more targeted. Through trial runs and comparative testing in national and provincial-level drought monitoring operations, the results indicate that the MCI outperforms the previous CI (based on GB/T20481-2006, China) in terms of monitoring effectiveness [
13].
3.3. Cross-Validation
The cross-validation of the MCI drought product and the FY remote sensing drought product consists of two parts: qualitative analysis and quantitative analysis. The qualitative validation involves a comparison of the spatial distribution consistency between the two products, analyzing the agreement of occurrence time and extent for typical drought events over a decade, from 2013 to 2022. The results of this analysis are presented in
Section 4.1.
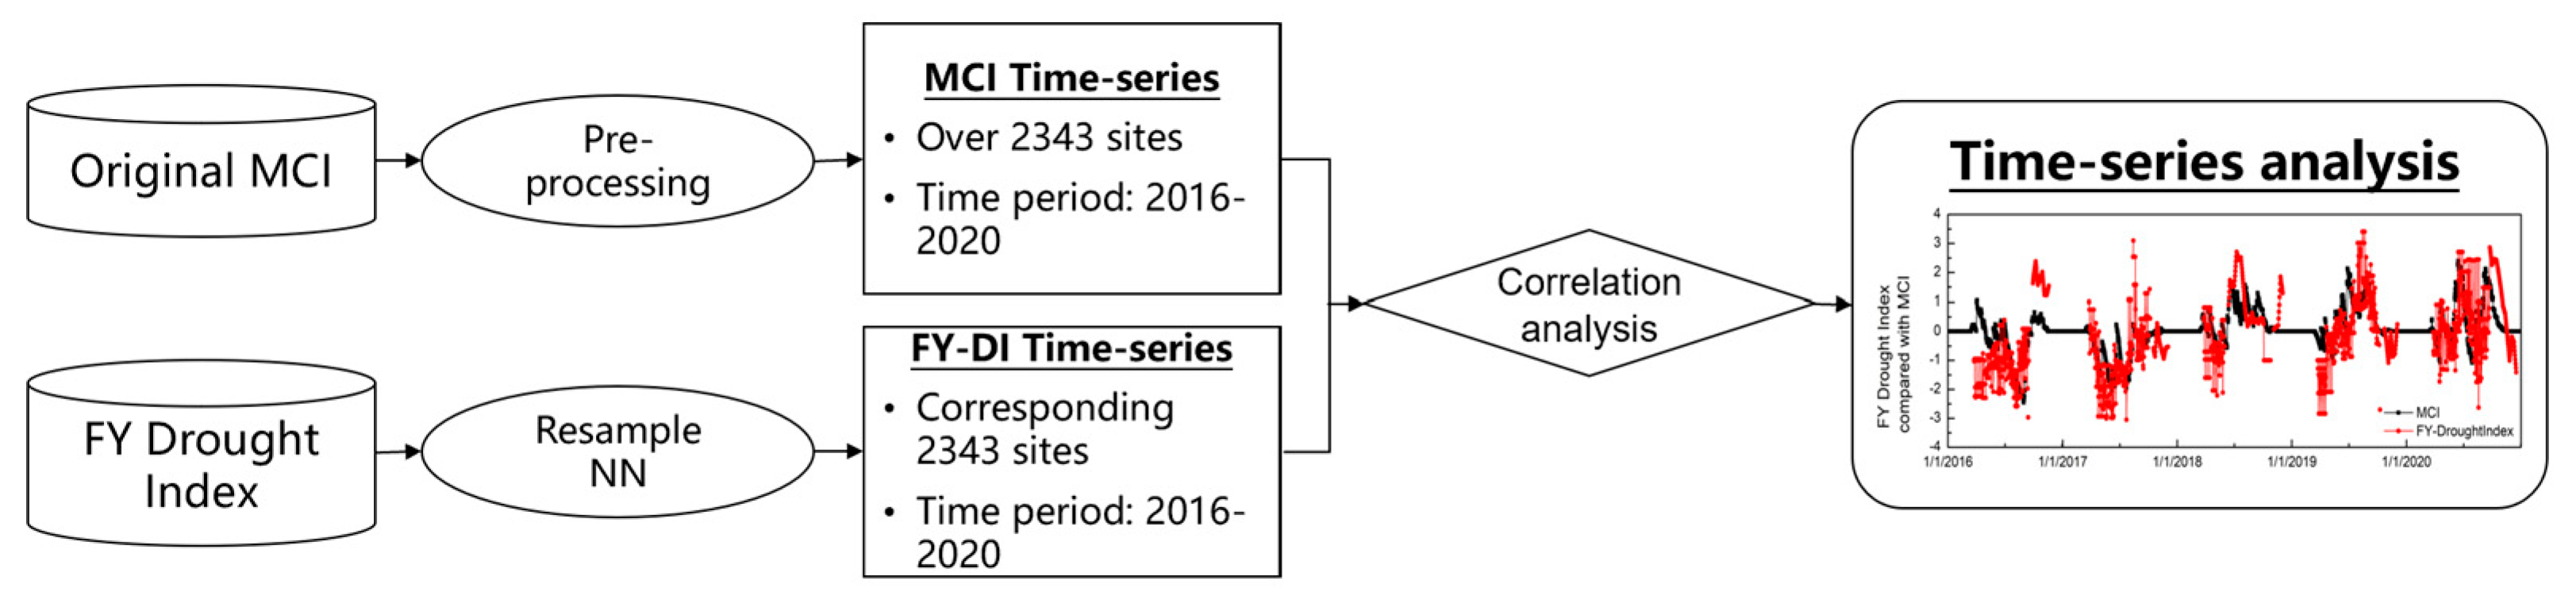
Quantitative validation examines the correlation of time series between the FY remote sensing drought index and the MCI drought index over 2343 ground stations. This rigorous analysis concentrates on an intensive five-year validation period from 2016 to 2020.
Prior to conducting the relevance comparison, it is essential to pre-process both the MCI and the FY remote sensing inversion index, as demonstrated in
Figure 3. The original MCI ground observation data may have missing days or seasons, hence the need for filling and processing to avoid inaccurate matches. The FY satellite-based drought products are aligned with each MCI station using the nearest neighboring resampling method. The most representative pixel is selected and paired with the ground station, using the same time period (2016–2020) for comparison and validation with the MCI time series.
4. Results
4.1. Results of Qualitative Analysis
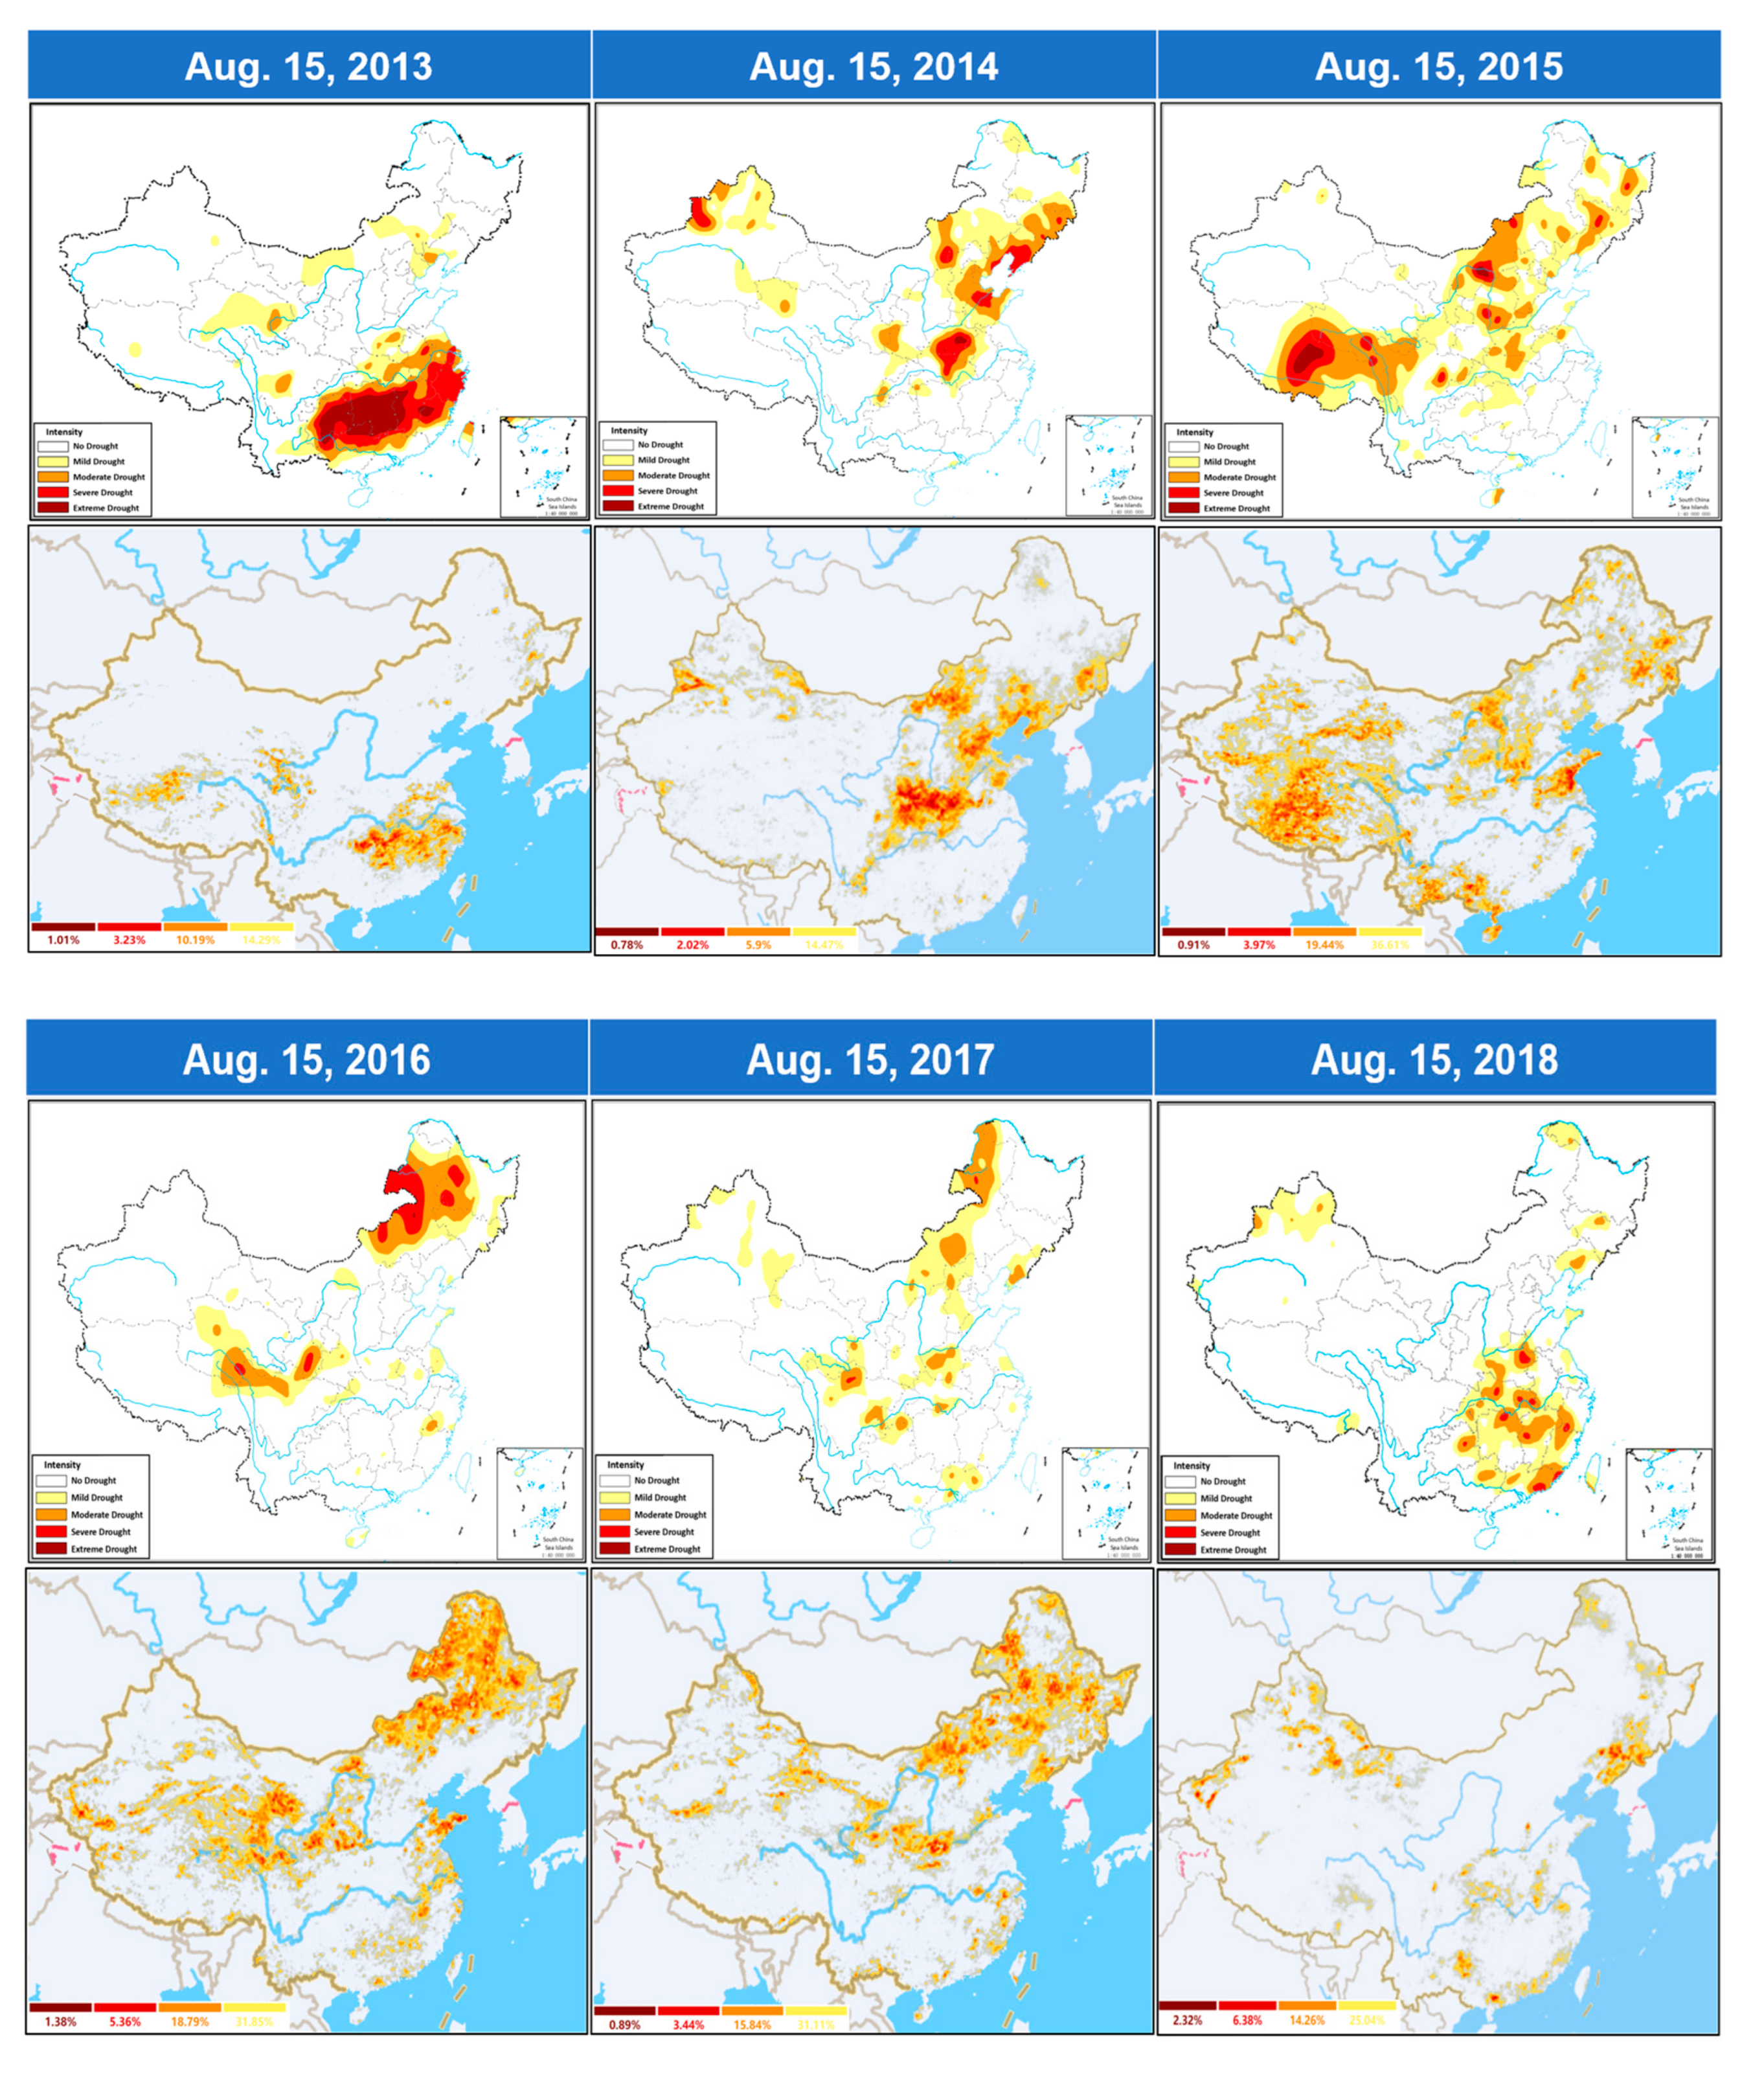
The spatial distribution of drought conditions was compared between the FYDI and the spatially interpolated MCI maps from 2013 to 2022.
Figure 4 displays a comparison of the two products for each August from 2013 to 2022. In general, the FY remote sensing drought monitoring product has shown high accuracy in detecting the spatial distribution of typical drought events over the past decade. The forecasted occurrence time and regional extent of drought align well with the MCI index. Despite minor regional differences in certain years, both products exhibit strong consistency in drought event monitoring in terms of spatial distribution and intensity.
Notable findings include severe drought in the Yangtze River Basin in mid-August 2013, particularly in the western Hunan Province and eastern Guizhou Province, and the identification of mild droughts in Qinghai and Tibet. Similar consistency is seen in the detection of medium to severe drought in the Liao River and Huai River Basins in the summer of 2014, the large-scale drought in Tibet in 2015, and the two-year drought in the northern part of Inner Mongolia in 2016 and 2017.
Divergence between the two products is noticeable in the summer of 2018, when the MCI index showed a wide range of droughts in southeastern China, but the FY remote sensing product did not issue a drought warning in the Hunan and Jiangxi provinces. We further checked the FY drought index from 1 August to 15 August 2018. The results showed that the number of days affected by cloud contamination in the Hunan and Jiangxi regions exceeded ten days. The remote sensing product did not reflect the drought in this area due to a great number of days affected by cloud contamination.
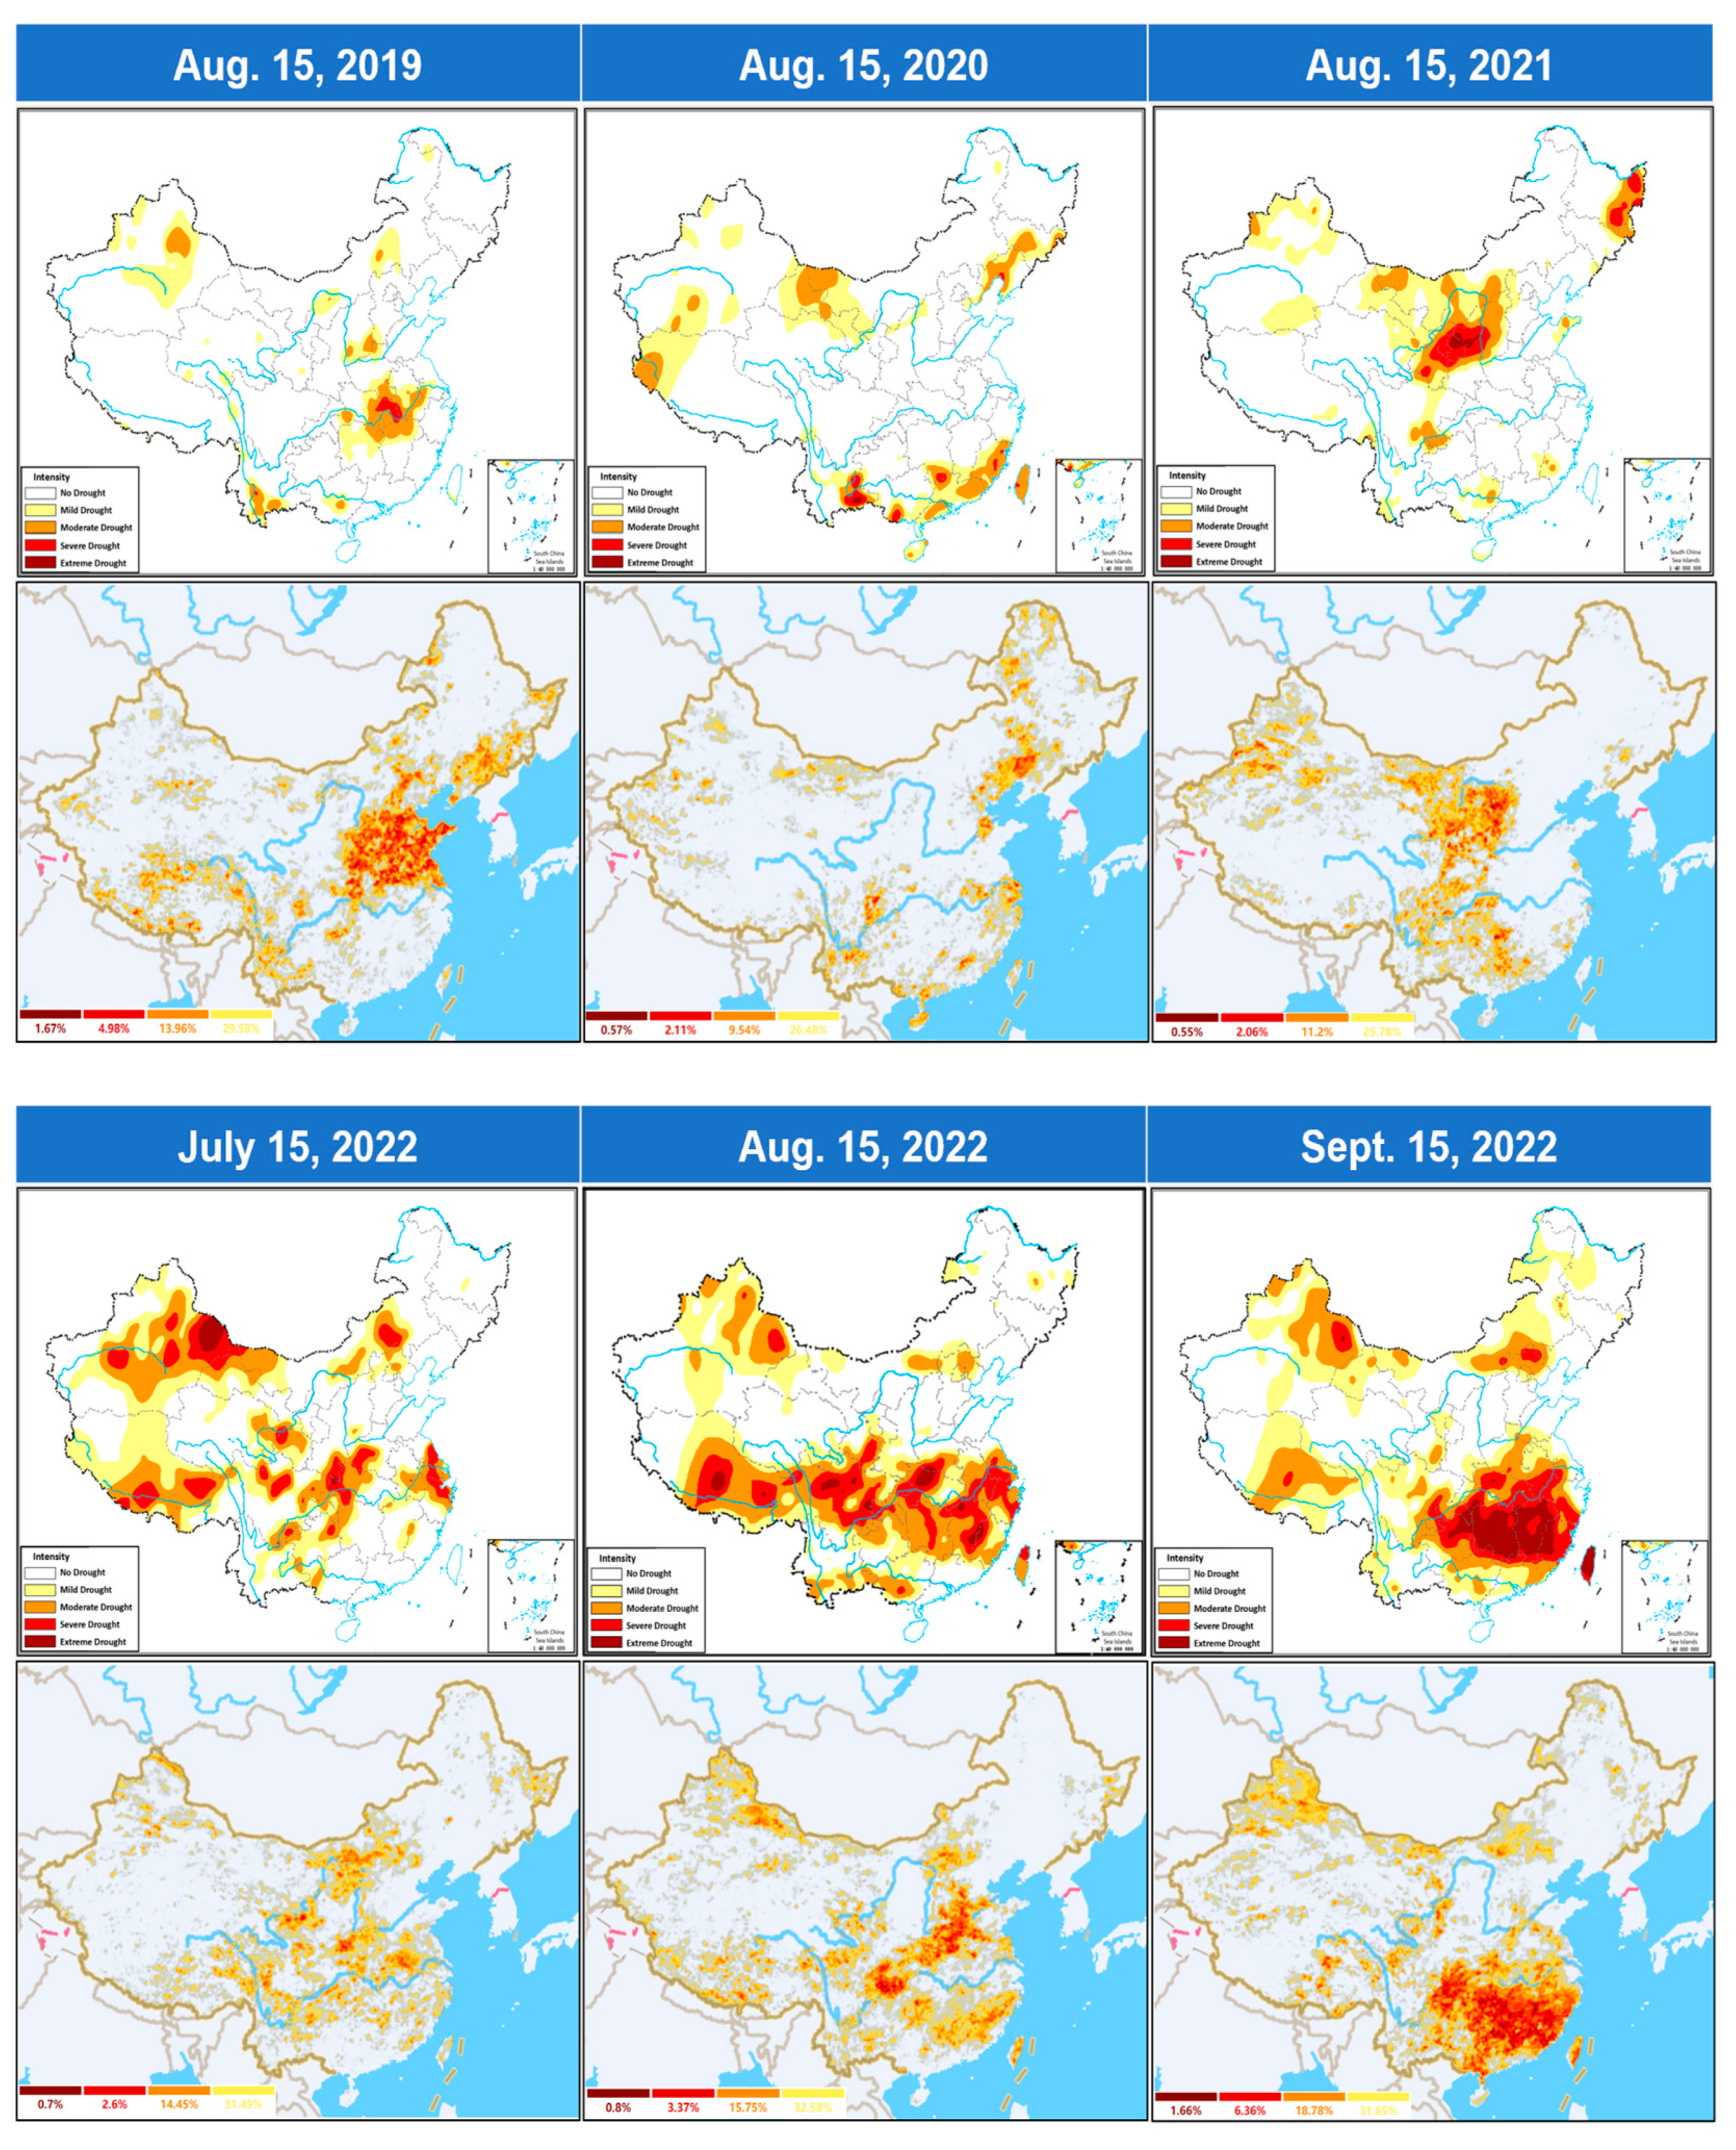
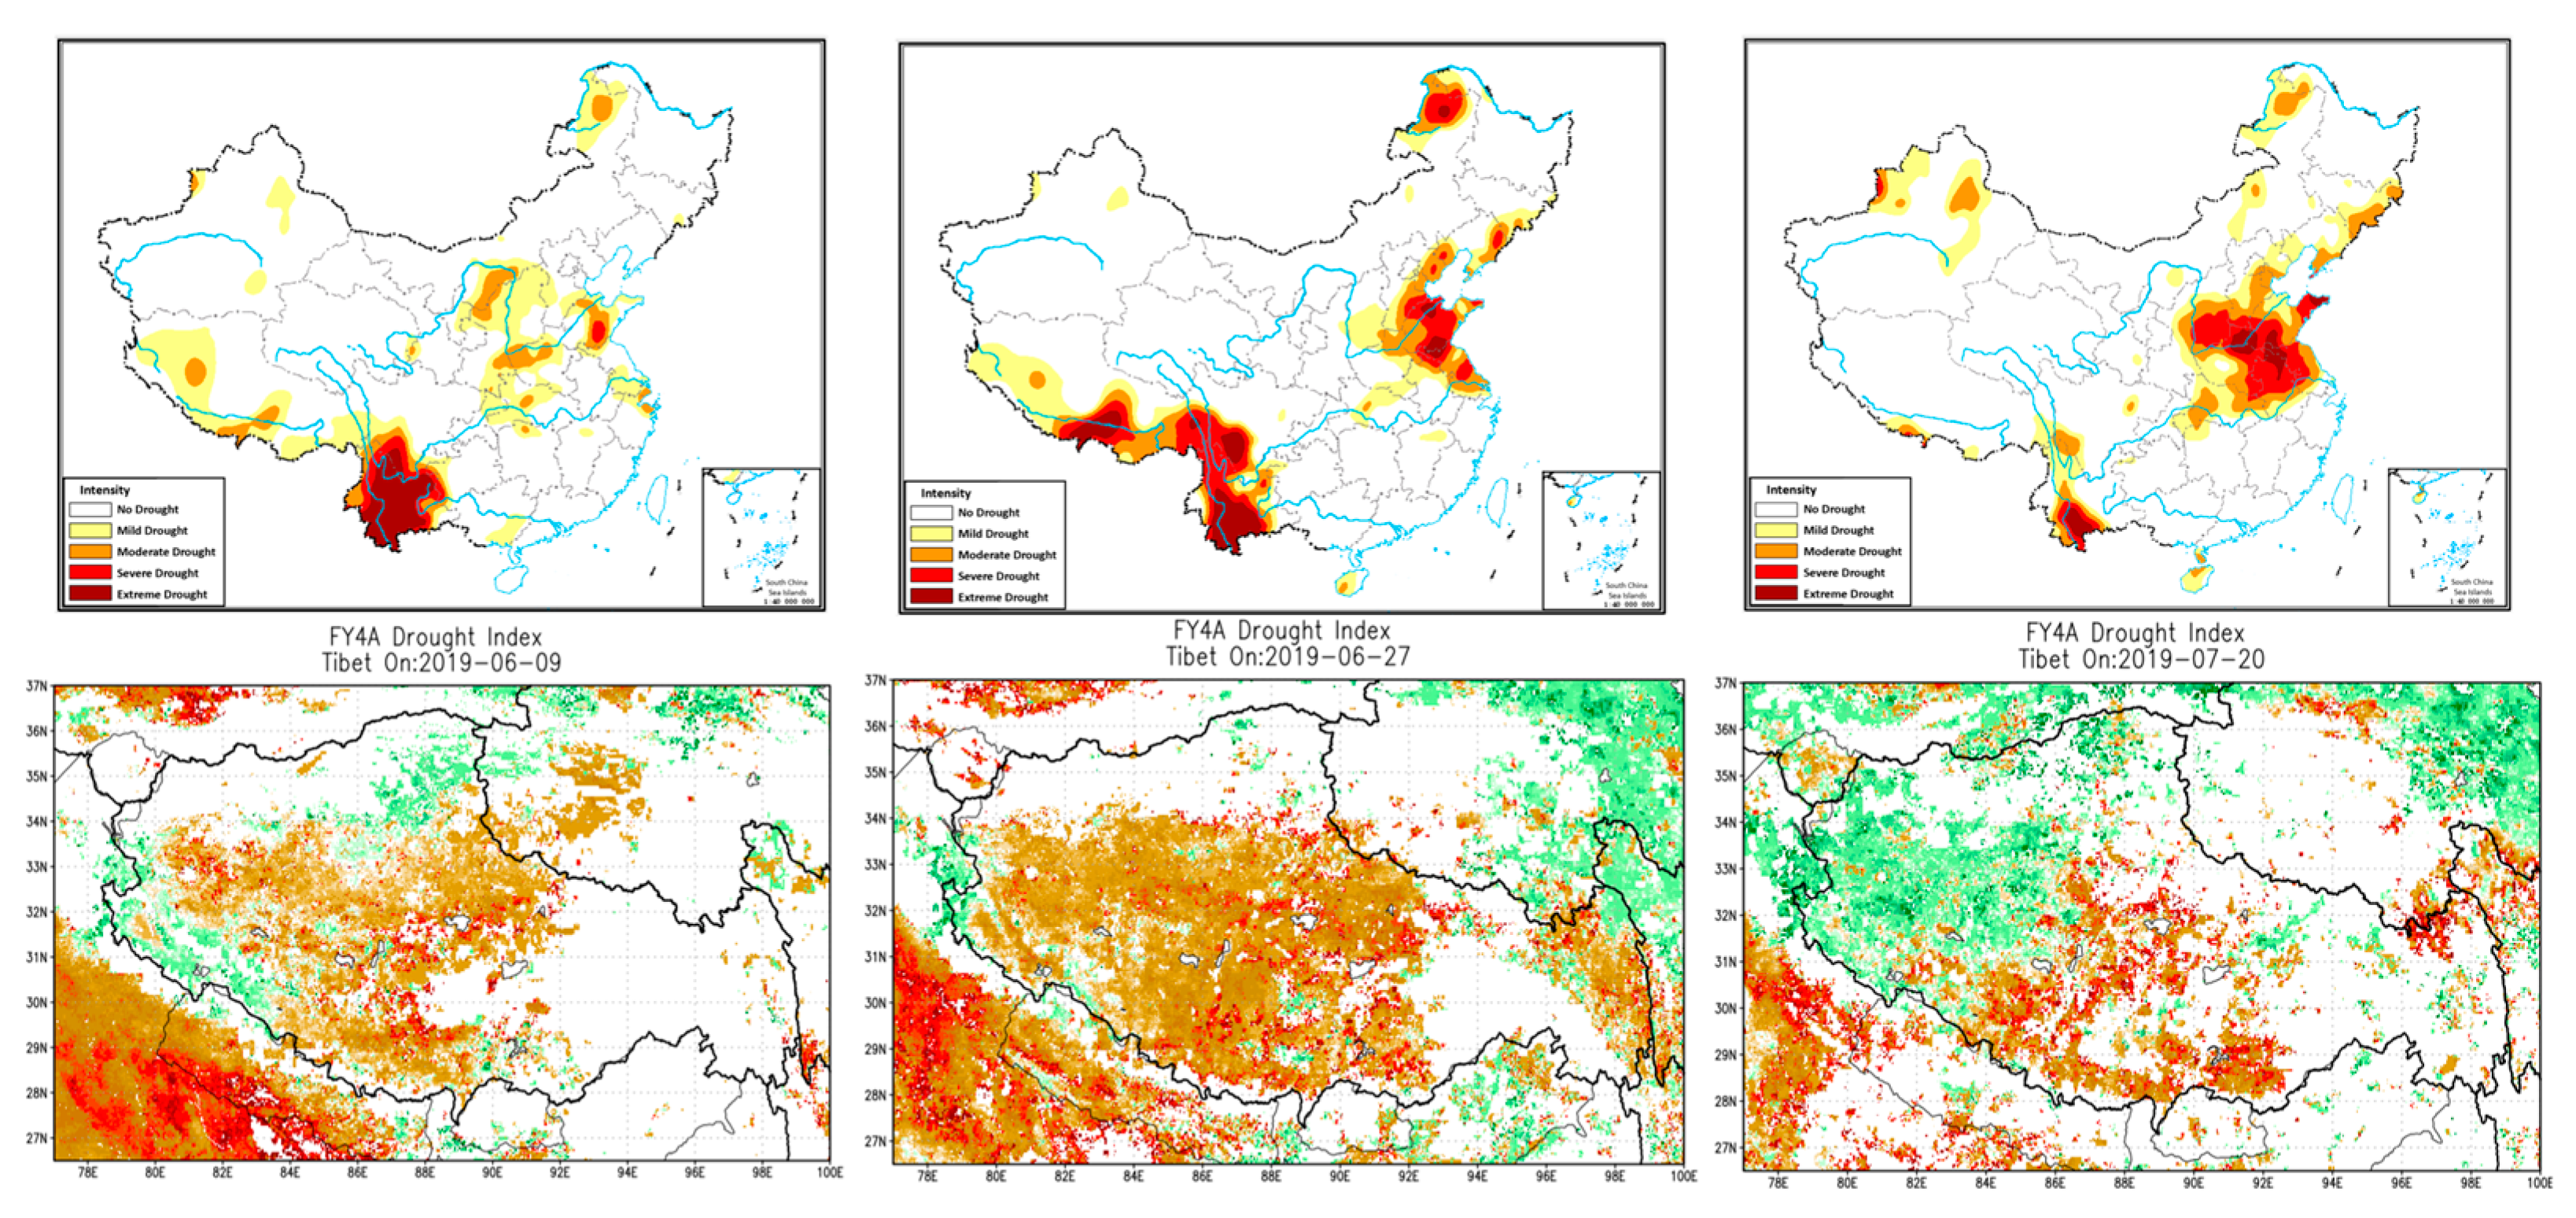
A larger range of drought in Tibet was detected by the satellite remote sensing product than was monitored by the MCI index in 2019. The discrepancy is further analyzed in
Section 4.3.1.
Both products showed good agreement in displaying drought events scattered in Inner Mongolia, Xinjiang, and southern regions in 2020. Notably, the 2021 drought in the Yellow River Basin was simultaneously captured in both products, underscoring their consistency and reliability in tracking significant drought events across various regions.
In the summer of 2022, China experienced the most severe drought since 1961. Both drought products consistently showed a worsening trend in the Yangtze River Basin from July to September, despite certain differences in the classification of localized drought severity.
4.2. Results of Quantitative Analysis
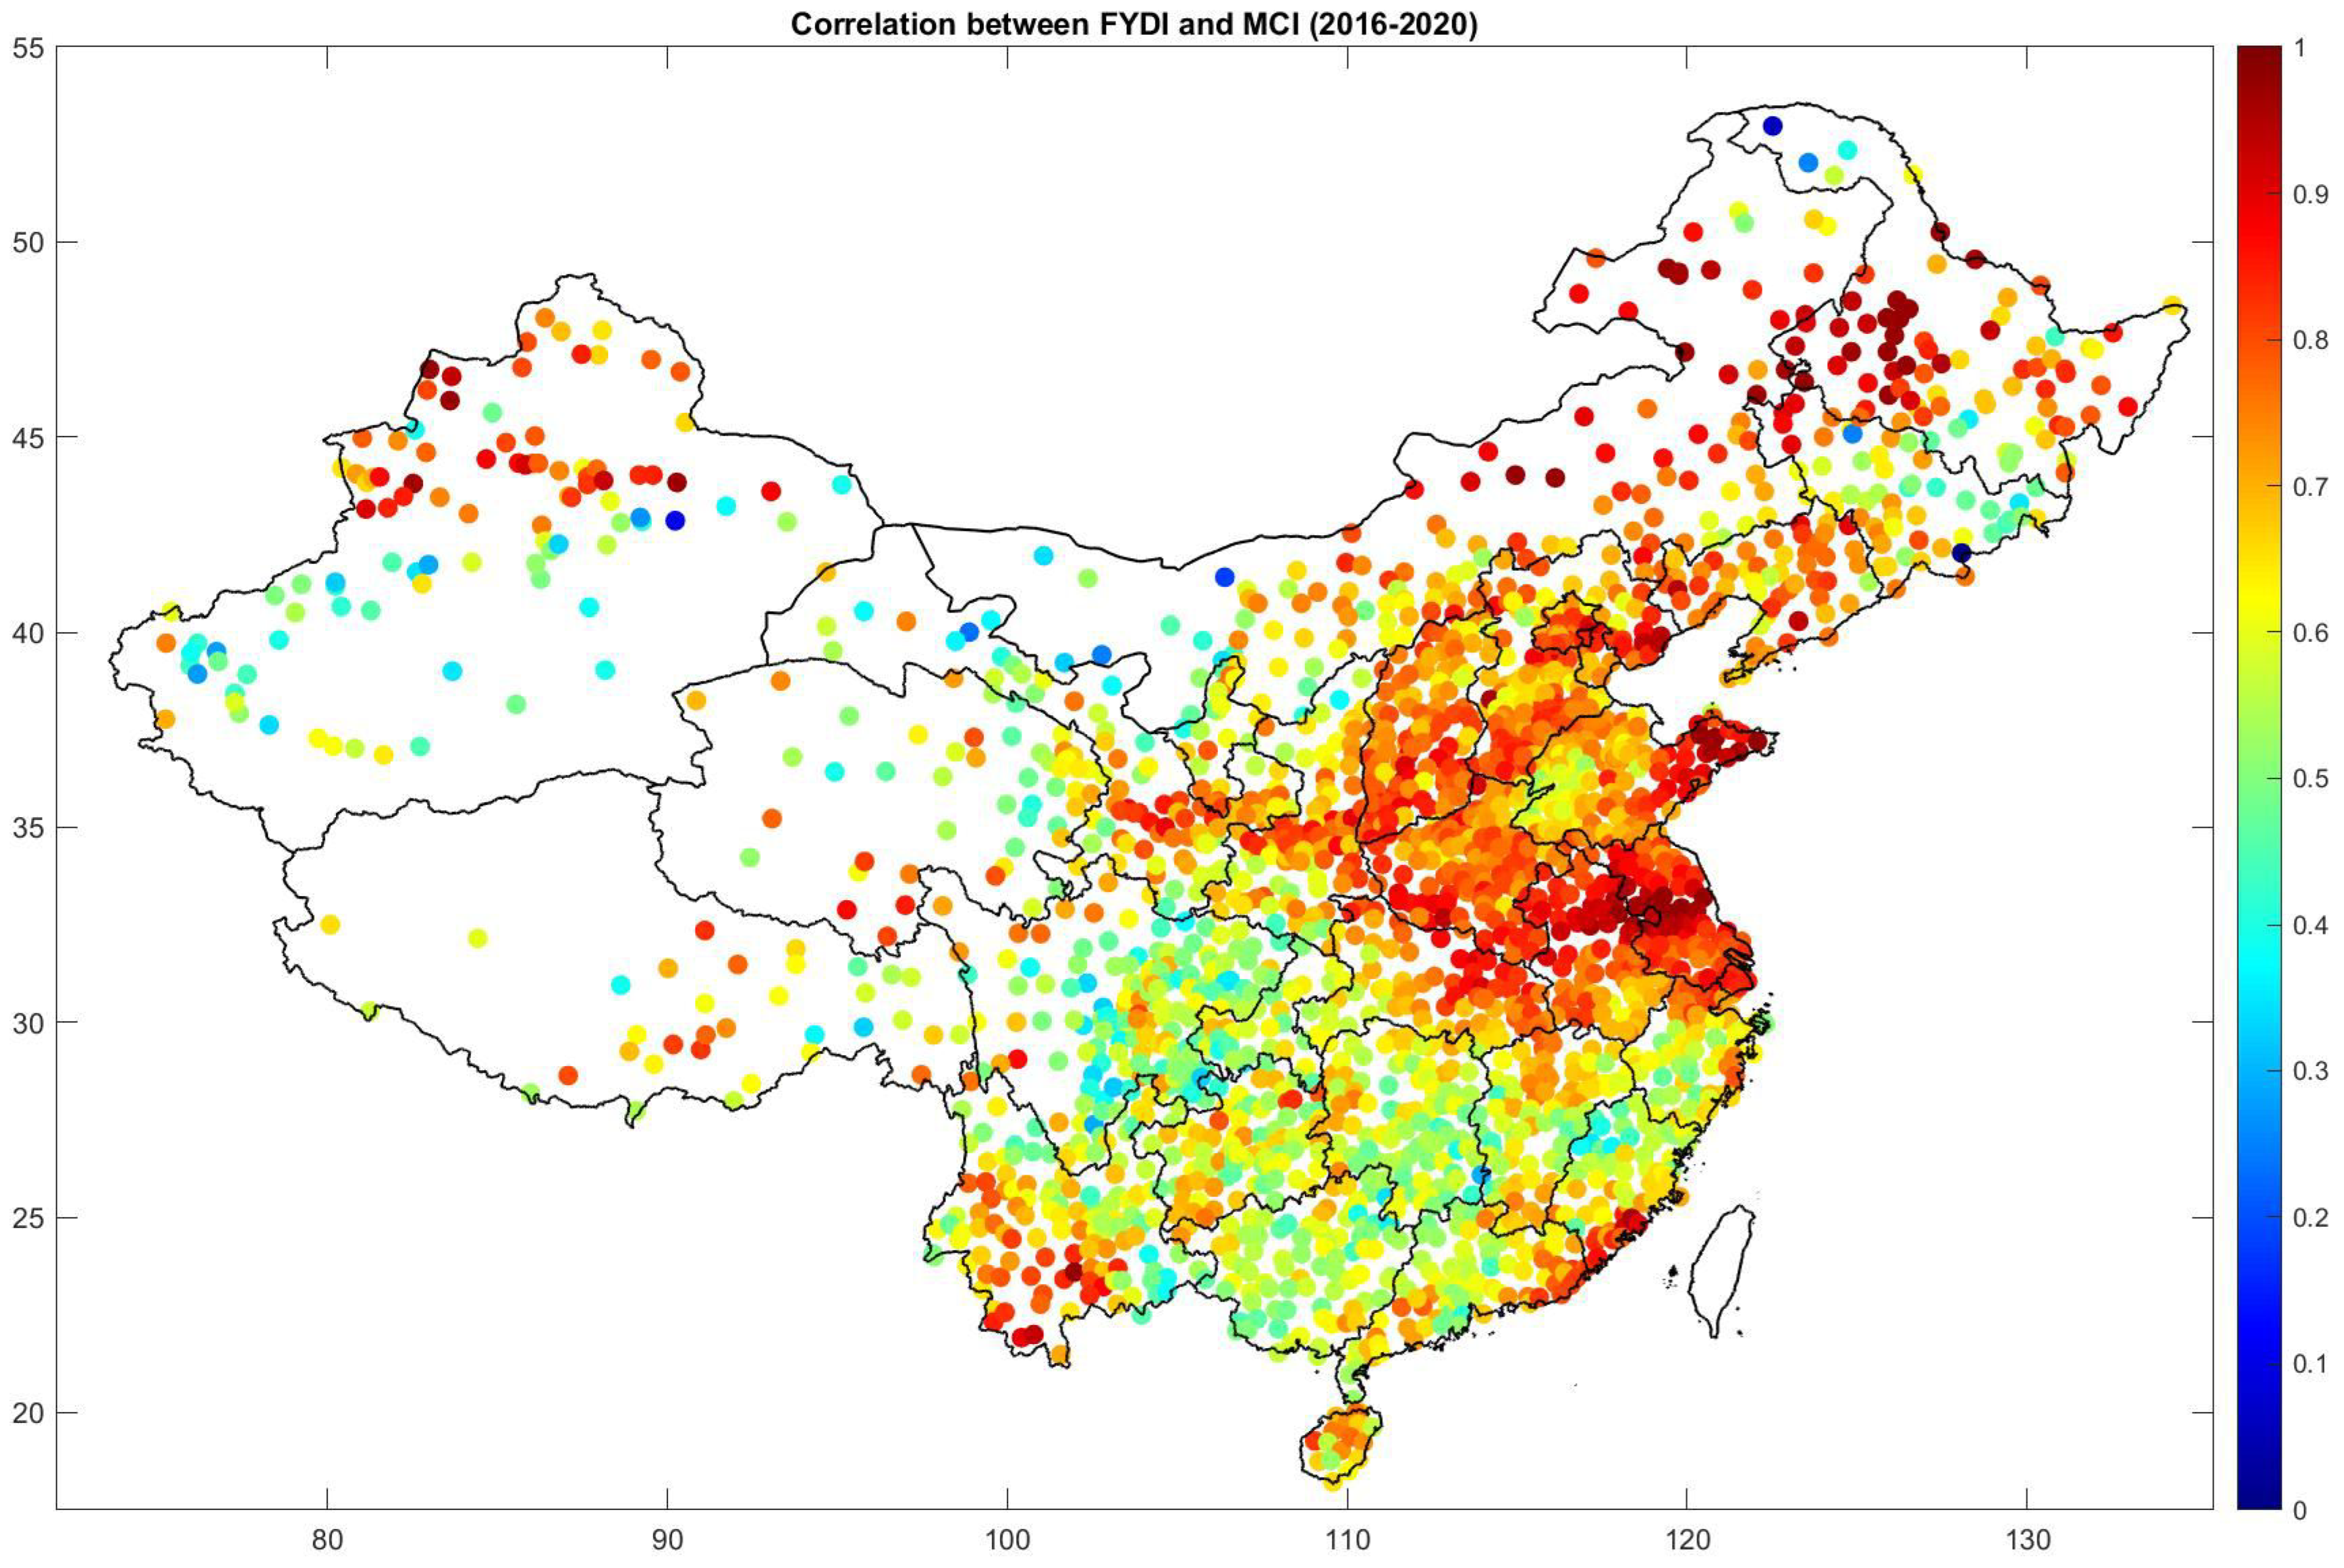
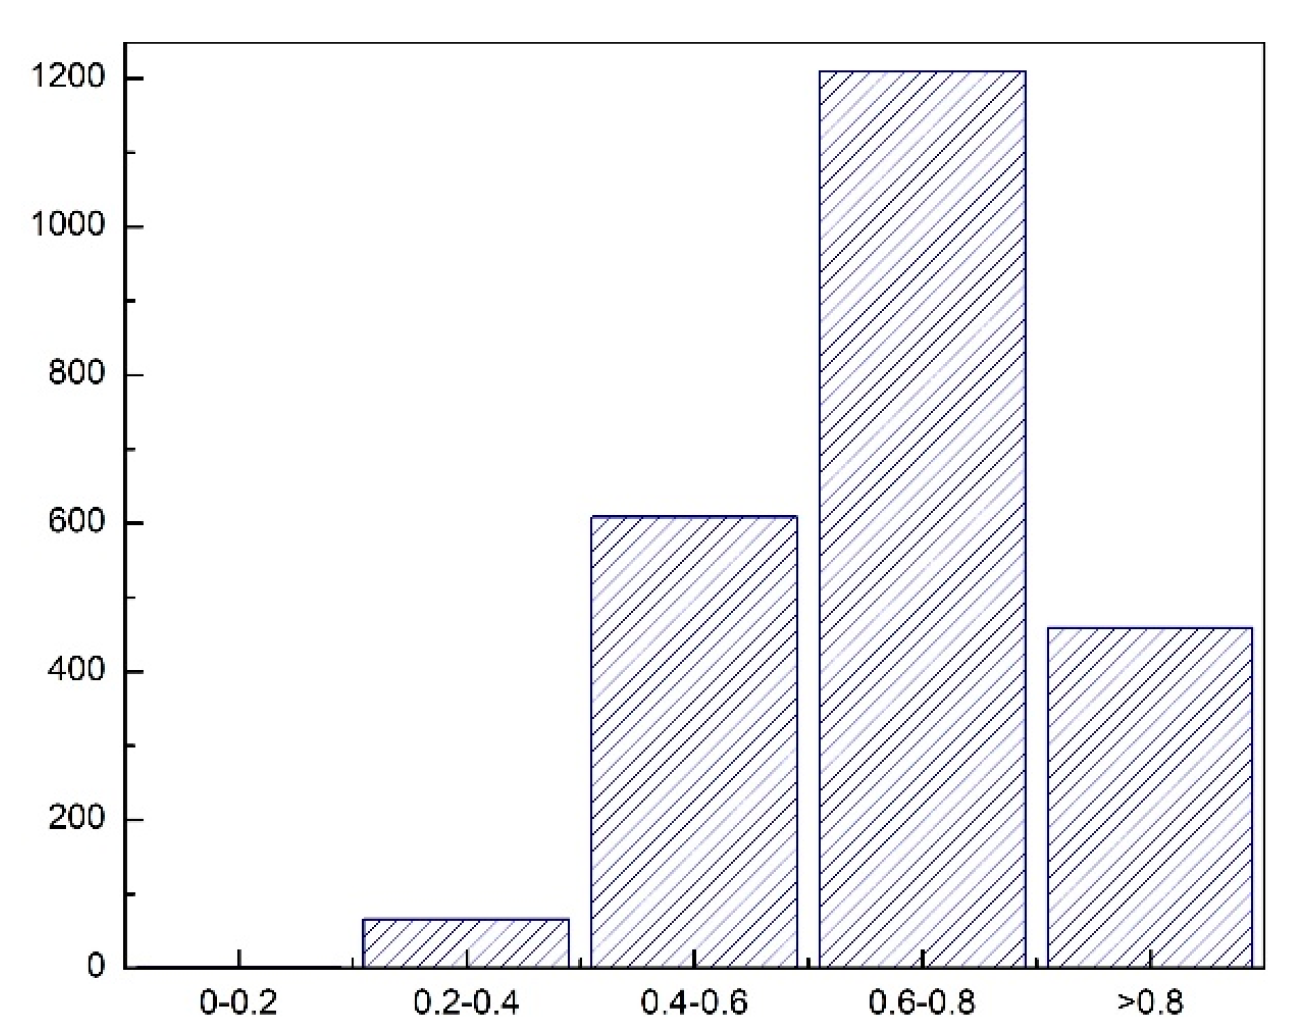
From a quantitative analysis perspective, the FY remote sensing drought index was extracted from 2343 sites from 2016 to 2020, according to the latitude and longitude of the MCI sites using the nearest neighbor algorithm. The time series of the FYDI index was then correlated with the MCI drought index, and correlation coefficients were calculated over all the individual validation sites. The distribution of the ground stations and their corresponding correlation coefficients are shown in
Figure 5, and the histogram of the correlation coefficient is shown in
Figure 6.
The results reveal an average correlation coefficient of 0.679 for the two groups of drought indices, with over 71.2% of the sites having a correlation coefficient greater than 0.6. Consistency was notably higher in northeastern and northern China than in central and southern China. Sichuan Province showed a significant difference between the two products, with an average time series correlation coefficient of less than 0.5. In Xinjiang Province, the consistency of the two products at sites in the northern part is generally higher than at sites in the southern part.
To analyze the impact of land surface types on the differences between the two products, we further classified the correlation coefficients according to land surface types, and the statistical results are shown in
Figure 7. Among the 13 types of land surfaces excluding water bodies, sites with an average correlation coefficient of less than 0.68 are concentrated in three types of land surfaces (evergreen coniferous forests, deciduous broad-leaved forests, and bare soil), while the consistency of the two products on other land surface types is relatively high. In order to elaborate on the distribution of land types characterized by low correlation coefficients, the spatial distribution of land types exhibiting lower correlations is shown in
Figure S1. The maps include Land type 2: Evergreen Needleleaf Forest; Land type 5: Deciduous Broadleaf Forest; and Land type 13: Bare Soil. The figure clearly demonstrates that the lower correlation coefficients are predominantly found in regions where these land types are prevalent. For instance, regions like Fujian and Guangxi provinces show notably lower correlations, particularly over areas with dominant evergreen needleleaf forests. This analysis suggests that a normalization correction using the MCI as a reference could potentially enhance the inversion accuracy of the remote sensing product in specific land surface types.
4.3. Advantages of FY Satellite-Based Drought Product
4.3.1. Superior Spatial Resolution
The two-dimensional MCI drought map is derived from the observed MCI index over discrete ground sites. Thus, in regions with high site density, such as eastern China (see
Figure 5), the interpolation effect is satisfactory. However, in sparsely covered areas like the western regions (including Xinjiang and Tibet Provinces), the interpolation effect is unsatisfactory, leading to a gradient or hotspot representation of drought events. Conversely, the FY remote sensing satellite drought product offers a spatial resolution of 4 km, being able to provide more detailed spatial distribution characteristics in these sparsely populated areas. Two specific cases—a drought event in Tibet in summer 2019 and one in the northwestern region in September 2020—are presented to illustrate the superior spatial resolution of remote sensing products.
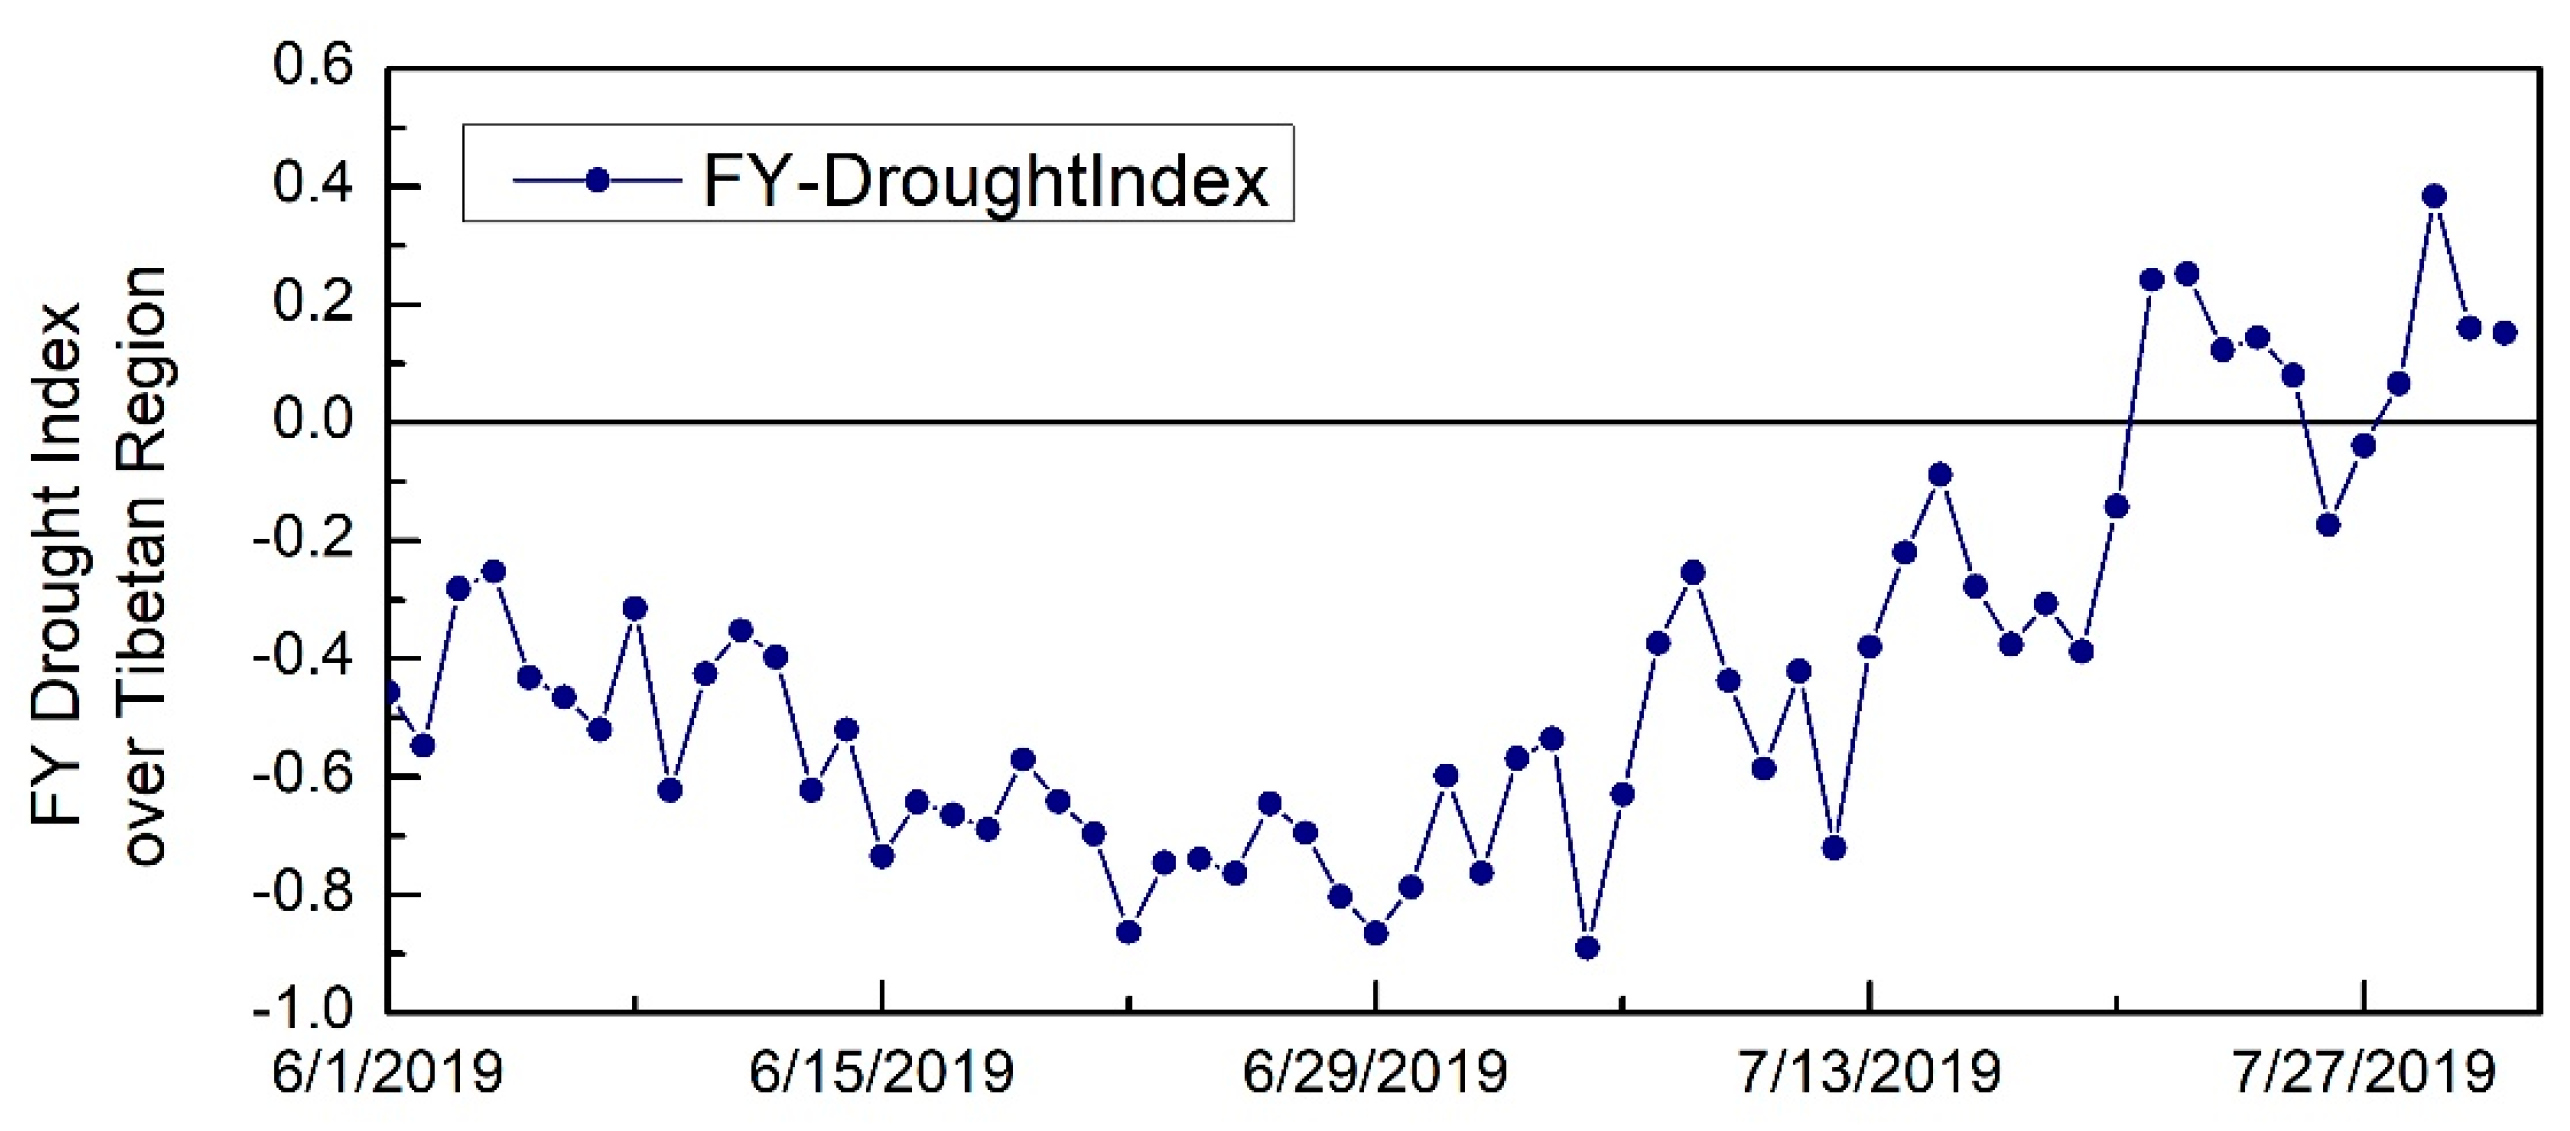
The climate report of the Tibet Autonomous Region highlighted that the annual precipitation in most parts of Tibet was three levels below the average in 2019, and the region entered the rainy season on 4 July—27 days later than usual. The time series analysis of the FYDI from June to July for Tibet (
Figure 8) reveals a gradual intensification of the drought from early June, which started to ease in early July. After each rainfall event, there was a step-by-step rise, and it was not until late July that the impact of the drought was alleviated. The satellite data align closely with this reported drought trend.
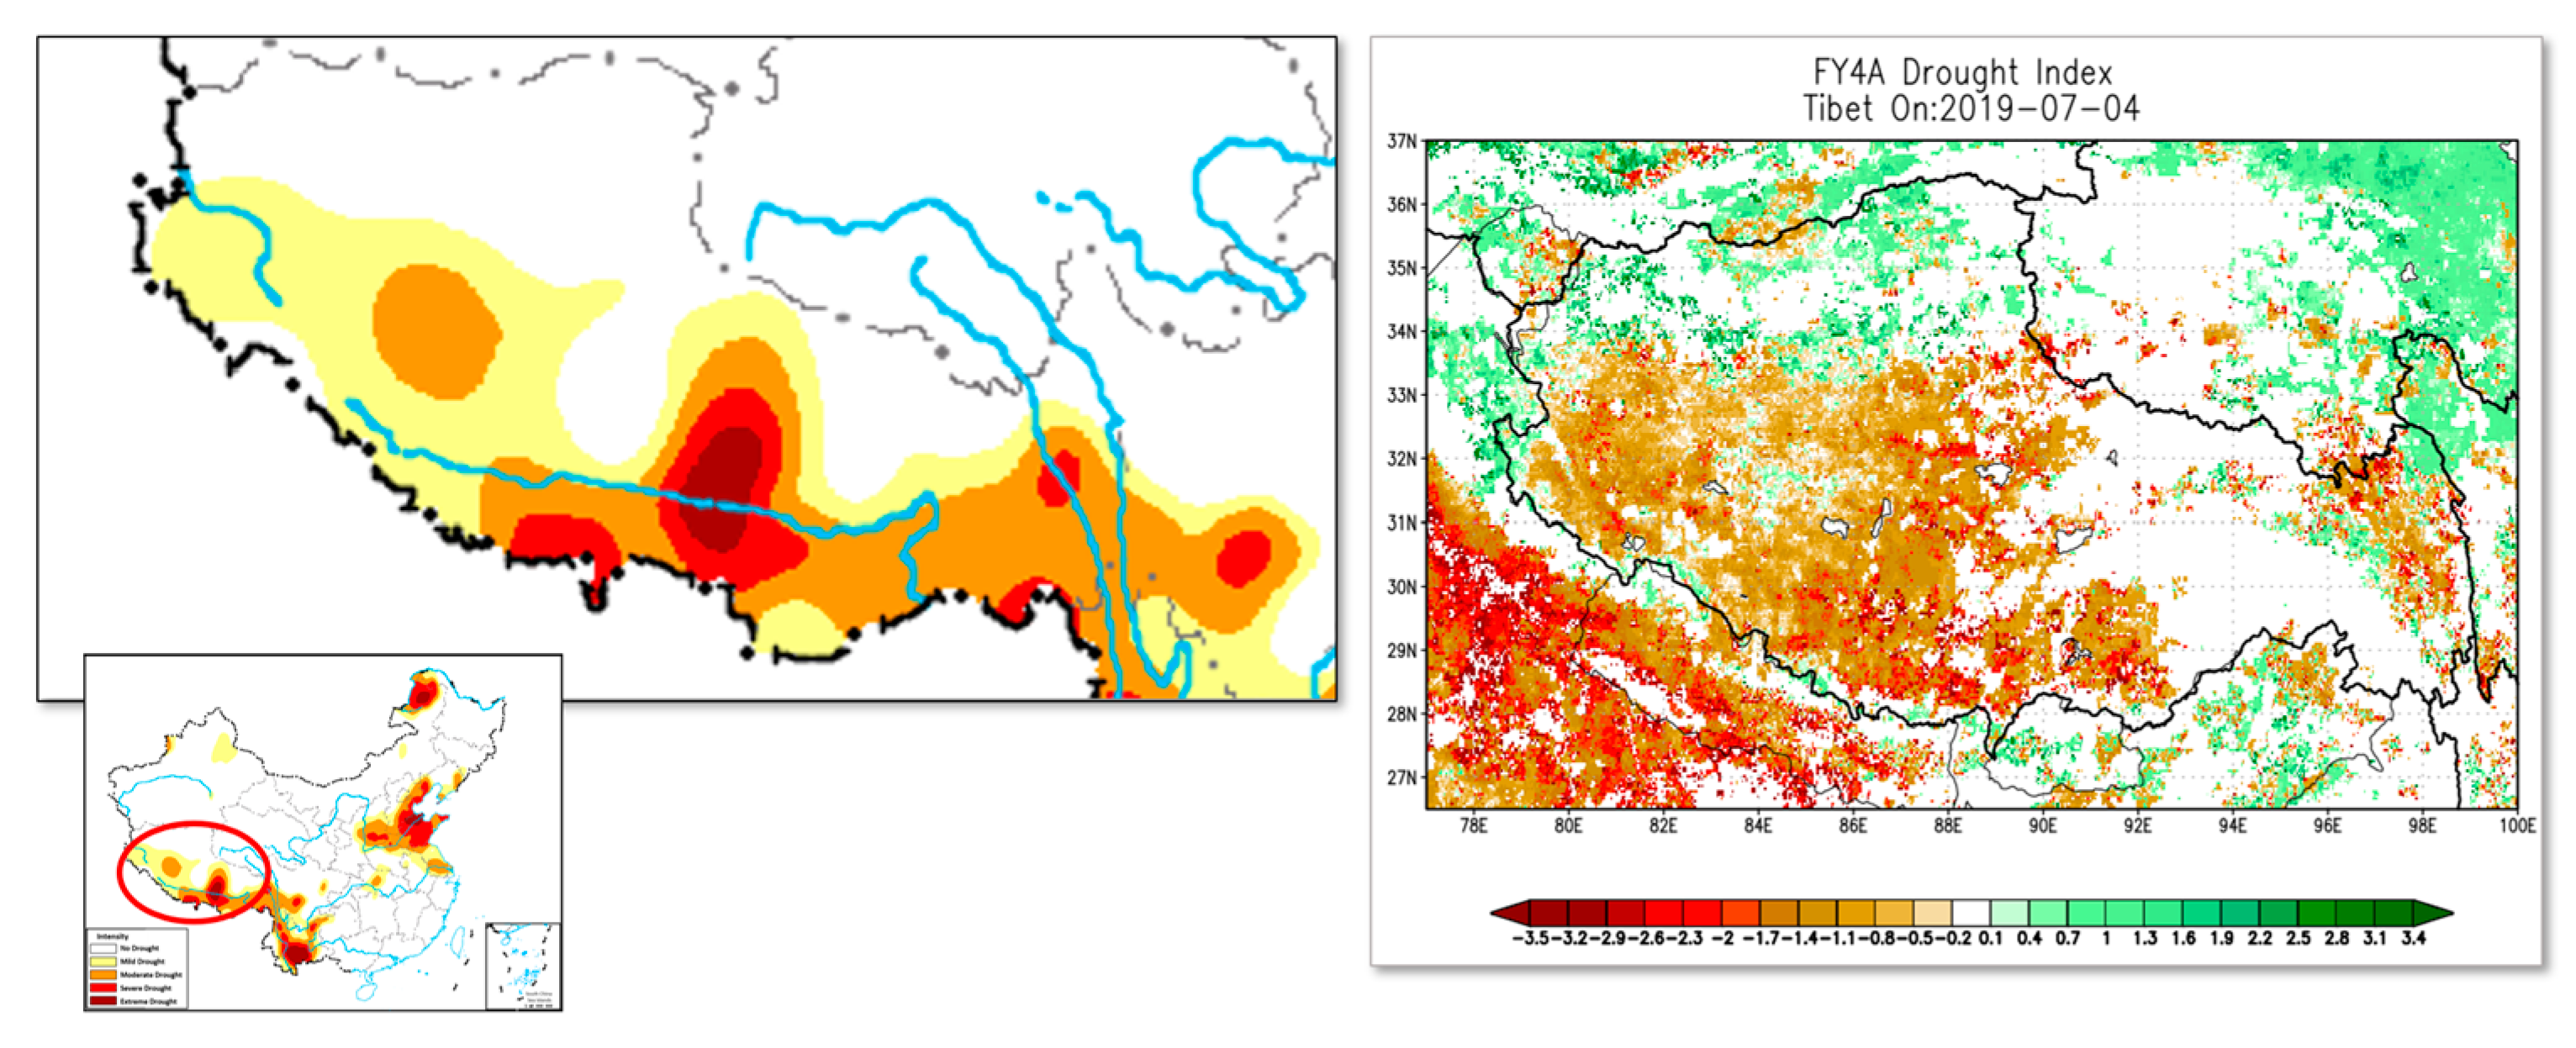
Figure 9 compares the MCI drought index with the FY remote sensing product’s drought distribution in Tibet on July 4, while the MCI drought map displays a point-like hotspot distribution in the northwest of Tibet due to the insufficient representativeness of ground sites. The high-resolution remote sensing product offers a more granular depiction of the drought distribution.
Figure 10 presents the 2019 Tibet drought starting in early June (left), reaching its peak at the end of June (middle), and gradually easing a month later (right). It presents a comparative view of the MCI drought map (top row) and the FYDI product (bottom row), illustrating the striking difference in their ability to display spatial details during the 2019 Tibet drought.
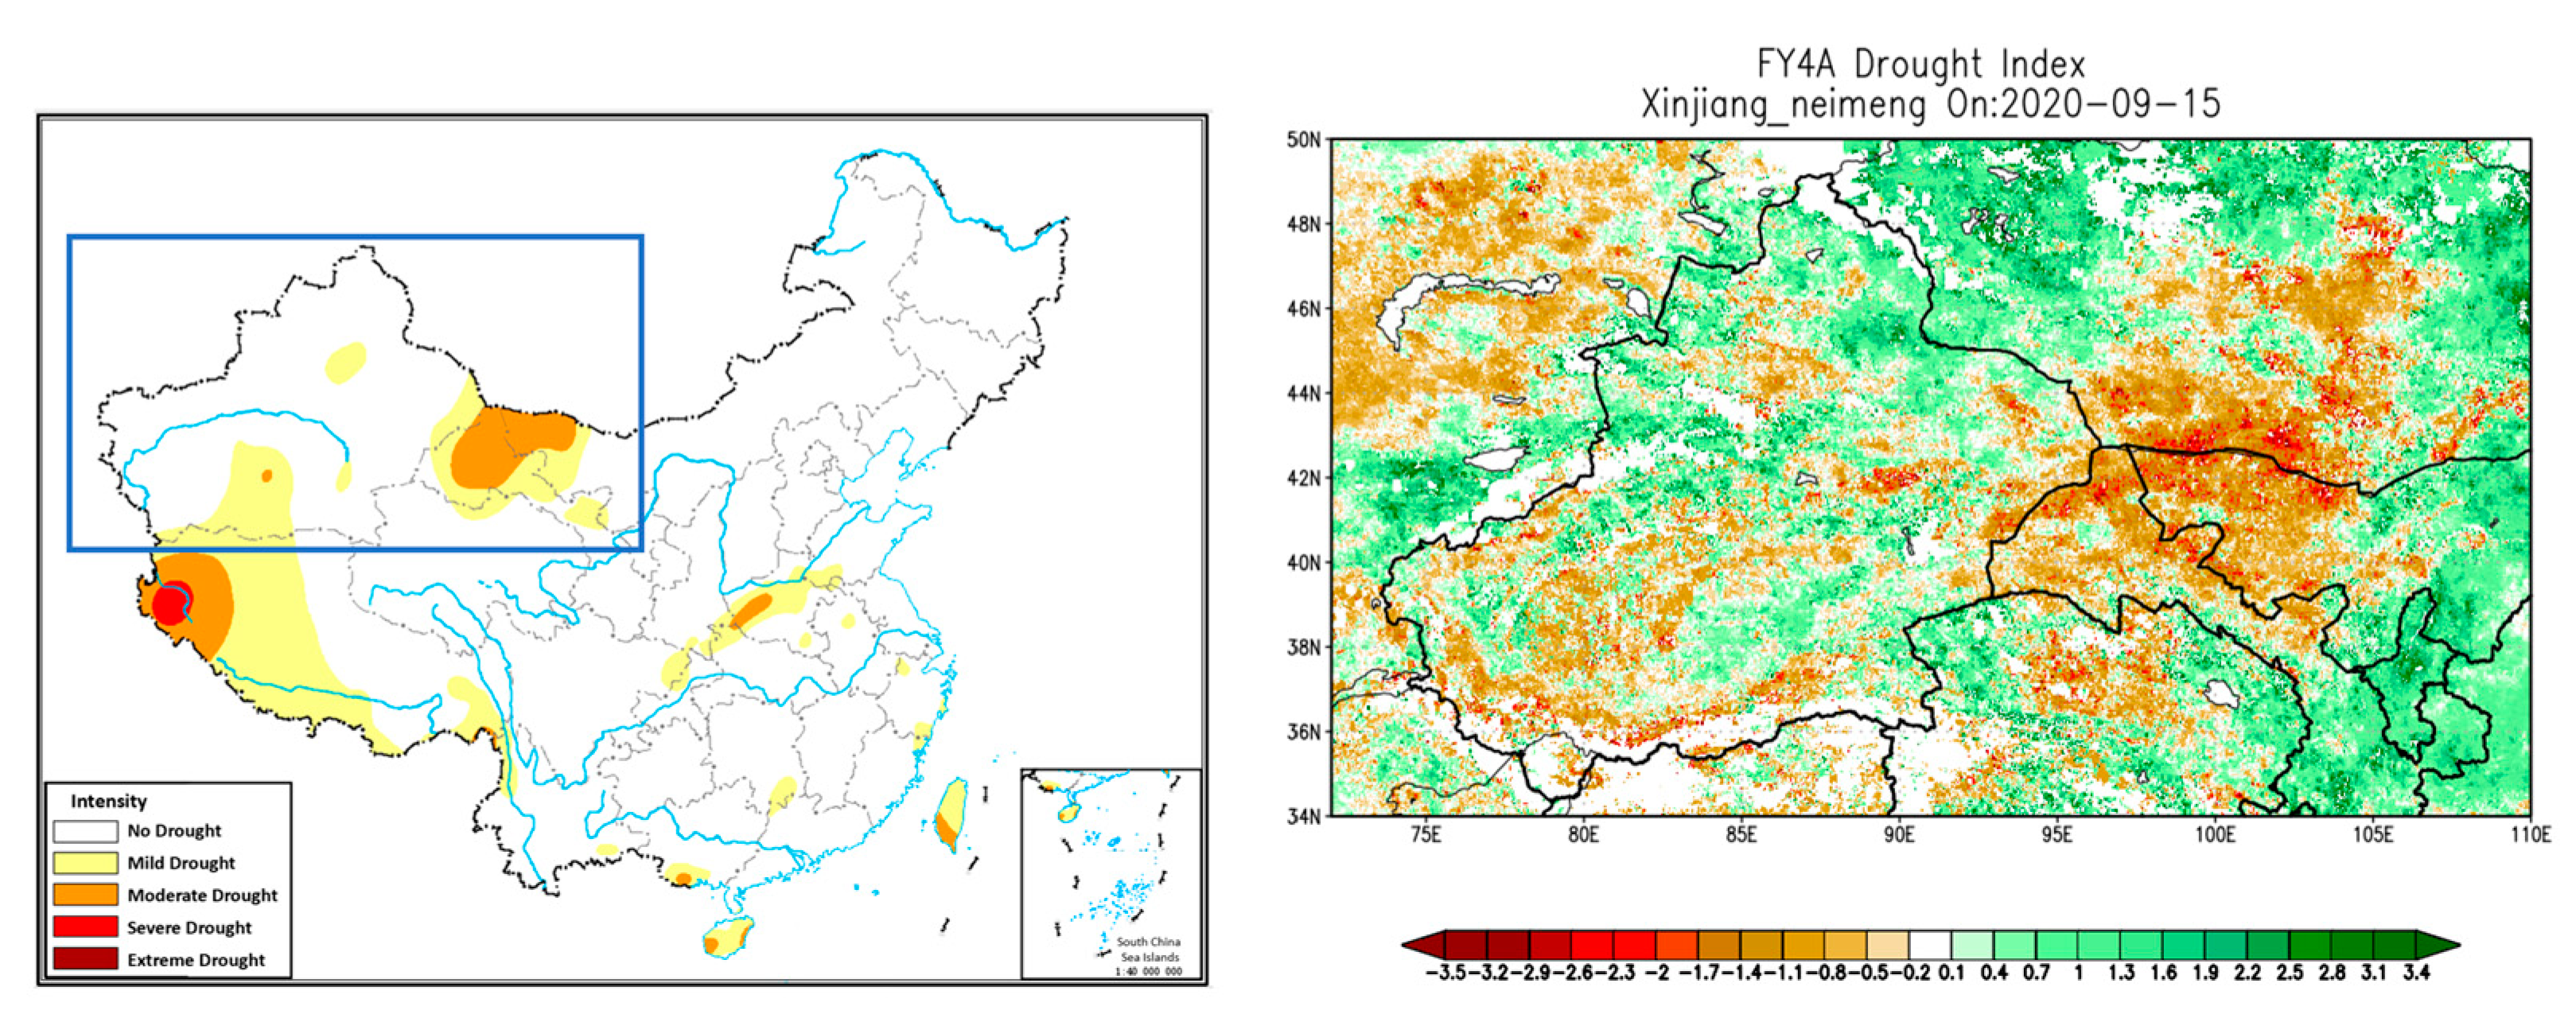
Another case in
Figure 11 showcases a drought event in the northwest region in 2020. This instance supports the earlier conclusion that satellite remote sensing products can present a more detailed distribution of drought levels in areas such as Urumqi, Xinjiang, and the northwest part of Gansu. The most severe drought areas—including the northwest corner of Gansu, the northwest corner of Inner Mongolia, and the border with Mongolia—are highlighted, showing a level of detail that is challenging to achieve with the interpolated MCI drought maps where site deployment is sparse.
4.3.2. Independent of Empirical Parameters for Models
Satellite remote sensing leverages thermal observations from FY satellites and meteorological inputs to estimate real-time evapotranspiration and moisture metrics, eliminating the need for supplementary empirical parameters. In contrast, the ground-based MCI drought index incorporates a series of empirically adjusted parameters, which may vary based on season, region, or land type.
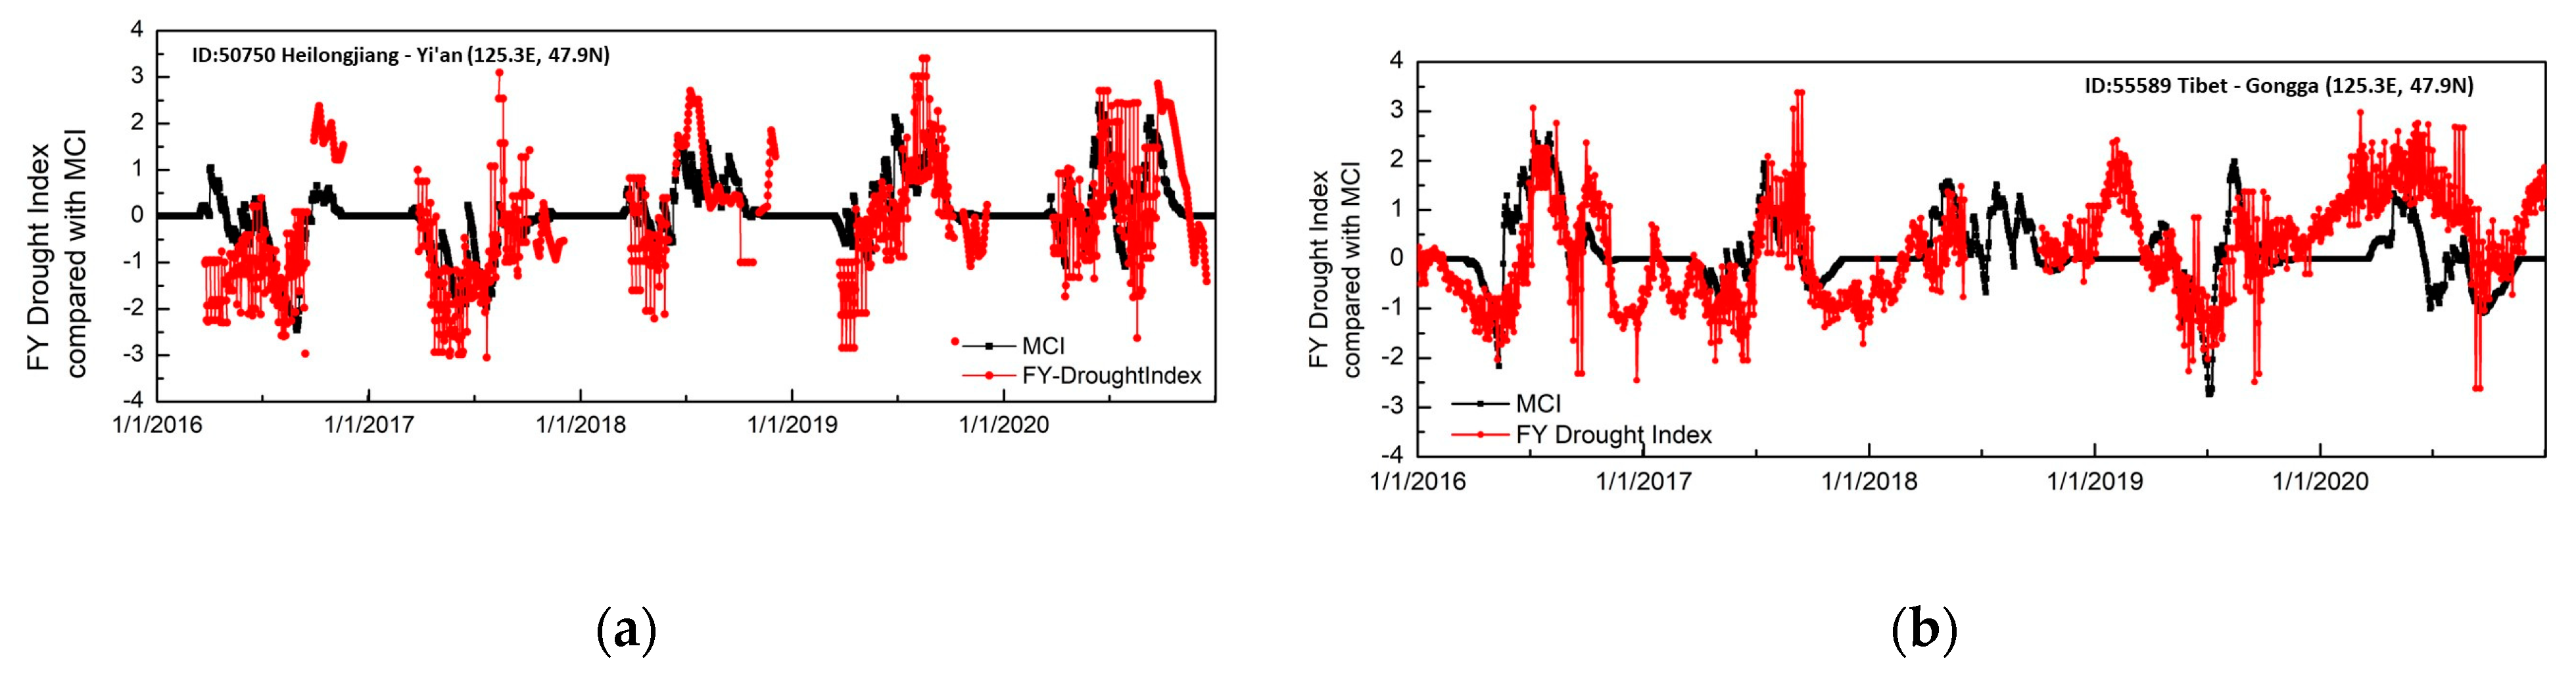
When comparing this with the ground-based MCI meteorological composite index, we observed notable variances in China’s northeastern high-latitude and northwestern plateau regions where permafrost is prevalent. Specifically, the composite index’s readings are swayed by the seasonal adjustment coefficient, Ka. During instances of potential snow cover or the presence of permafrost, it is adjusted down to a flat zero. For instance, as depicted in
Figure 12a for the Heilongjiang station, the MCI consistently reads 0 throughout the winter. In these durations, dictated by the Ka coefficient adjustments, FY remote sensing-based products often revert to default values. Yet, in another location, as shown at the Gongga station in Tibet (
Figure 12b), the presence of snow or permafrost is not a constant during winters. Here, remote sensing continues to capture valuable signals, indicating fluctuating evapotranspiration and drought surface conditions as winter progresses.
This comparison indicates that the setting of the seasonal parameter Ka on certain surface types limits the accurate monitoring of the actual surface conditions. It is worth noting that Ka is merely one amongst a suite of empirical parameters, highlighting the pronounced edge that satellite-derived products hold in this domain.
5. Conclusions and Discussion
This study has assessed and compared the performance of the FY remote sensing satellite drought product and the ground-based MCI in monitoring drought events. Both qualitative and quantitative cross-validations were carried out to investigate the consistency between these two products.
Qualitative analysis revealed a high degree of consistency between the FY and MCI products in terms of spatial distribution and timing of drought events over a ten-year period from 2013 to 2022. Despite some discrepancies in specific regions or years, the two products demonstrated commendable agreement in most cases.
Quantitative analysis further solidified these findings, with an average correlation coefficient of 0.679 among 2343 sites from 2016 to 2020. We observed higher consistency in northeastern and northern China compared with central and southern regions. Notably, the correlation differed across various land surface types, indicating the potential for adjustment of remote sensing inversion model coefficients for specific land types.
One major advantage of the FY satellite product is its superior spatial resolution, particularly in sparsely populated regions such as Tibet and Xinjiang. While the MCI product, reliant on ground-based measurements, tends to show a gradient or hotspot representation of drought in these areas, the FY satellite product can more finely delineate the spatial distribution of drought events. However, we also found instances where the FY product did not issue a drought warning due to data limitations, indicating potential areas for further improvements.
Although the verification results show that the FY drought product can accurately monitor the scope and severity of droughts over a prolonged period, there remains potential for further enhancement, especially when backed by substantial ground station data. We observed that the consistency between the FYDI and the MCI was significantly higher in the northeastern and northern regions of China compared with the central and southern regions. One contributing factor to this variation is data availability, influenced largely by regional climate characteristics. As illustrated in
Figure S2, the sample sizes, where the satellite-based FYDI and the MCI both have valid estimates, in provinces like Guizhou, Chongqing, and Sichuan are much smaller compared with coastal areas. These regions are characterized by abundant rainfall, high humidity, and frequent cloudiness, leading to substantial cloud cover impact. Interestingly, some areas with smaller sample sizes, such as the northeastern provinces in China and the north of Xinjiang Province, exhibit higher correlations. Upon further analysis, we determined that land type is a crucial factor influencing the consistency between the two drought products.
In our next steps, we intend to use the MCI index from ground stations to make parameter adjustments to the FY drought algorithm, aiming to further refine the accuracy of the remote sensing inversion index. Concurrently, the dynamic monitoring of remote sensing can also correct the empirical parameters set during the MCI composite index calculation, like some that are consistently set based on seasonality. As pointed out in
Section 4.3.2, there are cases in permafrost regions where the MCI index is constrained by these empirical parameters. Our ultimate goal is to fully integrate the strengths of both real-time remote sensing observations and precise ground station point measurements, allowing them to complement and boost each other, thus enhancing the precision of drought monitoring.
In conclusion, the new FY satellite-based drought product, with its remarkable spatial resolution and substantial correlation with the MCI index, emerges as a robust tool for drought monitoring. Nevertheless, it is vital to continue refining and cross-validating these products to enhance their accuracy and representativeness, ultimately improving our capacity to monitor and respond to drought events on a global scale.

 ,
, 