Article

Climatic and Anthropogenic Contributions to Vegetation Changes in Guangdong Province of South China

1
Guangdong Provincial Key Laboratory of Remote Sensing and Geographical Information System, Guangdong Open Laboratory of Geospatial Information Technology and Application, Guangzhou Institute of Geography, Guangdong Academy of Sciences, Guangzhou 510070, China
2
Center for Natural Resources Policy Survey and Evaluation of Jiangxi Province, Nanchang 330025, China
*
Author to whom correspondence should be addressed.
Remote Sens. 2023, 15(22), 5377; https://doi.org/10.3390/rs15225377
Submission received: 31 August 2023 / Revised: 24 October 2023 / Accepted: 25 October 2023 / Published: 16 November 2023
(This article belongs to the Topic Urban Forestry and Sustainable Environments)

Abstract

:
How to distinguish the relative role of climate change and human activities in vegetation dynamics has attracted increasing attention. However, most of the current studies concentrate on arid and semiarid regions, while the relative contributions of climate change and human activities to vegetation changes remain unclear in warm-humid regions. Based on the normalized difference vegetation index (NDVI) and climatic variables (temperature, precipitation, radiation) during 2001–2020, this study used the Theil–Sen median trend analysis, partial correlation analysis, and residual trend analysis to analyze the spatiotemporal pattern of vegetation trends, the response of vegetation to climate variations, and the climatic and anthropogenic contributions to vegetation dynamics in the warm and humid Guangdong Province of south China. Results showed that the NDVI in most areas exhibited an increasing trend. Changes in climatic variables displayed different spatial variations which, however, were not significant in most areas. Vegetation responded diversely to climate change with temperature as the most important climatic factor for vegetation improvement in most areas, while precipitation was the dominant climatic factor in the southern edge region and radiation was the dominant climatic factor in the central and western regions. Vegetation in most areas was influenced by both climate change and human activities, but the contribution rate of human activities was commonly much higher than climate change. The findings of this study are expected to enhance our understanding of the relative climatic and anthropogenic contributions to vegetation changes in warm-humid regions and provide a scientific basis for future ecological policies and ecosystem management in highly urbanized regions.

1. Introduction

Terrestrial ecosystems are significant global carbon stocks and carbon sinks, and vegetation variations are highly related to carbon budgets [1,2,3,4]. Vegetation change is a complex process affected by various natural and anthropogenic factors [5,6,7]. Hence, disentangling the driving forces of vegetation dynamics is essential for understanding carbon balance and developing adaptive strategies.
As one of the few countries where vegetation has significantly improved since 2000, China leads the global greening [8]. Specifically, forests in the southern part and croplands in the central part of China display the most obvious greening trend. Contrary to naturally vegetated areas, the urbanization process usually causes vegetation degradation in many regions [9,10,11]. However, recent studies indicate that urban vegetation growth enhancement is also widely observed in Chinese and worldwide cities [12,13]. Thus, vegetation changes in urban areas are much more complicated than in undisturbed areas. Previous work found that vegetation improvement happened in urban cores, while vegetation degradation occurred in newly developed peripheries in the Guangdong–Hong Kong–Macao Greater Bay Area urban agglomeration [14]. Vegetation dynamics are attributed to numerous driving forces, which are generally concluded as two categories: climate change and human activity [15,16].
Climate variation is extensively believed to have widespread impacts on vegetation change. Across the globe, water availability, temperature, and radiation constrained vegetation growth for 40%, 33%, and 27% of the vegetated areas on Earth, respectively [17]. The increasingly intense dry seasons have caused global vegetation productivity to decrease, and it is projected to potentially reduce by 10–30% in 2100 [18]. Effects of climate change on vegetation vary in different regions and ecosystems [19,20]. For example, worldwide plains are believed to be more vulnerable to climate variability than alpine regions [21]. Temperate broadleaf forest and temperate grassland have a higher sensitivity to extremely low precipitation than other biomes [22]. Crops are more sensitive to water and meadows are more sensitive to temperature in the Heihe River Basin of northern China [23]. Precipitation is the limiting factor of vegetation changes in the northeast and southwest of the Tibetan Plateau, while temperature and the combination of radiation and temperature are the prominent climatic drivers for the mid-east and the south, respectively [24]. Water-limited regions of vegetation productivity are primarily situated in the southern and eastern basins and piedmont plains of the Taihang Mountains of north China, while the northern and central regions with high elevations mainly suffer from low temperatures [25].
The effects of anthropogenic activities on vegetation change have attracted increasing concern in recent decades, particularly for rapidly developing regions [8,9,26,27]. On the one hand, industrialization and urbanization usually cause vegetation degradation and vegetation loss. For instance, forest vegetation decline has lasted for 30 years since the construction of industrial complexes in southern Korea [28]. Urban expansion widely resulted in vegetation degradation around urbanized regions, such as the Beijing–Tianjin–Hebei Region [27], the Yangtze River Delta [5], and the Pearl River Delta and Shantou city of Guangdong Province [9]. On the other hand, ecological projects and land-use management greatly contribute to vegetation greening. During the late 1990s and early 2000s, a series of national ecological restoration programs including The Grain for Green Program, The Natural Forest Protection Program, and The Shelterbelt Development Programs were carried out in China, and ecological restoration measures such as forest planation and mountain closure played a vital role in vegetation improvement [29]. Agricultural intensification and urban green space management such as fertilization and irrigation also dramatically enhanced vegetation greening [8,26].
Since both climate change and human activities have important impacts on vegetation dynamics, how to disentangle their relative contributions has become the focus of concern, especially in recent years. A large number of studies have made remarkable progress on this task and at least two kinds of approaches are proposed and widely used so far. First, statistical techniques and models such as the multiple linear regression model [30], ridge regression [31], structural equation modeling [32], random forest algorithms [33], redundancy analysis [34], geographically weighted regression models [35], and geographical detectors [36,37] are often used to explore the relationship between vegetation indices and their climatic and anthropogenic drivers to quantity the relative role of their influences. These models need both climatic and human-related variables as input data, but the indicators of human activities are usually difficult to obtain and often inconsistent with the spatial resolution of climatic indicators. Hence, the residual trend analysis has been proposed and then widely adopted to distinguish the impacts of climate variations and human activities on vegetation changes without the requirement of human-related data [38,39]. For this residual approach, a regression model is usually established between vegetation indices and climatic variables to obtain the climate-induced vegetation change, and then the residuals of the model are calculated to represent the human-induced vegetation change. Considering the difficulty in obtaining comprehensive data of anthropogenic variables, the residual trend approach has become increasingly popular and has been proven to be an effective method to separate the relative effects of climate variability and human disturbance on vegetation greenness or productivity in many studies [15,16,40,41,42,43]. However, most of these studies focus on arid and semiarid regions where vegetation generally has distinct phenological dynamics and plant growth is obviously limited by climatic factors. Few studies focus on warm-humid regions with vastly different climatic conditions to arid and semiarid ecosystems, so attributing vegetation dynamics in warm-humid regions is beneficial to enrich our understanding of the characteristics and mechanisms of vegetation changes [9].
Guangdong Province, situated in South China with a warm and humid climate, is an important carbon sink with vegetation cover at the forefront of China. Climate extremes in Guangdong are much higher than in most other areas of China [44], and Guangdong Province is one of the most vulnerable regions to climate change [45]. During the past decades, Guangdong Province has experienced a soaring economy and population boom, and land use has changed dramatically, thereby affecting ecosystem services and habitat quality [46,47]. Current studies indicate that the vegetation in Guangdong Province changed significantly during the urbanization process [33]. As such, Guangdong Province is a typical area for studying the combined effects of climate change and human disturbance on vegetation. By taking land use/cover change (LUCC) to represent human activities, previous studies emphasized human activities as the main driving force of vegetation changes and explored how the interaction of climate variations and human activities affected vegetation dynamics in Guangdong Province [9,33]. LUCC is one of the most direct manifestations of human activities, but it cannot reflect all aspects of human activities. Many other human-related activities without LUCC, including the increase in population intensity, improvement of low-quality forests, and management of green space, also have tremendous impacts on vegetation variations. Thus, considering only LUCC may underestimate the influence of human activities on vegetation changes.
This study took Guangdong Province as a case study to (1) investigate the spatiotemporal trends of vegetation and climate, (2) explore the relationships between vegetation and climate, and (3) quantify the relative contributions of climate change and anthropogenic activities to vegetation dynamics. To achieve the above aims, Moderate Resolution Imaging Spectroradiometer (MODIS) Normalized Difference Vegetation Index (NDVI) data during 2001–2020 were collected, and multiple analytical methods and techniques including Theil–Sen median trend analysis with a Mann–Kendall significance test, partial correlation analysis, and residual trend analysis were used to detect vegetation variations and their attribution. The results of this study are expected to separate the climate-induced and human-induced vegetation changes in the warm-humid Guangdong Province, which is helpful to evaluate the effectiveness of ecological conservation and restoration measures over the last 20 years, thereby providing guidance for future policy making.

2. Materials and Methods
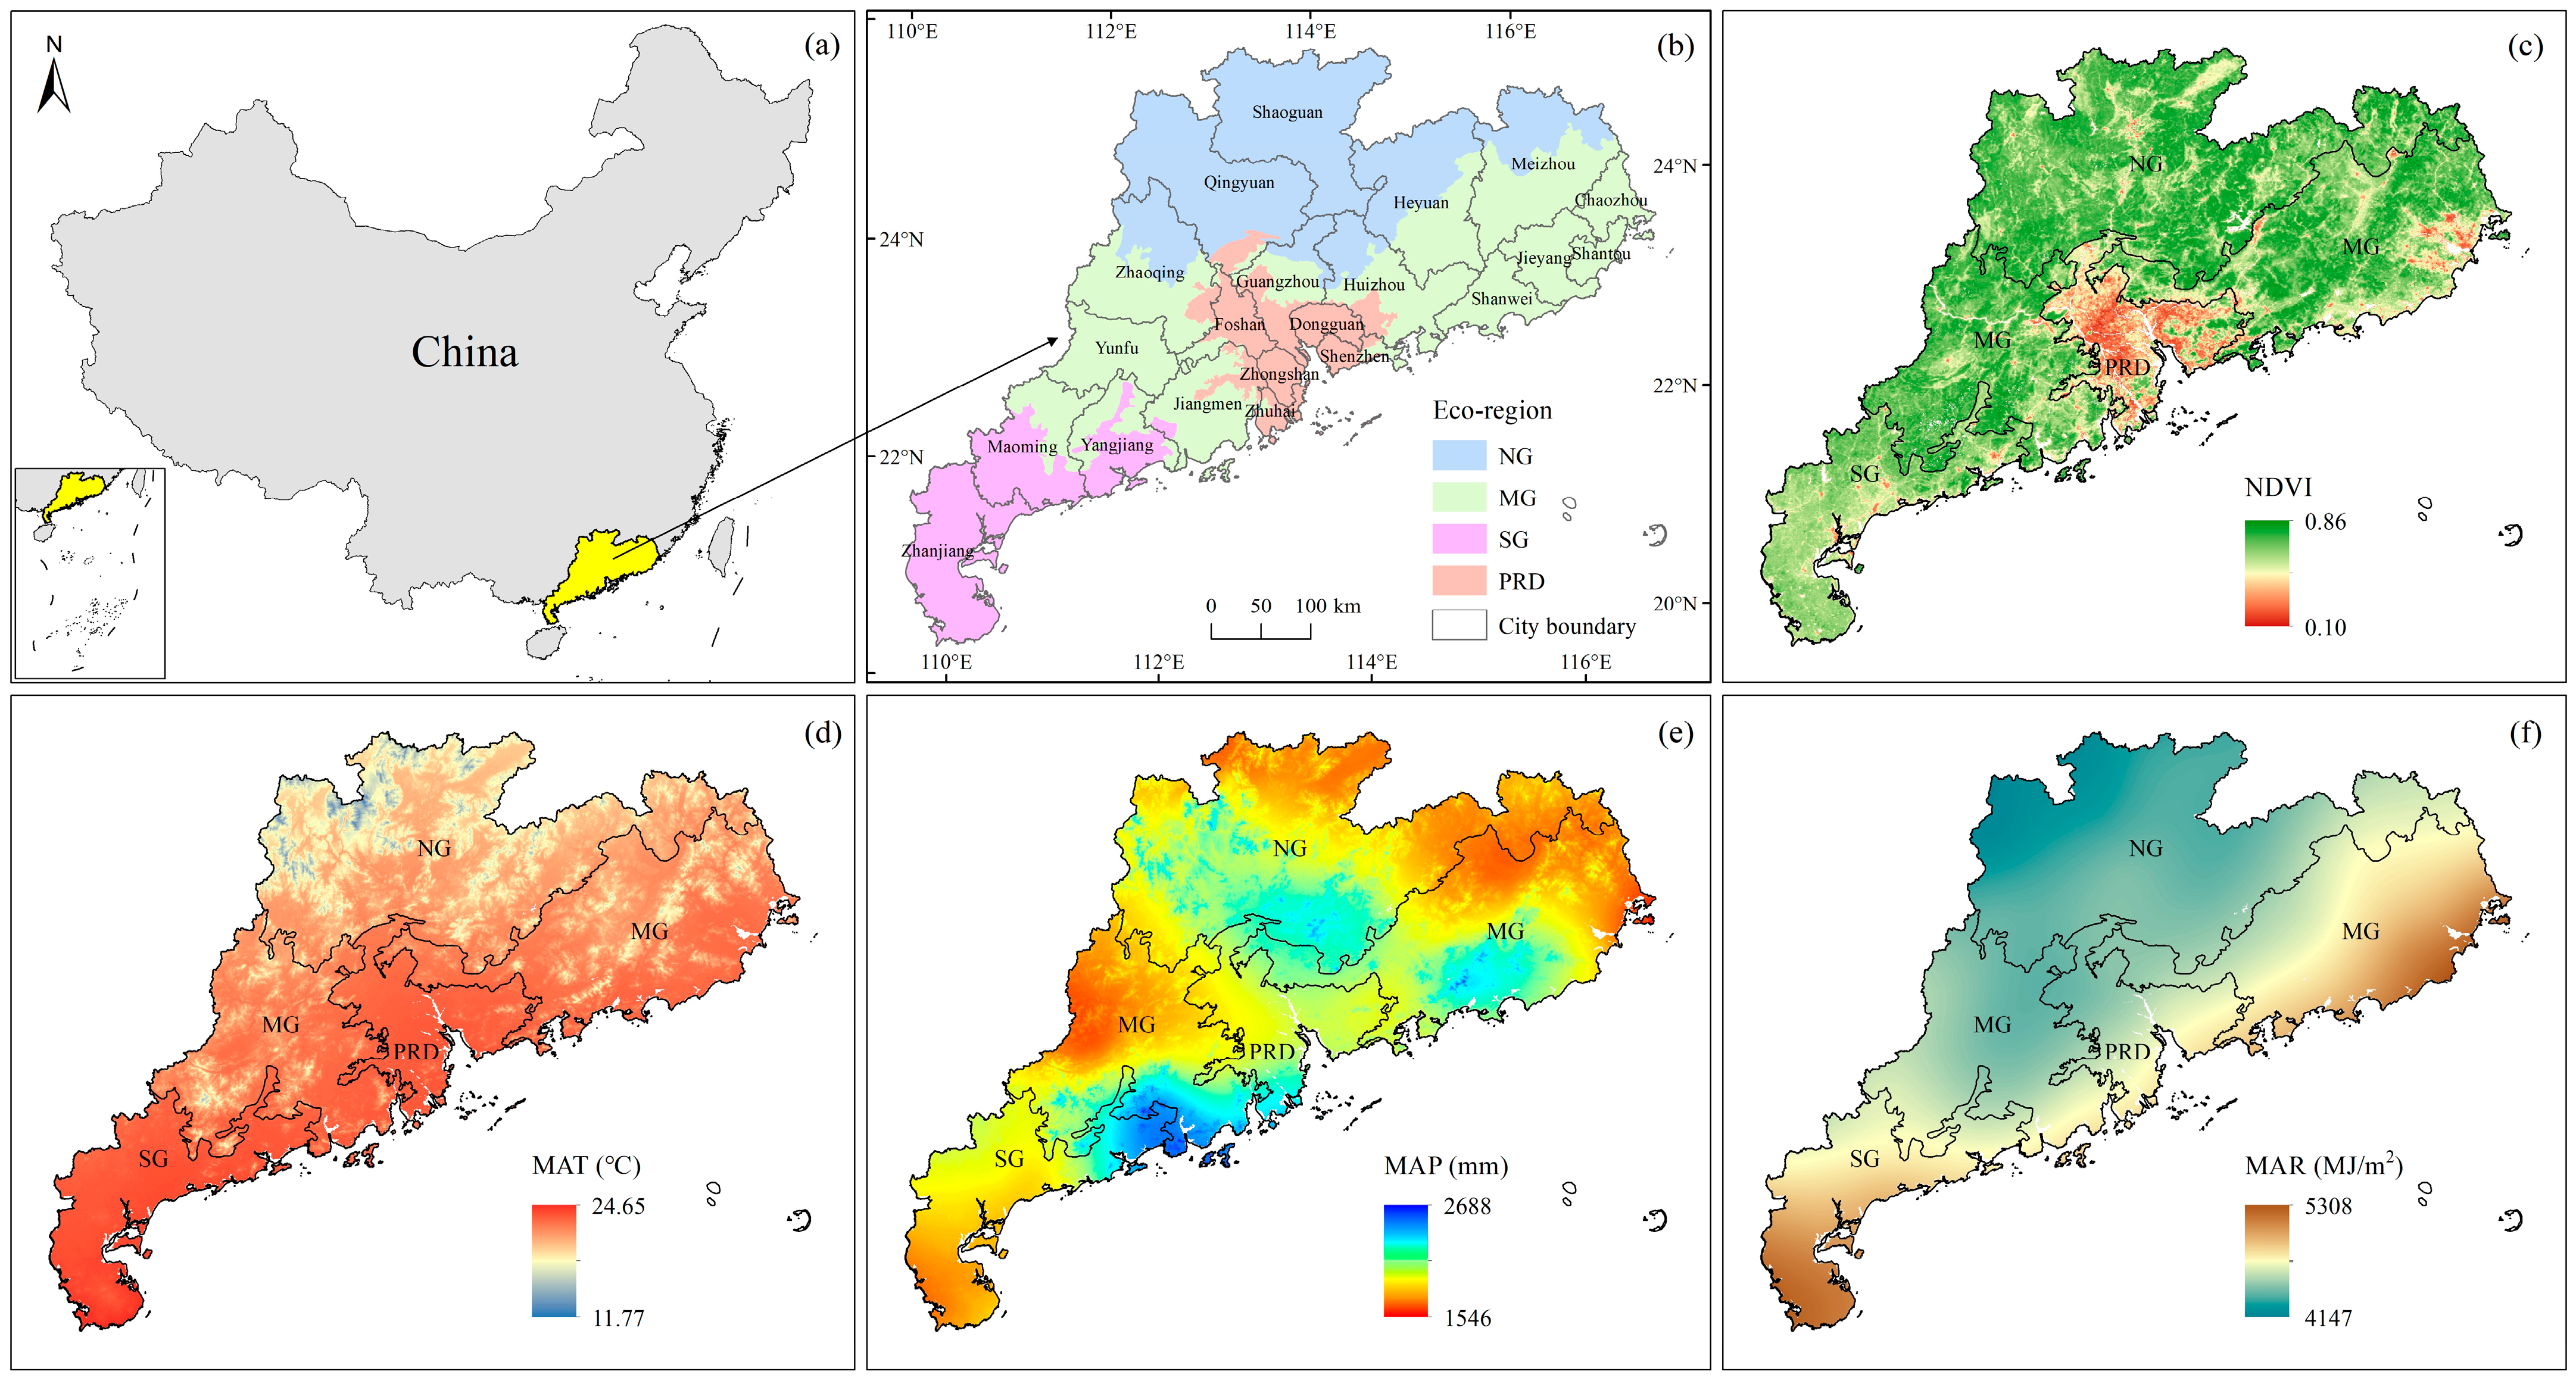
2.1. Study Area

Guangdong (GD) Province (20°09′–25°31′N, 109°45′–117°20′E) is located in the south of China and covers a land area of ~179,700 km2 (Figure 1a). Guangdong Province contains 21 cities and can be divided into 4 eco-regions according to ecosystem types and geographical characteristics (www.ecosystem.csdb.cn, accessed on 5 May 2020): the northern Guangdong (NG) eco-region with mid-subtropical mountainous and hilly evergreen broad-leaved forest, the middle Guangdong (MG) eco-region with south-subtropical mountainous and hilly evergreen broad-leaved forest, the southern Guangdong (SG) eco-region with tropical monsoon forest and rainforest, and the Pearl River Delta (PRD) eco-region with south-subtropical urban and suburban agriculture (Figure 1b). The MG eco-region can be further divided into the western part (West MG) and the eastern part (East MG). Vegetation in these eco-regions is different, thus the averaged NDVI over 2001–2020 displays distinct spatial patterns (Figure 1c). The warm-humid subtropical climate dominates GD Province with abundant light, heat, and water resources. According to the spatially interpolated meteorological records as described in Section 2.2.2 below, the mean annual temperature (MAT), precipitation (MAP), and radiation (MAR) ranges during 2001–2020 are 11.77–24.65 °C, 1546–2688 mm, and 4147–5308 MJ/m2, respectively (Figure 1d–f).

2.2. Data Preparation

2.2.1. NDVI Data

The MODIS NDVI data (MOD13A1) for the period of 2001–2020, with the temporal resolution of 16 days and the spatial resolution of 500 m, were collected from the Land Processes Distributed Active Archive Center (LP DAAC) within the U.S. National Aeronautics and Space Administration (NASA) Earth Observing System Data and Information System (EOSDIS) (https://lpdaac.usgs.gov, accessed on 15 April 2020). Since the data might be contaminated by clouds and haze, we used the Savitzky–Golay filter in the TIMESET software package of MATLAB R2020b to smooth the annual cycle of NDVI data and improve the data quality of the NDVI time series [48]. Then, the maximum value composite (MVC) method was used to generate monthly and yearly NDVI datasets.

2.2.2. Climate Data

Daily temperature (°C), precipitation (mm), and sunshine duration (hour) records of 128 meteorological observation stations within and nearby Guangdong Province during 2001–2020 were provided by the China Meteorological Data Service Center (http://data.cma.cn, accessed on 13 December 2021). Incorrect and suspicious data were first removed via data cleaning and quality control and the percentage of missing data was kept within 10% for every meteorological station [49]. The missing data were imputed via the “mice” package in RStudio [50]. Then, these daily climatic records were composited to monthly datasets for spatial interpolation. The ANUSPLIN 4.2 software was used to interpolate meteorological point data into raster surfaces with the spatial resolution in line with NDVI pixels [51]. The sunshine duration (hour) was converted to radiation (MJ/m2) via the method recommended by the Food and Agriculture Organization [52]. Finally, the yearly average temperature and total precipitation and radiation were calculated.

2.2.3. Eco-Region Data

The eco-region data were obtained from the datasets of ecosystem assessment and ecological security in China (www.ecosystem.csdb.cn, accessed on 5 May 2020). Based on the eco-environmental problems, ecosystem sensitivity, and ecosystem services in China, eco-regions were delineated according to natural conditions such as landforms, hydrothermal conditions, vegetation characteristics, ecosystem types, and geographical features via multiple methods including spatial overlay technique, correlation analysis, and expert consultation. There are 50 eco-regions in China, and Guangdong Province involves 4 of them (Figure 1b).

2.3. Methods

To distinguish the relative contributions of climate change and human activities to vegetation dynamics via residual trend analysis, it is essential to understand the characteristics of vegetation and climate trends and the relationships between vegetation and climatic variables in advance. Using the time series of NDVI and climatic variables (temperature-TEM, precipitation-PRE, radiation-RAD) during 2001–2020, the Theil–Sen median trend analysis and linear regression analysis were first adopted to reveal the features of vegetation and climate changes at both pixel and regional scales, and then partial correlation analysis was used to explore the relationships between vegetation and climatic factors, and finally residual trend analysis was applied to separate the climatic and anthropogenic contributions to vegetation changes in this study (Figure 2).

2.3.1. Theil–Sen Median Trend Analysis with a Mann–Kendall Significance Test

The Theil–Sen median trend analysis was used to analyze the yearly trend of NDVI or climatic variables (temperature, precipitation, radiation) at pixel scale, and the Mann–Kendall test was used to detect the significance level of the changing trend. As a robust non-parametric technique, this method is insensitive to outliers and missing noise values [53,54,55], so it has been widely employed for long time-series trend analyses, especially in vegetation dynamic and climate change studies [14,15,56,57].
First, the slope of the Theil–Sen median was calculated by the Theil–Sen estimator:
S x = M e d i a n x j x i j i ,       2001 i < j 2020
where Sx is the median from the set of slopes of the NDVI or climatic variables time series; xi and xj are the NDVI values or climatic variables of year i and year j, respectively. Sx > 0 indicates an increasing trend, and Sx < 0 indicates a decreasing trend for the period of 2001–2020.
Then, the significance of the trend was determined by the Mann–Kendall test:
S = j = 1 n 1 i = j + 1 n s g n x j x i
s g n x j x i = 1 , x j x i > 0 0 , x j x i = 0 1 , x j x i < 0
δ S = n n 1 2 n + 5 18
Z = S 1 δ S ,       S > 0 0 ,       S = 0 S + 1 δ S ,       S < 0
where n is the length of years; sgn is a sign function. Z value, calculated by S statistics, was used to test the significance of the changing trend.
For a given significance level α, |Z| > Z1−α/2 denotes the changing trend of the time series is significant [15,57]. This study selected α = 0.05 as the significance level to classify the trend magnitude (Table 1).

2.3.2. Linear Regression Analysis

The linear regression analysis based on the ordinary least-squares method was applied to detect the overall interannual trend of NDVI during 2001–2020 at regional scale. The slope coefficient was calculated as below:
s l o p e = n × t = 1 n t × N D V I t t = 1 n t t = 1 n N D V I t n × t = 1 n t 2 t = 1 n t 2
where slope is the changing trend of NDVI; n is the number of years; NDVIt is the averaged NDVI value of year t for the study area or eco-regions. The positive slope value indicates an overall increasing trend and the negative slope value implies an overall decreasing trend in the study period.

2.3.3. Partial Correlation Analysis

Partial correlation analysis was performed to explore the degree of association between every individual climatic factor (temperature, precipitation, or radiation) and monthly NDVI while controlling the potential effects of the other two climatic variables. The partial correlation coefficient can reflect a more intrinsic correlation compared with the simple correlation coefficient by eliminating the interactive influences of climatic factors on vegetation, so the partial correlation analysis has been widely used to investigate climatic driving forces on vegetation growth [11,15,24,36]. We used the “ppcor.test” function in the “ppcor” package in software RStudio version 2023.03.0 to explore the partial correlations between NDVI and each climatic variable. The calculation of the partial correlation coefficient was as follows:
r a b , c ~ p 2 = R a ( b , c , , p ) 2 R a ( c , , p ) 2 1 R a ( c , , p ) 2
where rab,c~p is the partial correlation coefficient between variables a and b without the influence of variables (c~p); Ra(b,c,…,p) is the Spearman correlation coefficient of regression analysis between variable a and (b~p); Ra(c,…,p) is the Spearman correlation coefficient of regression analysis between variable a and (c~p). The non-parametric Spearman’s rank correlation has no assumptions of the distribution of variables, so the Spearman correlation coefficient rather than the conventional Pearson correlation coefficient was used in this study because the climatic variables may not be normally distributed. According to the significance test, the partial correlation between NDVI and each climatic variable was classified into four types: significant negative (SN), non-significant negative (NN), non-significant positive (NP), and significant positive (SP).
In order to screen the dominant climatic factor driving vegetation change, the absolute partial correlation coefficient values of the three climatic variables (temperature, precipitation, radiation) were compared, and the climatic factor with the maximum absolute partial correlation coefficient value was considered to have the greatest importance [58,59].

2.3.4. Residual Trend Analysis

Since both climate variations and human activities have tremendous impacts on vegetation in Guangdong Province [14,33,45], residual trend analysis was used to distinguish the relative impacts of climate change and human activities on vegetation changes [38]. This method assumes that the unexplained variation in the model between vegetation and climatic variables is attributed to anthropogenic activities [60]. In other words, this assumption regards human activities as the only remaining cause except for climate change in driving vegetation dynamics. Hence, the impact of human activities on vegetation dynamics can be indirectly quantified by establishing a model between climatic variables and vegetation indices and extracting the residual of the model. Heat, water, and light are widely regarded as the three main climatic limitations for vegetation growth [17], and vegetation responds sensitively to monthly climate extremes in Guangdong Province [45]. Thus, we selected temperature, precipitation, and radiation as climatic factors and established a multiple linear regression model between monthly NDVI and climatic factors to predict the climate-driven NDVI in this study. Then, the human-induced NDVI was calculated by the model residual (NDVIres), which was the difference between the observed NDVI (NDVIobs) and predicted NDVI (NDVIpre). The model was expressed as follows:
N D V I p r e = α × T E M + β × P R E + γ × R A D + ε
N D V I r e s = N D V I o b s N D V I p r e
where TEM, PRE, and RAD refer to the climatic factors of temperature, precipitation, and radiation, respectively; α, β, γ, and ε refer to the model coefficients.

2.3.5. Relative Contribution under Various Scenarios

Based on the residual trend analysis as mentioned above, the impacts of climate change and human activities on vegetation variations were separated and measured by NDVIpre and NDVIres, respectively. The trends of both NDVIpre and NDVIres were then analyzed by linear regression analysis. An increasing/decreasing trend of NDVIres indicates positive/negative effects of human activities on NDVI improvement and so does the NDVIpre. Thus, various scenarios based on the slopes of NDVIobs (slopeobs), NDVIpre (slopepre), and NDVIres (sloperes) were developed to determine the relative contributions of climate change and human activities in vegetation change [39] (Table 2).

3. Results

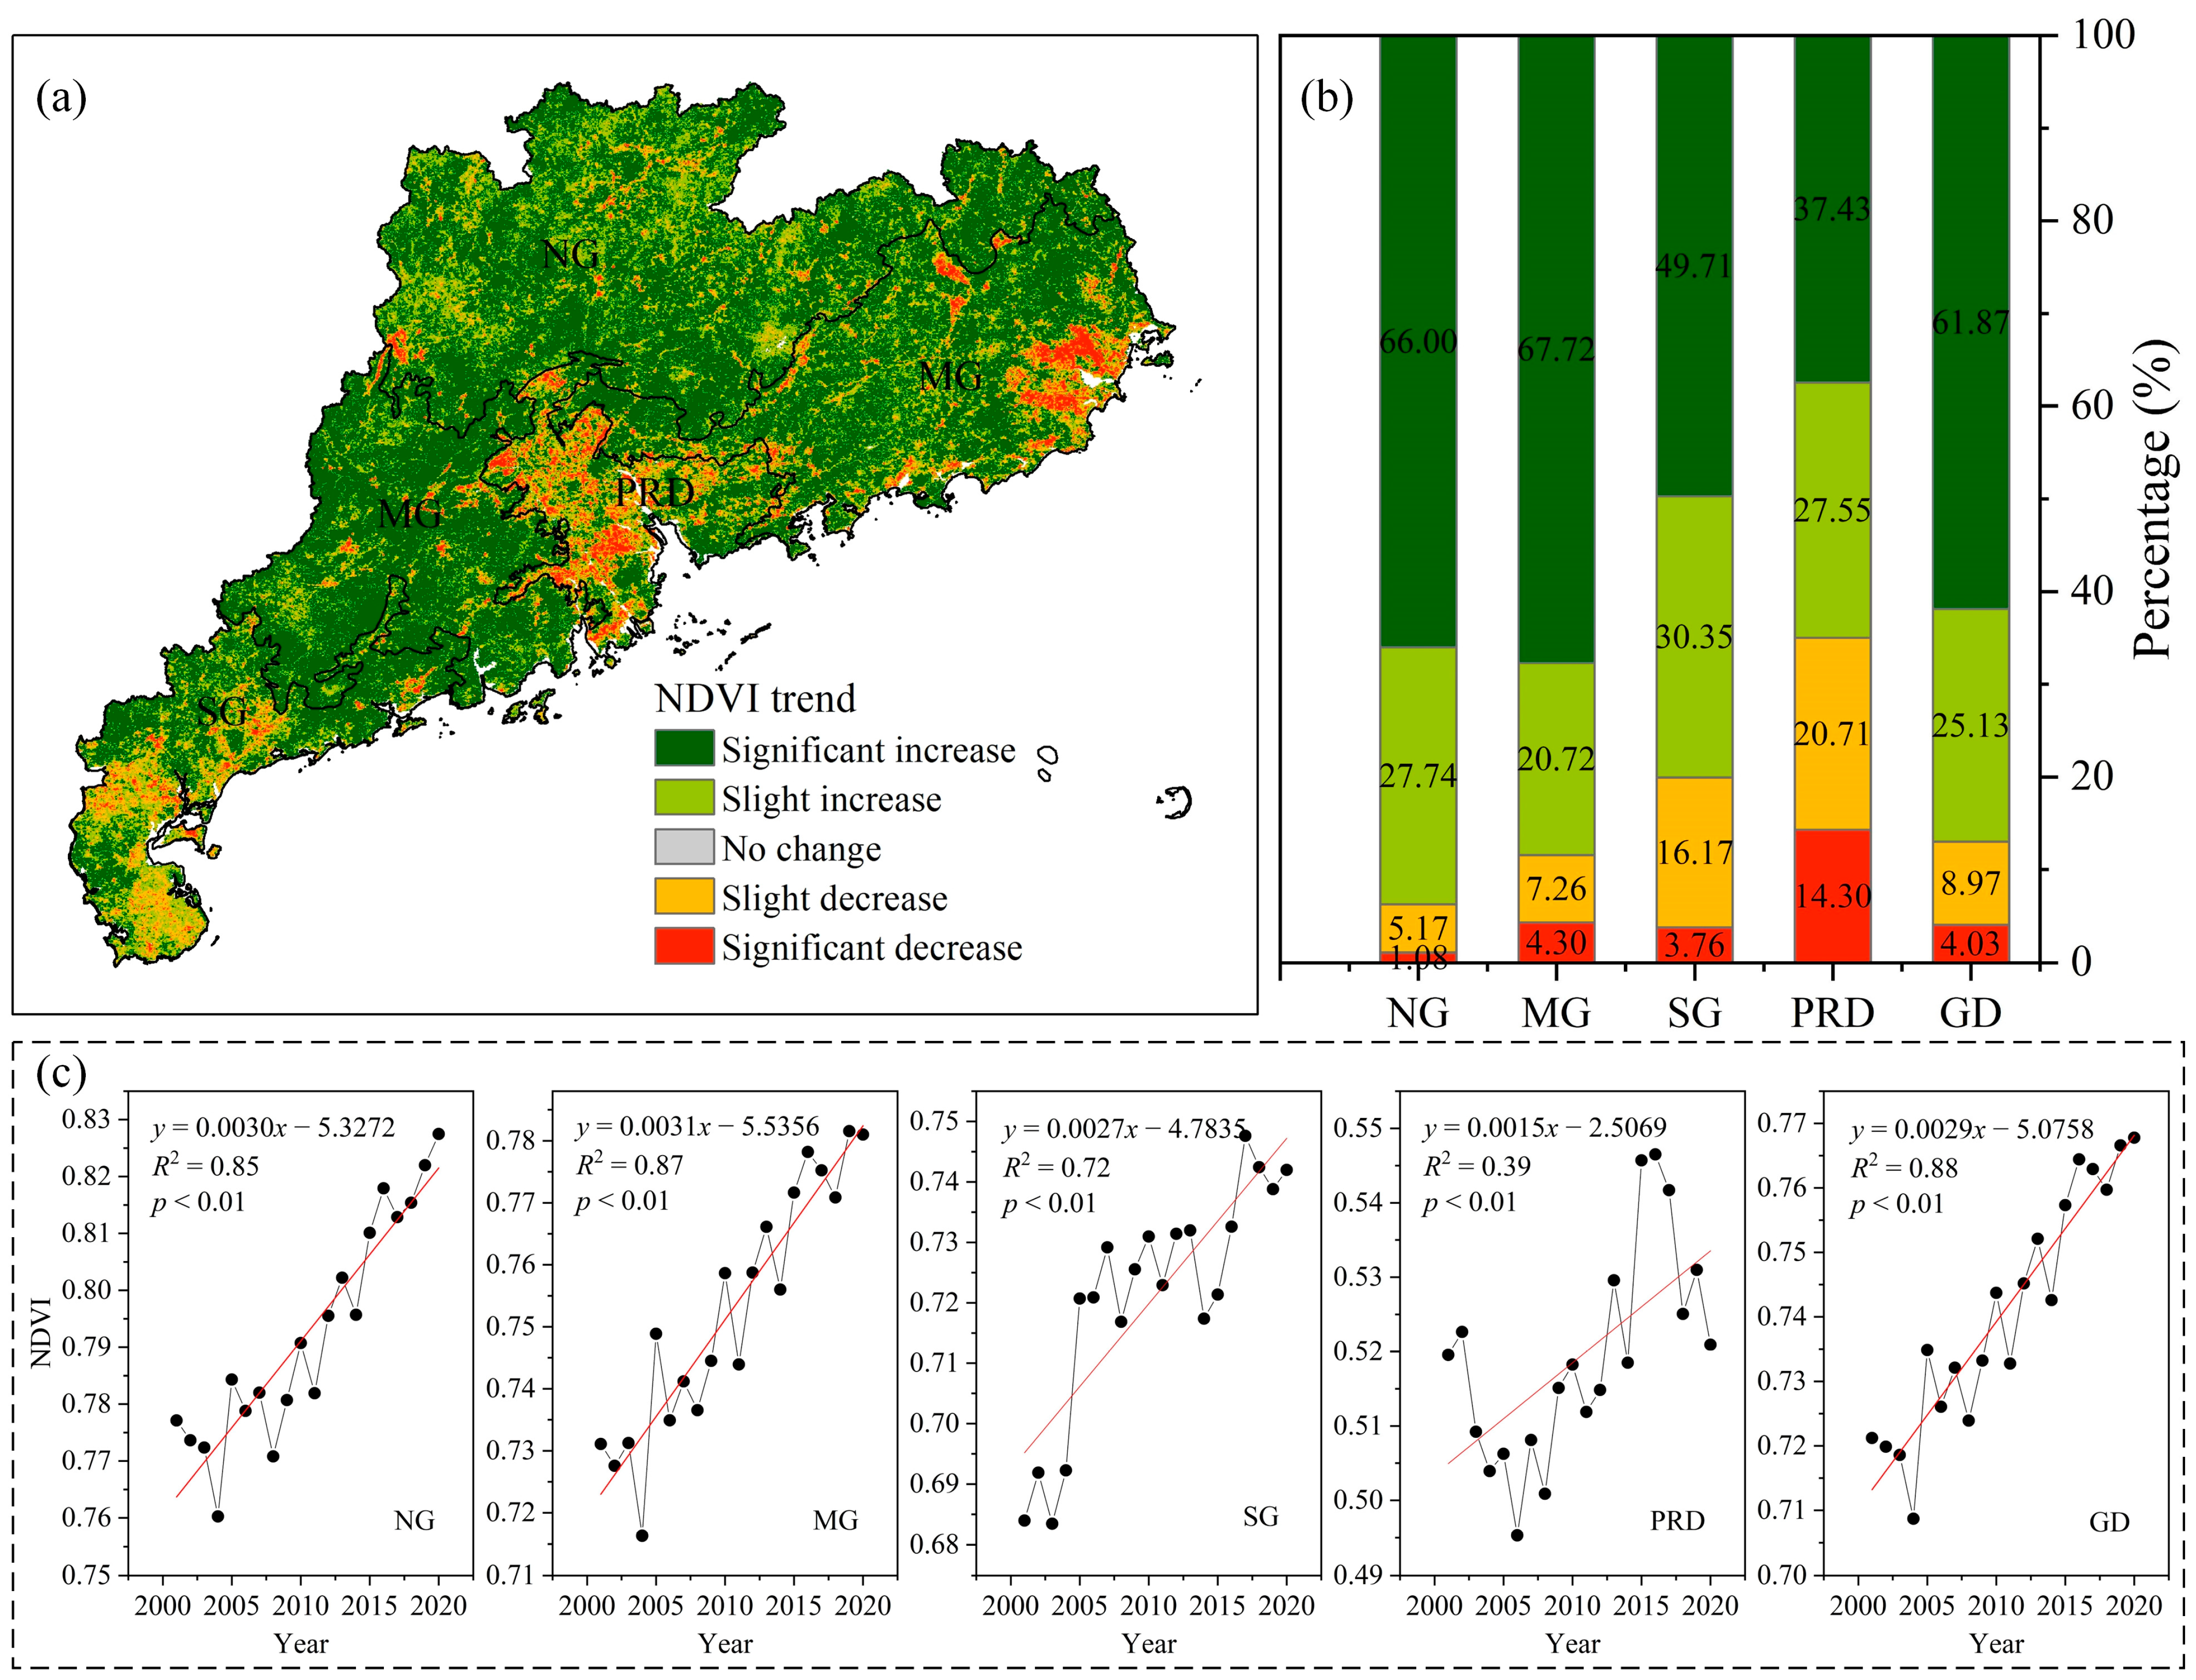
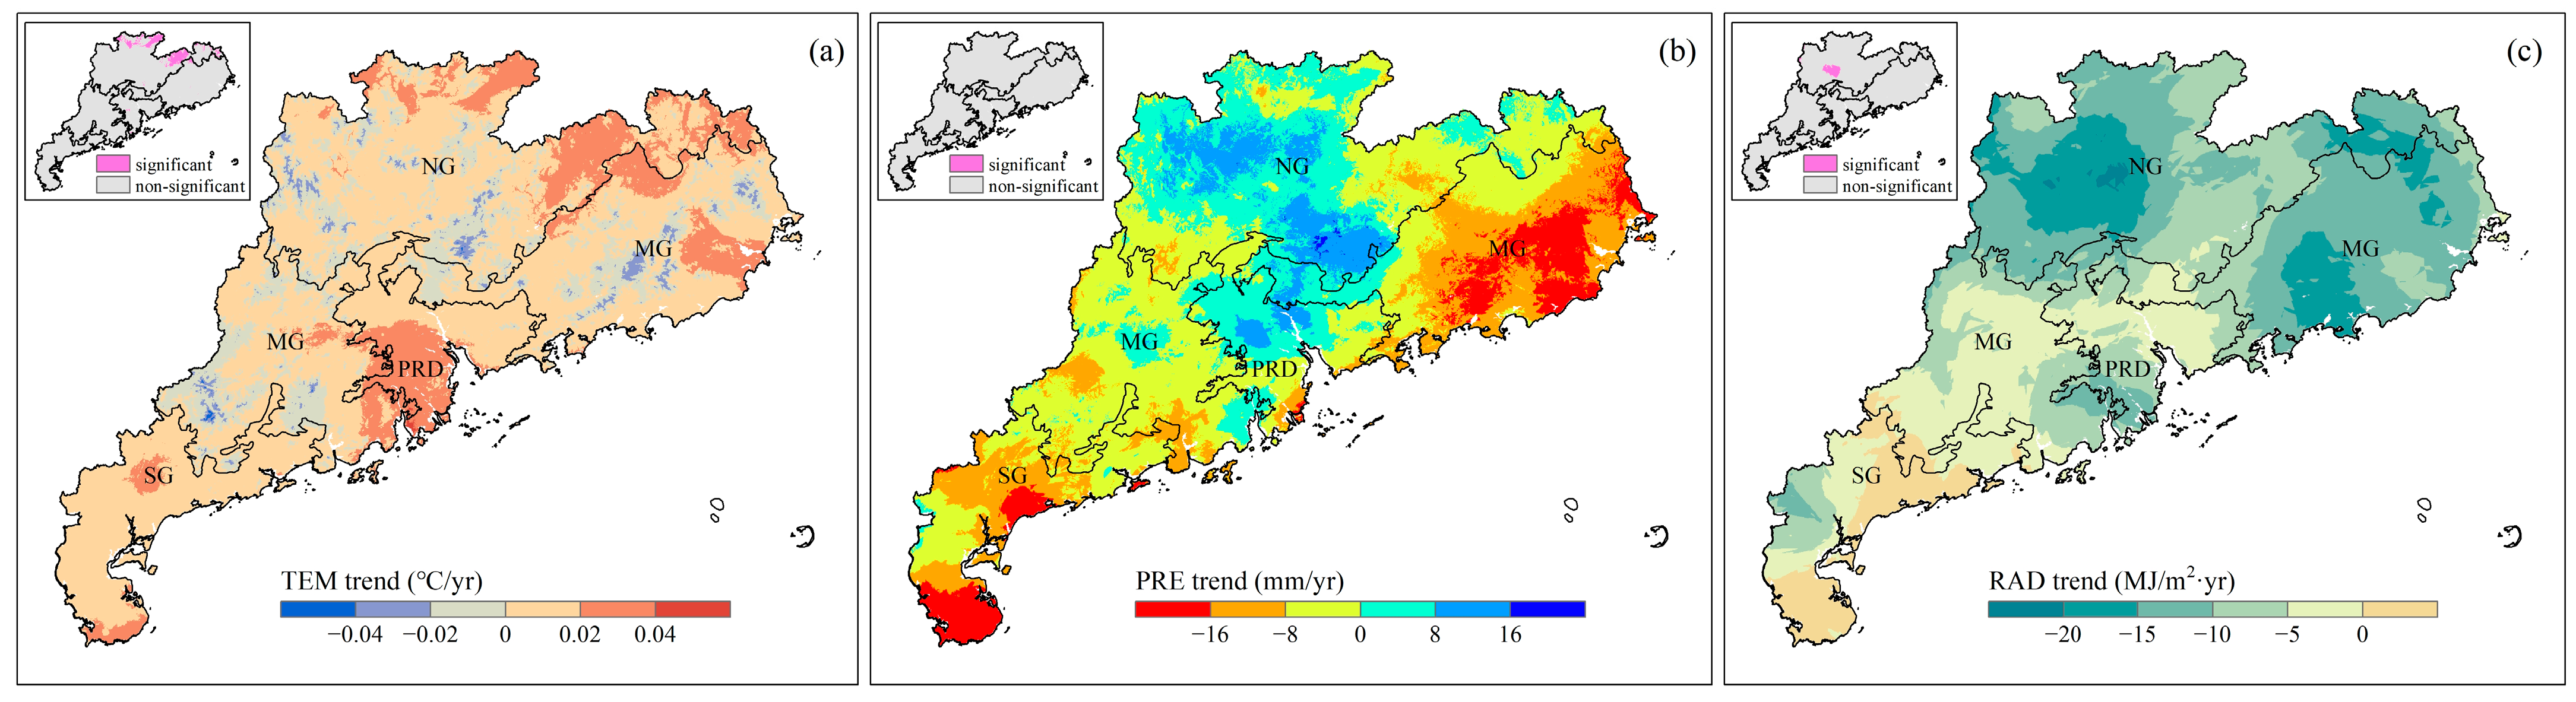
3.1. Spatiotemporal Changes in the NDVI and Climatic Variables

The spatial pattern of yearly NDVI trends analyzed by the Theil–Sen median trend analysis showed that an increasing trend was observed in most land areas (61.87% for significant increase and 25.13% for slight increase) of Guangdong Province from 2001 to 2020 (Figure 3a). Areas with a decreasing NDVI trend were mainly concentrated in the PRD, SG, and East MG eco-regions, in which the significant decrease trend (4.03%) primarily happened in the PRD and East MG eco-regions, and the slight decrease trend (8.97%) chiefly occurred in the SG eco-region.
Area statistics illustrated that NDVI trends varied greatly among eco-regions (Figure 3b). Overall, the total area percentage of increased NDVI ranked as follows: NG > MG > SG > PRD. The NDVI in approximately two-thirds of the MG (67.72%) and NG (66.00%) eco-regions exhibited a significant increasing trend, and the proportion for the SG and PRD eco-regions was 49.71% and 37.43%, respectively. In contrast, many more areas (14.30%) in the PRD eco-region experienced a significant NDVI decrease than in the other eco-regions, while this percentage was only 1.08% for the NG eco-region. The significant decrease areas for the MG and SG regions were comparable, accounting for 4.30% and 3.76%, respectively.
From the result of linear regression analysis, the regional area-averaged NDVI generally presented a significant increasing trend (p < 0.01, n = 20) during 2001–2020 for the whole study area but with different changing rates and processes for the four eco-regions (Figure 3c). The changing rate of interannual NDVI was highest for the MG and NG eco-regions with a similar rate of 0.0030–0.0031 per year and the minimum NDVI value appeared in 2004. The SG eco-regions had a slightly lower changing rate at 0.0027 per year, and the NDVI increased sharply from 2003 but fluctuated between 2005 and 2014 and increased again after 2014. The increasing rate for the PRD eco-region was lowest at 0.0015 per year with the NDVI increasing between 2006–2016 but decreasing before 2006 and after 2016.
During 2001–2020, temperature, precipitation, and radiation displayed diverse fluctuations but non-significant yearly trends in most areas (Figure 4). A warming trend was observed in most areas especially for several regions in the southern PRD, northern NG and eastern East MG eco-regions with more evident warming, but only a small region exhibited a significant changing trend (Figure 4a). Wetting mainly happened in most of the NG and PRD eco-regions, while the majority of the MG and SG eco-regions became drier, particularly for some regions at an annual decreasing rate of more than 16 mm (Figure 4b). Radiation decreased in the whole study area except for a few areas in the SG eco-region with a slightly increasing trend, and the significant changing trend was merely observed in a small part of the central NG eco-region (Figure 4c).

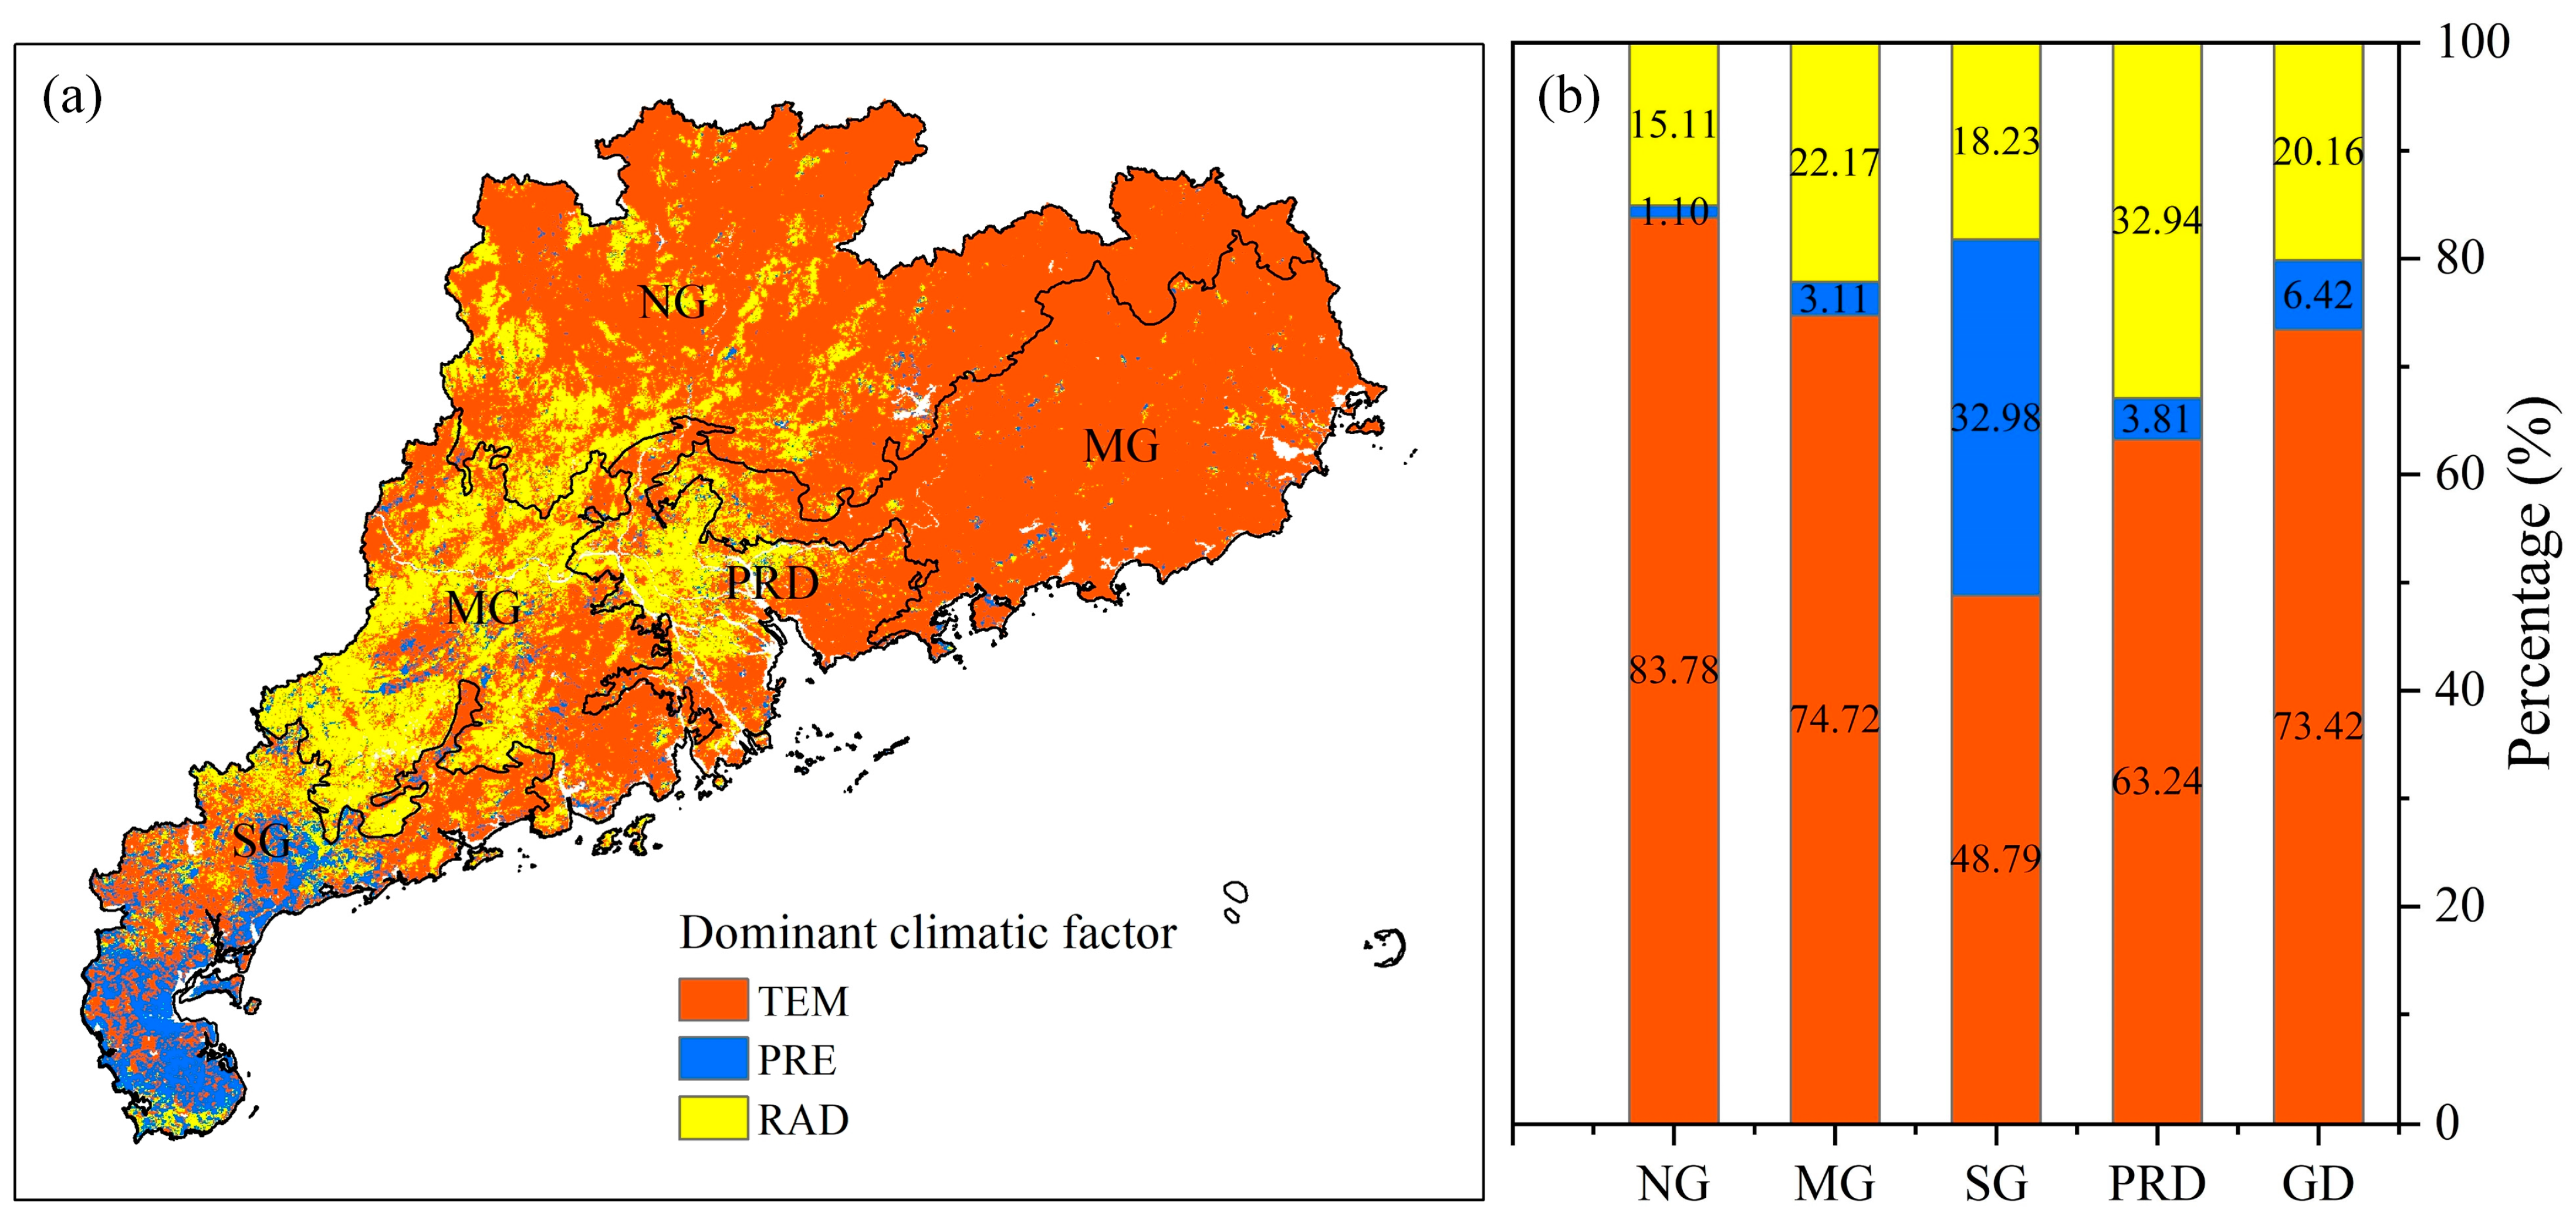
3.2. Relationships between Climatic Variables and the NDVI

The partial correlation between the monthly NDVI and climatic factors (temperature, precipitation, and radiation) was mapped to determine the impacts of climate change on vegetation variations (Figure 5). A significant positive correlation between the NDVI and temperature was observed in most of the study area (80.73%), while the area showed a significant negative correlation only accounting for 0.32%. Regions with non-significant correlations between the NDVI and temperature were mainly scattered in the PRD and West MG eco-regions (Figure 5a). Contrary to temperature, the impact of precipitation on the NDVI was not significant in most areas (71.63%). The NDVI and precipitation showed significant positive correlations in the SG eco-region and parts of the West MG and northern NG eco-regions, whereas the NDVI and precipitation showed significant negative correlations in the East MG and eastern NG eco-regions (Figure 5b). Similar to PRE, regions showing a significant negative correlation between the NDVI and radiation were mainly distributed in the East MG eco-region. There was a noticeable tendency of transition from significant negative correlation to significant positive correlation between the NDVI and radiation along the east-west gradient, except for the negative correlation at the southern edge of the SG eco-region. The proportion of regions presenting a significant positive correlation between the NDVI and radiation was 30.35%, which was widely situated in the PRD, West MG, southern NG, and northern SG eco-regions (Figure 5c).
The absolute values of the partial correlation coefficients between temperature, precipitation, radiation and the NDVI were compared to determine the dominant climatic factor in driving vegetation changes (Figure 6). The area percentage of the three dominant climatic factors was calculated for each eco-region and the whole study area. Results indicated that vegetation was predominantly influenced by temperature (73.42%), especially for the East MG and northern NG eco-regions. Areas with precipitation as the dominant factor were mainly distributed in the southern SG eco-region, accounting for 32.98% of the SG eco-region, while the impact of precipitation on the other three eco-regions was relatively small. Vegetation dynamics in the northern PRD, West MG, southern NG, and northern SG eco-regions were primarily dominated by radiation.

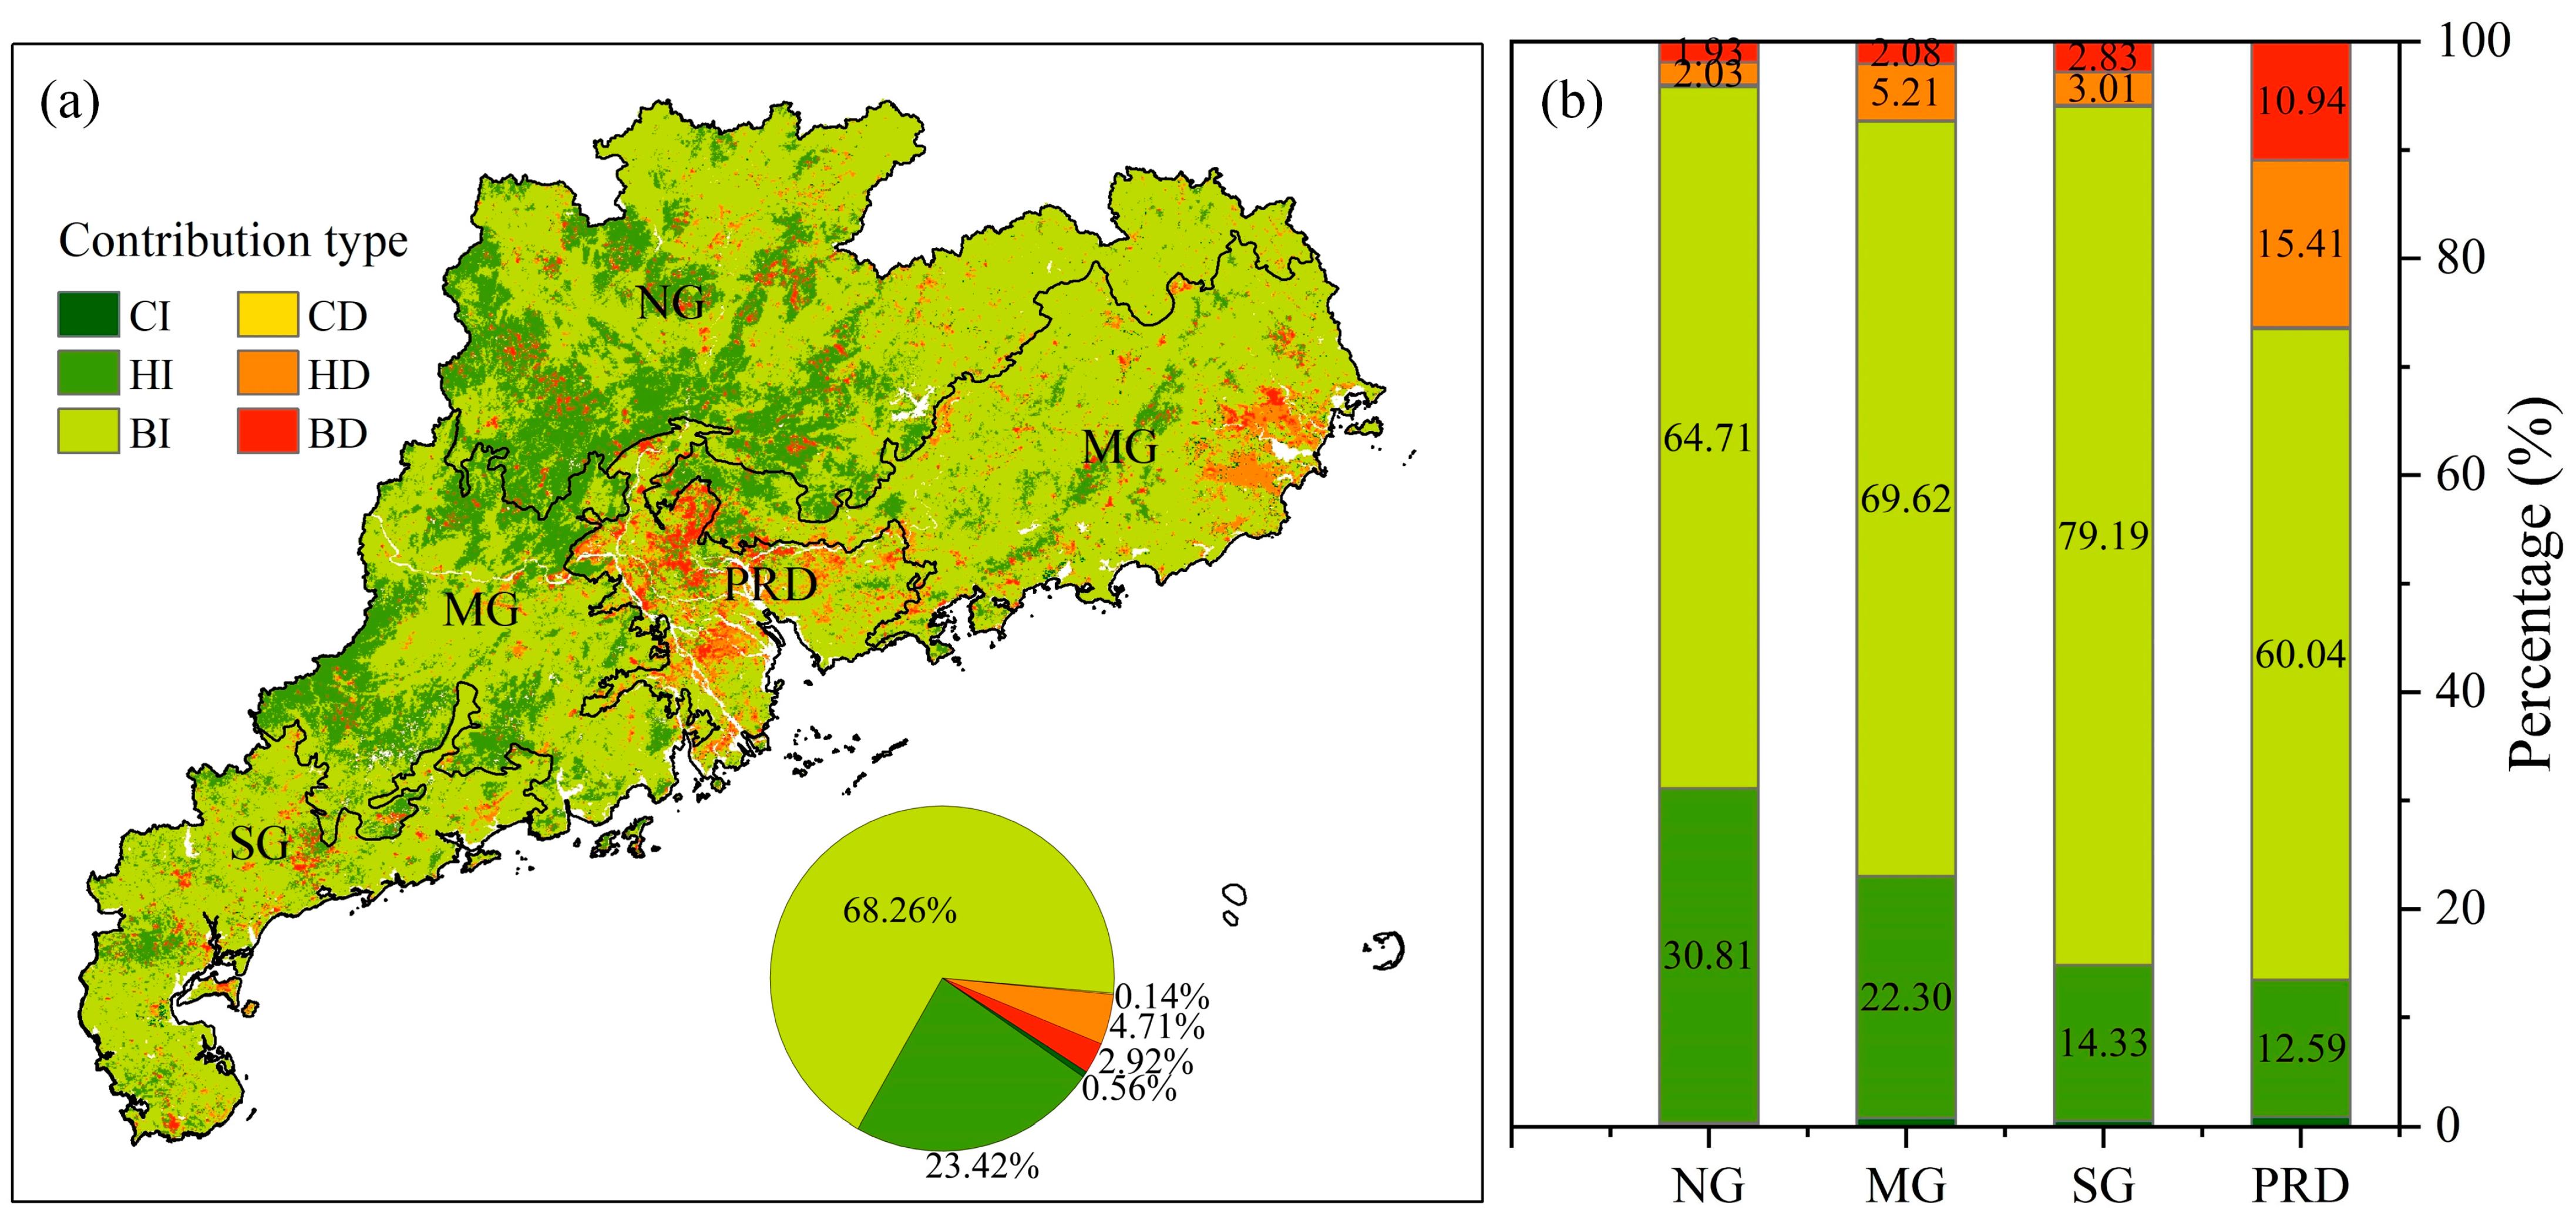
3.3. Contributions of Climate Variations and Human Activities to NDVI Change

Vegetation responded differently to climate change and human activities based on their relative contribution rates calculated by the residual trend analysis (Figure 7). For climate change, regions with a negative contribution to the NDVI were mainly distributed in the southern NG, southern and northern West MG, eastern East MG, massive areas of the PRD, and a few areas of the SG eco-regions, accounting for 31.18% of the study area, against 68.82% for the regions with a positive contribution (Figure 7a). The contribution of climate change for most areas was small (−25% < contribution rate < 25%), while regions with a relatively large contribution (contribution rate < −50% or contribution rate > 50%) were scattered sparsely throughout all the eco-regions with an area proportion of only 1.57%. For human activities, regions with a negative contribution to the NDVI increase merely occupied 8.32%, and most (87.74%) of these regions were concentrated in the PRD and eastern East MG eco-regions with a contribution rate of less than −75% (Figure 7b). Conversely, human activities in most areas (91.68%) exhibited a positive contribution, in which 96.98% presented a high contribution rate (>75%). Overall, human activities dominated (contribution rate < −50% or contribution rate > 50%) 98.43% of the vegetation changes in the whole study area.
The contribution type of climate change and human activities to vegetation dynamics was classified under various scenarios (Table 2, Figure 8). Vegetation increase or decrease caused by climate change only happened in a few regions, accounting for 0.56% and 0.14% of the study area, respectively. Human-induced vegetation improvement (23.42%) mainly occurred in the NG and MG eco-regions, while human-induced vegetation degradation (4.71%) was concentrated in the PRD and eastern East MG eco-regions. Vegetation variations in most (68.26% for NDVI increase and 2.92% for NDVI decrease) of the study area were influenced by both climate change and human activities. The area proportion of vegetation improvement caused by both climatic and anthropogenic contributions was highest in all four eco-regions, occupying 64.71%, 69.62%, 79.19%, and 60.04% of the NG, MG, SG, and PRD eco-regions, respectively. In contrast, regions of vegetation degradation induced by the combination of climate change and human activities had a relatively small area and were distributed dispersedly, except for the concentrated distribution in the PRD eco-region.

4. Discussion

4.1. Vegetation Trends and Their Climatic Drivers

This study found that vegetation growth in most areas of Guangdong Province displayed an increasing trend during 2001–2020, and the decreasing trend was mainly concentrated in the urban areas and peripheries in the PRD and eastern East MD ecoregions (Figure 3), in agreement with previous studies [9,33]. However, these studies demonstrated a non-significant increasing or even decreasing trend of vegetation greenness in most area of northern Guangdong [9,33], contrasting with our results that vegetation improved significantly in the NG eco-region. This is partially due to the more extended study period of our study (2001–2020) compared with the prior work (2001–2013). Our results showed that the NDVI in the NG eco-region fluctuated highly before 2011, and has sharply increased in recent years (Figure 3c). Another possible reason is the difference in zonation. The eco-regions in this study were delineated based on natural conditions, while previous studies used the administrative division map. Thus, the boundary definition of northern Guangdong (NG eco-region in this study) was different. The vegetation trend in many regions of the northern NG eco-region in this study was not significant either, similar to these previous studies. The results of this study indicated that trends of climatic variables (temperature, precipitation, radiation) and their effects on vegetation changes were spatially different (Figure 4 and Figure 5). First, significant positive correlations between the NDVI and temperature were observed across most areas (Figure 5a) and temperature was the dominant climatic factor for 73.42% of the study area (Figure 6), especially the northern NG and East MG eco-regions, in line with previous studies [9,33]. These regions are mostly mountainous areas with higher latitudes and elevations, and the temperature is relatively low in comparison with other eco-regions (Figure 1d), so vegetation growth is more sensitive to low temperatures [61]. The increasing temperature is widely believed to prolong the growing season with an earlier spring and a delayed autumn [62,63], thus promoting vegetation greenness in these heat-limited regions. Second, radiation had a predominant influence on vegetation in most areas of the PRD, West MG, and southern NG eco-regions (Figure 6), where the NDVI and radiation were significantly and positively correlated (Figure 5c). The deficiency of sunshine time may be the reason why vegetation tends to be limited by light in these regions (Figure 1f). Conversely, negative effects of radiation on vegetation were extensively detected in the East MG eco-region and the southern edge of the SG eco-region. This is possibly because of photoinhibition as sufficient radiation exists in these regions and strong light inhibits vegetation photosynthesis [64]. Last, compared with the widespread impacts of temperature and radiation on vegetation variations, regions with precipitation as the dominant climatic factor only accounted for 6.42% of the study area (Figure 6). Since precipitation in Guangdong Province is usually abundant, drought is generally not the stressor of vegetation growth, which was also concluded in a global study showing that tropical forests are highly sensitive to temperature and cloudiness rather than water availability [19]. The influence of precipitation on vegetation showed distinct north-south patterns with negative impacts in most areas except for the SG eco-region (Figure 5b), which was also observed in previous studies [9,45]. Specifically, significant negative correlations between the NDVI and precipitation were mainly distributed in the eastern NG and East MG eco-regions. This is presumably because these regions have high susceptibility to geohazards [65], and the excessive precipitation is likely to reduce photosynthetic activity via aggravating soil erosion and even triggering floods [66]. In contrast, the significant positive effect of precipitation on vegetation greenness was primarily situated in the SG eco-region. The precipitation in the SG eco-region is relatively low with a decreasing trend (Figure 1e and Figure 4b), thus the drier environment may cause stress on vegetation growth. In addition, the SG eco-region has the best heat and light resources in the study area, and the persistent high temperature and radiation may accelerate evapotranspiration and exhaust soil moisture, thereby causing adverse impacts on vegetation [67,68,69]. Precipitation is believed to alleviate these unfavorable effects and promote vegetation growth [45,70].

4.2. The Dominant Role of Anthropogenic Activities in Vegetation Change

As Guangdong Province belongs to the warm-humid subtropical climate region with relatively high temperature, abundant precipitation, and sufficient radiation (Figure 1) and these climatic variables did not change significantly in most areas over 2001–2020 (Figure 4), vegetation dynamics are largely independent of climate change. Instead, anthropogenic activities play a dominant role in vegetation variations (Figure 7 and Figure 8), also supported by other studies [7,9,33,36], suggesting that the residual trend analysis is an effective method in the study area.
This study indicated that 98.43% of vegetation changes were predominantly induced by human activities with the absolute contribution rate >50% (Figure 7), which is much higher than the value of 79.40% in a previous work [33]. One possible reason is that our results included the contribution of both climate change and human activities just with a higher contribution rate of human activities than climate change. In contrast, the previous work only referred to the explanation rate of human activities. Additionally, the previous work took LUCC to represent human activities, which might neglect human-related activities without land use conversions and thus underestimate the anthropogenic contribution to vegetation changes. By comparison, we used the residual trend analysis in this study which assumed that vegetation variations were induced by human activities after excluding the effect of climate change. Human activities have both negative and positive effects on vegetation greenness. Land cover changes caused by urbanization are widely regarded as the main reason for vegetation degradation in Guangdong province [9,14,33,71]. Our results also found that the NDVI decreased around the urban areas, particularly for the PRD eco-region and the eastern part of the East MG eco-region (Figure 3a), where urban expansion mainly occurred [47]. Apart from urban regions, vegetation in most other areas was improved by human activities, which is principally due to a series of ecological protection and restoration programs since 1999 [72]. In this study, we found that NDVI had the largest increasing trend in the MG eco-region (Figure 3c). This is probably because conversions from croplands and grasslands to forests via afforestation mainly happened in eastern and western Guangdong [9], and fast-growing forest species were selected in these large-scale reforestation programs [73], which significantly contributed to vegetation greenness. In addition, urban greening policies [26], the urban heat island effect [74], the fertilization effect of carbon dioxide [75], and nitrogen deposition [76] may also promote vegetation enhancement in built-up areas. thus, vegetation changes were more complicated in the PRD eco-region (Figure 3c).

4.3. Uncertainties and Challenges

Our findings highlighted the predominant role of human activities in vegetation change in Guangdong Province, but some limitations and uncertainties remain. The residual trend analysis used in this study assumes that vegetation changes are driven by either climate change or human activities. However, some situations may conflict with this assumption including (1) the difficulty in accurately quantifying the relationship between climatic variables and vegetation indices, and (2) where other factors rather than climate change and human activities are the controlling factors of vegetation variations. Firstly, the residual trend analysis based on the multiple linear regression model has been well applied to disentangle the relative contributions of climate change and human activities to vegetation dynamics in arid and semiarid regions [39,40,42,43], where vegetation growth is usually water-limited and linearly correlated to precipitation change. However, vegetation growth in warm and humid regions such as Guangdong Province is generally not inhibited by climatic conditions and the response of vegetation to climate change may be nonlinear [77,78]. The multiple linear regression model may not be able to accurately reflect the complicated relationship between vegetation responses and climate variations. A recent study attempted to combine a nonlinear model with residual trend analysis to better reveal the nonlinear vegetation responses to climatic variables [41]. Thus, the method applicability and selection need more exploration based on a deeper understanding of vegetation–climate relationships. Moreover, other factors such as atmospheric carbon dioxide concentration [62], nitrogen deposition [76], soil condition [25], agricultural intensification [26], and exotic plant invasion [79] may also largely affect vegetation greenness and productivity. For example, the invasion of the exotic grass red brome in the northeastern region of the Mojave Desert played a vital role in vegetation greening on post-fire landscapes [79]. The carbon dioxide fertilization effects explained most of the greening trends in the tropics [62]. Hence, the contribution of human activities to vegetation changes separated by the residual trend analysis is likely to be overestimated when there are other important factors besides climate change and human activities. Additionally, the lag effect of climate change on vegetation growth was not considered in this study but has been considered in many other studies [9,58,80]. However, these studies only analyzed the lag time of climatic influences on vegetation, but how to integrate the lag effect into the attribution analysis of vegetation dynamics is still a challenging work.

5. Conclusions

Based on data of the NDVI time series and climatic variables (temperature, precipitation, radiation) during 2001–2020, this study analyzed the spatiotemporal patterns of vegetation trends, explored the response of vegetation to climate variations, and distinguished the relative climatic and anthropogenic contribution to vegetation dynamics in Guangdong Province of South China. Vegetation enhancement happened in most areas, while vegetation degradation was mainly concentrated around urban areas. Vegetation trends varied largely among the four eco-regions in Guangdong Province with the highest rate of change in the MG eco-region and lowest rate of change in the PRD eco-region. Changes in temperature, precipitation, and radiation presented distinct spatial patterns over the past 20 years, but their changing trends were not statistically significant in most areas. Vegetation responded differently to climate change with significant positive correlations to temperature in most areas, and negative correlations in the east but positive correlations in the west were generally observed between vegetation and both precipitation and radiation. Temperature was the dominant climatic factor in most areas, while regions with radiation or precipitation as the dominant factor were mainly concentrated in the center-west or the southern edge, respectively. The contribution of climate change to vegetation variations was much smaller compared with human activities. Human-induced vegetation greening widely happened in the NG and MG eco-regions, while human-induced vegetation browning was concentrated in the PRD and eastern East MG eco-regions. Vegetation dynamics in most areas were influenced by both climate change and human activities, although the contribution rate of human activities was much higher than climate change. The results of this study highlight the effectiveness of ecological policies in vegetation restoration, which is of great significance for future ecosystem management and conservation.

Author Contributions

Conceptualization, S.G. and X.Z.; Data curation, X.Y. and M.L.; Formal analysis, S.G.; Funding acquisition, S.G. and L.Y.; Investigation, Z.S. and L.Y.; Methodology, S.G. and H.Z.; Writing—original draft, S.G.; Writing—review and editing, X.Z. and Z.S. All authors have read and agreed to the published version of the manuscript.

Funding

This research was funded by the National Natural Science Foundation of China (grant number 42001215), the Guangzhou Basic and Applied Basic Research Foundation (grant number 2023A04J1530), GDAS’ Project of Science and Technology Development (grant number 2020GDASYL-20200401001), the Guangdong Province Forestry Science and Technology Innovation Project (grant number 2022KJCX003), and the 2023 Natural Resources Affairs Management—Ecological Forestry Construction Special Project of Forestry Administration of Guangdong Province (grant number [2022]8).

Data Availability Statement

NDVI data used in this study can be freely accessed via https://lpdaac.usgs.gov. Climate data used in this study can be freely applied at http://data.cma.cn. Eco-region data used in this study can be freely obtained from www.ecosystem.csdb.cn.

Acknowledgments

The authors thank the editors and anonymous reviewers for their thoughtful and helpful suggestions to improve the manuscript.

Conflicts of Interest

The authors declare no conflict of interest.

References

  1. Friedlingstein, P.; O’Sullivan, M.; Jones, M.W.; Andrew, R.M.; Hauck, J.; Olsen, A.; Peters, G.P.; Peters, W.; Pongratz, J.; Sitch, S.; et al. Global Carbon Budget 2020. Earth Syst. Sci. Data 2020, 12, 3269–3340. [Google Scholar] [CrossRef]
  2. Piao, S.L.; Fang, J.Y.; Ciais, P.; Peylin, P.; Huang, Y.; Sitch, S.; Wang, T. The carbon balance of terrestrial ecosystems in China. Nature 2009, 458, 1009–1013. [Google Scholar] [CrossRef] [PubMed]
  3. Pan, Y.D.; Birdsey, R.A.; Fang, J.Y.; Houghton, R.; Kauppi, P.E.; Kurz, W.A.; Phillips, O.L.; Shvidenko, A.; Lewis, S.L.; Canadell, J.G.; et al. A large and persistent carbon sink in the world’s forests. Science 2011, 333, 988–993. [Google Scholar] [CrossRef] [PubMed]
  4. Chen, J.M.; Ju, W.; Ciais, P.; Viovy, N.; Liu, R.; Liu, Y.; Lu, X. Vegetation structural change since 1981 significantly enhanced the terrestrial carbon sink. Nat. Commun. 2019, 10, 4259. [Google Scholar] [CrossRef]
  5. Wu, S.H.; Zhou, S.L.; Chen, D.X.; Wei, Z.Q.; Dai, L.; Li, X.G. Determining the contributions of urbanisation and climate change to NPP variations over the last decade in the Yangtze River Delta, China. Sci. Total Environ. 2014, 472, 397–406. [Google Scholar] [CrossRef]
  6. Gatti, L.V.; Basso, L.S.; Miller, J.B.; Gloor, M.; Domingues, L.G.; Cassol, H.L.G.; Tejada, G.; Aragao, L.E.O.C.; Nobre, C.; Peters, W.; et al. Amazonia as a carbon source linked to deforestation and climate change. Nature 2021, 595, 388–393. [Google Scholar] [CrossRef]
  7. Chen, Y.Z.; Feng, X.M.; Tian, H.Q.; Wu, X.T.; Gao, Z.; Feng, Y.; Piao, S.L.; Lv, N.; Pan, N.Q.; Fu, B.J. Accelerated increase in vegetation carbon sequestration in China after 2010: A turning point resulting from climate and human interaction. Global Chang. Biol. 2021, 27, 5848–5864. [Google Scholar] [CrossRef]
  8. Chen, C.; Park, T.; Wang, X.H.; Piao, S.L.; Xu, B.D.; Chaturvedi, R.K.; Fuchs, R.; Brovkin, V.; Ciais, P.; Fensholt, R.; et al. China and India lead in greening of the world through land-use management. Nat. Sustain. 2019, 2, 122–129. [Google Scholar] [CrossRef]
  9. Wu, Y.Z.; Tang, G.P.; Gua, H.; Liu, Y.L.; Yang, M.Z.; Sun, L. The variation of vegetation greenness and underlying mechanisms in Guangdong province of China during 2001–2013 based on MODIS data. Sci. Total Environ. 2019, 653, 536–546. [Google Scholar] [CrossRef]
  10. Du, J.Q.; Quan, Z.J.; Fang, S.F.; Liu, C.C.; Wu, J.H.; Fu, Q. Spatiotemporal changes in vegetation coverage and its causes in China since the Chinese economic reform. Environ. Sci. Pollut. R. 2020, 27, 1144–1159. [Google Scholar] [CrossRef]
  11. Yuan, J.; Xu, Y.P.; Xiang, J.; Wu, L.; Wang, D.Q. Spatiotemporal variation of vegetation coverage and its associated influence factor analysis in the Yangtze River Delta, eastern China. Environ. Sci. Pollut. R. 2019, 26, 32866–32879. [Google Scholar] [CrossRef] [PubMed]
  12. Zhang, L.; Yang, L.; Zohner, C.M.; Crowther, T.W.; Li, M.C.; Shen, F.X.; Guo, M.; Qin, J.; Yao, L.; Zhou, C.H. Direct and indirect impacts of urbanization on vegetation growth across the world’s cities. Sci. Adv. 2022, 8, eabo0095. [Google Scholar] [CrossRef]
  13. Zhao, S.Q.; Liu, S.G.; Zhou, D.C. Prevalent vegetation growth enhancement in urban environment. Proc. Natl. Acad. Sci. USA 2016, 113, 6313–6318. [Google Scholar] [CrossRef] [PubMed]
  14. Geng, S.B.; Zhang, H.M.; Xie, F.; Li, L.H.; Yang, L. Vegetation Dynamics under Rapid Urbanization in the Guangdong-Hong Kong-Macao Greater Bay Area Urban Agglomeration during the Past Two Decades. Remote Sens. 2022, 14, 3993. [Google Scholar] [CrossRef]
  15. Liu, Y.; Liu, H.H.; Chen, Y.; Gang, C.C.; Shen, Y.F. Quantifying the contributions of climate change and human activities to vegetation dynamic in China based on multiple indices. Sci. Total Environ. 2022, 838, 156553. [Google Scholar] [CrossRef] [PubMed]
  16. Naeem, S.; Zhang, Y.Q.; Tian, J.; Qamer, F.M.; Latif, A.; Paul, P.K. Quantifying the Impacts of Anthropogenic Activities and Climate Variations on Vegetation Productivity Changes in China from 1985 to 2015. Remote Sens. 2020, 12, 1113. [Google Scholar] [CrossRef]
  17. Nemani, R.R.; Keeling, C.D.; Hashimoto, H.; Jolly, W.M.; Piper, S.C.; Tucker, C.J.; Myneni, R.B.; Running, S.W. Climate-driven increases in global terrestrial net primary production from 1982 to 1999. Science 2003, 300, 1560–1563. [Google Scholar] [CrossRef]
  18. Murray-Tortarolo, G.; Friedlingstein, P.; Sitch, S.; Seneviratne, S.I.; Fletcher, I.; Mueller, B.; Greve, P.; Anav, A.; Liu, Y.; Ahlstroem, A.; et al. The dry season intensity as a key driver of NPP trends. Geophys. Res. Lett. 2016, 43, 2632–2639. [Google Scholar] [CrossRef]
  19. Seddon, A.W.R.; Macias-Fauria, M.; Long, P.R.; Benz, D.; Willis, K.J. Sensitivity of global terrestrial ecosystems to climate variability. Nature 2016, 531, 16986. [Google Scholar] [CrossRef]
  20. Qiu, B.W.; Li, W.J.; Zhong, M.; Tang, Z.H.; Chen, C.C. Spatiotemporal analysis of vegetation variability and its relationship with climate change in China. Geo.-Spat. Inf. Sci. 2014, 17, 170–180. [Google Scholar] [CrossRef]
  21. Li, D.; Wu, S.; Liu, L.; Zhang, Y.; Li, S. Vulnerability of the global terrestrial ecosystems to climate change. Glob. Chang. Biol. 2018, 24, 4095–4106. [Google Scholar] [CrossRef] [PubMed]
  22. Liu, G.; Liu, H.Y.; Yin, Y. Global patterns of NDVI-indicated vegetation extremes and their sensitivity to climate extremes. Environ. Res. Lett. 2013, 8, 5009. [Google Scholar] [CrossRef]
  23. You, N.; Meng, J.; Zhu, L. Sensitivity and resilience of ecosystems to climate variability in the semi-arid to hyper-arid areas of Northern China: A case study in the Heihe River Basin. Ecol. Res. 2018, 33, 161–174. [Google Scholar] [CrossRef]
  24. Li, L.H.; Zhang, Y.L.; Liu, L.S.; Wu, J.S.; Wang, Z.F.; Li, S.C.; Zhang, H.M.; Zu, J.X.; Ding, M.J.; Paudel, B. Spatiotemporal Patterns of Vegetation Greenness Change and Associated Climatic and Anthropogenic Drivers on the Tibetan Plateau during 2000–2015. Remote Sens. 2018, 10, 1525. [Google Scholar] [CrossRef]
  25. Geng, S.B.; Li, W.; Kang, T.T.; Shi, P.L.; Zhu, W.R. An integrated index based on climatic constraints and soil quality to simulate vegetation productivity patterns. Ecol. Indic. 2021, 129, 108015. [Google Scholar] [CrossRef]
  26. Feng, D.R.; Bao, W.K.; Yang, Y.Y.; Fu, M.C. How do government policies promote greening? Evidence from China. Land Use Pol. 2021, 104, 105389. [Google Scholar] [CrossRef]
  27. Zhou, Q.; Zhao, X.; Wu, D.H.; Tang, R.Y.; Du, X.Z.; Wang, H.Y.; Zhao, J.C.; Xu, P.P.; Peng, Y.F. Impact of Urbanization and Climate on Vegetation Coverage in the Beijing-Tianjin-Hebei Region of China. Remote Sens. 2019, 11, 2452. [Google Scholar] [CrossRef]
  28. Lee, H.; Lim, B.S.; Kim, D.U.; Kim, A.R.; Seol, J.W.; Lim, C.H.; Kil, J.H.; Moon, J.S.; Lee, C.S. Decline and Passive Restoration of Forest Vegetation Around the Yeocheon Industrial Complex of Southern Korea. Forests 2020, 11, 674. [Google Scholar] [CrossRef]
  29. Delang, C.; Yuan, Z. China’s Grain for Green Program: A Review of the Largest Ecological Restoration and Rural Development Program in the World; Springer International Publishing: Cham, Switzerland, 2015. [Google Scholar]
  30. Song, W.Q.; Feng, Y.H.; Wang, Z.H. Ecological restoration programs dominate vegetation greening in China. Sci. Total Environ. 2022, 848, 157729. [Google Scholar] [CrossRef]
  31. Xie, S.D.; Mo, X.G.; Hu, S.; Liu, S.X. Contributions of climate change, elevated atmospheric CO2 and human activities to ET and GPP trends in the Three-North Region of China. Agric. For. Meteorol. 2020, 295, 108183. [Google Scholar] [CrossRef]
  32. Yang, L.; Shen, F.X.; Zhang, L.; Cai, Y.Y.; Yi, F.X.; Zhou, C.H. Quantifying influences of natural and anthropogenic factors on vegetation changes using structural equation modeling: A case study in Jiangsu Province, China. J. Clean. Prod. 2021, 280, 124330. [Google Scholar] [CrossRef]
  33. Li, H.; Li, K.X.; Zhao, X.; Zhao, J.C. Changes in Vegetation Greenness and Their Influencing Factors in Southern China. Remote Sens. 2022, 14, 3291. [Google Scholar] [CrossRef]
  34. Xiong, Q.L.; Xiao, Y.; Liang, P.H.; Li, L.J.; Zhang, L.; Li, T.; Pan, K.W.; Liu, C.G. Trends in climate change and human interventions indicate grassland productivity on the Qinghai-Tibetan Plateau from 1980 to 2015. Ecol. Indic. 2021, 129, 108010. [Google Scholar] [CrossRef]
  35. Zhao, Y.B.; Sun, R.H.; Ni, Z.Y. Identification of Natural and Anthropogenic Drivers of Vegetation Change in the Beijing-Tianjin-Hebei Megacity Region. Remote Sens. 2019, 11, 1224. [Google Scholar] [CrossRef]
  36. Wu, Y.Y.; Wu, Z.F. NPP Variability Associated with Natural and Anthropogenic Factors in the Tropic of Cancer Transect, China. Remote Sens. 2023, 15, 1091. [Google Scholar] [CrossRef]
  37. Shi, S.H.; Zhu, L.P.; Luo, Z.H.; Qiu, H. Quantitative Analysis of the Contributions of Climatic and Anthropogenic Factors to the Variation in Net Primary Productivity, China. Remote Sens. 2023, 15, 789. [Google Scholar] [CrossRef]
  38. Evans, J.; Geerken, R. Discrimination between climate and human-induced dryland degradation. J. Environ. 2004, 57, 535–554. [Google Scholar] [CrossRef]
  39. Sun, Y.L.; Yang, Y.L.; Zhang, L.; Wang, Z.L. The relative roles of climate variations and human activities in vegetation change in North China. Phys. Chem. Earth 2015, 87–88, 67–78. [Google Scholar] [CrossRef]
  40. Liu, Z.J.; Liu, Y.S.; Li, Y.R. Anthropogenic contributions dominate trends of vegetation cover change over the farming-pastoral ecotone of northern China. Ecol. Indic. 2018, 95, 370–378. [Google Scholar] [CrossRef]
  41. Wu, J.S.; Li, M.; Zhang, X.Z.; Fiedler, S.; Gao, Q.Z.; Zhou, Y.T.; Cao, W.F.; Hassan, W.; Margarint, M.C.; Tarolli, P.; et al. Disentangling climatic and anthropogenic contributions to nonlinear dynamics of alpine grassland productivity on the Qinghai-Tibetan Plateau. J. Environ. Manag. 2021, 281, 111875. [Google Scholar] [CrossRef]
  42. Tong, L.J.; Liu, Y.Y.; Wang, Q.; Zhang, Z.Y.; Li, J.L.; Sun, Z.G.; Khalifa, M. Relative effects of climate variation and human activities on grassland dynamics in Africa from 2000 to 2015. Ecol. Inform. 2019, 53, 100979. [Google Scholar] [CrossRef]
  43. Chen, T.; Bao, A.M.; Jiapaer, G.; Guo, H.; Zheng, G.X.; Jiang, L.L.; Chang, C.; Tuerhanjiang, L. Disentangling the relative impacts of climate change and human activities on arid and semiarid grasslands in Central Asia during 1982–2015. Sci. Total Environ. 2019, 653, 1311–1325. [Google Scholar] [CrossRef] [PubMed]
  44. Wu, X.Y.; Hao, Z.C.; Hao, F.H.; Zhang, X. Variations of compound precipitation and temperature extremes in China during 1961–2014. Sci. Total Environ. 2019, 663, 731–737. [Google Scholar] [CrossRef]
  45. Wang, L.D.; Hu, F.; Zhang, C.Y.; Miao, Y.C.; Chen, H.L.; Zhong, K.Y.; Luo, M.Z. Response of Vegetation to Different Climate Extremes on a Monthly Scale in Guangdong, China. Remote Sens. 2022, 14, 5369. [Google Scholar] [CrossRef]
  46. Zhang, H.W.; Lang, Y.Q. Quantifying and Analyzing the Responses of Habitat Quality to Land Use Change in Guangdong Province, China over the Past 40 Years. Land 2022, 11, 817. [Google Scholar] [CrossRef]
  47. Ye, Y.Q.; Zhang, J.E.; Wang, T.; Bai, H.; Wang, X.; Zhao, W. Changes in Land-Use and Ecosystem Service Value in Guangdong Province, Southern China, from 1990 to 2018. Land 2021, 10, 426. [Google Scholar] [CrossRef]
  48. Jonsson, P.; Eklundh, L. TIMESAT—A program for analyzing time-series of satellite sensor data. Comput. Geosci. 2004, 30, 833–845. [Google Scholar] [CrossRef]
  49. Wang, A.; Fu, J. Changes in daily climate extremes of observed temperature and precipitation in China. Atmos. Ocean. Sci. Lett. 2013, 6, 312–319. [Google Scholar]
  50. van Buuren, S.; Groothuis-Oudshoorn, K. Mice: Multivariate Imputation by Chained Equations in R. J. Stat. Softw. 2011, 45, 1–67. [Google Scholar] [CrossRef]
  51. Hutchinson, M.F.; Xu, T.B. Anusplin Version 4.2 User Guide; Centre for Resource Environmental Studies, The Australian National University: Canberra, Australia, 2004. [Google Scholar]
  52. Allen, R.G.; Pereira, L.S.; Raes, D.; Smith, M. Crop Evapotranspiration. Guidelines for Computing Crop Water Requirements; FAO Irrigation and Drainage Paper 56; Food and Agriculture Organization of the United Nations: Rome, Italy, 1998. [Google Scholar]
  53. Sen, P.K. Estimates of the Regression Coefficient Based on Kendall’s Tau. J. Am. Stat. Assoc. 1968, 63, 1379–1389. [Google Scholar] [CrossRef]
  54. Kendall, M. Rank Correlation Methods; Charles Griffin: London, UK, 1975. [Google Scholar]
  55. Theil, H. A Rank-Invariant Method of Linear and Polynomial Regression Analysis I, II, and III. Proc. K. Ned. Akad. Wet. 1950, 53, 386–392, 521–525, 1397–1412. [Google Scholar] [CrossRef]
  56. Gocic, M.; Trajkovic, S. Analysis of changes in meteorological variables using Mann-Kendall and Sen’s slope estimator statistical tests in Serbia. Glob. Planet Chang. 2013, 100, 172–182. [Google Scholar] [CrossRef]
  57. Sun, R.; Chen, S.H.; Su, H.B. Climate Dynamics of the Spatiotemporal Changes of Vegetation NDVI in Northern China from 1982 to 2015. Remote Sens. 2021, 13, 187. [Google Scholar] [CrossRef]
  58. Zhang, P.P.; Cai, Y.P.; Yang, W.; Yi, Y.J.; Yang, Z.F.; Fu, Q. Contributions of climatic and anthropogenic drivers to vegetation dynamics indicated by NDVI in a large dam-reservoir-river system. J. Clean. Prod. 2020, 256, 120477. [Google Scholar] [CrossRef]
  59. Wen, Z.F.; Wu, S.J.; Chen, J.L.; Lu, M.Q. NDVI indicated long-term interannual changes in vegetation activities and their responses to climatic and anthropogenic factors in the Three Gorges Reservoir Region, China. Sci. Total Environ. 2017, 574, 947–959. [Google Scholar] [CrossRef] [PubMed]
  60. Geerken, R.; Ilaiwi, M. Assessment of rangeland degradation and development of a strategy for rehabilitation. Remote Sens. Environ. 2004, 90, 490–504. [Google Scholar] [CrossRef]
  61. Wu, J.S.; Wang, T.; Pan, K.Y.; Li, W.F.; Huang, X.L. Assessment of forest damage caused by an ice storm using multi-temporal remote-sensing images: A case study from Guangdong Province. Int. J. Remote Sens. 2016, 37, 3125–3142. [Google Scholar] [CrossRef]
  62. Zhu, Z.C.; Piao, S.L.; Myneni, R.B.; Huang, M.T.; Zeng, Z.Z.; Canadell, J.G.; Ciais, P.; Sitch, S.; Friedlingstein, P.; Arneth, A.; et al. Greening of the Earth and its drivers. Nat. Clim. Chang. 2016, 6, 791–795. [Google Scholar] [CrossRef]
  63. Keenan, T.F.; Riley, W.J. Greening of the land surface in the world’s cold regions consistent with recent warming. Nat. Clim. Chang. 2018, 8, 825–828. [Google Scholar] [CrossRef]
  64. Murata, N.; Takahashi, S.; Nishiyama, Y.; Allakhverdiev, S.I. Photoinhibition of photosystem II under environmental stress. Biochim. Et Biophys. Acta (BBA)-Bioenerg. 2007, 1767, 414–421. [Google Scholar] [CrossRef]
  65. Tian, C.S.; Liu, X.L.; Wang, J. Geohazard susceptibility assessment based on CF model and Logistic regression models in Guangdong. Hydrogeol. Eng. Geol. 2016, 43, 154–161+170. (In Chinese) [Google Scholar]
  66. Qu, S.; Wang, L.C.; Lin, A.W.; Zhu, H.J.; Yuan, M.X. What drives the vegetation restoration in Yangtze River basin, China: Climate change or anthropogenic factors? Ecol. Indic. 2018, 90, 438–450. [Google Scholar] [CrossRef]
  67. Qu, S.; Wang, L.C.; Lin, A.W.; Yu, D.Q.; Yuan, M.X.; Li, C.A. Distinguishing the impacts of climate change and anthropogenic factors on vegetation dynamics in the Yangtze River Basin, China. Ecol. Indic. 2020, 108, 105724. [Google Scholar] [CrossRef]
  68. Eslamian, S.; Khordadi, M.J.; Abedi-Koupai, J. Effects of variations in climatic parameters on evapotranspiration in the arid and semi-arid regions. Glob. Planet Chang. 2011, 78, 188–194. [Google Scholar] [CrossRef]
  69. Yinglan, A.; Wang, G.Q.; Liu, T.X.; Xue, B.L.; Kuczera, G. Spatial variation of correlations between vertical soil water and evapotranspiration and their controlling factors in a semi-arid region. J. Hydrol. 2019, 574, 53–63. [Google Scholar] [CrossRef]
  70. Wang, L.D.; Hu, F.; Miao, Y.C.; Zhang, C.Y.; Zhang, L.; Luo, M.Z. Changes in Vegetation Dynamics and Relations with Extreme Climate on Multiple Time Scales in Guangxi, China. Remote Sens. 2022, 14, 2013. [Google Scholar] [CrossRef]
  71. Jiang, C.; Wu, Z.F.; Cheng, J.; Yu, Q.; Rao, X.Q. Impacts of urbanization on net primary productivity in the Pearl River Delta, China. Int. J. Plant Prod. 2015, 9, 581–598. [Google Scholar]
  72. Jiang, C.; Wang, Y.X.; Wei, S.J.; Wu, Z.P.; Zeng, Y.H.; Wang, J.; Zhao, Y.; Yang, Z.Y. Achieving balance between socioeconomic development and ecosystem conservation via policy adjustments in Guangdong Province of southeastern China. Environ. Sci. Pollut. R. 2023, 30, 41187–41208. [Google Scholar] [CrossRef]
  73. Zhou, C.Y.; Wei, X.H.; Zhou, G.Y.; Yan, J.H.; Wang, X.; Wang, C.L.; Liu, H.G.; Tang, X.Y.; Zhang, Q.M. Impacts of a large-scale reforestation program on carbon storage dynamics in Guangdong, China. For. Ecol. Manag. 2008, 255, 847–854. [Google Scholar] [CrossRef]
  74. Pei, F.S.; Li, X.; Liu, X.P.; Wang, S.J.; He, Z.J. Assessing the differences in net primary productivity between pre- and post-urban land development in China. Agric. For. Meteorol. 2013, 171–172, 174–186. [Google Scholar] [CrossRef]
  75. Los, S.O. Analysis of trends in fused AVHRR and MODIS NDVI data for 1982–2006: Indication for a CO2 fertilization effect in global vegetation. Glob. Biogeochem. Cycles 2013, 27, 318–330. [Google Scholar] [CrossRef]
  76. Greaver, T.L.; Clark, C.M.; Compton, J.E.; Vallano, D.; Talhelm, A.F.; Weaver, C.P.; Band, L.E.; Baron, J.S.; Davidson, E.A.; Tague, C.L.; et al. Key ecological responses to nitrogen are altered by climate change. Nat. Clim. Chang. 2016, 6, 836–843. [Google Scholar] [CrossRef]
  77. Luo, Y.Q.; Jiang, L.F.; Niu, S.L.; Zhou, X.H. Nonlinear responses of land ecosystems to variation in precipitation. New Phytol. 2017, 214, 5–7. [Google Scholar] [CrossRef]
  78. Burkett, V.R.; Wilcox, D.A.; Stottlemyer, R.; Barrow, W.; Fagre, D.; Baron, J.; Price, J.; Nielsen, J.L.; Allen, C.D.; Peterson, D.L.; et al. Nonlinear dynamics in ecosystem response to climatic change: Case studies and policy implications. Ecol. Complex. 2005, 2, 357–394. [Google Scholar] [CrossRef]
  79. Horn, K.J.; St Clair, S.B. Wildfire and exotic grass invasion alter plant productivity in response to climate variability in the Mojave Desert. Landsc. Ecol. 2017, 32, 635–646. [Google Scholar] [CrossRef]
  80. Yang, S.K.; Liu, J.; Wang, C.H.; Zhang, T.; Dong, X.H.; Liu, Y.L. Vegetation dynamics influenced by climate change and human activities in the Hanjiang River Basin, central China. Ecol. Indic. 2022, 145, 109586. [Google Scholar] [CrossRef]
Figure 1. The geographical location (a) and eco-regions (b) of Guangdong Province and spatial distributions of NDVI (c), MAT (d), MAP (e), and MAR (f). Eco-regions of Guangdong Province in panel (c): NG—the northern Guangdong eco-region, MG—the middle Guangdong eco-region, SG—the southern Guangdong eco-region, PRD—the Pearl River Delta eco-region. NDVI—normalized difference vegetation index; MAT—mean annual temperature; MAP—mean annual precipitation; MAR—mean annual radiation.
Remotesensing 15 05377 g001
Figure 2. The flowchart of methods. NDVI—normalized difference vegetation index; TEM—temperature; PRE—precipitation; RAD—radiation.
Remotesensing 15 05377 g002
Figure 3. NDVI trends in Guangdong Province during 2001–2020. (a) Spatial pattern of NDVI trends; (b) Area percentage of NDVI trends for eco-regions; (c) Area-averaged NDVI trends for eco-regions. The label with a percentage less than 1% was hidden in panel (b). The four eco-regions: NG—the northern Guangdong eco-region, MG—the middle Guangdong eco-region, SG—the southern Guangdong eco-region, PRD—the Pearl River Delta eco-region. GD—Guangdong Province.
Remotesensing 15 05377 g003
Figure 4. Spatial patterns of trends for temperature (TEM, (a)), precipitation (PRE, (b)), and radiation (RAD, (c)) in Guangdong Province from 2000 to 2020. The four eco-regions: NG—the northern Guangdong eco-region, MG—the middle Guangdong eco-region, SG—the southern Guangdong eco-region, PRD—the Pearl River Delta eco-region.
Remotesensing 15 05377 g004
Figure 5. Spatial distributions of partial correlations between NDVI and temperature (TEM, (a)), precipitation (PRE, (b)), and radiation (RAD, (c)). The significance of the partial correlation: SN—significant negative correlation, NN—non-significant negative correlation, NP—non-significant positive correlation, SP—significant positive correlation. The four eco-regions: NG—the northern Guangdong eco-region, MG—the middle Guangdong eco-region, SG—the southern Guangdong eco-region, PRD—the Pearl River Delta eco-region.
Remotesensing 15 05377 g005
Figure 6. Spatial pattern (a) and area percentage (b) of the dominant climatic factor in driving NDVI variations for eco-regions. The three climatic factors: TEM—temperature, PRE—precipitation, RAD—radiation. The four eco-regions: NG—the northern Guangdong eco-region, MG—the middle Guangdong eco-region, SG—the southern Guangdong eco-region, PRD—the Pearl River Delta eco-region. GD—Guangdong Province.
Remotesensing 15 05377 g006
Figure 7. Spatial distributions of the relative role of climate change (a) and human activities (b) in NDVI variations. The four eco-regions: NG—the northern Guangdong eco-region, MG—the middle Guangdong eco-region, SG—the southern Guangdong eco-region, PRD—the Pearl River Delta eco-region.
Remotesensing 15 05377 g007
Figure 8. Contribution types of climate change and human activities to NDVI changes. (a) Spatial pattern of the contribution types; (b) Area percentage of the contribution types among eco-regions. The label with a percentage less than 1% was hidden in panel (b). The six contribution types: CI—climate change induced vegetation improvement, HI—human activities induced vegetation improvement, BI—both climate change and human activities induced vegetation improvement, CD—climate change induced vegetation degradation, HD—human activities induced vegetation degradation, BD—both climate change and human activities induced vegetation degradation. The four eco-regions: NG—the northern Guangdong eco-region, MG—the middle Guangdong eco-region, SG—the southern Guangdong eco-region, PRD—the Pearl River Delta eco-region.
Remotesensing 15 05377 g008
Table 1. Trend magnitude classification of the Theil–Sen median trend analysis.
SxZTrend Magnitude
Sx > 0|Z| > 1.96Significant increase
Sx > 0|Z| ≤ 1.96Slight increase
Sx < 0|Z| > 1.96Significant decrease
Sx < 0|Z| ≤ 1.96Slight decrease
Table 2. Relative contributions of climate change and human activities to vegetation change [39].
Vegetation TrendScenarioRelative Contribution (%)Contribution Classification
slopepresloperesClimate ChangeHuman Activity
Increase>0<01000Climate change induced vegetation improvement (CI).
(slopeobs > 0)<0>00100Human activities induced vegetation improvement (HI).
>0>0 s l o p e p r e s l o p e o b s × 100 s l o p e r e s s l o p e o b s × 100 Both climate change and human activities induced vegetation improvement (BI).
Decrease<0>01000Climate change induced vegetation degradation (CD).
(slopeobs < 0)>0<00100Human activities induced vegetation degradation (HD)
<0<0 s l o p e p r e s l o p e o b s × 100 s l o p e r e s s l o p e o b s × 100 Both climate change and human activities induced vegetation degradation (BD)
Disclaimer/Publisher’s Note: The statements, opinions and data contained in all publications are solely those of the individual author(s) and contributor(s) and not of MDPI and/or the editor(s). MDPI and/or the editor(s) disclaim responsibility for any injury to people or property resulting from any ideas, methods, instructions or products referred to in the content.

