


Integrated Remote Sensing Observations of Radiative Properties and Sources of the Aerosols in Southeast Asia: The Case of Thailand

Abstract
:
1. Introduction
2. Methodology
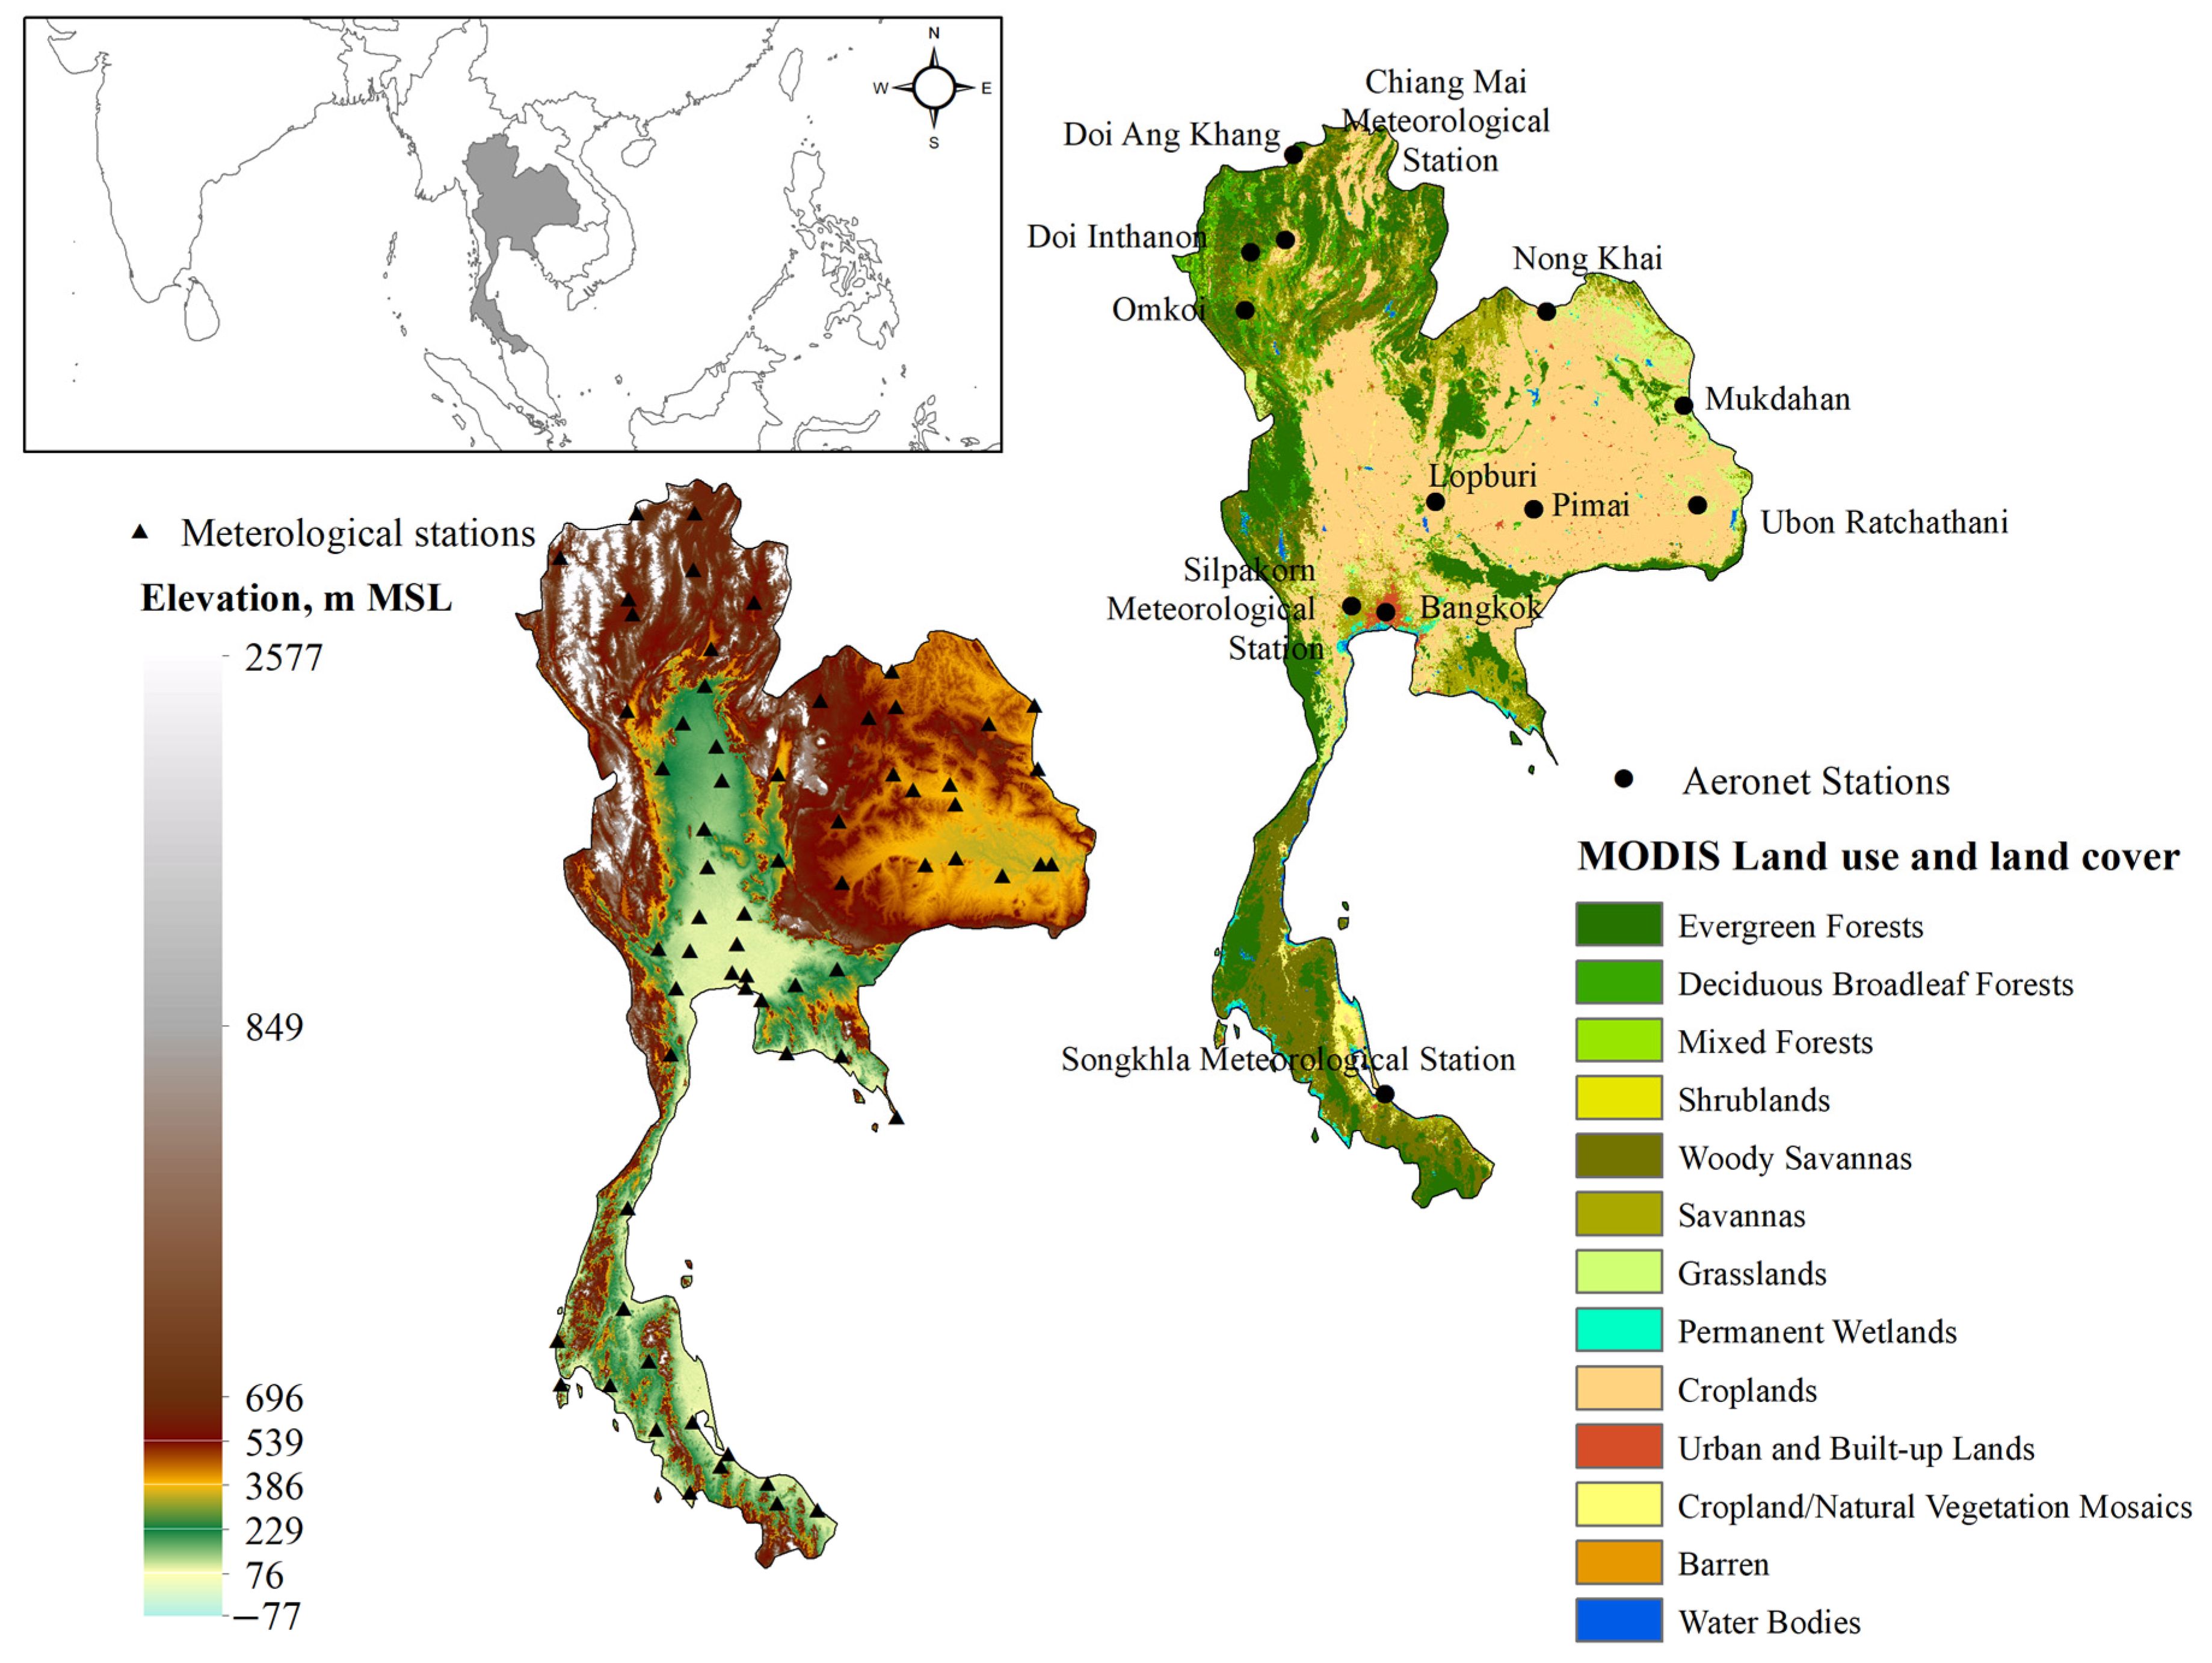
2.1. Study Area
2.2. Data Description
- The Version 2 AERONET (Aerosol Robotic Network) inversion aerosol L2 (cloud-screened and quality-assured) product from 12 ground stations across Thailand was acquired interactively via the AERONET Aerosol Robotic Network, NASA website, https://aeronet.gsfc.nasa.gov/, accessed on 1 August 2020. The stations are listed in Table 1. The AERONET aerosol products are measured using sun and sky photometers to calculate direct and diffuse radiation. The AERONET product used in this study includes the following parameters [15]:
- ○
- The Angstrom exponent (AE) is the log–slope exponent of the spectral aerosol optical depth between 440 nm and 870 nm wavelengths. It indicates the sensitivity of the aerosol scattering properties to the wavelength of the incoming electromagnetic radiation. If the AE approaches zero, it suggests a prominent coarse-sized aerosol. In contrast, an AE close to four suggests that the aerosol size is comparable to that of air molecules and can better scatter light at shorter wavelengths.
- ○
- The single-scattering albedo (SSA) is the ratio of the scattering coefficient to the extinction coefficient (combined scattering and adsorption effects). An aerosol with an SSA close to one tends to scatter light well, whereas the SSA closer to zero exhibits light absorbing potential [16]. In this study, the AERONET SSA was referred to at 440, 675, 870, and 1020 nm wavelengths.
- ○
- The complex refractive index indicates the aerosol’s light scattering (real part) and light absorbing (imaginary part) properties. This study measured the refractive index for 440, 675, 870, and 1020 nm wavelengths.
- ○
- The asymmetry parameter indicates the asymmetry of light scattering for all directions around the aerosol. When the factor is close to zero, it suggests the perfect symmetry of light scattering, whereas forward light scattering is associated with a positive asymmetry parameter of about 0.85. In this study, the asymmetry parameter was measured for 440, 675, 870, and 1020 nm wavelengths.
- ○
- The effective radius is estimated, based on the size distribution of the particle number.
- ○
- The aerosol optical depth (AOD) is the extinction (both scattering and absorption) of the solar beam attributed to the aerosol. In this study, the AERONET AOD was measured at 500 nm using the direct sun algorithm. The AOD is widely used to imply atmospheric aerosol loading [15].
- 2.
- This study utilized several products from the Moderate Resolution Imaging Spectroradiometer (MODIS), an instrument developed and operated by the United States’ National Aeronautics and Space Administration (NASA). The MODIS is onboard both the Terra and Aqua satellites, passing the equator twice a day at about 10:30 a.m. and about 1:30 p.m., respectively. Thus, the combined products from both satellites could help determine the daily dynamics of the land and atmosphere across Thailand. Details on the MODIS products used in this study are as follows.
- 1.
- The land cover classification for 2018–2019 from the MODIS sensor onboard the Terra and Aqua satellites (MCD12Q1 Version 6) were used in this study. The products are provided at annual time steps, with a 500 m spatial resolution. In this study, we used the University of Maryland (UMD) legend, and the land cover for Thailand is shown in Figure 1. The land cover was reclassified into four types before analysis: forest (combined evergreen forests, deciduous broadleaf forests, and mixed forests), savannas (woody savannas, savannas, and grasslands), croplands (croplands and cropland mosaics), and urban (urban and built-up lands). The analysis relied on the % grid of each land cover type within a 5 km radius centered at the studied sites.
- 2.
- The daily Level 3 MODIS-based PM2.5 (particulate matter with a size of 2.5 μm or smaller) air quality index (AQI) was acquired from the Geo-Informatics and Space Technology Development Agency, Thailand (GISTDA). The product was generated using the Level 2 MODIS aerosol optical depth, AOD, from the Terra satellite (MOD04). The product was downscaled to 66 meteorological stations.
- 3.
- The near real-time MODIS Thermal Anomalies/Fire Locations, Collection 6 (MCD14DL) has a spatial resolution of 1 km, and was acquired from the Fire Information of Resource Management System (FIRMS) via https://firms.modaps.eosdis.nasa.gov/active_fire/, accessed on 15 August 2020. This study used the location of active fires to assess the fraction of fire pixels within the 5 km radius centered at studied sites.
- 3.
- The Shuttle Radar Topography Mission (SRTM) digital elevation model (DEM) was acquired online from the USGS Earth Explorer via https://earthexplorer.usgs.gov/, accessed on 15 August 2020. The product has a spatial resolution of 1 arc second, or about 30 m. The DEM for Thailand is illustrated in Figure 1.
- 4.
- The ground-based meteorological dataset was acquired from 66 stations of the Thai Meteorology Department (see the locations in Figure 1) located across the country. The dataset includes daily rainfall, relative humidity, air temperature, air pressure, and wind speed about 10 m above ground level.
- 5.
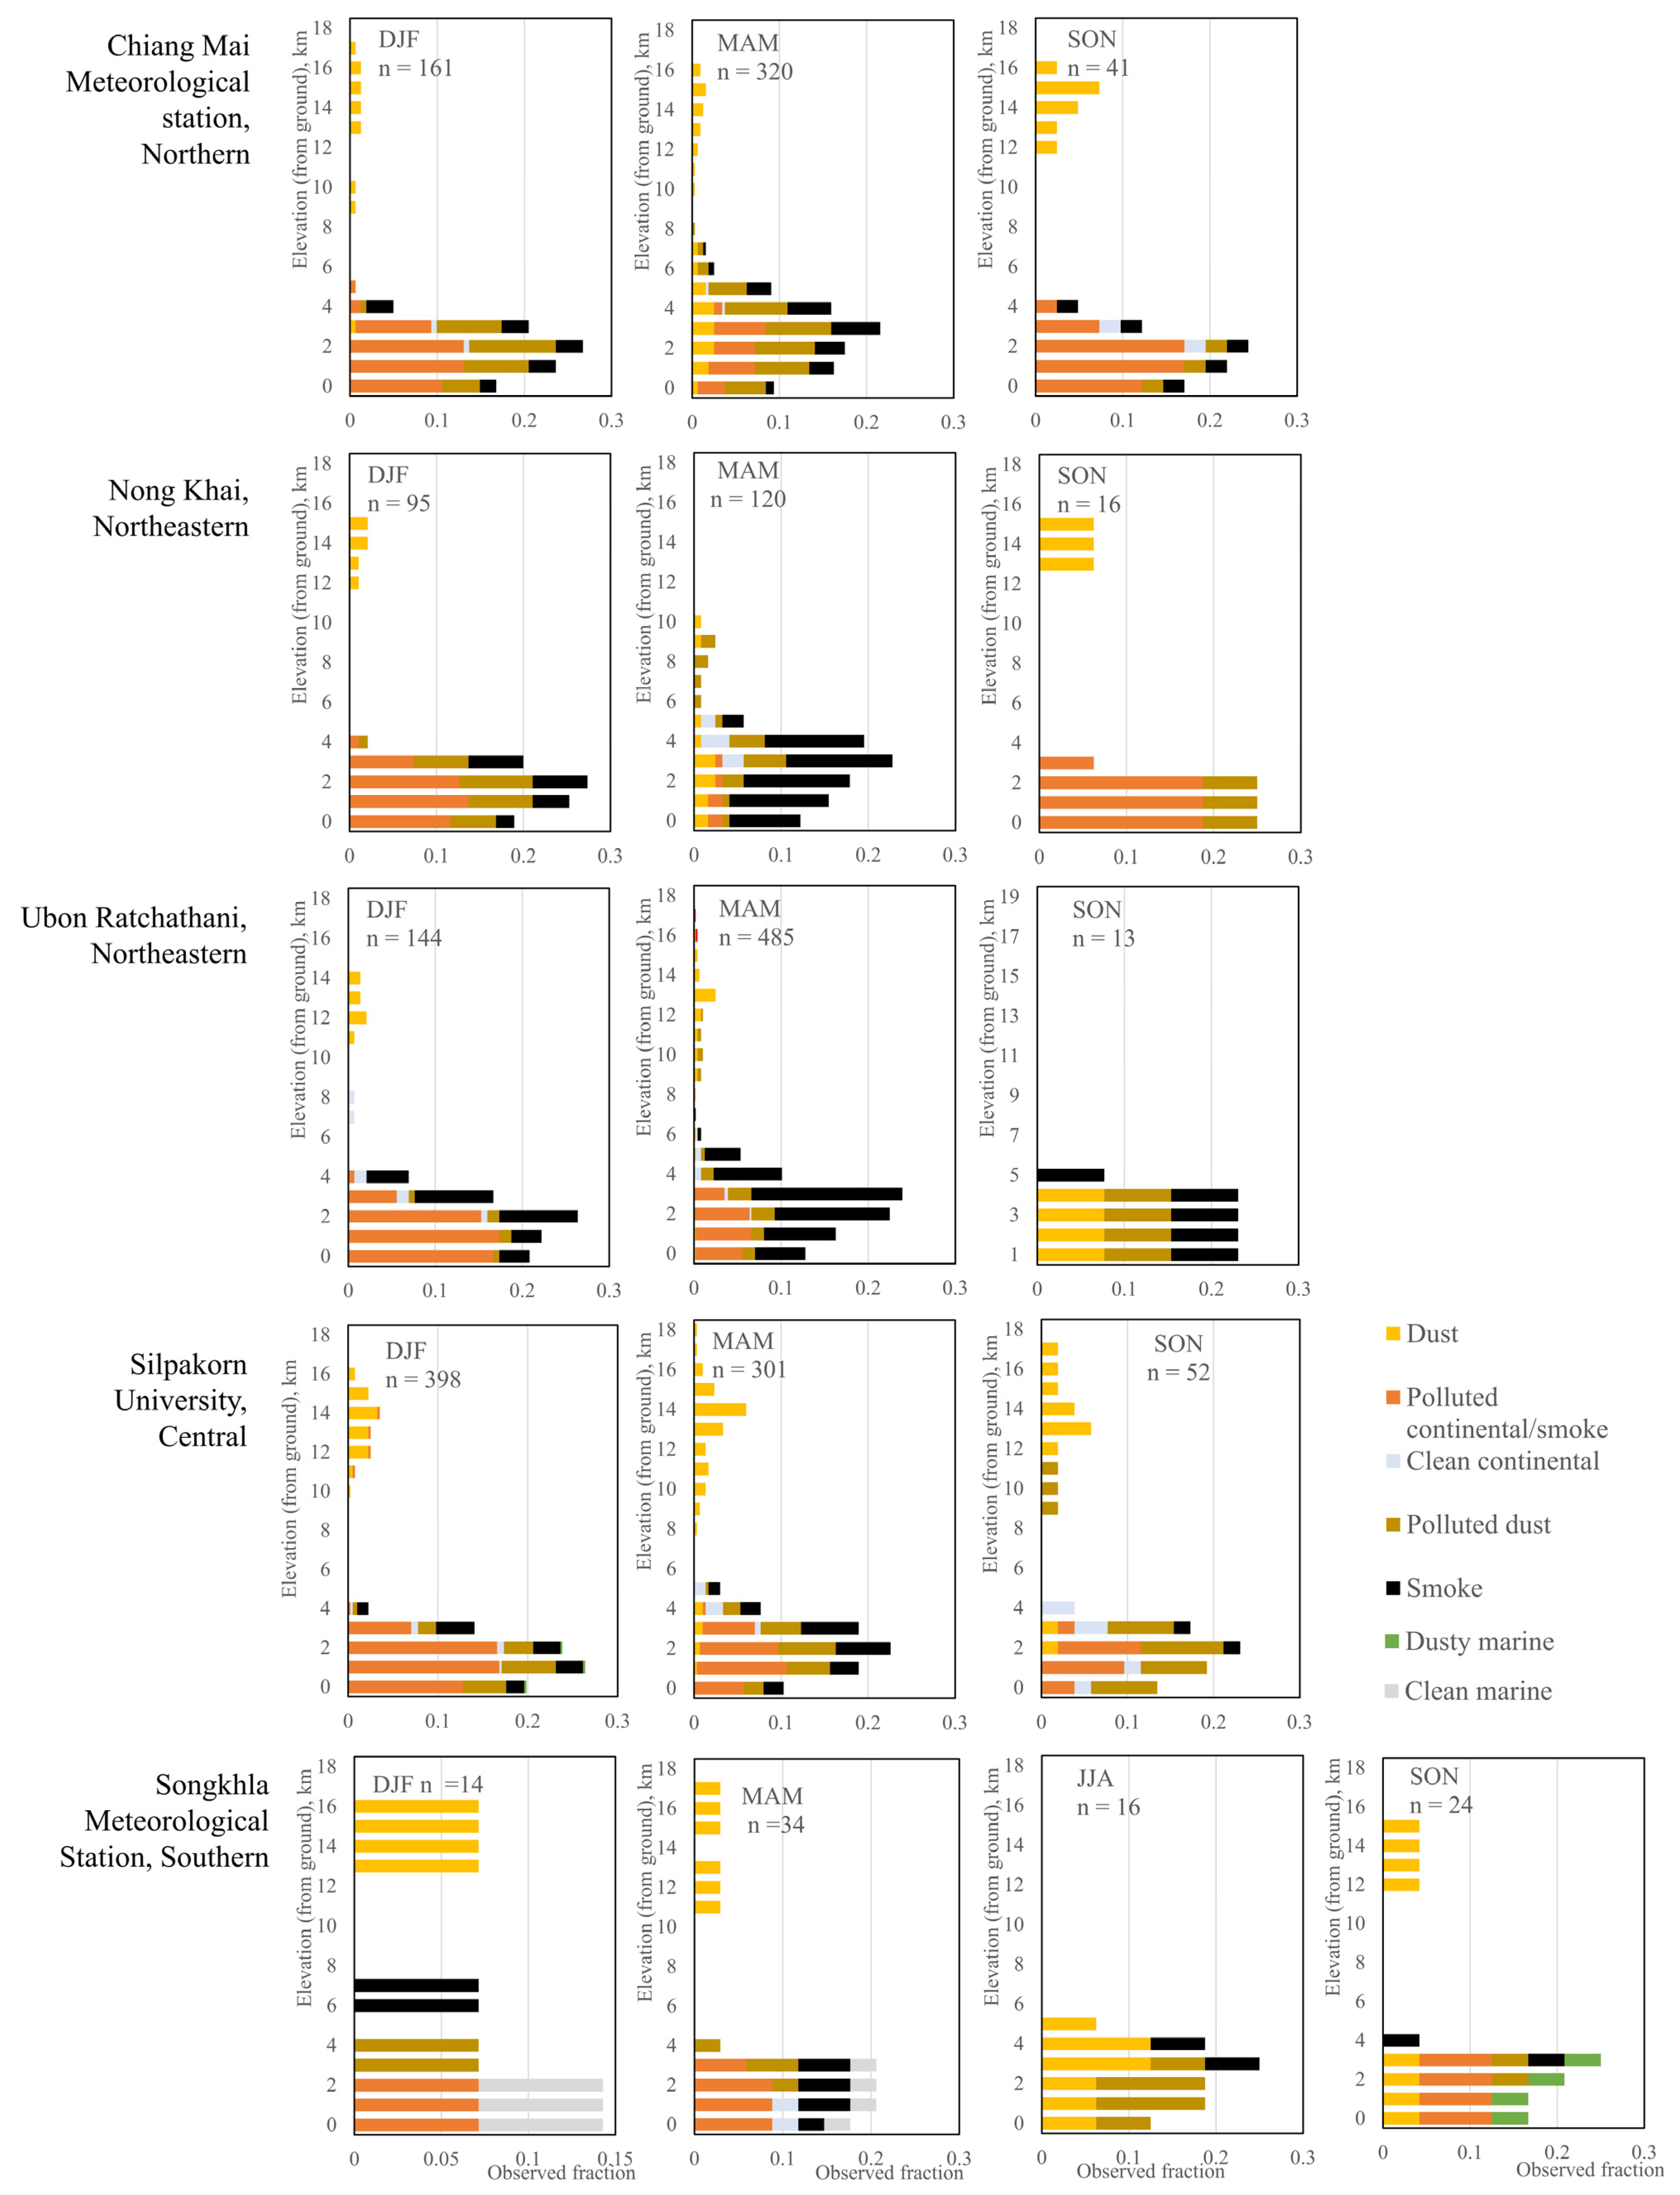
- The Lidar vertical aerosol type dataset was retrieved by the Cloud-Aerosol Lidar with Orthogonal Polarization (CALIOP) instrument onboard the Cloud-Aerosol Lidar and Infrared Pathfinder Satellite Observation (CALIPSO) through CALIPSO’s web-based search and sub-setting web application (https://subset.larc.nasa.gov/calipso/login.php, accessed on 23 October 2020). The CALIOP retrieval algorithm reports seven tropospheric aerosol subtypes by considering the aerosol Lidar ratio at 532 nm and 1064 nm. The aerosol subtypes are clean marine, dust, polluted continental/smoke, clean continental, polluted dust, elevated smoke, and dusty marine [17]. In this study, the CALIOP aerosol vertical profiles were retrieved for the areas close to (±1°) of the five locations (see Table 1), which were the Chiang Mai Meteorological Station (in the North) for the years 2010–2016, Silpakorn University (Central) for the years 2010–2019, Nong Khai (Northeast) for the years 2015–2019, Ubon Ratchathani (Northeast) for the years 2010–2019, and the Songkhla Meteorological Station (South) for the years 2010–2019. These stations were selected for their spatial correspondence to the AERONET stations and the air quality monitoring stations operated by the Pollution Control Department (PCD), Thailand. In this study, the CALIOP aerosol subtype product illustrates seasonal vertical aerosol profiles at the stations. There profiles provide evidence for inferring or supporting conclusions about possible sources for each aerosol cluster, based on their seasonal preferences.
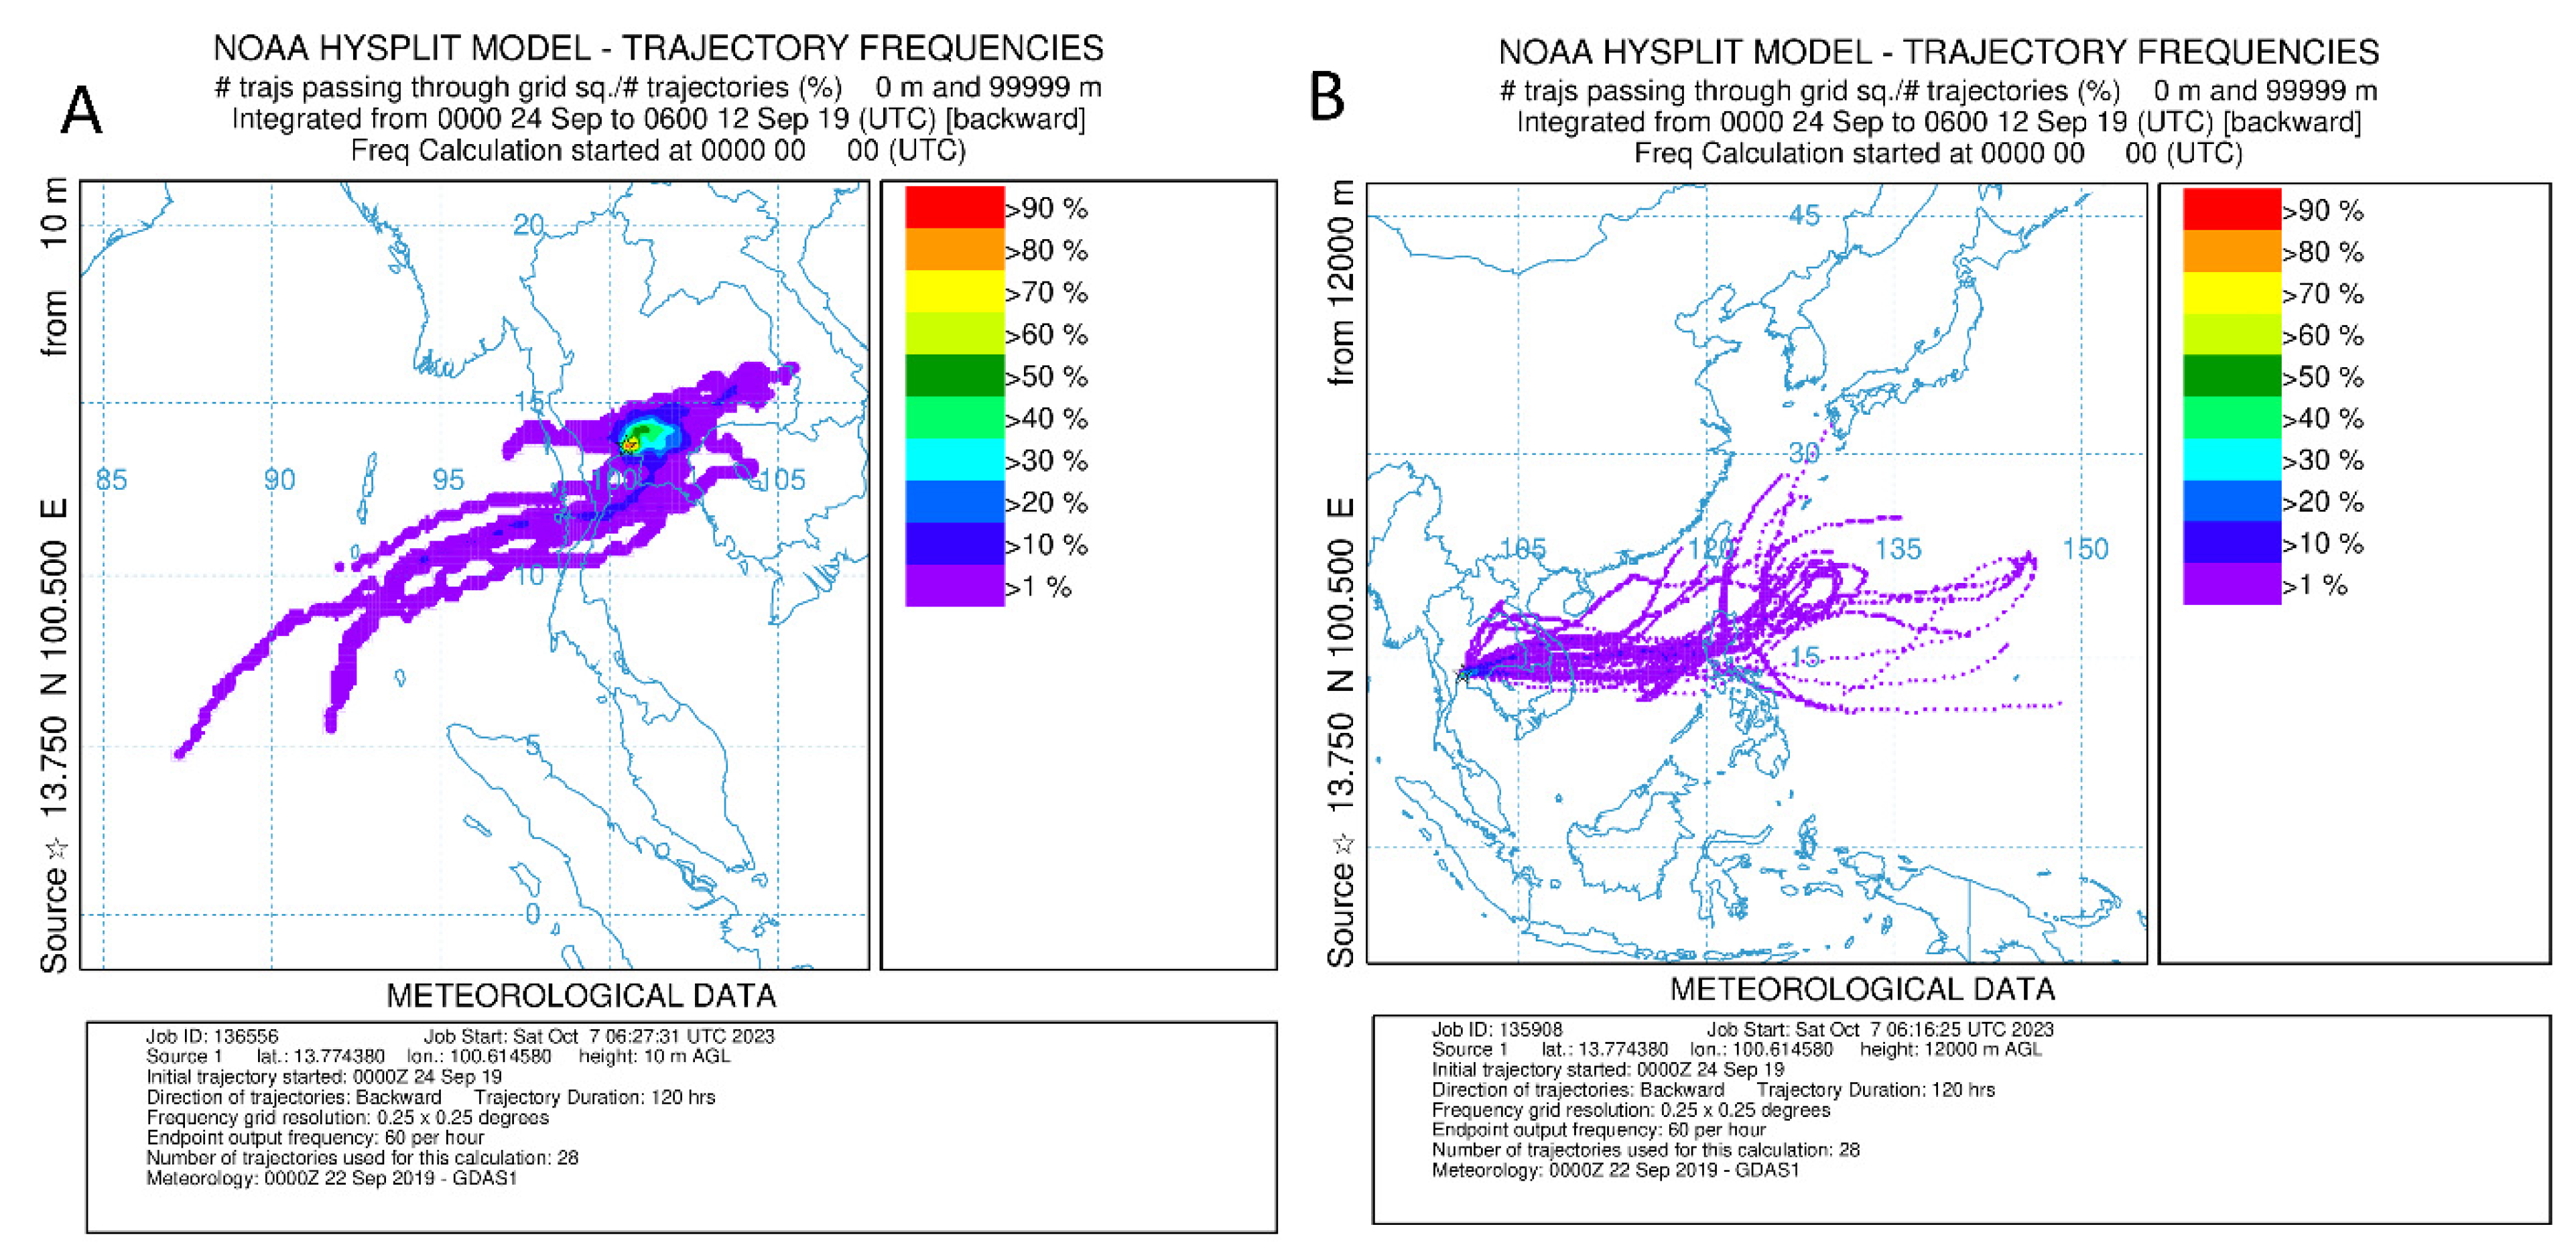
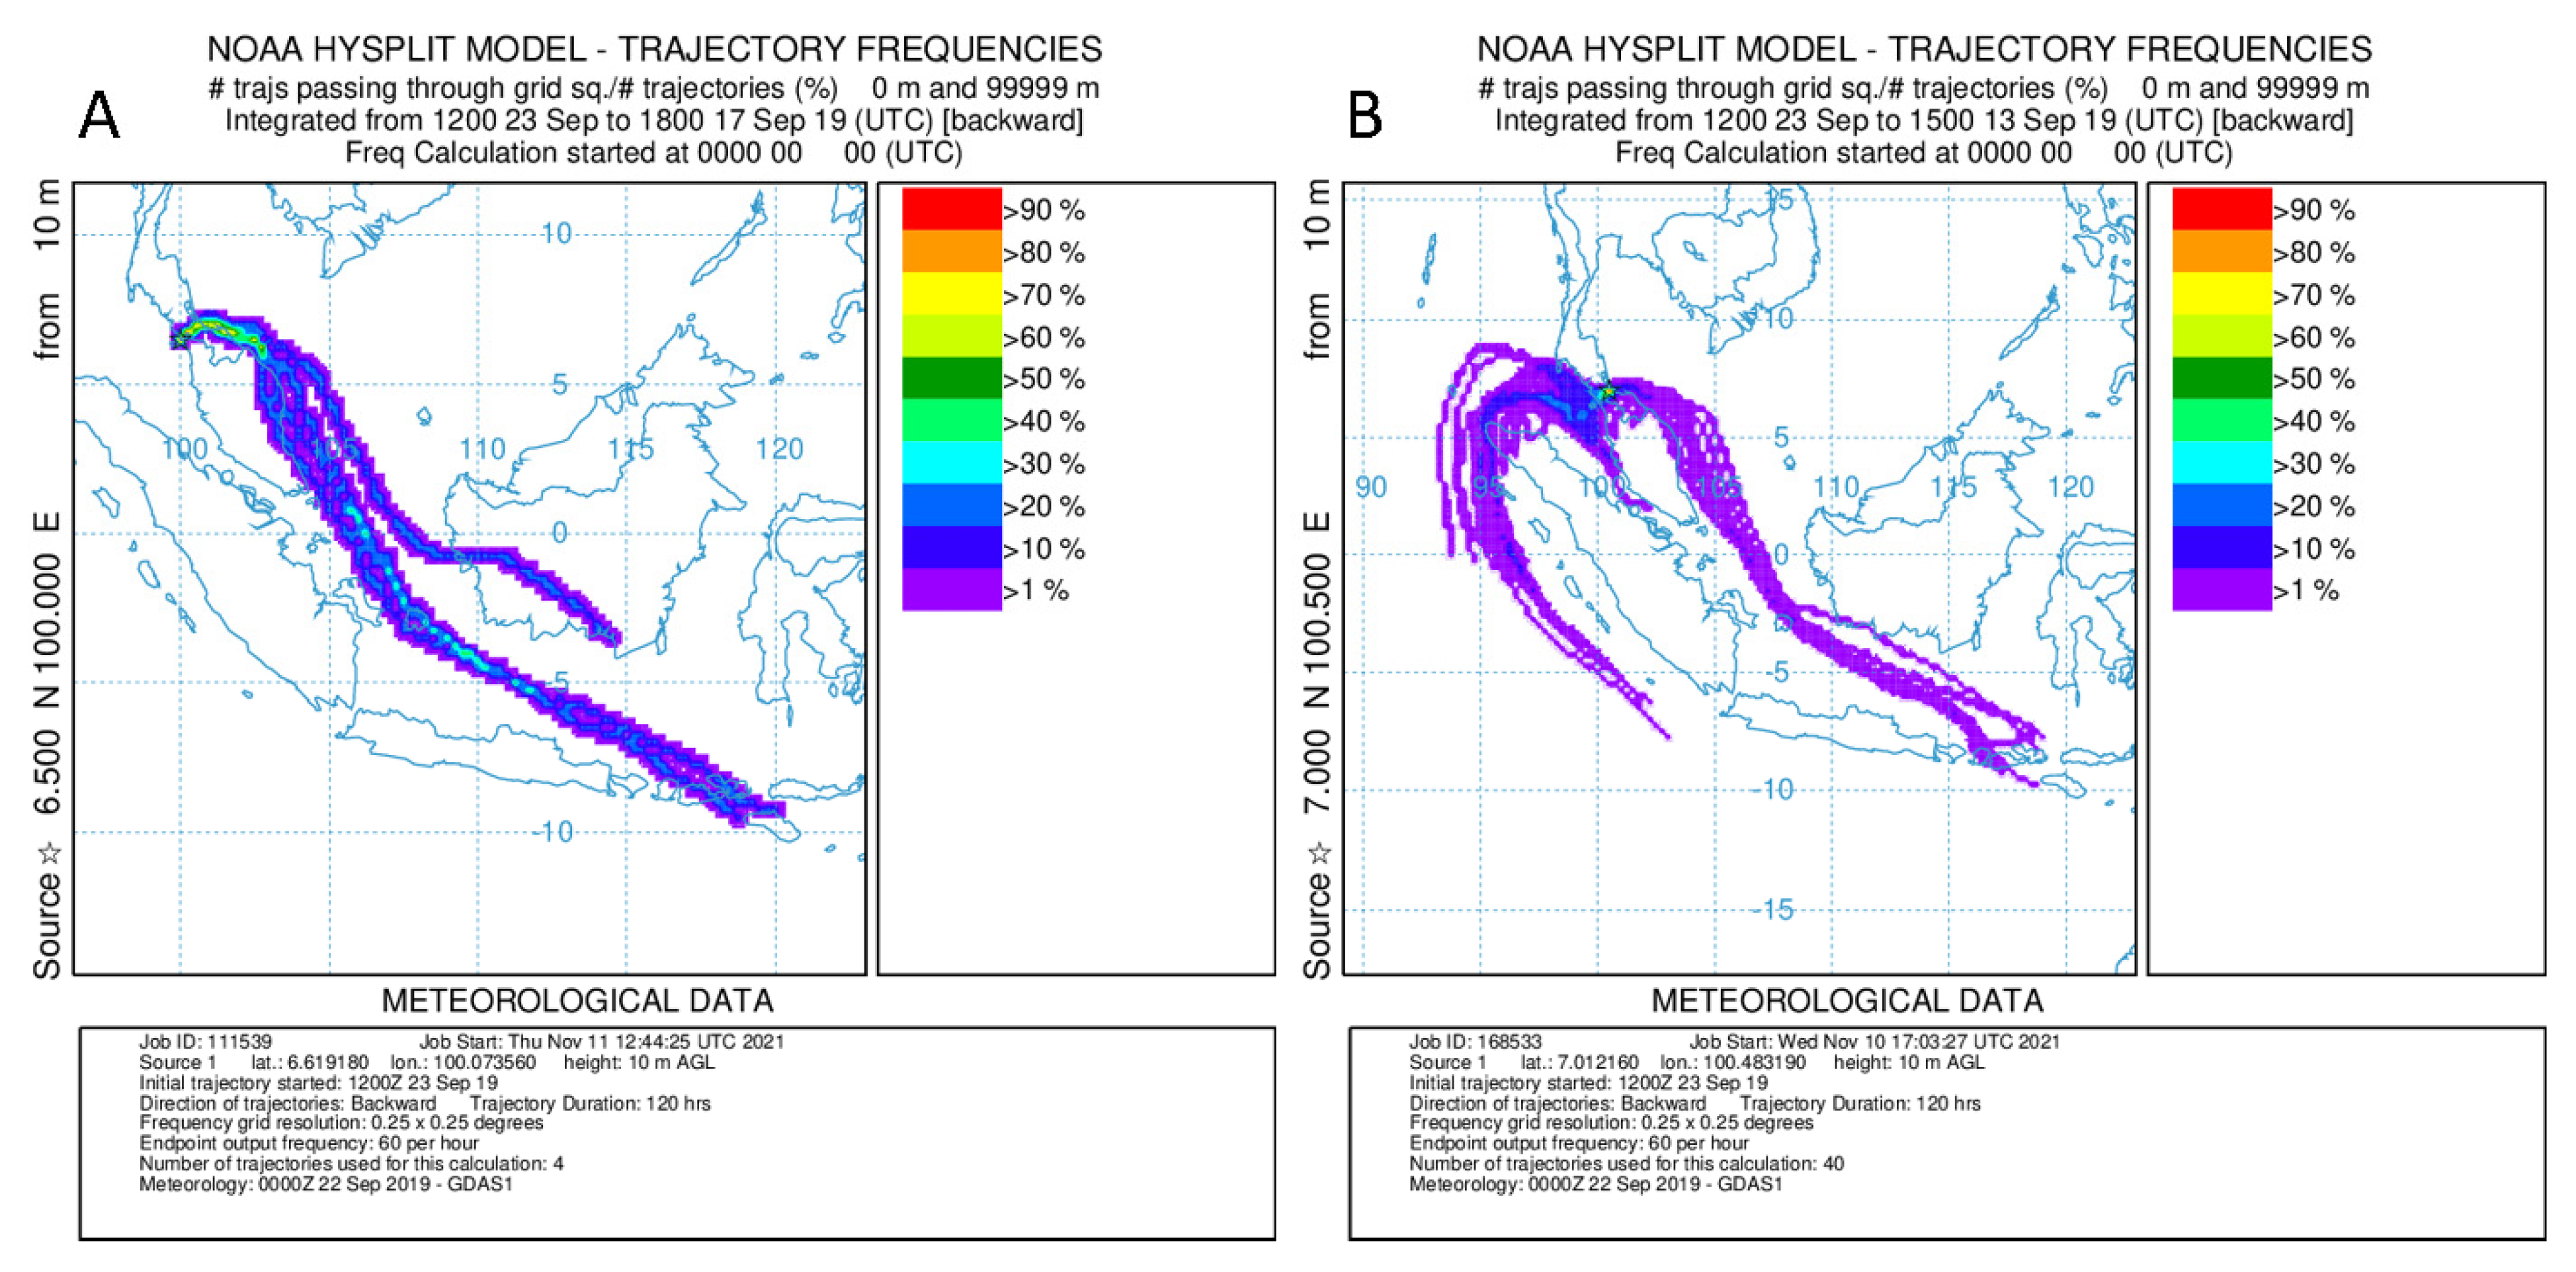
2.3. Source Identification Using the HYSPLIT Backward Trajectory Model
2.4. Data Analysis
- Cluster analysis was used for classifying aerosol types using the AERONET aerosol optical parameters. In this study, Ward’s minimum variance method was used for clustering. In the Ward’s method, each observation is treated as a separate cluster, and subsequently, the clusters are iteratively combined in a way that minimizes the total within-cluster variance. Seven aerosol types were chosen in this study, according to dendrogram analysis. The dendrogram is a tree-like diagram that visually represents the process of merging clusters in the hierarchical clustering analysis (refer to the dendrogram for this study in Appendix A). The analysis was performed using MATLAB R2020b from MathWorks. The inherent patterns of aerosol optical parameters are reported and discussed for each aerosol cluster.
- Kriging interpolation was used to interpolate the point observations of the meteorological parameters at 66 stations to the spatial information at 12 AERONET stations. A variogram model in the kriging interpolation is a mathematical representation of the spatial relationship among data points, and it helps in the estimation of values at unsampled locations, based on spatial autocorrelation. In this study, the variogram model was developed using either Gaussian or exponential functions, depending on which provided the better fit, based on visual inspection. The spatial information was later used for discriminant analysis. The interpolation was conducted using the Spatial Analyst Tools of ArcMap 10.5.1 in Esri’s ArcGIS 10.5.1 software.
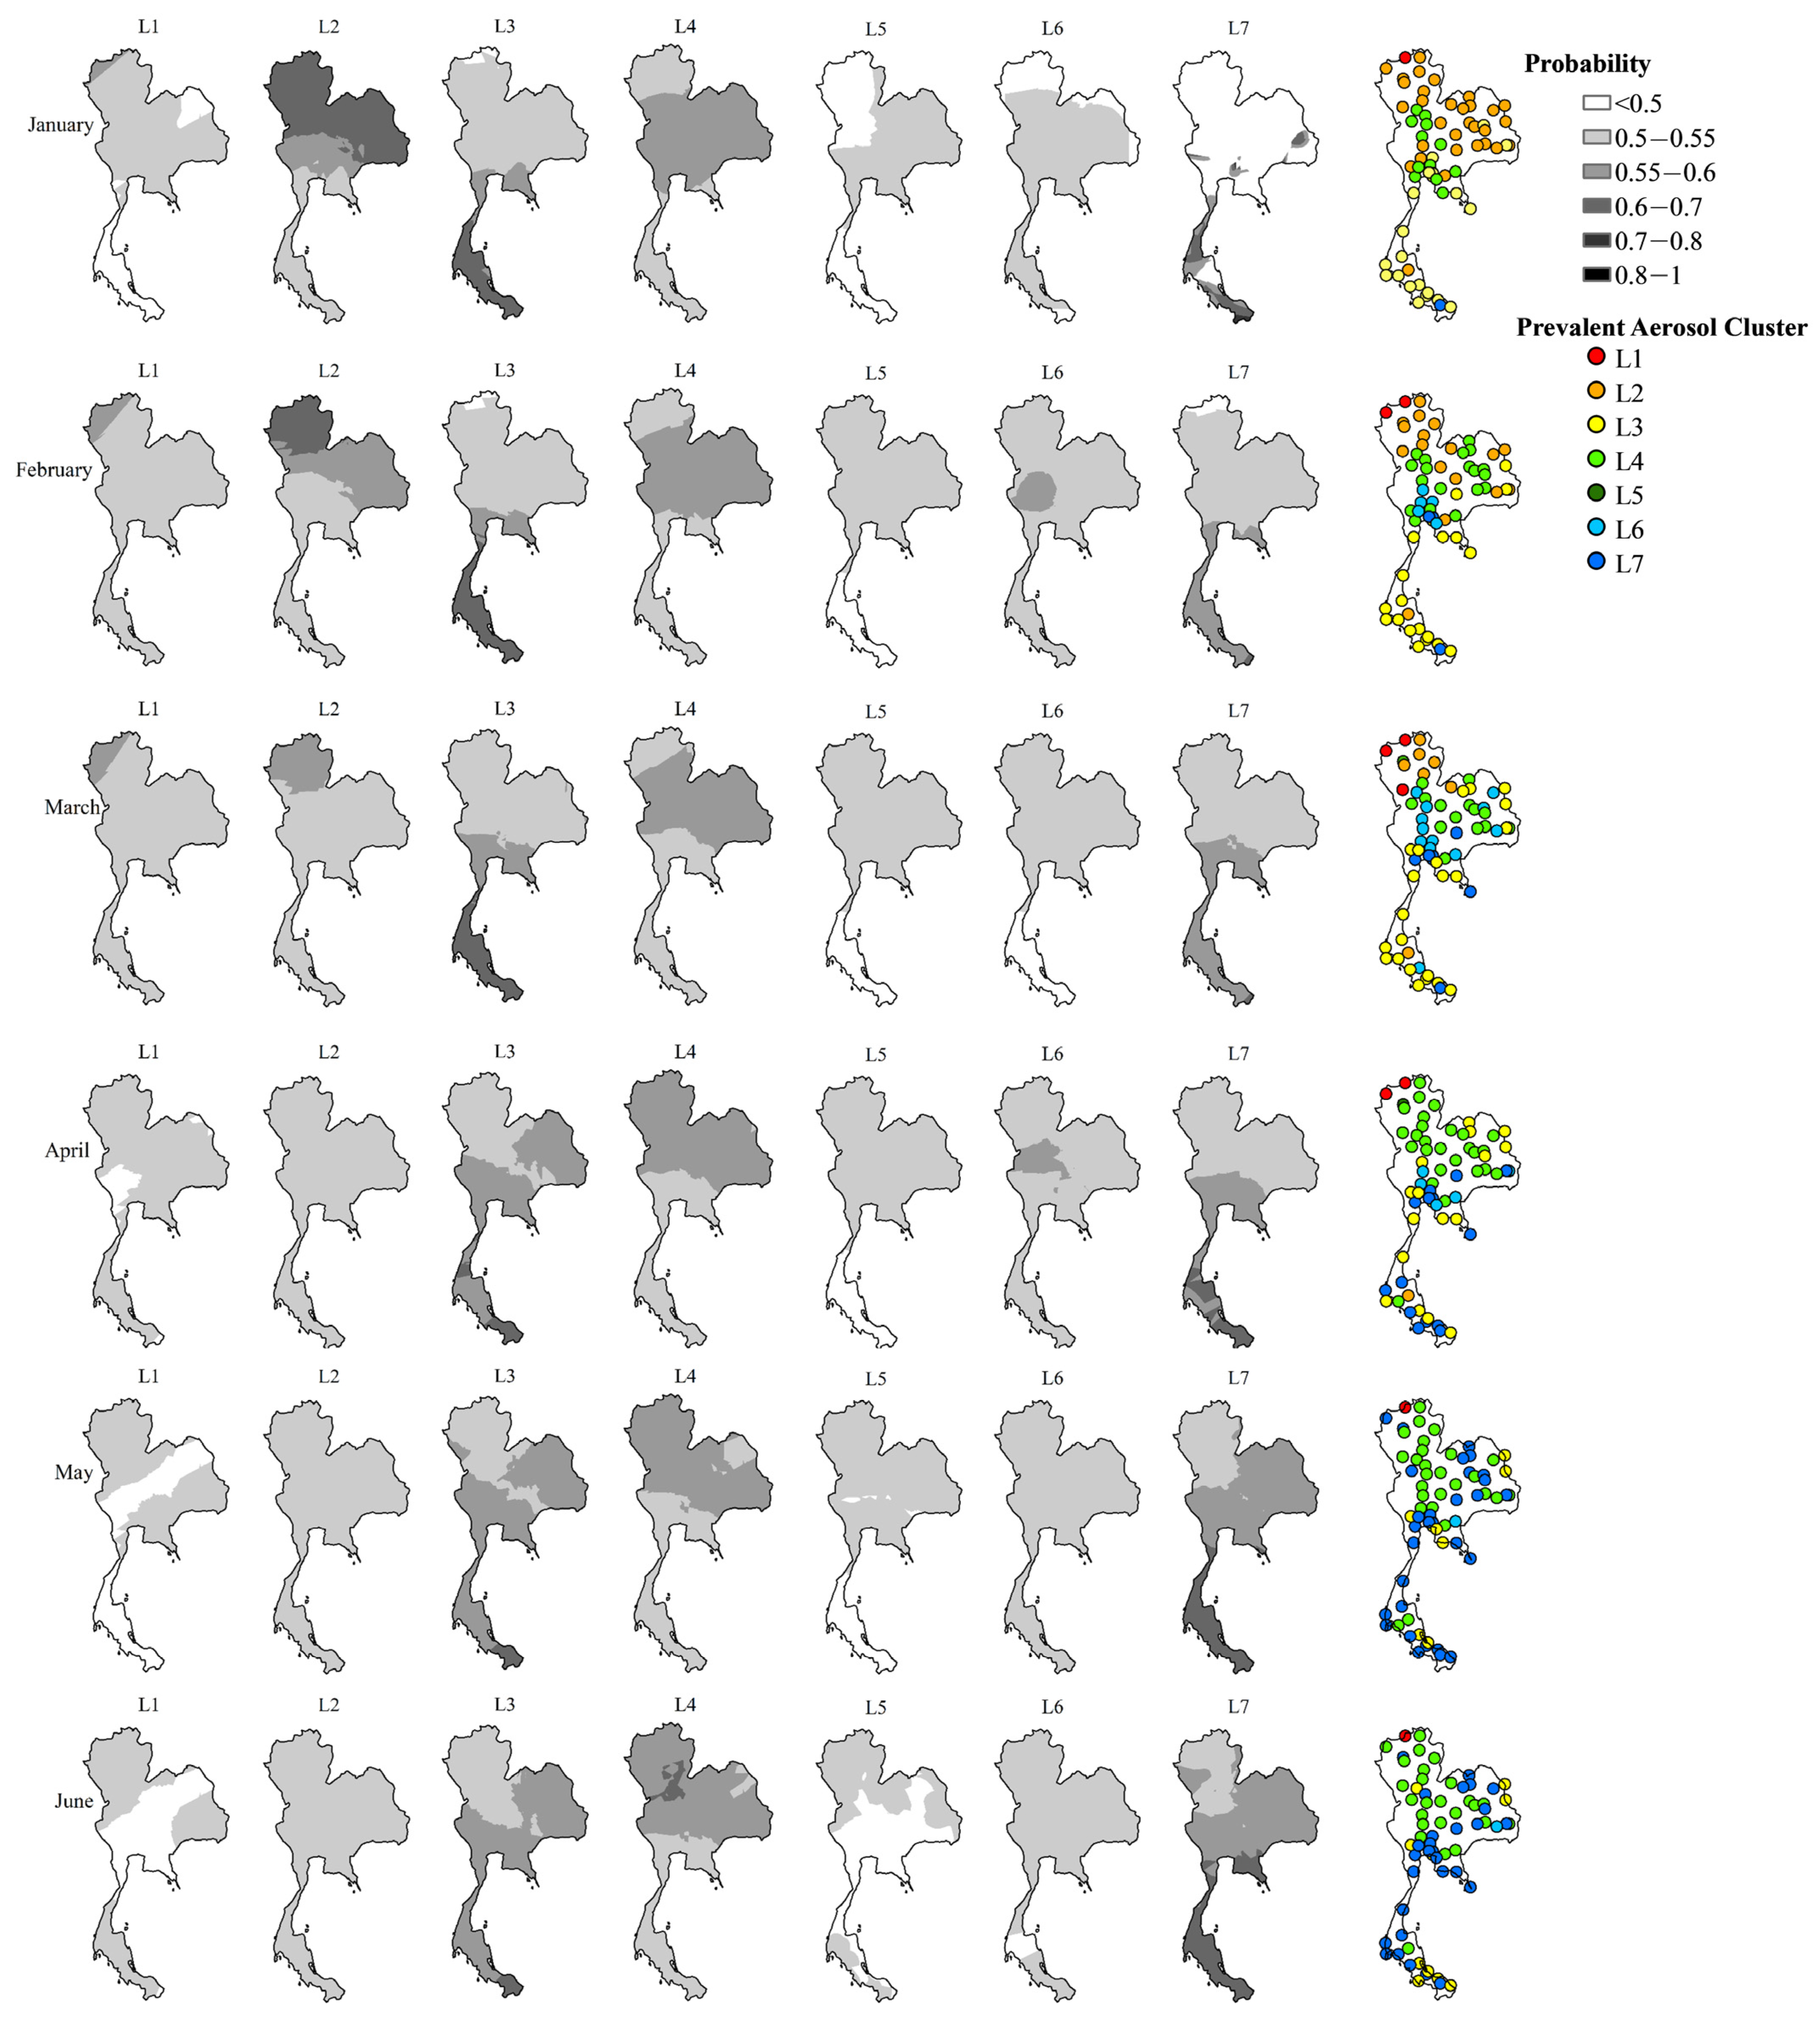
- Logit-transformed linear discriminant analysis was used to assess the possibility of occurrence for individual aerosol types. The models were developed using the spatial information from 12 AERONET stations, which were the MODIS land cover fractions (% forest, % savannas, % croplands, and % urban), the MODIS active fire fraction, the MODIS AOD-derived PM2.5 AQI, the DEM, and the meteorological parameters (surface temperature, relative humidity, and wind speed at approximately 10 m). Later, the models were used to assess the aerosol types at 66 meteorological stations across the country. The analysis was performed using MATLAB R2020b from MathWorks.
- The validation confusion matrix was employed to assess the performance of the logit-transformed linear discriminant model. The model is trained using data from the years 2015 and earlier, and then tested using the remaining dataset. The confusion matrix offers a comprehensive breakdown of the correct and incorrect classifications made by the model. The user’s accuracy quantifies how well each of the simulated aerosol clusters was correctly classified, which implies reliability in the model application. The producer’s accuracy measures how well each of the AERONET aerosol clusters was correctly classified, which reflects the model performance.
- Pearson’s linear correlation analysis was conducted using AERONET precipitable water and the corresponding effective radius of atmospheric aerosol particles in both fine and coarse modes. Precipitable water indicates atmospheric moisture or relative humidity levels. A strong positive correlation coefficient, indicating that aerosol particles grow in size with increasing humidity, implies hygroscopic growth.
3. Result and Discussion
3.1. Classification of Aerosol Optical Properties
3.1.1. Light-Absorbing Aerosols
- Light scattering properties—the real-part refractive index was the highest for L1 (~1.53 at 440 nm), followed by L5 (~1.48 at 675 nm), L2 (~1.47 at 675 nm), and L4 (~1.45 at 440 nm).
- Fine size—the L1 aerosol exhibited the finest size, as suggested by a low fine-mode effective radius (~0.15 μm), a high Angstrom exponent (~1.72), and a low fine-mode asymmetry factor (~0.56 at 675 nm).
- Coarse size—the L5 aerosol exhibited the coarsest size, as suggested by a high coarse-mode effective radius (~3.13 μm) and a high coarse-mode asymmetry parameter (~0.96 at 675 nm).
- Aerosol concentration—the L5 aerosol was often found under the highest aerosol optical depth (~1.72), followed by L1 (~0.74), L4 (~0.61), and L2 (~0.57).
3.1.2. Light-Scattering Aerosol
3.1.3. Neutral Aerosol
3.2. Assessing Potential Sources for the Aerosol Clusters
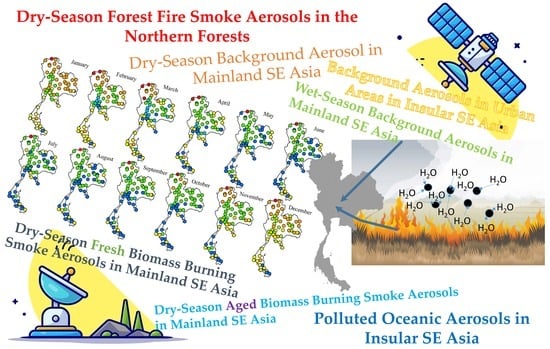
3.2.1. Aerosol Cluster 1 (L1): Dry-Season Forest Fire Smoke Aerosols in the Northern Forests
3.2.2. Aerosol Cluster 2 (L2): Dry-Season Background Aerosol in Mainland SEA
3.2.3. Aerosol Cluster 3 (L3): Background Aerosols in Urban Areas in Insular SEA
3.2.4. Aerosol Cluster 4 (L4): Wet-Season Background Aerosols in Mainland SEA
3.2.5. Aerosol Cluster 5 (L5): Dry-Season Fresh Biomass Burning Smoke Aerosols in Mainland SEA
3.2.6. Aerosol Cluster 6 (L6): Dry-Season Aged Biomass Burning Smoke Aerosols in Mainland SEA
3.2.7. Aerosol Cluster 7 (L7): Polluted Oceanic Aerosols in Insular SEA
4. Conclusions
- L1—dry-season forest fire smoke aerosols in the northern forests. These were less hygroscopic and were carbon-rich.
- L2—dry-season background aerosol in mainland SEA, especially in the north and the northeast. These were predominantly water-soluble organic aerosols from biomass open burning and emissions from urban activities.
- L4—wet-season background aerosol in mainland SEA. This exhibited hygroscopic growth in the coarse mode and could be a mixture of oceanic and local aerosols. Furthermore, the CALIOP dust subtypes were often found in elevated layers, but the source of this elevated dust remains unknown.
- L5—dry-season fresh biomass burning smoke aerosols in mainland SEA. These were water soluble in the fine mode, and the main composition was brown carbon.
- L6—dry-season aged biomass burning smoke aerosols in mainland SEA, especially in central Thailand. This exhibited slight water solubility in the fine mode and were likely formed during transportation.
- L7—polluted oceanic aerosols in insular SEA. These aerosols could be attributed to transboundary biomass burning smoke, since they were likely found within the CALIOP smoke subtype, and they appeared in the elevated layers.
Author Contributions
Funding
Data Availability Statement
Acknowledgments
Conflicts of Interest
Appendix A

Appendix B
Appendix C

Appendix D
References
- Nguyen, T.T.; Pham, H.V.; Lasko, K.; Bui, M.T.; Laffly, D.; Jourdan, A.; Bui, H.Q. Spatiotemporal analysis of ground and satellite-based aerosol for air quality assessment in the Southeast Asia region. Environ. Pollut. 2019, 255, 113106. [Google Scholar] [CrossRef] [PubMed]
- Reid, J.S.; Hyer, E.J.; Johnson, R.S.; Holben, B.N.; Yokelson, R.J.; Zhang, J.; Campbell, J.R.; Christopher, S.A.; Di Girolamo, L.; Giglio, L. Observing and understanding the Southeast Asian aerosol system by remote sensing: An initial review and analysis for the Seven Southeast Asian Studies (7SEAS) program. Atmos. Res. 2013, 122, 403–468. [Google Scholar]
- Feng, N.; Christopher, S.A. Satellite and surface-based remote sensing of Southeast Asian aerosols and their radiative effects. Atmos. Res. 2013, 122, 544–554. [Google Scholar] [CrossRef]
- Khan, R.; Kumar, K.R.; Zhao, T. The climatology of aerosol optical thickness and radiative effects in Southeast Asia from 18-years of ground-based observations. Environ. Pollut. 2019, 254, 113025. [Google Scholar] [CrossRef]
- Adam, M.G.; Chiang, A.W.J.; Balasubramanian, R. Insights into characteristics of light absorbing carbonaceous aerosols over an urban location in Southeast Asia. Environ. Pollut. 2020, 257, 113425. [Google Scholar] [CrossRef]
- Banerjee, T.; Shitole, A.; Mhawish, A.; Anand, A.; Ranjan, R.; Khan, M.F.; Srithawirat, T.; Latif, M.T.; Mall, R. Aerosol climatology over South and Southeast Asia: Aerosol types, vertical profile, and source fields. J. Geophys. Res. Atmos. 2021, 126, e2020JD033554. [Google Scholar] [CrossRef]
- Lin, N.-H.; Sayer, A.M.; Wang, S.-H.; Loftus, A.M.; Hsiao, T.-C.; Sheu, G.-R.; Hsu, N.C.; Tsay, S.-C.; Chantara, S. Interactions between biomass-burning aerosols and clouds over Southeast Asia: Current status, challenges, and perspectives. Environ. Pollut. 2014, 195, 292–307. [Google Scholar] [CrossRef]
- Ross, A.D.; Holz, R.E.; Quinn, G.; Reid, J.S.; Xian, P.; Turk, F.J.; Posselt, D.J. Exploring the first aerosol indirect effect over Southeast Asia using a 10-year collocated MODIS, CALIOP, and model dataset. Atmos. Chem. Phys. 2018, 18, 12747–12764. [Google Scholar] [CrossRef]
- Bellouin, N.; Quaas, J.; Gryspeerdt, E.; Kinne, S.; Stier, P.; Watson-Parris, D.; Boucher, O.; Carslaw, K.S.; Christensen, M.; Daniau, A.L. Bounding global aerosol radiative forcing of climate change. Rev. Geophys. 2020, 58, e2019RG000660. [Google Scholar]
- Liu, Y.; Jia, R.; Dai, T.; Xie, Y.; Shi, G. A review of aerosol optical properties and radiative effects. J. Meteorol. Res. 2014, 28, 1003–1028. [Google Scholar]
- Dubovik, O.; Smirnov, A.; Holben, B.; King, M.; Kaufman, Y.; Eck, T.; Slutsker, I. Accuracy assessments of aerosol optical properties retrieved from Aerosol Robotic Network (AERONET) Sun and sky radiance measurements. J. Geophys. Res. Atmos. 2000, 105, 9791–9806. [Google Scholar] [CrossRef]
- Bridhikitti, A.; Overcamp, T.J. Optical characteristics of southeast Asia’s regional aerosols and their sources. J. Air Waste Manag. Assoc. 2011, 61, 747–754. [Google Scholar] [CrossRef] [PubMed]
- Stibig, H.J.; Belward, A.; Roy, P.; Rosalina-Wasrin, U.; Agrawal, S.; Joshi, P.; Hildanus; Beuchle, R.; Fritz, S.; Mubareka, S. A land-cover map for South and Southeast Asia derived from SPOT-VEGETATION data. J. Biogeogr. 2007, 34, 625–637. [Google Scholar] [CrossRef]
- Work Bank Group. Climate Change Knowledge Portal for Development Practitioners and Policy Makers: Thailand. Available online: https://climateknowledgeportal.worldbank.org/country/thailand/climate-data-historical#:~:text=Thailand%20enjoys%20a%20tropical%20climate,country%2C%20especially%20the%20mountainous%20regions (accessed on 2 August 2023).
- Bridhikitti, A. Applications of Remote Sensing for Air Pollution Monitoring in Thailand: An Early Warning for Public Health. In Earth Data Analytics for Planetary Health; Springer Nature Singapore Pte Ltd.: Singapore, 2023; pp. 3–31. [Google Scholar]
- Di Biagio, C.; di Sarra, A.; Meloni, D.; Monteleone, F.; Piacentino, S.; Sferlazzo, D. Measurements of Mediterranean aerosol radiative forcing and influence of the single scattering albedo. J. Geophys. Res. Atmos. 2009, 114. [Google Scholar] [CrossRef]
- Falah, S.; Mhawish, A.; Omar, A.H.; Sorek-Hamer, M.; Lyapustin, A.I.; Banerjee, T.; Kizel, F.; Broday, D.M. Intercomparison of aerosol types reported as part of aerosol product retrieval over diverse geographic regions. Remote Sens. 2022, 14, 3667. [Google Scholar] [CrossRef]
- Ming, Y.; Russell, L.M. Predicted hygroscopic growth of sea salt aerosol. J. Geophys. Res. Atmos. 2001, 106, 28259–28274. [Google Scholar] [CrossRef]
- Liu, X.; Gu, J.; Li, Y.; Cheng, Y.; Qu, Y.; Han, T.; Wang, J.; Tian, H.; Chen, J.; Zhang, Y. Increase of aerosol scattering by hygroscopic growth: Observation, modeling, and implications on visibility. Atmos. Res. 2013, 132, 91–101. [Google Scholar] [CrossRef]
- Royer, H.M.; Pöhlker, M.L.; Krüger, O.; Blades, E.; Sealy, P.; Lata, N.N.; Cheng, Z.; China, S.; Ault, A.P.; Quinn, P.K. African smoke particles act as cloud condensation nuclei in the wintertime tropical North Atlantic boundary layer over Barbados. Atmos. Chem. Phys. 2023, 23, 981–998. [Google Scholar] [CrossRef]
- Liu, L.; Cheng, Y.; Wang, S.; Wei, C.; Pöhlker, M.L.; Pöhlker, C.; Artaxo, P.; Shrivastava, M.; Andreae, M.O.; Pöschl, U. Impact of biomass burning aerosols on radiation, clouds, and precipitation over the Amazon: Relative importance of aerosol–cloud and aerosol–radiation interactions. Atmos. Chem. Phys. 2020, 20, 13283–13301. [Google Scholar] [CrossRef]
- Luoma, K.; Virkkula, A.; Aalto, P.; Petäjä, T.; Kulmala, M. Over a 10-year record of aerosol optical properties at SMEAR II. Atmos. Chem. Phys. 2019, 19, 11363–11382. [Google Scholar] [CrossRef]
- Gunsch, M.J.; May, N.W.; Wen, M.; Bottenus, C.L.; Gardner, D.J.; VanReken, T.M.; Bertman, S.B.; Hopke, P.K.; Ault, A.P.; Pratt, K.A. Ubiquitous influence of wildfire emissions and secondary organic aerosol on summertime atmospheric aerosol in the forested Great Lakes region. Atmos. Chem. Phys. 2018, 18, 3701–3715. [Google Scholar] [CrossRef]
- Pio, C.; Legrand, M.; Alves, C.; Oliveira, T.; Afonso, J.; Caseiro, A.; Puxbaum, H.; Sánchez-Ochoa, A.; Gelencsér, A. Chemical composition of atmospheric aerosols during the 2003 summer intense forest fire period. Atmos. Environ. 2008, 42, 7530–7543. [Google Scholar] [CrossRef]
- Park, J.-U.; Kim, S.-W.; Sheridan, P.J.; Williams, A.; Chambers, S.D. Long-term variability of aerosol optical properties at Mauna Loa. Aerosol Air Qual. Res. 2020, 20, 1700–1711. [Google Scholar] [CrossRef]
- Schkolnik, G.; Chand, D.; Hoffer, A.; Andreae, M.; Erlick, C.; Swietlicki, E.; Rudich, Y. Constraining the density and complex refractive index of elemental and organic carbon in biomass burning aerosol using optical and chemical measurements. Atmos. Environ. 2007, 41, 1107–1118. [Google Scholar] [CrossRef]
- Chuersuwan, N.; Nimrat, S.; Lekphet, S.; Kerdkumrai, T. Levels and major sources of PM2. 5 and PM10 in Bangkok Metropolitan Region. Environ. Int. 2008, 34, 671–677. [Google Scholar] [CrossRef]
- Li, C.; Tsay, S.-C.; Hsu, N.C.; Kim, J.Y.; Howell, S.G.; Huebert, B.J.; Ji, Q.; Jeong, M.-J.; Wang, S.-H.; Hansell, R.A. Characteristics and composition of atmospheric aerosols in Phimai, central Thailand during BASE-ASIA. Atmos. Environ. 2013, 78, 60–71. [Google Scholar] [CrossRef]
- Phairuang, W.; Inerb, M.; Furuuchi, M.; Hata, M.; Tekasakul, S.; Tekasakul, P. Size-fractionated carbonaceous aerosols down to PM0. 1 in southern Thailand: Local and long-range transport effects. Environ. Pollut. 2020, 260, 114031. [Google Scholar] [CrossRef]
- Tsai, Y.I.; Sopajaree, K.; Chotruksa, A.; Wu, H.-C.; Kuo, S.-C. Source indicators of biomass burning associated with inorganic salts and carboxylates in dry season ambient aerosol in Chiang Mai Basin, Thailand. Atmos. Environ. 2013, 78, 93–104. [Google Scholar] [CrossRef]
- Pengchai, P.; Chantara, S.; Sopajaree, K.; Wangkarn, S.; Tengcharoenkul, U.; Rayanakorn, M. Seasonal variation, risk assessment and source estimation of PM 10 and PM10-bound PAHs in the ambient air of Chiang Mai and Lamphun, Thailand. Environ. Monit. Assess. 2009, 154, 197–218. [Google Scholar] [CrossRef]
- Wang, H.; Wang, X.; Yang, X.; Li, W.; Xue, L.; Wang, T.; Chen, J.; Wang, W. Mixed chloride aerosols and their atmospheric implications: A review. Aerosol Air Qual. Res. 2017, 17, 878–887. [Google Scholar] [CrossRef]
- Wang, Y.; Henning, S.; Poulain, L.; Lu, C.; Stratmann, F.; Wang, Y.; Niu, S.; Pöhlker, M.L.; Herrmann, H.; Wiedensohler, A. Aerosol activation characteristics and prediction at the central European ACTRIS research station of Melpitz, Germany. Atmos. Chem. Phys. 2022, 22, 15943–15962. [Google Scholar] [CrossRef]
- Zeng, C.; Liu, C.; Li, J.; Zhu, B.; Yin, Y.; Wang, Y. Optical properties and radiative forcing of aged BC due to hygroscopic growth: Effects of the aggregate structure. J. Geophys. Res. Atmos. 2019, 124, 4620–4633. [Google Scholar] [CrossRef]
- Liu, X.; Cheng, Y.; Zhang, Y.; Jung, J.; Sugimoto, N.; Chang, S.-Y.; Kim, Y.J.; Fan, S.; Zeng, L. Influences of relative humidity and particle chemical composition on aerosol scattering properties during the 2006 PRD campaign. Atmos. Environ. 2008, 42, 1525–1536. [Google Scholar] [CrossRef]
- Titos, G.; Lyamani, H.; Cazorla, A.; Sorribas, M.; Foyo-Moreno, I.; Wiedensohler, A.; Alados-Arboledas, L. Study of the relative humidity dependence of aerosol light-scattering in southern Spain. Tellus B Chem. Phys. Meteorol. 2014, 66, 24536. [Google Scholar] [CrossRef]
- Bai, Z.; Ji, Y.; Pi, Y.; Yang, K.; Wang, L.; Zhang, Y.; Zhai, Y.; Yan, Z.; Han, X. Hygroscopic analysis of individual Beijing haze aerosol particles by environmental scanning electron microscopy. Atmos. Environ. 2018, 172, 149–156. [Google Scholar] [CrossRef]
- Schepanski, K. Transport of mineral dust and its impact on climate. Geosciences 2018, 8, 151. [Google Scholar] [CrossRef]
- Lin, C.-Y.; Sheng, Y.-F.; Chen, W.-N.; Wang, Z.; Kuo, C.-H.; Chen, W.-C.; Yang, T. The impact of channel effect on Asian dust transport dynamics: A case in southeastern Asia. Atmos. Chem. Phys. 2012, 12, 271–285. [Google Scholar] [CrossRef]
- Kim, J.; Yoon, S.-C.; Jefferson, A.; Kim, S.-W. Aerosol hygroscopic properties during Asian dust, pollution, and biomass burning episodes at Gosan, Korea in April 2001. Atmos. Environ. 2006, 40, 1550–1560. [Google Scholar] [CrossRef]
- Meskhidze, N.; Petters, M.D.; Tsigaridis, K.; Bates, T.; O’Dowd, C.; Reid, J.; Lewis, E.R.; Gantt, B.; Anguelova, M.D.; Bhave, P.V. Production Mechanisms, Number Concentration, Size Distribution, Chemical Composition, and Optical Properties of Sea Spray Aerosols; Wiley Online Library: Hoboken, NJ, USA, 2013. [Google Scholar]
- Lesins, G.; Chylek, P.; Lohmann, U. A study of internal and external mixing scenarios and its effect on aerosol optical properties and direct radiative forcing. J. Geophys. Res. Atmos. 2002, 107, AAC 5-1–AAC 5-12. [Google Scholar] [CrossRef]
- Sheu, G.-R.; Lin, N.-H.; Lee, C.-T.; Wang, J.-L.; Chuang, M.-T.; Wang, S.-H.; Chi, K.H.; Ou-Yang, C.-F. Distribution of atmospheric mercury in northern Southeast Asia and South China Sea during Dongsha experiment. Atmos. Environ. 2013, 78, 174–183. [Google Scholar] [CrossRef]
- Chand, D.; Guyon, P.; Artaxo, P.; Schmid, O.; Frank, G.P.; Rizzo, L.V.; Mayol-Bracero, O.L.; Gatti, L.V.; Andreae, M.O. Optical and physical properties of aerosols in the boundary layer and free troposphere over the Amazon Basin during the biomass burning season. Atmos. Chem. Phys. 2006, 6, 2911–2925. [Google Scholar] [CrossRef]
- Zhang, Y.; Peng, Y.; Song, W.; Zhang, Y.-L.; Ponsawansong, P.; Prapamontol, T.; Wang, Y. Contribution of brown carbon to the light absorption and radiative effect of carbonaceous aerosols from biomass burning emissions in Chiang Mai, Thailand. Atmos. Environ. 2021, 260, 118544. [Google Scholar] [CrossRef]
- Wu, G.; Ram, K.; Fu, P.; Wang, W.; Zhang, Y.; Liu, X.; Stone, E.A.; Pradhan, B.B.; Dangol, P.M.; Panday, A.K. Water-soluble brown carbon in atmospheric aerosols from Godavari (Nepal), a regional representative of South Asia. Environ. Sci. Technol. 2019, 53, 3471–3479. [Google Scholar] [CrossRef] [PubMed]
- Zhang, M.; Ma, Y.; Gong, W.; Liu, B.; Shi, Y.; Chen, Z. Aerosol optical properties and radiative effects: Assessment of urban aerosols in central China using 10-year observations. Atmos. Environ. 2018, 182, 275–285. [Google Scholar] [CrossRef]
- Tiwari, S.; Pandithurai, G.; Attri, S.; Srivastava, A.; Soni, V.; Bisht, D.; Kumar, V.A.; Srivastava, M.K. Aerosol optical properties and their relationship with meteorological parameters during wintertime in Delhi, India. Atmos. Res. 2015, 153, 465–479. [Google Scholar] [CrossRef]
- Ebert, M.; Weinbruch, S.; Rausch, A.; Gorzawski, G.; Helas, G.; Hoffmann, P.; Wex, H. Complex refractive index of aerosols during LACE 98# x2010; as derived from the analysis of individual particles. J. Geophys. Res. Atmos. 2002, 107, LAC 3-1–LAC 3-15. [Google Scholar]
- Levoni, C.; Cervino, M.; Guzzi, R.; Torricella, F. Atmospheric aerosol optical properties: A database of radiative characteristics for different components and classes. Appl. Opt. 1997, 36, 8031–8041. [Google Scholar] [CrossRef]
- Reidmiller, D.R.; Hobbs, P.V.; Kahn, R. Aerosol optical properties and particle size distributions on the east coast of the United States derived from airborne in situ and remote sensing measurements. J. Atmos. Sci. 2006, 63, 785–814. [Google Scholar] [CrossRef]
- Chou, M.-D.; Chan, P.-K.; Wang, M. Aerosol radiative forcing derived from SeaWiFS-retrieved aerosol optical properties. J. Atmos. Sci. 2002, 59, 748–757. [Google Scholar] [CrossRef]


| AERONET Station | Latitude | Longitude | Sampling Period | Number of Observations | CALIOP Observing |
|---|---|---|---|---|---|
| 18.771125 | 98.972467 | 6 January 2010 to 26 May 2016 | 580 | Y |
| 13.819308 | 100.041183 | 1 January 2010 to 30 December 2019 | 667 | Y |
| 19.93245 | 99.0454 | 16 February 2013 to 1 May 2019 | 164 | N |
| 18.59 | 98.485556 | 4 April 2017 to 28 April 2017 | 6 | N |
| 16.606667 | 104.67611 | 9 January 2007 to 5 December 2009 | 159 | N |
| 17.8772 | 102.71671 | 21 January 2015 to 1 October 2019 | 257 | Y |
| 17.798333 | 98.431667 | 3 March 2014 to 14 March 2018 | 174 | N |
| 15.181944 | 102.564167 | 10 January 2007 to 28 March 2008 | 69 | N |
| 7.184387 | 100.604583 | 9 January 2010 to 24 March 2019 | 84 | Y |
| 15.245518 | 104.871011 | 19 March 2010 to 11 March 2019 | 387 | Y |
| 15.266667 | 101.187361 | 28 September 2018 to 9 January 2019 | 7 | N |
| 13.7491 | 100.5177 | 30 January 2007 to 25 January 2019 | 53 | N |
| Aerosol Cluster | Number Observed | Angstrom Exponent (440–870 nm) | SSA (440/675/870/1020 nm) | Real-Part Refractive Indices (440/675/870/1020 nm) | Imaginary-Part Refractive Indices (440/675/870/1020 nm) | Asymmetry Factor (Fine) (440/675/870/1020 nm) | Asymmetry Factor (Coarse) (440/675/870/1020 nm) | Effective Radius-Fine, µm | Effective Radius-Coarse, µm | Aerosol Optical Depth, AOD | Precipitable Water, cm |
|---|---|---|---|---|---|---|---|---|---|---|---|
| L1 | 194 | 1.72 | 0.89/0.88/0.85/0.82 | 1.53/1.53/1.53/1.52 | 0.02/0.02/0.02/0.02 | 0.65/0.56/0.49/0.44 | 1.03/0.88/0.83/0.81 | 0.15 | 2.43 | 0.74 | 1.15 |
| L2 | 493 | 1.57 | 0.89/0.88/0.86/0.85 | 1.47/1.47/1.47/1.48 | 0.02/0.02/0.02/0.02 | 0.68/0.59/0.53/0.49 | 1.06/0.90/0.83/0.82 | 0.16 | 2.62 | 0.57 | 1.93 |
| L3 | 409 | 1.57 | 0.91/0.91/0.89/0.88 | 1.44/1.44/1.44/1.46 | 0.01/0.01/0.01/0.01 | 0.69/0.59/0.52/0.47 | 0.99/0.86/0.83/0.80 | 0.16 | 2.30 | 0.62 | 3.45 |
| L4 | 488 | 1.59 | 0.90/0.89/0.88/0.86 | 1.45/1.45/1.45/1.47 | 0.02/0.02/0.02/0.02 | 0.69/0.59/0.52/0.48 | 1.03/0.88/0.83/0.81 | 0.16 | 2.51 | 0.61 | 2.76 |
| L5 | 86 | 1.73 | 0.89/0.89/0.87/0.85 | 1.48/1.48/1.48/1.50 | 0.02/0.02/0.02/0.02 | 0.68/0.57/0.50/0.46 | 1.16/0.96/0.83/0.86 | 0.16 | 3.13 | 1.72 | 2.59 |
| L6 | 332 | 1.49 | 0.93/0.93/0.92/0.91 | 1.43/1.43/1.43/1.45 | 0.01/0.01/0.01/0.01 | 0.72/0.64/0.58/0.54 | 1.08/0.91/0.83/0.83 | 0.19 | 2.96 | 1.04 | 3.80 |
| L7 | 605 | 1.52 | 0.93/0.93/0.92/0.91 | 1.42/1.42/1.42/1.45 | 0.01/0.01/0.01/0.01 | 0.71/0.61/0.54/0.49 | 0.98/0.85/0.83/0.80 | 0.17 | 2.40 | 0.68 | 4.29 |
| Aerosol Cluster | Number of Observations | Reff-C | Reff-F | ||
|---|---|---|---|---|---|
| r | p-Value | r | p-Value | ||
| 1 | 194 | −0.143 | 0.046 | 0.354 | <0.001 |
| 2 | 493 | 0.280 | <0.001 | 0.201 | <0.001 |
| 3 | 409 | 0.207 | <0.001 | 0.187 | <0.001 |
| 4 | 488 | 0.424 | <0.001 | 0.150 | 0.001 |
| 5 | 86 | −0.130 | 0.232 | 0.469 | <0.001 |
| 6 | 332 | −0.062 | 0.262 | 0.188 | 0.001 |
| 7 | 605 | 0.174 | <0.001 | 0.131 | 0.001 |
| N = 1184 | Latitude | % Forest | % Savannas | % Croplands | % Urban | Elevation, m | Wind Speed, km h−1 | RH, % | Temperature, °C | Active Fire Fraction | PM2.5 AQI |
|---|---|---|---|---|---|---|---|---|---|---|---|
| L1 | 19.227 | 0.439 | 0.440 | 0.022 | 0.085 | 1005 | 17.2 | 61.7 | 25.4 | 0.70 | 0.76 |
| L2 | 17.763 | 0.112 | 0.348 | 0.112 | 0.345 | 425 | 17.2 | 65.9 | 25.4 | 0.60 | 0.45 |
| L3 | 15.227 | 0.013 | 0.293 | 0.110 | 0.415 | 119 | 19.4 | 69.0 | 28.2 | 0.47 | 0.64 |
| L4 | 16.662 | 0.031 | 0.283 | 0.179 | 0.376 | 214 | 18.1 | 67.8 | 26.7 | 0.45 | 0.54 |
| L5 | 18.420 | 0.052 | 0.277 | 0.118 | 0.471 | 306 | 19.4 | 60.9 | 27.4 | 0.78 | 1.34 |
| L6 | 15.819 | 0.009 | 0.247 | 0.205 | 0.382 | 126 | 18.3 | 68.4 | 27.5 | 0.46 | 0.93 |
| L7 | 14.991 | 0.009 | 0.318 | 0.081 | 0.455 | 94 | 19.8 | 70.8 | 28.7 | 0.43 | 0.71 |
| Simulated Aerosol Type | Producer Accuracy, % | |||||||||
|---|---|---|---|---|---|---|---|---|---|---|
| 1 | 2 | 3 | 4 | 5 | 6 | 7 | Total | |||
| AERONET Aerosol Type | 1 | 89 | 36 | 1 | 7 | 3 | 136 | 65 | ||
| 2 | 24 | 179 | 15 | 59 | 1 | 4 | 4 | 286 | 63 | |
| 3 | 3 | 50 | 64 | 6 | 11 | 45 | 179 | 28 | ||
| 4 | 61 | 41 | 100 | 11 | 11 | 18 | 242 | 41 | ||
| 5 | 12 | 4 | 32 | 6 | 1 | 55 | 58 | |||
| 6 | 11 | 19 | 32 | 8 | 42 | 18 | 130 | 32 | ||
| 7 | 28 | 29 | 2 | 16 | 81 | 156 | 52 | |||
| Total | 113 | 302 | 154 | 295 | 63 | 90 | 167 | 1184 | ||
| User Accuracy, % | 79 | 59 | 32 | 34 | 51 | 47 | 49 | 48 | ||
Disclaimer/Publisher’s Note: The statements, opinions and data contained in all publications are solely those of the individual author(s) and contributor(s) and not of MDPI and/or the editor(s). MDPI and/or the editor(s) disclaim responsibility for any injury to people or property resulting from any ideas, methods, instructions or products referred to in the content. |
© 2023 by the authors. Licensee MDPI, Basel, Switzerland. This article is an open access article distributed under the terms and conditions of the Creative Commons Attribution (CC BY) license (https://creativecommons.org/licenses/by/4.0/).
Share and Cite
Bridhikitti, A.; Petchpayoon, P.; Prabamroong, T. Integrated Remote Sensing Observations of Radiative Properties and Sources of the Aerosols in Southeast Asia: The Case of Thailand. Remote Sens. 2023, 15, 5319. https://doi.org/10.3390/rs15225319
Bridhikitti A, Petchpayoon P, Prabamroong T. Integrated Remote Sensing Observations of Radiative Properties and Sources of the Aerosols in Southeast Asia: The Case of Thailand. Remote Sensing. 2023; 15(22):5319. https://doi.org/10.3390/rs15225319
Chicago/Turabian StyleBridhikitti, Arika, Pakorn Petchpayoon, and Thayukorn Prabamroong. 2023. "Integrated Remote Sensing Observations of Radiative Properties and Sources of the Aerosols in Southeast Asia: The Case of Thailand" Remote Sensing 15, no. 22: 5319. https://doi.org/10.3390/rs15225319
APA StyleBridhikitti, A., Petchpayoon, P., & Prabamroong, T. (2023). Integrated Remote Sensing Observations of Radiative Properties and Sources of the Aerosols in Southeast Asia: The Case of Thailand. Remote Sensing, 15(22), 5319. https://doi.org/10.3390/rs15225319