Article

Increased Warming Efficiencies of Lake Heatwaves Enhance Dryland Lake Warming over China

1
College of Atmospheric Sciences, Lanzhou University, Lanzhou 730000, China
2
Collaborative Innovation Center for Western Ecological Safety, Lanzhou 730000, China
3
School of Atmospheric Sciences, Sun Yat-sen University, Zhuhai 519082, China
*
Author to whom correspondence should be addressed.
Remote Sens. 2024, 16(3), 588; https://doi.org/10.3390/rs16030588
Submission received: 9 December 2023 / Revised: 9 January 2024 / Accepted: 2 February 2024 / Published: 4 February 2024

Abstract

:
Lake surface water temperature (LSWT) has significantly increased over China and even globally in recent decades due to climate change. However, the responses of LSWTs to climate warming in various climatic regions remain unclear due to the limited lake observations. Satellite-observed LSWT data from the Moderate Resolution Imaging Spectroradiometer (MODIS) dataset were extended using the air2water model. This research aimed to investigate summer LSWT trends across various climatic zones in China, shedding light on the complex interplay between surface air temperatures and LSWT from 1950 to 2020. The results demonstrate robust model performance, with high Nash–Sutcliffe efficiency coefficients, affirming its capability to simulate LSWT variability. Regional disparities in LSWT patterns are identified, revealing notable warming trends in dryland lakes, particularly in central Inner Mongolia. Notably, the study unveils a substantial increase in the intensity and duration of lake heatwaves, especially in semi-arid regions. Dryland lake heatwaves emerge as dominant contributors to intensified LSWT warming, showcasing stronger and longer-lasting events than humid regions. The research highlights a positive feedback loop between lake warming and heatwaves, further amplifying dryland LSWT warming. These findings underscore the vulnerability of dryland lakes to climate change and signal the potential ramifications of increased greenhouse gas concentrations.

1. Introduction

Lakes serve as repositories of substantial liquid surface freshwater [1], constituting valuable natural reservoirs essential for the sustenance of aquatic and terrestrial ecosystems, agricultural and fishery productivity, provision of ecosystem services to human populations, and modulation of climatic conditions [2,3,4]. Key aspects such as lake surface water temperature (LSWT), lake ice cover, lake mixing regimes, and dimensions (area and water level) are particularly susceptible to climatic changes induced by global warming [5,6]. LSWT emerges as a critical indicator within the spectrum of diverse lake variables, acting as a regulatory factor that mediates the direct impact of climate dynamics on lacustrine environments [7,8,9]. Over recent decades, there has been a discernible and accelerated warming in summer LSWTs across most lakes worldwide, manifesting at an average rate of 0.34 °C per decade [10,11]. Notably, numerous locations exhibit a more pronounced increase in summer LSWT than the concurrent warming trends observed in local air temperatures. Nevertheless, the rate of warming in LSWT shows spatial variability, lacking a discernible regional uniformity, as noted by O’Reilly et al. [11]. A recent investigation employing satellite observations spanning the global landscape from 1995 to 2016 revealed that the warming in LSWT over drylands surpassed that observed in humid regions during the specified timeframe [12].
A significant portion of the research addressing the impacts of global warming on lakes has primarily emphasized seasonal or annual fluctuations in the mean temperature of lake surface water. Previous studies have posited a sustained, long-term warming trend in lakes globally. In contrast, there is a notable absence of knowledge concerning lake heatwaves, similar to marine heatwaves, characterized by a period of warm lake surface water temperature. Woolway et al. [13] introduced the novel concept of lake heatwaves, revealing, for the first time, that lake heatwaves become more intense and longer lasting within a warming world. This study also underscored the heightened sensitivity of lake heatwaves to climatic variations. Subsequent investigations have substantiated the affirmative patterns in the attributes of lake heatwaves, encompassing factors such as frequency, duration, and intensity, spanning from regional to global extents [14,15,16]. It has been posited that 94% of the identified severe heatwaves observed during the satellite data-taking period exhibit indications of anthropogenic influence.
Moreover, severe heatwaves are estimated to occur at 3 to 25 times higher temperatures in a warmer world, relative to a scenario without anthropogenic impact [15]. The documented rise in lake heatwaves is also linked to changes in the occurrence of algal blooms [17], organism mortality [18], poor water quality [19], and stability in the productivity of lakes worldwide [20]. Cumulative evidence suggests that the warming of lake surfaces, particularly the heightened incidence of lake heatwaves, has exerted a significant impact on the physical and chemical environment of aquatic systems [21], consequently influencing biodiversity and human health in the broader context [22].
Notwithstanding an increasing recognition of their significance, the scientific comprehension of lake heatwaves remains in a nascent stage, notably lagging behind the understanding of their atmospheric and marine counterparts [22]. Given the acknowledged substantial warming of lakes in drylands, inquiries into potential distinctions in the characteristics of lake heatwaves between drylands and humid regions, as well as the role played by lake heatwaves in the augmented warming of dryland lakes, necessitate further exploration and investigation. A notable challenge lies in the impracticality of directly simulating the surface temperatures of billions of lakes over an extended temporal span. It is deemed more pragmatic to ascertain and validate the lake warming patterns characteristic of specific regions, such as China, which exhibits significant warming in its drylands under global climate change [23,24]. Furthermore, approximately half of China’s lakes, totaling 2600 lakes with sizes exceeding 1 km2, are in dryland areas, encompassing around 1% of the nation’s total land area [25,26]. The interplay of climate warming and aridification exacerbates water scarcity in these drylands [27], resulting in the overall contraction or disappearance of lakes within this context [28,29,30,31,32].
Given that lakes play a pivotal role in influencing regional weather and climate by modulating local air humidity [33,34], China’s dryland lakes are perceived as particularly susceptible to the effects of global warming. The dynamics of LSWT and its response to climate change remain uncertain, especially when considering the fragility of dryland environments, necessitating a more nuanced and detailed examination. Consequently, the analysis of the pattern and processes of warming in Chinese lakes assumes significance in unraveling the responses and mechanisms underlying lake warming. Our study focuses on discerning regional disparities in LSWT to investigate the evolving pattern of lake warming across the various climatic zones in China and to elucidate the role of lake heatwaves. Specifically, our objectives address the following inquiries: (1) In recent decades, how have the patterns of lake warming varied across the distinct climatic zones in China in response to global warming? (2) What are the responses of lake heatwaves to the rising water temperatures, and are there discernible differences between dryland and humid regions? (3) Through examining the impact of lake heatwaves, what insights can be gleaned regarding observed warming in the dryland lakes of China?

2. Data and Methods

2.1. LSWT Data

Daily LSWTs from 2000 to 2020 across China were acquired at a spatial resolution of 1 km from MOD11A1 data [35]. These datasets are accessible at https://lpdaac.usgs.gov/products/mod11a1v006/ (accessed on 30 April 2020). The delineation of Chinese lake boundaries, as provided by Zhang et al. [31], was employed to extract pertinent lake data from the MODIS data products, utilizing the AρρEEARS tool (https://lpdaacsvc.cr.usgs.gov/appeears/) (accessed on 30 April 2020), an application developed by the Land Processes Distributed Active Archive Center (LP DAAC). Both daytime and nighttime land surface temperature (LST) products for each lake, along with their respective quality control values, were retrieved. Ensuring uniform quality standards, the mean LSWTs were computed by averaging the daytime and nighttime LSTs. Daily LSWTs were subsequently determined by averaging values within each lake region. For this study, the definition of summer corresponds to July, August, and September (JAS), aligning with definitions utilized in prior research endeavors [10,11,36].

2.2. Meteorological Data

In this research, climate zones were categorized utilizing monthly mean precipitation and potential evapotranspiration data obtained from the Climatic Research Unit (CRU data version 4.05) from 1950 to 2020 [37]. The trend in air temperature was computed using monthly mean air temperature data, featuring a spatial resolution of 0.25°, derived from the ERA5 reanalysis datasets from 1950 to 2020 [38]. Daily mean air temperature and geopotential height data, with a spatial resolution of 0.25°, were retrieved from the ERA5 reanalysis datasets [39] and applied in the air2water model. For the consideration of each lake’s air temperature, the lapse rate (Γ) was employed to adjust the surface air temperature to corresponding over-lake values, particularly when the elevations of the lake and the model grid did not align [40,41].

2.3. The Air2water Model

The air2water model, an open-source simulation model for LSWT, exclusively relies on air temperature as input forcing data [42]. Rooted in a volume-integrated heat balance equation applied to the well-mixed surface layer of lakes within the model, the model linearizes and simplifies the heat flux components at the lake–atmosphere interface, with air temperature serving as the sole variable encapsulating the overall climate forcing. Characterized by a straightforward ordinary differential equation, the model has demonstrated efficacy in generating daily LSWT simulations. A distinctive attribute of the air2water model is its incorporation of lake thermal stratification through empirical closure, setting it apart from simplistic statistical models. This feature is pivotal in achieving performance levels comparable to those of more intricate deterministic models. The model’s simplicity, coupled with its proven suitability for climate change investigations [43], has resulted in its widespread adoption for predicting LSWT globally [42,43,44,45].
The calibration of the air2water model involved an initial comparison of simulated LSWTs using air temperatures derived from the ERA5 reanalysis data with observed LSWTs obtained from MOD11A1 during the 2000–2020 period in this investigation. Subsequently, the calibrated model was applied to simulate LSWT for the broader temporal span of 1950–2020. The assessment of the air2water model’s accuracy in simulating LSWT employed the Nash–Sutcliffe efficiency (NSE) index [46]. The NSE index is defined as Equation (1), where Q 0 is the observational data, Q m is the simulated data, Q t is the value of time t, and Q ¯ is the average.
N S E = 1 t = 1 T ( Q 0 t Q m t ) 2 t = 1 T ( Q 0 t Q 0 ¯ ) 2
The NSE index, ranging from −∞ to 1, signifies a perfect match between measured and simulated values when equal to 1. In this study, lakes with NSEs exceeding 0.8 were identified as well-simulated lakes and selected for further analysis.

2.4. Climate Regionalization

The aridity index (AI), defined as the ratio of annual precipitation to annual potential evapotranspiration (PET), serves as a key parameter in this analysis. The classification of the four climatic zones is contingent upon their respective AI values: arid (AI < 0.2), semi-arid (0.2 ≤ AI <0.5), dry subhumid (0.5 ≤ AI < 0.65), and humid (AI ≥ 0.65) regions. The delineation of China’s climatic zones is depicted in Figure 1a. In subsequent sections, arid, semi-arid, and dry subhumid collectively refer to drylands [47,48,49]. Figure 1b presents regionally averaged annual mean summer air temperature (AT) trends as a function of the climatological mean AI and illustrates that China’s regions experiencing the greatest summer warming rates predominantly fall within AI values of 0.2 to 0.6. The warming rate progressively intensifies in areas with AI values less than 0.4, reaching a zenith in regions with AI values hovering around 0.4, characterized by the swiftest warming rates in China. Subsequently, the warming rate gradually diminishes in regions with AI values surpassing 0.4. Consequently, drylands exhibit a more accelerated warming trend compared to humid regions.

2.5. Definition of Lake Heatwaves

Lake heatwaves were operationally defined as periods during which daily LSWTs exceeded locally and seasonally varying 90th percentile thresholds for a minimum duration of five consecutive days. These thresholds were computed for each calendar day by employing an 11-day window centered on the respective date throughout the climatological periods from 1950 to 2020. The calculation involved a 31-day moving average smoothing process [13,14]. To ensure robustness, instances of two lake heatwave events with an interruption of fewer than three days were consolidated and treated as a singular event. The present study investigates the critical characteristics of lake heatwaves, specifically their duration and intensity.

2.6. Warming Efficiency

Toffolon et al. [50] introduced a straightforward lake-averaged metric termed “warming efficiency”, denoted as η, which quantifies the extent of change in LSWT relative to alterations in air temperature. For each lake, the five coldest and five warmest years, determined based on the mean summer LSWTs, were identified from 1950 to 2020. The mean summer air temperatures and LSWTs from these selected years were then averaged, yielding representative values for the coldest ( A T ¯ c o l d and L S W T ¯ c o l d ) and warmest ( A T ¯ w a r m and L S W T ¯ w a r m ) , with the overbar denoting averaging over the corresponding five years. The changes in air temperature ( Δ A T = A T ¯ w a r m A T ¯ c o l d ) and LSWT ( Δ L S W T = L S W T ¯ w a r m L S W T ¯ c o l d )   between the warmest and coldest years were subsequently computed. The summer warming efficiency η was then calculated as the ratio of the changes in LSWT to air temperature changes:
η = Δ L S W T Δ A T
In the present study, we computed the warming efficiency for each lake and subsequently averaged these values within the four climatic zones.

3. Results

3.1. Assessment of Simulated Long-Term Lake Temperatures Using the air2water Model

The air2water model, designed for simulating LSWTs based on surface air temperatures, has demonstrated robust performance in reproducing LSWT variability through comparative assessments with observed LSWTs [51,52,53]. This capacity presents an opportunity to extend the temporal scope of LSWT observations and explore long-term trends. Based on air temperatures derived from the ERA5 dataset, we extended the LSWT dataset to cover the period from 1950 to 2020, following an evaluation against observed LSWTs from the MODIS dataset. Validation of the air2water model’s performance utilized the Nash–Sutcliffe efficiency (NSE) coefficient, as depicted in Figure 2. The results reveal NSE values exceeding 0.8 over most lakes, indicative of a high simulation performance. However, due to observational uncertainties associated with lakes on the Tibetan Plateau, influenced by terrain and elevation, the simulation outcomes for this region are deemed inadequate. To ensure the precision of LSWT simulations, lakes with NSEs greater than 0.8 were selectively considered to analyze LSWT variations and geographical patterns between 1950 and 2020 [41].

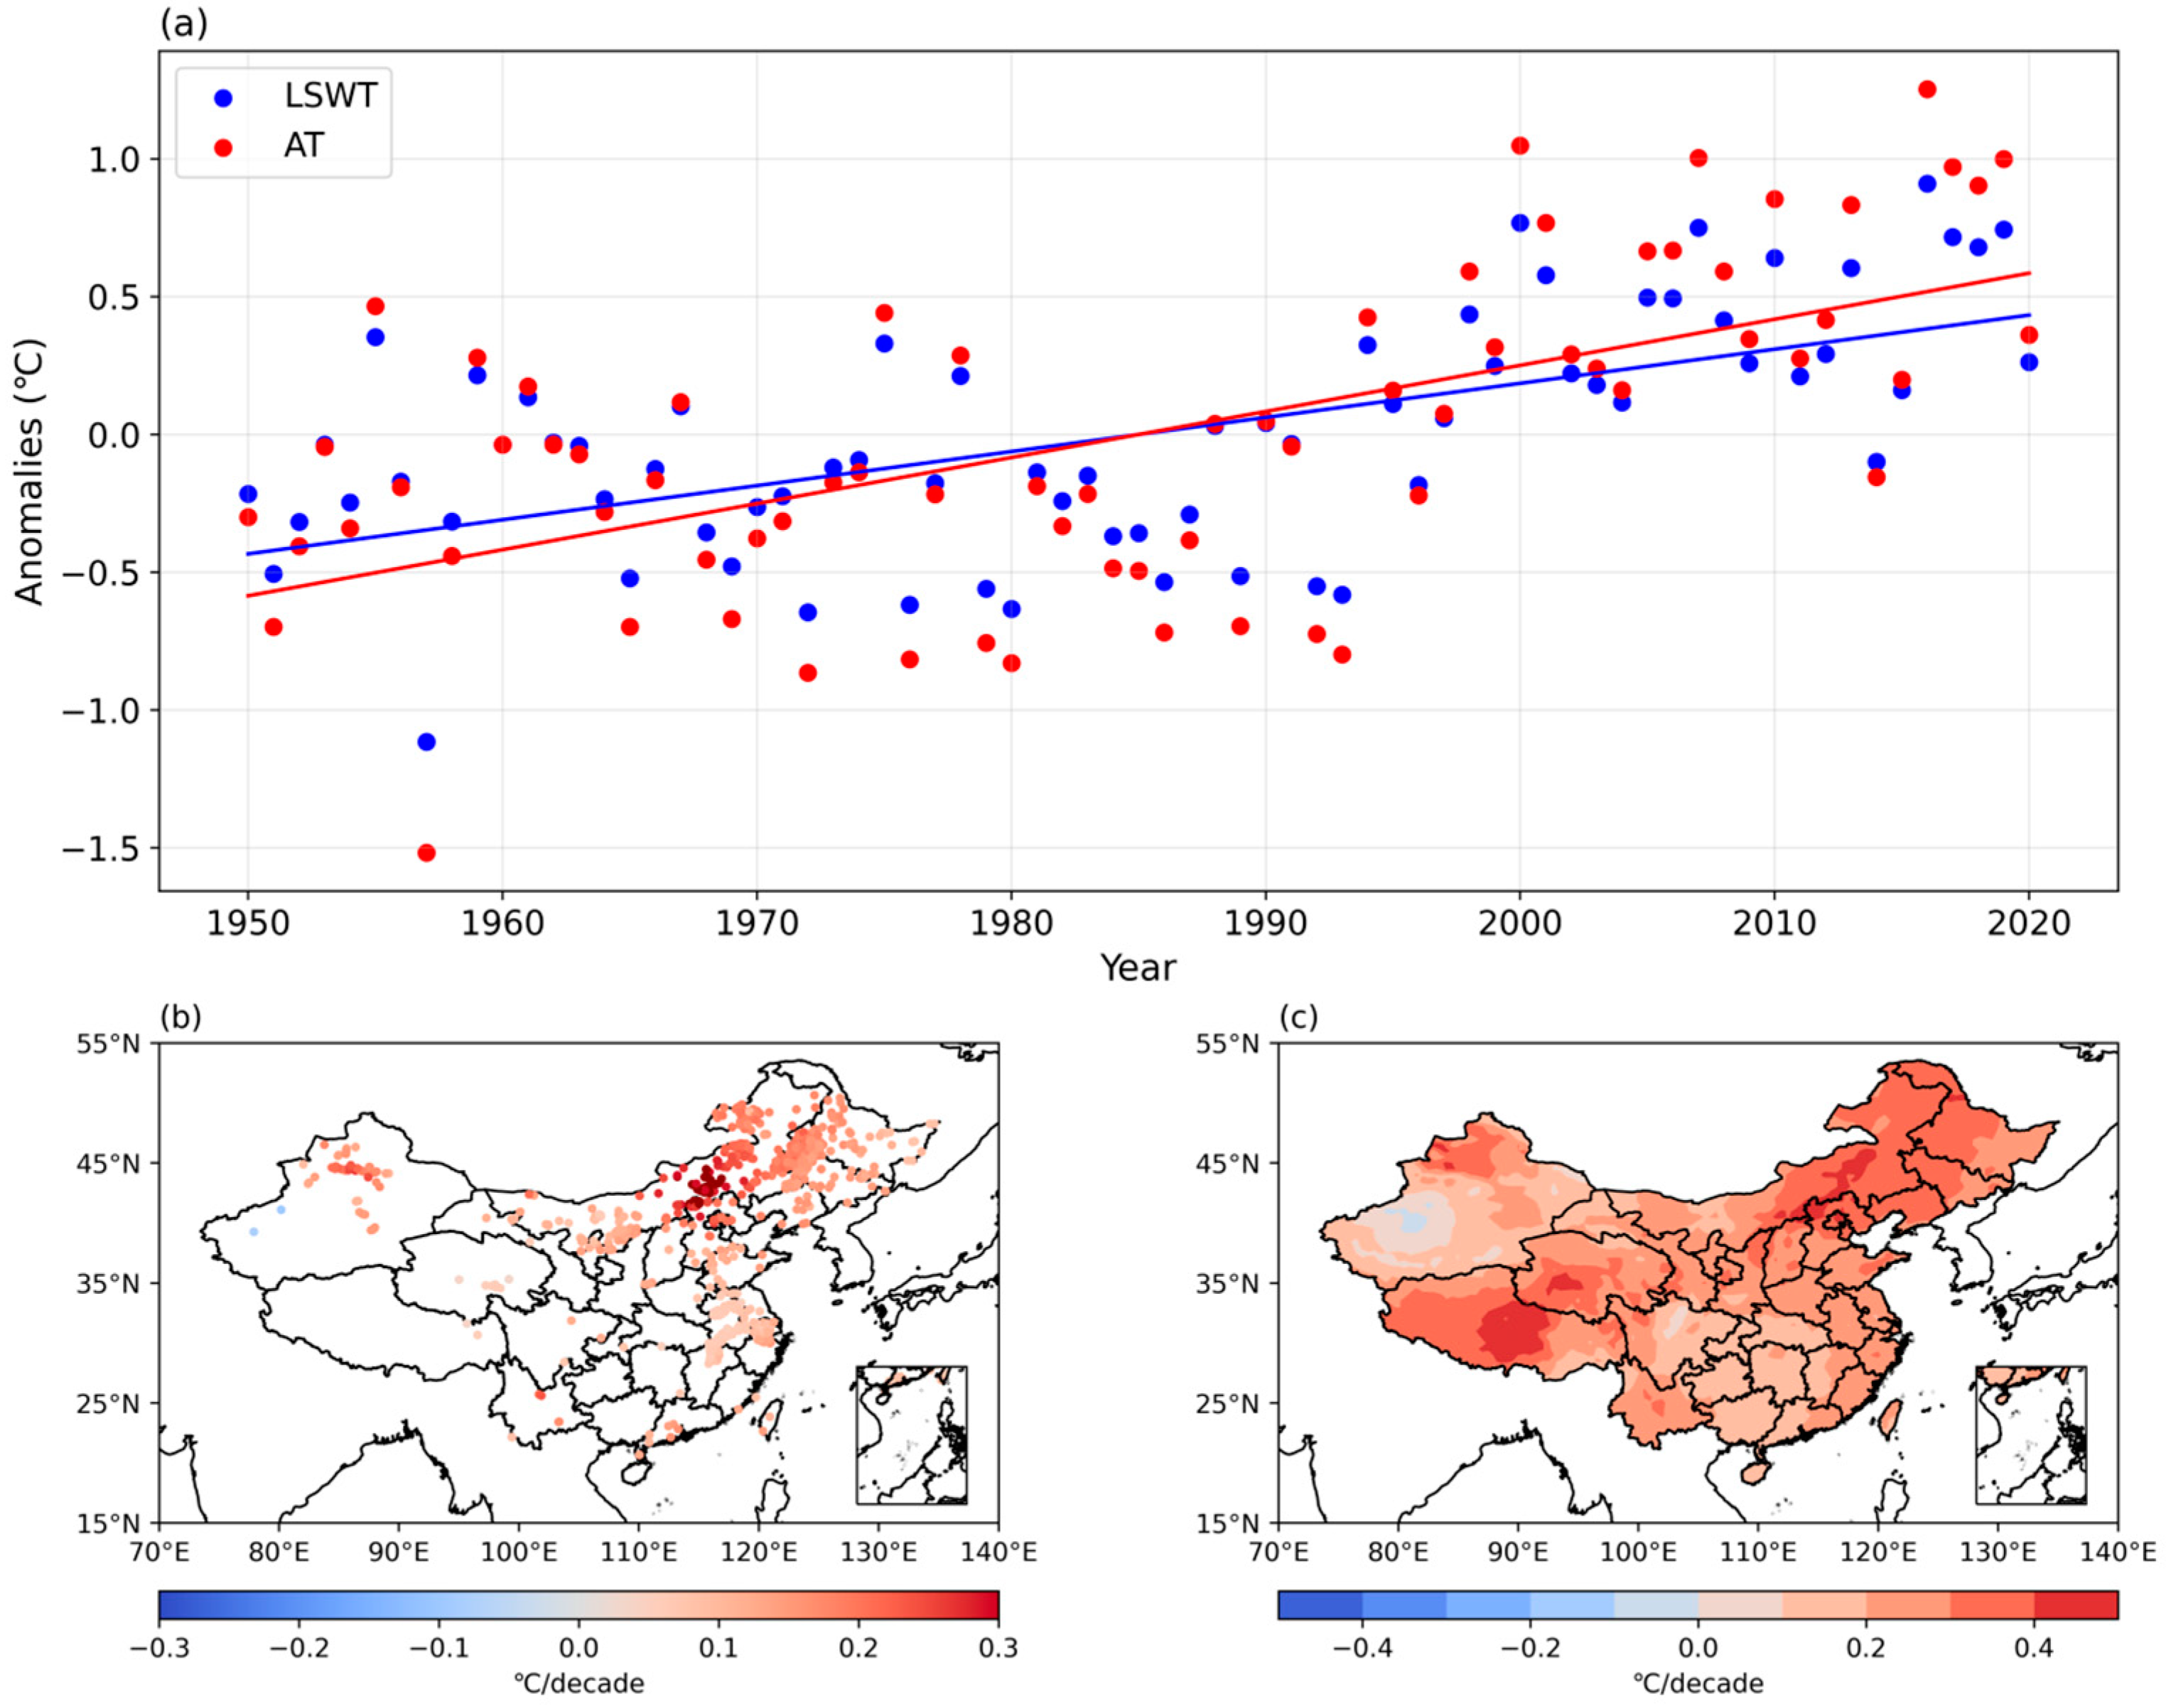
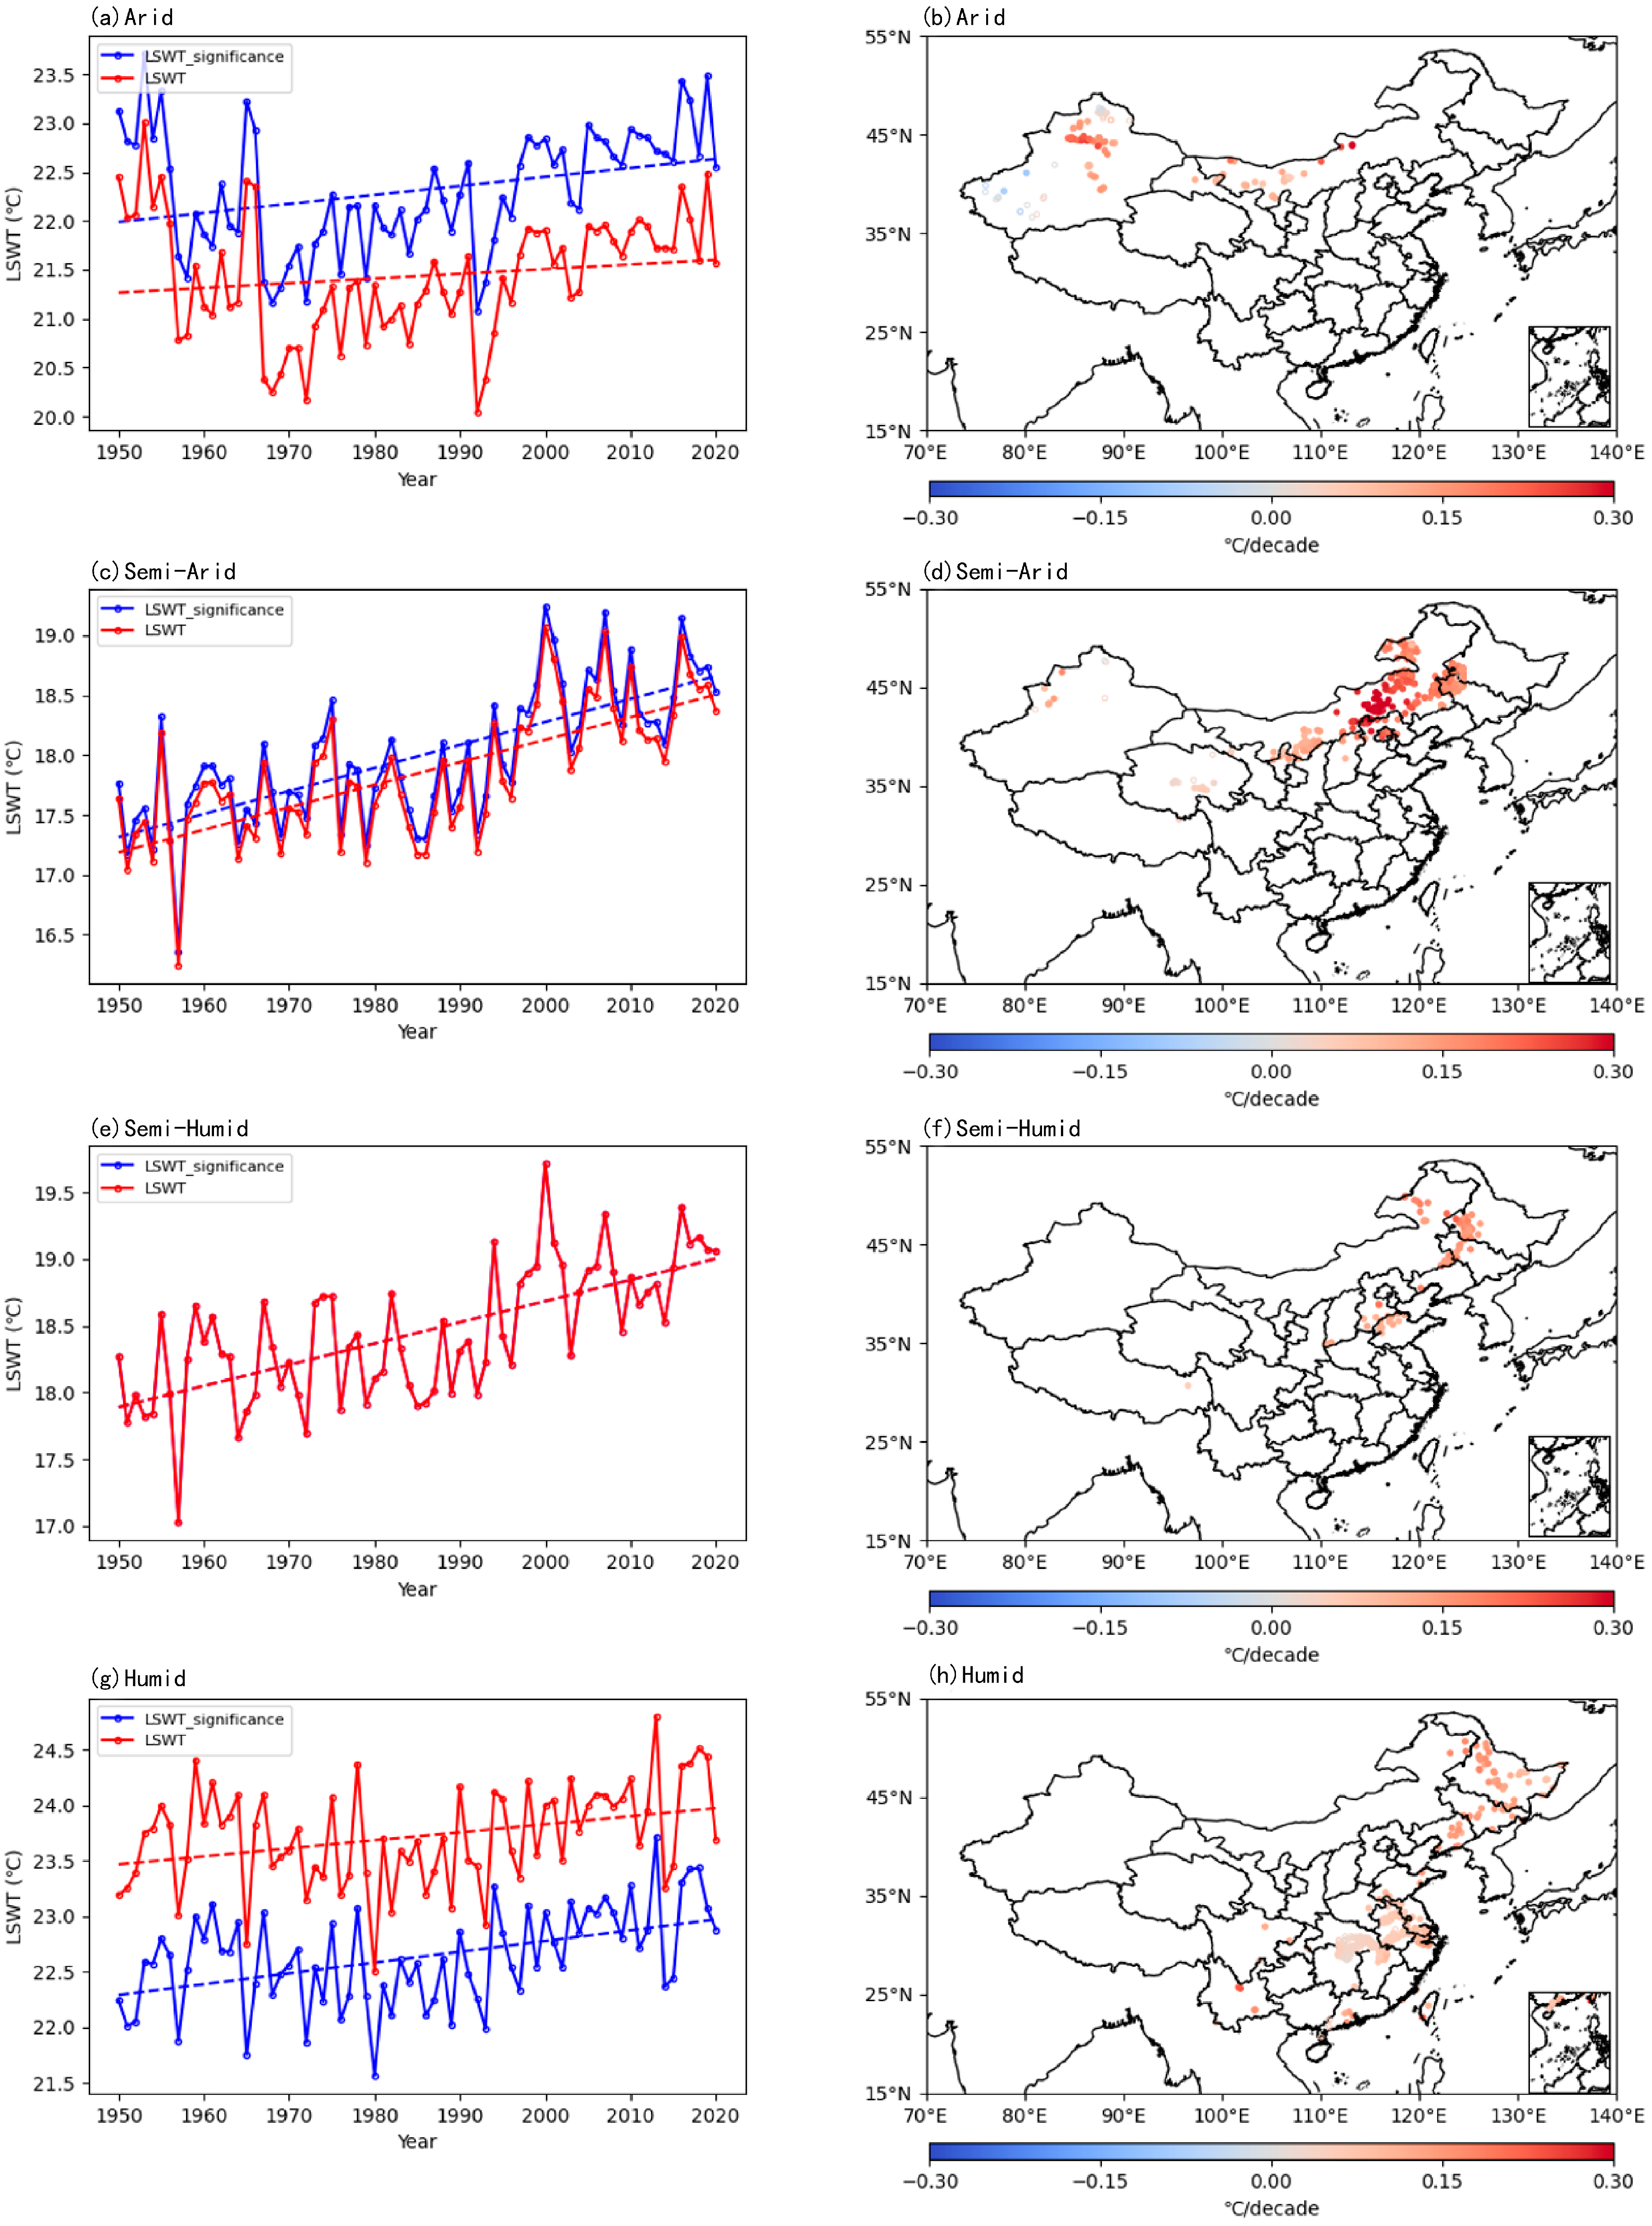
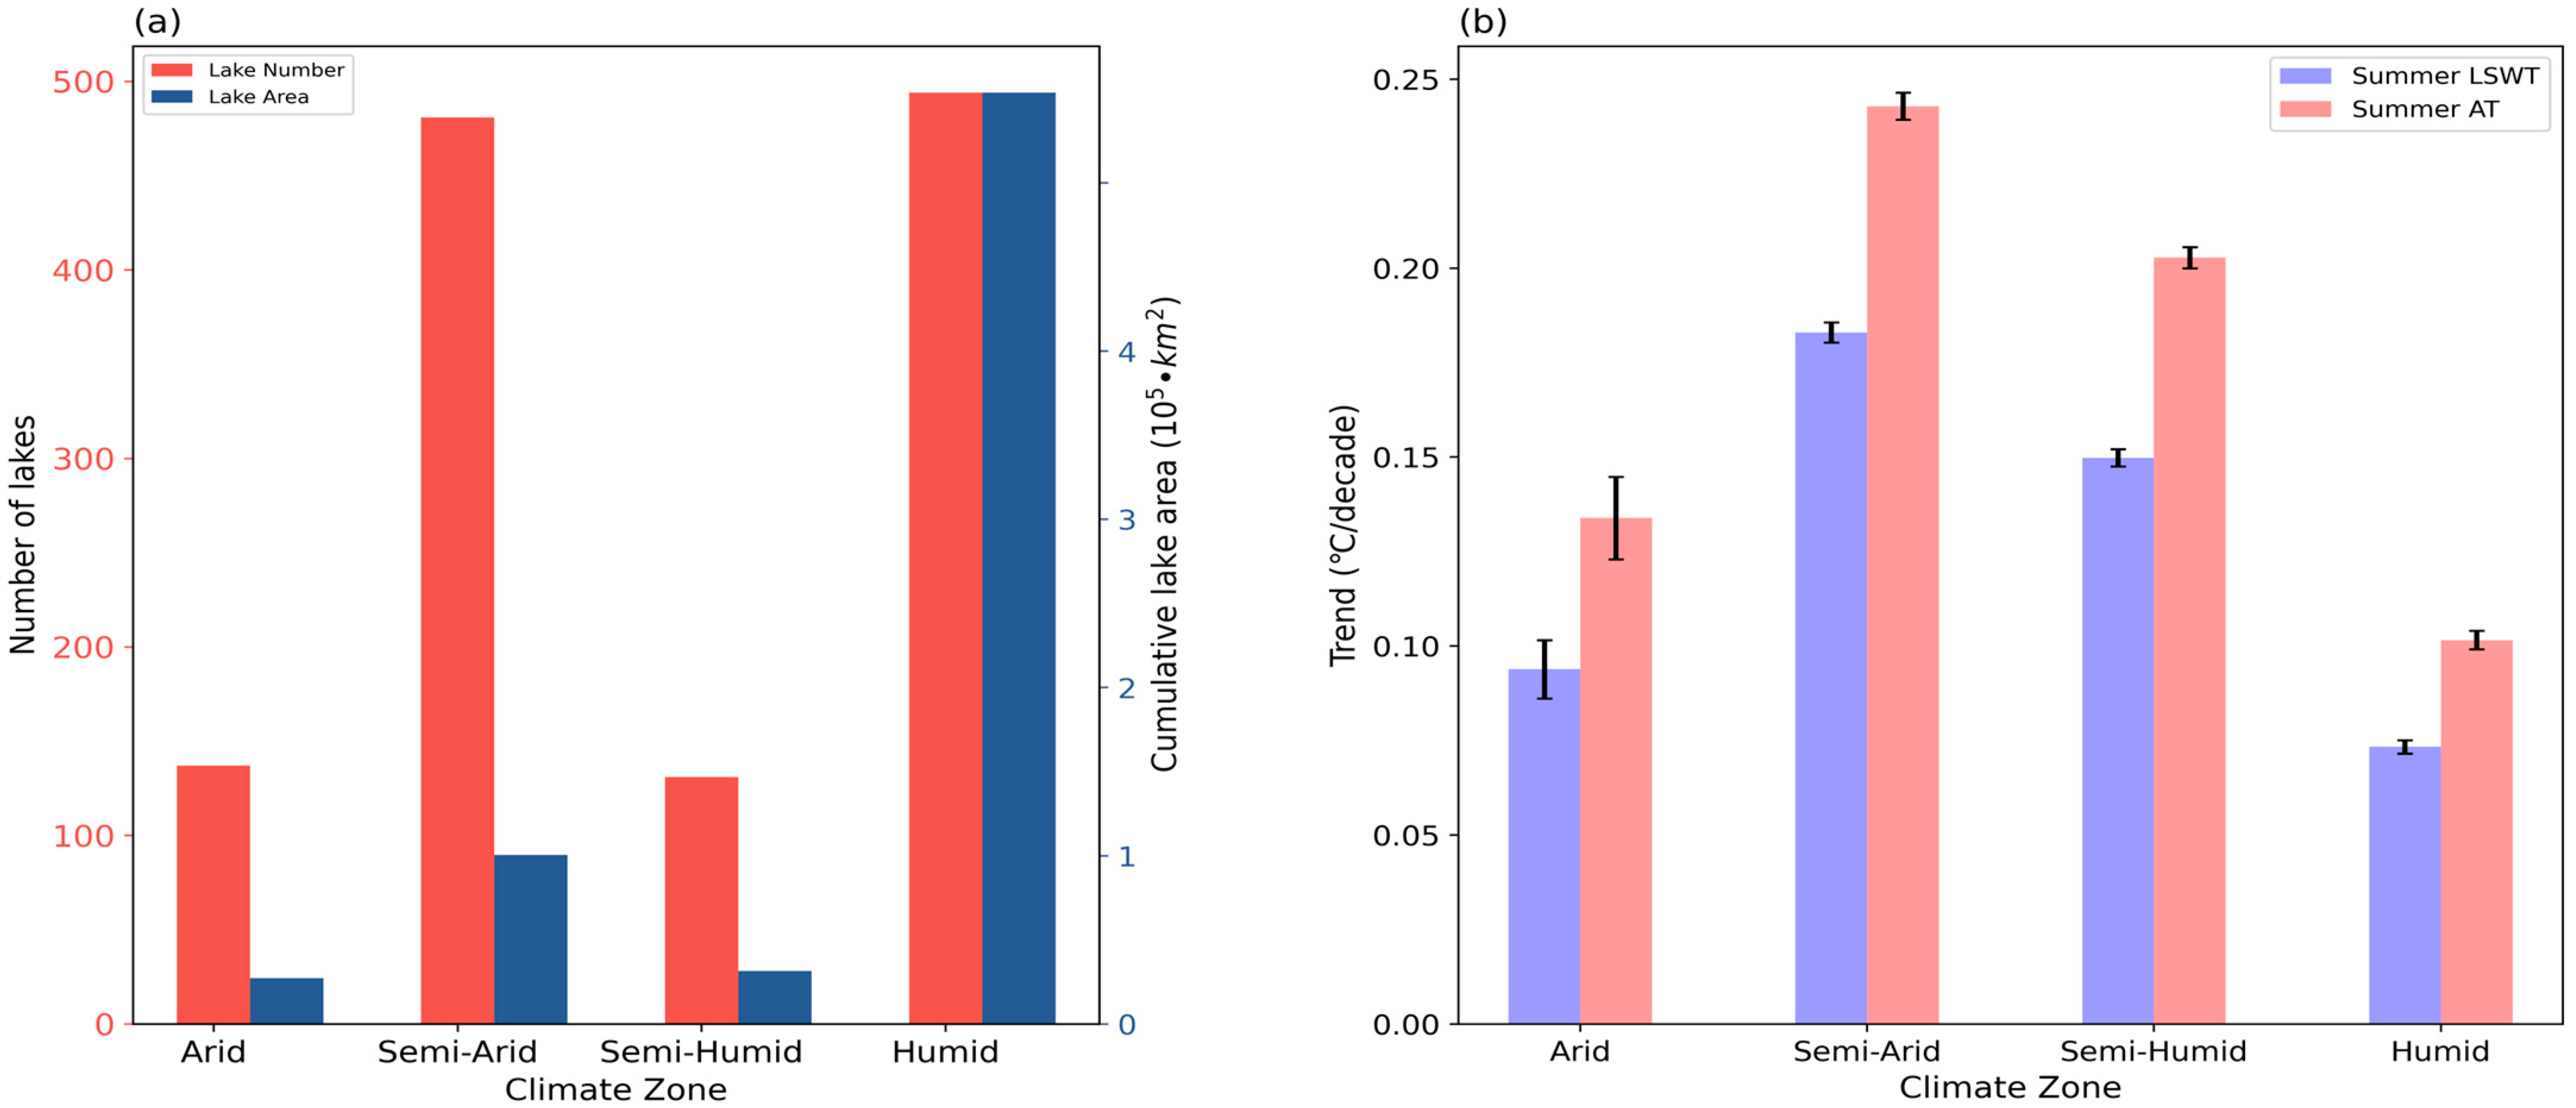
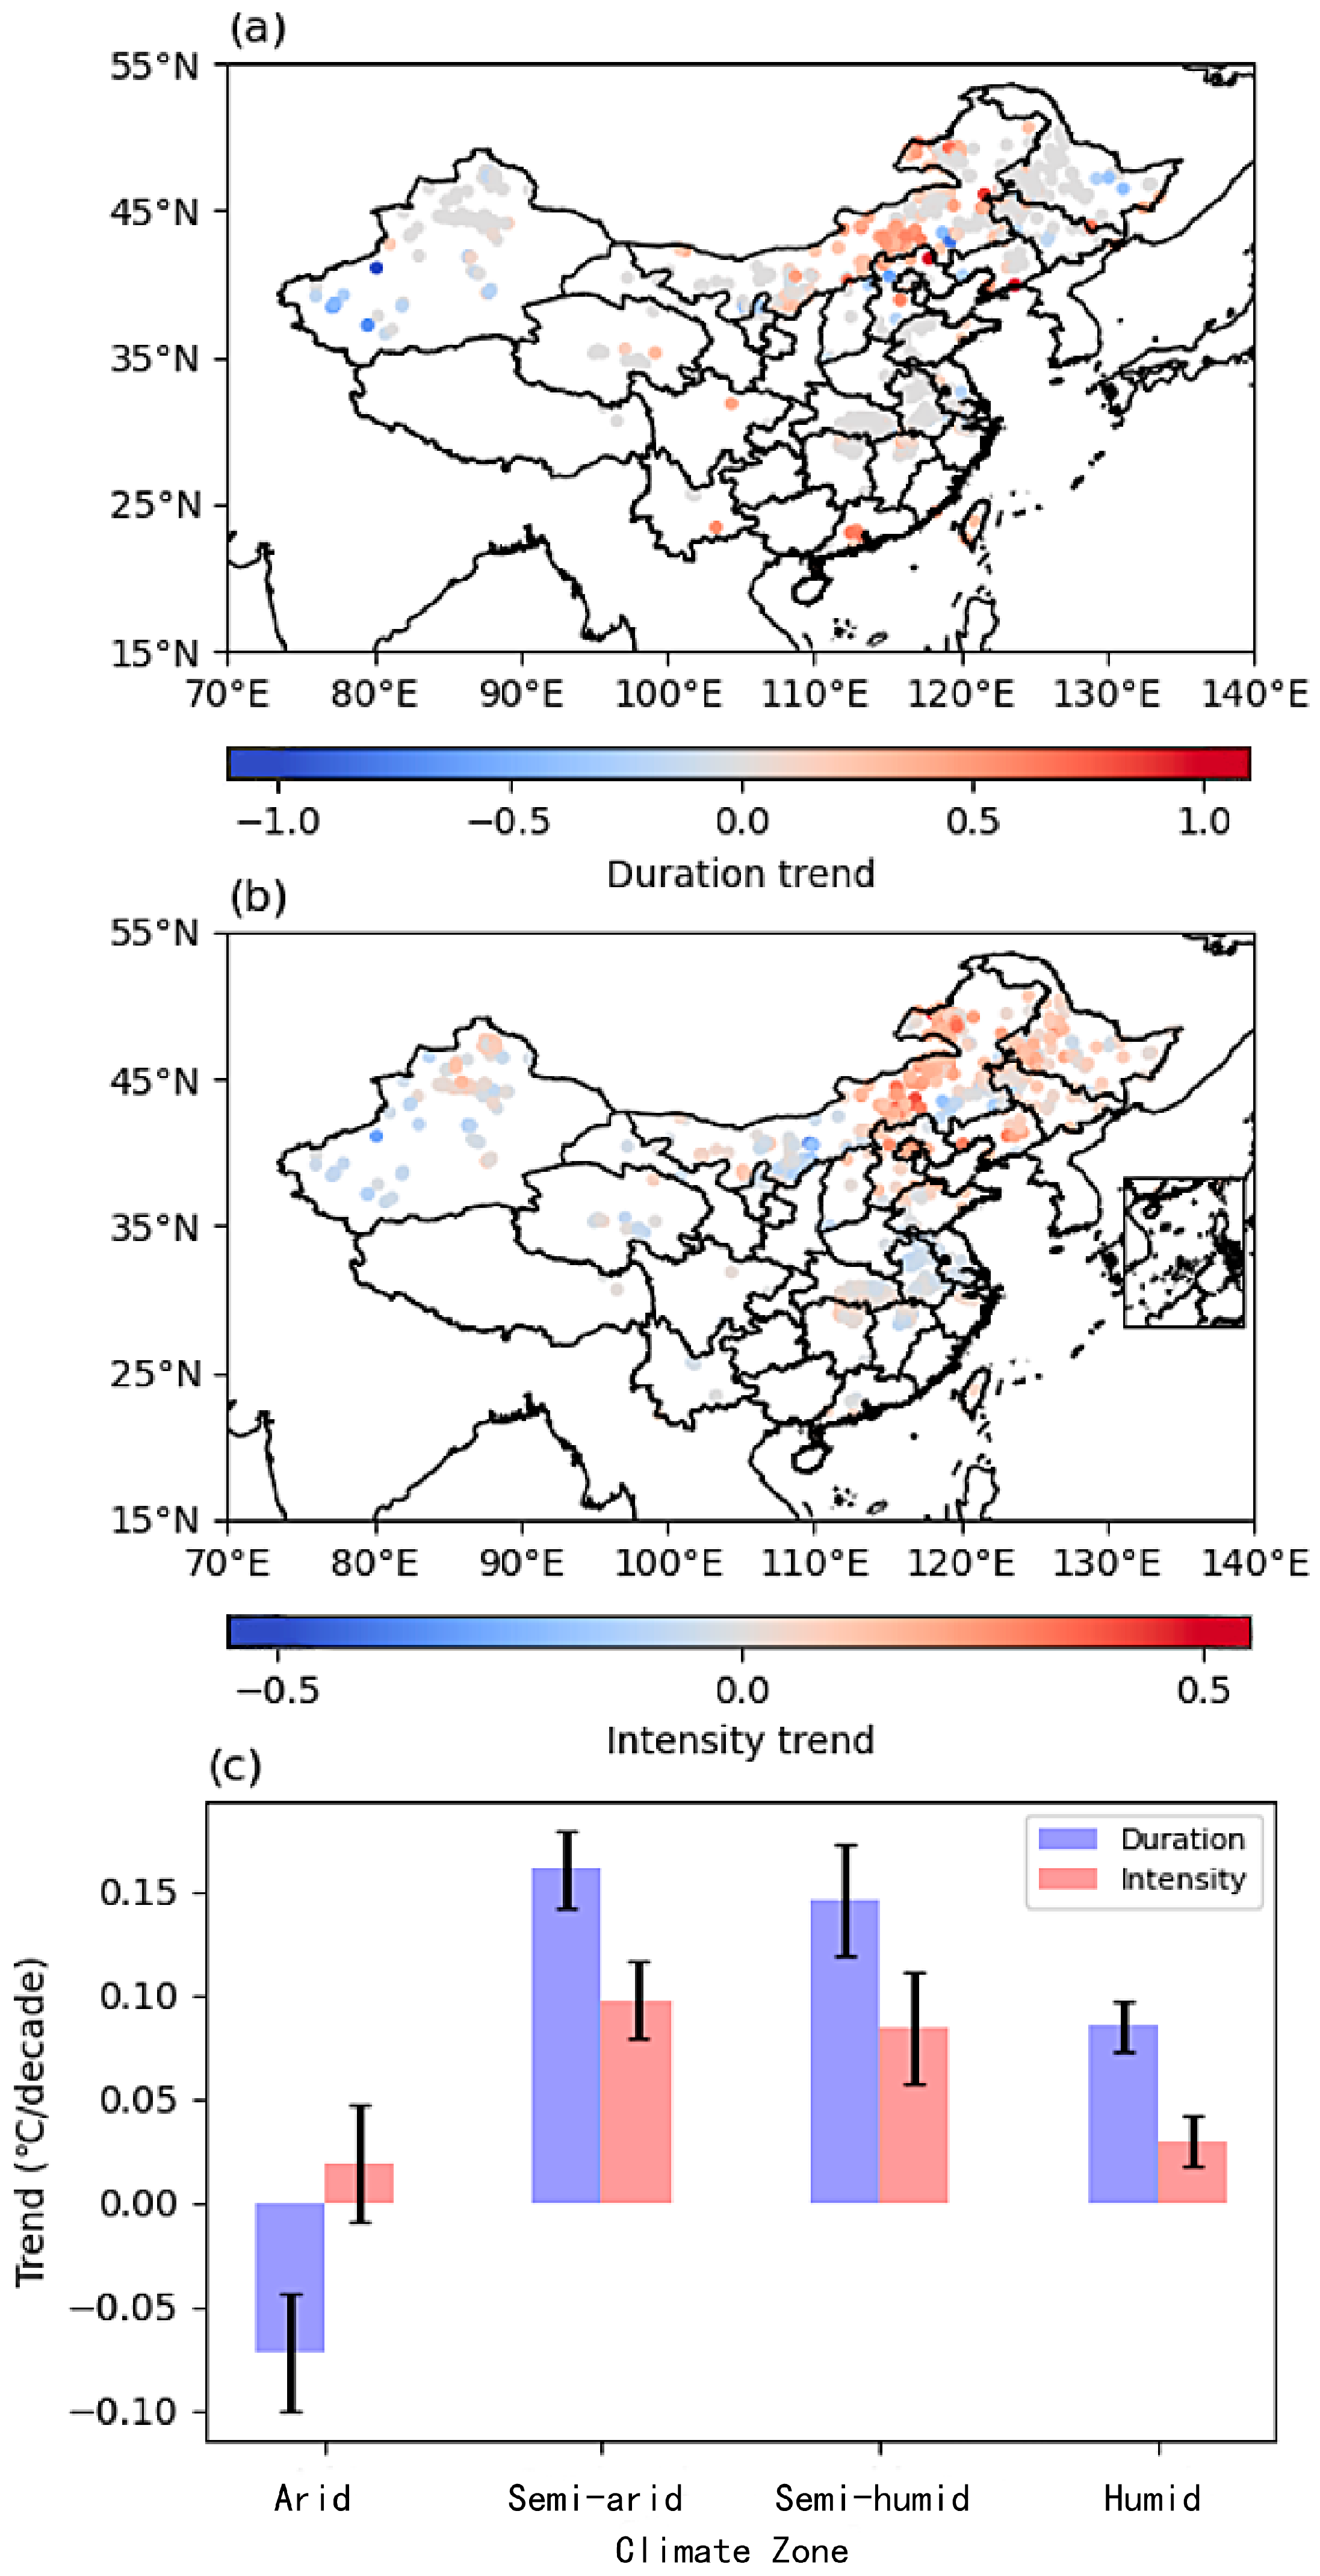
3.2. Enhanced LSWT Warming in Dryland Lakes over China

Figure 3 illustrates the interannual variations in the regional average LSWTs across China from 1950 to 2020. The summer LSWT of all lakes in China exhibited a warming trend at a rate of 0.12 °C per decade, marginally slower than the corresponding warming trend in air temperature (0.17 °C per decade, Figure 3a). The latest report indicates that from 1901 to 2022, the annual average surface temperature in China has shown a significant upward trend, increasing by an average of 0.16 °C every decade. This is higher than the global average warming level during the same period. Prior to 1990, it was below the average, but afterward, it became above the average. This is consistent with the evolutionary characteristics of lake temperatures discussed in this article. Over the past 71 years, notable fluctuations in LSWTs have been observed. Subsequently, a consistent upward trajectory in total LSWT was noted after 1993. Piccolroaz et al. [41] reported substantial variability in the annual average LSWT trend throughout the twentieth century, with significant warming evident in the Northern Hemisphere post-1980, consistent with the present study’s findings. Regional disparities in LSWT patterns among Chinese lakes are clear, with most lakes exhibiting warming trends, except for select lakes in Northwest China that are experiencing cooling (Figure 3b). The summer LSWT trends for specific lakes range from −0.09 to 0.35 °C per decade (Figure 3b). Geographically, the LSWT trends in China display a decreasing gradient from north to south, with lakes in northeastern China experiencing a notably higher warming pace than the national average. Examining air temperature trends, except for a slight negative trend observed in western Xinjiang, air temperature generally indicates an increasing trend from 1950 to 2020, with northeastern China and the Tibetan Plateau exhibiting more pronounced warming compared to other regions (Figure 3c). A comparative analysis of regional changes in LSWT and air temperature reveals a consistent correlation between the increasing trend in LSWT and warmer regions with rising air temperatures. This observation underscores the consistency between changes in summer air temperature and LSWT.
The lakes within the four distinct climatic zones exhibited a warming trend during the summer period spanning from 1950 to 2020, with trends measured at 0.07, 0.21, 0.13, and 0.06 °C per decade (Figure 4). Notably, lakes in the semi-arid region, predominantly situated in central Inner Mongolia, experienced the most rapid warming, followed by lakes in the semi-humid region, and subsequently by lakes in the arid and humid regions. In arid regions, the LSWT of lakes displayed a decline in the early stages, followed by an upward trend in the later stages. The approximate year 1970 signifies a turning point in Chinese interannual variations. Conversely, LSWTs exhibited more pronounced fluctuations in humid regions and a comparatively slower increase. The regional distribution of the trend highlights significant LSWT warming in the semi-arid zone (Figure 4d). Observable differences exist among climatic zones in terms of the number and cumulative area of lakes within each climate region (Figure 5a). The number of lakes in the semi-arid and humid regions surpasses those in the arid and semi-humid regions by more than threefold, collectively constituting over 75% of the total number of lakes examined in this study.
Finally, Figure 5b presents the trends in summer LSWT and air temperature across different climatic zones. Upon comparing the warming rates of lakes in various climatic zones, it was observed that dryland lakes exhibited a summer warming rate of 0.14 °C per decade, surpassing that of humid-region lakes by over 100%, which recorded a rate of 0.07 °C per decade. The semi-arid zone exhibited the most substantial increase in LSWT. Similarly, in comparison to the humid region (0.10 °C per decade), air temperature warming in drylands (0.19 °C per decade) was more pronounced. Consequently, we propose that the disparity in summer LSWT warming between drylands and humid regions is intricately linked to regional air temperature warming. Existing evidence suggests that air temperature serves as the primary driver of LSWT changes [11,44]. The heightened warming of air temperatures in drylands contributes to the more substantial warming of summer LSWT in these regions. In summary, our findings indicate that summer LSWT in China’s drylands has consistently surpassed that in humid regions, implying the potential vulnerability of dryland lakes to the pronounced warming trends in China’s drylands.

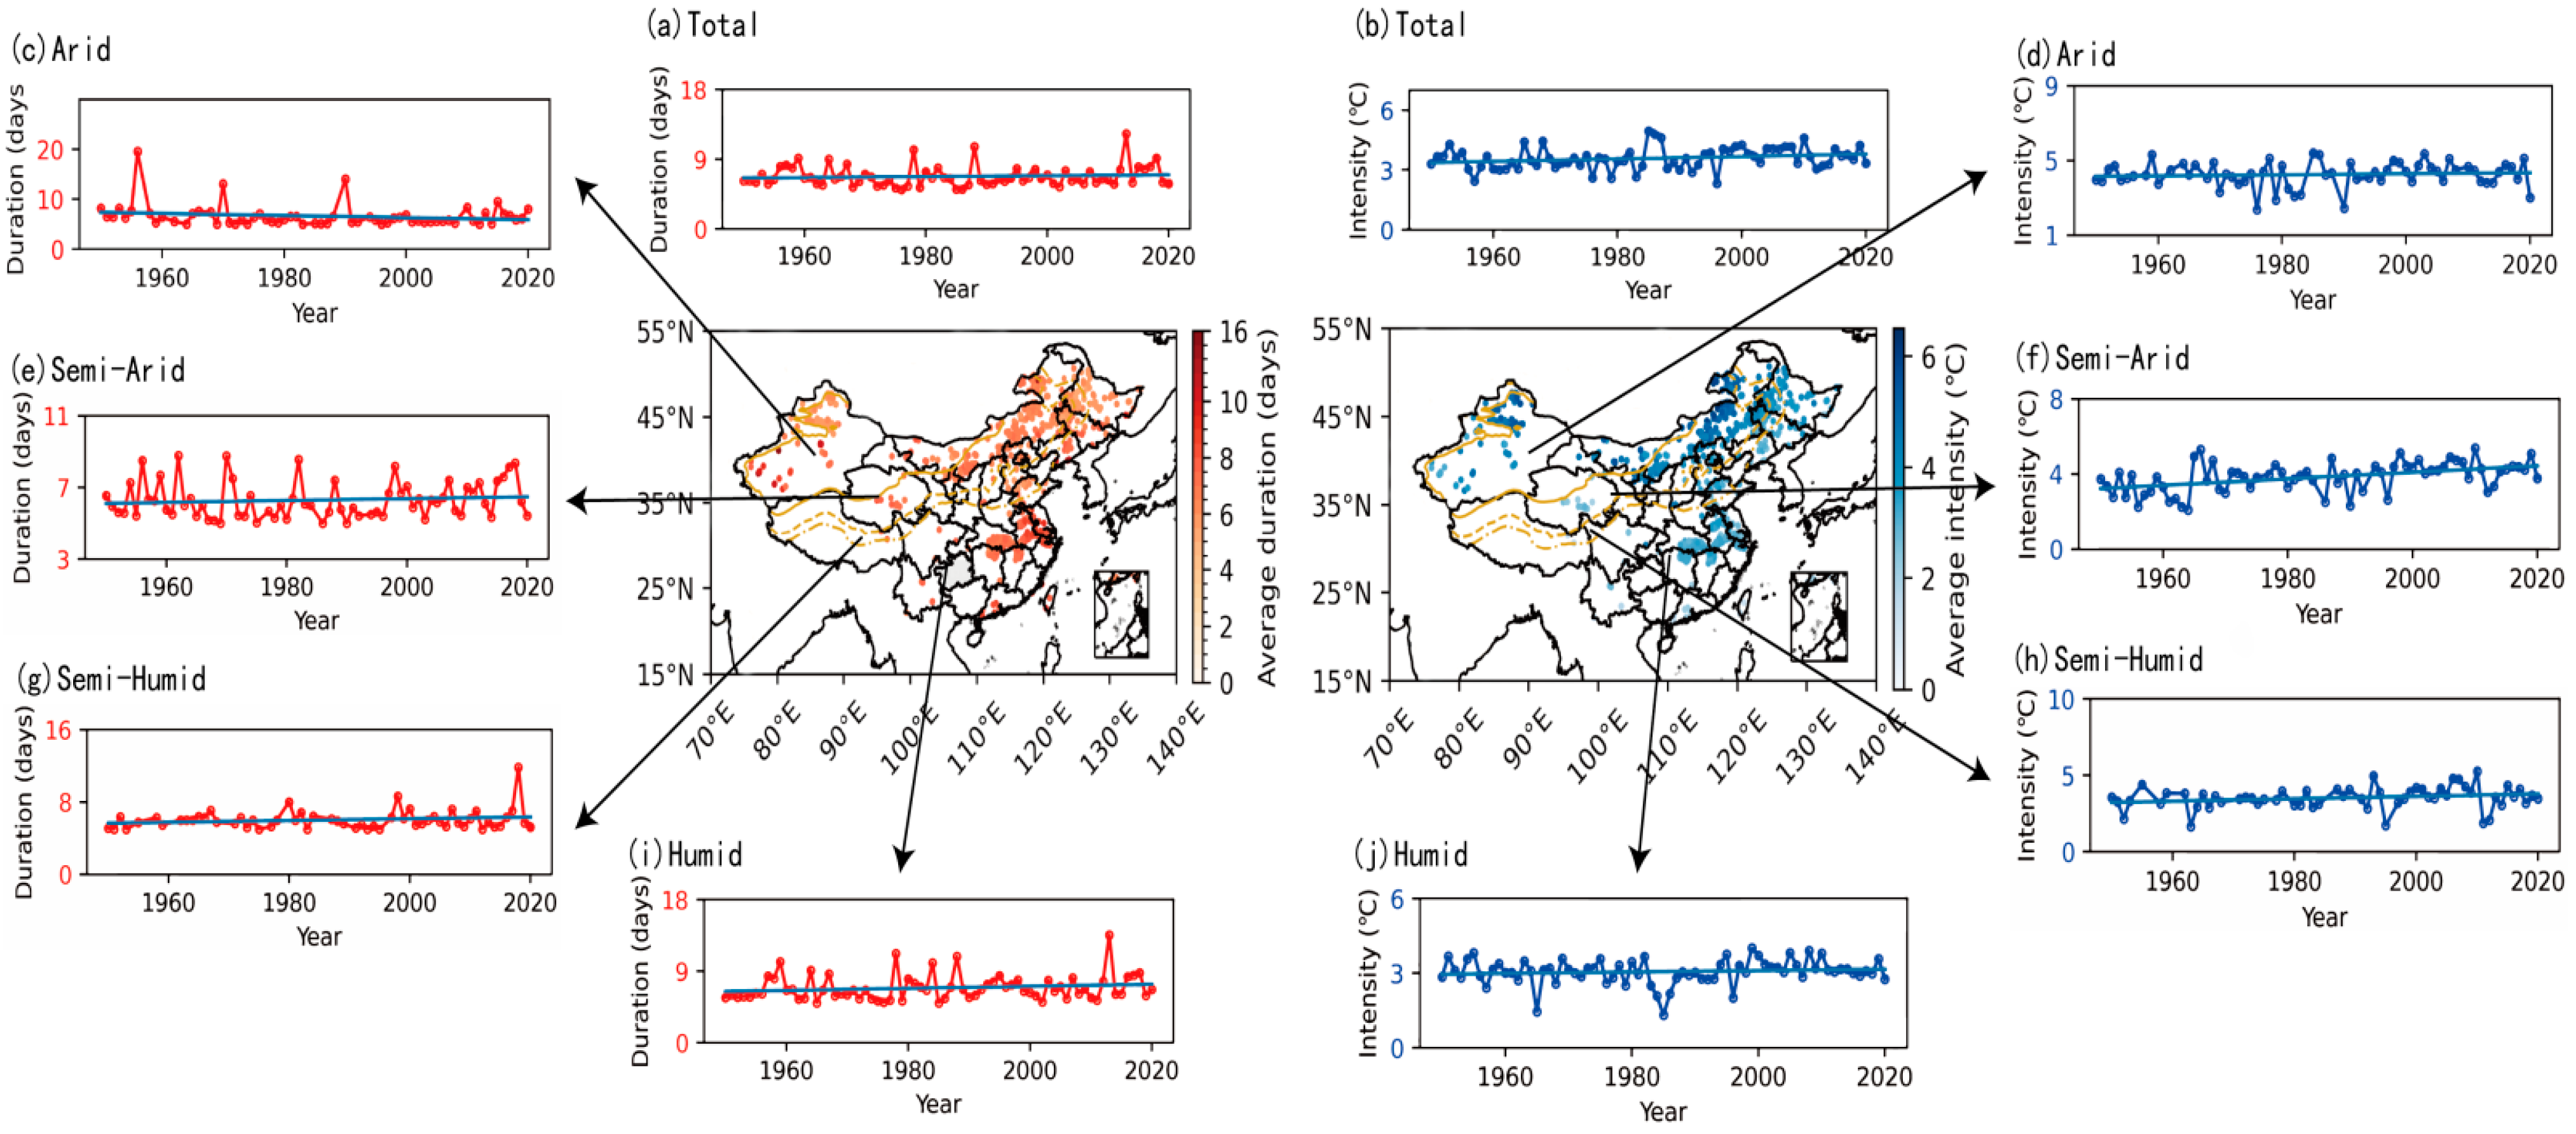
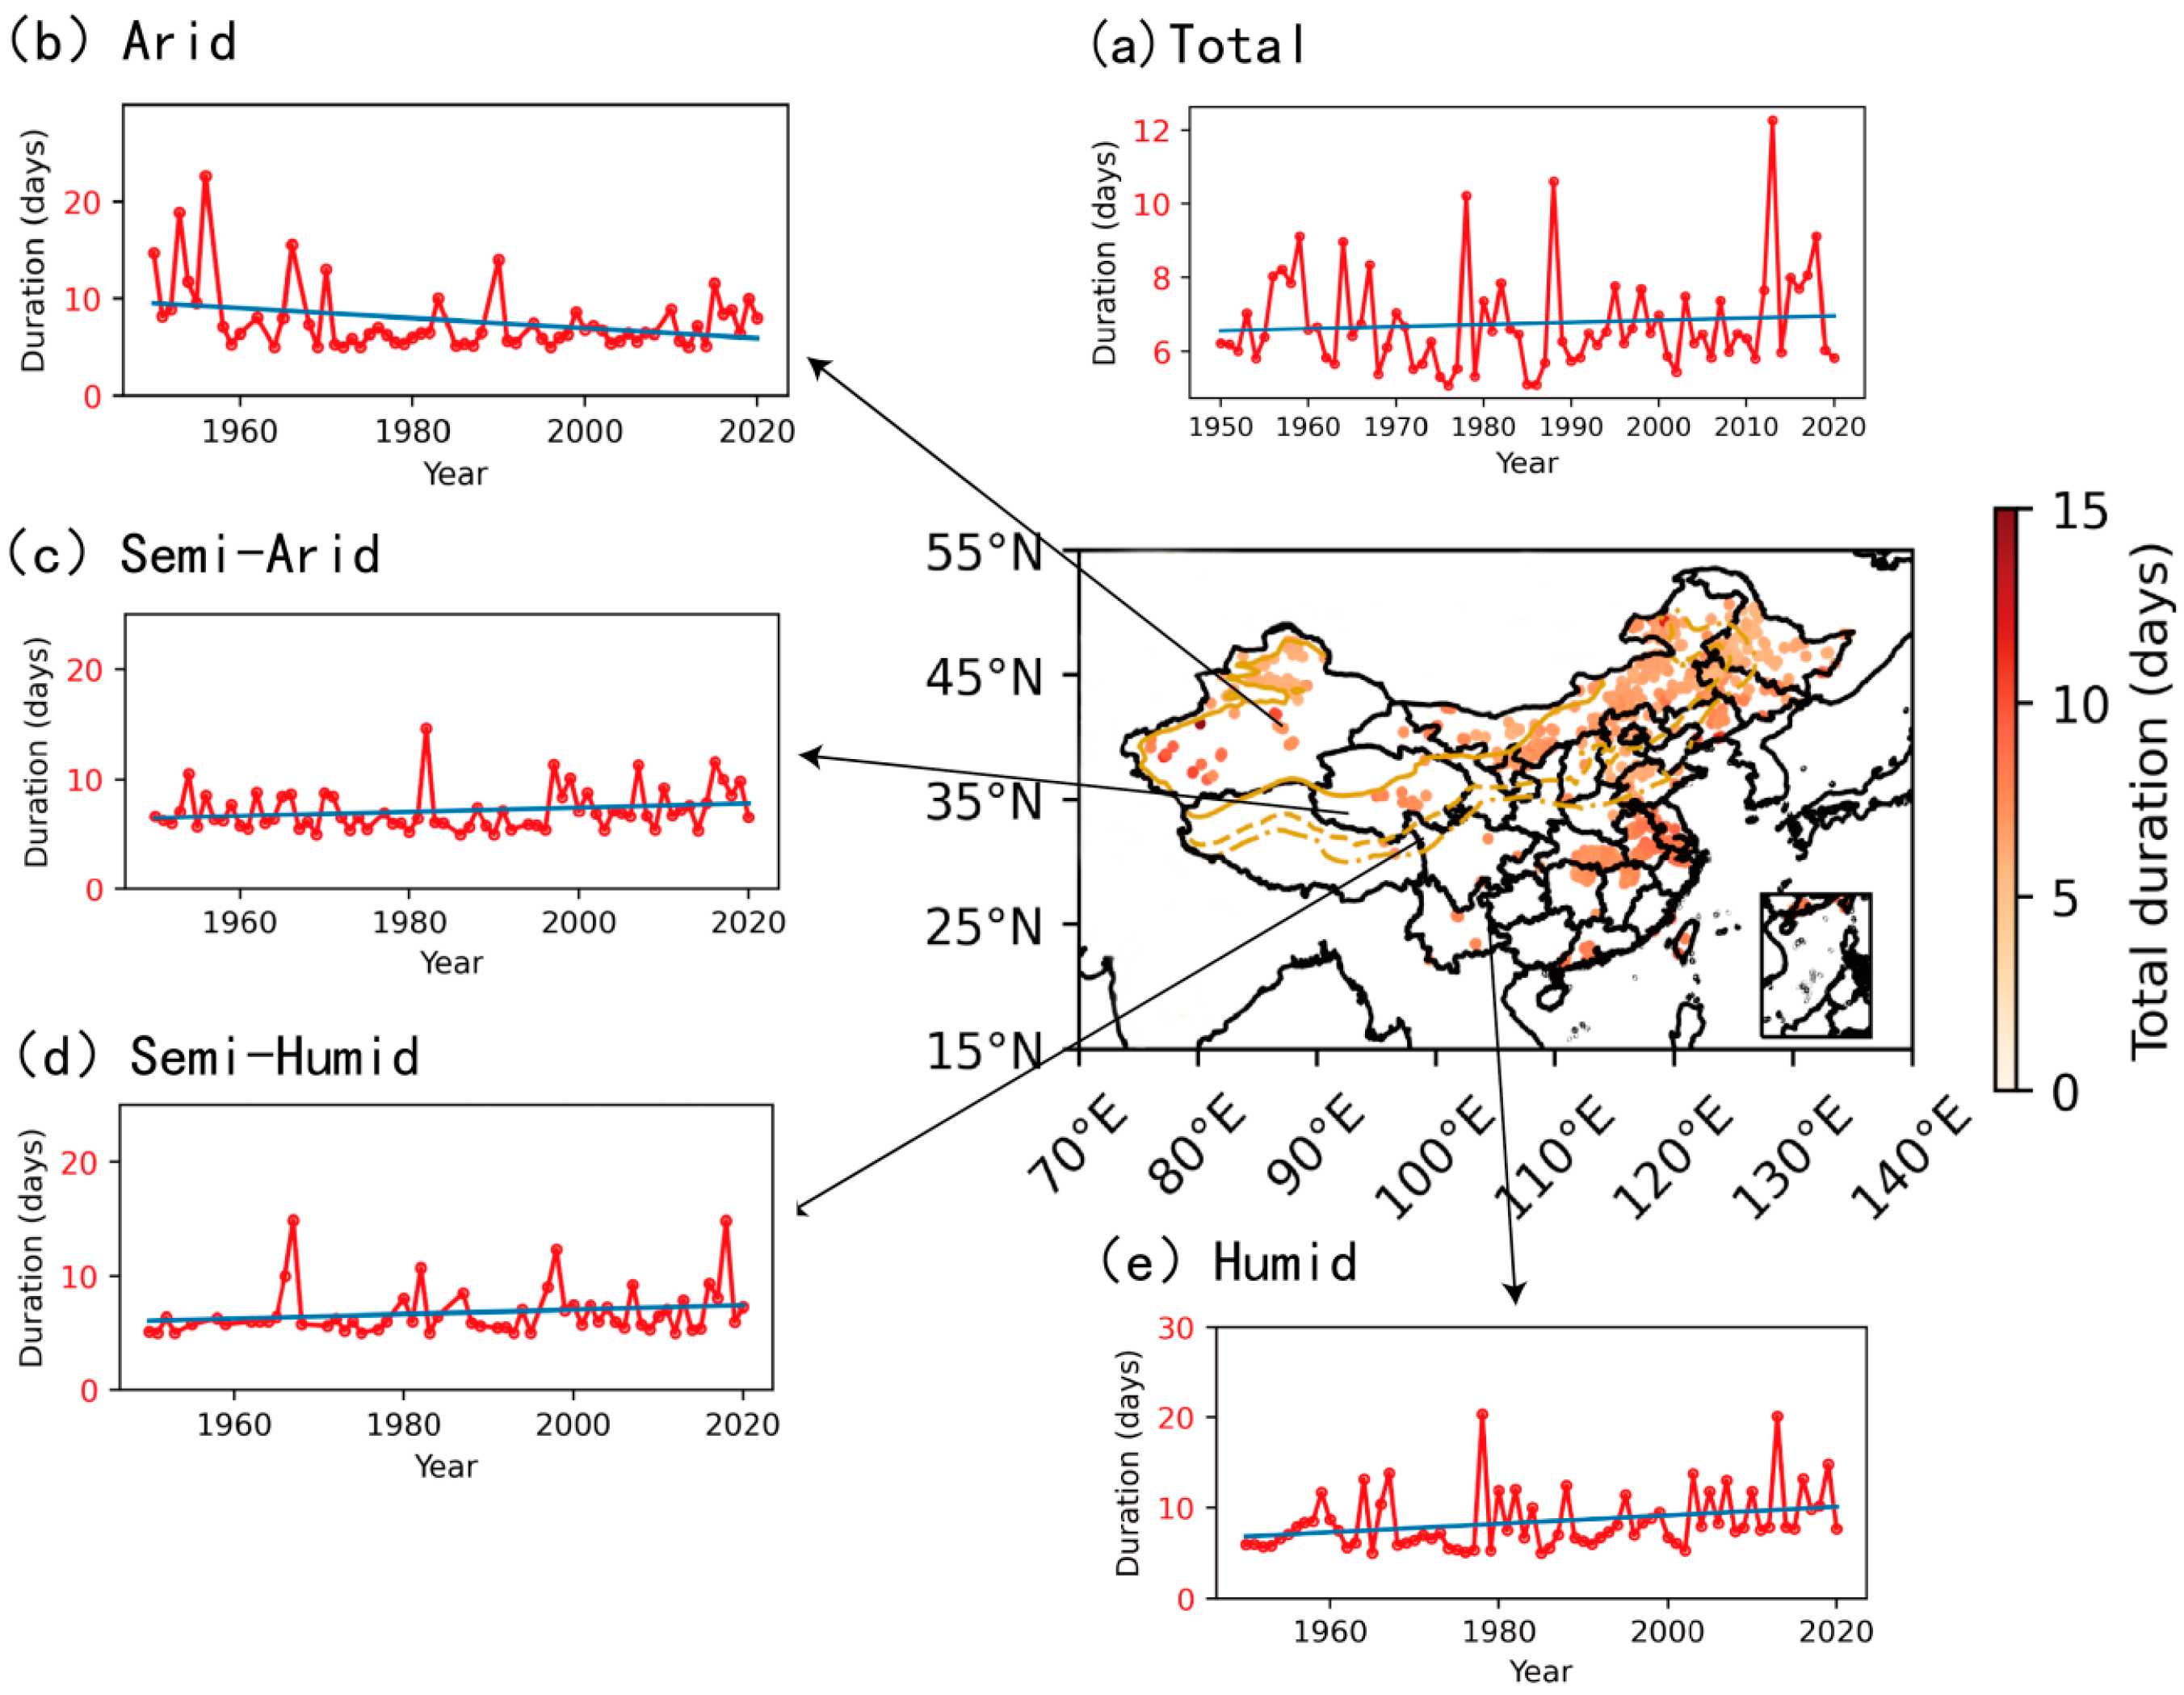
3.3. Trend of Lake Heatwaves in China

Lake heatwaves, characterized by prolonged periods of elevated LSWT, have undergone significant alterations attributed to the pronounced warming of LSWT. In this context, we undertake a quantitative assessment of the spatial and temporal variations in the intensity and duration of lake heatwaves across different climate zones. With the exception of the duration in the arid region (−0.20 °C per decade), all analyzed properties of lake heatwaves exhibit positive trends from 1950 to 2020 (Figure 6). In China, the average duration of lake heatwaves experienced a decade-by-decade increase of 0.06 days, ranging from slightly over 5 to approximately 16 days, with an average of 6.8 days. The average intensity witnessed a rise of 0.08 °C per decade, culminating in a total increase of 0.6 °C over the 71-year study period (Figure 6a). Drylands (Figure 6c) exhibited a comparatively shorter average duration (6.5 days) than humid regions (Figure 6i) (7.3 days), while the average intensity in drylands (Figure 6d) (4.2 °C) surpassed that in the humid region (Figure 6j) by 31% (3.2 °C). Regions in southeastern China and southwestern Xinjiang manifested more prolonged episodes, while the intensity showed an opposing trend, with stronger lake heatwaves observed in northern China’s semi-arid region, featuring temperatures peaking at 6.2 °C and a mean of 4.3 °C (Figure 6f). Furthermore, the annual total duration of lake heatwaves demonstrated a faster growth rate (0.18 days per decade) compared to the average duration (Figure 7).
The annual total duration of lake heatwaves in the arid region exhibited a consistent negative trend (−0.05 °C per decade), mirroring the mean duration (Figure 6c and Figure 7b). Conversely, the other three climatic zones displayed positive trends, with mean annual total durations of 8.0 days, 7.3 days, and 9.8 days per year, respectively. In terms of regional distribution, the total duration of lake heatwaves was most extensive in southern China’s humid region and Xinjiang’s desert region. Notably, the mean duration and intensity of lake heatwaves in northeastern China’s semi-arid region displayed significant positive trends, while other regions exhibited lower or even negative trends (Figure 8). Specifically, Figure 8c elucidates that the semi-arid region showcased the most substantial trends in duration (0.16 °C per decade) and intensity (0.10 °C per decade).
Throughout the analyzed period, the intensity of lake heatwaves increased across all four climatic zones. The negative trend in the mean duration of lake heatwaves in the arid region (−0.07 °C per decade) implies a shortening of lake heatwave durations in this region. Dryland lake heatwaves continued to intensify in both duration and intensity (0.08 days/0.08 °C per decade), whereas those in the humid region exhibited a comparatively slower increase (0.07 days/0.03 °C per decade). In conclusion, China witnessed an increase in the average duration, total duration, and intensity of lake heatwaves. The intensity of lake heatwaves in drylands surpassed that in humid regions by 1.3 times, while the duration and total duration of lake heatwaves in the humid region exceeded those in drylands by 1.1 times.
In accordance with the observed trends, drylands exhibited more intense lake heatwaves than humid regions in terms of intensity, while the duration increased at a comparable rate. This discrepancy aligns with expectations, as the intensity of lake heatwaves is intricately linked to variations in air temperature [14]. Regions characterized by substantial fluctuations in surface temperature, such as high-latitude areas, experience more pronounced temperature warming in lakes, whereas the reverse is true for low-latitude lakes. This supports our conclusion that the considerable warming observed in China’s drylands has led to more intense dryland lake heatwaves. Dryland lakes demonstrate a heightened sensitivity to variations in dryland air temperature.
Additionally, it is noteworthy that high-latitude lake heatwave events tend to be shorter than those at lower latitudes, which is consistent with our findings indicating that high-latitude dryland lakes exhibit shorter heatwave durations than lakes in humid regions at lower latitudes. The increase in the mean spatial extent of lake heatwaves is primarily attributed to a rise in the duration of these heatwaves [14]. It is plausible that the augmented duration of lake heatwaves over the research period was accompanied by an expansion in the area of lake heatwaves in drylands. The more substantial increases in dryland LSWTs contribute to more frequent and prolonged dryland lake heatwaves.

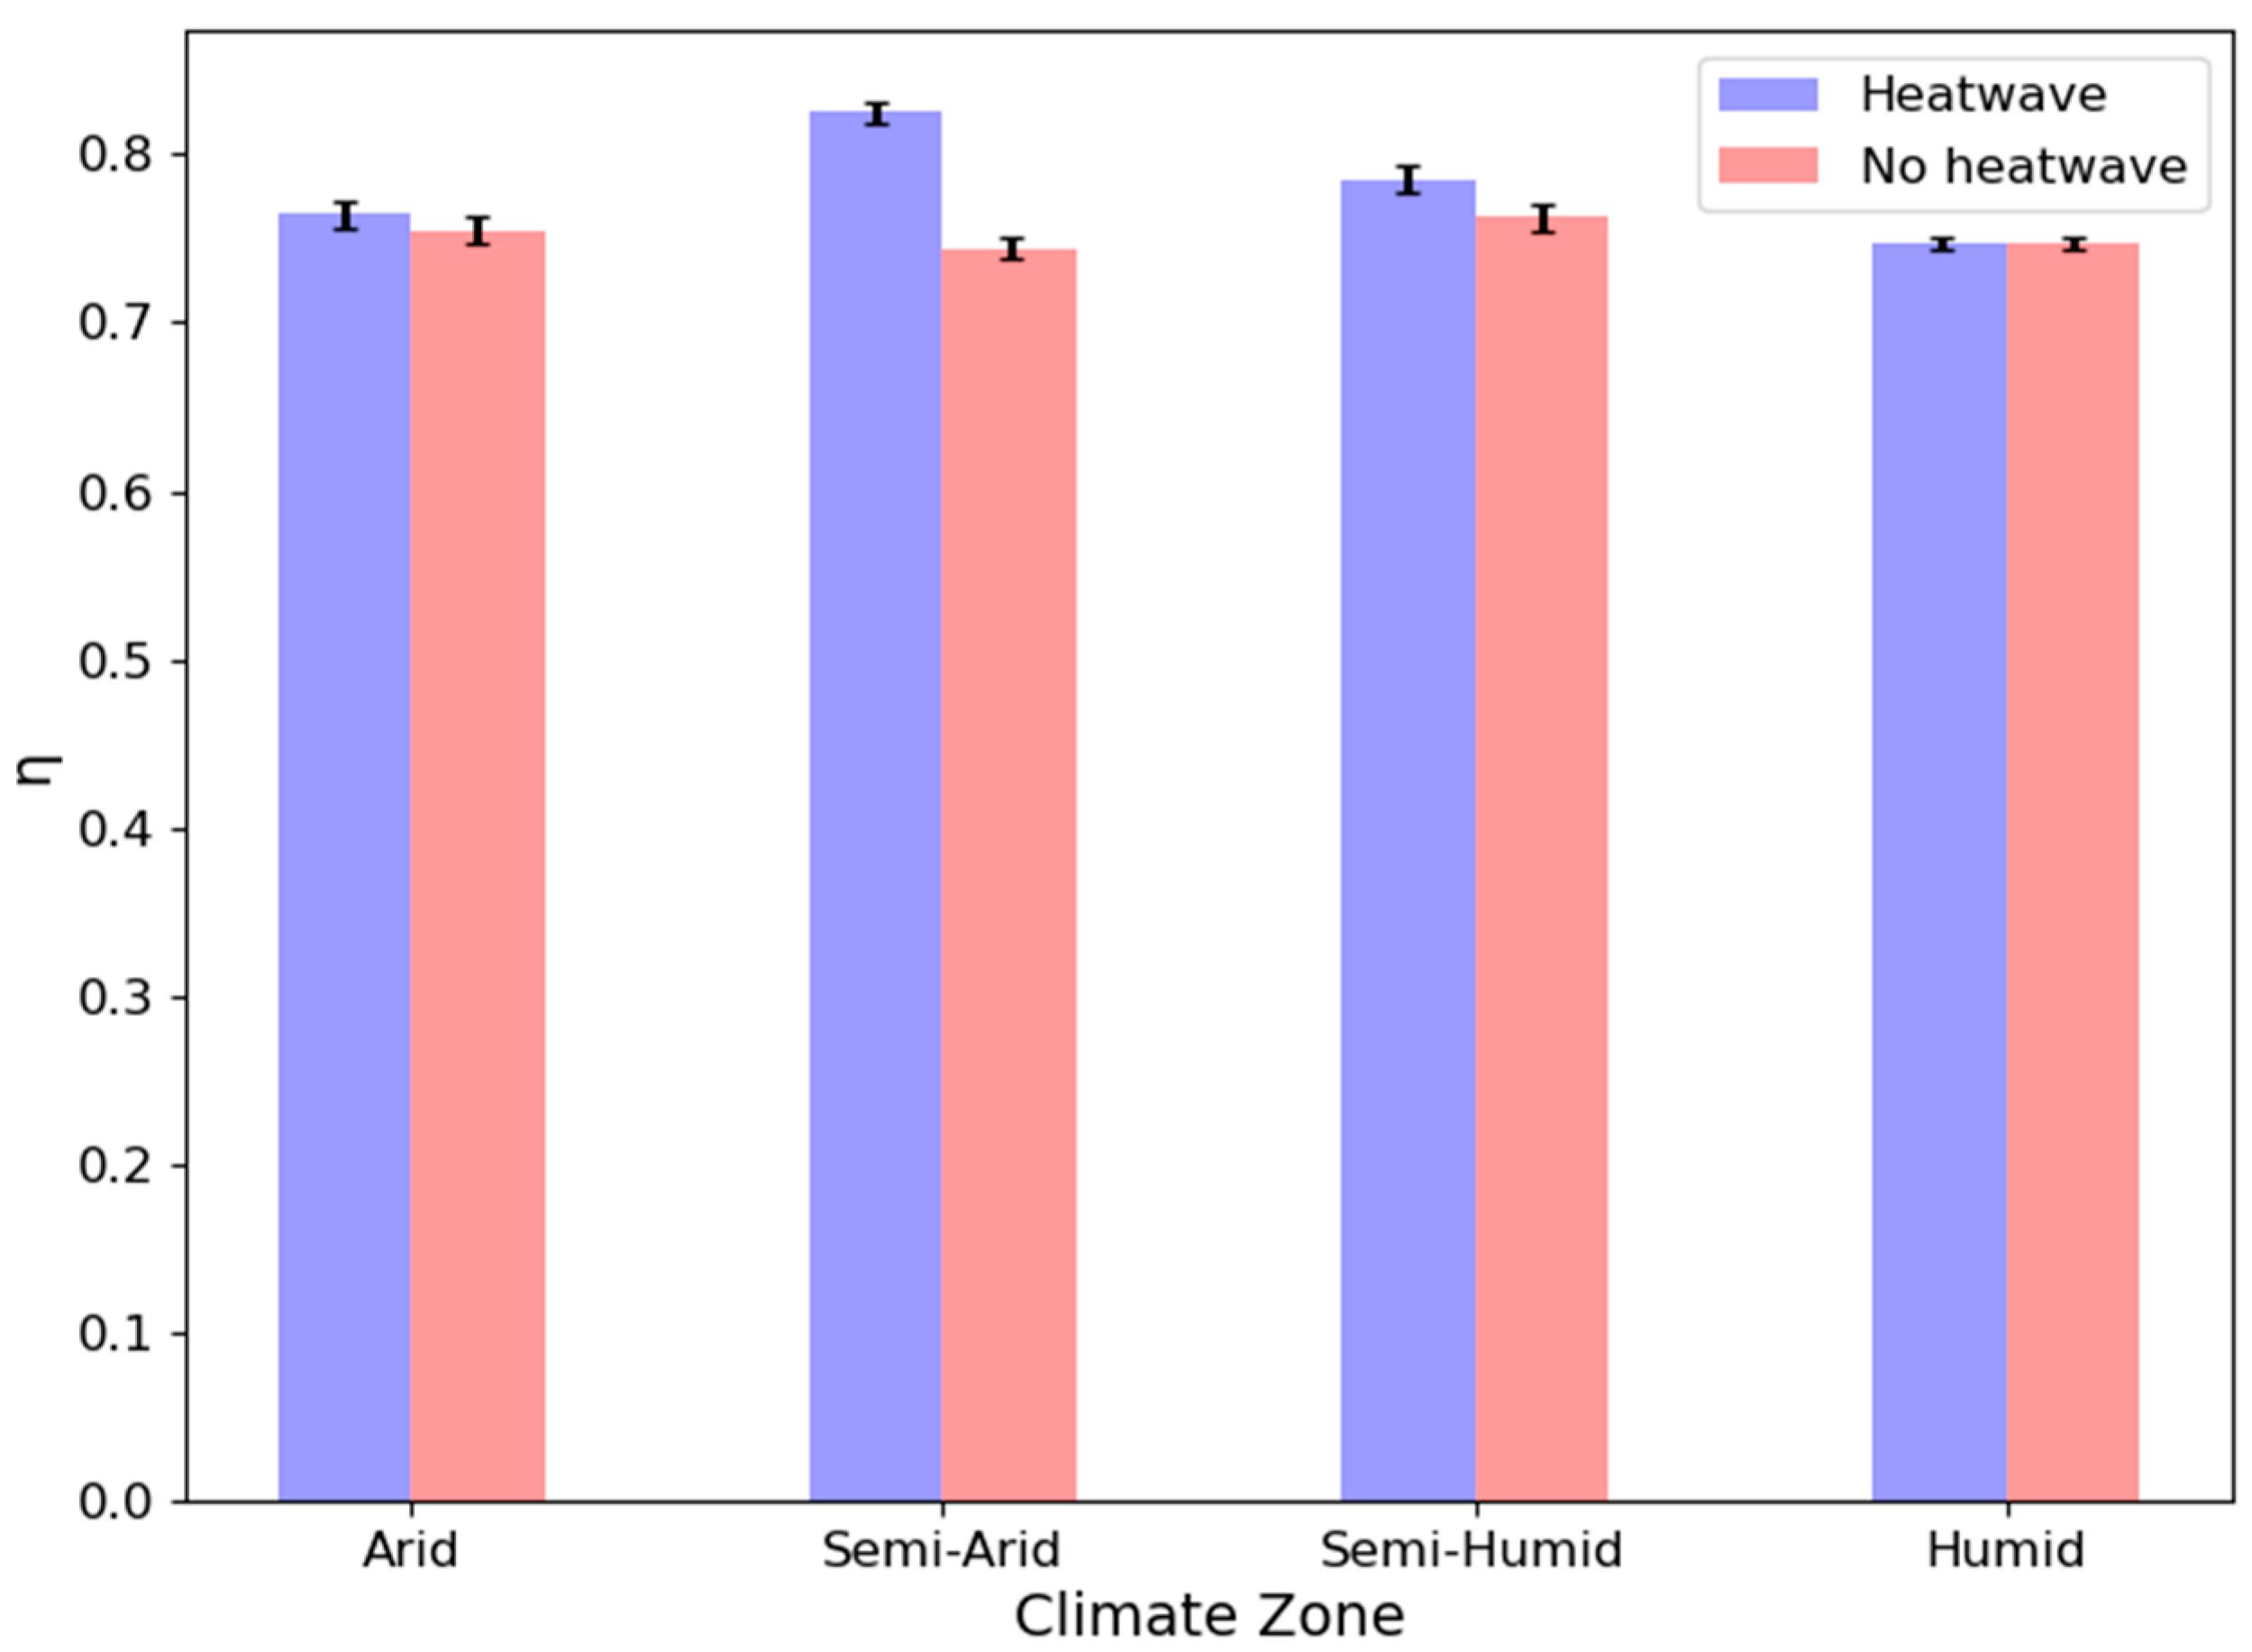
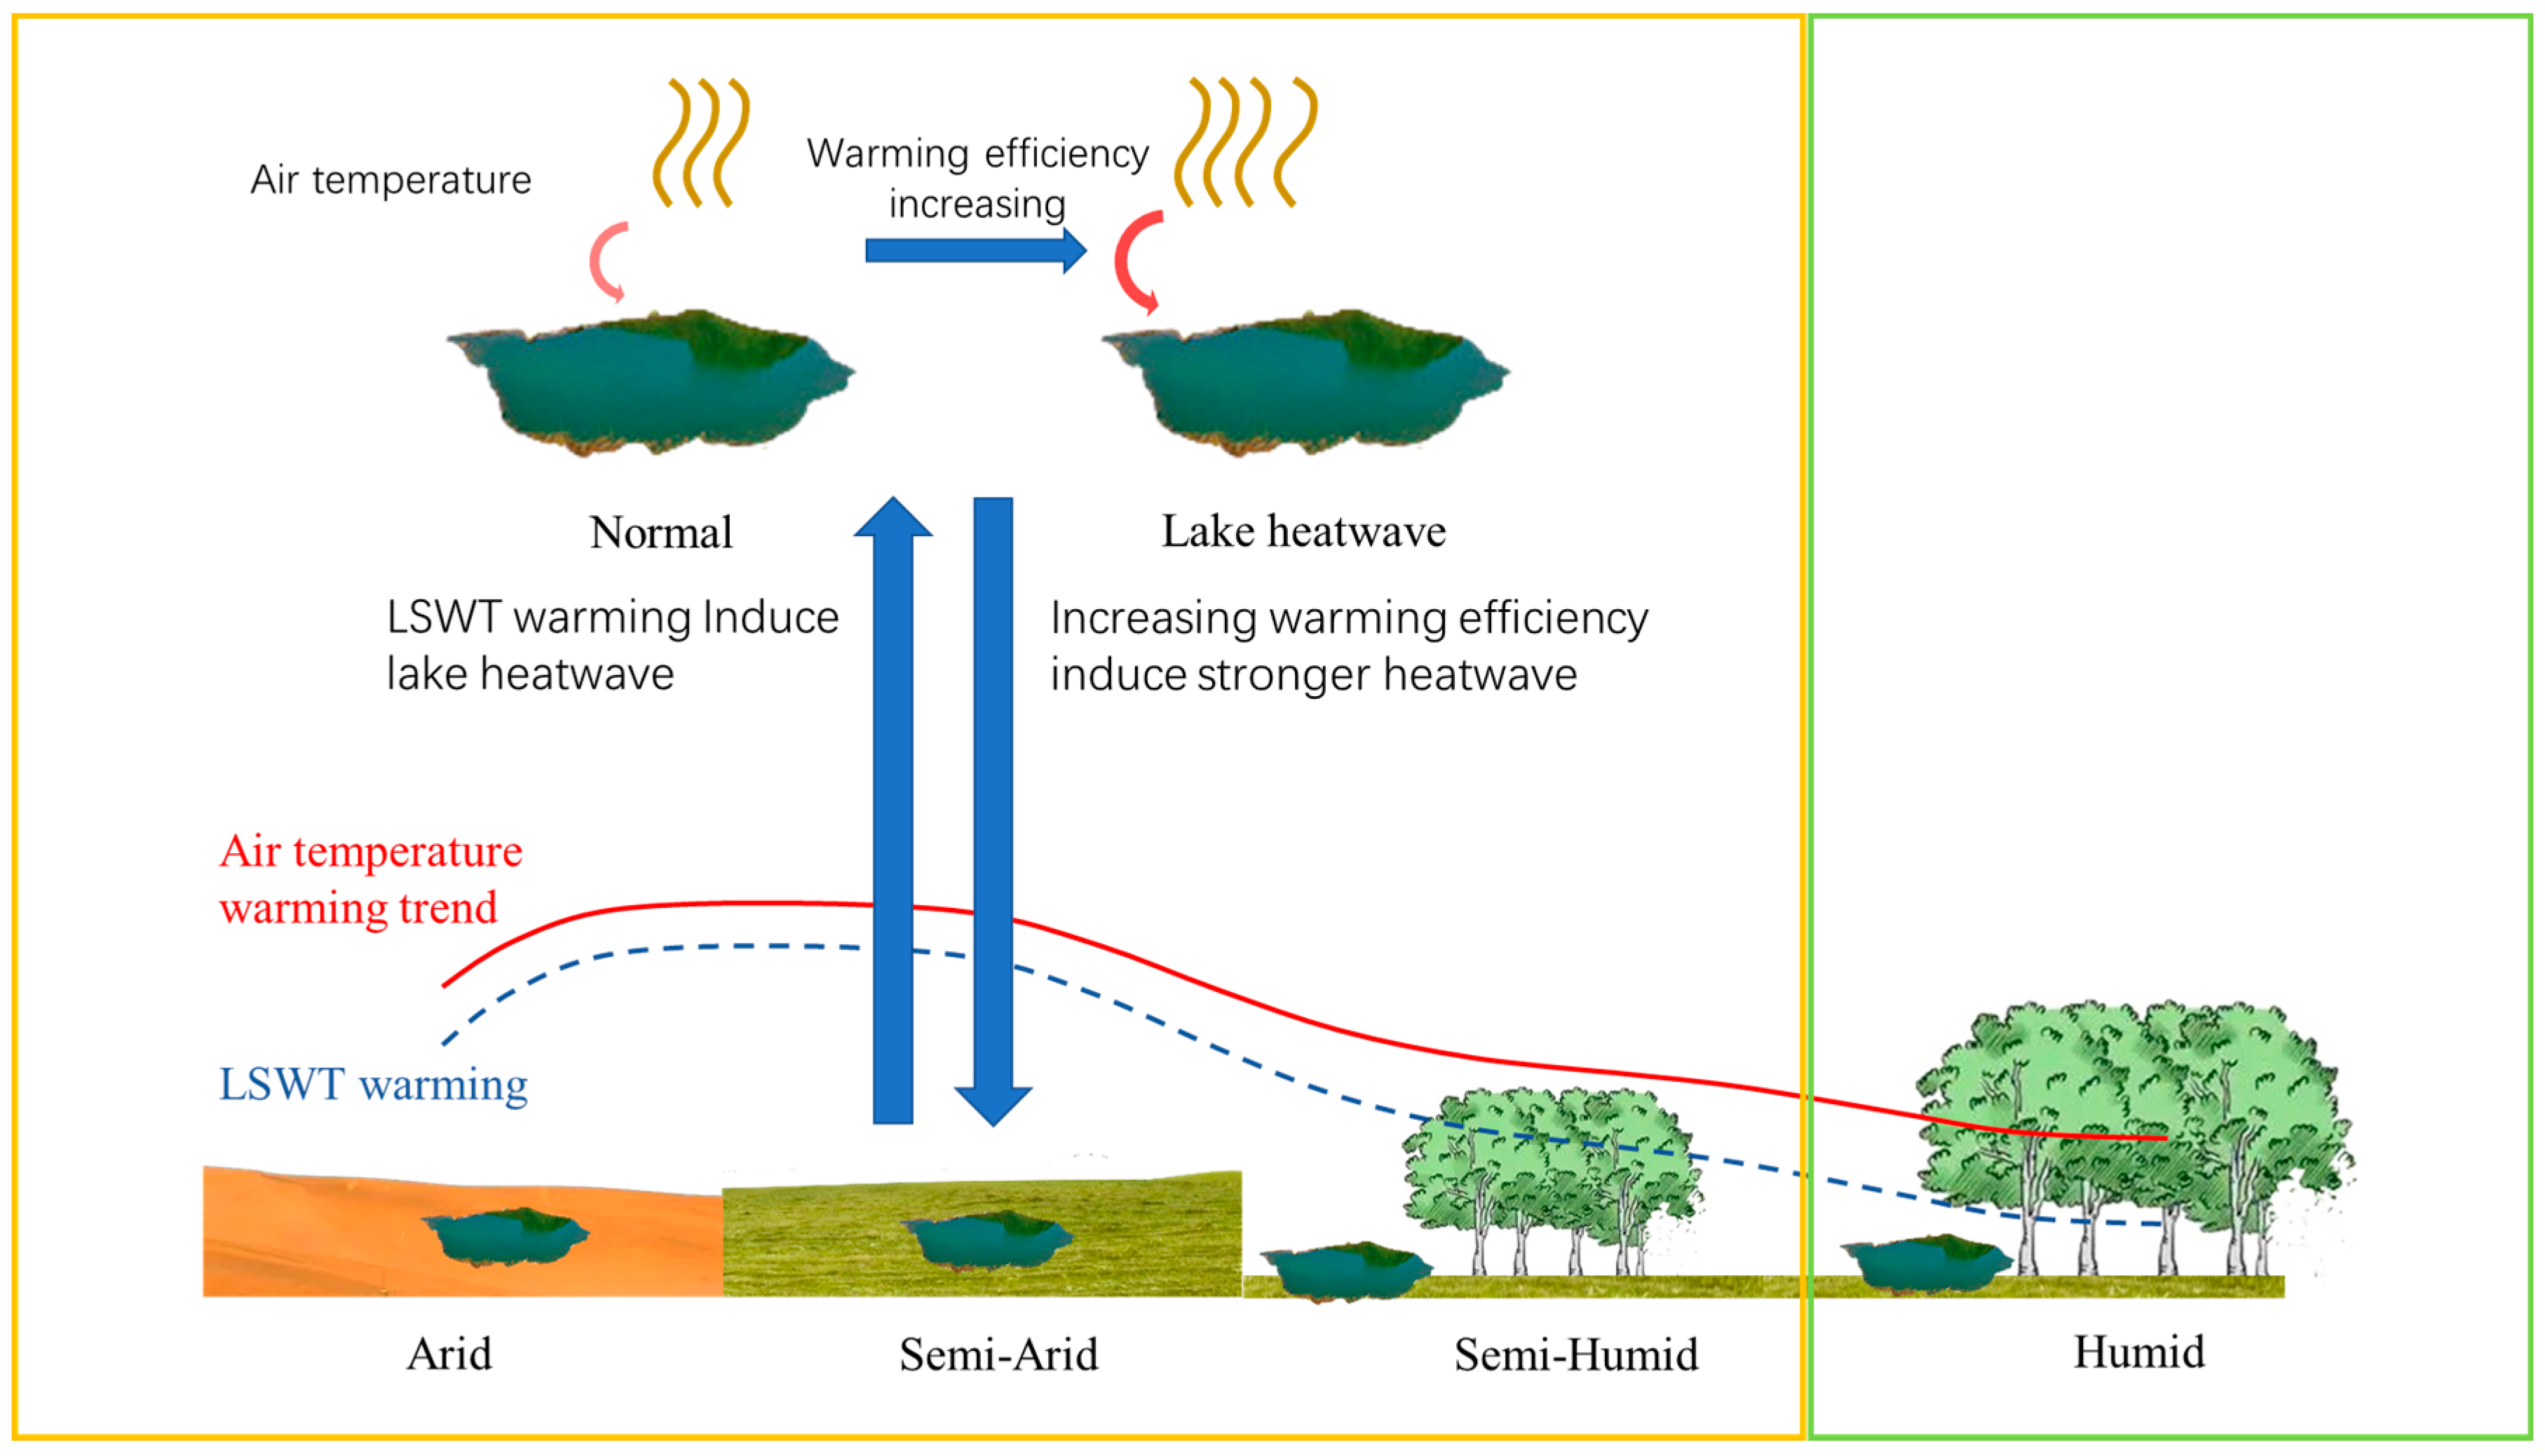
3.4. Role of Lake Heatwaves in Enhanced Dryland LSWT Warming

Dryland lake heatwaves exhibit greater strength and duration compared to those in humid regions, implying a significant role in the intensified warming of dryland LSWT. Consequently, we explored the warming efficiency η (Equation (1)) during both heatwave and non-heatwave periods over lakes (Figure 9). Warming efficiency, denoting the ratio of LSWT changes to air temperature changes, serves as an indicator of the energy transfer rate from air temperature to LSWT. The η values range between 0.7 and 0.8, slightly below 1, consistent with Figure 5b, depicting that LSWT warming lags behind air temperature warming. Notably, during lake heatwaves, semi-arid regions exhibit the strongest response, while humid regions exhibit the smallest response. Conversely, during non-heatwave periods, warming efficiencies in the four climatic zones exhibit similar values, with the semi-arid regions displaying the weakest response.
Examining specific periods, the average warming efficiency in drylands during lake heatwaves stood at 0.79, surpassing the 0.75 obtained during non-heatwave periods in drylands. Additionally, the warming efficiency in drylands during non-heatwave periods aligns with that in humid regions, both registering a value of 0.75. Overall, drylands exhibit a higher warming efficiency during lake heatwaves than during non-heatwave periods. Specifically, drylands featuring only lake heatwaves demonstrate a higher warming efficiency than humid regions. This suggests that during lake heatwaves, dryland lakes exhibit heightened sensitivity to changes in air temperature, evident in their high warming efficiency and robust warming trends. Consequently, the trend in LSWT warming is influenced by both increased air temperature trends and greater warming efficiencies in dryland lakes compared to humid regions.
The interactions between LSWT warming and lake heatwaves may engender positive feedback loops, amplifying dryland LSWT warming. Under global warming conditions, the acceleration of dryland LSWTs surpasses that of humid regions, driven by air temperature trends. The elevated dryland LSWTs contribute to increased frequency and prolonged duration of lake heatwaves. Importantly, during lake heatwaves, the warming efficiency rises compared to non-heatwave periods. This heightened efficiency supports the amplification of both lake heatwaves and LSWT warming. Notably, the most substantial changes in warming efficiency between lake heatwaves and non-heatwave periods occur in semi-arid regions, fostering the intensification of dryland LSWT warming. These processes collectively form a positive feedback loop, with lake warming and lake heatwaves mutually reinforcing each other in drylands, as depicted in Figure 10. Crucially, as concentrations of greenhouse gases (GHGs) continue to increase due to human activities, the positive feedback effect outlined here suggests that lake heatwaves will become more frequent and intense in a warming world.

4. Conclusions and Discussion

This study utilized the air2water model to extend daily lake surface water temperatures (LSWTs) in Chinese lakes, spanning from 1950 to 2020, aiming to explore the responses of LSWT warming and the role of lake heatwaves. The findings revealed a warming trend in the summer LSWT of Chinese lakes, slightly lagging behind the increase in air temperature. Remarkable temporal variations were observed, including a decline from 1955 to 1970, a resurgence between 1975 and 1993, and a consistent rise post-1993. Regional disparities were evident, with lakes in the semi-arid region exhibiting the most rapid warming, followed by those in the semi-humid, arid, and humid regions. Analysis of lake heatwaves, characterized by prolonged elevated LSWT periods, demonstrated positive trends in duration and intensity across different climatic zones from 1950 to 2020. Drylands displayed more intense and prolonged heatwaves compared to humid regions. The study further assessed the warming efficiency during lake heatwaves, indicating the energy transfer rate from air temperature to LSWT, revealing higher values in drylands than in humid regions. This suggests the heightened sensitivity of dryland lakes to air temperature changes during heatwaves. Moreover, the research highlighted a positive feedback loop between LSWT warming and lake heatwaves, particularly pronounced in semi-arid regions. Dryland LSWTs increased more rapidly than in humid regions under global warming, contributing to the increased frequency and duration of lake heatwaves. The intensified lake heatwaves, in turn, elevated the warming efficiency, amplifying both lake heatwaves and LSWT warming. With the ongoing rise in greenhouse gas concentrations, the study implies a potential escalation of lake heatwaves, particularly in drylands.
While the air2water model provided an extended analysis of daily LSWT, it also comes with inherent limitations. Firstly, the model might be constrained by the quality and spatial resolution of input data, which could affect the accuracy of the model outputs. Additionally, the model may not account for other factors influencing LSWT, such as lake geomorphological characteristics or anthropogenic activities. Such limitations could introduce biases or misconceptions in certain conclusions. Although this study primarily focused on summer lake heatwaves, it does not preclude the possibility of similar phenomena occurring in other seasons. To gain a comprehensive understanding of the impacts and mechanisms of lake heatwaves, future research should consider patterns across all seasons. Lake heatwaves could have profound implications for ecosystems. Firstly, sustained high temperatures could degrade water quality, leading to phenomena such as eutrophication and oxygen depletion, thereby affecting aquatic biota. Secondly, heatwaves might alter the structure and functioning of lake ecosystems, such as reducing species diversity or disrupting food chains. These changes could compromise the ecological balance and sustainability of lakes. Meanwhile, inland waters such as lakes are important CO2 emitters; however, accurately estimating the emissions is still a big challenge, leading to large uncertainty in the terrestrial carbon sink estimation [54]. Human activities have increased reactive nitrogen (Nr) input to terrestrial ecosystems compared with the pre-industrial era. New findings imply that Nr burial in lakes is overlooked as an important global sink of Nr input to terrestrial ecosystems [55].
The heightened sensitivity of lakes in drylands to temperature changes during heatwaves may be attributed to their geographical, climatic, and ecological characteristics. Firstly, lakes in drylands are typically smaller and more susceptible to temperature fluctuations due to their limited volume. Secondly, these lakes often exist in arid or semi-arid regions where water resources are already limited, rendering them more vulnerable. Additionally, the ecosystems of dryland lakes may be under significant stress, such as water scarcity or reduced biodiversity, making them more susceptible to temperature changes and heatwaves. The size of the lake might influence the rate of temperature increase. Generally, larger lakes with greater volume and thermal inertia may not experience significant temperature changes in the short term. Conversely, smaller or shallower lakes, due to their reduced volume, might be more susceptible to external climatic factors, potentially leading to faster warming rates. Thus, the lake area serves as a crucial factor affecting the rate of temperature change in lakes, necessitating further investigation into its underlying mechanisms. In summary, these discussion points provide a deeper understanding of lake heatwave phenomena and their potential implications while highlighting key factors and directions that warrant further research and consideration.

Author Contributions

Conceptualization, F.J., Y.H. and S.H.; methodology, Y.H., F.J. and S.W.; software, Y.W.; validation, F.J., Y.H. and S.H.; formal analysis, F.J., Y.H. and S.H.; data curation, S.W.; writing—original draft preparation, F.J., Y.W. and S.W.; writing—review and editing, F.J., Y.H. and S.H.; visualization, Y.W. and S.W.; funding acquisition, F.J., Y.H. and S.H. All authors have read and agreed to the published version of the manuscript.

Funding

This work was jointly supported by The National Key Research and Development Program of China (No: 2019YFA0607104), Gansu Provincial Science and Technology Project under Grant No. 23JRRA1030 and 22JR5RA405, the National Science Foundation of China (42375063, 42075029, 42375021), and Scientific Research Fund for Arid Meteorology (IAM202314). This work was also supported by the Supercomputing Center of Lanzhou University.

Data Availability Statement

The data that support the research can be accessed openly. Daily LSWTs from 2000 to 2020 across China were acquired from MOD11A1 data. These datasets are accessible at https://lpdaac.usgs.gov/products/mod11a1v006/ (accessed on 30 April 2020). Further inquiries can be directed to the corresponding author.

Conflicts of Interest

The authors declare no conflicts of interest.

References

  1. Gleick, P.H. Water and conflict: Fresh water resources and international security. Int. Secur. 1993, 18, 79–112. [Google Scholar] [CrossRef]
  2. Xu, X.; Jiang, B.; Tan, Y.; Costanza, R.; Yang, G. Lake-wetland ecosystem services modeling and valuation: Progress, gaps and future directions. Ecosyst. Serv. 2018, 33, 19–28. [Google Scholar] [CrossRef]
  3. Liu, H.; Chen, Y.; Ye, Z.; Li, Y.; Zhang, Q. Recent lake area changes in Central Asia. Sci. Rep. 2019, 9, 16277. [Google Scholar] [CrossRef] [PubMed]
  4. Zhang, G.; Yao, T.; Xie, H.; Yang, K.; Zhu, L.; Shum, C.; Bolch, T.; Yi, S.; Allen, S.; Jiang, L. Response of Tibetan Plateau’s lakes to climate changes: Trend, pattern, and mechanisms. Earth-Sci. Rev. 2020, 208, 103269. [Google Scholar] [CrossRef]
  5. Tan, C.; Guo, B.; Kuang, H.; Yang, H.; Ma, M. Lake area changes and their influence on factors in arid and semiarid regions along the silk road. Remote Sens. 2018, 10, 595. [Google Scholar] [CrossRef]
  6. Woolway, R.I.; Kraemer, B.M.; Lenters, J.D.; Merchant, C.J.; O’reilly, C.M.; Sharma, S. Global lake responses to climate change. Nat. Rev. Earth Environ. 2020, 1, 388–403. [Google Scholar] [CrossRef]
  7. Woolway, R.I.; Dokulil, M.T.; Marszelewski, W.; Schmid, M.; Bouffard, D.; Merchant, C.J. Warming of Central European lakes and their response to the 1980s climate regime shift. Clim. Chang. 2017, 142, 505–520. [Google Scholar] [CrossRef]
  8. Woolway, R.I.; Merchant, C.J. Intralake Heterogeneity of Thermal Responses to Climate Change: A Study of Large Northern Hemisphere Lakes. J. Geophys. Res. Atmos. 2018, 123, 3087–3098. [Google Scholar] [CrossRef]
  9. Huang, L.; Wang, X.; Sang, Y.; Tang, S.; Jin, L.; Yang, H.; Ottlé, C.; Bernus, A.; Wang, S.; Wang, C. Optimizing lake surface water temperature simulations over large lakes in China with FLake model. Earth Space Sci. 2021, 8, e2021EA001737. [Google Scholar] [CrossRef]
  10. Schneider, P.; Hook, S.J. Space observations of inland water bodies show rapid surface warming since 1985. Geophys. Res. Lett. 2010, 37. [Google Scholar] [CrossRef]
  11. O’reilly, C.M.; Sharma, S.; Gray, D.K.; Hampton, S.E.; Read, J.S.; Rowley, R.J.; Schneider, P.; Lenters, J.D.; Mcintyre, P.B.; Kraemer, B.M. Rapid and highly variable warming of lake surface waters around the globe. Geophys. Res. Lett. 2015, 42, 10773–10781. [Google Scholar] [CrossRef]
  12. Wang, S.; He, Y.; Hu, S.; Ji, F.; Wang, B.; Guan, X.; Piccolroaz, S. Enhanced Warming in Global Dryland Lakes and Its Drivers. Remote. Sens. 2022, 14, 86. [Google Scholar] [CrossRef]
  13. Woolway, R.I.; Jennings, E.; Shatwell, T. Lake heatwaves under climate change. Nature 2021, 589, 402–407. [Google Scholar] [CrossRef] [PubMed]
  14. Woolway, R.I.; Anderson, E.J.; Albergel, C. Rapidly expanding lake heatwaves under climate change. Environ. Res. Lett. 2021, 16, 094013. [Google Scholar] [CrossRef]
  15. Woolway, R.I.; Albergel, C.; Frölicher, T.L.; Perroud, M. Severe lake heatwaves attributable to human-induced global warming. Geophys. Res. Lett. 2022, 49, e2021GL097031. [Google Scholar] [CrossRef]
  16. Wang, X.; Shi, K.; Zhang, Y.; Qin, B.; Zhang, Y.; Wang, W.; Jeppesen, E. Climate change drives rapid warming and increasing heatwaves of lakes. Sci. Bull. 2023, 68, 1574–1584. [Google Scholar] [CrossRef] [PubMed]
  17. Ho, J.C.; Michalak, A.M.; Pahlevan, N. Widespread global increase in intense lake phytoplankton blooms since the 1980s. Nature 2019, 574, 667–670. [Google Scholar] [CrossRef] [PubMed]
  18. Till, A. Fish die-offs are concurrent with thermal extremes in north temperate lakes. Nature Clim. Chang. 2019, 9, 637–641. [Google Scholar] [CrossRef]
  19. Tassone, S.J.; Alice, F.B.; Cal, D.B.; Jonathan, A.W.; Michael, L.P. Co-occurrence of aquatic heatwaves with atmospheric heatwaves, low dissolved oxygen, and low pH events in estuarine ecosystems. Estuaries Coasts 2022, 45, 707–720. [Google Scholar] [CrossRef]
  20. Gilarranz, L.J.; Narwani, A.; Odermatt, D. Regime shifts, trends, and variability of lake productivity at a global scale. Proc. Natl. Acad. Sci. USA 2022, 119, e2116413119. [Google Scholar] [CrossRef]
  21. Anderson, E.J.; Stow, C.A.; Gronewold, A.D. Seasonal overturn and stratification changes drive deep-water warming in one of Earth’s largest lakes. Nat. Commun. 2021, 12, 1688. [Google Scholar] [CrossRef]
  22. Woolway, R.I.; Sharma, S.; Smol, J.P. Lakes in hot water: The impacts of a changing climate on aquatic ecosystems. Bioscience 2022, 72, 1050–1061. [Google Scholar] [CrossRef]
  23. Ji, F.; Wu, Z.; Huang, J.; Chassignet, E.P. Evolution of land surface air temperature trend. Nat. Clim. Change 2014, 4, 462–466. [Google Scholar] [CrossRef]
  24. Huang, J.; Ma, J.; Guan, X.; Li, Y.; He, Y. Progress in semiarid climate change studies in China. Adv. Atmos. Sci. 2019, 36, 922–937. [Google Scholar] [CrossRef]
  25. Ma, R.; Yang, G.; Duan, H.; Jiang, J.; Wang, S.; Feng, X.; Li, A.; Kong, F.; Xue, B.; Wu, J. China’s lakes at present: Number, area and spatial distribution. Sci. China Earth Sci. 2011, 54, 283–289. [Google Scholar] [CrossRef]
  26. Xu, J.; Zeng, Y.; Qiu, X.; He, Y.; Shi, G.; Zhu, X. Aridity Changes and Related Climatic Drivers in the Drylands of China during 1960–2019. J. Appl. Meteorol. Climatol. 2021, 60, 607–617. [Google Scholar] [CrossRef]
  27. Fu, C.; Wu, H.; Zhu, Z.; Song, C.; Xue, B.; Wu, H.; Ji, Z.; Dong, L. Exploring the potential factors on the striking water level variation of the two largest semi-arid-region lakes in northeastern Asia. Catena 2021, 198, 105037. [Google Scholar] [CrossRef]
  28. Smith, L.C.; Sheng, Y.; Macdonald, G.; Hinzman, L. Disappearing arctic lakes. Science 2005, 308, 1429. [Google Scholar] [CrossRef] [PubMed]
  29. Ma, R.; Duan, H.; Hu, C.; Feng, X.; Li, A.; Ju, W.; Jiang, J.; Yang, G. A half-century of changes in China’s lakes: Global warming or human influence? Geophys. Res. Lett. 2010, 37. [Google Scholar] [CrossRef]
  30. Liu, H.; Yin, Y.; Piao, S.; Zhao, F.; Engels, M.; Ciais, P. Disappearing lakes in semiarid northern China: Drivers and environmental impact. Environ. Sci. Technol. 2013, 47, 12107–12114. [Google Scholar] [CrossRef] [PubMed]
  31. Zhang, G.; Yao, T.; Chen, W.; Zheng, G.; Shum, C.; Yang, K.; Piao, S.; Sheng, Y.; Yi, S.; Li, J. Regional differences of lake evolution across China during 1960s–2015 and its natural and anthropogenic causes. Remote Sens. Environ. 2019, 221, 386–404. [Google Scholar] [CrossRef]
  32. Cao, Y.; Fu, C.; Wang, X.; Dong, L.; Yao, S.; Xue, B.; Wu, H.; Wu, H. Decoding the dramatic hundred-year water level variations of a typical great lake in semiarid region of northeastern Asia. Sci. Total Environ. 2021, 770, 145353. [Google Scholar] [CrossRef] [PubMed]
  33. Livingstone, D.M. Impact of secular climate change on the thermal structure of a large temperate central European lake. Clim. Chang. 2003, 57, 205–225. [Google Scholar] [CrossRef]
  34. Dai, Y.; Yao, T.; Li, X.; Ping, F. The impact of lake effects on the temporal and spatial distribution of precipitation in the Nam Co basin, Tibetan Plateau. Quat. Int. 2018, 475, 63–69. [Google Scholar] [CrossRef]
  35. Wan, Z.; Hook, S.; Hulley, G. MOD11A1 MODIS/Terra Land Surface Temperature/Emissivity Daily L3 Global 1km SIN Grid. V006 [Data Set]. NASA EOSDIS Land Processes DAAC. 2015. Available online: https://ladsweb.modaps.eosdis.nasa.gov/missions-and-measurements/products/MOD11A1 (accessed on 30 April 2020).
  36. Sharma, S.; Gray, D.K.; Read, J.S.; O’reilly, C.M. A global database of lake surface temperatures collected by in situ and satellite methods from 1985–2009. Sci. Data 2015, 2, 150008. [Google Scholar] [CrossRef]
  37. Harris, I.; Osborn, T.J.; Jones, P. Version 4 of the CRU TS monthly high-resolution gridded multivariate climate dataset. Sci. Data 2020, 7, 109. [Google Scholar] [CrossRef]
  38. Hersbach, H. ERA5 Monthly Averaged Data on Single Levels from 1979 to Present. Copernicus Climate Change Service (C3S) Climate Data Store (CDS). 2019. Available online: https://cds.climate.copernicus.eu/cdsapp#!/dataset/reanalysis-era5-single-levels-monthly-means?tab=overview (accessed on 30 April 2020).
  39. Bell, B. ERA5 Hourly Data on Pressure Levels from 1950 to 1978 (Preliminary Version). Copernicus Climate Change Service (C3S) Climate Data Store (CDS). 2020. Available online: https://cds.climate.copernicus.eu/cdsapp#!/dataset/reanalysis-era5-pressure-levels-preliminary-back-extension?tab=overview (accessed on 30 April 2020).
  40. Gao, L.; Bernhardt, M.; Schulz, K. Elevation correction of ERA-Interim temperature data in complex terrain. Hydrol. Earth Syst. Sci. 2012, 16, 4661–4673. [Google Scholar] [CrossRef]
  41. Piccolroaz, S.; Woolway, R.I.; Merchant, C.J. Global reconstruction of twentieth century lake surface water temperature reveals different warming trends depending on the climatic zone. Clim. Chang. 2020, 160, 427–442. [Google Scholar] [CrossRef]
  42. Piccolroaz, S. Prediction of lake surface temperature using the air2water model: Guidelines, challenges, and future perspectives. Adv. Oceanogr. Limnol. 2016, 7, 36–50. [Google Scholar] [CrossRef]
  43. Piccolroaz, S.; Healey, N.; Lenters, J.; Schladow, S.; Hook, S.; Sahoo, G.; Toffolon, M. On the predictability of lake surface temperature using air temperature in a changing climate: A case study for Lake Tahoe (USA). Limnol. Oceanogr. 2018, 63, 243–261. [Google Scholar] [CrossRef]
  44. Toffolon, M.; Piccolroaz, S.; Majone, B.; Soja, A.M.; Peeters, F.; Schmid, M.; Wüest, A. Prediction of surface temperature in lakes with different morphology using air temperature. Limnol. Oceanogr. 2014, 59, 2185–2202. [Google Scholar] [CrossRef]
  45. Schmid, M.; Köster, O. Excess warming of a Central European lake driven by solar brightening. Water Resour. Res. 2016, 52, 8103–8116. [Google Scholar] [CrossRef]
  46. Nash, J.E.; Sutcliffe, J.V. River flow forecasting through conceptual models part I—A discussion of principles. J. Hydrol. 1970, 10, 282–290. [Google Scholar] [CrossRef]
  47. Huang, J.; Yu, H.; Guan, X.; Wang, G.; Guo, R. Accelerated dryland expansion under climate change. Nat. Clim. Change 2016, 6, 166–171. [Google Scholar] [CrossRef]
  48. Huang, J.; Li, Y.; Fu, C.; Chen, F.; Fu, Q.; Dai, A.; Shinoda, M.; Ma, Z.; Guo, W.; Li, Z. Dryland climate change: Recent progress and challenges. Rev. Geophys. 2017, 55, 719–778. [Google Scholar] [CrossRef]
  49. Guan, X.; Ma, J.; Huang, J.; Huang, R.; Zhang, L.; Ma, Z. Impact of oceans on climate change in drylands. Sci. China Earth Sci. 2019, 62, 891–908. [Google Scholar] [CrossRef]
  50. Toffolon, M.; Piccolroaz, S.; Calamita, E. On the use of averaged indicators to assess lakes’ thermal response to changes in climatic conditions. Environ. Res. Lett. 2020, 15, 034060. [Google Scholar] [CrossRef]
  51. Javaheri, A.; Babbar-Sebens, M.; Miller, R.N. Resources. From skin to bulk: An adjustment technique for assimilation of satellite-derived temperature observations in numerical models of small inland water bodies. Adv. Water 2016, 92, 284–298. [Google Scholar] [CrossRef]
  52. Prats, J.; Danis, P.-A. An epilimnion and hypolimnion temperature model based on air temperature and lake characteristics. Knowl. Manag. Aquat. Ecosyst. 2019, 8, 24. [Google Scholar] [CrossRef]
  53. Flaim, G.; Andreis, D.; Piccolroaz, S.; Obertegger, U. Ice cover and extreme events determine dissolved oxygen in a placid mountain lake. Water Resour. Res. 2020, 56, e2020WR027321. [Google Scholar] [CrossRef]
  54. Duan, H.; Xiao, Q.; Qi, T. Measuring lake carbon dioxide from space: Opportunities and challenges. Innov. Geosci. 2023, 1, 100025. [Google Scholar] [CrossRef]
  55. Wang, M.; Houlton, B.Z.; Wang, S.; Ren, C.; van Grinsven, H.J.; Chen, D.; Xu, J.; Gu, B. Human-caused increases in reactive nitrogen burial in sediment of global lakes. Innovation 2021, 2, 100158. [Google Scholar] [CrossRef] [PubMed]
Figure 1. (a) Spatial distribution of climatological annually averaged AI values between 1950 and 2020, as determined from the CRU dataset. The dots in (a) represent the locations of Chinese lakes. The colors of the dots represent the lake areas. (b) Regionally averaged annual mean air temperature (AT) trends as a function of the climatological mean AI in China.
Remotesensing 16 00588 g001
Figure 2. Spatial patterns in the performance of the air2water model, evaluated via the NSE coefficient between the observed and simulated daily LSWTs over 2000–2020.
Remotesensing 16 00588 g002
Figure 3. (a) Time series of mean summer LSWT (blue) and air temperature (red) anomalies in China from 1950 to 2020. The anomalies were calculated relative to the baseline period of 1950–2020. The spatial distribution of summer LSWT trends (b) and air temperature trends (c).
Remotesensing 16 00588 g003
Figure 4. Time series and spatial distributions of summer mean LSWTs in arid (a,b), semi-arid (c,d), semi-humid (e,f), and humid (g,h) regions over the 1950–2020 period. The left column shows the time series changes in the four climate zones. The red line represents the average temperature of all lakes within the climate zone. The blue line represents the average temperature of lakes within the region where both surface water temperature and air temperature have significantly changed (p value < 0.1). The two dashed lines indicate their respective linear trends. The solid circles represent significant LSWT trends, while hollow circles represent nonsignificant changes.
Remotesensing 16 00588 g004
Figure 5. (a) The numbers and cumulative areas of lakes in different climate zones. (b) The mean warming trends of summer LSWT and air temperature in the four climate zones. The error bars represent 1σ uncertainty.
Remotesensing 16 00588 g005
Figure 6. Spatiotemporal pattern of mean duration and intensity of summer lake heatwaves in China and four climatic zones from 1950 to 2020. (a,b), (c,d), (e,f), (g,h), and (i,j) represent the whole country, arid, semi-arid, dry and semi-humid, and humid areas, respectively. The red line on the left is the mean duration, and the blue line on the right is the mean intensity. Yellow lines indicate the boundaries of different climatic zones.
Remotesensing 16 00588 g006
Figure 7. Spatiotemporal pattern of annual duration of summer lake heatwave in China and four climatic zones from 1950 to 2020. (ae) represent arid, semi-arid, dry semi-humid, and humid areas of the country, respectively. The red line shows the annual total duration series of summer lake heatwaves. Yellow lines indicate the boundaries of different climatic zones.
Remotesensing 16 00588 g007
Figure 8. Spatial distributions of the summer average duration trends (a) and intensity trends (b) in China. (c) Mean duration and intensity trends of summer lake heatwaves in four climate zones. The error bars represent 1σ uncertainty.
Remotesensing 16 00588 g008
Figure 9. Mean warming efficiency η of lakes in different climate zones. The blue color represents the warming efficiency when only lake heatwaves occur. In contrast, the pink color represents the warming efficiency when no lake heatwave occurs. The error bars represent 1σ uncertainty.
Remotesensing 16 00588 g009
Figure 10. A schematic diagram including the processes of LSWT warming and the effects of lake heatwaves and air temperatures on LSWTs.
Remotesensing 16 00588 g010
Disclaimer/Publisher’s Note: The statements, opinions and data contained in all publications are solely those of the individual author(s) and contributor(s) and not of MDPI and/or the editor(s). MDPI and/or the editor(s) disclaim responsibility for any injury to people or property resulting from any ideas, methods, instructions or products referred to in the content.

