Article

Mapping and Pre- and Post-Failure Analyses of the April 2019 Kantutani Landslide in La Paz, Bolivia, Using Synthetic Aperture Radar Data

1
Institute of Space and Earth Information Science, The Chinese University of Hong Kong, Shatin, Hong Kong, China
2
Earth Sciences Department, University of Firenze, Via La Pira 4, 50121 Firenze, Italy
3
Laboratorio de Geotecnia-GTUMSS, Universidad Mayor de San Simon, Avenida Ballivian Esquina Reza 591, Cochabamba 2500, Bolivia
*
Author to whom correspondence should be addressed.
Remote Sens. 2023, 15(22), 5311; https://doi.org/10.3390/rs15225311
Submission received: 9 October 2023 / Revised: 6 November 2023 / Accepted: 8 November 2023 / Published: 10 November 2023
(This article belongs to the Section Urban Remote Sensing)

Abstract

:
Urban landslides have brought challenges to developing countries undergoing urbanization. Rapid approaches to assess ground deformation are required when facing the challenge of insufficient geological survey methods. Additionally, it is indeed a challenge to map landslide-affected areas, especially precipitation-induced landslides, through optical remote sensing methods. This study applied SAR change detection methods to map the slope failure event of the San Jorge Kantutani landfill site in La Paz, Bolivia, which occurred in April 2019, and Multi-Temporal Synthetic Aperture Radar Interferometry (MTInSAR) methods to assess pre- and post-failure ground stability related to this event. We found that the amplitude information of high-resolution COSMO-SkyMed SAR imagery and its texture information can be very useful in landslide mapping, especially in situations in which optical images are not available because of complex meteorological conditions and the similar spectral characteristics between the original land cover and landslide deposits. The MTInSAR analyses found that there was already significant deformation of more than 50 mm/year along the slope direction over this site before the landslide, and such deformation could be clearly discriminated from the surrounding environment. After the landslide event and the remobilization of the landslide deposit, the slope still shows a deformation velocity of more than 30 mm/year. The SAR amplitude change detection and MTInSAR fully exploited the SAR data in landslide studies and were useful in back analyzing the occurred landslides; this could be a good method for monitoring the ground stability of La Paz or even on a national scale over the long term for reducing the catastrophic effects of geological hazards in this landslide-prone city.

Graphical Abstract

1. Introduction

The urbanization process, coupled with the lack of systematic urban land use administration and monitoring and management of geological hazards, has exposed more residents, infrastructures, and civil engineering activities to geological hazards, thereby increasing the vulnerability of urban environments to geological risks [1,2]. Landslides and slope failures occur when solid or liquefied solid materials including soils, rocks, or debris move downwards of the slope, posing threats to the urban environment [3]. Multiple natural processes, such as earthquakes, intense precipitation, reactivation of landslides, and human activities including excavation, construction, and changes in land use, are the major triggering factors of urban landslides [4,5,6,7]. Urban slope instability problems of varying scales lead to severe consequences, including human casualties and injuries, property damage, economic losses, and substantial and continual interruptions to essential urban services such as transportation and utilities. The features of the ground deformation or slope creep phenomena of these large quantities of newly established properties belonging to the public or private sectors in the urban environments of developing countries can vary because of poor urban planning. In fact, land use can sometimes be modified without taking the geological or geotechnical information into account during the fast progress of urbanization. Consequently, these areas need to be monitored, and conventional pointwise and onsite geodesy measurements for collecting information on ground deformation are too labor intensive and expensive to achieve adequate temporal and spatial coverage and resolution [8,9].
Landslide-prone areas can be identified and mapped and appropriate measures can be implemented thanks to long-term, multiple-scale monitoring [10,11,12]. Slope stability monitoring and mapping in urban areas pose significant challenges for the rapid response and accurate identification of the spatial location, sometimes without the condition of physical accessibility to the involved area. Remote sensing (RS) techniques, especially SAR remote sensing, can help in the back analysis, identification, investigation, and monitoring of ground deformation over previous decades [13,14,15,16]. Persistent Scatterers Synthetic Aperture Radar Interferometry (PSInSAR, or PSI) [17] and Small Baseline Subset (SBAS) [18] have long been utilized for retrieving information deformation processes over the Earth’s surface [19]. Since the first introduction of the SqueeSAR algorithm in 2011 [20], numerous PSI techniques based on Distributed Scatterers (DS) have been developed over the past decade, founded on the concept of extracting scatterers not only from Persistent Scatterers (PS) like rock outcrops, buildings, and bridges, but also over natural environments which exhibit coherent radar backscattering characteristics over time [21,22,23]. In recent years, the application of global coverage SAR data by constellation with increasing spatial resolution and phase quality, as well as shorter and more periodic revisit times (e.g., TerraSAR-X; COSMO-SkyMed; and Sentinel-1), has allowed for the application of Multi-Temporal SAR interferometry (MTInSAR) techniques at various scopes [24,25,26,27,28]. These techniques have enabled the utilization of long-term series of SAR datasets acquired over the last three decades, thereby enabling the investigation of long-term phenomena by generating precise time series of ground deformation [29].
The SAR phase is used in the InSAR approach to ground stability monitoring, but the SAR amplitude change detection method has also often been used in landslide mapping as a good alternative option when high spatial resolution optical aerial or satellite imagery is not available, e.g., in cloudy or rainy seasons. The land cover, water content, slope, and aspect of the landslide-affected area discriminated from the background can be detected by changes in the SAR amplitudes by comparing the pre- and post-failure SAR images [30]. Spatial and temporal analyses of the amplitude variations through SAR change detection can identify the landslide-affected areas, revealing changes in the physical and geomorphological factors [31,32], or indirectly by mapping landslide areas [33,34,35].
The application of SAR remote sensing in ground stability monitoring in South America is still insufficient [36]. Among these limited number of works, even fewer are in the field of revealing urban ground stability and analyzing landslides in urban areas. References [9,37] applied InSAR analyses to Villa de la Independencia, a town of 6000 inhabitants in Bolivia, to reveal the relationship between InSAR and seismic noise to understand the landslide mechanism, even in the subsurface. Reference [38] analyzed the ground stability of five cities around the world using the P-SBAS method with ESA’s G-POD platform (Grid-Processing on Demand, a predecessor of GEP) service, and of these cities, Bogotá was the only one selected in South America. In [39], ground subsidence was analyzed using the InSAR method in 99 coastal cities around the world, 6 of which are located in South America (Lima, Rio de Janeiro, Maracaibo, Buenos Aires, Caracas, and Antofagasta).
According to the historical landslide database, the Bolivian city of La Paz is situated in a landslide-prone area [40,41]. In recent years, the city has experienced many landslides and ground deformation phenomena. Pre- and post-failure analyses of the 2011 Pampahasi landslide were conducted using the HDS-InSAR (Homogenous Distributed Scatterer InSAR) method on Radarsat-2 images (September 2008–December 2011) in order to determine the creep in both the pre- and post-slide phases [42]. Another study [43] also used the PSI and SBAS methods on Sentinel-1 data from 2015 to 2016 in La Paz, identifying active deformation before the Auquisamaña landslide, which occurred on 15 February 2017. Additionally, other unstable zones were identified in the Callapa area after the investigation was conducted on the Pampahasi landslide.
The aims of this work were: (i) the exploitation of SAR amplitude information in landslide mapping; (ii) the usage of various MTInSAR techniques to detect the precursor of the precipitation-induced landslide in the Kantutani sanitary landfill before its occurrence in April 2019; and (iii) to use the results of the MTInSAR analyses in (ii) for a detailed investigation of urban ground stability in La Paz, Bolivia. In this work, amplitude change detection approaches using multi-band satellite SAR imagery were applied to map the affected area of the landslide. Then, a ground deformation analysis over the city of La Paz was performed using improved two-tier network DSInSAR and P-SBAS techniques [44,45,46,47] with the GEP (Geohazards Exploitation Platform), a powerful cloud computing platform. The resulting back analysis allowed for the conclusion that a systematic long-term ground deformation monitoring project in La Paz city could enhance geological risk management and urban planning efficiency.

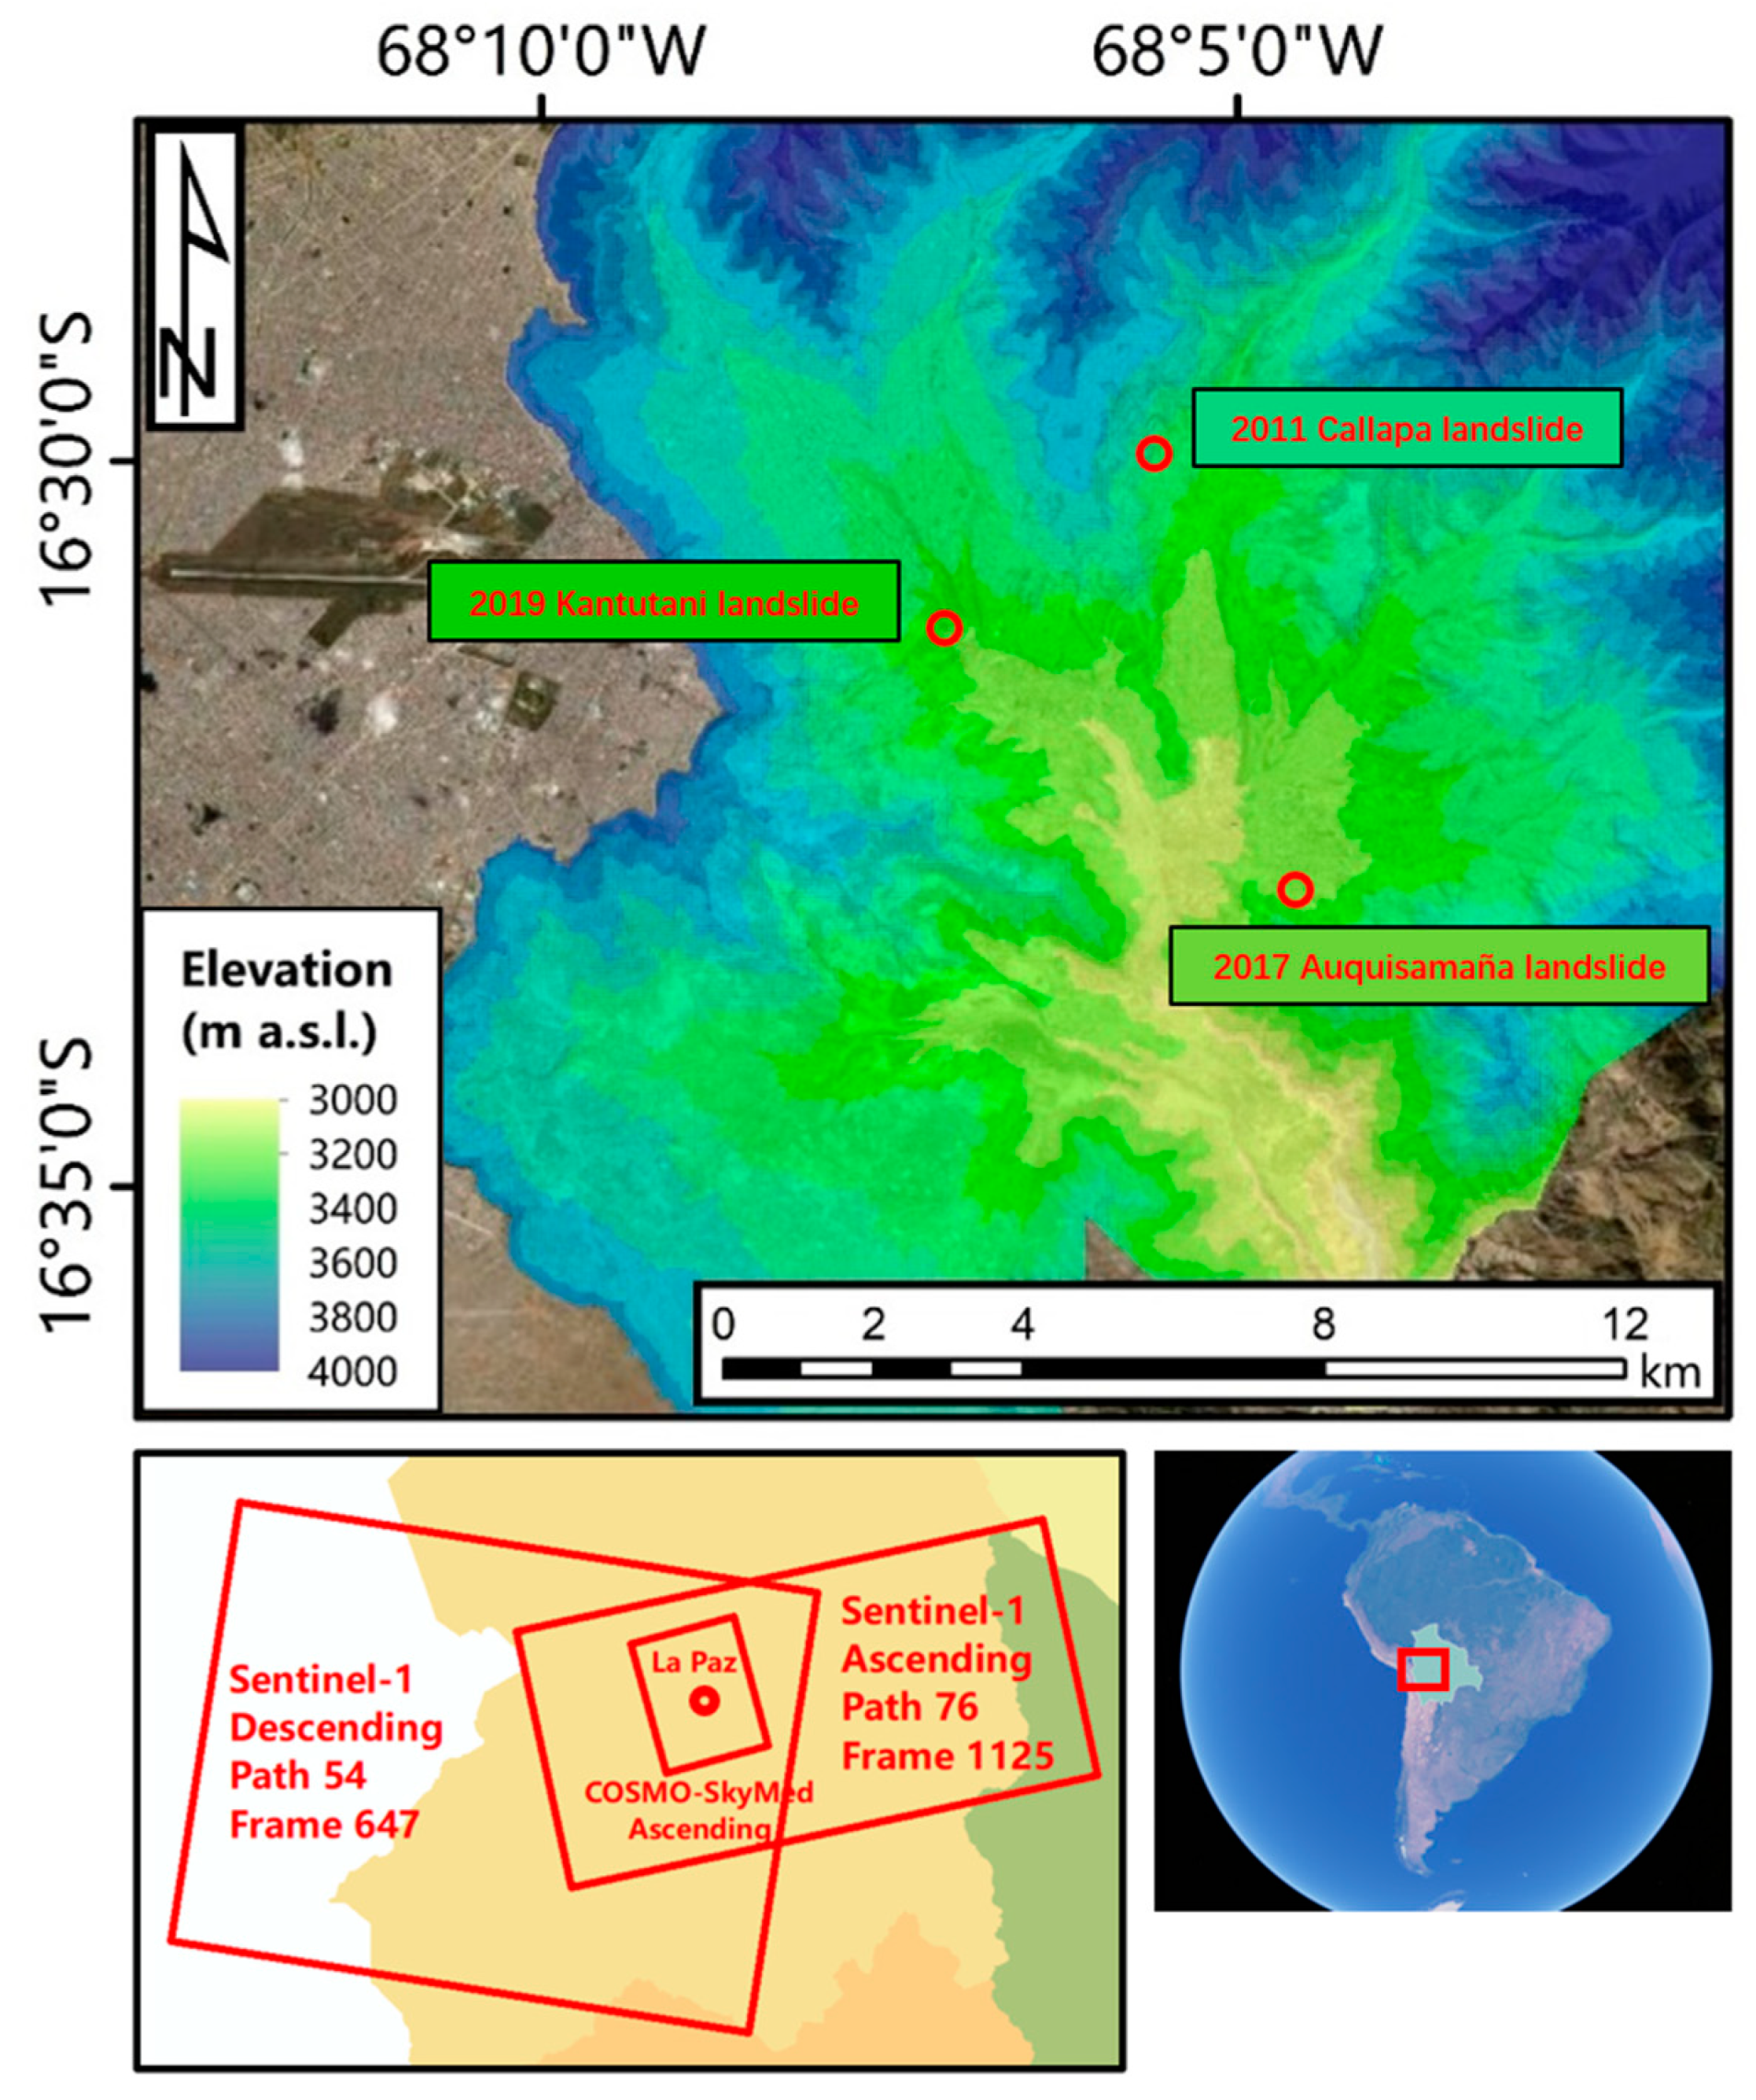
2. Study Area and San Jorge Kantutani Landslide

La Paz (16°29′S, 68°08′W) is the capital of the State of Bolivia in South America (Figure 1). It has a population of 0.8 million and it is located in the Altiplano Plateau in the west of Bolivia, which is a country highly vulnerable to geological hazards [9]. The geomorphology of La Paz is characterized by a diverse and intricate landscape that includes steep slopes, deep valleys, and rugged terrain. With an average elevation of 3640 m above sea level (a.s.l.), the minimum elevation is around 3100 m a.s.l.; meanwhile, the highest elevation is approximately 3900 m a.s.l. [40]. The high altitude of La Paz city results in its highland, seasonal climate in the thermal and rainfall regimes featuring cool-to-cold temperatures and relatively low humidity throughout the year, which is very unique for a city located close to the equator. La Paz experiences a dry season (April to August) and rainy season (November to March). Sometimes, the dry season may extend until November in years with remarkable droughts. The overall average precipitation is approximately 600 mm/year, ranging from 325 mm/year (1956–1958) to 812 mm/year (1979) [48]. Associated with cold fronts from the south, the precipitation, which is over 4000 m a.s.l. in the high mountain peaks and slopes in northeastern La Paz, often occurs in the form of hail or snow during January. The location of the housing for residents of different levels of wealth also changes with the variation in the altitude of La Paz city.
Usually, richer people live in the well-planned and well-maintained residence buildings and houses located in the valleys at lower elevations where ground stability problems occur less often as the slopes. In this case, they are more vulnerable to geological hazards. While poorer classes build their houses along the unstable slopes or even landfills at higher elevations along the outskirts of La Paz city. According to the quality of the construction, the maintenance, and many other factors causing geotechnical problems that would increase the susceptibility of landslides over their residential houses, poorer residents are no doubt more exposed to geological hazards.
Between 1995 and 2014, landslides in La Paz resulted in the relocation of 11,470 people, the destruction of 1575 houses, and the loss of 21 lives, as reported in [49]. The occurrence of landslides in La Paz is mainly characterized as the rotational type, attributed to heavy and continuous rainfall that lasts for weeks during the rainy season, usually from January to March [40]. The primary cause of this hydrometeorological controlling mechanism can be explained by precipitation that is controlled by the topography, which leads to greater slope erosion of the steep terrain with high-relief, V-shaped valleys. Secondly, in La Paz, landslides often occur as a result of soil saturation from the water from the Andean Altiplano flowing to the Amazon River. Such saturated soil is not able to help in maintaining ground stability. With the urbanization processes of the growing population and expanding settlement since the early twentieth century, La Paz has become an urbanization environment that is vulnerable to various geological hazards, resulting in destructive landslides that cause significant human and economic damage [9,50]. The shortage of a long-term effective urban planning framework has worsened the situation of an expanding population, coupled with the construction of properties on hazardous slopes without adequate information on safety standards and geotechnical and design guidance [51]. Over the past years, landslides have resulted in the destruction of buildings, roads, and other critical infrastructures in La Paz [9]. In July 2004, a mega-landslide occurred in Allpacoma Valley, causing the ground to shake, a fracturing noise to be heard for about three hours, and blocking the Allpacoma River into two parts [52]. A mega-landslide (~40 Mm3) hit the Callapa area of La Paz in February 2011. The natural causes included intense rainfall events during the rainy season and earth erosion by the surrounding river. The human cause was attributed to the increasing need for housing that altered the land cover of the slope, finally causing an overload of the landslide body [41,42]. In [43], it was found that there was clear pre-failure ground deformation before the Feb 15, 2017 Auquisamaña landslide, which buried five houses nearby. In [50], various resources were utilized, including analyses of public resources such as newspapers and reports, aerial and satellite images, fieldwork, and scientific publications, and it was found that since the beginning of the twentieth century, La Paz has experienced over 100 landslides with volumes ranging from 102 to 106 m3. Table 1 lists some landslides that occurred in La Paz in recent years that caused fatalities and economic losses.
The first slide occurred on 27 April 2019, at the top of the Bajo Llojeta sector in the Kantutani area of the Cotahuma macro district, which was home to 179,000 residents. Then, the secondary slide occurred at noon time on 30 April 2019, affecting approximately 80 families and leading to the evacuation of 380 occupants. It should be noted that two days before the secondary landslide there were previous movements that mobilized the residents to evacuate the area, thereby avoiding the loss of human life. Therefore, no deaths, serious injuries, or disappearances were recorded. The landslide affected an area of approximately 0.09 km2 (86,310 m2) with a runout distance of approximately 575 m from an elevation of 3510 m to 3410 m a.s.l. and was defined as a rotational landslide evolving into an earthflow. The velocity of this landslide was extremely rapid (>5 m/s), according to the categorization in [53].
The Kantutani area was originally a landfill site in the 1980s and labeled as a high geological hazard area according to the official geological risk map published by the Autonomous Municipal Government of La Paz (Gobierno Autónomo Municipal de La Paz, in the Spanish language, Abbrev. GAMLP) in 2011 [54]. Landslide-prone areas are assessed using an expert scoring system in which the soil humidity saturation, slope, geomorphology, and geotechnical factors take 40%, 30%, 20%, and 10% of the final score for the geological hazards, respectively [55]. Various parameters, including the topography, geology, active fault lines, and geomechanical soil conditions are taken into account in the evaluation system to assess areas affected by a landslide or slope instability event socially, politically, or economically. But the risk map has not been updated since 2011. During this period, geotechnical factors may have undergone significant changes, especially after the occurrence of landslides and slope instability events such as Callapa in 2011 and San Jorge Kantutani in 2019 in La Paz city.
The causes of the twofold slope failures in April 2019 are complicated. The direct cause of the first slide on 27 April 2019 was construction work that caused an overload of weight on the San Jorge Kantutani landfill, resulting in the loss of stability of the landfill site. From the video and pictures on the local news [56,57,58,59], the black liquified earth that exuded from the landslide body represents the physiochemical processes that occurred when the landfill material inside the slope had been subjected to long-term overpressure. Figure 2 shows the high spatial resolution optical remote sensing images provided by Google Earth. It indicates land cover changes due to the landslide, and Figure 2b highlighted the locations where the reference [56,57,58,59] were taken. Another major long-term cause of this slope failure resulted from the drainage system of the buildings in this sector lacking adequate waterproofing materials during construction, which led to the discharge of sewage into the landfill directly and caused material saturation, which is indicated by the growth of vegetation on the slope. Additionally, a few months before the first failure, which occurred on 27 April 2019, there were cuts at the foot of the slope for new constructions. The reactivation that occurred at noon on 30 April 2019, was due to the intense precipitation that occurred on the morning of the same day. The rainfall infiltrated the cracks caused by the first slide, forming a shear surface beneath the surface terrain, causing the overload of the landfill body and, finally, triggering the secondary main failure.

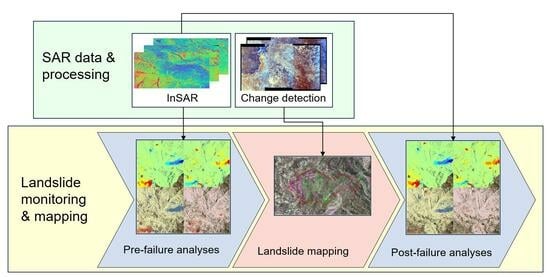
3. Materials and Methods

3.1. Available Data

3.1.1. SAR Images

To visually represent the landslide-affected area, we utilized the SAR change detection method to analyze the European Space Agency (ESA)’s C-band Sentinel-1 and the Italian Space Agency (ASI)’s X-band COSMO-SkyMed amplitude SAR data using the SentiNel Application Platform (SNAP). The COSMO-SkyMed constellation consists of four low Earth orbit satellites; its first satellite was launched in June 2007 and the last in November 2010 [60]. The Sentinel-1A began its operation in 2014 and, in 2016, the following Sentinel-1B was launched, formulating Copernicus Sentinel-1 into a constellation and providing improved global coverage and data continuity [61,62]. To minimize irrelated factors other than the landslide that may have contributed to the land cover change, we collected the latest image before and the first available image after the landslide. Two X-band COSMO-SkyMed SAR images of HH polarization were collected in the Stripmap HIMAGE mode with a temporal interval of 16 days. Four C-band Sentinel-1 Ground Range Detected (GRD) SAR images of VV polarization in both ascending and descending geometries (two for each geometry) were collected from ESA Copernicus Open Access Hub [63]. Information on the selected SAR amplitude data is shown in Table 2. The ascending Sentinel-1 GRD is Frame 1125, Path 76, and the descending is Frame 647, Path 54. The footprint of the Sentinel-1 and COSMO-SkyMed data is shown in Figure 1, together with the topography of La Paz.
It is worth noting that when selecting the Sentinel-1 data for descending geometry, we found that the Sentinel-1 GRD image of 4 May 2019, which is the first available image after the slope failure, was not able to be co-registered with the Sentinel-1 GRD images collected on 22 April 2019 or 10 April 2019. To solve this issue, we kept the Sentinel-1 GRD image taken on 22 April 2019 as the pre-failure image, but selected the second available image after the landslide captured on 16 May 2019 as the post-failure image.
For the MTInSAR processing, the applied frame and path of the Sentinel-1 SLC data were the same as the Sentinel-1 data used in the SAR amplitude change detection method. Information for the applied Sentinel-1 SLC data can be seen in Table 3.

3.1.2. Ancillary Data
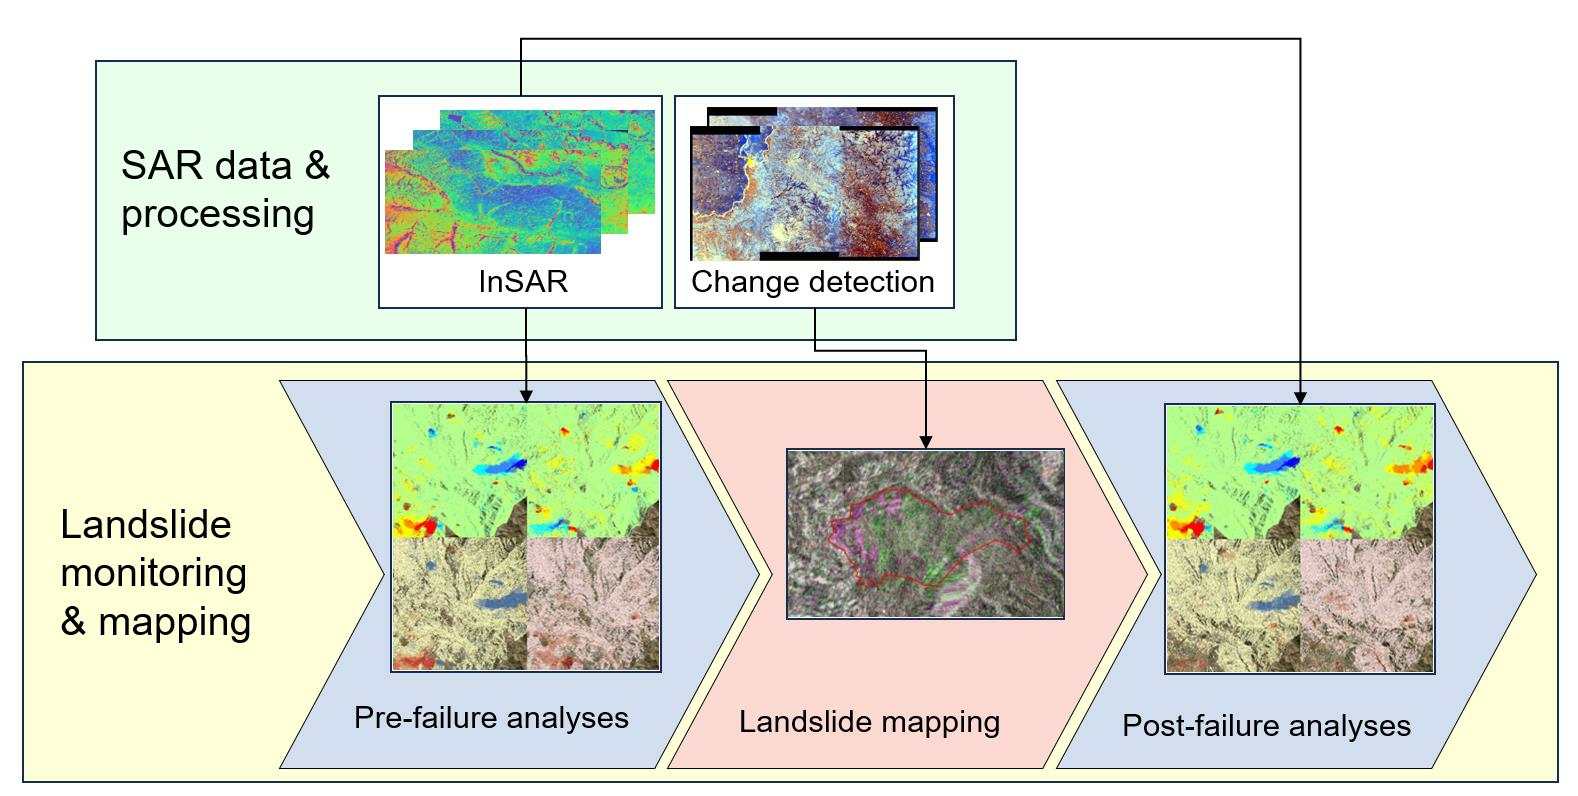
In this study, multiple types of ancillary data were used to support the SAR amplitude landslide-affected area and MTInSAR analyses. Optical remote sensing imagery was broadly applied in the verification. Following the Copernicus Sentinel-1 mission, the multispectral Sentinel-2 constellation (Sentinel-2A and Sentinel-2B) provides 10 m high-resolution multispectral remote sensing images of 13 bands with a regular revisit period of five days. Sentinel-2 has already been widely used for the monitoring of geohazards [64,65]. The visualization of the Sentinel-2 images was carried out using the Sentinel Hub. The Sentinel Hub is a cloud-based tool for EO data analysis operated by Sinergise [66,67]. In this work, we used the Sentinel Hub to generate quick-look images of the Sentinel-2 data. Additionally, we used high-resolution optical remote sensing imagery provided by Google Earth and ArcGIS to identify the geomorphological information of the study area. The pictures of the landslide were taken from the local news, social media, and Google Maps Street View. These images helped in the understanding of the landslide.
For the SAR change detection and MTInSAR processing, the Shutter Radar Topography Mission (SRTM) 1 arcsec DEM was used to geocode the processing results and to remove the topographic phase in the interferometry processing.

3.2. Methods

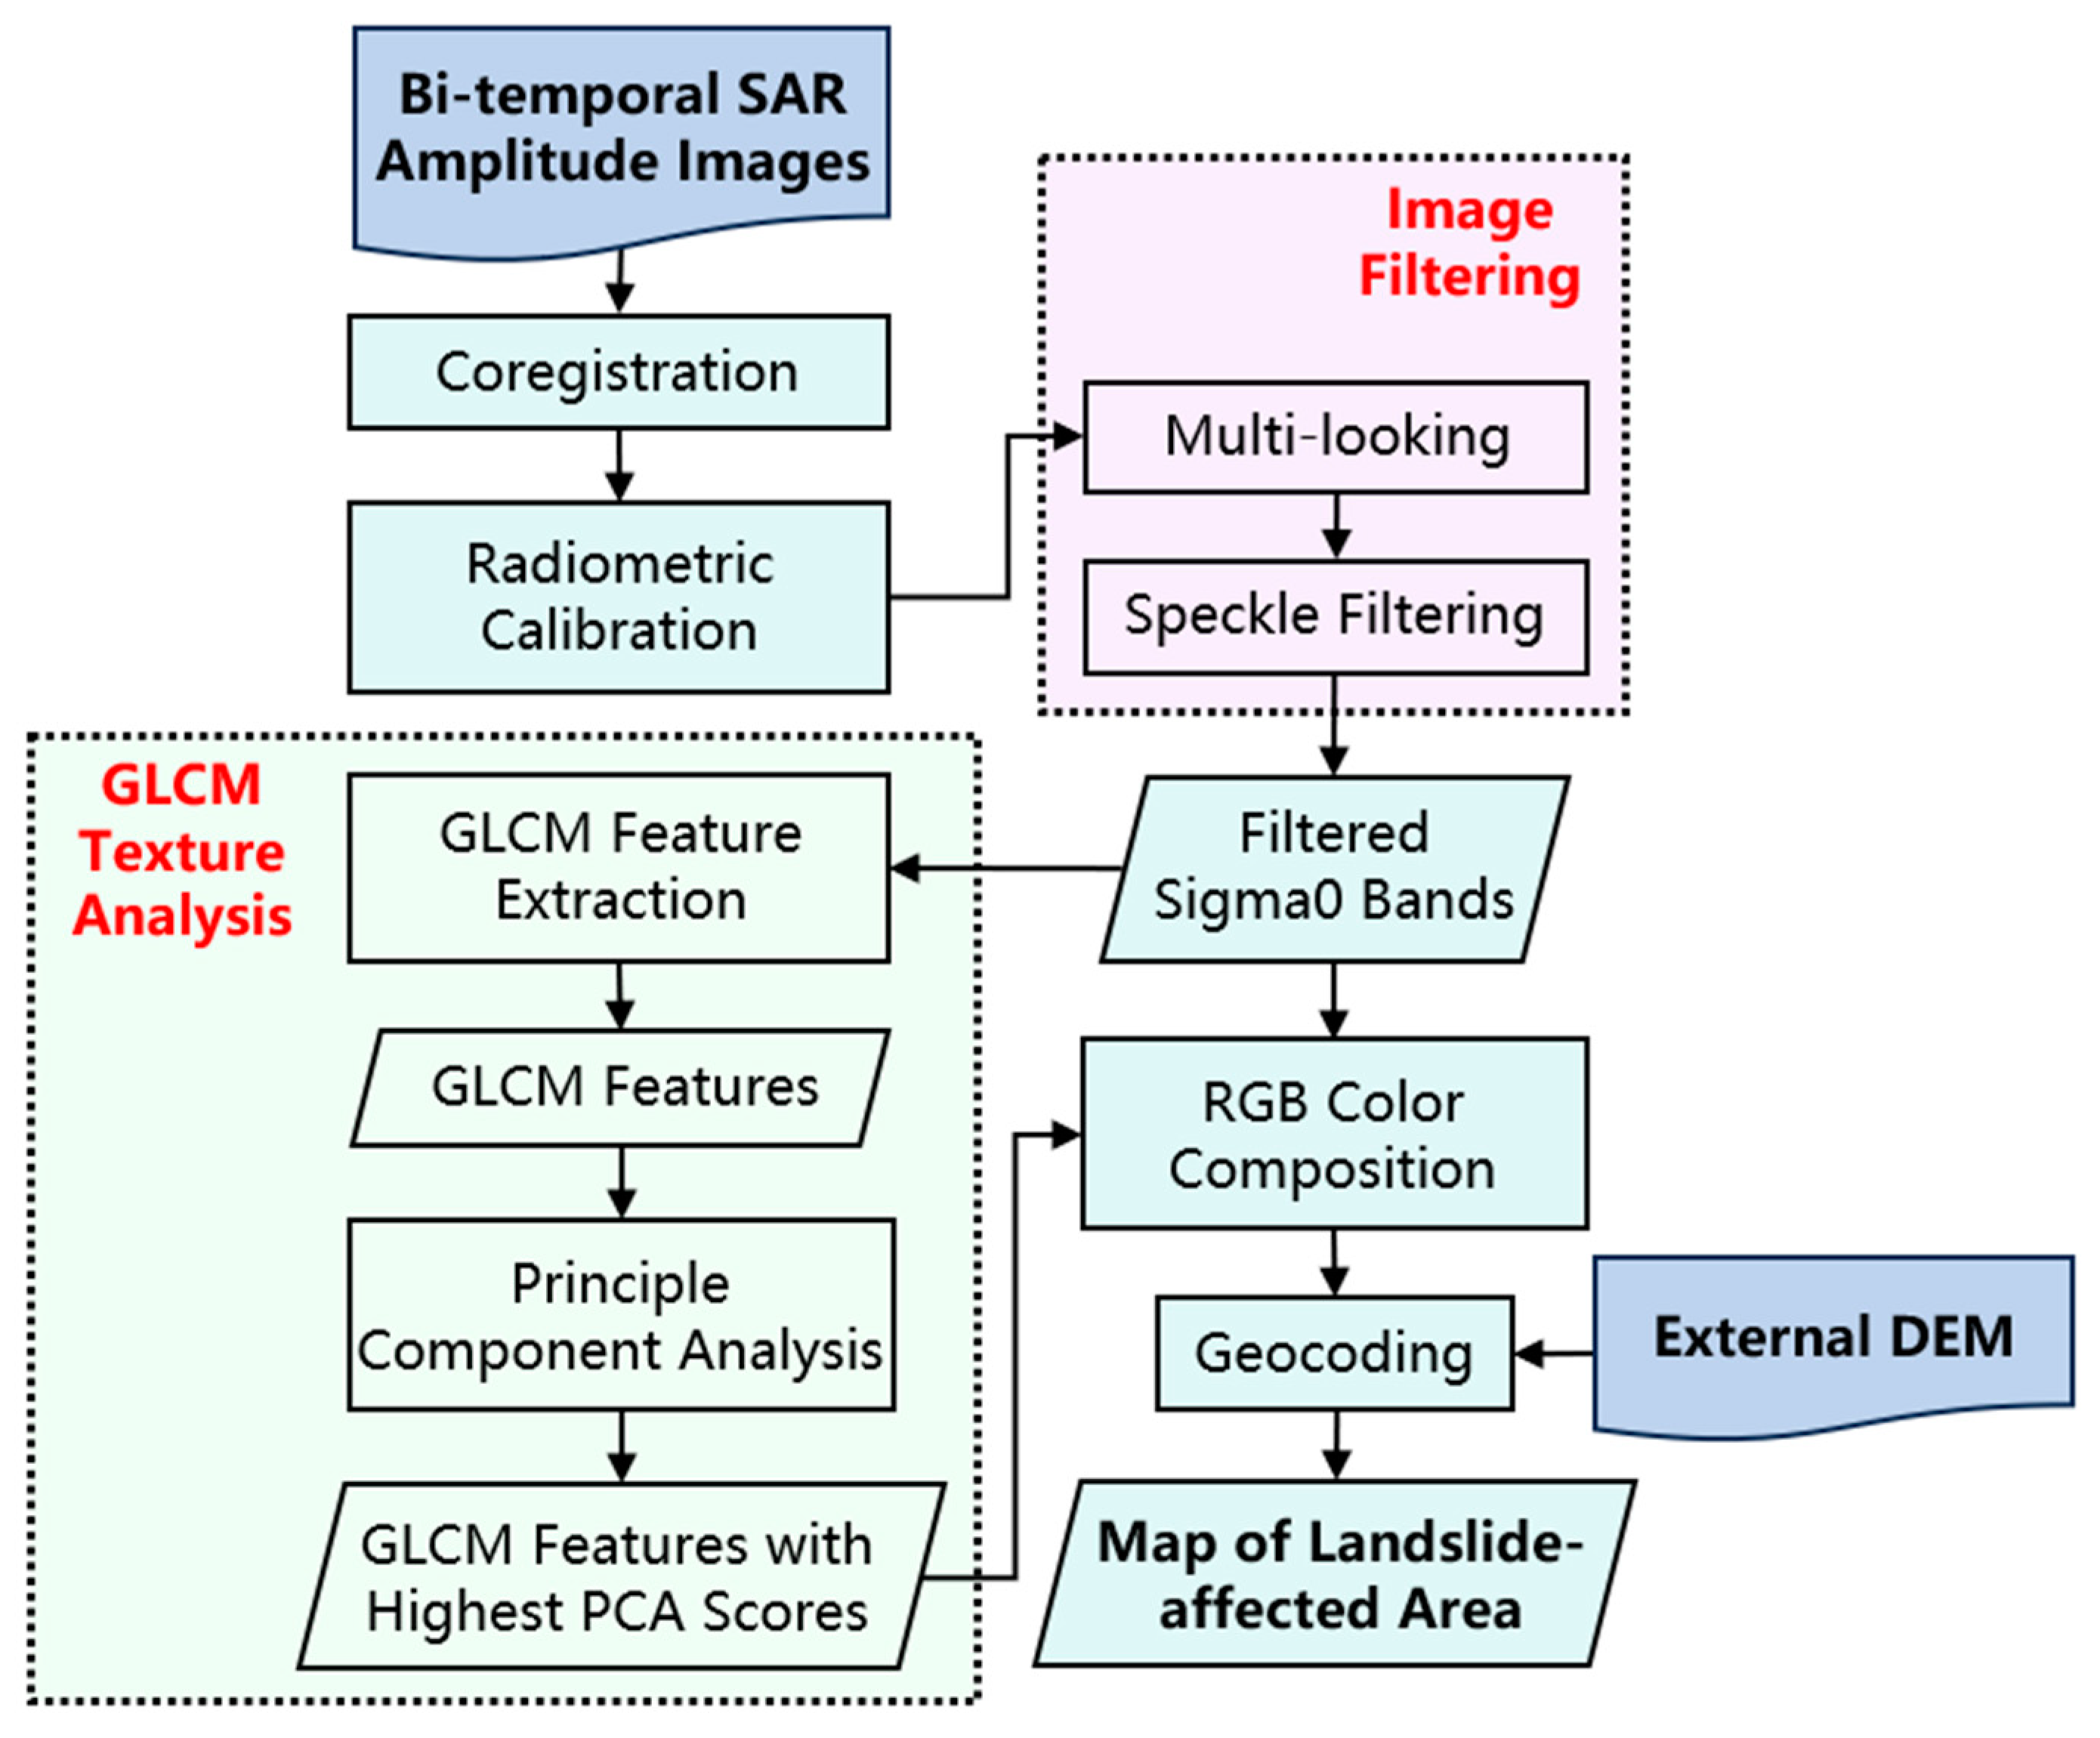
3.2.1. Change Detection

The objective of the SAR change detection method was to locate and measure the surface changes caused by the landslide in the Kantutani landfill site by measuring the alternations of the backscattering signals to the SAR sensors. Prior to the first slide on 27 April 2019, the backscarp of the landslide consisted of man-made infrastructure, such as buildings and local roads, while the landslide body was bare soil and sparse vegetation. However, after the major slide occurred on 30 April 2019, the backscarp of the landslide collapsed, leaving landslide deposits over the entire landslide-affected area. The SAR backscattering characteristics of buildings, roads, bare soil, and landfill deposits of this landslide differed significantly from each other. This modification in the land cover and further ground texture can simultaneously alter the SAR backscattering signal in the spatial and temporal domains. Hence, we anticipated that the SAR amplitude change detection method would be effective in mapping the landslide-affected area.
Two SAR amplitude change detection approaches were tested on the raw SAR imagery: (i) first with [68,69] and (ii) second with [70,71]. The SAR images needed to first be prepared, radiometric calibrated, and then co-registered into a stack. To reduce the time required for data processing in the SAR change detection analysis, we applied a spatial subset near the landslide-affected area to the co-registered SAR amplitude sigma0 data stack.
The first approach simply composited the pre- and post-failure calibrated SAR sigma0 images in the red–green–blue (RGB) color bands to visualize the difference in the intensity of the backscattering signals before and after the landslide, with the landslide-affected areas expected to be represented by green and pink (red + blue) colors. The second approach of the SAR amplitude change detection focused on the change in the texture features of the SAR image resulting from the landslide, as built-up areas, bare soil, and landfill deposits possess different ground textures. To detect the texture differences between the two images before and after the landslide, we performed a Gray Level Co-occurrence Matrix (GLCM) texture analysis on both the COSMO-SkyMed and Sentinel-1 GRD calibrated sigma0 images collected before and after the occurrence of the landslide. The GLCM analysis identifies patterns that may not be easily distinguished from the background through visual spectral inspection and reveals the spatial relationship among the pixels within a certain distance in a single raster image. Ten parameters that represent the texture features were generated from the GLCM texture analysis [72]. A Principal Component Analysis (PCA) was then applied to the twenty parameters (ten for the pre- and post-event sigma0 images, respectively) to rank these parameters by their capability to reflect the spatial diversity of the SAR amplitude data. The texture features with the highest PCA score were chosen and then used to visualize the landslide-affected area. In this way, the PCA reduced the dimensionality of the texture features of the GLCM analysis, as some parameters of the texture features merely contribute to the variability of the SAR amplitude images. The same as the first change detection method, the pre-failure PC was visualized in the red and blue bands, and the post-failure PC was then visualized in the green band.
The RGB color visualization scheme of the SAR amplitude change detection in this study is shown in Table 4. The workflow of the two SAR amplitude-based change detection analyses is shown in Figure 3.

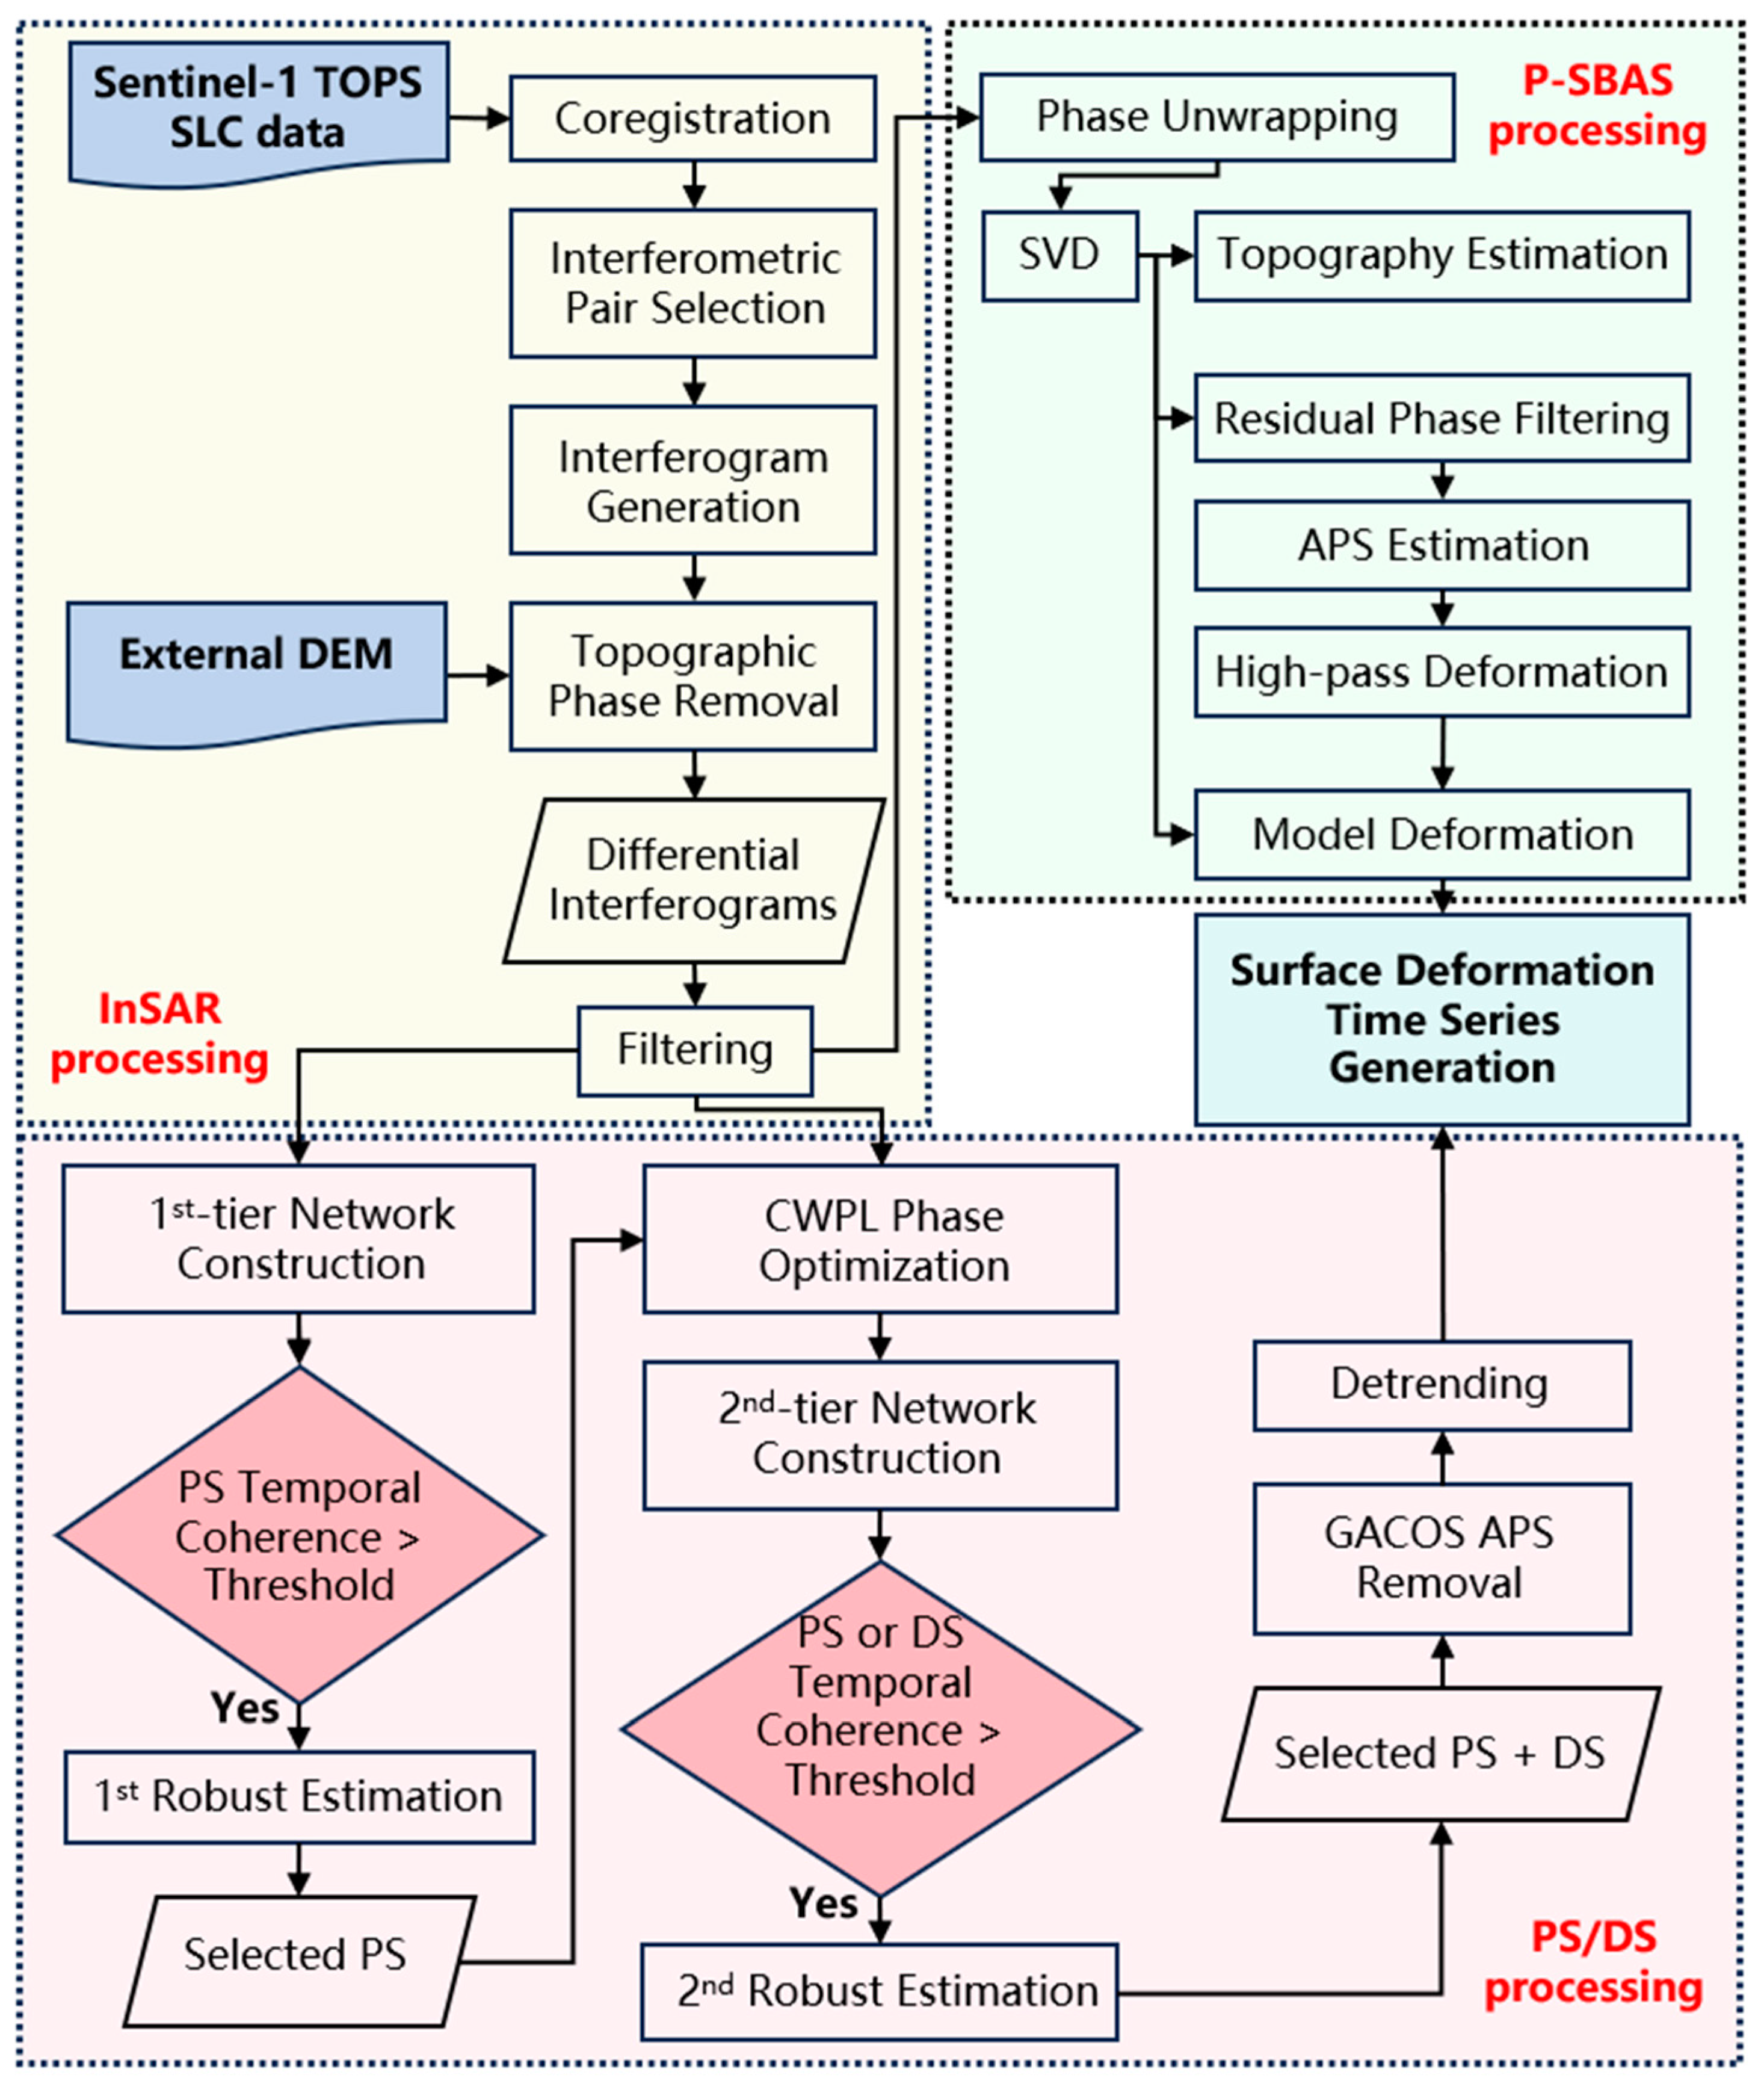
3.2.2. Two-Tier Network DSInSAR Processing

The MTInSAR methods were used to analyze the ground stability in La Paz city for the pre- and post-failure analysis using Sentinel-1 SLC data. For the applied DSInSAR method, refer to [47,73]. First, the multi-looking parameter was set to be 2 by 10 (azimuth by range) in order to mitigate the decorrelation noise in the generation of the interferograms, obtaining a pixel spacing of 40 by 50 m (azimuth by range) over flat terrain. The most stable PS targets were identified, and then their temporal coherence was estimated and filtered using a threshold of 0.72 from the first-tier Delaunay network. M-estimator and beamforming were used to calculate the height and deformation velocity and to improve the robustness by iteratively lowering the weight of low Signal-Noise-Ratio (SNR) images to reduce the following unwrapping errors. The relative estimates were integrated through a network adjustment using a ridge estimator to regulate ill-conditioned problems in the network adjustment for robust parameter integration. The other selected PS/DS were sent into the second-tier localized network processing. Coherence-Weighted Phase-Linking (CWPL) was used to reconstruct the optimal phase to identify the DS based on the temporal coherence threshold method (0.65) by assigning more weight to the phases with higher temporal coherence, which indicates a higher quality of SAR image. SRTM 1-arcsec DEM was used to remove the topography effect in the hilly study area and to geocode the DSInSAR processing results. Finally, the Generic Atmospheric Correction Online Service (GACOS) model was applied to remove the Atmospheric Phase Screen (APS), and the detrend analysis was applied to remove the trend in the deformation time series related to the elevation [74,75,76].
For the pre-failure DSInSAR analyses, a total of 62 images (31 for ascending and descending geometries each) were downloaded, preprocessed, and then sent into the processing chain. We observed that the landslide deposit was removed at the end of May 2019 by checking the cloud-free Sentinel-2 optical imagery. Onsite geologists also reported that the landslide deposit removal work was completed by June. Therefore, to avoid the loss of temporal coherence, the Sentinel-1 data stack used for the post-failure analyses was formulated starting from June 2019 to June 2020. A total of 76 images (38 for ascending and descending geometries each) were downloaded and then processed for the post-failure analyses.
To identify and assess the pre- and post-failure deformation in other dimensions rather than the SAR coordinates of the Line-of-Sight (LOS) direction only, especially in the hilly study area, we projected the LOS velocity into the slope (Vslope), east–west (VEW), and up–down (VV) directions using geometrical projections [5]. This was achieved by introducing the incidence and azimuth angles of the Sentinel-1′s ascending and descending geometries. As the Sentinel-1 SAR sensor operates on a near-polar sun-synchronous orbit, it is not sensitive to measure the ground deformation along the north–south direction [77]. In the processing results of the projection, the positive values refer to the east and up, while the negative values refer to the west and down directions. In contrast, for the projection of the deformation along the slope direction, the negative values refer to the movement from the top downwards along the slope direction. Positive values are usually considered errors, as the movement of materials against the slope direction is unlikely to occur in this study.

3.2.3. P-SBAS Processing

The P-SBAS processing was conducted on a cloud computing platform called the Geohazards Exploitation Platform [78,79]. The GEP is a cloud-based platform that allows users to process remote sensing data through numerous processing services for the purpose of supporting the EO in geohazards studies [80]. P-SBAS refers to Parallel SBAS processing. Compared to conventional SBAS processing, P-SBAS processing can significantly increase the processing efficiency by paralleling the tasks and processing these individual tasks simultaneously [54]. For the pre-failure analysis, a total of 142 Sentinel-1 SLC images collected over two years (from April 2017 to April 2019, with 66 and 76 for ascending and descending orbits, respectively) were applied, and for the post-failure analysis, a total of 122 Sentinel-1 SLC images collected over two years (from June 2019 to May 2021, with 61 each for ascending and descending orbits) were applied to the online processing platform over the study area. The default multi-looking parameter in the P-SBAS on GEP was 5 by 20 (azimuth by range), resulting in a multi-looked pixel spacing of 90 m. The selection of the master and slave interferometric pairs followed an automatic way of considering the temporal and spatial baselines of the SAR images in the dataset. The SRTM 1-arcsec DEM was applied in the removal of the topographic phase. The temporal coherence threshold was set to be 0.5. The extended minimum cost flow (EMCF) algorithm was used in the phase unwrapping. Singular Value Decomposition (SVD) method was applied to estimate the deformation velocity by subtracting the topography and residual phases. The flowchart of the DSInSAR and P-SBAS processing on the GEP is shown in Figure 4.
The primary final output of the GEP P-SBAS processing included a spreadsheet of the velocity and time series of the deformation for each extracted coherent target with the latitude and longitude in the WGS84 system which could be visualized by geolocating the targets in the (GIS). The metadata and quick-look results in the raster (.png) and Google Earth (.kmz) formats were also provided.

4. Results

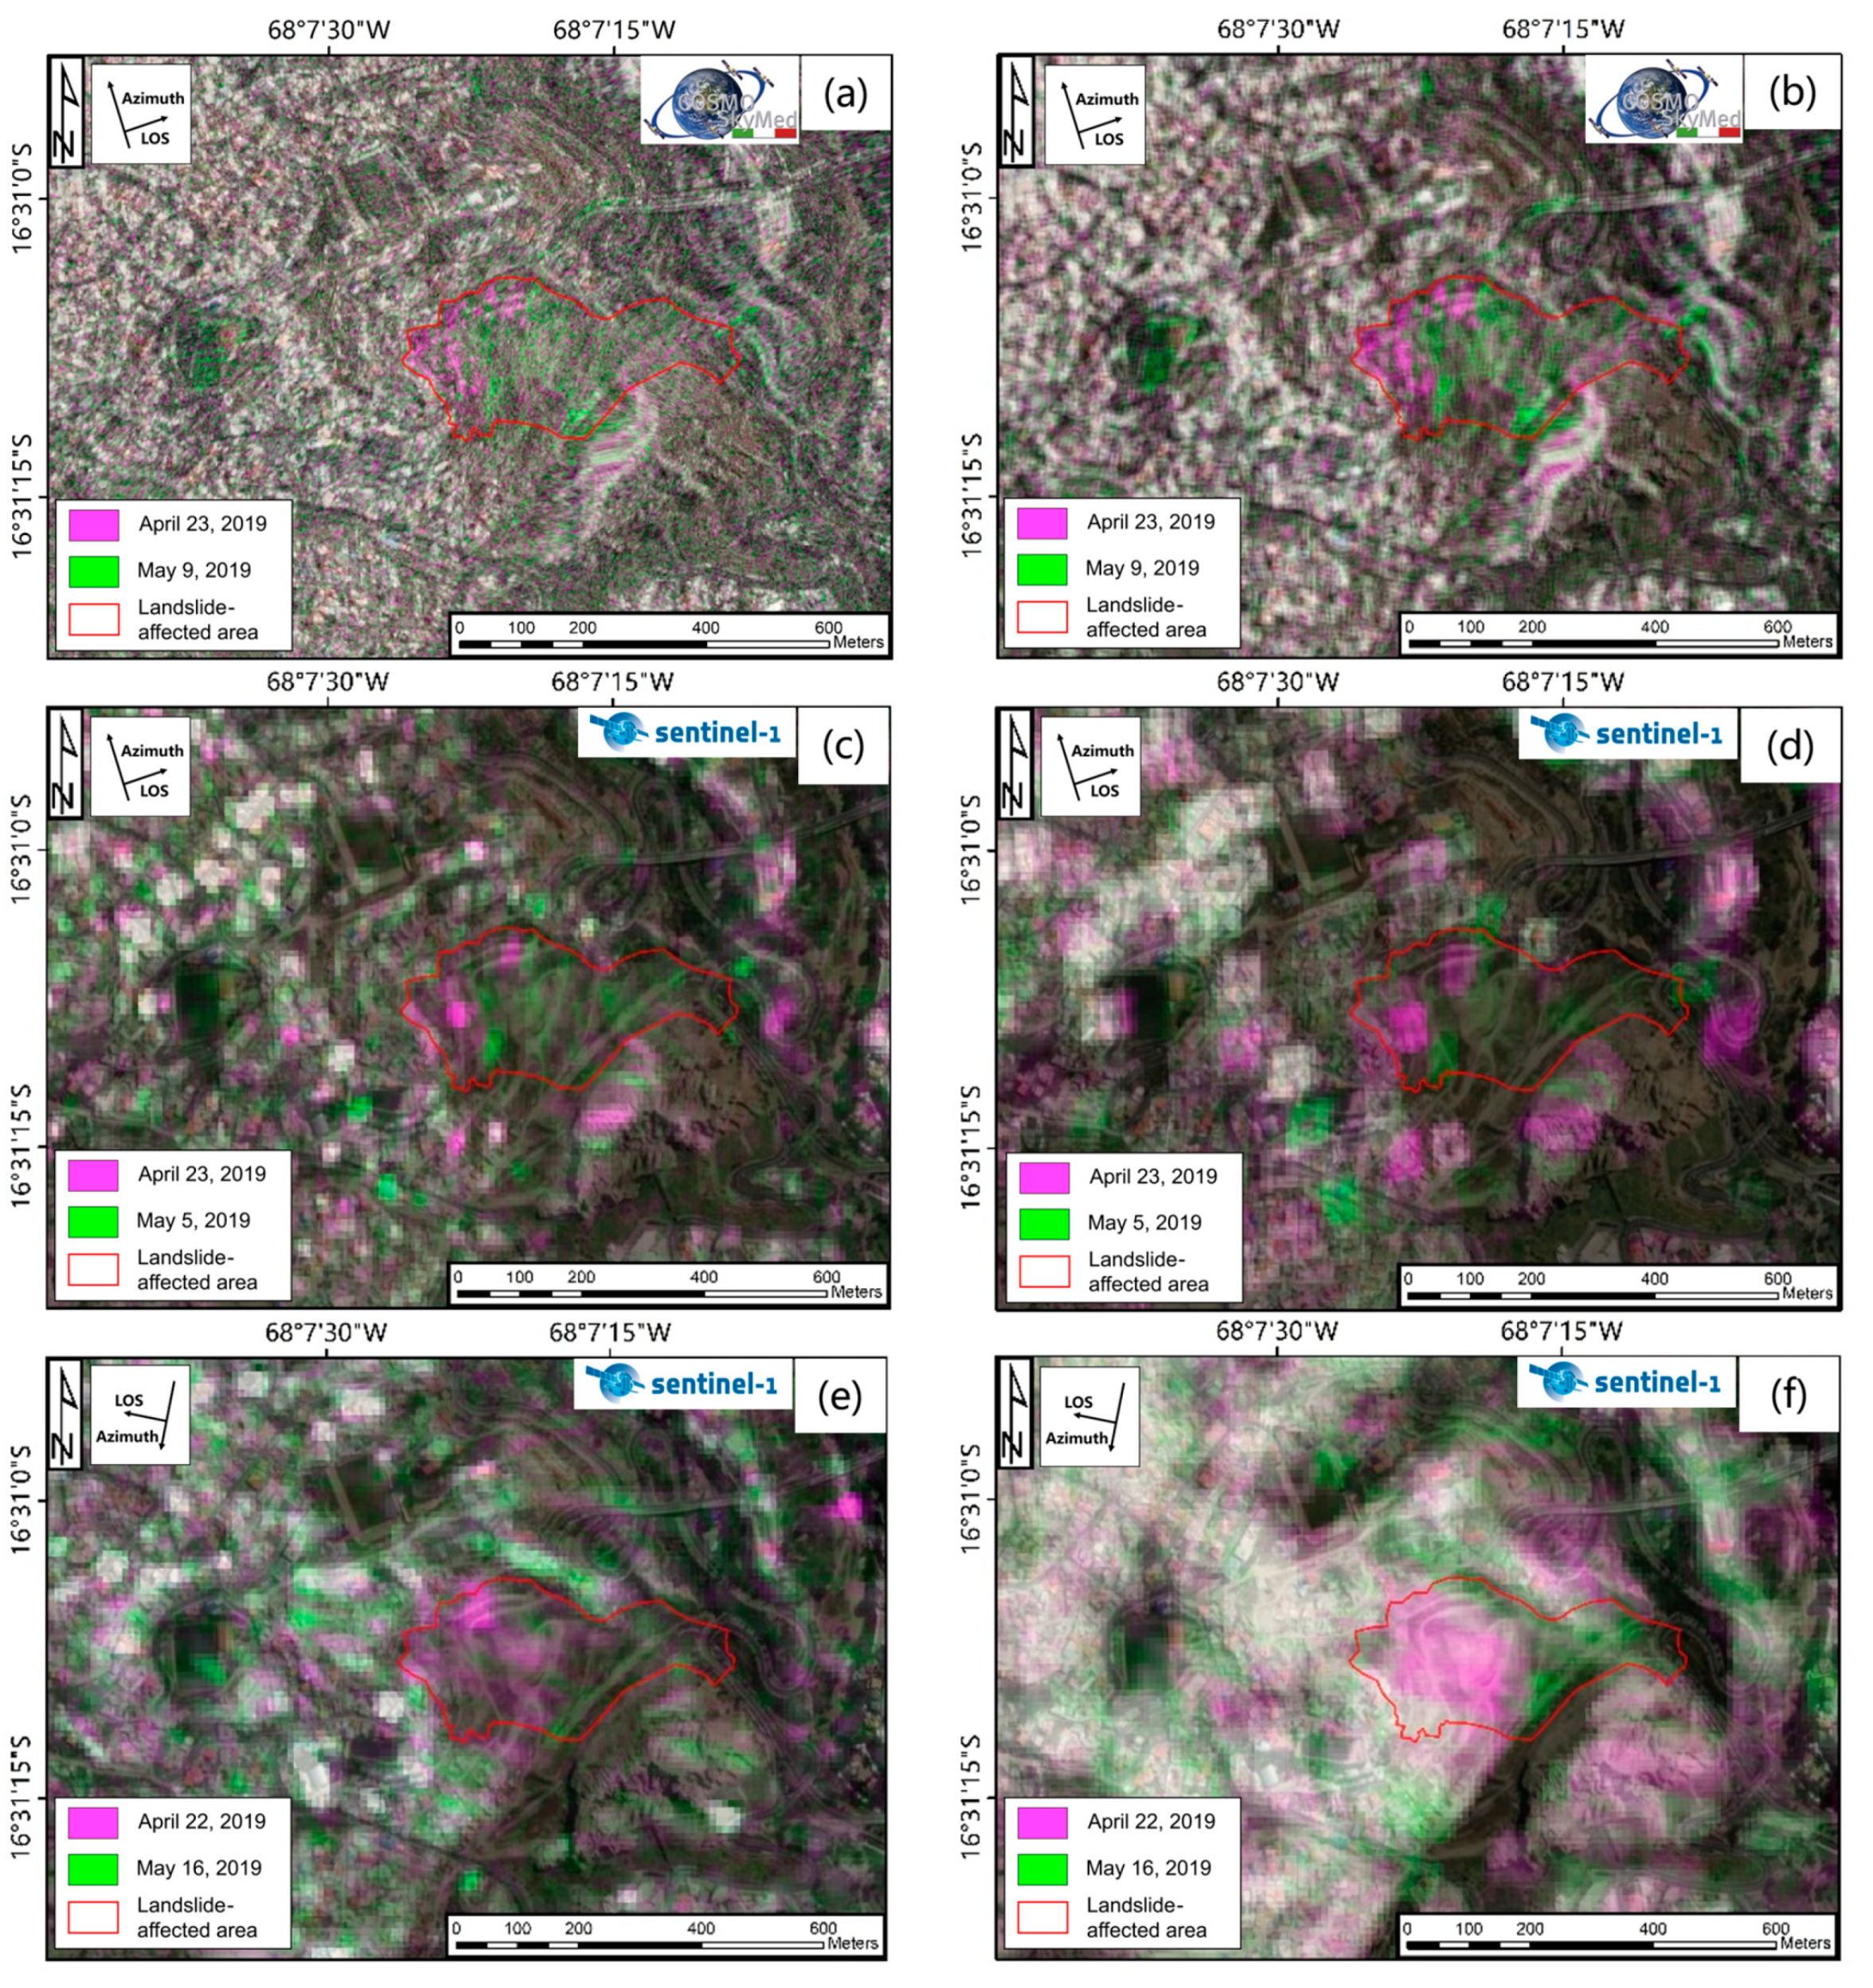
4.1. Landslide Mapping Using the SAR Amplitude

The calibrated sigma0 band and the GLCM variance RGB color composition of the COSMO-SkyMed and Sentinel-1 data are the first results obtained with the change detection analysis (Figure 5). The pink color indicates the decrement in the SAR reflectance of the backscarp of the landslide, as the original land cover of this area included mainly roads and houses. The new land cover over the backscarp after the landslide was originally finer materials inside the landfill. Meanwhile, the green color represents the landslide deposits, indicating an increment in the SAR reflectance. Through optical remote sensing imagery taken before and after the failure and the videos taken onsite, the major components of the landslide deposits were materials such as bricks, tarmac, concrete waste, rooftops, and other materials that had a higher reflectance than the original land cover of bare soil or sparse vegetation.
The GLCM variance was used to visualize the landslide-affected area highlighted by the highest PCA score in both the COSMO-SkyMed and Sentinel-1 GLCM analyses. A higher score indicates a stronger capability to distinguish the texture features in the SAR image, therefore providing clearer landslide-affected area mapping results. The GLCM variance, contrast, and GLCM mean were the three GLCM texture features with the highest PCA scores among all GLCM texture features after performing the PCA for both the COSMO-SkyMed and Sentinel-1 data. Table 5 lists the scores of these three parameters.
The football field located to the west of the San Jorge Kantutani landslide showed a clear green feature referring to the land use change due to the emergency requisition of the local civil protection department as an evacuation site for the residents who were affected by the landslide. From Figure 2f, the facilities that were set up on the football field can be observed. The backscattering signals of such facilities were higher than the original land cover of grass. Therefore, the green feature in the SAR change detection results referring to the land use change were similar to the landslide-affected area.

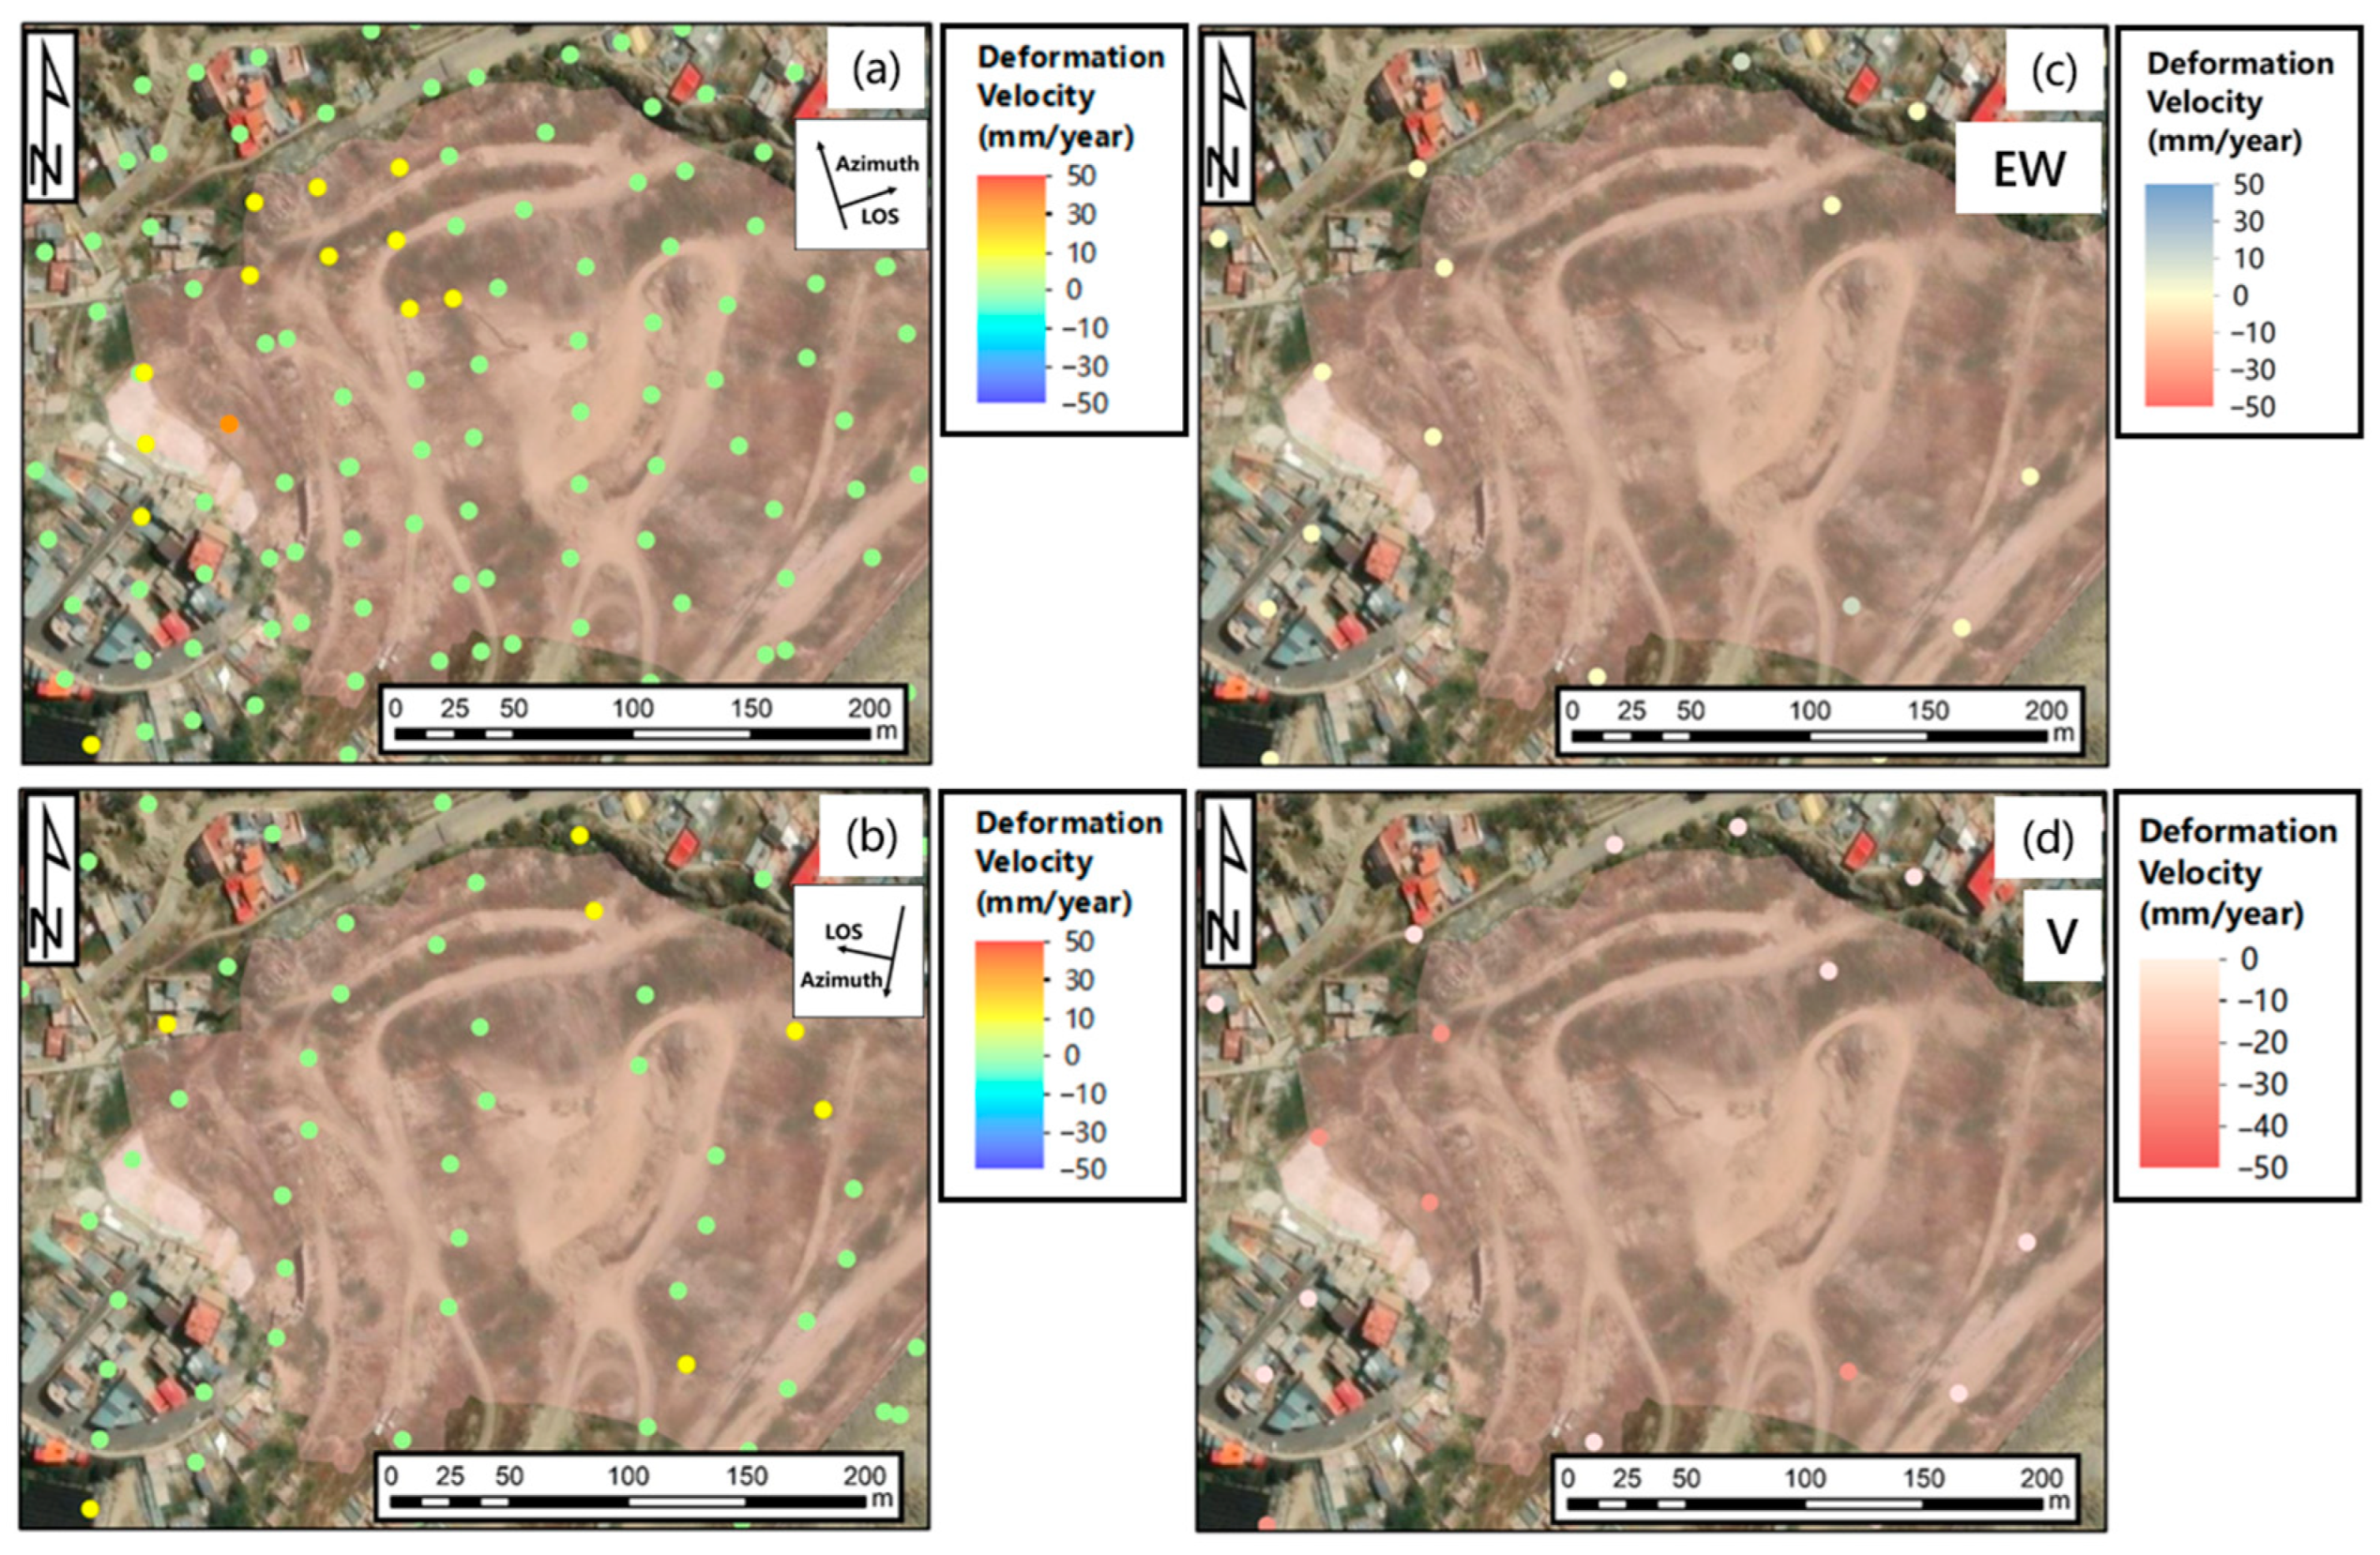
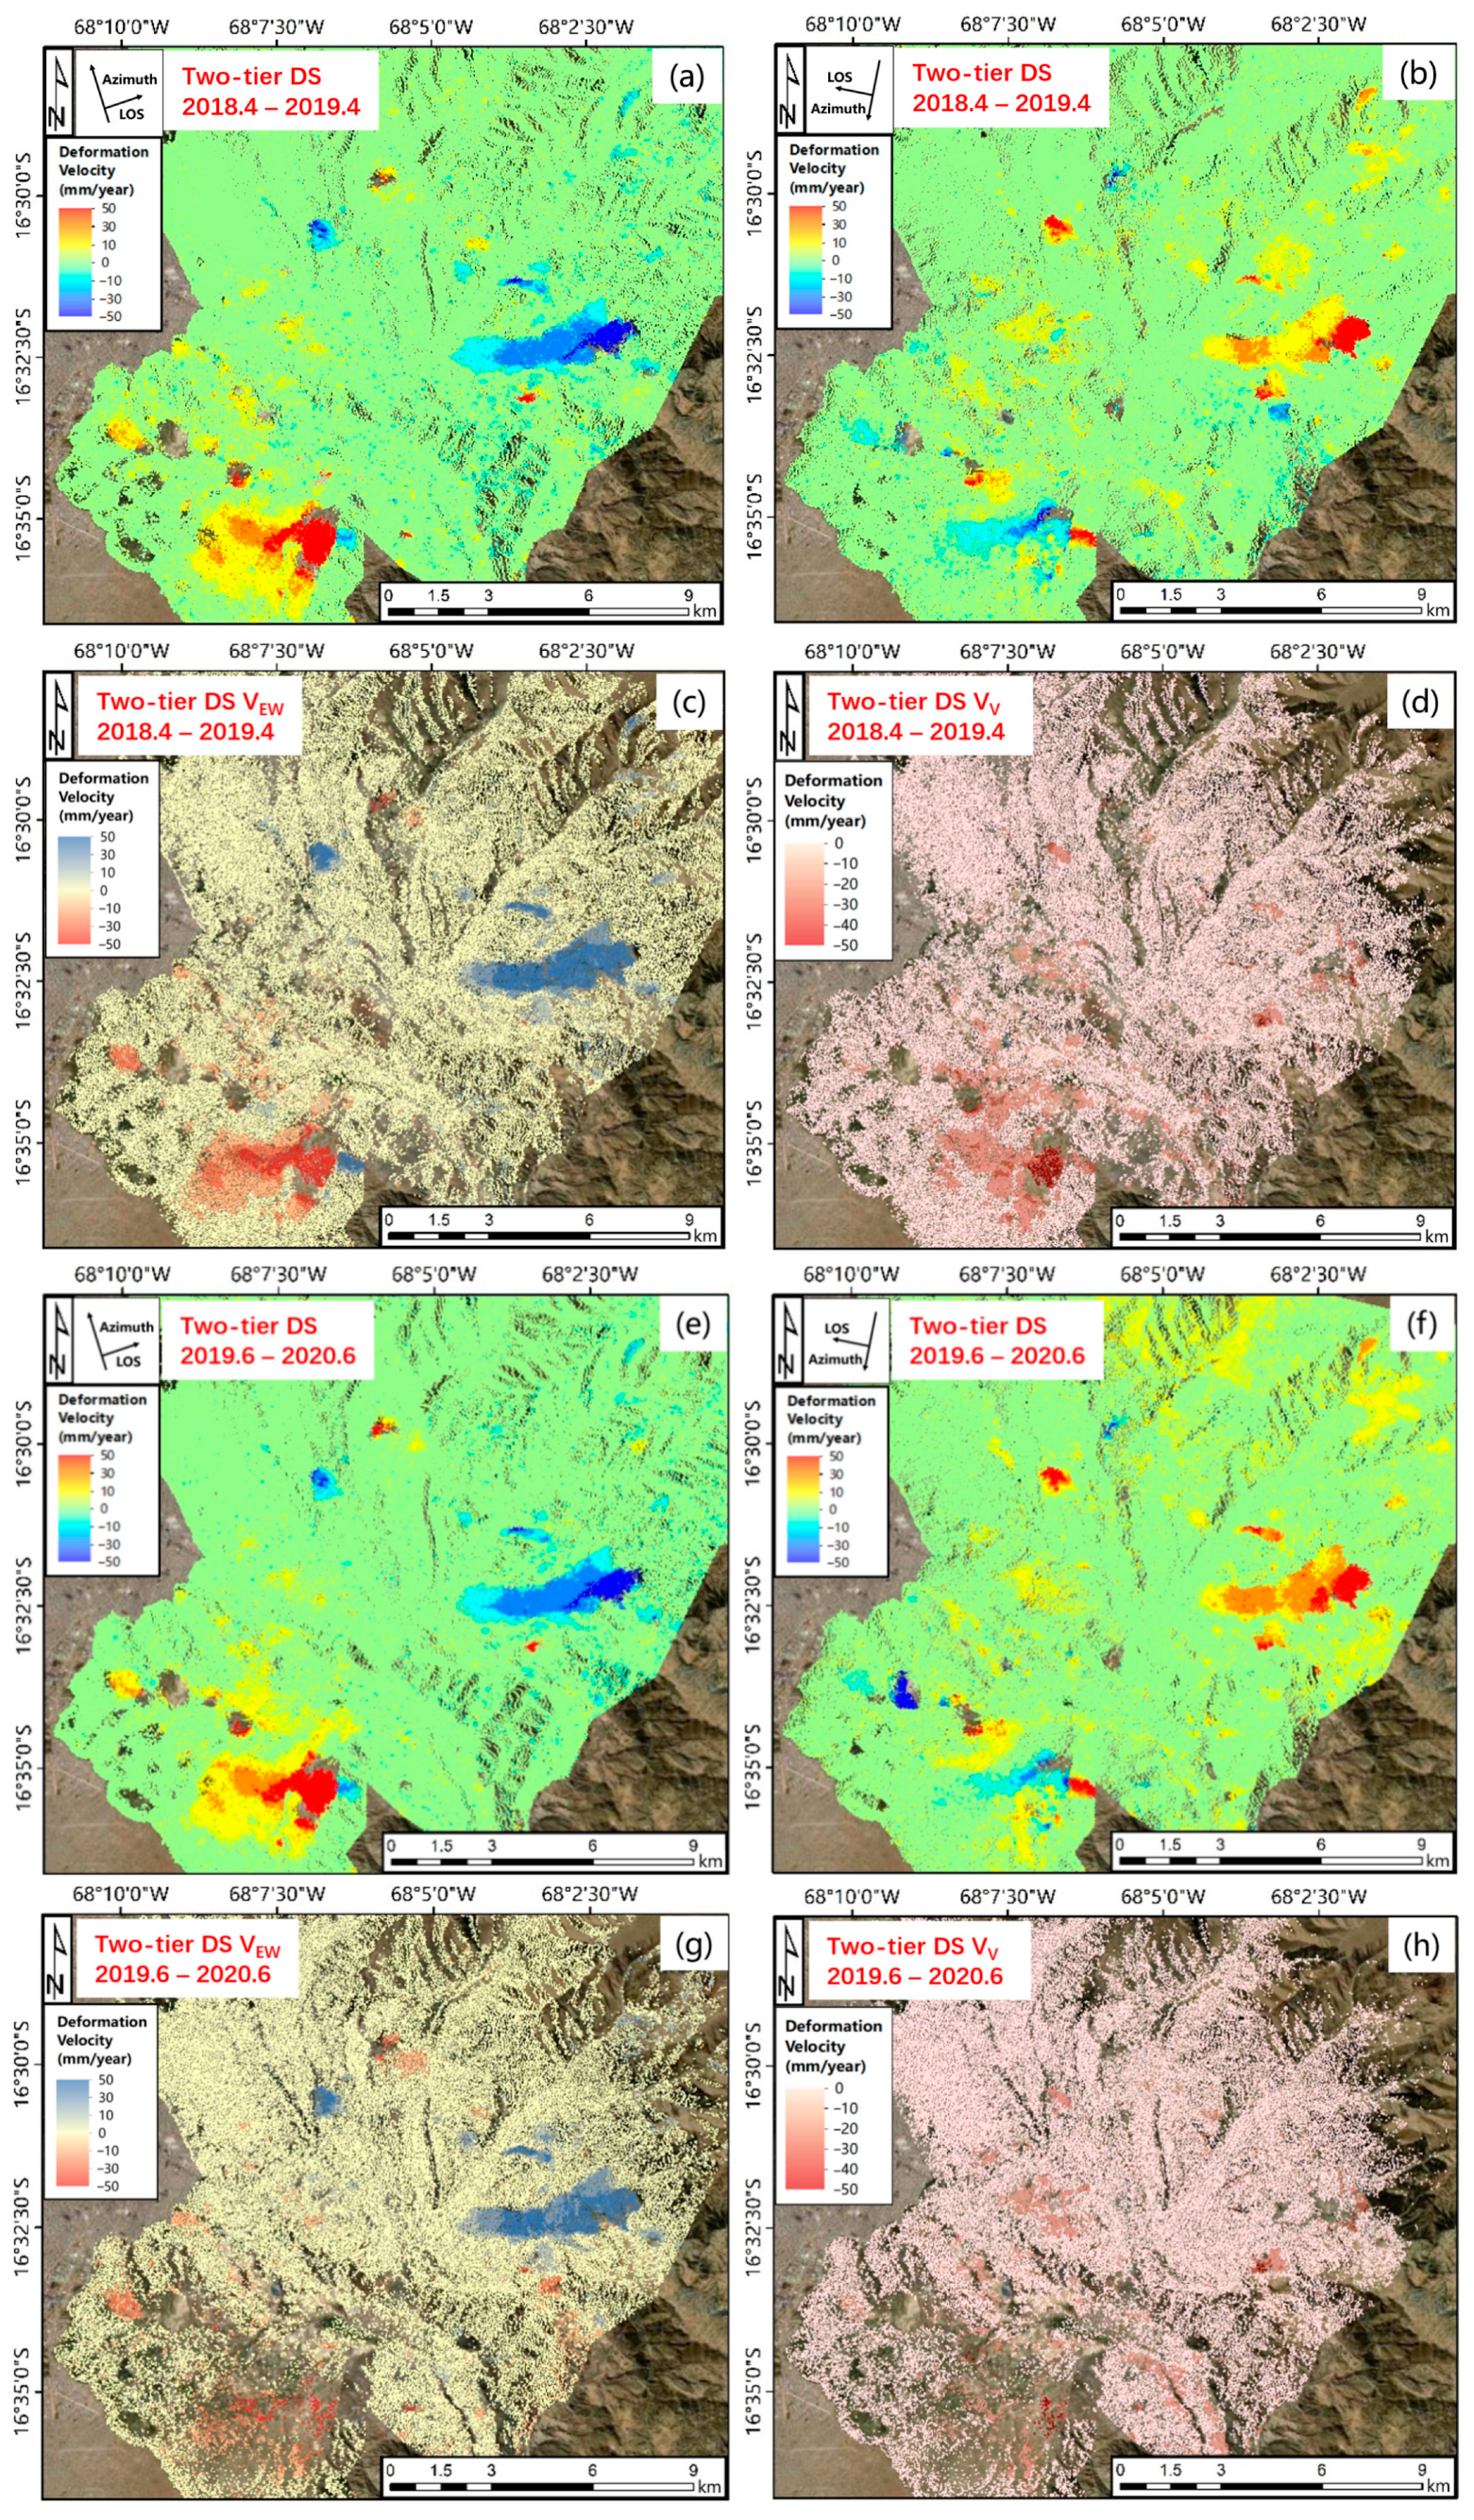
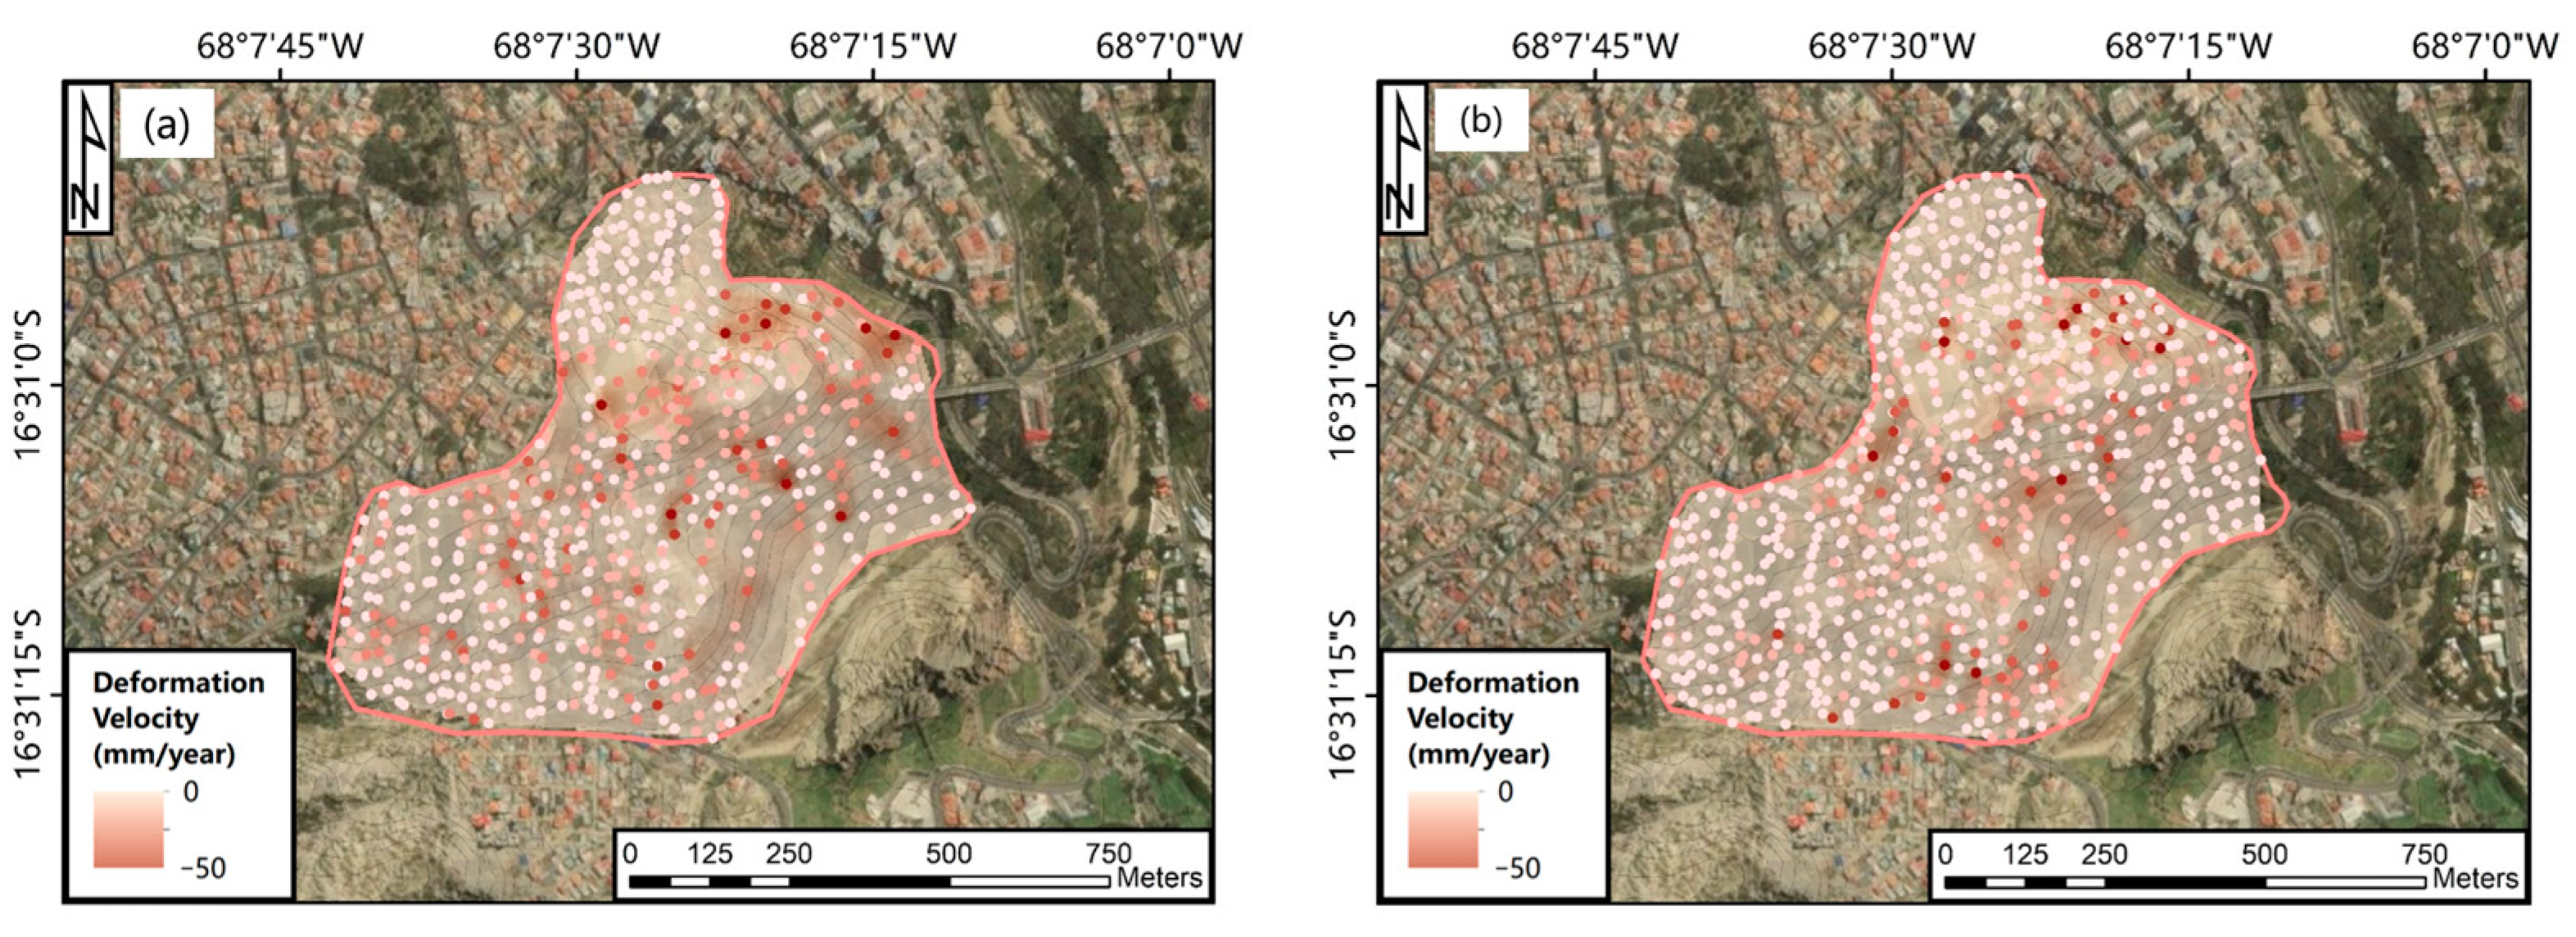
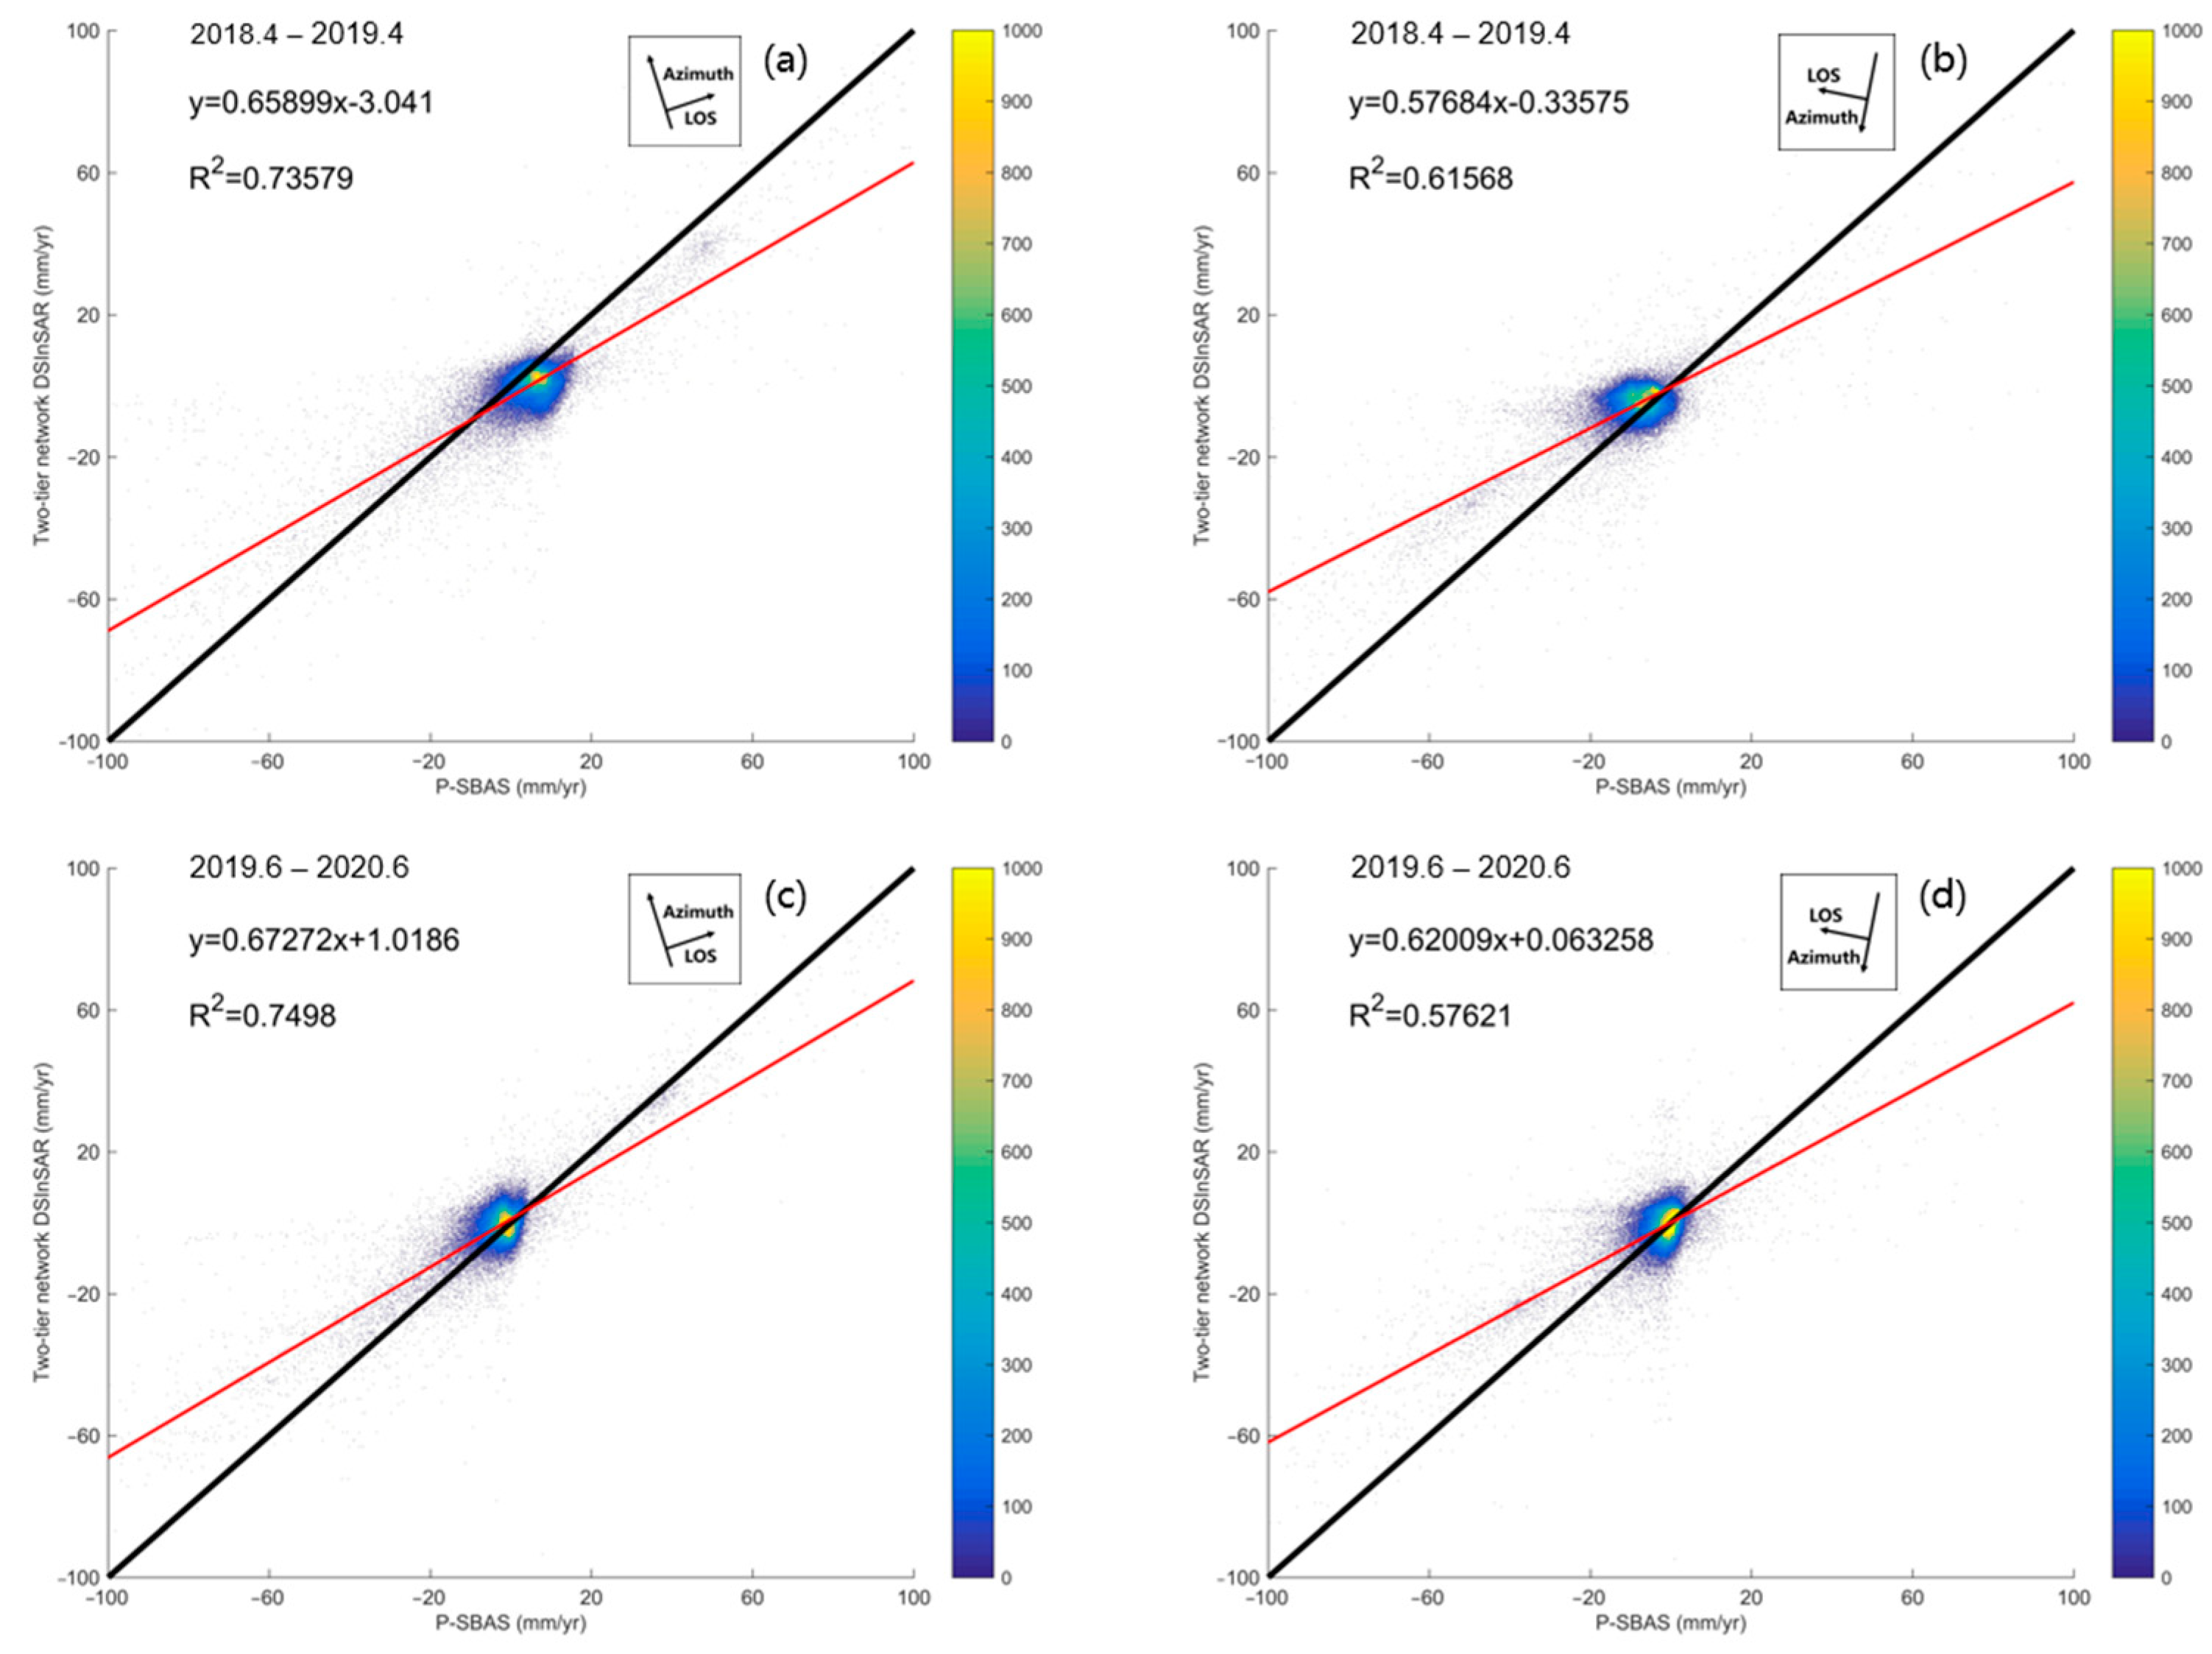
4.2. Two-Tier Network DSInSAR Analysis

The pre- and post-failure VLOS of the ascending and descending geometries and the VEW and VV of the DSInSAR processing results are shown in Figure 6. The study area included La Paz city and the southern suburban area, which yielded ~300,000 PS/DS points in each two-tier network for the DSInSAR processing. The point density reached a level of approximately 500/km2, with a dense distribution of the points in the urban area of La Paz, facilitating the subsequent analysis of the geohazards. Notably, the density of the PS/DS in the suburban sites around the La Paz urban area was relatively high compared to previous studies, with the DSInSAR algorithm successfully extracting sufficient point targets over the rock outcrops and bare soil with low vegetation density in the study area. The projection results indicate multiple areas of creep phenomena along the east–west directions in the red–blue colors, and areas of creep along the up–down directions in the blue–yellow–red colors. According to the pre-failure two-tier network DSInSAR results, more than 10% of the points suffered from deformation greater than 10 mm/year along the LOS direction and, considering the even spatial distribution of the points in the urban area of La Paz, the deformation hotspots took up more than 10% of the urban area of La Paz. The reason for not counting the post-failure two-tier network DSInSAR results is the loss of temporally and spatially coherent PS/DS targets during that period. On the other hand, by comparing the situation of some deformation hotspots in La Paz city, the increasing velocity from the pre-failure period to the post-failure period confirmed the loss of temporally and spatially coherent PS and DS. Such results indicate that the ground deformation of La Paz city behaves more as creep-like rotational earthflow rather than subsidence caused by organic or sandy materials along the vertical direction.

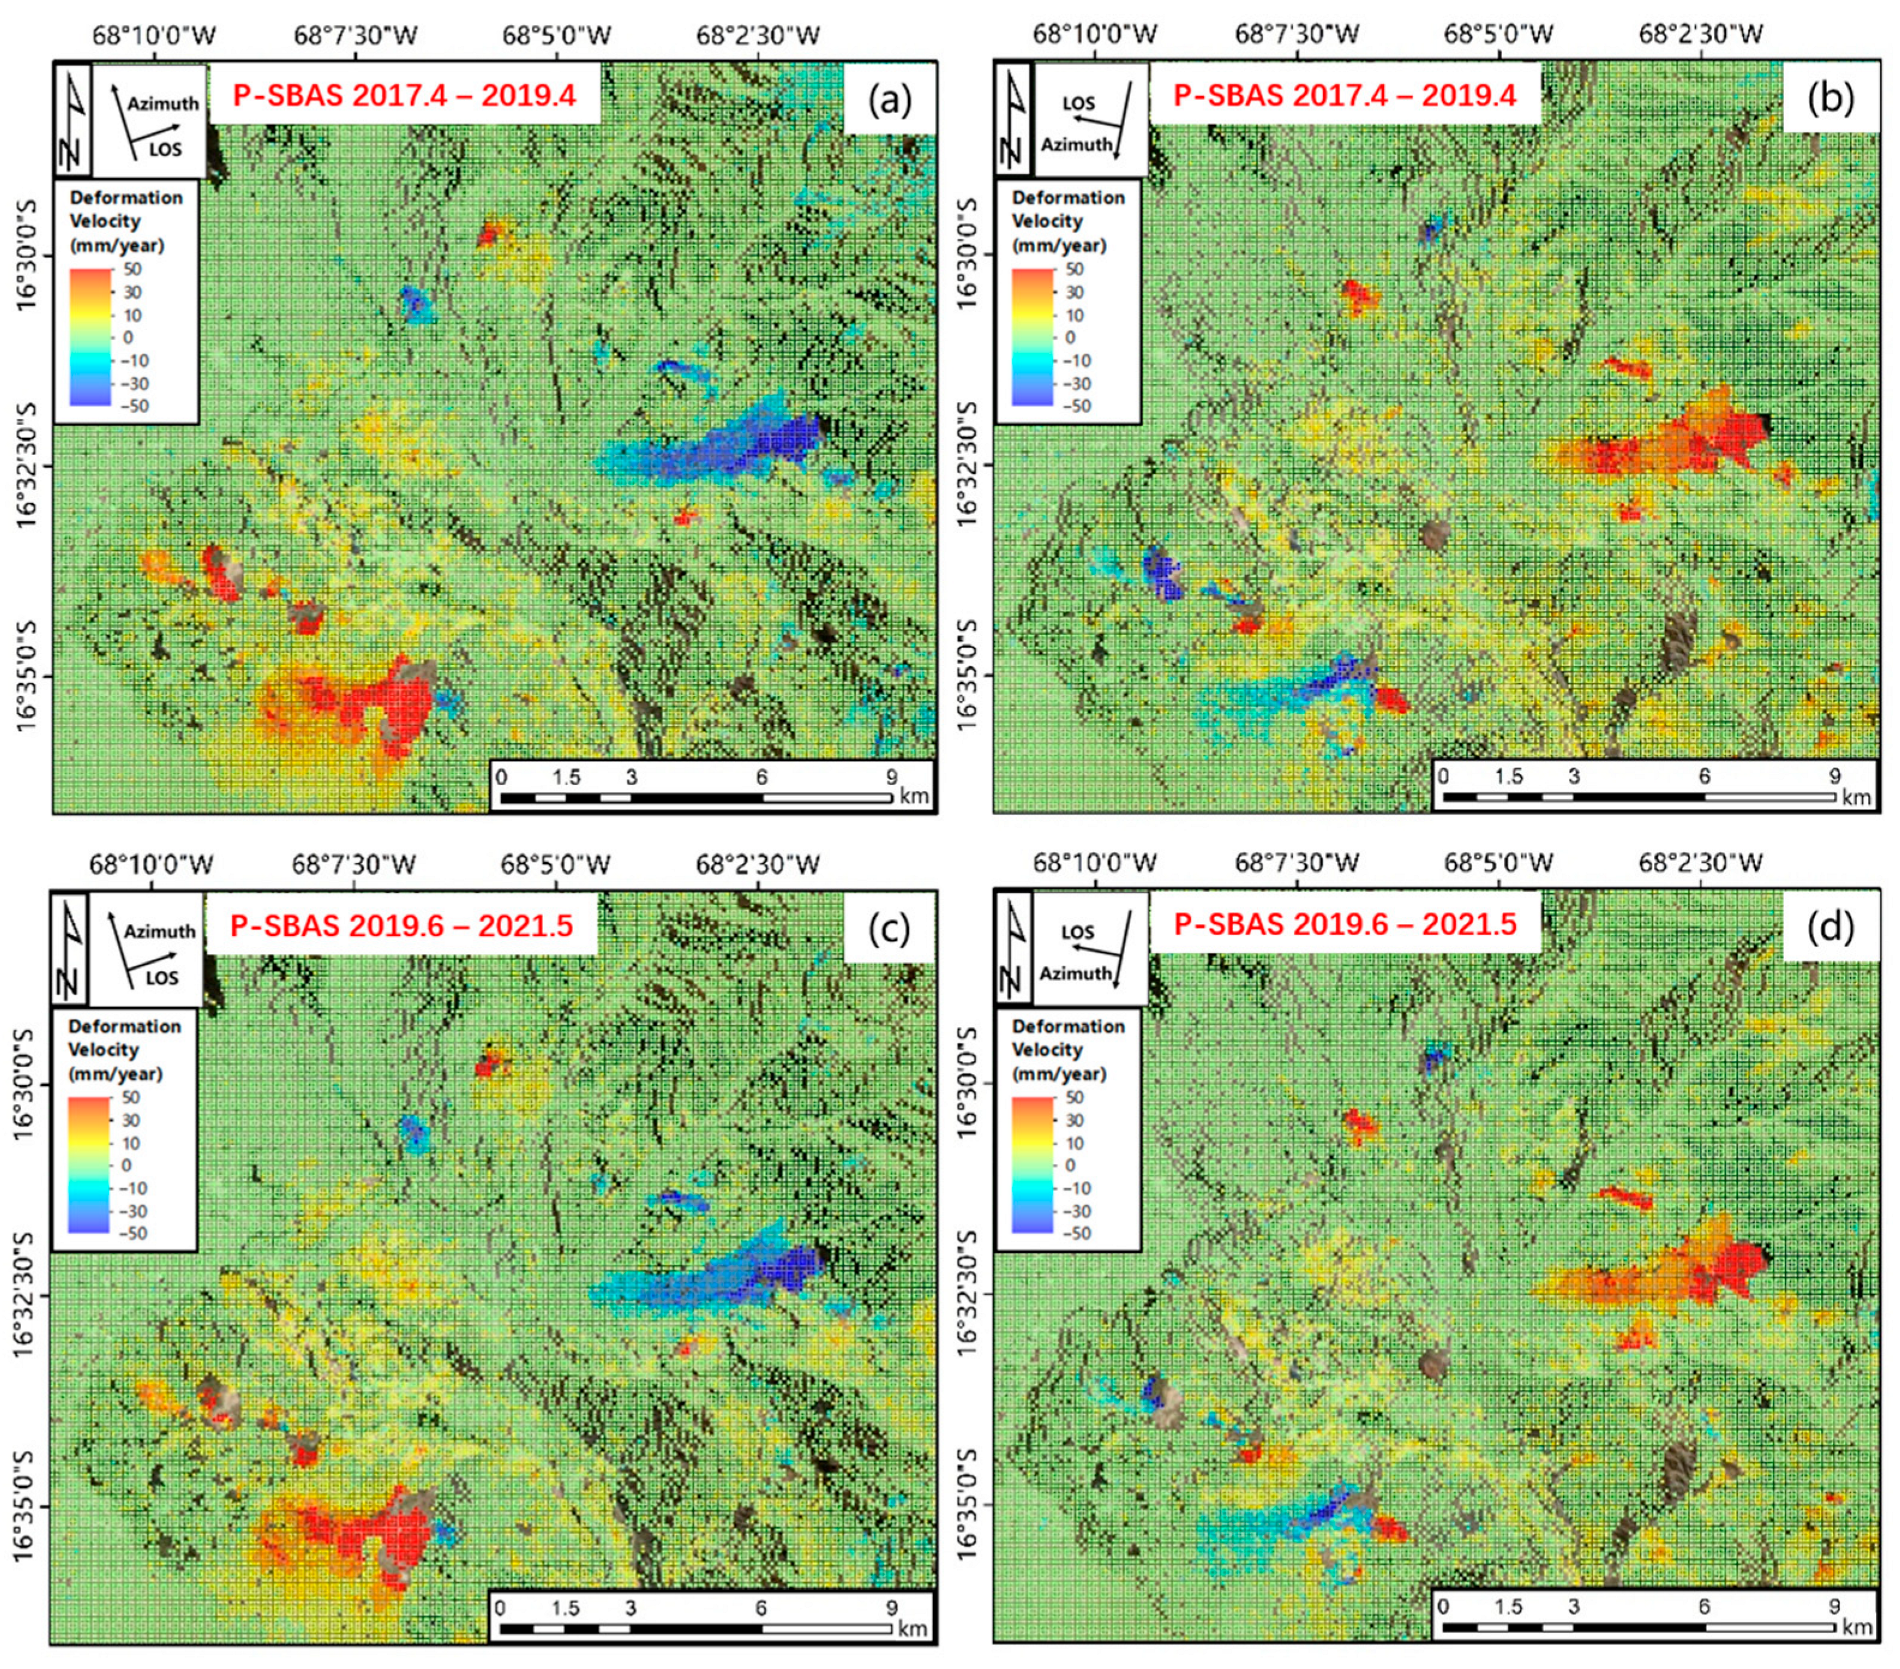
4.3. P-SBAS Analysis

The P-SBAS pre- and post-failure processing results are illustrated in Figure 7. As the default multi-looking factor in the P-SBAS processing on the GEP resulted in a 90 m spatial resolution, the distribution of the point targets of the P-SBAS analysis was not as dense as the DSInSAR processing. Areas of severe deformation were still present from the P-SBAS results. Table 6 and Table 7 list the maximum velocity observed through both the MTInSAR processing along the LOS and the projected directions in the different deformation hotspot areas in La Paz city. The deformation spots were obtained from [43]. The analyzed results suggest that the creep phenomena in La Paz predominantly occurred along the east–west rather than the up–down direction. Figure 8 illustrates the deformation time series along the east–west direction over some selected hotspots. Subsequent to the analyses of the MTInSAR processing, we observed that the detected areas with creep phenomena in La Paz were very similar. However, the velocity results of the point targets from the P-SBAS processing were sometimes different from the results (~30%) obtained from the DSInSAR processing of the same area. It may be that the P-SBAS processing used a larger window for the multi-looking factor than the two-tier network DSInSAR processing. In addition, the threshold of the temporal coherence and amplitude stability threshold used in the DSInSAR processing were both relatively high, causing decorrelation phenomena to occur. Both reasons resulted in selected point targets from the P-SBAS to be fewer in number than DSInSAR but more spatially continuous.

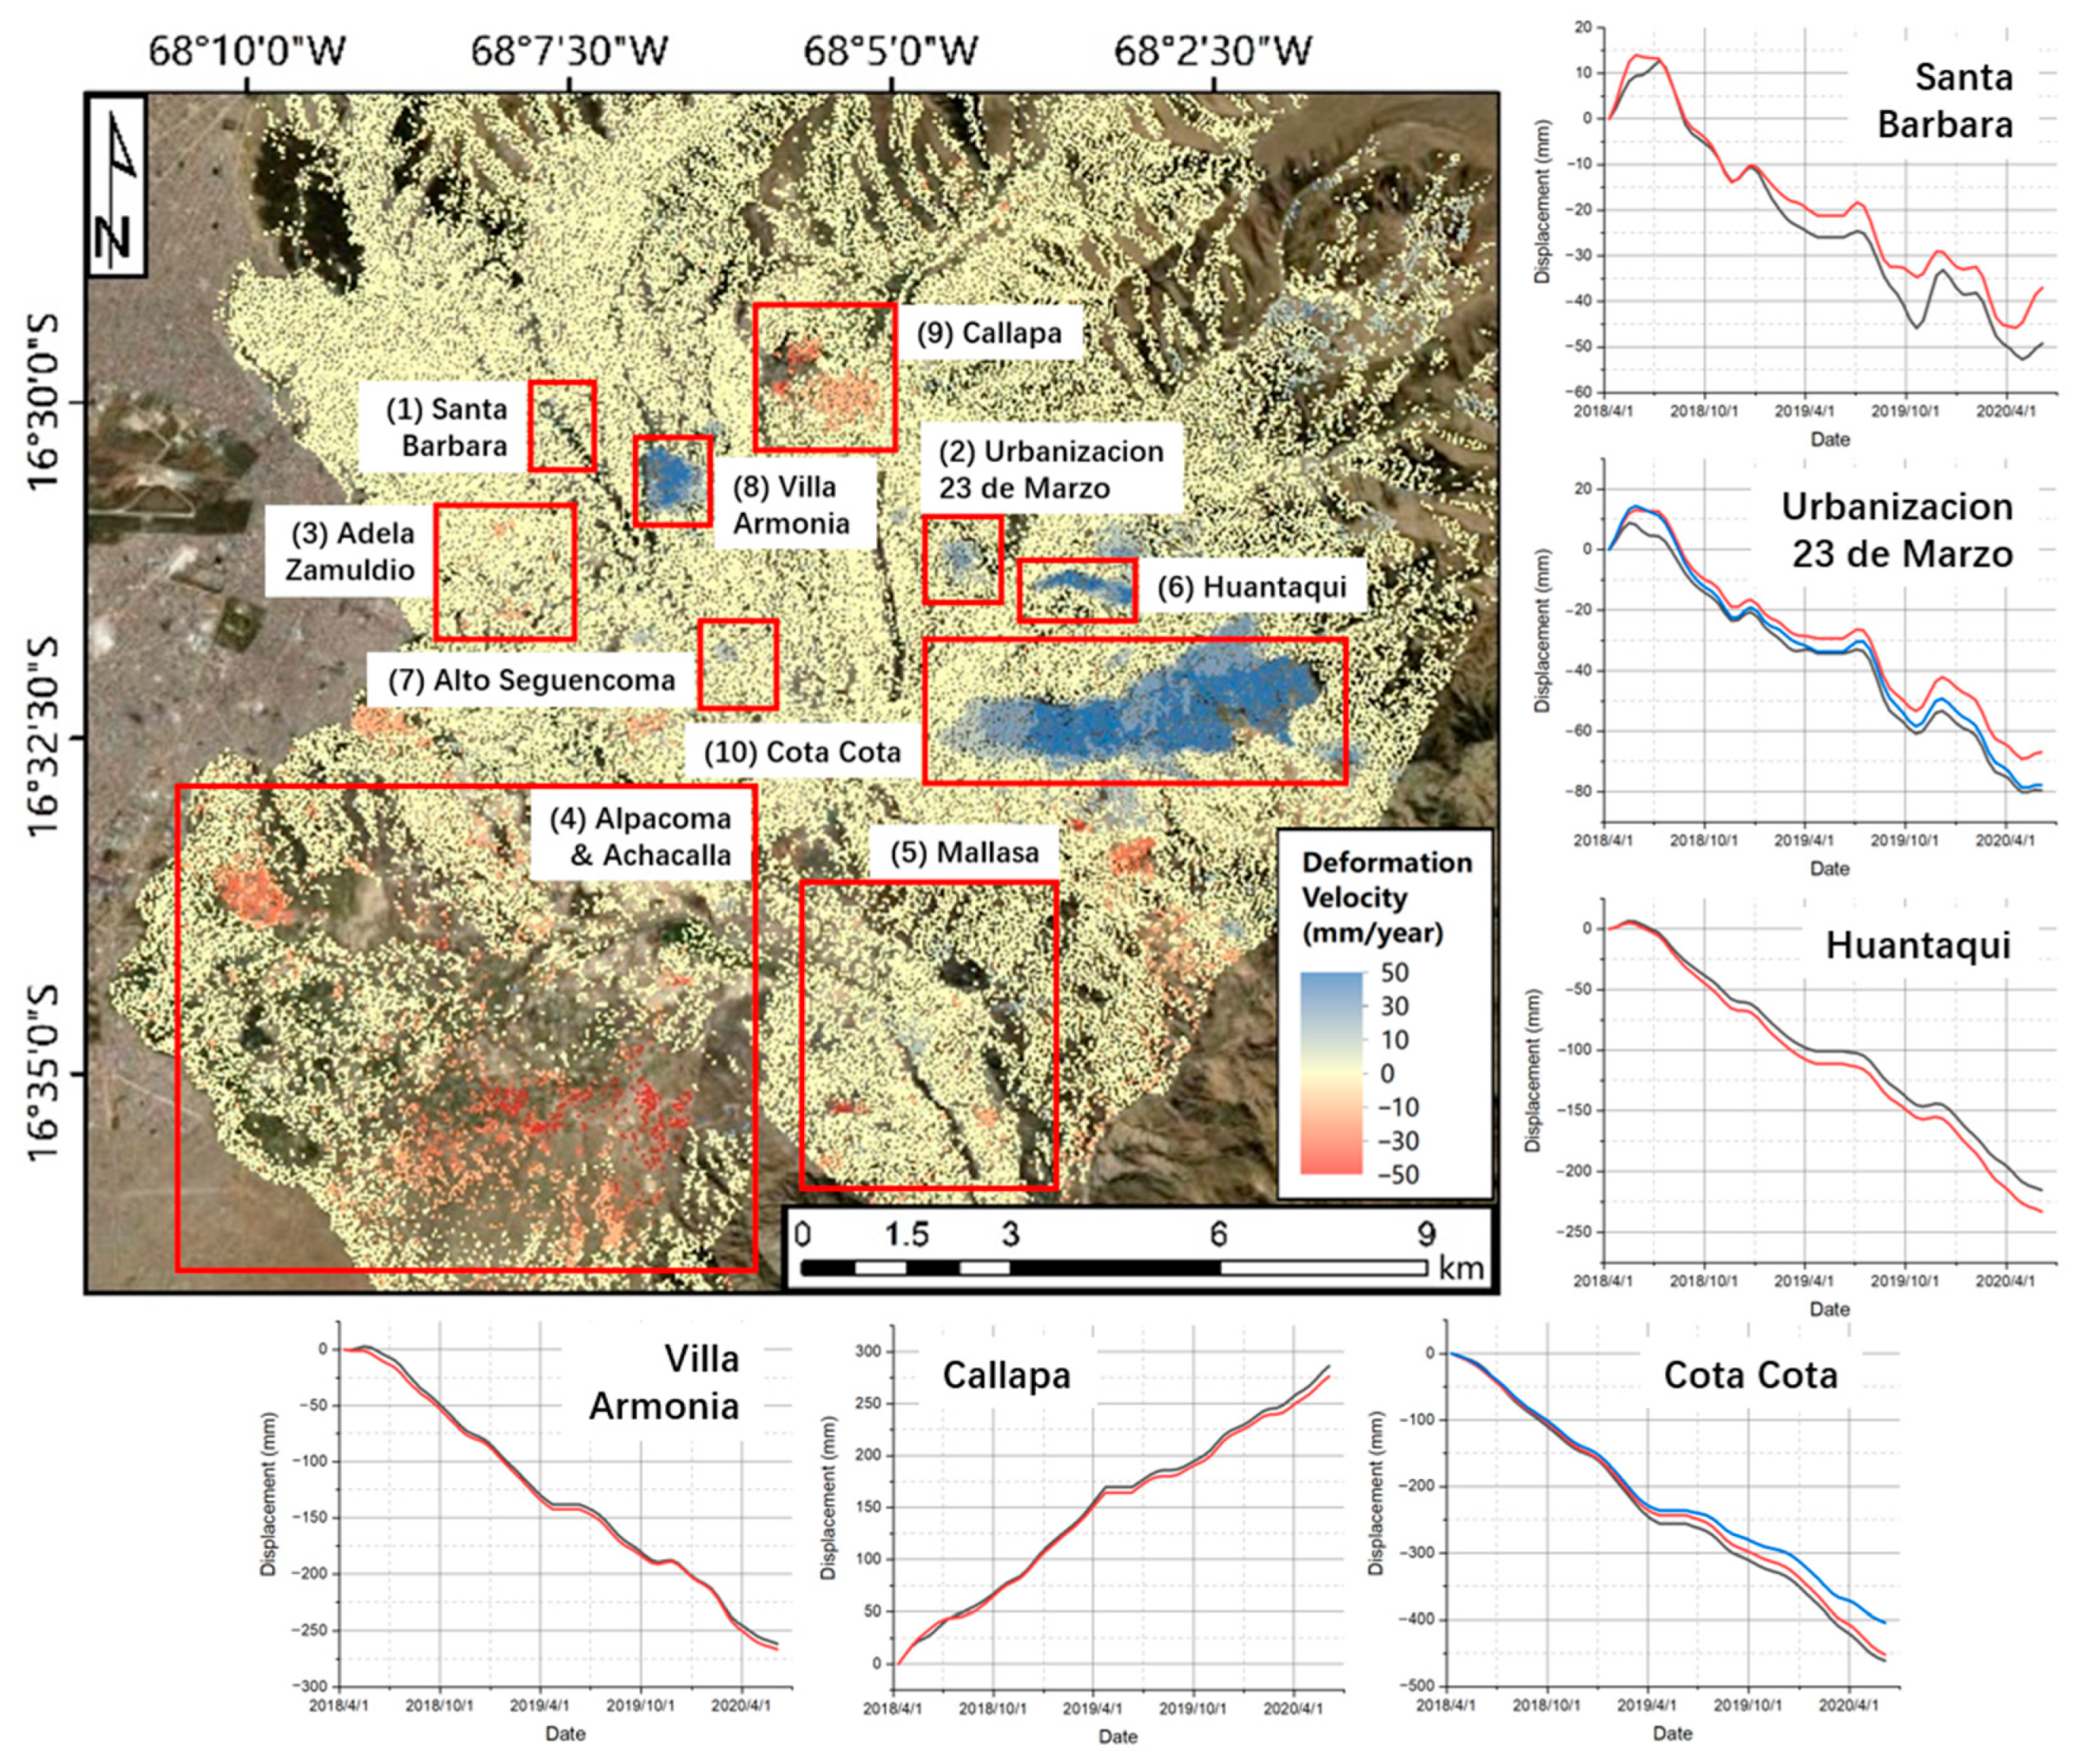
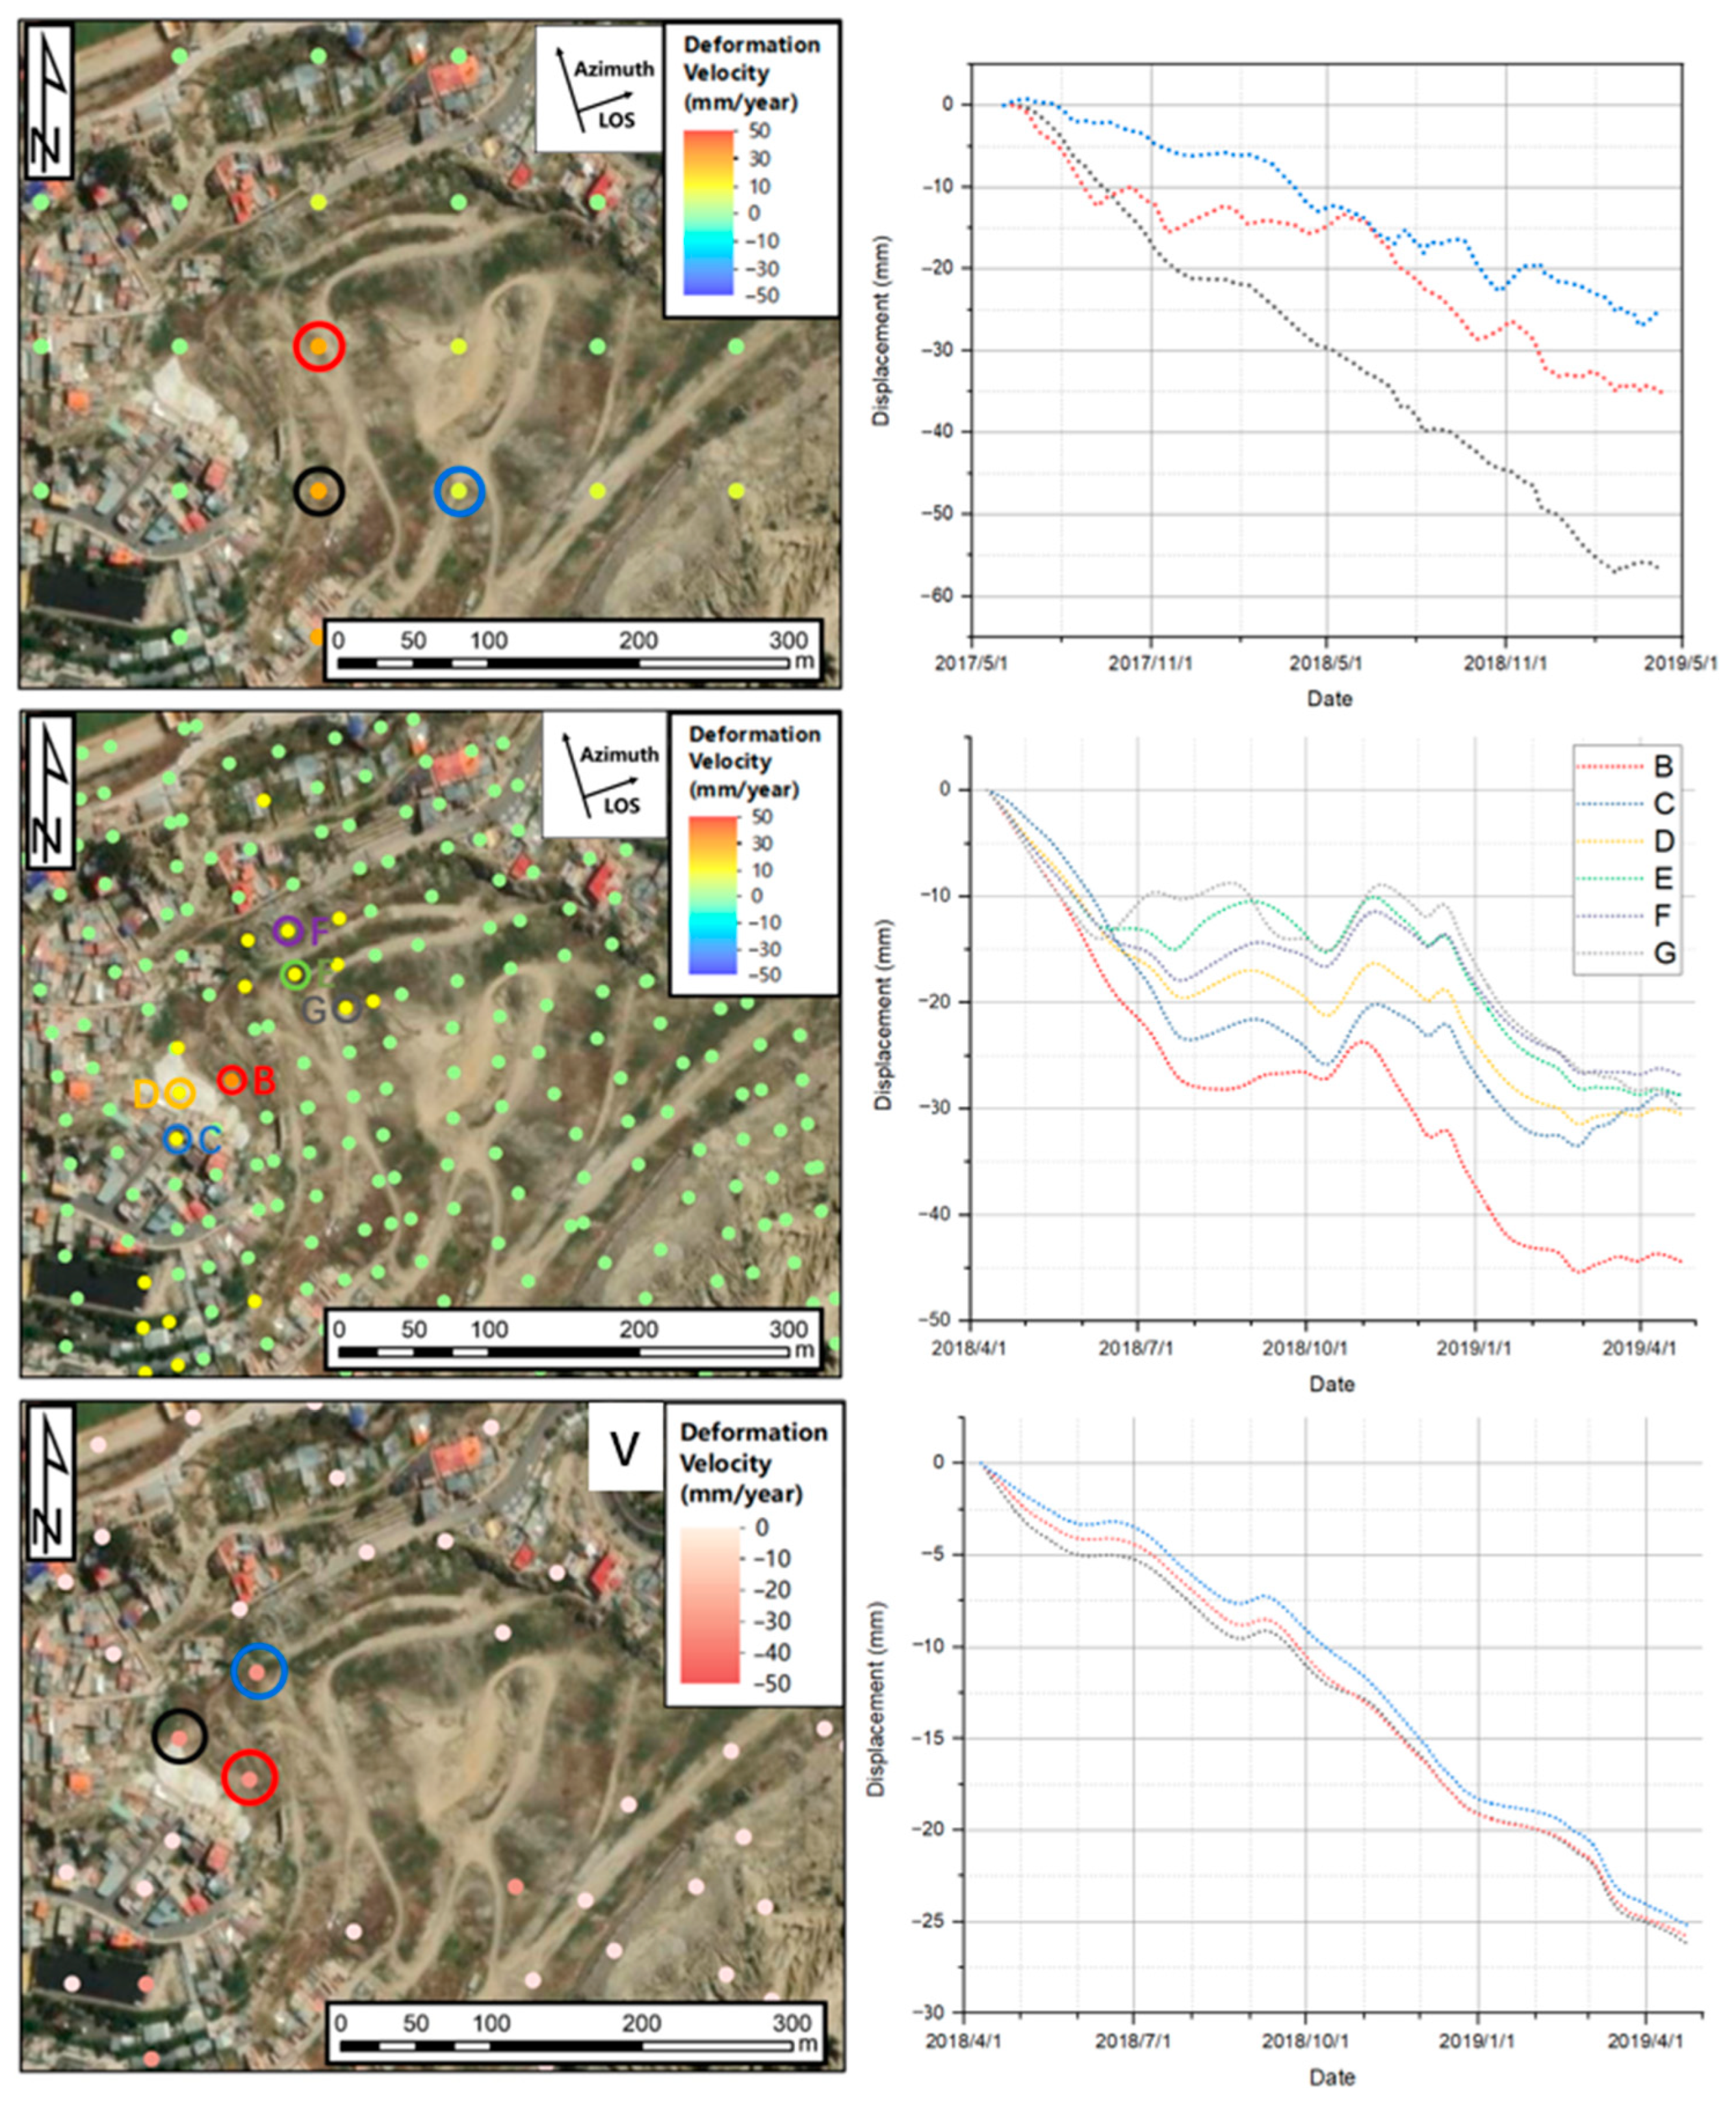
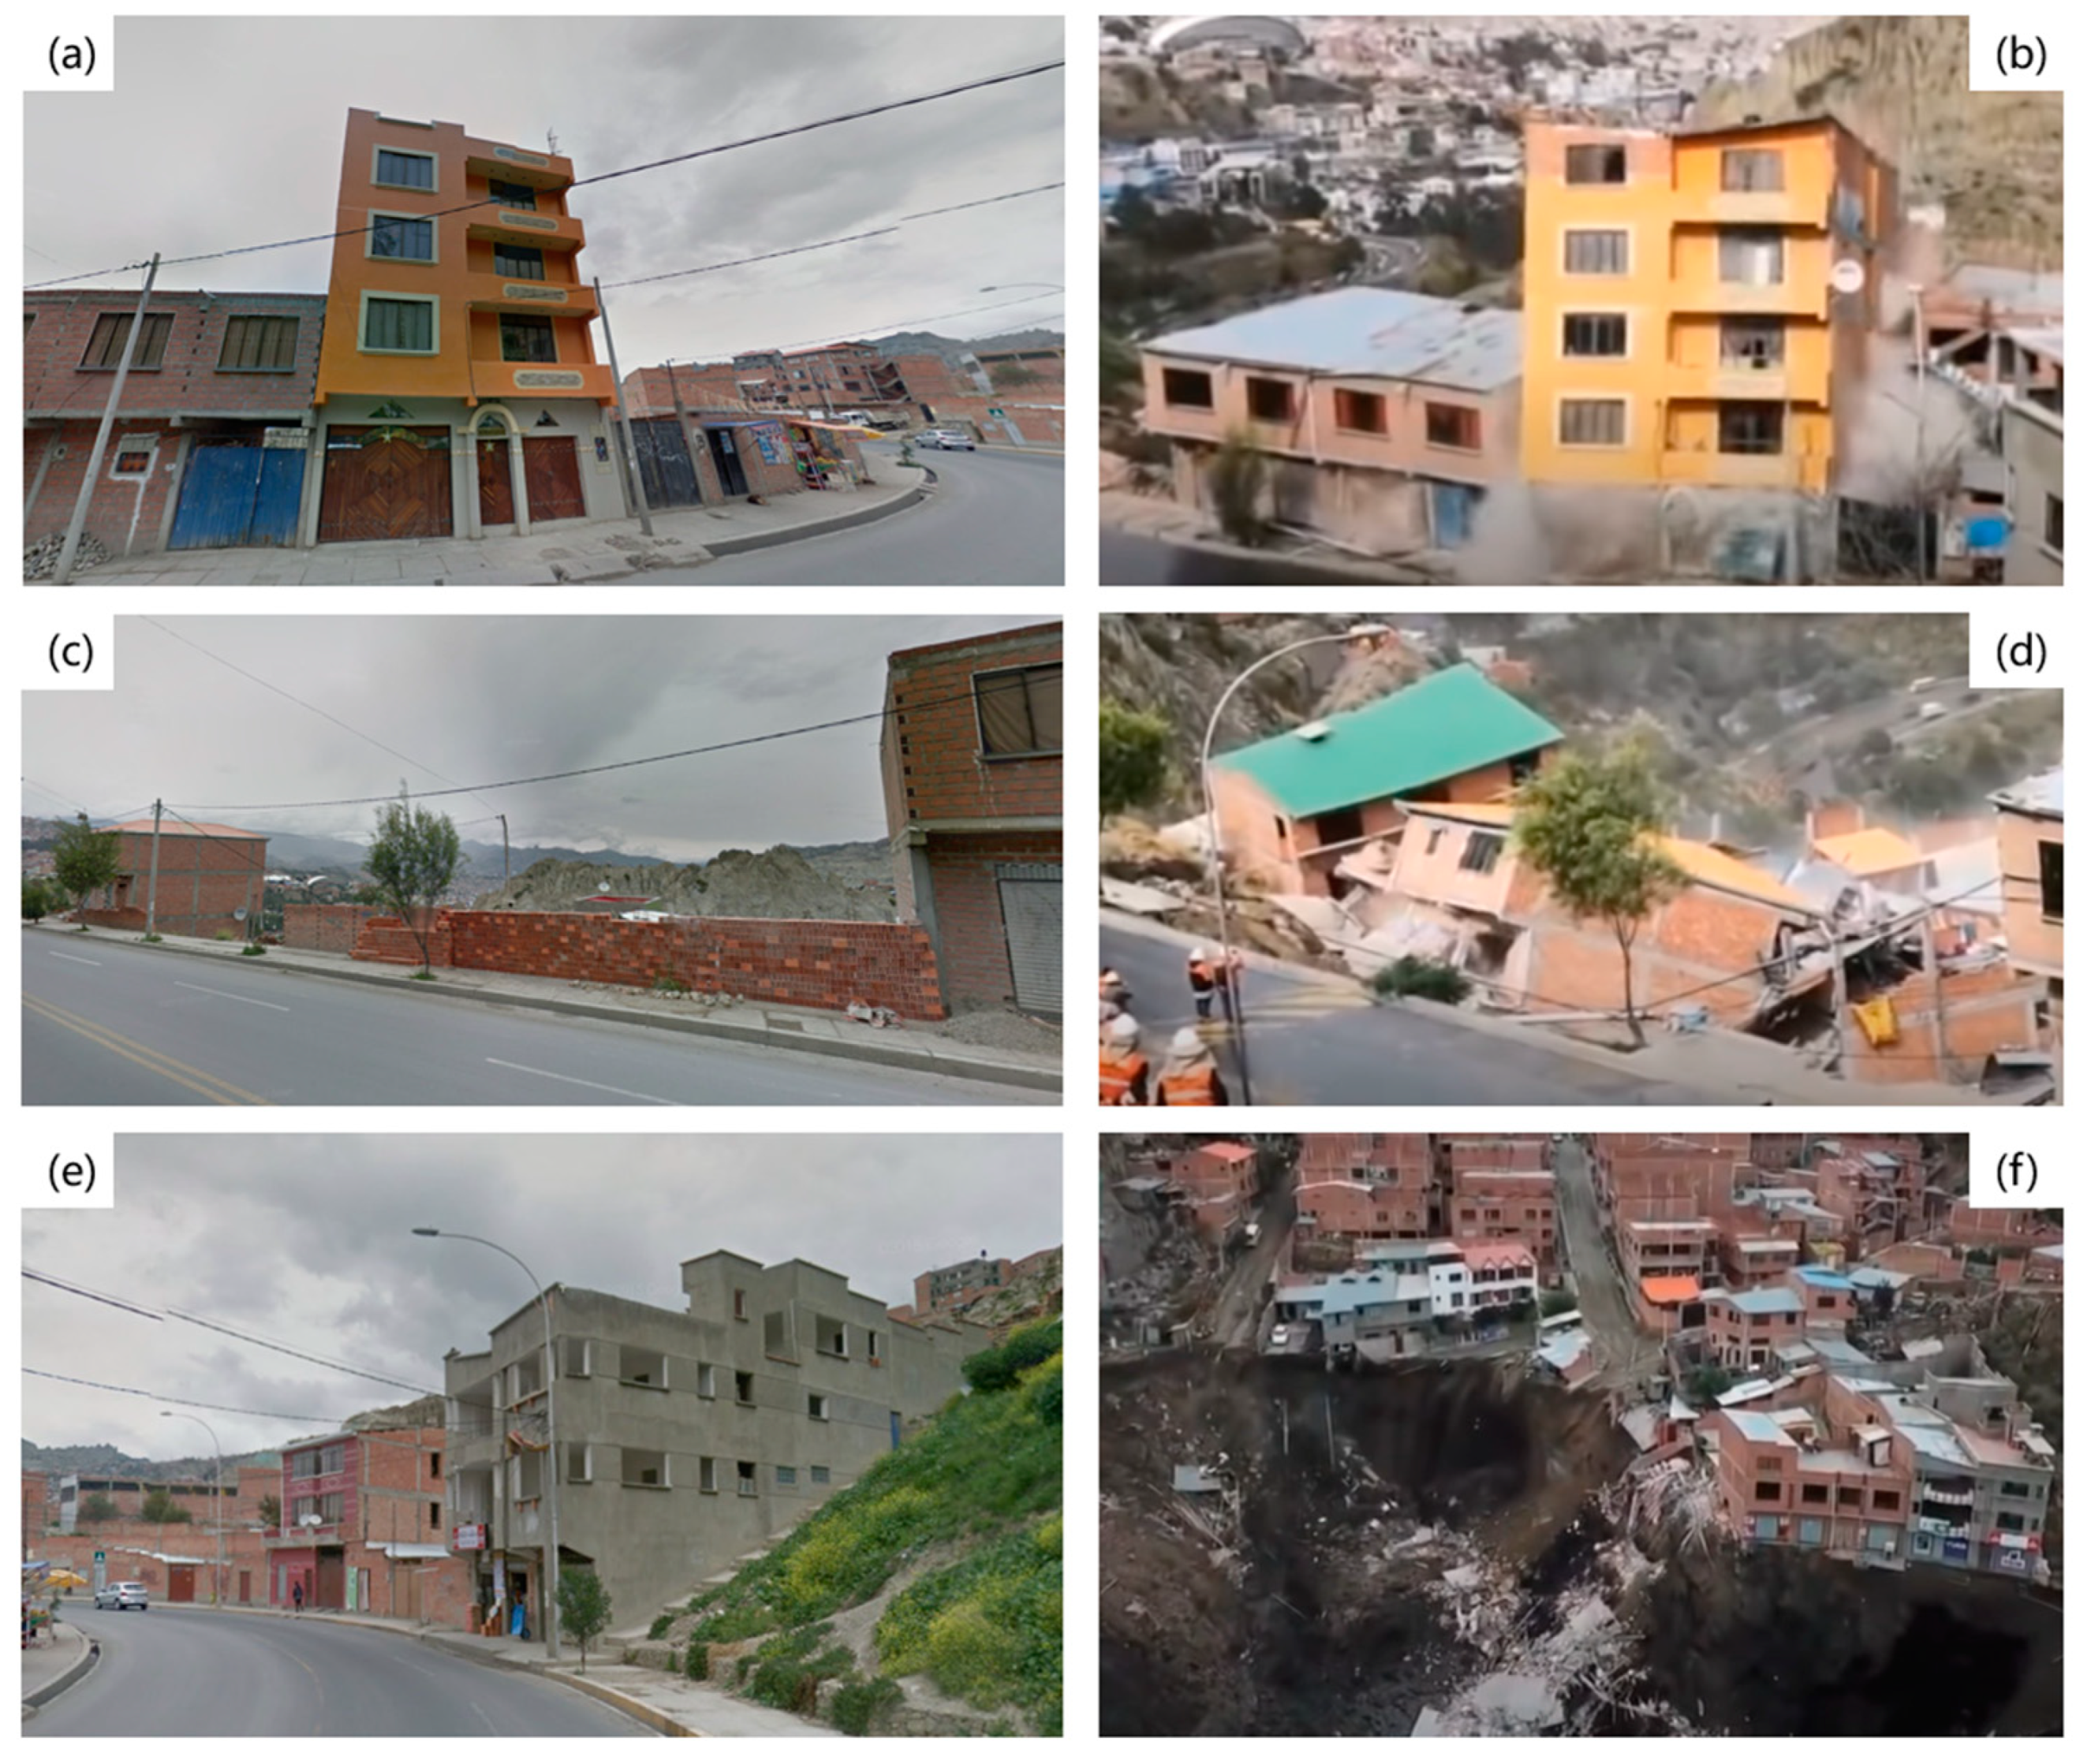
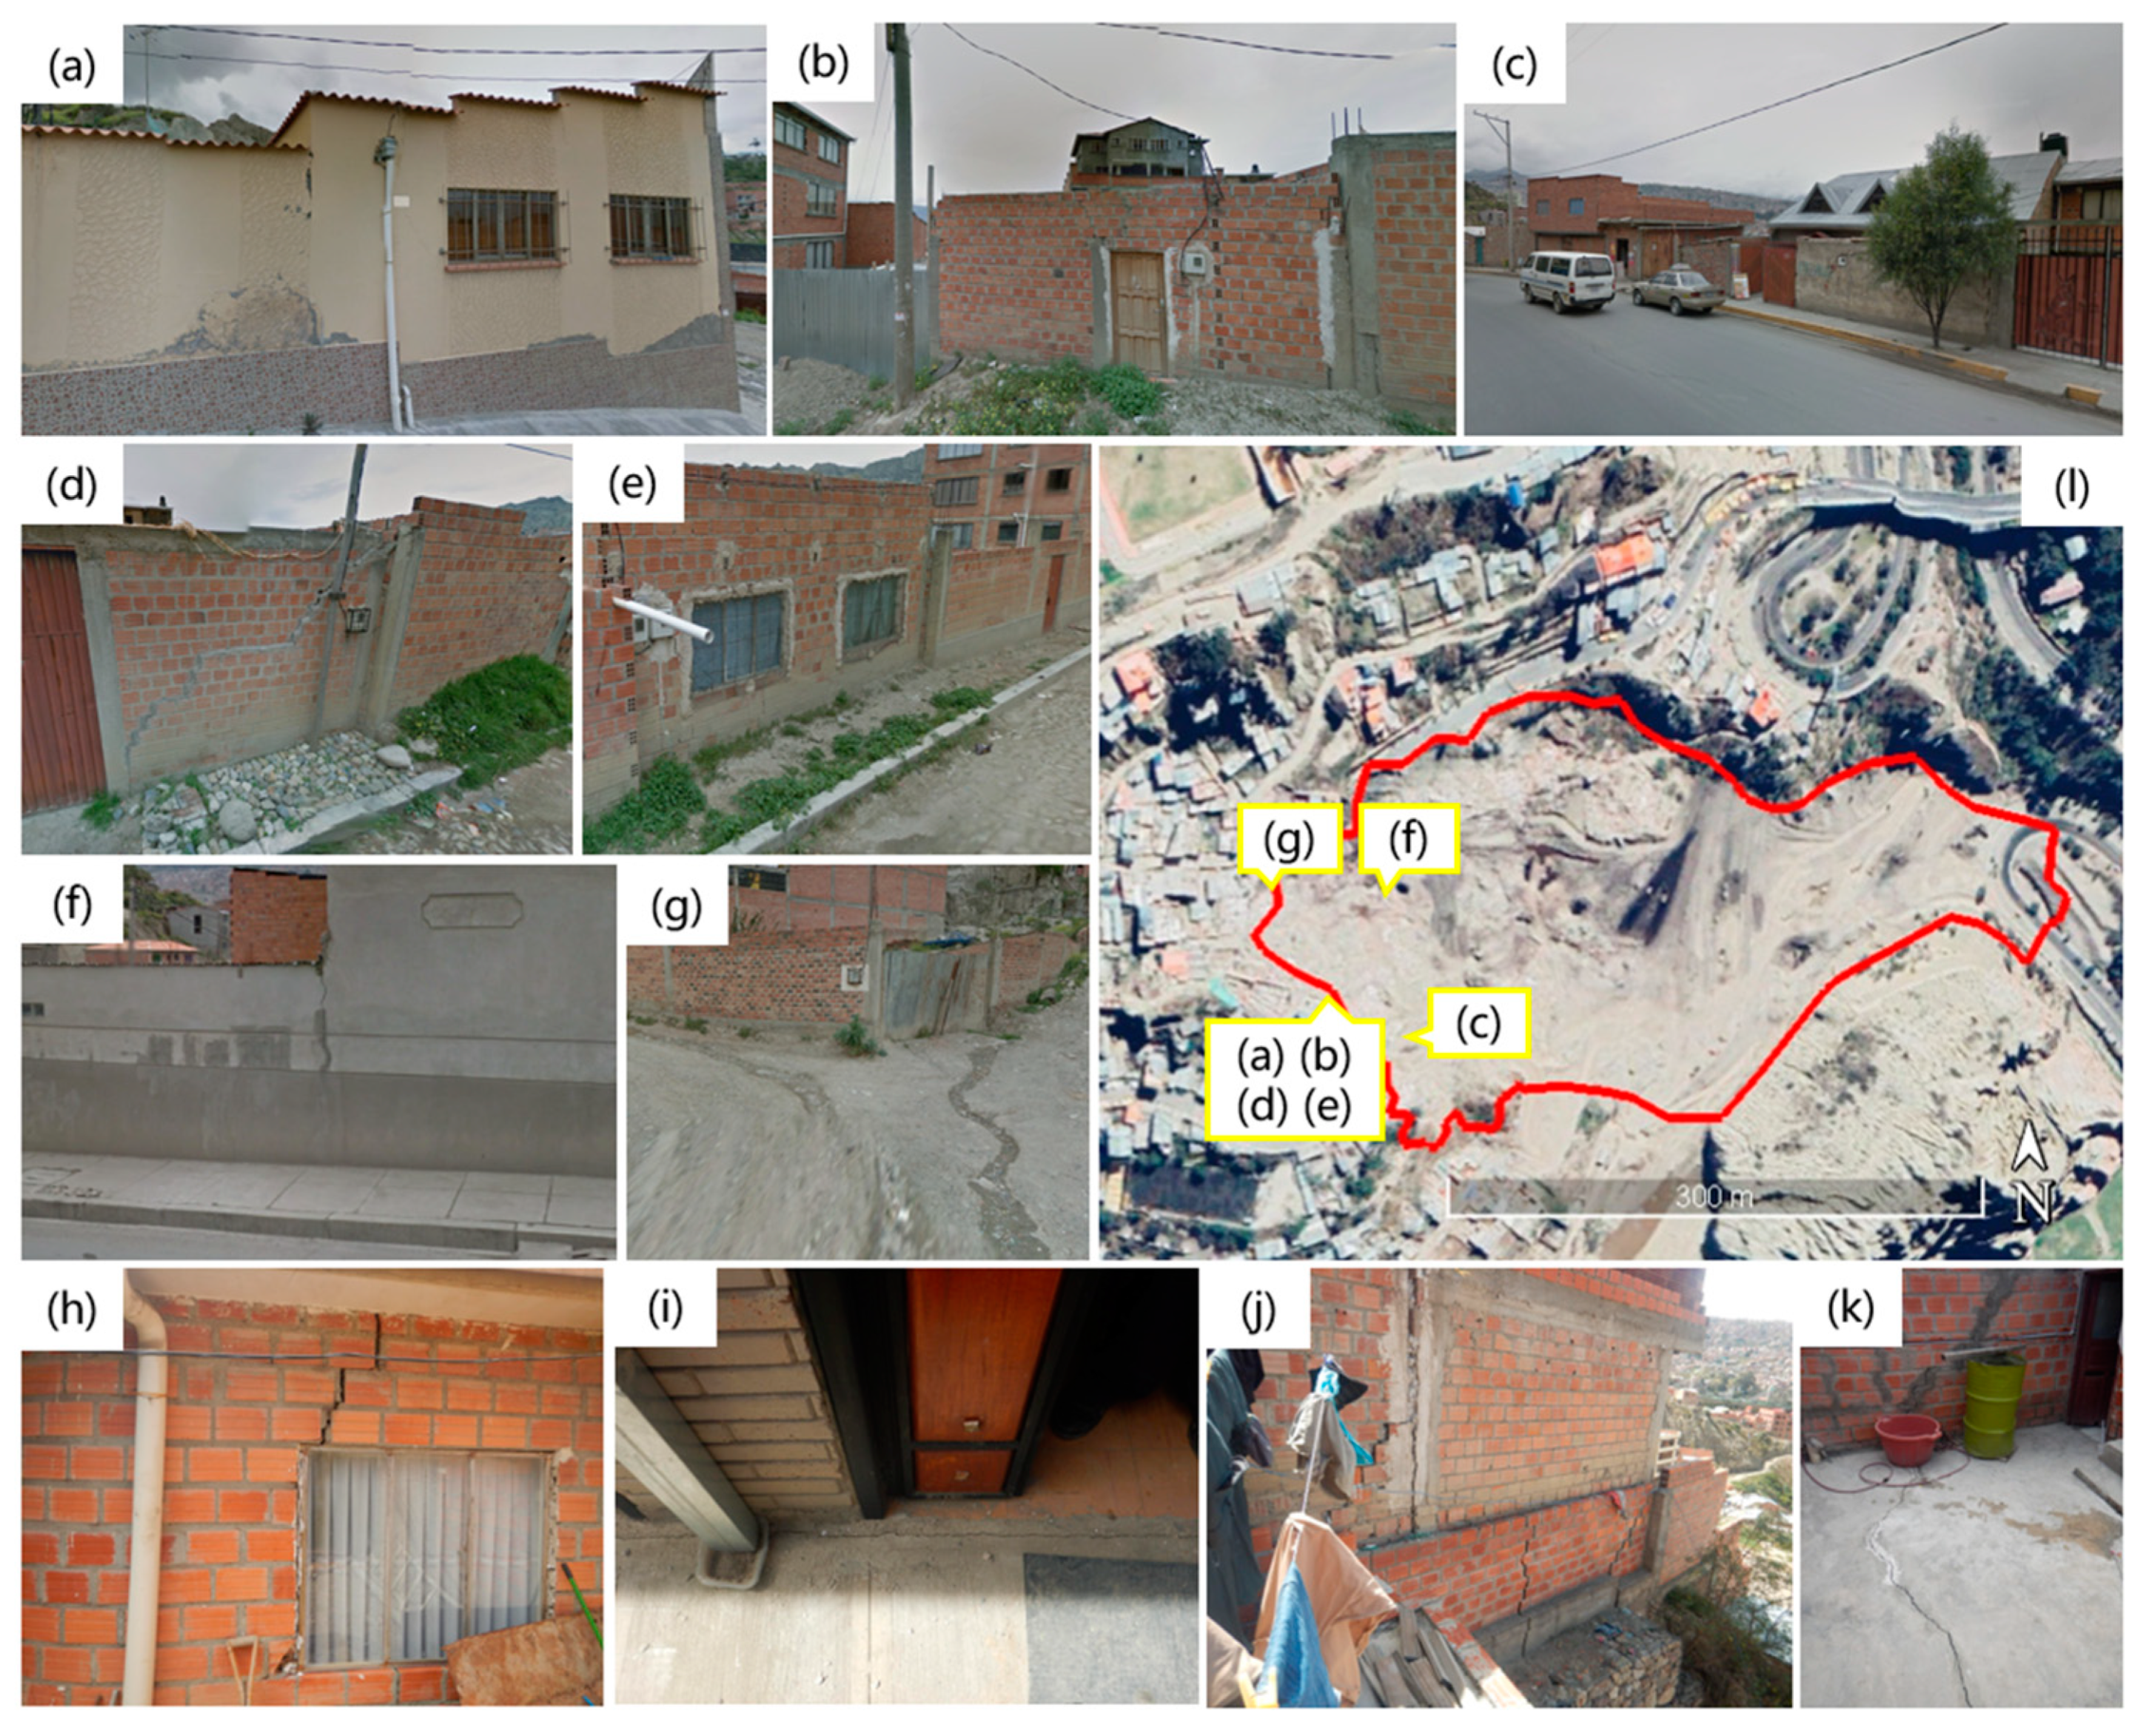
4.4. San Jorge Kantutani Landslide

The San Jorge Kantutani landslide was located on an east-facing slope. Figure 9 shows the velocity along the LOS, east–west, and vertical directions over the extracted PS/DS through the two-tier network DSInSAR processing over the landslide’s backscarp. Through DSInSAR and P-SBAS pre-failure processing, two relatively active deformation hotspots located on the northern and western sides of the future landslide-affected area that are clearly discriminated from the surrounding point targets can be observed mainly in the deformation map of the ascending geometry. The results of the DSInSAR processing show that before the final landslide, the maximum VLOS detected was −39.14 mm/year in the ascending geometry. However, with a reduced spatial resolution of only 90 m, the P-SBAS cannot represent the actual spatial distribution of the targets over the portion of the slope and the future landslide. We found that the maximum P-SBAS VLOS in a nearby area was −31.41 mm/year in the ascending geometry. It should be noted that such a velocity was recorded in the direction away from the satellite, which is consistent with the movement of the materials along the slope direction under the actual circumstances.
Figure 10 shows the deformation time series of selected points representing the pre-failure deformation of both MTInSAR methods of ascending geometry. At the end of February, as the rainy season was about to end, the creep velocity slowed down until it stabilized. This may indicate that as the precipitation reduced, the load over the Kantutani slope reached a relatively stable state. The earth became saturated and then no longer underwent creep. Later, the cut slope construction project that began in April caused the loss of support to the slope body, causing the first slide to occur on 27 April 2019. Finally, because of the intense rainfall on the morning of 30 April 2019, the water infiltrated into the sliding surface caused by the first slide that happened three days prior, leading to the eventual failure a few hours later. The trends of the results of both MTInSAR analyses are quite similar. Then, the 27 April 2019 landslide happened because of a collapse of the materials at the northern part of the landslide-affected area, followed by the collapse of the western part of the slope on 30 April 2019, causing the occurrence of the major landslide. Therefore, we were able to detect signals of deformation on the San Jorge Kantutani landslide before it collapsed on the 27 and 30 April 2019 using MTInSAR methods. For the descending geometry, the extracted point targets did not exhibit clear deformation features spatially. This could be because of the higher sensitivity of Sentinel-1 ascending data to the east-facing slope than the descending data; as for the descending geometry, the materials tended to move perpendicularly to the LOS direction [81,82].
The VV map revealed that the pre-failure VV of the three points detected on the future landslide’s backscarp were −21.32, −21.1, and −21.15 mm/year through the two-tier network DSInSAR processing. The VEW of the pre-failure analysis was not significant and could not be distinguished from the surrounding point targets. Further, the Vslope and VV revealed subsidence hotspots near the future backscarp of the landslide. However, the projected VV had a reduced spatial resolution that obscured the pre-failure signal of the northern backscarp because we applied a nearest-neighbor-based algorithm to merge the PS/DS targets of the ascending and descending geometries, and the size of the searching window was set to 40 m. The maximum Vslope over the northern backscarp was −54.54 mm/year and −46.48 mm/year on the western backscarp. The spatial distribution of the subsidence hotspots of both the Vslope and VV were similar, which can explain that the pre-failure signal was mainly on the vertical direction of the Kantutani landfill, rather than like the earthflows of natural processes along the horizontal directions in La Paz.
Using Google Maps Street View images collected in March 2015 (Figure 11a,c,e) and pictures of the landslide from social media (Figure 11b,d,f), construction work on houses near the backscarp of the landslide continued over the years. Such activities increased the mass of the slope and played a long-term role in triggering the landslide. Figure 12a–g are screenshots taken from Google Maps Street View and Figure 12h–k are images taken of houses nearby the Kantutani area after the landslide by onsite geologists from GAMLP. Figure 12a–g and Figure 12h–k show cracks in the walls and roads and of the landslide-affected area, and Figure 12g shows the lack of a well-planned underground drainage system for the site. (l) is indicates the locations where Figure 12a–g were taken. Because of privacy reasons, the locations of Figure 12h–k are not presented in this work.
From the post-failure analysis of the DSInSAR processing, the results still show clear subsidence signals near the north and west backscarps of the San Jorge Kantutani landslide. This indicates that the slope of the Kantutani landfill was still not stabilized after the major landslide that occurred on 30 April 2019. The post-failure Vslope of the northern scarp was −35.54 mm/year and the western scarp was −21.72 mm/year. We then performed natural neighbor spatial interpolation to the pre- and post-failure Vslope results, combining both the ascending and descending geometries (Figure 13). Multiple clear deformation hotspots and their changes over time can be discriminated in this area through the interpolation results. The DSInSAR processing also identified that the southwest direction of the San Jorge Kantutani landslide, as a potential geohazard-prone area, showed an increasing VV of −28.62 mm/year compared to the pre-failure velocity of −24.85 mm/year. Therefore, we considered that the deformation of the southwestern part of the Kantutani area may have accelerated under some circumstances similar to the triggering factors of the San Jorge Kantutani landslide. Based on these presented results, we believe that the occurrence of the slope failure relieved some of the pressure within the landfill, but there is still a considerable risk of landslides in the same area. Onsite investigations, sampling, and geotechnical lab experiments are needed to determine whether this risk comes from the ongoing instability of the landfill or the paleo-landslide in the Cotahuma area.

5. Discussion

Here in this paper, the objective of using SAR change detection approaches to map the landslide-affected area of the San Jorge Kantutani landslide that occurred in April 2019 in La Paz, Bolivia, was achieved. The capability of utilizing the texture change of the SAR amplitude data was proven in assisting in the mapping of landslides that cause land cover change when optical remote sensing data are not available. The COSMO-SkyMed data showed a stronger capability to map landslides thanks to their higher spatial resolution of 3 by 3 m compared to Sentinel-1. No significant graphic features that could be interpreted as landslide-affected areas in the results using the Sentinel-1 data were observed. Although X-band COSMO-SkyMed or TerraSAR-X has higher spatial resolution than C-band Sentinel-1 data, the larger frame width, more regular revisit period, and better accessibility of Sentinel-1 have made Sentinel-1 amplitude data have better mapping capabilities in landslides that induce land cover and their texture change at greater scales, such as larger landslides caused by volcano eruptions, debris flow, snow avalanches, and earthquakes using change detection approaches [25,83,84,85].
Based on the MTInSAR analyses, ground deformation maps of La Paz city were generated over time. With a regular revisit interval of every 12 or even 6 days by the Sentinel-1 constellation, spaceborne MTInSAR is sufficient to identify early signals of ground deformation events, especially landslides, over a large area, which has been validated in many studies, as well as in this study [86,87,88]. Among the factors applied in the urban geological hazards map were geotechnical factors including soil moisture and groundwater level which, altered by the extreme precipitation events and, on the other hand, human activities, including unplanned construction works and habits of the residents, can vary significantly over time, and then influence the ground deformation essentially. Compared with the pointwise GNSS, MTInSAR can provide spatially continuous observations. Furthermore, based on the MTInSAR measurements in La Paz, the large area of ground deformation and the large quantity of deformation hotspots would increase the cost of GNSS monitoring. Hence, using MTInSAR methods, an urban geological hazards map of La Paz could be updated regularly. The time series of the PS/DS targets in some areas were then examined, as they were labeled as geohazard-prone areas in the 2011 official geological risk map, but we did not find obvious subsidence signals from the time series.
In addition, the two-tier network DSInSAR method was mainly utilized to evaluate the pre- and post-failure creep of the landslide-affected area following the occurrence of the San Jorge Kantutani landslide in April 2019. The deformation results clearly revealed that the initial subsidence detected along the slope direction of the northern and western backscarps of the Kantutani landfill site was the primary geotechnical cause of the landslide. Spatially, their deformation features were clearly discriminated from the surrounding areas and verified by the onsite observation of the failure mechanism by the geologists. Furthermore, the pre-failure creep signals were present from July 2018, nine months prior to the landslide.
The post-failure analysis of a landslide is crucial for gaining an in-depth understanding of the underlying causes and contributing factors in order to prevent similar occurrences in the future. It is often observed that slopes where landslides have occurred previously often show intensified post-failure activities. The post-failure analysis using SAR interferometry shall be initiated after checking the landslide deposit removal work of the San Jorge Kantutani landslide to maintain the density of the PS/DS targets over the landslide-affected area, as the backscattering characteristics of the point targets of the landslide-affected area had been altered significantly because of the landslide and the landslide deposit removal work. From the results of the post-failure analyses, the landslide-affected area still shows a clear deformation trend referring to the potential slope instability from its old scarps to the north and west. Further analyses using this two-tier network DSInSAR method have revealed a slight acceleration trend in the southwestern area of the Kantutani landfill, which was not affected by the landslide before. This phenomenon could be attributed to the removal of landfill materials caused by the landslide, leaving no material to prevent the backscarp earth in the southwest direction from sliding rotationally. In the future, more historical Sentinel-1 data are hoped to be utilized for MTInSAR analyses to reconstruct the deformation trend of the slope over a longer period of time to better study the deformation characteristics of this landfill area and also to examine the effectiveness of the DSInSAR method in La Paz city. Also, when applying the MTInSAR processing to landslides and regional ground deformation monitoring, it is crucial to project the displacement along the LOS direction into up–down, east–west, or slope directions to better reconstruct the landslide motion in time series. This allows for a more detailed analysis of the actual displacement in different directions while the SAR data of both ascending and descending geometries are available.
The velocity of the P-SBAS processing results was re-estimated using the displacement time series as the P-SBAS results cover a longer time span (June 2017 to May 2021) than the processing results of the two-tier network DSInSAR (June 2018 to June 2020) and then it reduced the spatial resolution of the two-tier network DSInSAR processing into P-SBAS using natural neighbor interpolation. Correlation analyses were performed for the velocity results generated using the two MTInSAR methods in this work (Figure 14), and it was found that the monitoring results of the two methods were consistent and the correlation coefficient of the velocity results of the ascending geometry was higher than the descending results. However, because of the different processing methods and procedures, the range of the deformation rate of the two-tier network DSInSAR processing was smaller than for the P-SBAS processing. It can be found from the result that the P-SBAS processing used a larger spatial filter (~90 m), which was significantly larger than that for the DSInSAR processing (~50 m), and the temporal filter for the DSInSAR processing was larger than that for the P-SBAS processing. The differences between these filters are that more point targets are maintained in the P-SBAS processing, which may cause a loss in the spatial–temporal correlation in the DSInSAR processing. This is also the reason why there are more “holes” that represent the spatial discontinuity in the DSInSAR processing results.
The heavy rainfall on the morning of 30 April 2019 quickly caused the secondary slide on the same day because of infiltration into the cracks caused by the first slide that occurred only three days prior. During the development phase of a potential landslide, slope failure, or the reactivation phase of an old landslide, the temporal interval at an hourly scale is too short for existing satellite sensors. Ground-Based SAR Interferometry (GBInSAR) methods can be applied to monitor landslide activity during the phase that requires fast sensing and response. GBInSAR provides continuous slope stability monitoring on site and minimizes the influence of the deformation results brought on by the APS, as GBInSAR systems are usually installed very close to the monitored targets (usually at ~4 km level). Although GBInSAR equipment is expensive compared to spaceborne MTInSAR monitoring, it can provide slope-wise deformation data when landslides are likely to occur. By combining GBInSAR with spaceborne MTInSAR systematically, we can take advantage of the low cost of MTInSAR in regional geohazard inventory and the high frequency and high precision of GBInSAR in real time [89].
In recent years, many works have applied the InSAR method in North American, European, and Asian countries, but only very few have focused on South American and African countries. The urgent need to study urban landslides in South America using the InSAR method is imminent. Online processing tools, such as GEP, LiCSAR [90], HyP3 [91], and others, will greatly assist in the research and application of InSAR in developing countries.
For the continuous monitoring of the San Jorge Kantutani landfill, SAR remote sensing monitoring needs to be continuously carried out. The InSAR or SAR amplitude-based pixel offset tracking methods can only measure surface movements. Many studies tend to assume that the geotechnical and physicochemical properties of the materials in the landslide-affected area are spatially uniformed [9]. The design and operation of landfills requires the monitoring of stability due to the heterogenous components including liquid and even gas emissions due to long-term processes occurring for years underground. However, in this study, the changes in geotechnical factors induced by the physiochemical changes of the waste inside the landfill over time are unknown. The videos taken during the landslide showed that the soil inside the landfill was black and liquefied, which indicates that the earth originated from chemical changes in the buried waste under conditions of overpressure since the completion of the landfill in the 1980s, as it appears to have features clearly different from the surrounding geology. The geotechnical properties of this type of soil are not known, and it is uncertain whether it can ensure the slope stability of the original landslide and the southwestern part of the Kantutani area. Therefore, conducting field investigations and geotechnical experiments on the southwestern side of the slope to confirm these questions and further support the assessment of future landslide risk in the San Jorge Kantutani area is of crucial importance. It is also recommended to collect other geotechnical data, such as moisture content, fissures, shear strength, and effects caused by the landslide which may trigger the reactivation of the landslide after its first occurrence in April 2019. Together with the SAR analyses results, these data will help in the formulation of suitable models for slope stability reconstruction and then to plan geohazard mitigation works.

6. Conclusions

In this work, spaceborne SAR imagery was utilized to analyze the San Jorge Kantutani landfill landslide that was directly triggered by persistent precipitation at the end of April 2019 in La Paz, Bolivia. First, the affected area was delineated using SAR change detection approaches with multisource SAR data. The results show that the high-resolution X-band COSMO-SkyMed SAR data were instrumental in the mapping of the landslide-affected area. The limited spatial resolution of 10 m is likely the reason why the C-band Sentinel-1 amplitude data failed in the landslide-affected area mapping in this study. Then, a longtime series of the C-band Sentinel-1 data was analyzed with MTInSAR algorithms. The time series of deformation and its spatial distribution of both pre- and post-failure phases have shown significant deformation signals that can be regarded as precursors of slope failure. Combined with high-resolution optical remote sensing imagery and pictures taken onsite, the precursors of the landslide were better interpreted. It is recommended to collect geotechnical and geophysical data, as many factors may have been altered by the slope failure in April 2019.
For the regional scale monitoring, multiple subsidence hotspots in the study area were identified and then analyzed. Deformation records along the LOS direction of the ascending and descending geometries were projected along the up–down and east–west directions and it was found that, in La Paz city, compared to the ground subsidence or uplifting phenomena along the up–down direction, the slopes tend to creep more along the east–west directions. The P-SBAS generated a similar deformation spatial distribution and similar velocity to the DSInSAR method in this study.
MTInSAR has proven to be a very powerful instrument in urban planning and geohazard management on behalf of public administrations. As a future perspective, ground deformation analyses over extended periods are expected to be conducted periodically using various MTInSAR analyses in La Paz. These analyses will provide ground deformation information to help regularly update the official risk map, thanks to the regular revisit of Sentinel-1 data with a 12- or even 6-day frequency. Furthermore, the methodologies applied in this study can be extended to other emergency applications of civil protection activities or to places where high-resolution optical images are temporarily unavailable during the assessment.

Author Contributions

M.S. designed the work, analyzed the data, and wrote the manuscript; M.D.S. provided the concept, co-designed the work, and reviewed the manuscript; F.R. reviewed the manuscript; A.C. provided the onsite information and data; N.C. supervised this project. All authors have read and agreed to the published version of the manuscript.

Funding

This research received no external funding.

Data Availability Statement

The authors are willing to share the results of analyses upon personal request.

Acknowledgments

The authors would like to express their gratitude to the Italian Space Agency (ASI) for providing the COSMO-SkyMed data through Service Request ID 642091. We thank onsite geologist Sergio Fernando Iturri Urquizo from the Risk Management Unit of La Paz for providing the pictures collected during fieldwork. We also thank Peifeng Ma from the Institute of Space and Earth Information Science (ISEIS) of the Chinese University of Hong Kong (CUHK) for providing access to the InSAR processing algorithm. Additionally, we extend our thanks to Terradue, the operator of the Geohazards Exploitation Platform (GEP), for providing access to P-SBAS. We appreciate the valuable suggestions from anonymous reviewers for improving the quality of the manuscript.

Conflicts of Interest

The authors declare no conflict of interest.

References

  1. Cutter, S.L. Vulnerability to Environmental Hazards. Prog. Hum. Geogr. 1996, 20, 529–539. [Google Scholar] [CrossRef]
  2. Zhou, N.Q.; Zhao, S. Urbanization Process and Induced Environmental Geological Hazards in China. Nat. Hazards 2013, 67, 797–810. [Google Scholar] [CrossRef]
  3. Cascini, L.; Bonnard, C.; Corominas, J.; Jibson, R.; Montero-Olarte, J. Landslide hazard and risk zoning for urban planning and development. In Landslide Risk Management; Hungr, O., Fell, R., Couture, R., Eberhardt, E., Eds.; Taylor and Francis: London, UK, 2005; pp. 199–235. [Google Scholar]
  4. Coe, J.; Michael, J.; Crovelli, R.; Savage, W.; Laprade, W.; Nashem, W. Probabilistic Assessment of Precipitation-Triggered Landslides Using Historical Records of Landslide Occurrence, Seattle, Washington. Environ. Eng. Geosci. 2004, 10, 103–122. [Google Scholar] [CrossRef]
  5. Notti, D.; Herrera, G.; Bianchini, S.; Meisina, C.; López-Davalillo, J.C.; Zucca, F. A Methodology for Improving Landslide PSI Data Analysis. Int. J. Remote Sens. 2014, 35, 2186–2214. [Google Scholar] [CrossRef]
  6. Vega, J.; Hidalgo, C. Quantitative Risk Assessment of Landslides Triggered by Earthquakes and Rainfall Based on Direct Costs of Urban Buildings. Geomorphology 2016, 273, 217–235. [Google Scholar] [CrossRef]
  7. Li, Y.; Wang, X.; Mao, H. Influence of Human Activity on Landslide Susceptibility Development in the Three Gorges Area. Nat. Hazards J. Int. Soc. Prev. Mitig. Nat. Hazards 2020, 104, 2115–2151. [Google Scholar] [CrossRef]
  8. Tomás, R.; Romero, R.; Mulas, J.; Marturià, J.J.; Mallorquí, J.J.; Lopez-Sanchez, J.M.; Herrera, G.; Gutiérrez, F.; González, P.J.; Fernández, J.; et al. Radar Interferometry Techniques for the Study of Ground Subsidence Phenomena: A Review of Practical Issues through Cases in Spain. Environ. Earth Sci. 2014, 71, 163–181. [Google Scholar] [CrossRef]
  9. Song, C.; Yu, C.; Li, Z.; Pazzi, V.; Del Soldato, M.; Cruz, A.; Utili, S. Landslide Geometry and Activity in Villa de La Independencia (Bolivia) Revealed by InSAR and Seismic Noise Measurements. Landslides 2021, 18, 2721–2737. [Google Scholar] [CrossRef]
  10. Barla, G.; Antolini, F.; Barla, M. Slope Stabilization in Difficult Conditions: The Case Study of a Debris Slide in NW Italian Alps. Landslides 2013, 10, 343–355. [Google Scholar] [CrossRef]
  11. Wei, Z.; Shang, Y.; Sun, H.; Xu, H.; Wang, D. The Effectiveness of a Drainage Tunnel in Increasing the Rainfall Threshold of a Deep-Seated Landslide. Landslides 2019, 16, 1731–1744. [Google Scholar] [CrossRef]
  12. Ma, P.; Cui, Y.; Wang, W.; Lin, H.; Zhang, Y. Coupling InSAR and Numerical Modeling for Characterizing Landslide Movements under Complex Loads in Urbanized Hillslopes. Landslides 2021, 18, 1611–1623. [Google Scholar] [CrossRef]
  13. Intrieri, E.; Raspini, F.; Fumagalli, A.; Lu, P.; Del Conte, S.; Farina, P.; Allievi, J.; Ferretti, A.; Casagli, N. The Maoxian Landslide as Seen from Space: Detecting Precursors of Failure with Sentinel-1 Data. Landslides 2018, 15, 123–133. [Google Scholar] [CrossRef]
  14. Mishra, V.; Jain, K. Satellite Based Assessment of Artificial Reservoir Induced Landslides in Data Scarce Environment: A Case Study of Baglihar Reservoir in India. J. Appl. Geophys. 2022, 205, 104754. [Google Scholar] [CrossRef]
  15. Zhou, C.; Cao, Y.; Hu, X.; Yin, K.; Wang, Y.; Catani, F. Enhanced Dynamic Landslide Hazard Mapping Using MT-InSAR Method in the Three Gorges Reservoir Area. Landslides 2022, 19, 1585–1597. [Google Scholar] [CrossRef]
  16. Wang, W.; Motagh, M.; Mirzaee, S.; Li, T.; Zhou, C.; Tang, H.; Roessner, S. The 21 July 2020 Shaziba Landslide in China: Results from Multi-Source Satellite Remote Sensing. Remote Sens. Environ. 2023, 295, 113669. [Google Scholar] [CrossRef]
  17. Ferretti, A.; Prati, C.; Rocca, F. Permanent Scatterers in SAR Interferometry. IEEE Trans. Geosci. Remote Sens. 2001, 39, 8–20. [Google Scholar] [CrossRef]
  18. Berardino, P.; Fornaro, G.; Lanari, R.; Sansosti, E. A New Algorithm for Surface Deformation Monitoring Based on Small Baseline Differential SAR Interferograms. IEEE Trans. Geosci. Remote Sens. 2002, 40, 2375–2383. [Google Scholar] [CrossRef]
  19. Hooper, A.; Zebker, H.; Segall, P.; Kampes, B. A New Method for Measuring Deformation on Volcanoes and Other Natural Terrains Using InSAR Persistent Scatterers. Geophys. Res. Lett. 2004, 31, 23. [Google Scholar] [CrossRef]
  20. Ferretti, A.; Fumagalli, A.; Novali, F.; Prati, C.; Rocca, F.; Rucci, A. A New Algorithm for Processing Interferometric Data-Stacks: SqueeSAR. IEEE Trans. Geosci. Remote Sens. 2011, 49, 3460–3470. [Google Scholar] [CrossRef]
  21. Lv, X.; Yazıcı, B.; Zeghal, M.; Bennett, V.; Abdoun, T. Joint-Scatterer Processing for Time-Series InSAR. IEEE Trans. Geosci. Remote Sens. 2014, 52, 7205–7221. [Google Scholar] [CrossRef]
  22. Dong, J.; Zhang, L.; Tang, M.; Liao, M.; Xu, Q.; Gong, J.; Ao, M. Mapping Landslide Surface Displacements with Time Series SAR Interferometry by Combining Persistent and Distributed Scatterers: A Case Study of Jiaju Landslide in Danba, China. Remote Sens. Environ. 2018, 205, 180–198. [Google Scholar] [CrossRef]
  23. Jiang, M.; Guarnieri, A.M. Distributed Scatterer Interferometry with the Refinement of Spatiotemporal Coherence. IEEE Trans. Geosci. Remote Sens. 2020, 58, 3977–3987. [Google Scholar] [CrossRef]
  24. Hooper, A.; Bekaert, D.; Spaans, K.; Arıkan, M. Recent Advances in SAR Interferometry Time Series Analysis for Measuring Crustal Deformation. Tectonophysics 2012, 514–517, 1–13. [Google Scholar] [CrossRef]
  25. Di Traglia, F.; Nolesini, T.; Intrieri, E.; Mugnai, F.; Leva, D.; Rosi, M.; Casagli, N. Review of Ten Years of Volcano Deformations Recorded by the Ground-Based InSAR Monitoring System at Stromboli Volcano: A Tool to Mitigate Volcano Flank Dynamics and Intense Volcanic Activity. Earth-Sci. Rev. 2014, 139, 317–335. [Google Scholar] [CrossRef]
  26. Dai, K.; Liu, G.; Li, Z.; Ma, D.; Wang, X.; Zhang, B.; Tang, J.; Li, G. Monitoring Highway Stability in Permafrost Regions with X-Band Temporary Scatterers Stacking InSAR. Sensors 2018, 18, 1876. [Google Scholar] [CrossRef]
  27. Raspini, F.; Bianchini, S.; Ciampalini, A.; Del Soldato, M.; Solari, L.; Novali, F.; Del Conte, S.; Rucci, A.; Ferretti, A.; Casagli, N. Continuous, Semi-Automatic Monitoring of Ground Deformation Using Sentinel-1 Satellites. Sci. Rep. 2018, 8, 7253. [Google Scholar] [CrossRef]
  28. Bischoff, C.A.; Ferretti, A.; Novali, F.; Uttini, A.; Giannico, C.; Meloni, F. Nationwide Deformation Monitoring with SqueeSAR® Using Sentinel-1 Data. Proc. Int. Assoc. Hydrol. Sci. 2020, 382, 31–37. [Google Scholar] [CrossRef]
  29. Confuorto, P.; Di Martire, D.; Centolanza, G.; Iglesias, R.; Mallorqui, J.J.; Novellino, A.; Plank, S.; Ramondini, M.; Thuro, K.; Calcaterra, D. Post-Failure Evolution Analysis of a Rainfall-Triggered Landslide by Multi-Temporal Interferometry SAR Approaches Integrated with Geotechnical Analysis. Remote Sens. Environ. 2017, 188, 51–72. [Google Scholar] [CrossRef]
  30. Yamaguchi, Y. Disaster Monitoring by Fully Polarimetric SAR Data Acquired With ALOS-PALSAR. Proc. IEEE 2012, 100, 2851–2860. [Google Scholar] [CrossRef]
  31. White, R.G. Change Detection in SAR Imagery. Int. J. Remote Sens. 1991, 12, 339–360. [Google Scholar] [CrossRef]
  32. Rignot, E.J.M.; Van Zyl, J.J. Change Detection Techniques for ERS-1 SAR Data. IEEE Trans. Geosci. Remote Sens. 1993, 31, 896–906. [Google Scholar] [CrossRef]
  33. Plank, S.; Twele, A.; Martinis, S. Landslide Mapping in Vegetated Areas Using Change Detection Based on Optical and Polarimetric SAR Data. Remote Sens. 2016, 8, 307. [Google Scholar] [CrossRef]
  34. Di Traglia, F.; Nolesini, T.; Ciampalini, A.; Solari, L.; Frodella, W.; Bellotti, F.; Fumagalli, A.; De Rosa, G.; Casagli, N. Tracking Morphological Changes and Slope Instability Using Spaceborne and Ground-Based SAR Data. Geomorphology 2018, 300, 95–112. [Google Scholar] [CrossRef]
  35. Handwerger, A.L.; Jones, S.Y.; Huang, M.-H.; Amatya, P.; Kerner, H.R.; Kirschbaum, D.B. Rapid Landslide Identification Using Synthetic Aperture Radar Amplitude Change Detection on the Google Earth Engine. Nat. Hazards Earth Syst. Sci. Discuss. 2020, 2020, 1–24. [Google Scholar] [CrossRef]
  36. Euillades, P.; Euillades, L.; Pepe, A.; Mastro, P.; Falabella, F.; Imperatore, P.; Tang, Y.; Rosell, P. Recent Advancements in Multi-Temporal Methods Applied to New Generation SAR Systems and Applications in South America. J. South Am. Earth Sci. 2021, 111, 103410. [Google Scholar] [CrossRef]
  37. Pazzi, V.; Del Soldato, M.; Song, C.; Yu, C.; Li, Z.; Cruz, A.; Utili, S. InSAR, Seismic Noise, and Geotechnical Data to Assess Landslide Activity and Geometry: The Villa de Independencia (Cochabamba, Bolivia) Case Study. In Proceedings of the vvEGU21, the 23rd EGU General Assembly, Online, 19–30 April 2021. EGU21-12300. [Google Scholar] [CrossRef]
  38. Cigna, F.; Tapete, D. Sentinel-1 Big Data Processing with P-SBAS InSAR in the Geohazards Exploitation Platform: An Experiment on Coastal Land Subsidence and Landslides in Italy. Remote Sens. 2021, 13, 885. [Google Scholar] [CrossRef]
  39. Wu, P.-C.; Wei, M.; D’Hondt, S. Subsidence in Coastal Cities throughout the World Observed by InSAR. Geophys. Res. Lett. 2022, 49, e2022GL098477. [Google Scholar] [CrossRef]
  40. Nathan, F. Risk Perception, Risk Management and Vulnerability to Landslides in the Hill Slopes in the City of La Paz, Bolivia. A Preliminary Statement. Disasters 2008, 32, 337–357. [Google Scholar] [CrossRef]
  41. Hermanns, R.; Dehls, J.; Guzman, M.; Roberts, N.; Clague, J.; Cazas, S.A.; Quenta, Q.G. Relation of Recent Megalandslides to Prehistoric Events in the City of La Paz, Bolivia. In Proceedings of the 2nd North American Symposium on Landslides, Banff, AB, Canada, 3–8 June 2012; pp. 265–271. [Google Scholar]
  42. Roberts, N.J.; Rabus, B.T.; Clague, J.J.; Hermanns, R.L.; Guzmán, M.-A.; Minaya, E. Changes in Ground Deformation Prior to and Following a Large Urban Landslide in La Paz, Bolivia, Revealed by Advanced InSAR. Nat. Hazards Earth Syst. Sci. 2019, 19, 679–696. [Google Scholar] [CrossRef]
  43. Huang Lin, C.; Liu, D.; Liu, G. Landslide Detection in La Paz City (Bolivia) Based on Time Series Analysis of InSAR Data. Int. J. Remote Sens. 2019, 40, 6775–6795. [Google Scholar] [CrossRef]
  44. Casu, F.; Elefante, S.; Imperatore, P.; Zinno, I.; Manunta, M.; De Luca, C.; Lanari, R. SBAS-DInSAR Parallel Processing for Deformation Time-Series Computation. IEEE J. Sel. Top. Appl. Earth Obs. Remote Sens. 2014, 7, 3285–3296. [Google Scholar] [CrossRef]
  45. Zinno, I.; Elefante, S.; Mossucca, L.; De Luca, C.; Manunta, M.; Terzo, O.; Lanari, R.; Casu, F. A First Assessment of the P-SBAS DInSAR Algorithm Performances within a Cloud Computing Environment. IEEE J. Sel. Top. Appl. Earth Obs. Remote Sens. 2015, 8, 4675–4686. [Google Scholar] [CrossRef]
  46. Manunta, M.; De Luca, C.; Zinno, I.; Casu, F.; Manzo, M.; Bonano, M.; Fusco, A.; Pepe, A.; Onorato, G.; Berardino, P.; et al. The Parallel SBAS Approach for Sentinel-1 Interferometric Wide Swath Deformation Time-Series Generation: Algorithm Description and Products Quality Assessment. IEEE Trans. Geosci. Remote Sens. 2019, 57, 6259–6281. [Google Scholar] [CrossRef]
  47. Ma, P.; Wang, W.; Zhang, B.; Wang, J.; Shi, G.; Huang, G.; Chen, F.; Jiang, L.; Lin, H. Remotely Sensing Large- and Small-Scale Ground Subsidence: A Case Study of the Guangdong–Hong Kong–Macao Greater Bay Area of China. Remote Sens. Environ. 2019, 232, 111282. [Google Scholar] [CrossRef]
  48. Forno, E.; Baudoin, M. Historia Natural de un Valle En Los Andes: La Paz; Instituto de Ecología Universidad Mayor de San Andrés: La Paz, Bolivia, 1991. [Google Scholar]
  49. Roberts, N.J. Late Cenozoic Geology of La Paz, Bolivia, and Its Relation to Landslide Activity. Available online: https://summit.sfu.ca/item/16449 (accessed on 1 October 2023).
  50. Roberts, N.J.; Rabus, B.; Hermanns, R.L.; Guzmán, M.-A.; Clague, J.J.; Minaya, E. Recent Landslide Activity in La Paz, Bolivia. In Landslide Science for a Safer Geoenvironment; Sassa, K., Canuti, P., Yin, Y., Eds.; Springer International Publishing: Cham, Switzerland, 2014; pp. 431–437. [Google Scholar]
  51. O’hare, G.; Rivas, S. The Landslide Hazard and Human Vulnerability in La Paz City, Bolivia. Geogr. J. 2005, 171, 239–258. [Google Scholar] [CrossRef]
  52. Quenta, Q.G.; Galarza, I.; Teran, N.; Hermanns, R.L.; Cazaz, A.; Garcia, H. Translational Landslide and Damming in the Allpacoma Valley, City of La Paz, Bolivia. Mov. Masa Región Andin. Guía Para Eval. Amenazas Proy. Multinac. Andino Geocienc. Para Las Comunidades Andin. Serv. Nac. Geol. Min. Santiago Chile Publ. Geológica Multinac. 2007, 4, 230–234. [Google Scholar]
  53. Cruden, D.M.; Varnes, D.J. Landslides: Investigation and Mitigation; Chapter 3-Landslide Types and Processes; Transportation Research Board Special Report; The National Academies of Sciences, Engineering, and Medicine: Washington, DC, USA, 1996. [Google Scholar]
  54. GAMLP. Informe Técnico: Recopilación Bibliográfica Características Geológicas Valle de la Paz Y Zona de Kantutani; GAMLP: La Paz, Bolivia, 2019. [Google Scholar]
  55. Aparicio-Effen, M.; Arana, I.; Aparicio, J.; Ocampo, M.; Roque, S.; Nagy, G. A Successful Early Warning System for Hydroclimatic Extreme Events: The Case of La Paz City Mega Landslide; Springer: Cham, Switzerland, 2018; pp. 241–264. ISBN 978-3-319-56945-1. [Google Scholar]
  56. Gran Deslizamiento En San Jorge-Kantutani Destruye Viviendas En La Paz. Available online: https://www.urgente.bo/noticia/gran-deslizamiento-en-san-jorge-kantutani-destruye-viviendas-en-la-paz (accessed on 1 August 2023).
  57. Mediante Ley El Concejo Municipal Refrenda Declaratoria de Alerta Roja En Área de Deslizamiento. Available online: https://www.concejomunicipal.bo/2019/05/08/mediante-ley-el-concejo-municipal-refrenda-declaratoria-de-alerta-roja-en-area-de-deslizamiento/ (accessed on 1 August 2023).
  58. El Deslizamiento En Kantutani Es El Tercero Más Grave; Declaran Desastre. Available online: https://www.lostiempos.com/actualidad/pais/20190502/deslizamiento-kantutani-es-tercero-mas-grave-declaran-desastre (accessed on 1 August 2023).
  59. Un Nuevo Deslizamiento Arrastra Varias Viviendas En Bajo LLojeta y Deja Dos Desaparecidos. Available online: https://www.radiointegracion.com/un-nuevo-deslizamiento-arrastra-varias-viviendas-en-bajo-llojeta-y-deja-dos-desaparecidos/ (accessed on 1 August 2023).
  60. Milillo, P.; Fielding, E.J.; Shulz, W.H.; Delbridge, B.; Burgmann, R. COSMO-SkyMed Spotlight Interferometry Over Rural Areas: The Slumgullion Landslide in Colorado, USA. IEEE J. Sel. Top. Appl. Earth Obs. Remote Sens. 2014, 7, 2919–2926. [Google Scholar] [CrossRef]
  61. Torres, R.; Snoeij, P.; Geudtner, D.; Bibby, D.; Davidson, M.; Attema, E.; Potin, P.; Rommen, B.; Floury, N.; Brown, M.; et al. GMES Sentinel-1 Mission. Remote Sens. Environ. 2012, 120, 9–24. [Google Scholar] [CrossRef]
  62. Morishita, Y.; Lazecky, M.; Wright, T.J.; Weiss, J.R.; Elliott, J.R.; Hooper, A. LiCSBAS: An Open-Source InSAR Time Series Analysis Package Integrated with the LiCSAR Automated Sentinel-1 InSAR Processor. Remote Sens. 2020, 12, 424. [Google Scholar] [CrossRef]
  63. ESA Copernicus Open Access Hub. Available online: https://scihub.copernicus.eu/dhus/#/home (accessed on 1 August 2023).
  64. Drusch, M.; Del Bello, U.; Carlier, S.; Colin, O.; Fernandez, V.; Gascon, F.; Hoersch, B.; Isola, C.; Laberinti, P.; Martimort, P.; et al. Sentinel-2: ESA’s Optical High-Resolution Mission for GMES Operational Services. Remote Sens. Environ. 2012, 120, 25–36. [Google Scholar] [CrossRef]
  65. Phiri, D.; Simwanda, M.; Salekin, S.; Nyirenda, V.R.; Murayama, Y.; Ranagalage, M. Sentinel-2 Data for Land Cover/Use Mapping: A Review. Remote Sens. 2020, 12, 2291. [Google Scholar] [CrossRef]
  66. Sentinel Hub. Available online: www.sentinel-hub.com (accessed on 1 August 2023).
  67. Gomes, V.C.F.; Queiroz, G.R.; Ferreira, K.R. An Overview of Platforms for Big Earth Observation Data Management and Analysis. Remote Sens. 2020, 12, 1253. [Google Scholar] [CrossRef]
  68. Wadge, G.; Scheuchl, B.; Stevens, N.F. Spaceborne Radar Measurements of the Eruption of Soufrière Hills Volcano, Montserrat. Geol. Soc. Lond. Mem. 2002, 21, 583–594. [Google Scholar] [CrossRef]
  69. Bignami, C.; Corradini, S.; Merucci, L.; de Michele, M.; Raucoules, D.; De Astis, G.; Stramondo, S.; Piedra, J. Multisensor Satellite Monitoring of the 2011 Puyehue-Cordon Caulle Eruption. IEEE J. Sel. Top. Appl. Earth Obs. Remote Sens. 2014, 7, 2786–2796. [Google Scholar] [CrossRef]
  70. Misra, A.; Balaji, R. Simple Approaches to Oil Spill Detection Using Sentinel Application Platform (SNAP)-Ocean Application Tools and Texture Analysis: A Comparative Study. J. Indian Soc. Remote Sens. 2017, 45, 1065–1075. [Google Scholar] [CrossRef]
  71. Numbisi, F.N.; Van Coillie, F.M.B.; De Wulf, R. Delineation of Cocoa Agroforests Using Multiseason Sentinel-1 SAR Images: A Low Grey Level Range Reduces Uncertainties in GLCM Texture-Based Mapping. ISPRS Int. J. Geo-Inf. 2019, 8, 179. [Google Scholar] [CrossRef]
  72. Haralick, R.M.; Shanmugam, K.; Dinstein, I. Textural Features for Image Classification. IEEE Trans. Syst. Man Cybern. 1973, 6, 610–621. [Google Scholar] [CrossRef]
  73. Zhang, B.; Wang, R.; Deng, Y.; Ma, P.; Lin, H.; Wang, J. Mapping the Yellow River Delta Land Subsidence with Multitemporal SAR Interferometry by Exploiting Both Persistent and Distributed Scatterers. ISPRS J. Photogramm. Remote Sens. 2019, 148, 157–173. [Google Scholar] [CrossRef]
  74. Yu, C.; Penna, N.T.; Li, Z. Generation of Real-Time Mode High-Resolution Water Vapor Fields from GPS Observations. J. Geophys. Res. Atmos. 2017, 122, 2008–2025. [Google Scholar] [CrossRef]
  75. Yu, C.; Li, Z.; Penna, N.T.; Crippa, P. Generic Atmospheric Correction Model for Interferometric Synthetic Aperture Radar Observations. J. Geophys. Res. Solid Earth 2018, 123, 9202–9222. [Google Scholar] [CrossRef]
  76. Yu, C.; Li, Z.; Penna, N.T. Interferometric Synthetic Aperture Radar Atmospheric Correction Using a GPS-Based Iterative Tropospheric Decomposition Model. Remote Sens. Environ. 2018, 204, 109–121. [Google Scholar] [CrossRef]
  77. Wright, T.J.; Parsons, B.E.; Lu, Z. Toward Mapping Surface Deformation in Three Dimensions Using InSAR. Geophys. Res. Lett. 2004, 31, 1. [Google Scholar] [CrossRef]
  78. Geohazards TEP. Available online: https://geohazards-tep.eu/ (accessed on 1 August 2023).
  79. De Luca, C.; Cuccu, R.; Elefante, S.; Zinno, I.; Manunta, M.; Casola, V.; Rivolta, G.; Lanari, R.; Casu, F. An On-Demand Web Tool for the Unsupervised Retrieval of Earth’s Surface Deformation from SAR Data: The P-SBAS Service within the ESA G-POD Environment. Remote Sens. 2015, 7, 15630–15650. [Google Scholar] [CrossRef]
  80. Foumelis, M.; Papadopoulou, T.; Bally, P.; Pacini, F.; Provost, F.; Patruno, J. Monitoring Geohazards Using On-Demand and Systematic Services on Esa’s Geohazards Exploitation Platform. In Proceedings of the IGARSS 2019—2019 IEEE International Geoscience and Remote Sensing Symposium, Yokohama, Japan, 28 July–2 August 2019; pp. 5457–5460. [Google Scholar]
  81. Wasowski, J.; Bovenga, F. Investigating Landslides and Unstable Slopes with Satellite Multi Temporal Interferometry: Current Issues and Future Perspectives. Eng. Geol. 2014, 174, 103–138. [Google Scholar] [CrossRef]
  82. Dai, K.; Deng, J.; Xu, Q.; Li, Z.; Shi, X.; Hancock, C.; Wen, N.; Zhang, L.; Zhuo, G. Interpretation and Sensitivity Analysis of the InSAR Line of Sight Displacements in Landslide Measurements. GISci. Remote Sens. 2022, 59, 1226–1242. [Google Scholar] [CrossRef]
  83. Eckerstorfer, M.; Malnes, E.; Müller, K. A Complete Snow Avalanche Activity Record from a Norwegian Forecasting Region Using Sentinel-1 Satellite-Radar Data. Cold Reg. Sci. Technol. 2017, 144, 39–51. [Google Scholar] [CrossRef]
  84. Mondini, A.C.; Santangelo, M.; Rocchetti, M.; Rossetto, E.; Manconi, A.; Monserrat, O. Sentinel-1 SAR Amplitude Imagery for Rapid Landslide Detection. Remote Sens. 2019, 11, 760. [Google Scholar] [CrossRef]
  85. Handwerger, A.L.; Huang, M.-H.; Jones, S.Y.; Amatya, P.; Kerner, H.R.; Kirschbaum, D.B. Generating Landslide Density Heatmaps for Rapid Detection Using Open-Access Satellite Radar Data in Google Earth Engine. Nat. Hazards Earth Syst. Sci. 2022, 22, 753–773. [Google Scholar] [CrossRef]
  86. Zhao, R.; Li, Z.; Feng, G.; Wang, Q.; Hu, J. Monitoring Surface Deformation over Permafrost with an Improved SBAS-InSAR Algorithm: With Emphasis on Climatic Factors Modeling. Remote Sens. Environ. 2016, 184, 276–287. [Google Scholar] [CrossRef]
  87. Bianchini, S.; Raspini, F.; Solari, L.; Del Soldato, M.; Ciampalini, A.; Rosi, A.; Casagli, N. From Picture to Movie: Twenty Years of Ground Deformation Recording Over Tuscany Region (Italy) With Satellite InSAR. Front. Earth Sci. 2018, 6, 177. [Google Scholar] [CrossRef]
  88. Kang, Y.; Lu, Z.; Zhao, C.; Xu, Y.; Kim, J.; Gallegos, A.J. InSAR Monitoring of Creeping Landslides in Mountainous Regions: A Case Study in Eldorado National Forest, California. Remote Sens. Environ. 2021, 258, 112400. [Google Scholar] [CrossRef]
  89. Xiao, T.; Huang, W.; Deng, Y.; Tian, W.; Sha, Y. Long-Term and Emergency Monitoring of Zhongbao Landslide Using Space-Borne and Ground-Based InSAR. Remote Sens. 2021, 13, 1578. [Google Scholar] [CrossRef]
  90. Lazecký, M.; Spaans, K.; González, P.J.; Maghsoudi, Y.; Morishita, Y.; Albino, F.; Elliott, J.; Greenall, N.; Hatton, E.; Hooper, A.; et al. LiCSAR: An Automatic InSAR Tool for Measuring and Monitoring Tectonic and Volcanic Activity. Remote Sens. 2020, 12, 2430. [Google Scholar] [CrossRef]
  91. Hogenson, K.; Arko, S.A.; Buechler, B.; Hogenson, R.; Herrmann, J.; Geiger, A. Hybrid Pluggable Processing Pipeline (HyP3): A Cloud-Based Infrastructure for Generic Processing of SAR Data. In Proceedings of the AGU Fall Meeting Abstract, San Francisco, CA, USA, 12–16 December 2016. IN21B-1740. [Google Scholar]
Figure 1. Topography of La Paz and geolocation of the COSMO-SkyMed and Sentinel-1 data.
Remotesensing 15 05311 g001
Figure 2. Maps taken from Google Earth, showing the Kantutani area before and after the landslide. (a) was taken in April 2019, indicates the Kantutani area before the landslide occurred (b) shows the locations where the pictures in local news [56,57,58,59] were taken onsite, and the red polygon indicates the generated landslide-affected area using the presented method in the following context.
Remotesensing 15 05311 g002
Figure 3. Workflow of the SAR amplitude change detection.
Remotesensing 15 05311 g003
Figure 4. Workflow of the MTInSAR methods.
Remotesensing 15 05311 g004
Figure 5. The results of the landslide-affected area mapping using amplitude change detection approaches: (a) color composition of the pre- and post-failure COSMO-SkyMed sigma0 bands; (b) color composition of the COSMO-SkyMed GLCM variance feature; (cf) results of the Sentinel-1 GRD amplitude change detection approaches; (c,d) color composition of the pre- and post-failure sigma0 bands of the ascending and descending geometry, respectively; (e,f) color composition of the GLCM variance of the ascending and descending geometry, respectively. The red polygons refer to the landslide-affected area’s delineation results generated from the COSMO-SkyMed amplitude change detection results (a,b).
Remotesensing 15 05311 g005
Figure 6. Velocity results of the two-tier network DSInSAR analysis using Sentinel-1 data before and after the San Jorge Kantutani landslide in La Paz region, Bolivia: (a,e) ascending and (b,f) descending geometries; velocity projections along the (c,g) east–west and (d,h) up–down directions.
Remotesensing 15 05311 g006
Figure 7. Velocity results of the P-SBAS InSAR analysis using Sentinel-1 data: (a) ascending and (b) descending geometries before the San Jorge Kantutani landslide; (c) ascending and (d) descending geometries after the deposit removal process of the San Jorge Kantutani landslide in La Paz region, Bolivia, respectively.
Remotesensing 15 05311 g007
Figure 8. Deformation map and time series along east–west direction deformation hotspots and two-tier network DSInSAR displacement time series along east–west direction in La Paz. An increasing time series refers to an eastward movement and a decreasing time series refers to a westward movement.
Remotesensing 15 05311 g008
Figure 9. Pre-failure two-tier network DSInSAR over the Kantutani landslide: (a) VASC; (b) VDESC; (c) VEW; (d) VV.
Remotesensing 15 05311 g009
Figure 10. Selected pre-failure P-SBAS VAsc and two-tier network DSInSAR VAsc and VV time series on the backscarp of the landslide. The color circles refer to the color of the lines in the corresponding histogram to the right of the map.
Remotesensing 15 05311 g010
Figure 11. Screenshots taken from Google Maps Street View on the Puente Libertad Road and social media that represent the overload of the landfill caused by the construction work from March 2015 to April 2019. (a) refers to a 3-level building in 2015, and (b) refers to the collapsing building during the landslide. The building had 4 levels in 2019 compared to 3 levels in 2015. (c) refers to a brick wall and according to (d), the former brick wall had been replaced with a building and it collapsed with the two-level building on the left of the picture during the landslide. (e) refers to an unfinished building in 2015 and in (f) the construction had been finished in 2019.
Remotesensing 15 05311 g011
Figure 12. Screenshots taken from Google Maps Street View: (l) the locations of (ag). The locations where (hk) were taken are not presented because of privacy issues.
Remotesensing 15 05311 g012
Figure 13. Natural neighbor interpolation of the (a) pre- and (b) post-failure Vslope results around San Jorge Kantutani landfill in the eastern Cotahuma neighborhood.
Remotesensing 15 05311 g013
Figure 14. Cross-correlation results of the P-SBAS and the two-tier network DSInSAR processing. (a) pre-failure ascending MTInSAR results, (b) pre-failure descending MTInSAR results, (c) post-failure ascending MTInSAR results, (d) post-failure descending MTInSAR results.
Remotesensing 15 05311 g014
Table 1. Information on landslides that occurred in La Paz, Bolivia.
LocationDate of TriggeringAffectsExtent (km2)
Callapa, Pampahasi26 February 20111000 houses were destroyed, 2237 properties were affected and more than 6000 families have been relocated [43]1.5
Auquisamaña15 February 20175 houses were buried but no casualties were reported0.02
Kantutani30 April 201980 families were affected, 380 occupants were evacuated, no deaths, serious injuries, or disappearances were recorded0.09
Table 2. Information on the collected SAR amplitude images.
BandImaging ModePre-FailurePost-Failure Temporal
Interval
OrbitResolution
COSMO-SkyMedXStripmap HIMAGE23 April 20199 May 201916 daysAscending3 × 3 m
Sentinel-1CGRD23 April 20195 May 201912 daysAscending10 × 10 m
23 April 201916 May 201924 daysDescending
Table 3. Information on the collected Sentinel-1 SLC images used in the MTInSAR processing.
Pre-FailurePost-FailureOrbitNumber of ImagesResolution
Two-Tier Network DSInSARApril 2018 to April 2019June 2019 to June 2020Ascending69 (31 pre-failure,
38 post-failure)
40 × 50 m
April 2018 to April 2019June 2019 to June 2020Descending69 (31 pre-failure,
38 post-failure)
P-SBASApril 2017 to April 2019June 2019 to May 2021Ascending127 (66 pre-failure,
61 post-failure)
90 × 90 m
April 2017 to April 2019June 2019 to May 2021Descending137 (76 pre-failure,
61 post-failure)
Table 4. RGB color composition of the SAR amplitude change detection.
RedGreenBlue
Pre-failure calibrated amplitude sigma0Post-failure calibrated amplitude sigma0Pre-failure calibrated amplitude sigma0
Pre-event GLCM texture features with high PCA scoresPost-event GLCM texture features with high PCA scoresPre-event GLCM texture features with high PCA scores
Table 5. The PCA scores of the GLCM texture features of the COSMO-SkyMed and the Sentinel-1 GRD ascending and descending amplitude data. Only the three GLCM texture features with the highest PCA scores are listed.
COSMO-SkyMedSentinel-1 AscendingSentinel-1 Descending
Pre-FailurePost-FailurePre-FailurePost-FailurePre-FailurePost-Failure
GLCM variance653.83603.19166.51132.8560.1264.06
Contrast214.19214.94122.7596.4653.0757.72
GLCM mean31.1129.4312.1610.477.187.39
Table 6. Maximum velocity along different directions recorded among deformation hotspots in La Paz through MTInSAR pre-failure processing (mm/year).
Creep HotspotsOfficial Risk Map (2011)DSInSAR LOS
(mm/Year)
DSInSAR Projected
(mm/Year)
P-SBAS LOS
(mm/Year)
S-1 AscS-1 DescE-WU-DS-1 AscS-1 Desc
1Santa BarbaraVery High23.05−35.17−34.25−27.8520.23−22.47
2Urbanizacion 23 de MarzoVery High33.3−57.93−43.65−29.429.78−50.69
3Adela Zamuldio, CotahumaMixed−49.7213.3712.77−29.06−11.570.97
4Alpacoma and north of Achacalla BasinVery High−162.59/
55.62
−142.22/
77.12
−106.95/
150.61
−112.34−234.14/
52.7
−164.58/
158.25
5MallasaVery High−53.01−59.02−44.77−42.13−38.36−78.3
6HuantaquiVery High63.76−77.85−101.24−53.6873.9−93.38
7Alto SeguencomaMixed20.29−52.52−33.51−42.6615.59−41.57
8Villa ArmoniaVery High78.69−109.56−124.75−50.970.23−126.03
9CallapaVery High−132.4371.12150.98−81.87−124.3254.15
10Cota CotaVery High128.53−154.19−216.27−88.39171.10−177.46
Table 7. Maximum velocity along different directions recorded among deformation hotspots in La Paz through MTInSAR post-failure processing (mm/year).
Creep HotspotsOfficial Risk Map (2011)DSInSAR LOS
(mm/Year)
DSInSAR Projected
(mm/Year)
P-SBAS LOS
(mm/Year)
S-1 AscS-1 DescE-WU-DS-1 AscS-1 Desc
1Santa BarbaraVery High27.18−29.49−24−2410.88−21.27
2Urbanizacion 23 de MarzoVery High33.18−42.28−39.69−31.4425.61−41.87
3Adela Zamuldio, CotahumaMixed−14.219.3714.04−19.66−10.276.64
4Alpacoma and north of Achacalla BasinVery High−176.65/
45.38
−90.22/
87.34
−77.31/
186.61
−110.25−215.15/
44.5
−103.56/
74.48
5MallasaVery High−72.18−91−63.84−55.02−31.9−49.48
6HuantaquiVery High72.82−82.05−108.44−37.6377.7−93.27
7Alto SeguencomaMixed25.5−39.97−27.1−41.1210.26−37.41
8Villa ArmoniaVery High69.22−116.69−126.46−41.0955.88−86.88
9CallapaVery High−79.41101.07107.46−44.43−196.84125.94
10Cota CotaVery High138.18−127.75−200.58−88.73157.38−174.02
Disclaimer/Publisher’s Note: The statements, opinions and data contained in all publications are solely those of the individual author(s) and contributor(s) and not of MDPI and/or the editor(s). MDPI and/or the editor(s) disclaim responsibility for any injury to people or property resulting from any ideas, methods, instructions or products referred to in the content.

