

Study of Recent Deformations in the Bogotá Savanna and the City of Bogotá (Colombia) Using Multi-Temporal Satellite Radar Interferometry

 ,
,
Abstract
1. Introduction
2. Study Region
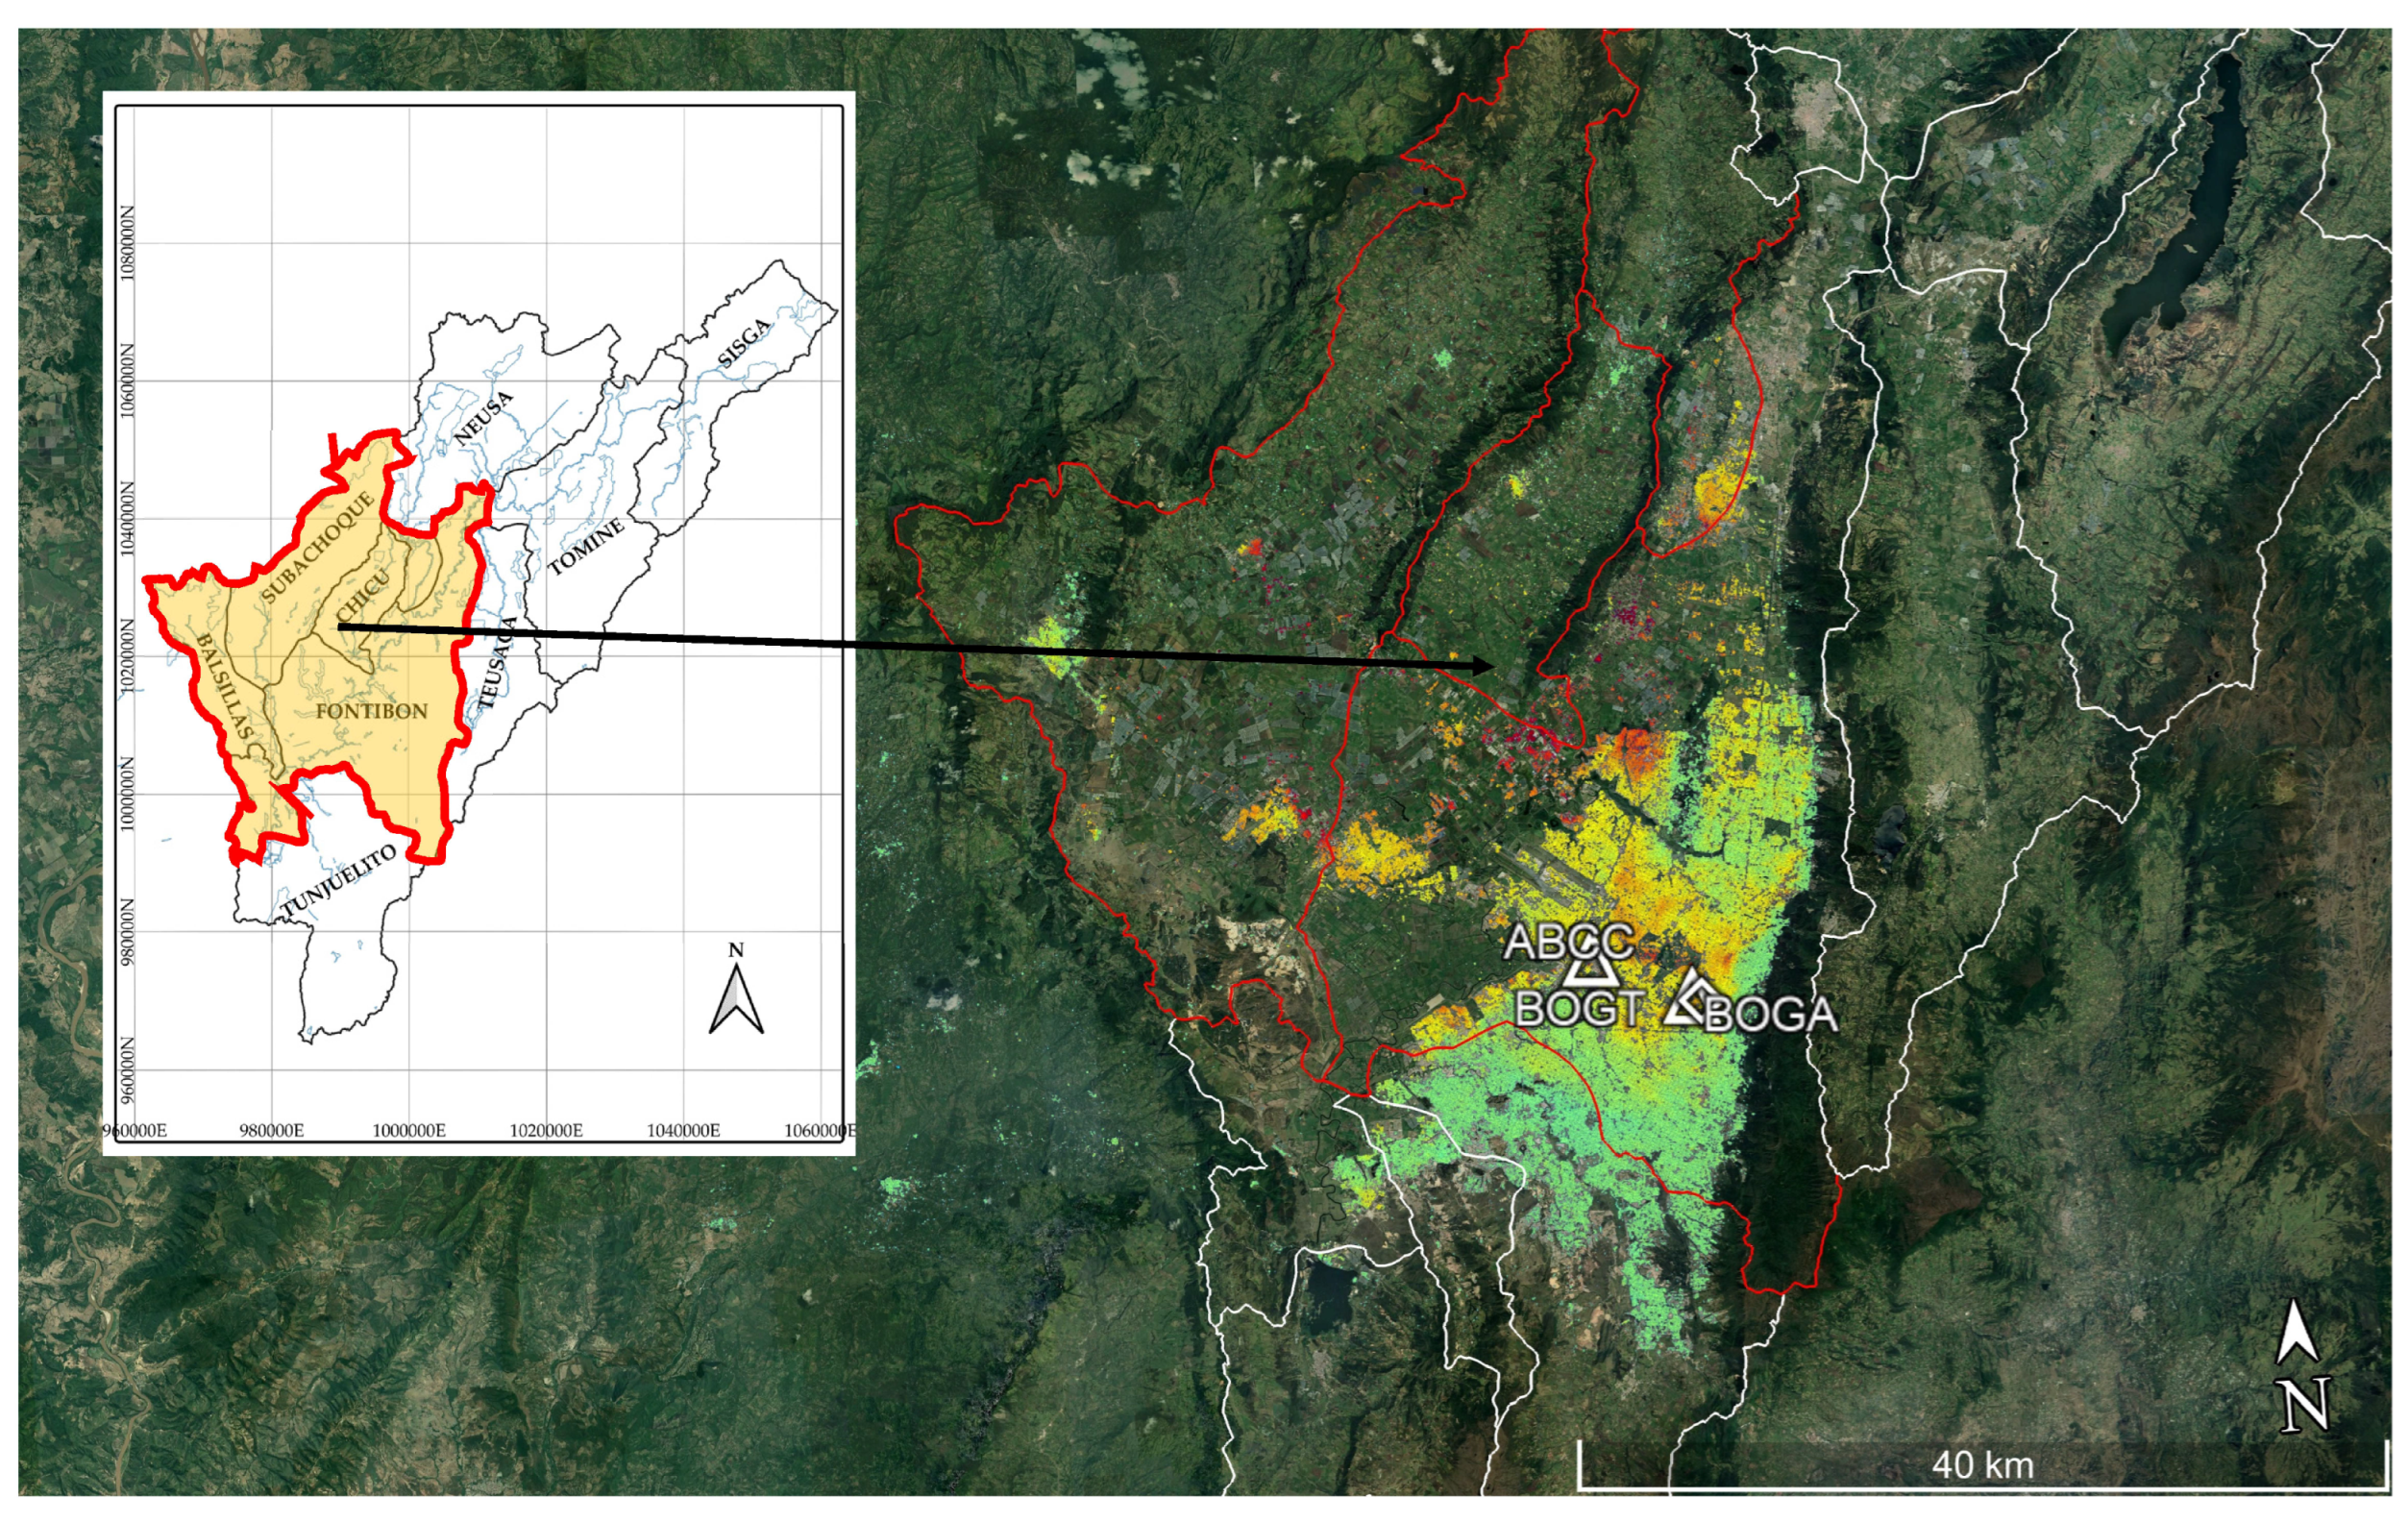
2.1. Bogotá Savanna
2.1.1. Geology of the Bogotá Savanna
- −
- Sabana Formation: Lacustrine deposits that emerge in the flat area made up mainly of clay and towards the margins of the organic, sandy clays and peat. It is in this deposit where the subsidence occurs.
- −
- Bogotá Formation: A sequence of thick banks of sandstones and claystones.
- −
- Cacho Formation: Conformed by grainy sandstones with some clay banks.
- −
- Guaduas Formation: Clay–sandy sequence with coal seams.
- −
- Labor-Tierna Formation: Very thick layers of sandstone interbedded with very thin layers of claystone.
- −
- Plaeners Formation: Conformed by claystones, lydites, siltstones, and, to a lesser extent, very-fine-grained sandstones.
- −
- Dura Sandstone: This unit is recognized by forming an abrupt morphology, derived from the lithology that is constituted mainly of sandstones with thicknesses up to 450 m.
- −
- Chipaque Formation: It is made up of pyrite schists with intercalations of lime sandstone, loose sandstone, and lime levels.
2.1.2. Hydrogeology of the Bogotá Savanna
2.2. Bogotá D.C.
2.2.1. Geology of Bogotá
2.2.2. Hydrogeology of Bogotá
3. Data and Methods
3.1. InSAR and GNSS Data
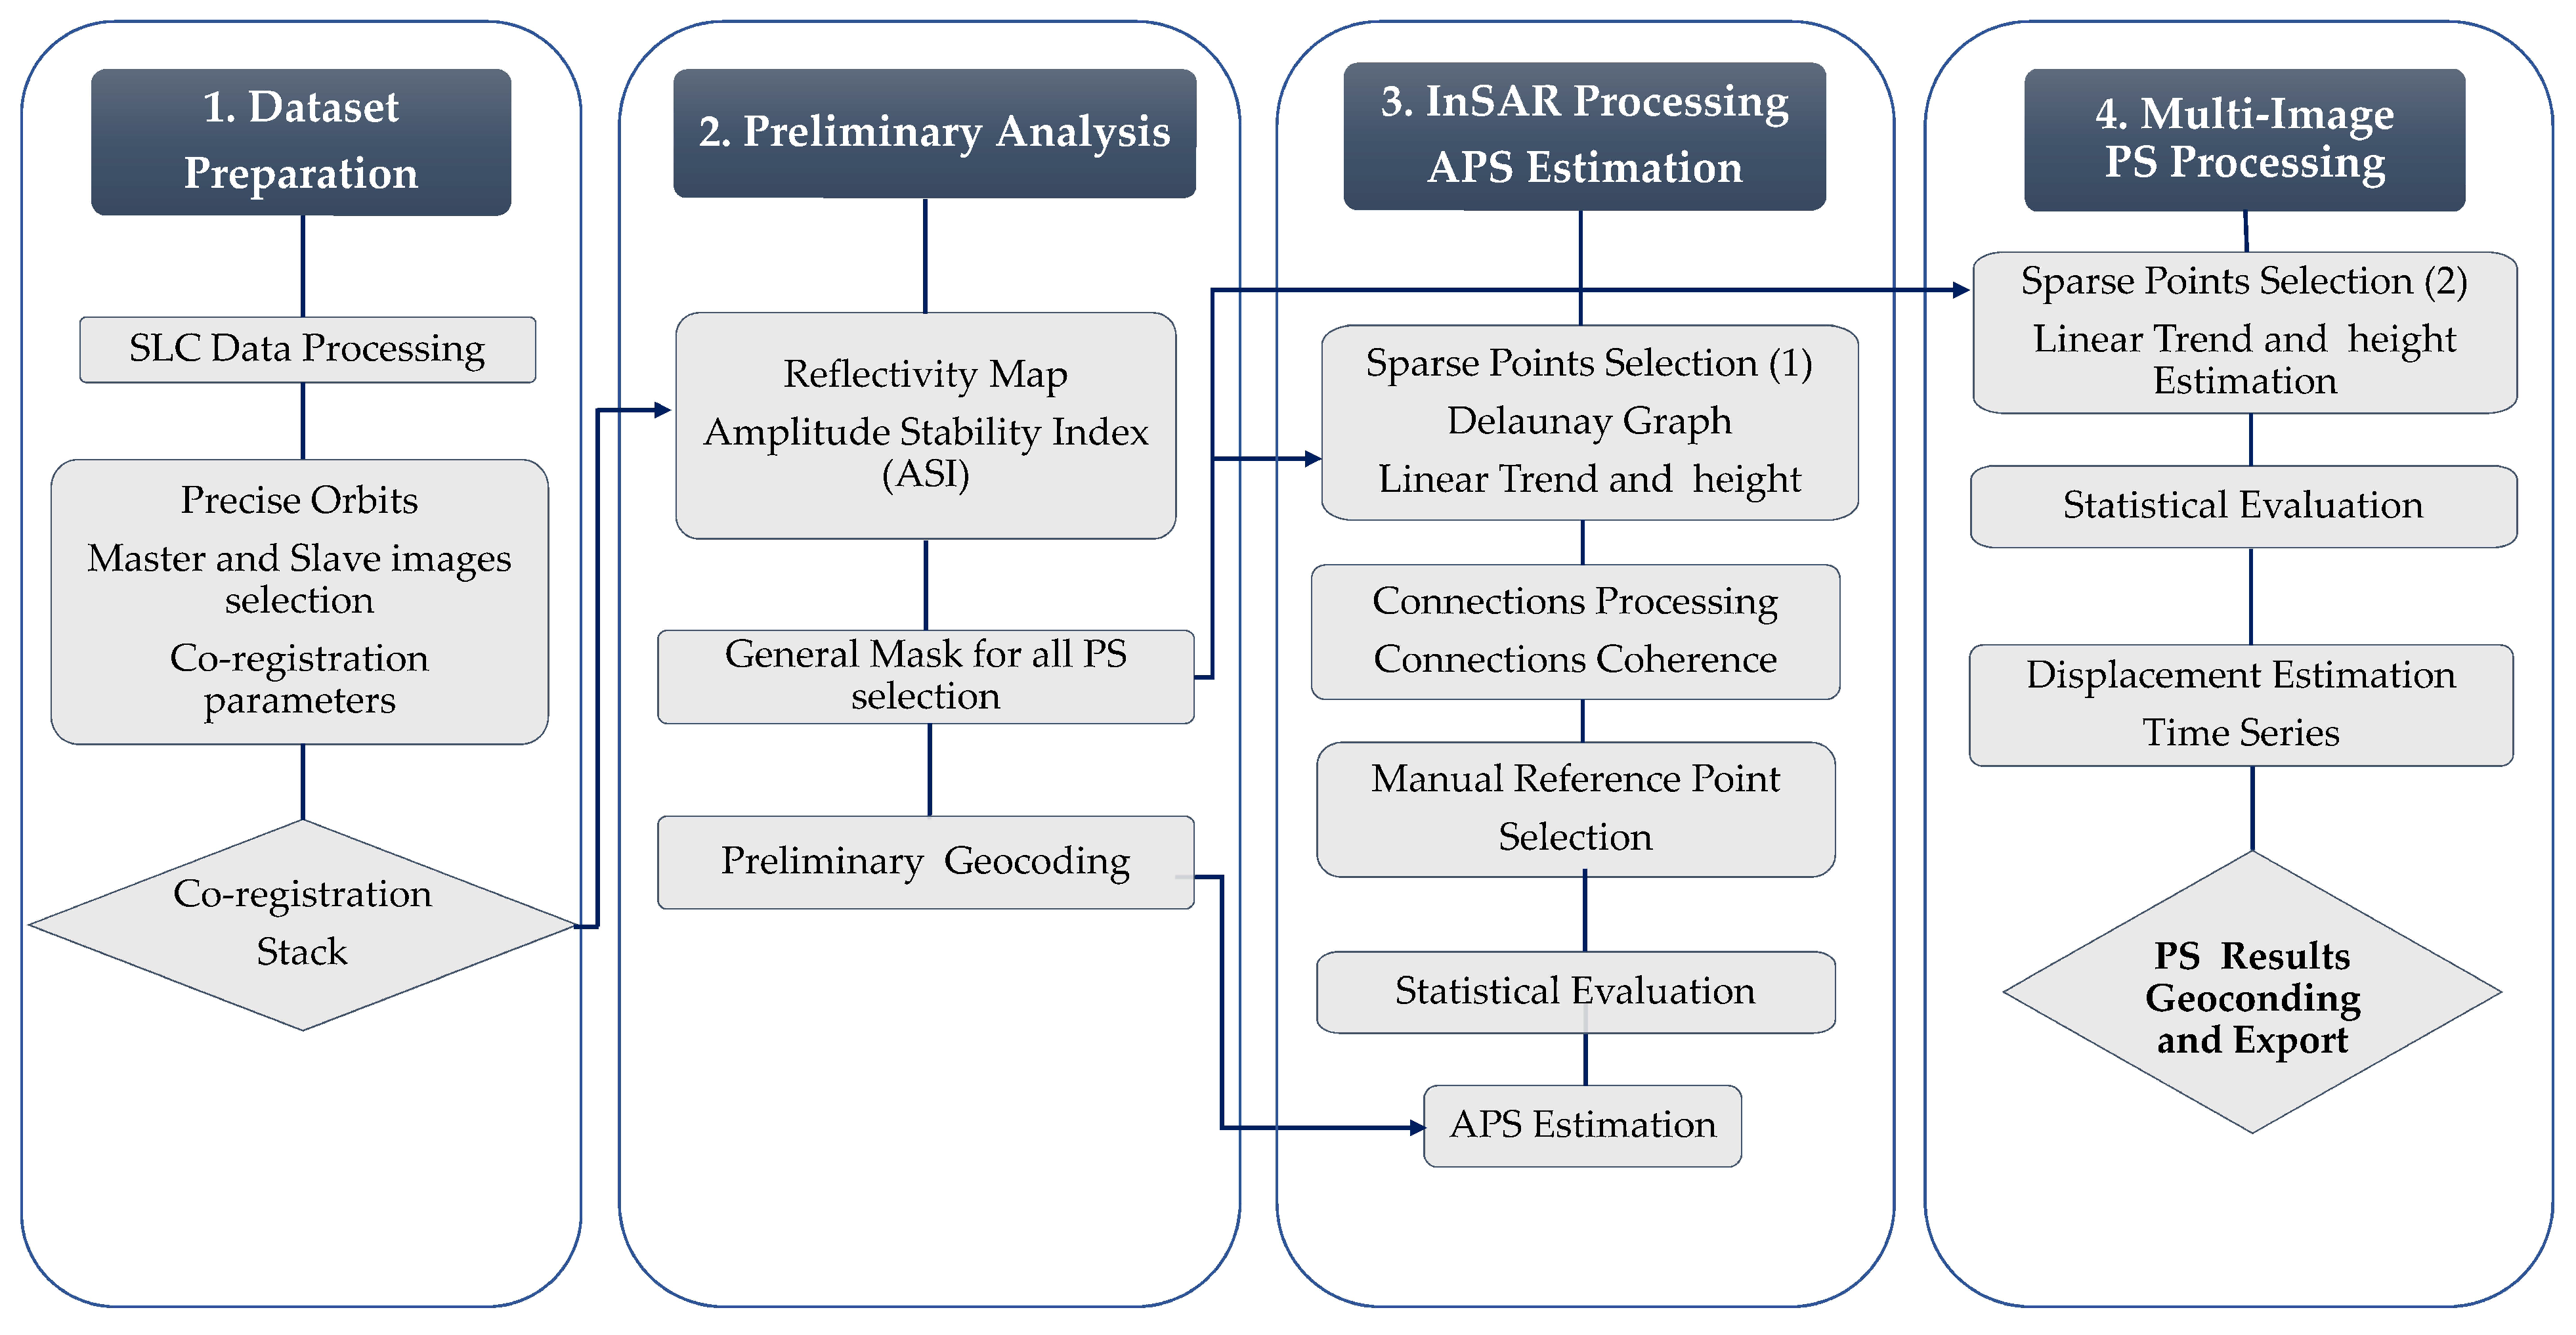
3.2. Methods
3.2.1. Synthetic Aperture Radar Interferometry
3.2.2. GNSS
4. Results
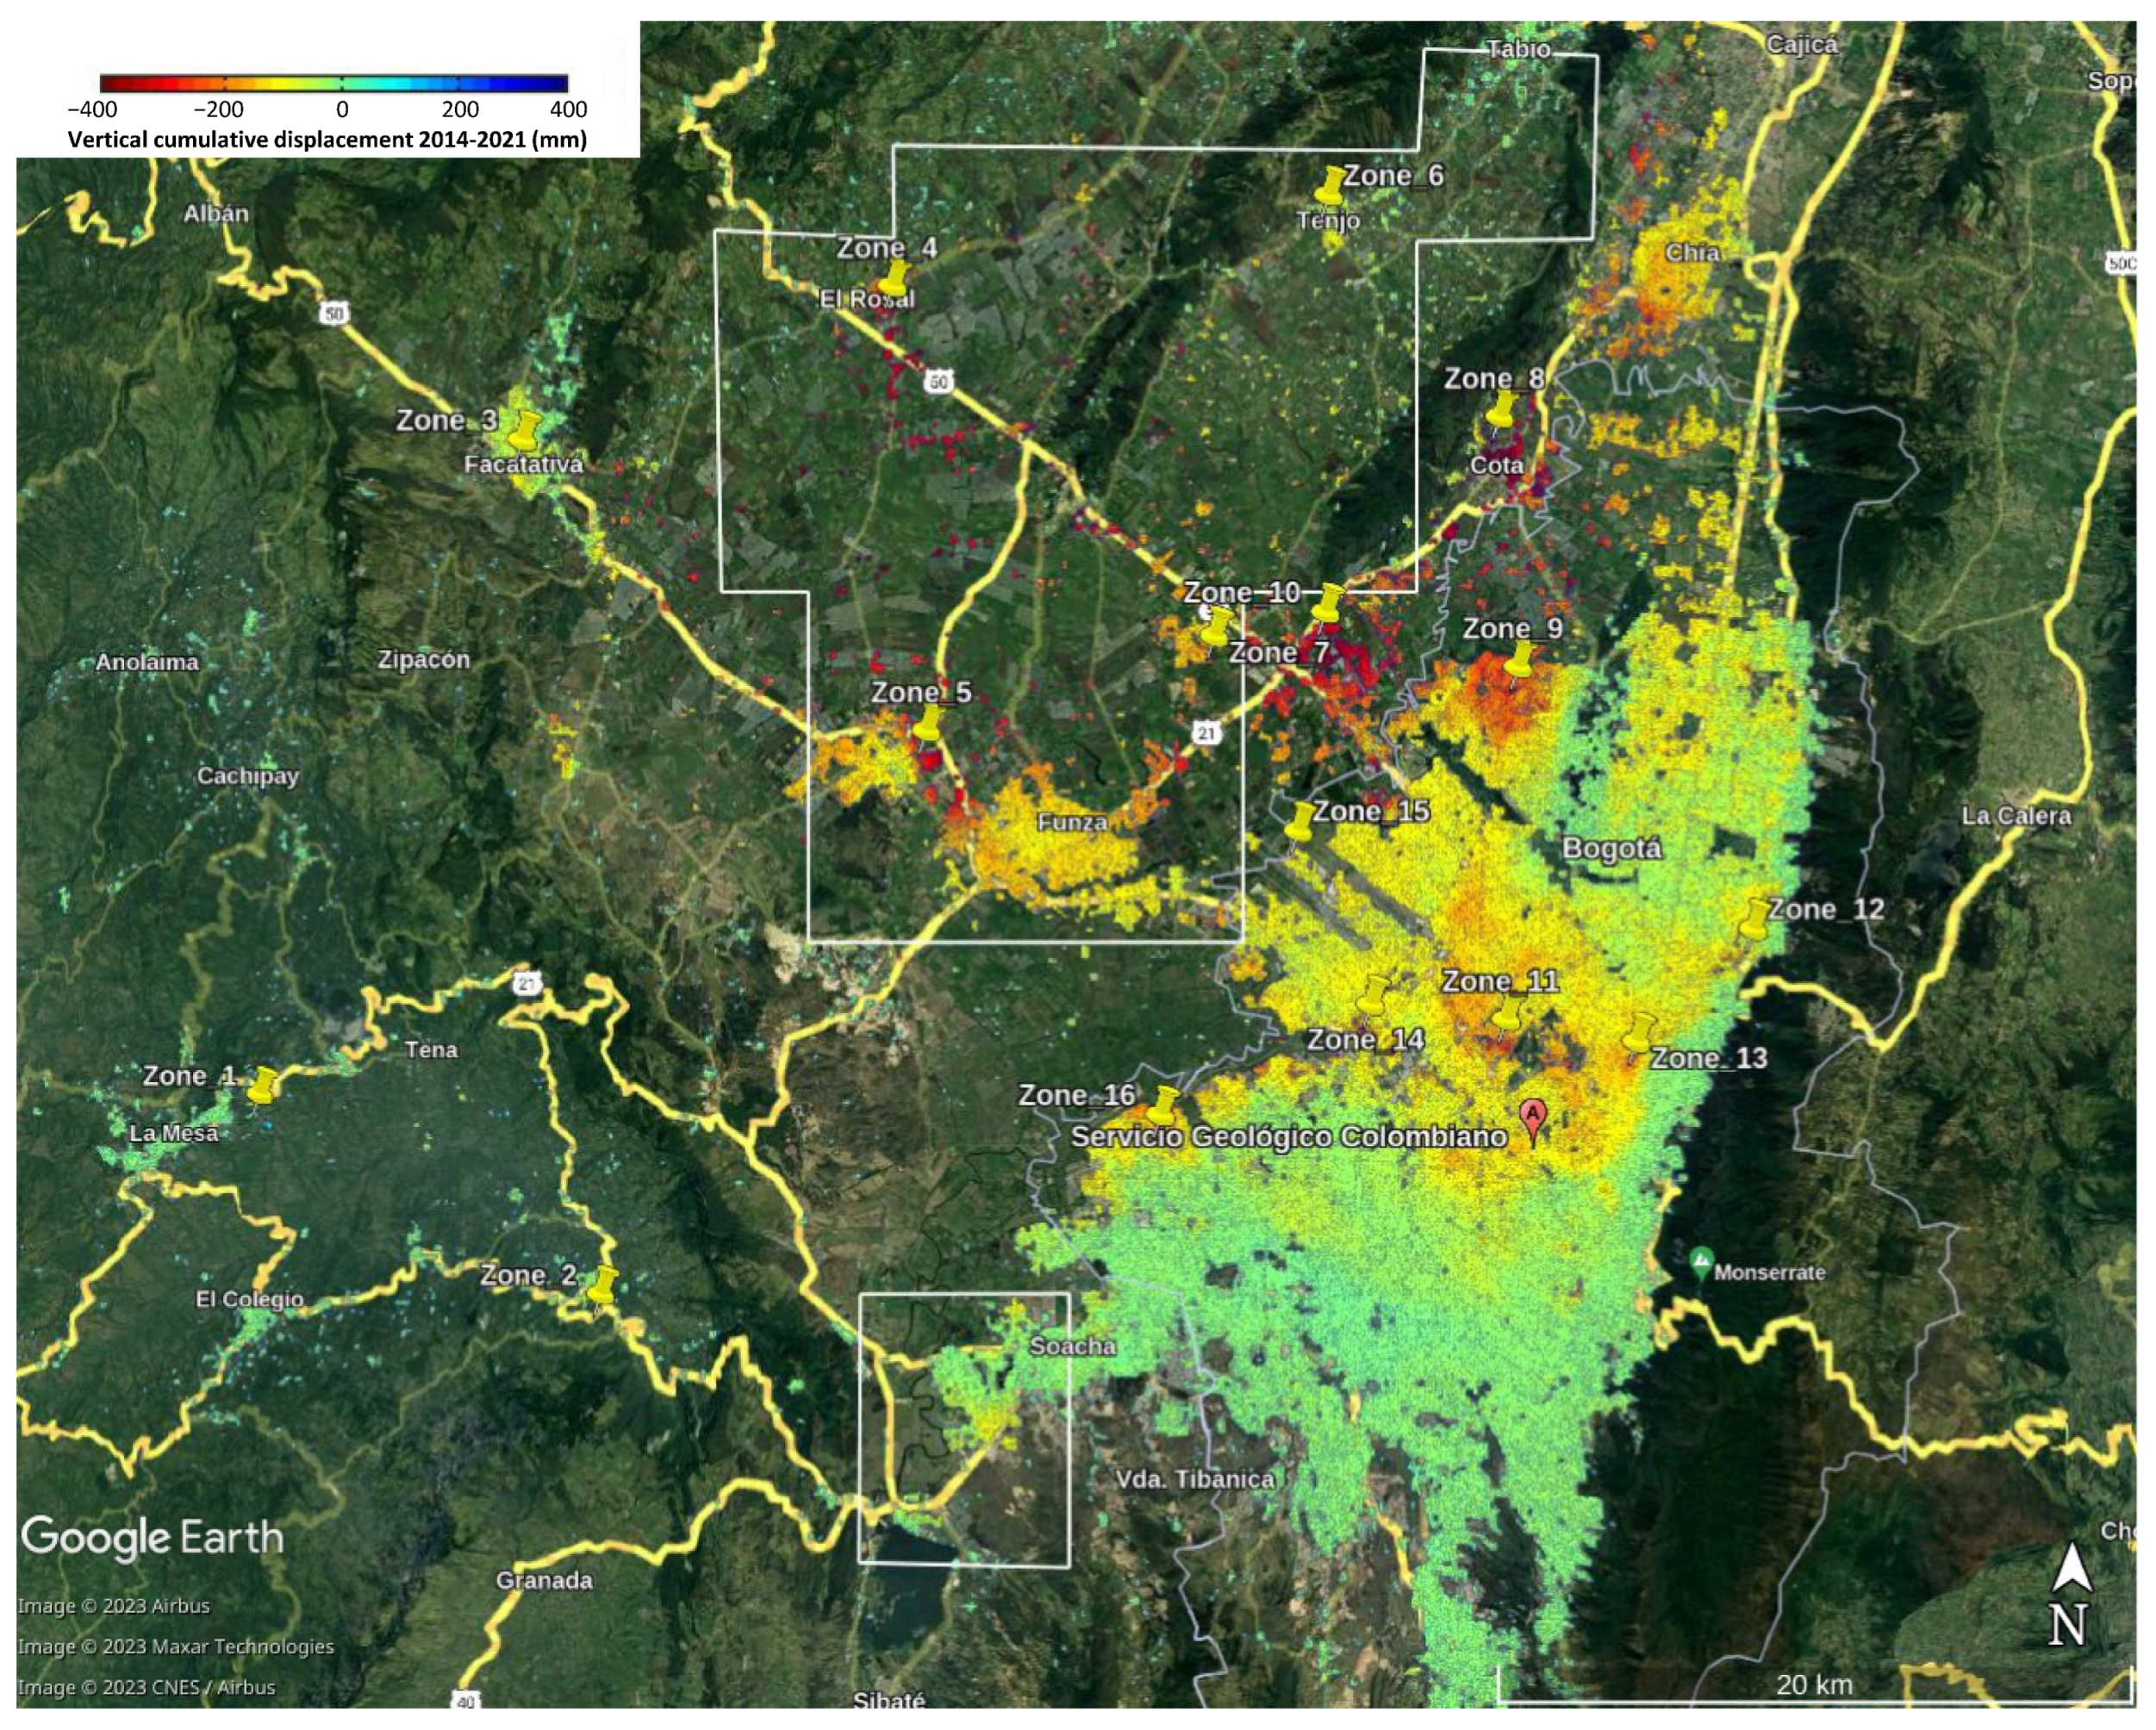
4.1. Multi-Temporal InSAR
4.2. GNSS and Comparison with MT-InSAR
5. Discussion
6. Conclusions
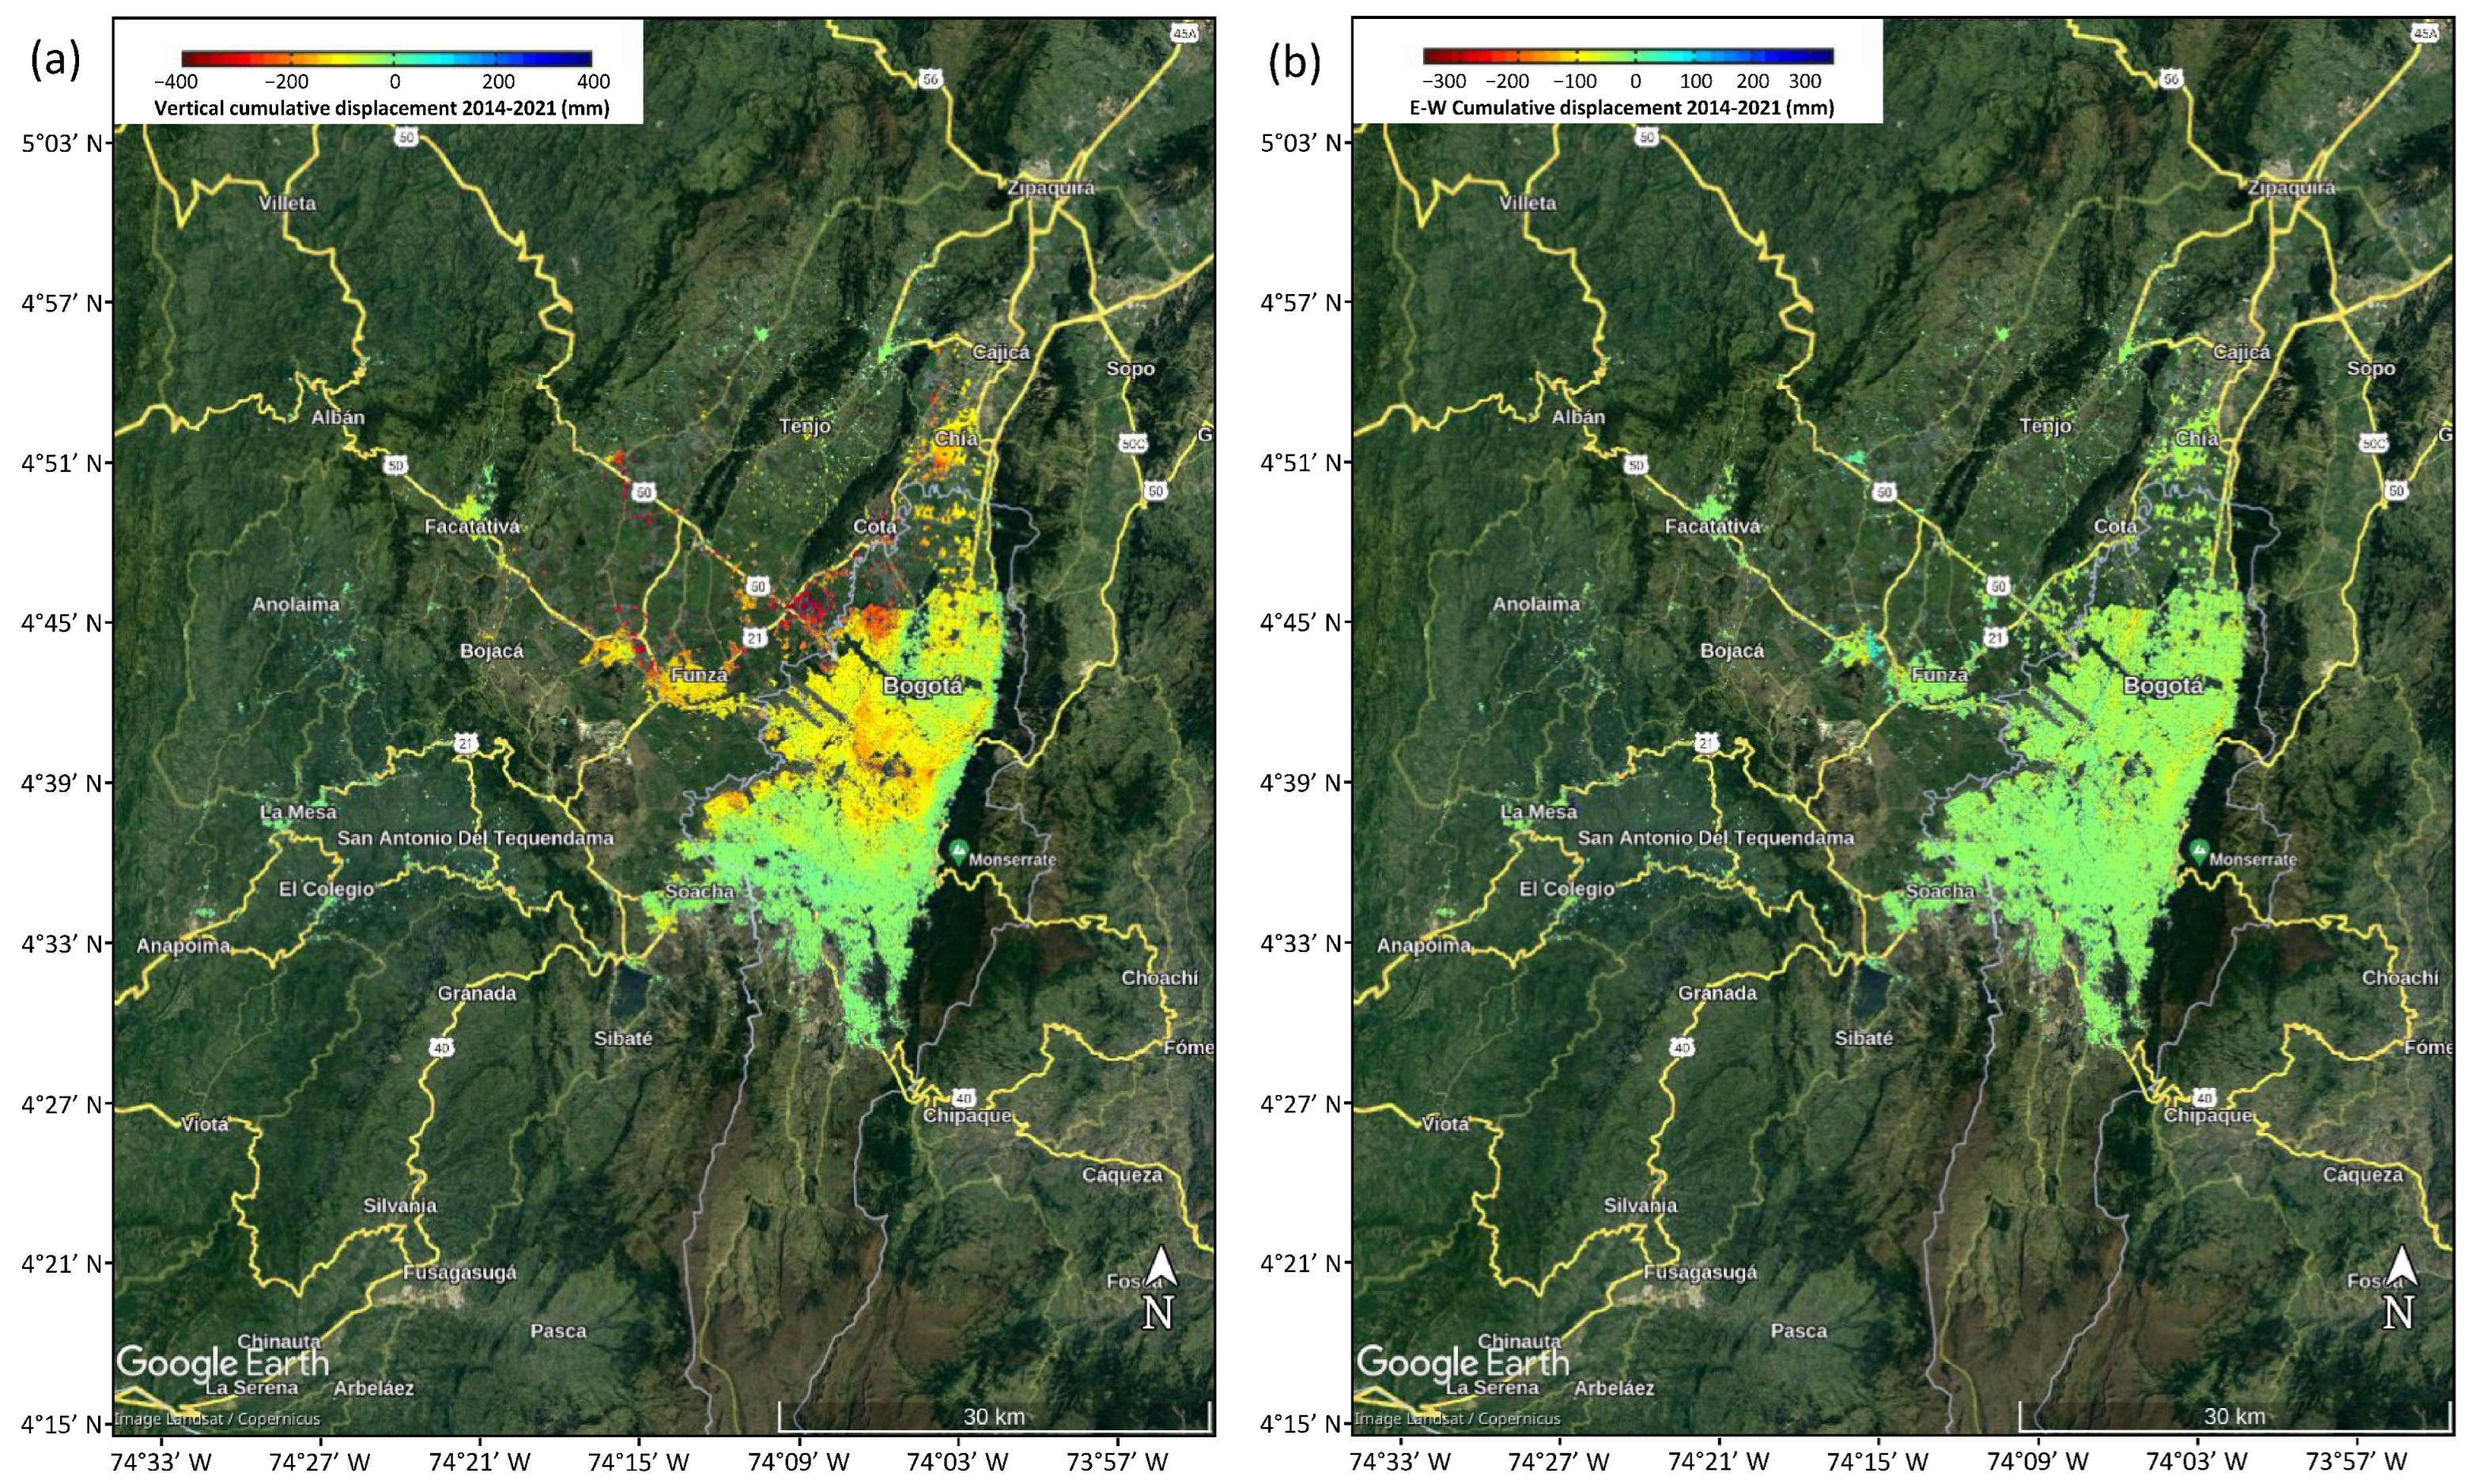
- − The subsidence phenomenon in the AOI continues to be active today, mainly impacting the central and western regions of Bogotá savanna, as well as certain areas within Bogotá city. Groundwater over-exploitation, driven by industrial development and population growth, is regarded as the cause of this subsidence, which has been present since the 1990s. Several municipalities, including El Rosal, Madrid, Facatativá, Cota, Funza, Bojacá, and others, demonstrated substantial cumulative deformation up to −400 mm during the research period from 2014 to 2021.
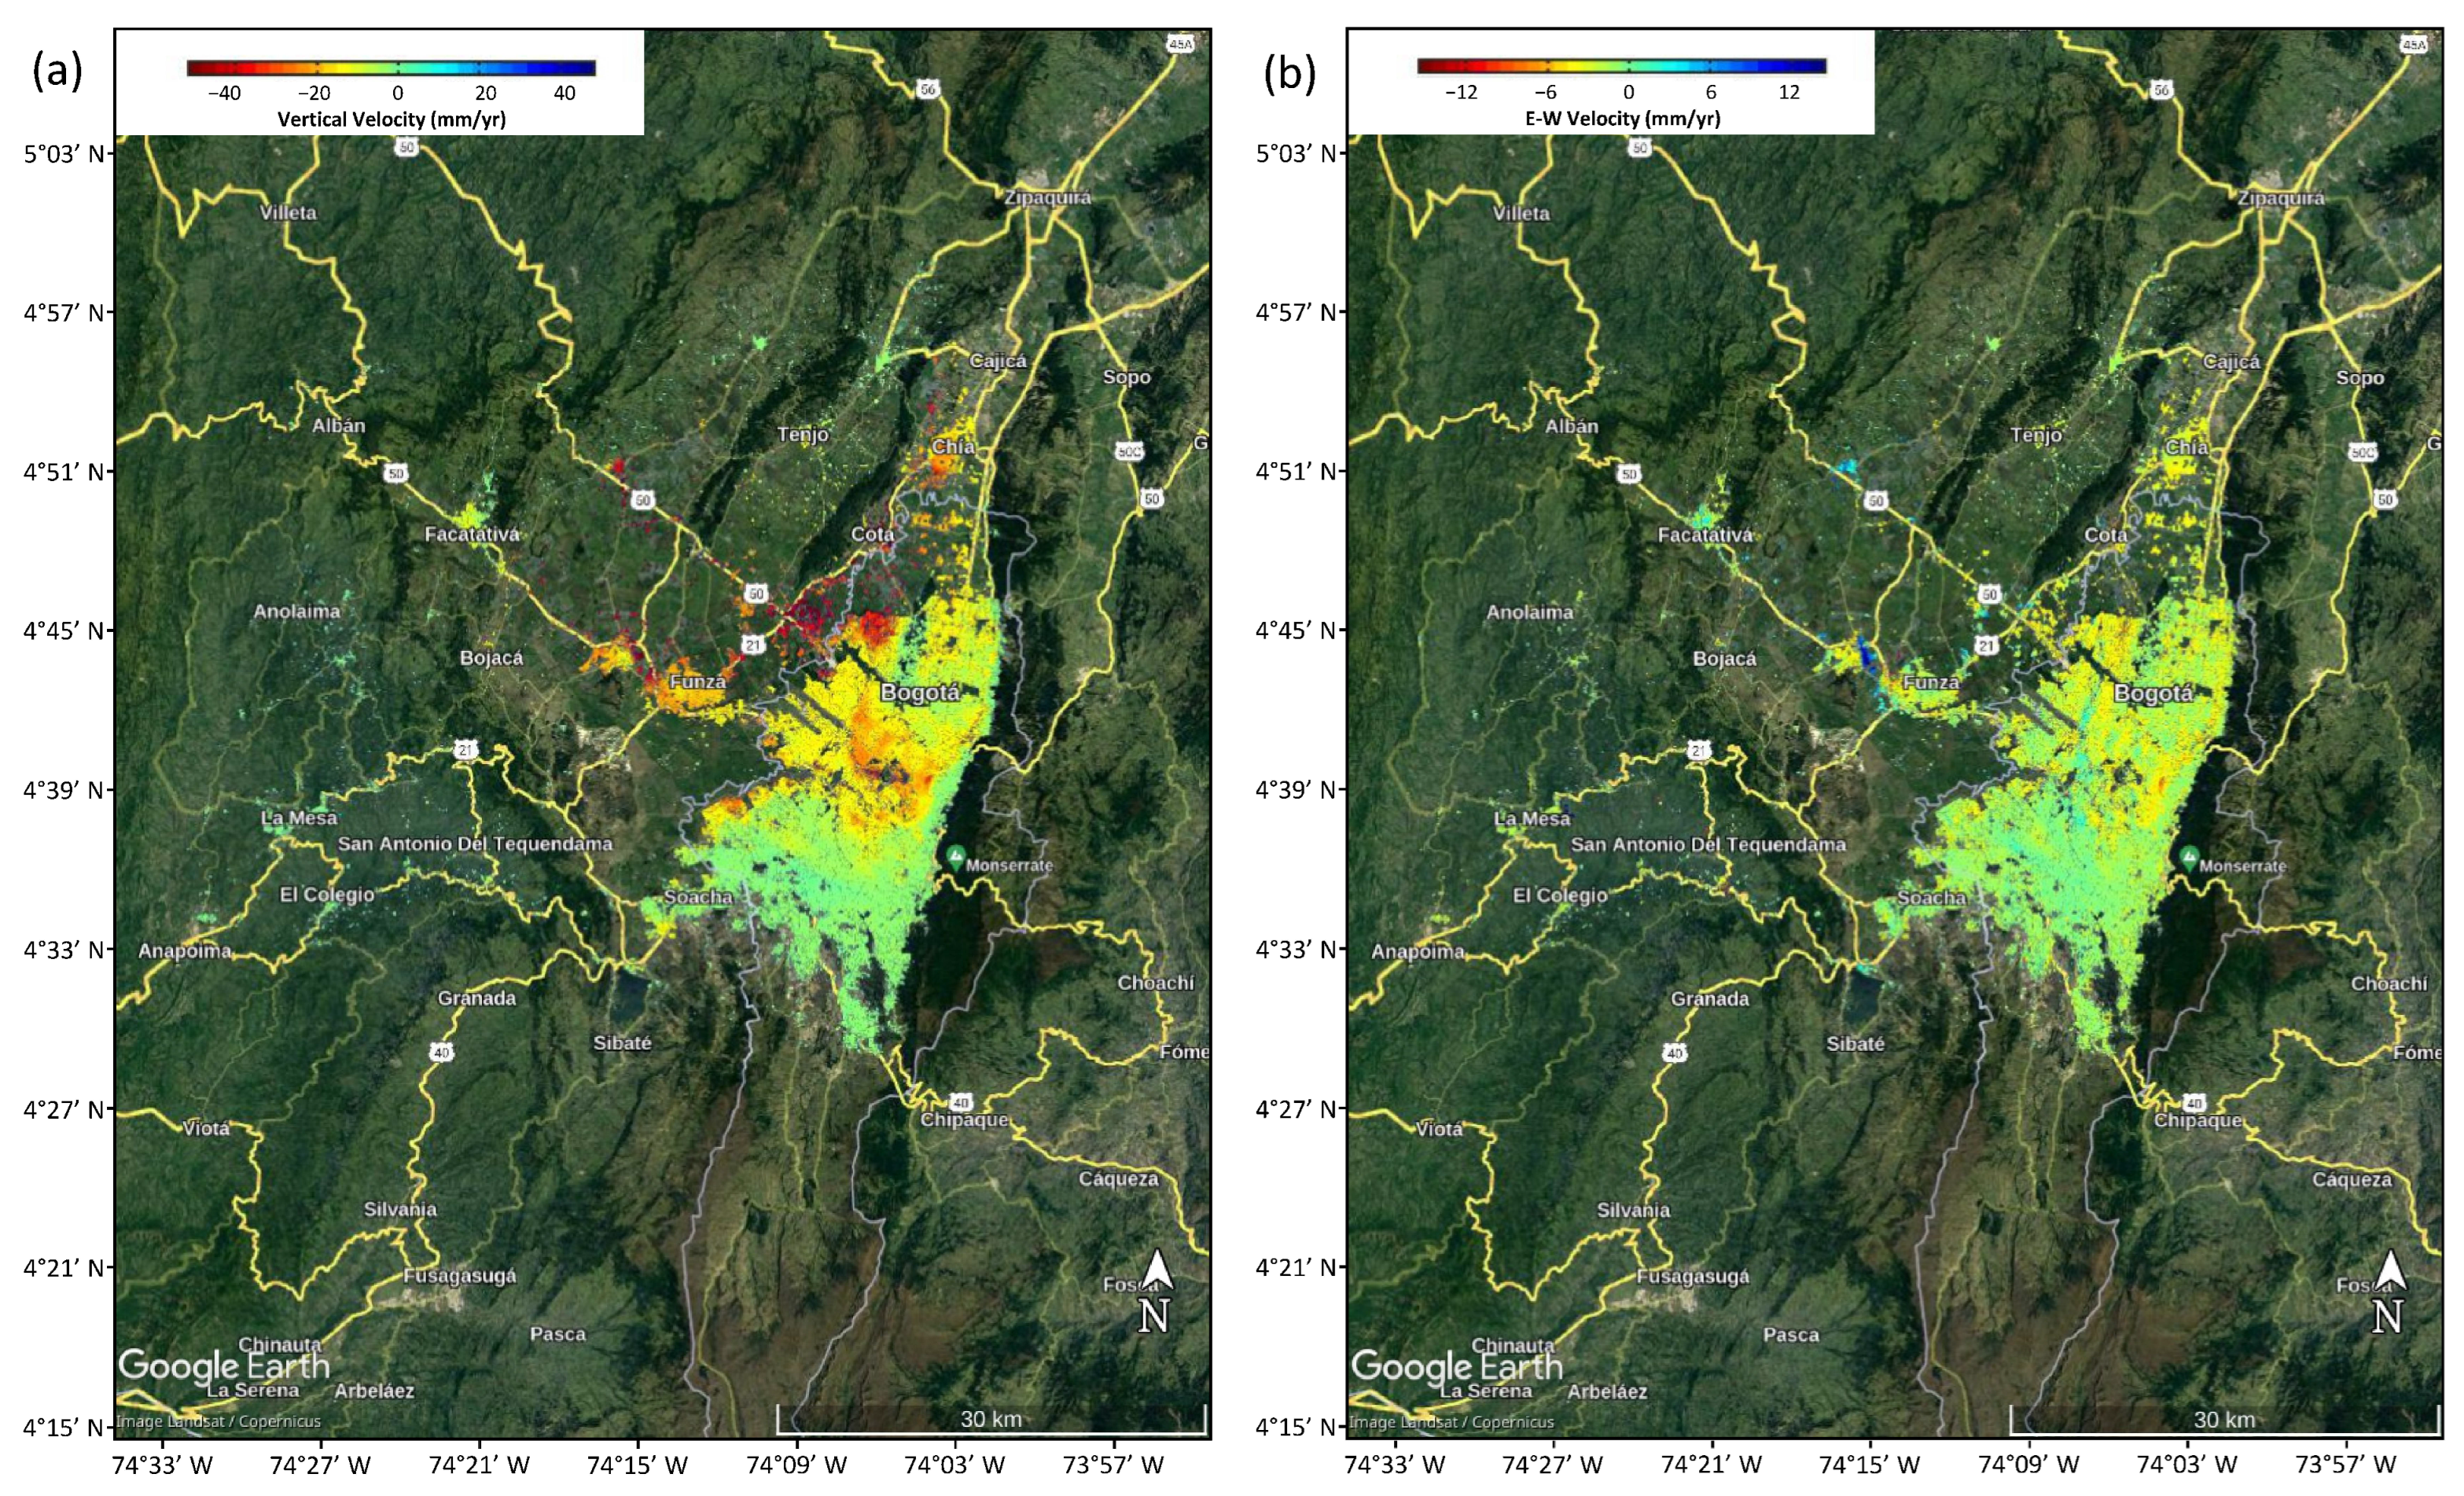
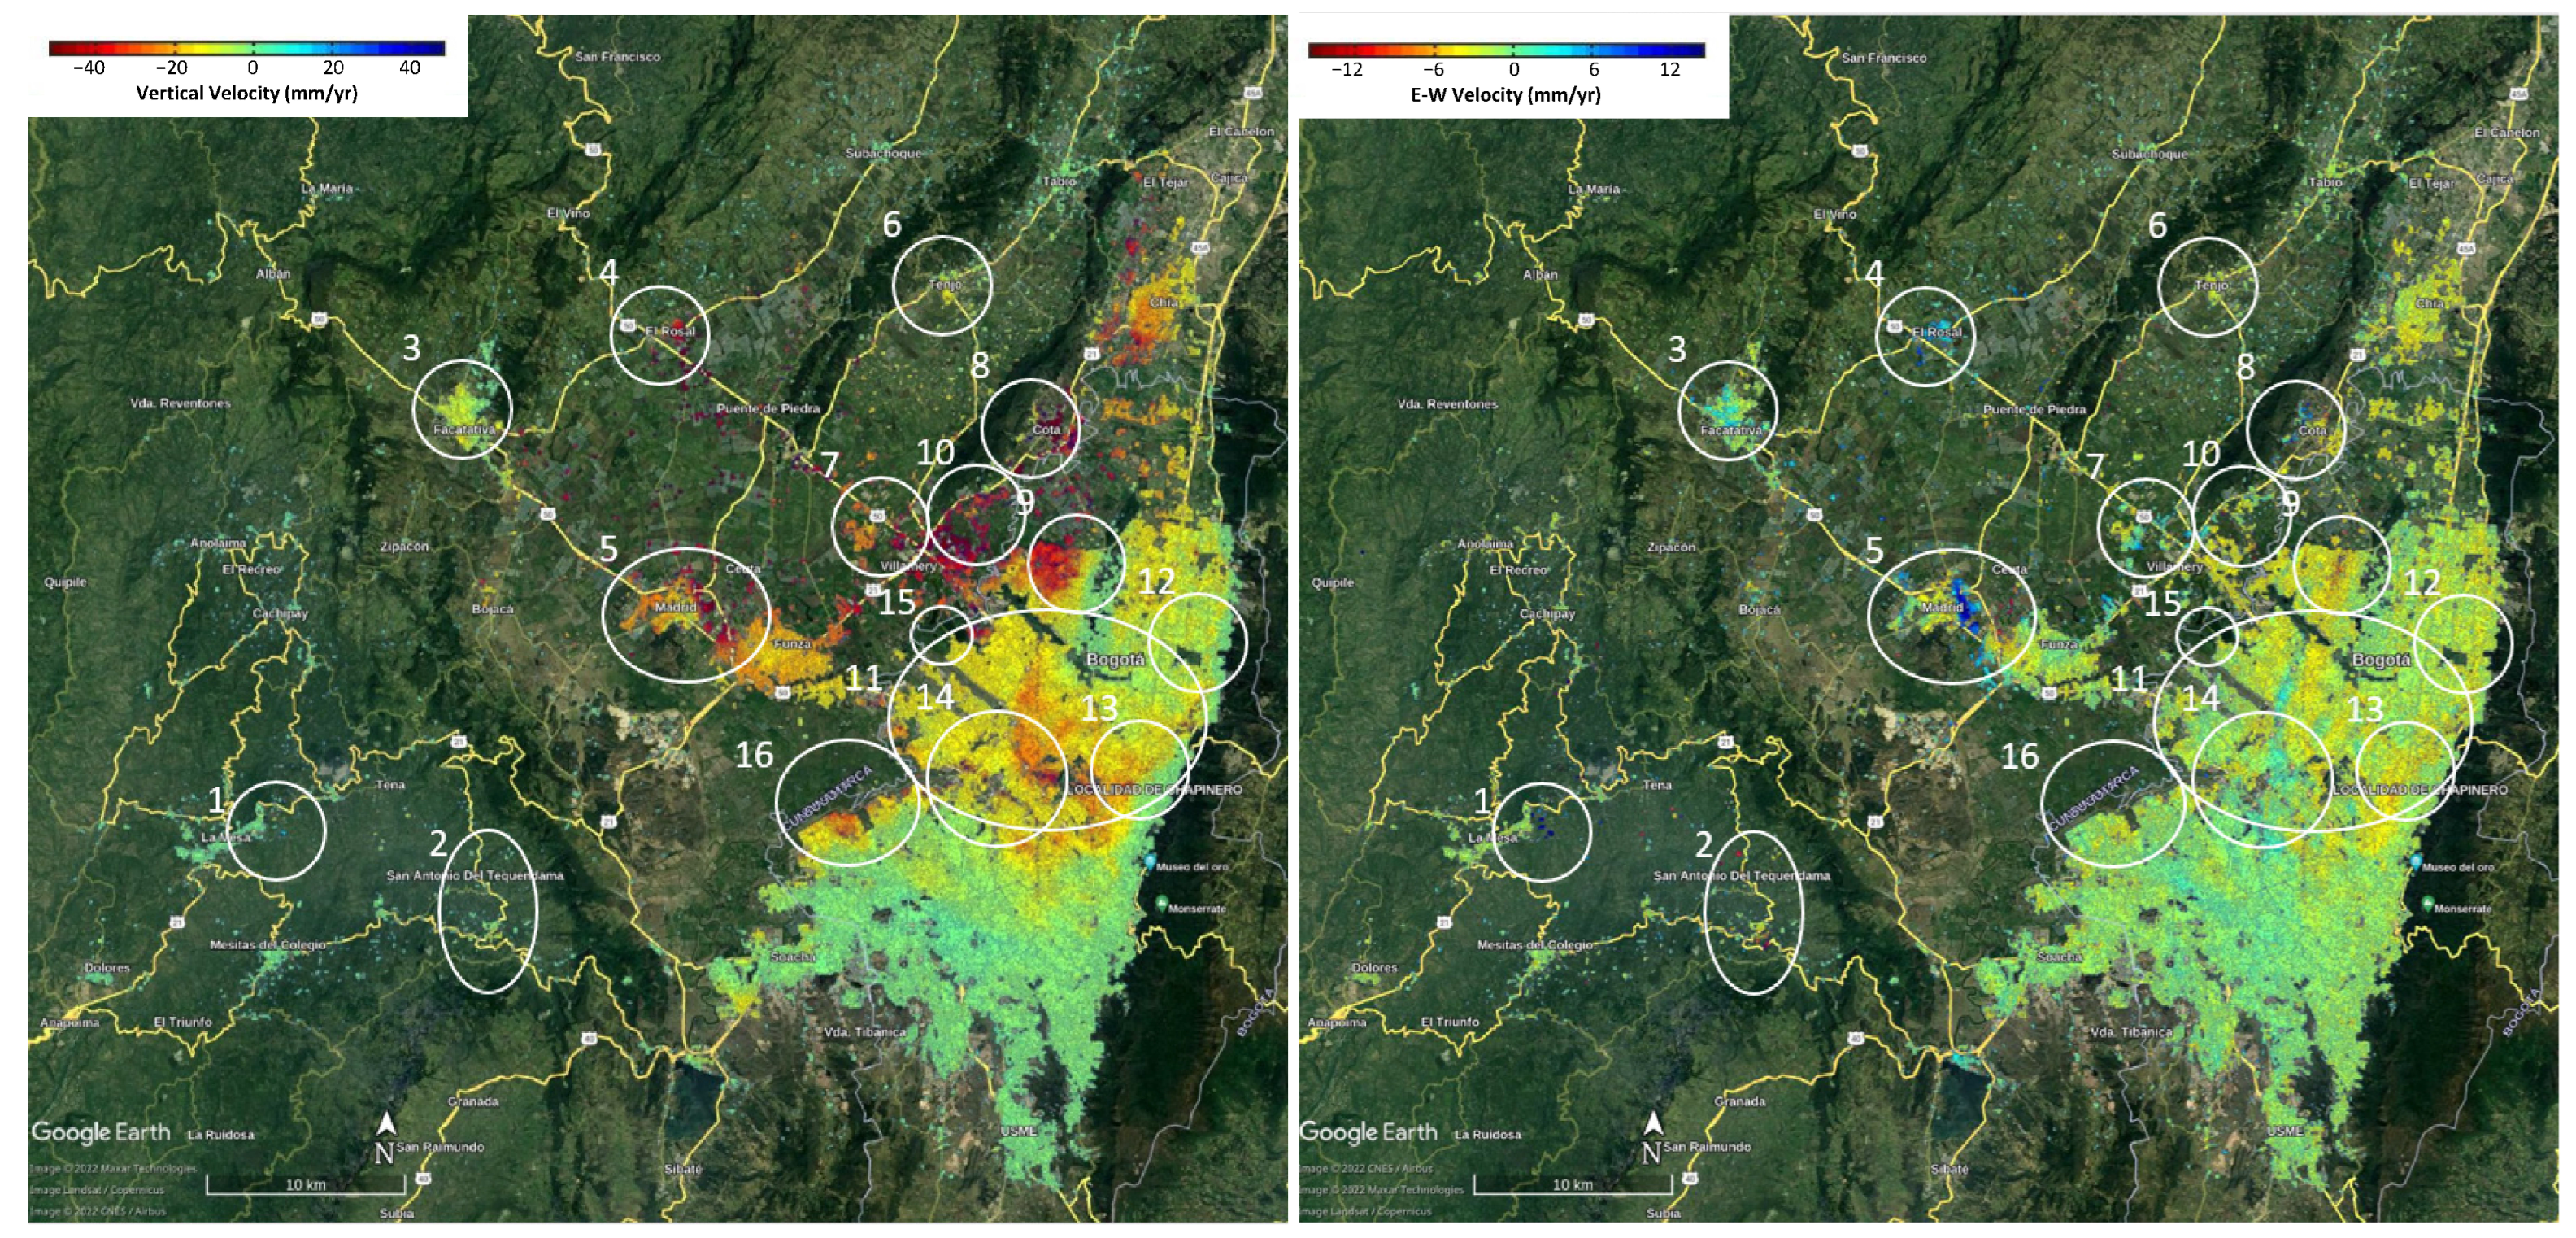
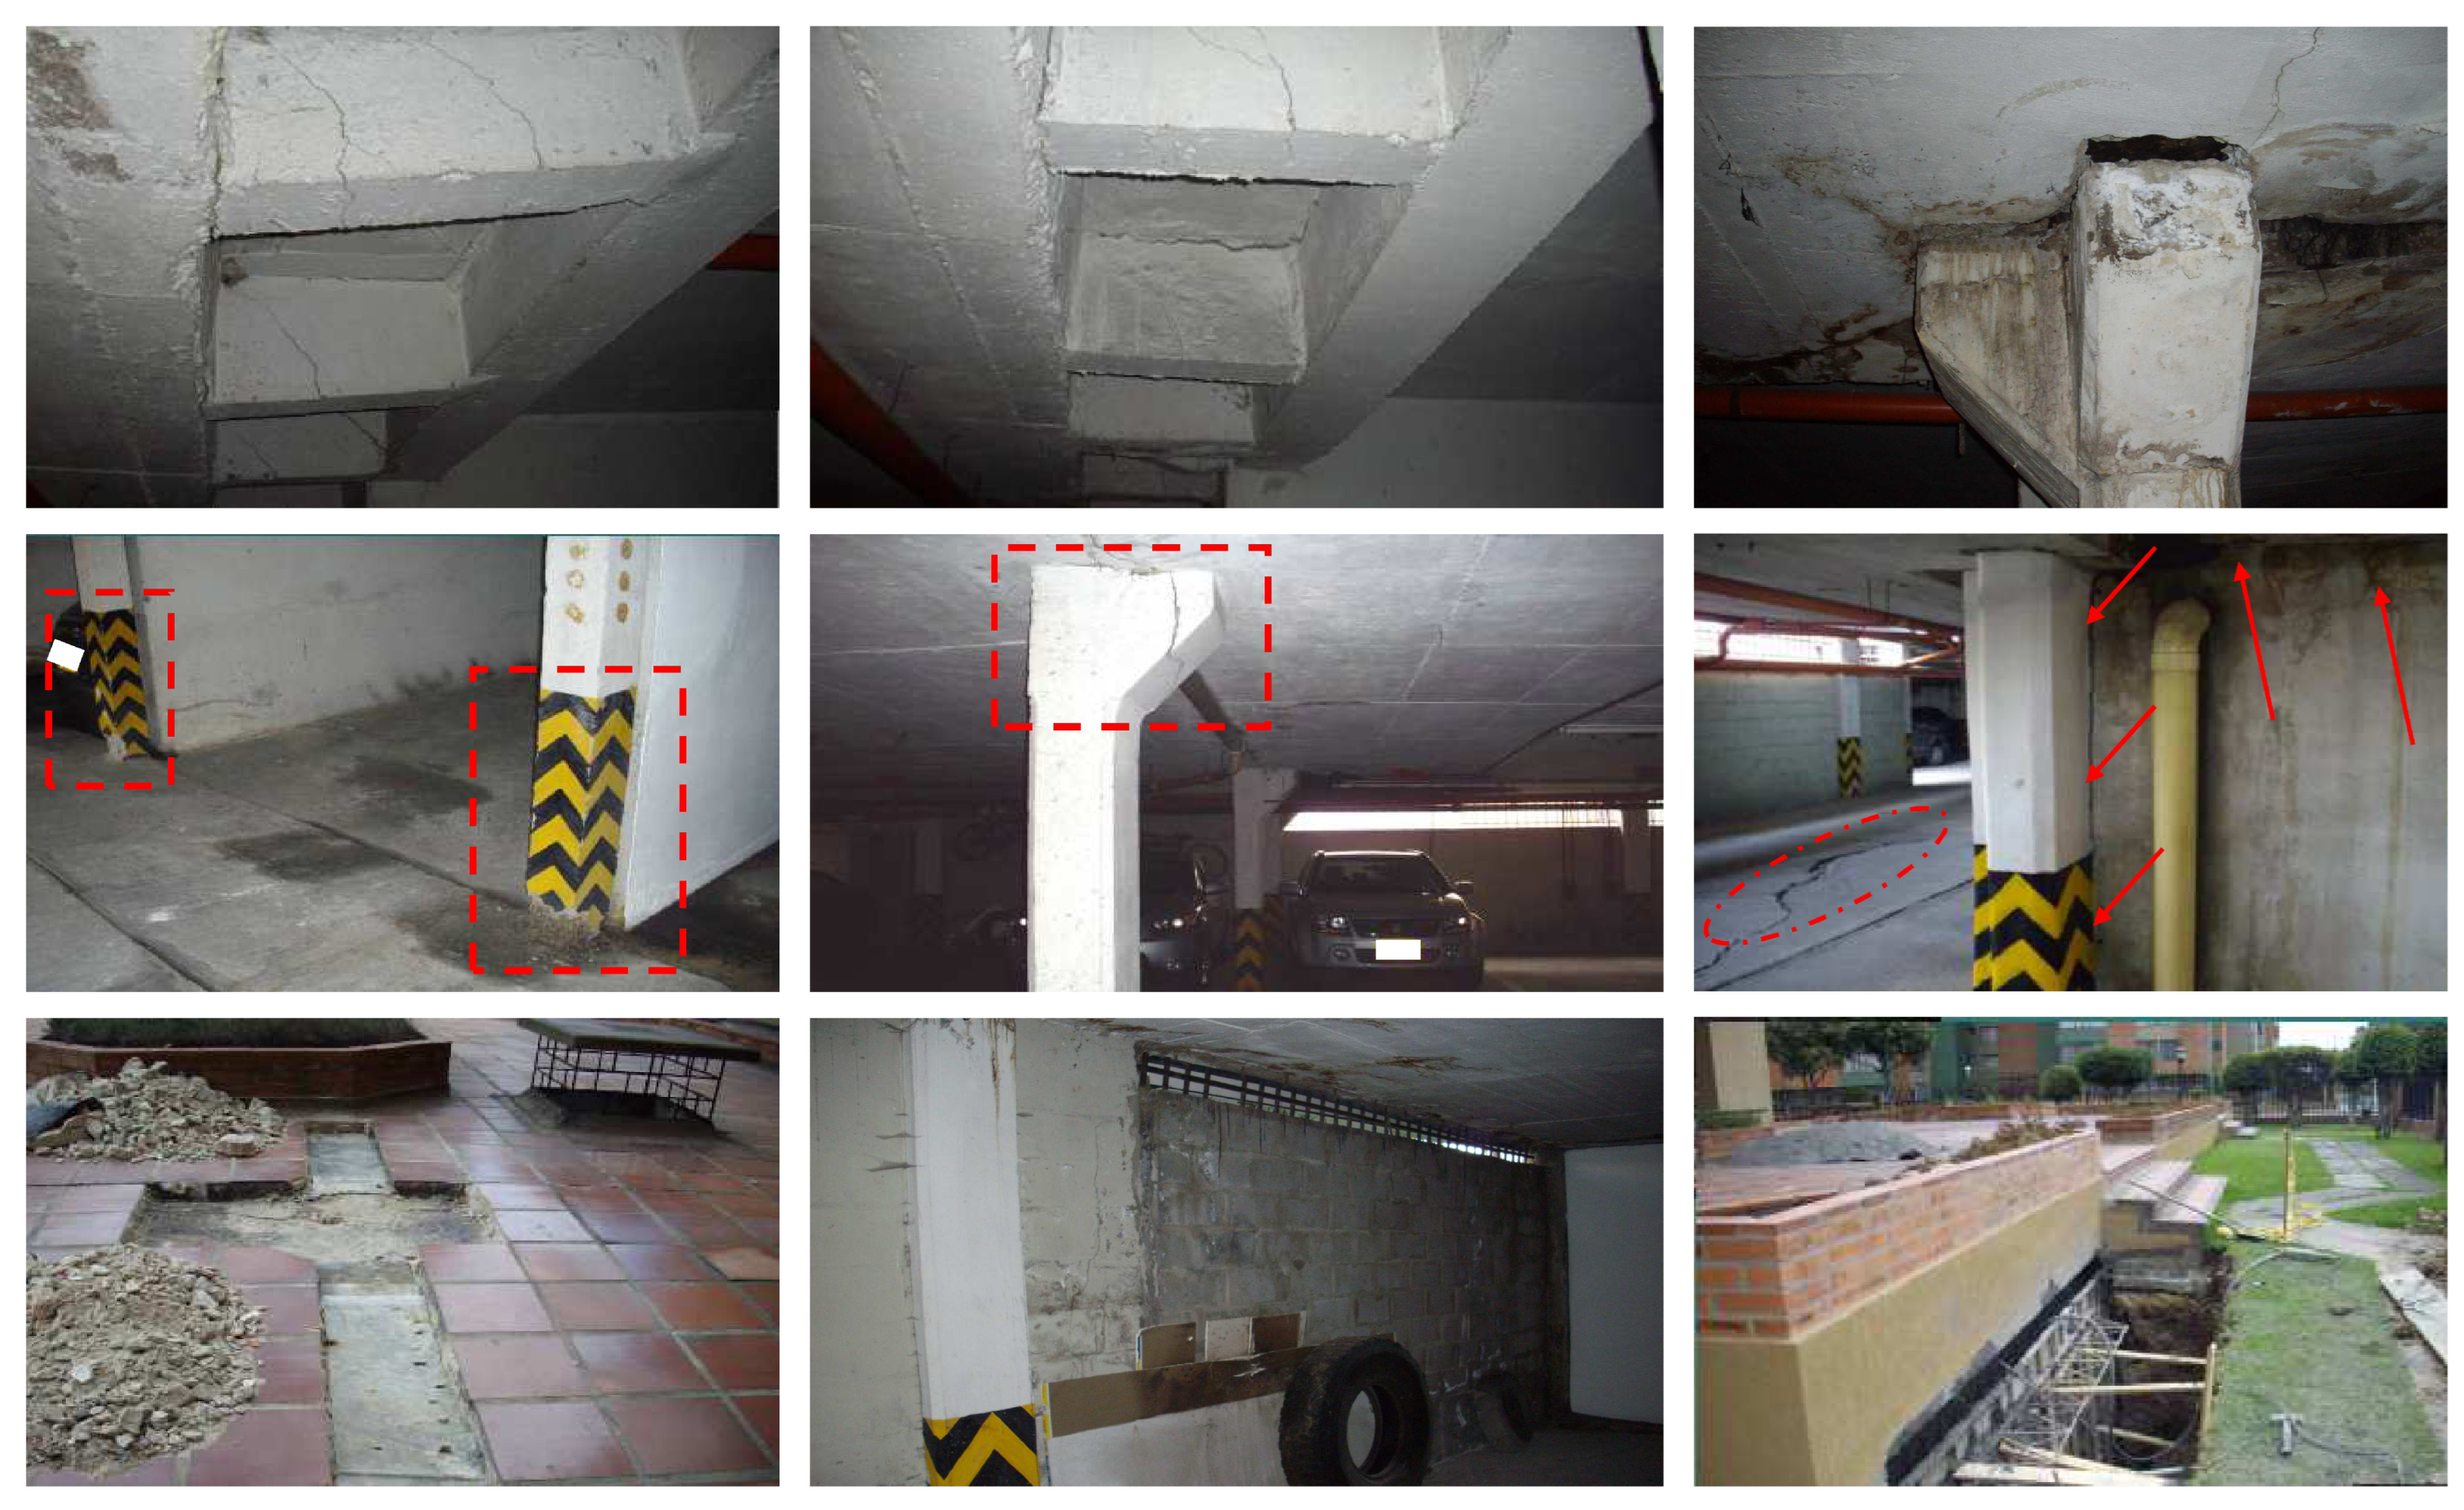
- − The subsidence indicates deformation velocity rates ranging from −10 to −40 mm/yr in the central and western areas of the Bogotá savanna, with some places even higher (−60 mm/yr). Horizontal deformation rates in the east–west direction (around 12 mm/yr) are lower than the vertical rates within the AOI. However, it is critical to highlight that this still poses a significant problem that necessitates constant surveillance in the region. The Quaternary and Guadalupe aquifers show continually decreasing deformation rates, suggesting a decline in the region’s groundwater potentiometric level. Such depletion results from intensive extraction for basic consumption needs surpassing natural recharge. Consequently, surface layers compact and subside, leading to rapid damage and deterioration of pavements in Bogotá savanna and Bogotá city.
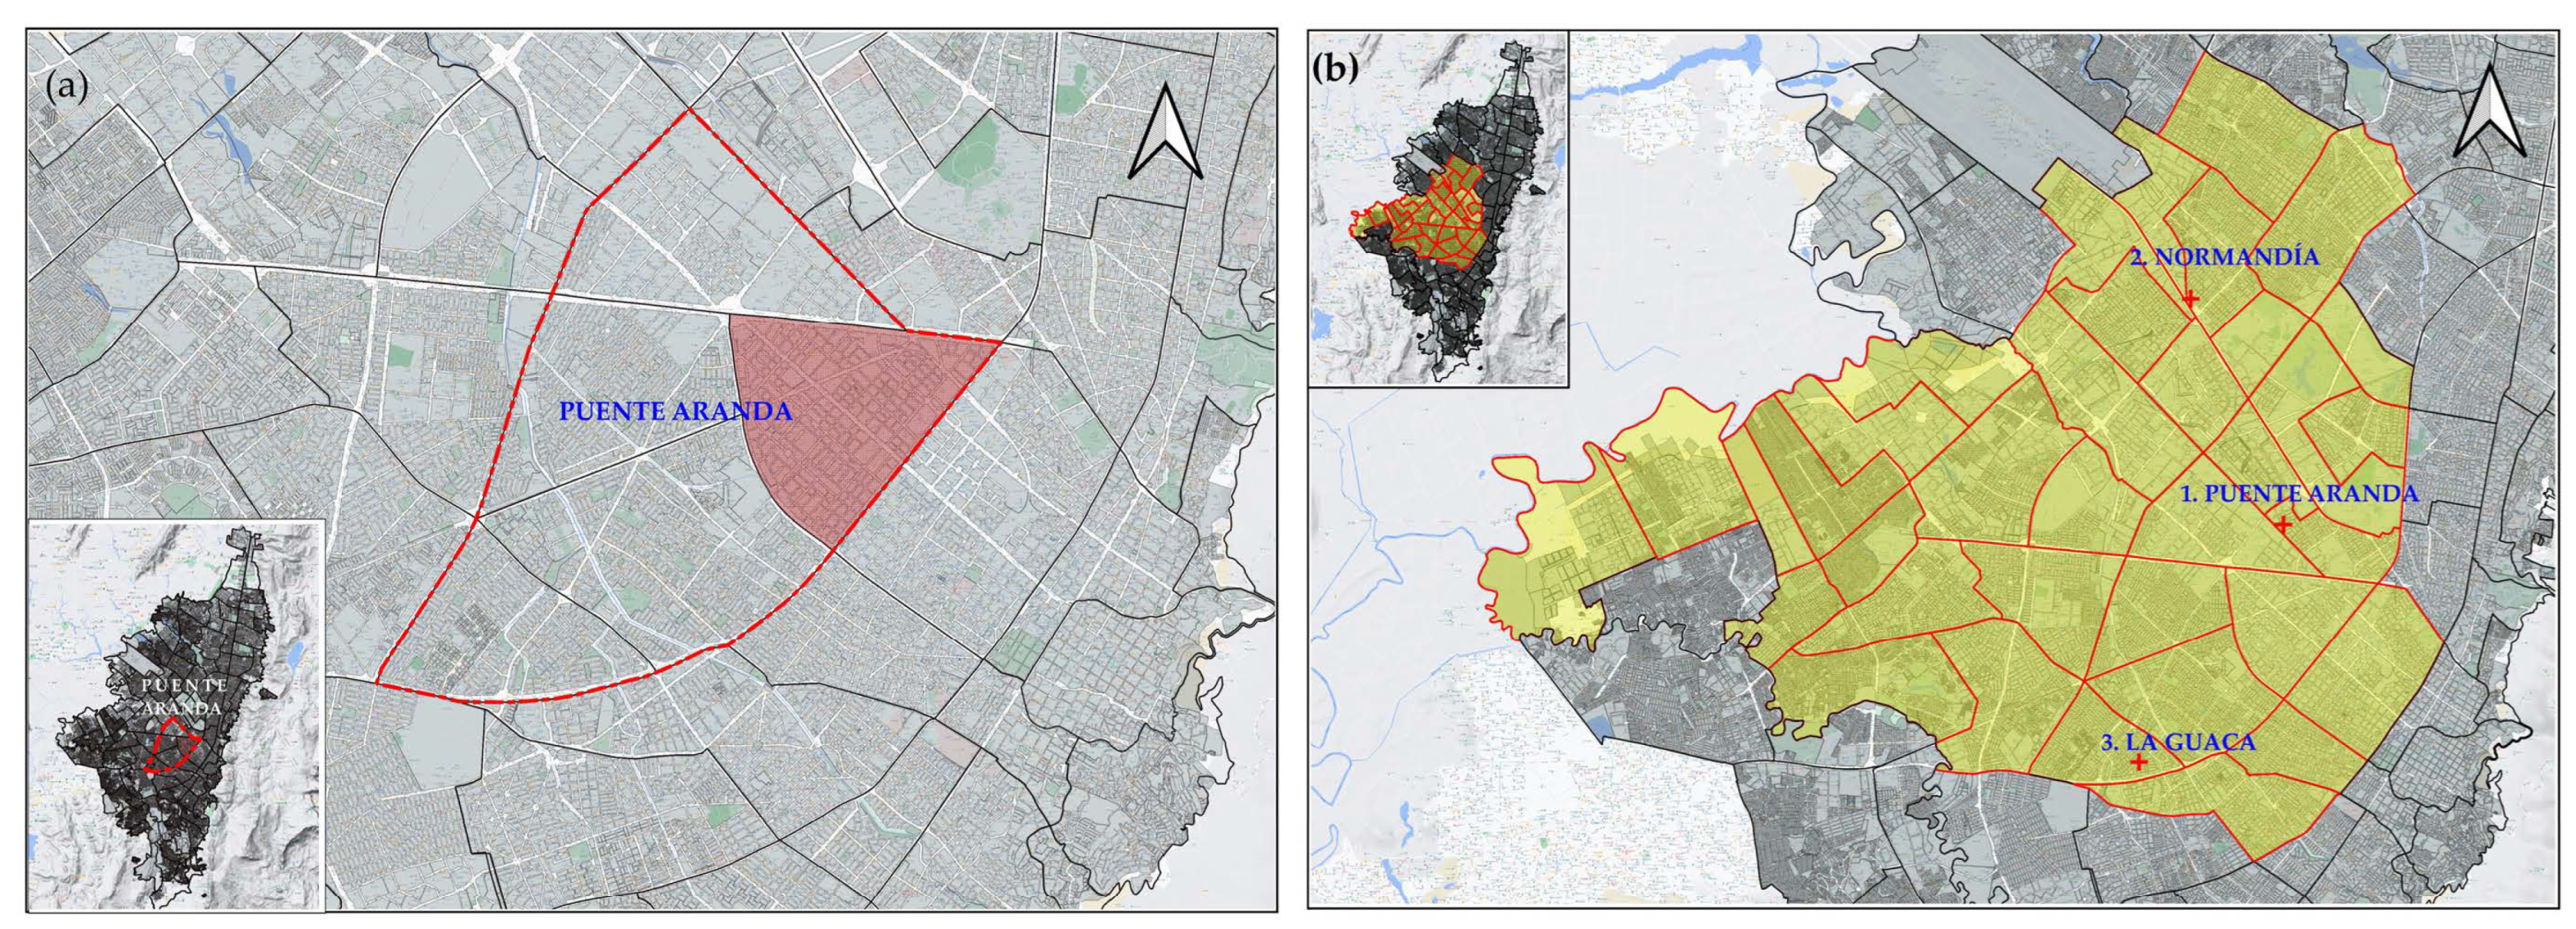
- − The MT–InSAR processing results reveal that, like the savanna, Bogotá experiences deformation rates in different neighborhoods situated in the north, center, west, and some parts of the south. Previous studies have identified deformation rates of up to −33 mm/yr in specific neighborhoods of the city. Even greater deformation rates and a spatiotemporal expansion from the city center towards the south, north, and west were observed in our latest analysis.
- − Conversely, the central area of Bogotá experienced a consistent downward movement over the period from 2014 to 2021, as confirmed by both MT-InSAR and GNSS data from the SIRGAS stations, providing additional validation across a significant portion of the city. Continuous monitoring of subsidence in the capital is recommended, due to the extensive area covered within the city, which could pose a risk to the stability of structures.
- − Additionally, the study found that the increasing demand for housing in smaller cities and towns contributes to subsidence in the Bogotá savanna. The construction of new multifamily buildings, factories, warehouses, and other structures has resulted in structural load consolidation in the soil, as captured by radar, which can persist for up to 20 years or more.
- − However, the absence of current and publicly accessible data on piezometric levels or water table levels in the area presents challenges for research. A public and comprehensive information system should be established to facilitate future studies on underground water usage and piezometric monitoring systems. The MT-InSAR analysis plays a crucial role in an early warning system that identifies areas requiring monitoring and intervention for subsidence-related issues. Nevertheless, the system can be complemented by other geodetic monitoring systems.
Author Contributions
Funding
Data Availability Statement
Acknowledgments
Conflicts of Interest
References
- Foroughnia, F.; Nemati, S.; Maghsoudi, Y.; Perissin, D. An Iterative PS-InSAR Method for the Analysis of Large Spatio-Temporal Baseline Data Stacks for Land Subsidence Estimation. Int. J. Appl. Earth Obs. Geoinf. 2019, 74, 248–258. [Google Scholar] [CrossRef]
- Galloway, D.; Jones, D.R.; Ingebritsen, S.E. Land Subsidence in the United States; USGS: Reston, VA, USA, 1999. [Google Scholar] [CrossRef]
- De Vallejo, L.I.G.; Ferrer, M.; Ortuño, L.; Oteo, C. Ingeniería Geológica, 1st ed.; Alhambra, Ed.; Pearson Educación: London, UK, 2002. [Google Scholar]
- Figueroa-Miranda, S.; Tuxpan-Vargas, J.; Ramos-Leal, J.A.; Hernández-Madrigal, V.M.; Villaseñor-Reyes, C.I. Land Subsidence by Groundwater Over-Exploitation from Aquifers in Tectonic Valleys of Central Mexico: A Review. Eng. Geol. 2018, 246, 91–106. [Google Scholar] [CrossRef]
- Neely, W.R.; Borsa, A.A.; Burney, J.A.; Levy, M.C.; Silverii, F.; Sneed, M. Characterization of Groundwater Recharge and Flow in California’s San Joaquin Valley From InSAR-Observed Surface Deformation. Water Resour. Res. 2021, 57, e2020WR028451. [Google Scholar] [CrossRef] [PubMed]
- Shi, X.; Wu, J.; Ye, S.; Zhang, Y.; Xue, Y.; Wei, Z.; Li, Q.; Yu, J. Regional Land Subsidence Simulation in Su-Xi-Chang Area and Shanghai City, China. Eng. Geol. 2008, 100, 27–42. [Google Scholar] [CrossRef]
- He, X.C.; Yang, T.L.; Shen, S.L.; Xu, Y.S.; Arulrajah, A. Land Subsidence Control Zone and Policy for the Environmental Protection of Shanghai. Int. J. Environ. Res. Public Health 2019, 16, 2729. [Google Scholar] [CrossRef]
- Sato, C.; Haga, M.; Nishino, J. Land Subsidence and Groundwater Management in Tokyo. Int. Rev. Environ. Strateg. 2006, 6, 403–424. [Google Scholar]
- Ruiz-Constán, A.; Ruiz-Armenteros, A.M.; Martos-Rosillo, S.; Galindo-Zaldívar, J.; Lazecky, M.; García, M.; Sousa, J.J.; Sanz de Galdeano, C.; Delgado-Blasco, J.M.; Jiménez-Gavilán, P.; et al. SAR Interferometry Monitoring of Subsidence in a Detritic Basin Related to Water Depletion in the Underlying Confined Carbonate Aquifer (Torremolinos, Southern Spain). Sci. Total Environ. 2018, 636, 670–687. [Google Scholar] [CrossRef]
- Hu, L.; Navarro-Hernández, M.I.; Liu, X.; Tomás, R.; Tang, X.; Bru, G.; Ezquerro, P.; Zhang, Q. Analysis of Regional Large-Gradient Land Subsidence in the Alto Guadalentín Basin (Spain) Using Open-Access Aerial LiDAR Datasets. Remote Sens. Environ. 2022, 280, 113218. [Google Scholar] [CrossRef]
- Modoni, G.; Darini, G.; Spacagna, R.L.; Saroli, M.; Russo, G.; Croce, P. Spatial Analysis of Land Subsidence Induced by Groundwater Withdrawal. Eng. Geol. 2013, 167, 59–71. [Google Scholar] [CrossRef]
- Poland, J.F. Guidebook to Studies of Land Subsidence Due to Ground-Water Withdrawal; UNESCO: London, UK, 1987; Volume 2. [Google Scholar] [CrossRef]
- Sosa Ruiz, D.; López-Caloca, A.A.; Couturier, S. Posibilidades y Limitaciones de La Interferometría Radar (InSAR) Con Imágenes de Una y Dos Polarizaciones Para El Monitoreo de Áreas Urbanas. Caso de Estudio: Zona Metropolitana Del Valle de México. In Análisis Geoespacial En Los Estud. Urbanos; National Autonomous University of Mexico: Mecixo City, Mexico, 2018; pp. 15–38. [Google Scholar]
- Farolfi, G.; Bianchini, S.; Casagli, N. Integration of GNSS and Satellite InSAR Data: Derivation of Fine-Scale Vertical Surface Motion Maps of Po Plain, Northern Apennines, and Southern Alps, Italy. IEEE Trans. Geosci. Remote Sens. 2019, 57, 319–328. [Google Scholar] [CrossRef]
- Müller, M.D.; Geiger, A.; Kahle, H.G.; Veis, G.; Billiris, H.; Paradissis, D.; Felekis, S. Velocity and Deformation Fields in the North Aegean Domain, Greece, and Implications for Fault Kinematics, Derived from GPS Data 1993–2009. Tectonophysics 2013, 597–598, 34–49. [Google Scholar] [CrossRef]
- Lazos, I.; Chatzipetros, A.; Pavlides, S.; Pikridas, C.; Bitharis, S. Tectonic Crustal Deformation of Corinth Gulf, Greece, Based on Primary Geodetic Data. Acta Geodyn. Geomater. 2020, 17, 413–424. [Google Scholar] [CrossRef]
- Hollenstein, C.; Müller, M.D.; Geiger, A.; Kahle, H.G. Crustal Motion and Deformation in Greece from a Decade of GPS Measurements, 1993–2003. Tectonophysics 2008, 449, 17–40. [Google Scholar] [CrossRef]
- Chalouan, A.; Gil, A.J.; Galindo-Zaldívar, J.; Ahmamou, M.; Ruano, P.; De Lacy, M.C.; Ruiz-Armenteros, A.M.; Benmakhlouf, M.; Riguzzi, F. Active Faulting in the Frontal Rif Cordillera (Fes Region, Morocco): Constraints from GPS Data. J. Geodyn. 2014, 77, 110–122. [Google Scholar] [CrossRef]
- Sanchez, L.; Martínez, W.; Herrera, I.; Téllez, L. Estimación de La Subsidencia En Bogotá a Partir de Mediciones GNSS y Nivelación Geométrica; IGAC: Montevideo, Uruguay, 2008. [Google Scholar]
- Blanco, P.; Barreto, G.; Ortiz Abaunza, D. La Interferometría Diferencial Dinsar—Una Técnica para el Monitoreo de la Subsidencia en Bogotá d.C; Department of Prevention and Emergency of the District of Bogotá: Bogotá, Colombia, 2009; pp. 1–15. [Google Scholar]
- Ávila, G.; Castro Villamarín, N. Avances En El Estudio de Subsidencia En La Ciudad de Bogotá. In Proceedings of the VIII International Conference on Geotechnical Engineering, Colombo, Sri Lanka, 6 December 2011; pp. 6-1–6-11. [Google Scholar]
- Mora Paéz, H.; Díaz Mila, F.; Cardona, L. Mapping Land Subsidence in Bogotá, Colombia, Using the Interferometric Synthetic Aperture Radar (InSAR) Technique with TerraSAR–X Images. His Master’s Voice 2020, 4, 515–548. [Google Scholar] [CrossRef]
- Landscapes, W.G. Landscapes and Landforms of Colombia; Hermelin, M., Ed.; World Geomorphological Landscapes; Springer International Publishing: Cham, Switzerland, 2016. [Google Scholar] [CrossRef]
- Lobo-Guerrero, A.; Gilboa, Y. Grounwater in Colombia. Hydrol. Sci. J. 1987, 32, 161–178. [Google Scholar] [CrossRef][Green Version]
- Montoya Arenas, D.M.; Reyes Torres, G.A. Geología de La Sabana de Bogotá. Instituto Colombiano de Geología y Minería (INGEOMINAS); Instituto Colombiano de Geología y Minería (INGEOMINAS): Bogotá, Colombia, 2005; p. 105. [Google Scholar]
- Lobo-Guerrero, A. Geología e Hidrogeología de Santafé de Bogotá y Su Sabana; Columbian Society of Geothechnology: Bogotá, Colombia, 1992. [Google Scholar]
- Lobo-Guerrero, A. Descenso de Niveles de Agua Subterránea En La Sabana de Bogotá. In Proceedings of the VIII Jornadas Geotécnicas de la Ingineria en Colombia-II Foro Sobre Geotecnica de la Sabana Bogotá, Bogotá, Colombia, 8–10 December 1995; pp. 1–11. [Google Scholar]
- Sabana Centro Cómo Vamos. Análisis de la Situación Poblacional Sabana Centro; Bogotá. 2018. Available online: https://sabanacentrocomovamos.org/home/wp-content/uploads/2019/11/Informe-An%C3%A1lisis-de-la-situaci%C3%B3n-poblacional-de-Sabana-Centro.pdf (accessed on 1 October 2023).
- Córdoba Álvarez, R.D. Una Aproximación Estocástica Para Modelar y Caracterizar los Episodios Torrenciales en el Espacio y el Tiempo—Caso de Estudio Sabana de Bogotá; Universidad de los Andes: Bogotá, Colombia, 2012. [Google Scholar]
- Corporación Autónoma Regional de Cundinamarca, C. Plan de Manejo Ambiental de Agua Subterránea En La Sabana de Bogotá y Zona Critica, 1st ed.; Imprenta Nacional de Colombia: Bogotá, Colombia, 2019; p. 176. [Google Scholar]
- Tomas, R.; Herrera, G.; José, D.; Peña, F. Subsidencia Del Terreno. Enseñanza Cienc. 2009, 17, 295–302. [Google Scholar]
- Ojeda, J.; Donnelly, L. Landslides in Colombia and Their Impact on Towns and Cities. Remote Sens. 2006, 112, 103–122. [Google Scholar]
- Ingeominas; Universidad de los Andes. Microzonificacion Sismica de Santa Fe de Bogotá.Convenio Interadministrativo 01-93.Pdf; Santa. Available online: https://www2.sgc.gov.co/biblioteca/Documents/Biblioteca/Microzonificacion%20sismica%20de%20santa%20fe%20de%20bogota.pdf (accessed on 1 October 2023).
- Lizarazo, P. La Integración de La Región Capital Hacia 2038; Subdirección Imprenta Distrital DDD: Bogotá, Colombia, 2011. [Google Scholar]
- Alfonso Piña, W.H.; Pardo Martínez, C.I. Urban Material Flow Analysis: An Approach for Bogotá, Colombia. Ecol. Indic. 2014, 42, 32–42. [Google Scholar] [CrossRef]
- López Hernández, C.N.; Jaramillo Garcés, M.M.; Avendaño, A.J.; Pérez Otavo, D.; Romero, Y.E.; Gaitán Victoria, C.E. Indicadores de Consumo de Agua y Energia Eléctrica; Alcaldia Mayor de Bogotá, Secretaria de Planeación: Bogotá, Colombia, 2020. [Google Scholar]
- Ávila, G. Estudio de La Retracción y El Agrietamiento de Arcillas. Aplicación a La Arcilla de Bogotá; Universitat Politècnica de Catalunya: Barcelona, Spain, 2004. [Google Scholar]
- Fárová, K.; Jelének, J.; Kopačková-Strnadová, V.; Kycl, P. Comparing DInSAR and PSI Techniques Employed to Sentinel_1 Data to Monitor Highway Stability_ A Case Study of a Massive Dobkovičky Landslide_Czech Republic.Pdf. Remote Sens. 2019, 11, 2670. [Google Scholar] [CrossRef]
- Zhong, L.; Jixian, Z.; Yonghong, Z.; Dzurisin, D. Monitoring and Characterizing Natural Hazards with Satellite InSAR Imagery. Ann. GIS 2010, 16, 55–66. [Google Scholar] [CrossRef]
- Perissin, D. Interferometric SAR Multitemporal Processing: Techniques and Applications. Remote Sens. Digit. Image Process. 2016, 20, 145–176. [Google Scholar] [CrossRef]
- Ferretti, A.; Prati, C.; Rocca, F. Permanent Scatterers in SAR Interferometry. IEEE Trans. Geosci. Remote Sens. 2001, 39, 8–20. [Google Scholar] [CrossRef]
- Mora, O.; Lanari, R.; Mallorqui, J.J.; Berardino, P.; Sansosti, E. A New Algorithm for Monitoring Localized Deformation Phenomena Based on Small Baseline Differential SAR Interferograms. In Proceedings of the IEEE International Geoscience and Remote Sensing Symposium, Toronto, ON, Canada, 24–28 June 2002; Volume 2, pp. 1237–1239. [Google Scholar] [CrossRef]
- Hooper, A.J. A Multi-Temporal InSAR Method Incorporating Both Persistent Scatterer and Small Baseline Approaches. Geophys. Res. Lett. 2008, 35, 1–5. [Google Scholar] [CrossRef]
- Crosetto, M.; Monserrat, O.; Cuevas-González, M.; Devanthéry, N.; Crippa, B. Persistent Scatterer Interferometry: A Review. ISPRS J. Photogramm. Remote Sens. 2016, 115, 78–89. [Google Scholar] [CrossRef]
- Hooper, A.; Bekaert, D.; Spaans, K.; Arikan, M. Recent Advances in SAR Interferometry Time Series Analysis for Measuring Crustal Deformation. Tectonophysics 2012, 514–517, 1–13. [Google Scholar] [CrossRef]
- Beladam, O.; Balz, T.; Mohamadi, B.; Abdalhak, M. Using Ps-Insar with Sentinel-1 Images for Deformation Monitoring in Northeast Algeria. Geosciences 2019, 9, 315. [Google Scholar] [CrossRef]
- IGAC. Red MAGNA ECO. Available online: https://www.igac.gov.co/es/contenido/areas-estrategicas/red-magna-eco (accessed on 1 October 2023).
- IGAC. MAGNA-SIRGAS. Available online: https://www.igac.gov.co/es/contenido/areas-estrategicas/magna-sirgas (accessed on 1 October 2023).
- SIRGAS. SIRGAS: Sobre Nosotros. Available online: https://www.sirgas.org/es/sirgas-definition/ (accessed on 1 October 2023).
- Sánchez, L.; Drewes, H.; Brunini, C.; Mackern, M.V.; Martínez-Díaz, W. SIRGAS Core Network Stability; Springer: Cham, Switzerland, 2015; pp. 183–191. [Google Scholar] [CrossRef]
- Sánchez, L.; Drewes, H. Crustal Deformation and Surface Kinematics after the 2010 Earthquakes in Latin America. J. Geodyn. 2016, 102, 1–23. [Google Scholar] [CrossRef]
- Sánchez, L.; Drewes, H. Geodetic Monitoring of the Variable Surface Deformation in Latin America. In Beyond 100: The Next Century in Geodesy, Proceedings of the IAG General Assembly, Montreal, QC, Canada, 8–18 July 2019; Springer International Publishing: Cham, Switzerland, 2020. [Google Scholar] [CrossRef]
- Escobar Castro, G.; Marantes González, L.E.; Lindon Losada, G.P.; Díaz Parra, F.J. Zonificación de la Respuesta Sísmica de Bogotá para el Diseño Sismo Resistente de Edificaciones; Bogotá. D.C. 2010. Available online: https://www.idiger.gov.co/documents/20182/112614/Zonificacion_Respuesta_Sismica-FOPAE-2010.pdf (accessed on 1 October 2023).
- Kaniuth, K.; HäfeleHafele, P.; Sánchez, L. Subsidence of the Permanent GPS Station Bogotá. In Vertical Reference Systems. International Association of Geodesy Symposia, vol 124.; Drewes, H., Dodson, A.H., Fortes, L.P.S., Sánchez, L., Sandoval, P., Eds.; Springer: Berlin/Heidelberg, Germany, 2002; pp. 56–59. [Google Scholar] [CrossRef]
- Rudenko, S.; Schön, N.; Uhlemann, M.; Gendt, G. Reprocessed Height Time Series for GPS Stations. Solid Earth 2013, 4, 23–41. [Google Scholar] [CrossRef]
- Mora–Páez, H.; Kellogg, J.N.; Freymueller, J.T. Contributions of Space Geodesy for Geodynamic Studies in Colombia: 1988 to 2017. In LR Lloyd’s Register; Gómez, J., Pinilla–Pachon, A.O., Eds.; Servicio Geológico Colombiano: Bogotá, Colombia, 2019; Volume 100, pp. 479–498. [Google Scholar] [CrossRef]
- Lobo-Guerrero, A. Effects of Aquifer Overexploitation on the Surface Infrastructure in the Bogotá Sabana (Colombia). RMZ-Mater. Geoenviron. 2003, 50, 193–196. [Google Scholar]


| No. | I | II | III | IV | V | VI | VII | VIII | IX |
|---|---|---|---|---|---|---|---|---|---|
| Sub–basins | Sisga | Tominé | Teusacá | Neusa | Fontibón | Chicú | Subachoque | Basillas | Tunjuelito |
| No. | Sub–Basin | Aquifer Related | Fluctuation Analysis Static Level |
|---|---|---|---|
| I | Sisga | Paleogene Cretaceous Guadalupe | * |
| Quaternary Neogene | <5 m | ||
| II | Tominé | Paleogene Cretaceous Guadalupe | * |
| Quaternary Neogene | Declines of 5 m | ||
| III | Teusacá | Paleogene Cretaceous Guadalupe | * |
| Quaternary Neogene | Gradual Declines between 5 and 10 m | ||
| IV | Neusa | Paleogene Cretaceous Guadalupe | Declines between 1 and 10 m |
| Quaternary Neogene | Declines of 10 m | ||
| V | Fontibón | Paleogene cretaceous Guadalupe | * |
| Quaternary Neogene | Declines between 5 and 15 m | ||
| VI | Chicú | Paleogene Cretaceous Guadalupe | Declines between 15 and 50 m |
| Quaternary Neogene | Declines between 5 and 25 m | ||
| VII | Subachoque | Paleogene Cretaceous Guadalupe | * |
| Quaternary Neogene | Declines between 10 and 30 m | ||
| VIII | Basillas | Paleogene Cretaceous Guadalupe | * |
| Quaternary Neogene | Declines between 5 and 15 m | ||
| IX | Tunjuelito | Paleogene Cretaceous Guadalupe | * |
| Quaternary Neogene | Declines between 5 and 15 m |
| Parameter | Ascending | Descending | Acquisition Mode |
|---|---|---|---|
| Acquisition period | 15 October 2014–29 May 2021 | 10 October 2014–24 May 2021 | Interferometric Wide (IW) |
| Total Number of Scenes in period | 107 | 153 | |
| Track Number | 150 | 69 | |
| Look Angle (°) | 39.33° | 39.56° | |
| Heading Azimuth (°) | 348.33° | 191.65° | |
| Number of PS Points Generated | 263,669 | 284,778 |
| Zone | Neighborhoods | Deformation Rates [mm/yr] | Description of Buildings Surroundings the Analysis Neighborhoods | |
|---|---|---|---|---|
| Max | Min | |||
| 1 | Aeropuerto El Dorado | −11.6 | −4 | |
| 2 | Álamos | −24.4 | −2.5 | Warehouses Area and Residential Buildings |
| 3 | Bavaria | −15 | −2 | New Residential Buildings |
| 4 | Bolivia | −19 | −4.3 | New buildings; Residential Buildings Area |
| 5 | Boyacá Real | −23 | −5 | Residential Buildings Area |
| 6 | Calandaima | −29 | 0 | New Residential Buildings |
| 7 | Capellanía | −17.6 | −4.7 | Warehouses Area and Residential Buildings |
| 8 | Castilla | −12 | −1 | |
| 9 | Chicó Lago | −20 | 0 | Residential Buildings |
| 10 | Ciudad Salitre Occidente. | −24 | −1 | Residential Buildings |
| 11 | Ciudad Salitre Oriente. | −27.7 | −5.8 | Residential Buildings and Warehouses Area |
| 12 | Doce de Octubre | −24 | −5 | Residential Buildings |
| 13 | El Porvenir | −26.6 | 0 | New Residential Buildings |
| 14 | Engativá | −17.1 | −5 | Warehouses Area and Residential Buildings |
| 15 | Fontibón | −35.4 | −4.4 | Warehouses Area and Residential Buildings |
| 16 | Fontibón San Pablo | −16.5 | −2.6 | Warehouses and Industrial Area |
| 17 | Galerias | −22.6 | −1.9 | Residential Buildings |
| 18 | Garces Navas | −37.1 | −5 | New Residential Buildings |
| 19 | Granjas de Techo | −33.1 | −2 | Warehouses Area |
| 20 | Jardin Botanico | −30 | −8.2 | Residential Buildings and Sports Areas |
| 21 | La Esmeralda | −23 | −5 | Residential Buildings |
| 22 | Las Ferias | −26.1 | −1 | New Residential Buildings |
| 23 | Los Alcazares | −31 | −3.7 | Warehouses Area and Residential Buildings |
| 24 | Minuto de Dios | −14 | 0 | Residential Buildings |
| 25 | Modelia | −17 | −3.7 | Residential Buildings |
| 26 | Parque salitre | −38.1 | −9.6 | Parks; Green area; Residential area |
| 27 | Parque Simon Bolivar | −28.1 | −10 | Parks; Green area; Residential area |
| 28 | Patio Bonito | −20 | 0 | |
| 29 | Puente Aranda | −23 | −6 | Factories and Warehouses |
| 30 | Quinta Paredes | −21.3 | −1 | Residential Buildings |
| 31 | Santa Cecilia | −25.3 | −9 | Residential Buildings |
| 32 | Teusaquillo | −18.8 | 0 | Residential Buildings |
| 33 | Tintal Norte | −27 | 0 | |
| 34 | Tintal Sur | −18.9 | −2 | Warehouses Area and New Residential Buildings |
| 35 | Zona Franca | −24.5 | −1.2 | Warehouses Area and New Residential Buildings |
| GNSS Station | North [mm] | East [mm] | Up [mm] |
|---|---|---|---|
| ABCC | 170.69 ± 0.061 | −23.36 ± 0.115 | −197.06 ± 0.213 |
| BOGA | 427.51 ± 0.029 | −85.80 ± 0.045 | −861.84 ± 0.081 |
| BOGT | 309.28 ± 0.051 | −12.65 ± 0.116 | −641.12 ± 0.192 |
Disclaimer/Publisher’s Note: The statements, opinions and data contained in all publications are solely those of the individual author(s) and contributor(s) and not of MDPI and/or the editor(s). MDPI and/or the editor(s) disclaim responsibility for any injury to people or property resulting from any ideas, methods, instructions or products referred to in the content. |
© 2023 by the authors. Licensee MDPI, Basel, Switzerland. This article is an open access article distributed under the terms and conditions of the Creative Commons Attribution (CC BY) license (https://creativecommons.org/licenses/by/4.0/).
Share and Cite
Tamayo Duque, J.S.; Ruiz-Armenteros, A.M.; Ávila Álvarez, G.E.; Matiz, G.; Sousa, J.J. Study of Recent Deformations in the Bogotá Savanna and the City of Bogotá (Colombia) Using Multi-Temporal Satellite Radar Interferometry. Remote Sens. 2023, 15, 5249. https://doi.org/10.3390/rs15215249
Tamayo Duque JS, Ruiz-Armenteros AM, Ávila Álvarez GE, Matiz G, Sousa JJ. Study of Recent Deformations in the Bogotá Savanna and the City of Bogotá (Colombia) Using Multi-Temporal Satellite Radar Interferometry. Remote Sensing. 2023; 15(21):5249. https://doi.org/10.3390/rs15215249
Chicago/Turabian StyleTamayo Duque, Juan S., Antonio Miguel Ruiz-Armenteros, Guillermo E. Ávila Álvarez, Gustavo Matiz, and Joaquim J. Sousa. 2023. "Study of Recent Deformations in the Bogotá Savanna and the City of Bogotá (Colombia) Using Multi-Temporal Satellite Radar Interferometry" Remote Sensing 15, no. 21: 5249. https://doi.org/10.3390/rs15215249
APA StyleTamayo Duque, J. S., Ruiz-Armenteros, A. M., Ávila Álvarez, G. E., Matiz, G., & Sousa, J. J. (2023). Study of Recent Deformations in the Bogotá Savanna and the City of Bogotá (Colombia) Using Multi-Temporal Satellite Radar Interferometry. Remote Sensing, 15(21), 5249. https://doi.org/10.3390/rs15215249