Article

Outbreak Mechanism of Locust Plagues under Dynamic Drought and Flood Environments Based on Time Series Remote Sensing Data: Implication for Identifying Potential High-Risk Locust Areas

1
Shenzhen Institutes of Advanced Technology, Chinese Academy of Sciences, Shenzhen 518055, China
2
Key Laboratory of Digital Earth Science, Aerospace Information Research Institute, Chinese Academy of Sciences, Beijing 100094, China
3
International Research Center of Big Data for Sustainable Development Goals, Beijing 100094, China
4
Space Engineering Development, China Aerospace Science and Industry Co., Ltd., Beijing 100854, China
5
School of Automation, Hangzhou Dianzi University, Hangzhou 310018, China
*
Author to whom correspondence should be addressed.
Remote Sens. 2023, 15(21), 5206; https://doi.org/10.3390/rs15215206
Submission received: 25 September 2023 / Revised: 31 October 2023 / Accepted: 31 October 2023 / Published: 2 November 2023
(This article belongs to the Special Issue Remote Sensing of Climate-Related Hazards)

Abstract

:
Locust plagues inflict severe agricultural damage. Climate change-induced extreme events like rainfall and droughts have expanded locust habitats. These new areas, often beyond routine monitoring, could become potential high-risk locust areas (PHRLA). Quantitatively understanding the outbreak mechanism driving drought and flood dynamics is crucial for identifying PHRLA, but such studies are scarce. To address this gap, we conducted a case study on locust outbreaks in Xiashan Reservoir, the largest reservoir in Shandong Province, China, in 2017 and 2018. Using time series satellite imagery and meteorological products, we quantitatively analyzed how drought–flood dynamics and temperature affect locust habitats, reproduction, and aggregation. Employing an object-oriented random forest classifier, we generated locust habitat classification maps with 93.77% average overall accuracy and Kappa coefficient of 0.90. Combined with meteorological analysis, we found that three consecutive drought years from 2014 to 2016 reduced the water surface area by 75%, expanding suitable habitats (primarily reeds and weeds) to cover 60% of the reservoir. Warm winters and high temperatures during locust key growth periods, coupled with expanding suitable habitats, promoted multi-generational locust reproduction. However, substantial flooding events in 2017 and 2018, driven by plentiful rainfall during key growth periods, reduced suitable habitats by approximately 54% and 29%, respectively. This compression led to high locust density, causing the locust plague and high-density spots of locusts (HDSL). Our study elucidates locust plague outbreak mechanisms under dynamic drought and flood environments. Based on this, we propose an approach to identify PHRLA by monitoring changes in drought and flood patterns around water bodies and variations in suitable habitat size and distribution, as well as surrounding topography. These findings hold significant implications for enhancing locust monitoring and early warning capabilities, reducing pesticide usage, and ensuring food and ecological security and sustainable agriculture.

Graphical Abstract

1. Introduction

Locust plagues can cause devastating hits to agricultural production. In China, the Oriental migratory locust (Locusta migratoria manilensis (Meyen.)) (OML, referred to as locust hereafter) stands out as one of the most destructive locust pests. Its extensive distribution and frequent outbreaks pose a severe threat to both food security and regional stability [1,2,3]. Presently, diligent efforts by plant protection departments have effectively controlled locust occurrence in conventional areas where locusts occur annually. However, recent years have witnessed a surge in extreme rainfall and drought events due to climate change, which have led to the continuous formation of new suitable habitats for locusts [4,5,6,7]. Many of these habitats are unfrequented and beyond the scope of routine human monitoring, making these areas prone to becoming potential high-risk locust areas (PHRLA), which could trigger locust outbreaks. Due to the long-distance migration capabilities and destructiveness of locust swarms, it is imperative to control them before they mature or aggregate [8,9,10] to prevent the potential water and soil pollution and environmental damage that may result from emergency chemical pesticide usage in responding locust outbreaks [11,12,13], which pose a great challenge to achieving sustainable agriculture [14,15]. All of the above issues underscore the critical importance of early warning and identifying PHRLA.
A traditional empirical method that relies on manual point-based field surveys to identify locust distribution areas is inefficient, time-consuming, and prone to oversights, making it unlikely to offer effective and targeted support for locust management [16,17]. Satellite-based remote sensing technology is a valuable tool for large-scale locust habitat monitoring and breeding area identification [8,18,19,20]. Numerous scholars have applied it to monitor locust habitat factors, classify habitats, assess habitat suitability, and identify breeding areas [21,22,23,24,25]. The formation of PHRLA is a dynamic development process consisting of forming and extending suitable habitats and reproducing and aggregating locusts under the influence of climate. However, existing remote sensing-based studies in this field are largely based on static habitat conditions without considering their dynamic changes and the coupled effects of long-term climate conditions [17,26,27,28]. This limitation hinders the timely capture of the evolution of habitats from unsuitable to suitable and the accumulation of the locust population, making it challenging to realize the early identification of PHRLA.
Extensive studies have shown that, unlike other migratory locust species, such as the Desert locusts and the Australian plague locusts, which are mainly affected by rainfall and its distribution [6,29], the outbreaks of OMLs are closely related to droughts and/or floods [3,30,31,32]. Continuous drought can provide suitable habitats for locusts, and floods caused by a sudden increase in rainfall after a long-term drought can compress the living space of locusts and promote the aggregation of locusts, thus causing locust plagues [30,33,34]. Therefore, drought and flood dynamics could be essential indicators for identifying the PHRLA. Although so many studies have long discussed their impacts on locust outbreaks, these studies were primarily qualitative correlation analyses based on the historical statistical data of locust plagues, droughts, and floods in terms of occurrence area and frequency [3,35,36,37,38]. As for how droughts and floods affect the dynamics of suitable habitats and locust population density, as well as how to locate PHRLA based on dynamic changes in droughts and floods, there are currently no quantitative interpretations or corresponding research available [9]. Answering these questions, namely, elucidating the outbreak mechanism of locust plagues under dynamic drought and flood environments, is a prerequisite for achieving the early warning and identification of PHRLA.
Time series remote sensing data, including satellite imagery and meteorological products, offer a promising solution to address the above challenges. Taking the locust plague that occurred in 2017 and high-density locust spots (HDSL) found in 2018, in the Xiashan Reservoir, the largest reservoir in Shandong Province, China, as case studies, this study quantitatively explores the impacts of drought–flood dynamics and temperature conditions on locust habitat, reproduction, and aggregation using long-term remote sensing data. This study aims to enhance locust monitoring and early warning capabilities within the context of climate change, reduce pesticide consumption, and ensure food security, ecological stability, and sustainable agriculture. The specific objectives are (1) to clarify the outbreak process of the locust plague in 2017 and the HDSL in 2018; (2) to elucidate the mechanisms behind locust plague outbreaks in dynamic drought and flood environments; and (3) to propose an approach for early warning and identifying PHRLA.

2. Materials and Methods

2.1. Study Area

The study area is located in the western part of Shandong Peninsula with the Xiashan Reservoir in the middle, facing the Yellow Sea to the east. The Wei River flows into the reservoir from the south and northwards into Bohai Bay (Figure 1a,b). The study area features a warm temperate continental monsoon climate with four distinct seasons. Rainfall here exhibits strong seasonality, abundant in the summer but less so in spring, autumn, and winter [39]. The Xiashan Reservoir has a controlled watershed area of 4210 km2. Eighty percent of the runoff of the reservoir comes from natural precipitation [40]. During dry years, reeds and weeds will grow in the reservoir, providing suitable habitats for locusts. There is a large area of cropland around the reservoir, mainly wheat, corn, millet, sorghum, rice, etc., most of which are favorable plants for locusts (Figure 1c). Once locusts break out here, the powerful long-distance mobility and huge appetite of locust swarms will seriously affect local agricultural production.

2.2. Biological Characteristics of the OML

2.2.1. Annual Life History

The life cycle of an OML consists of three stages: egg, nymph, and adult. The OMLs produce two generations per year in the study area, the summer locust (SL) and the autumn locust (AL). The summer locusts (SLs) lay eggs in the soil, and the eggs hatch into AL nymphs. The autumn locusts (ALs) lay eggs after maturating to adults, which overwinter in the soil and hatch into SL nymphs the following year. In drought and high-temperature years, there could be three generations [41]. Therefore, the OML life cycle can be divided into four key growth periods: (1) the incubation period, which is the egg stage in the soil before hatching into nymphs in spring; (2) the developmental period, which is the nymph stage (including 1st to 5th instars) after hatching and before maturing into adults; (3) the oviposition period, which is the spawning stage after the adults mature; and (4) the overwintering period, which is the egg stage in the soil during winter. The duration of each growth period of two generations varies with season and temperature [42].

2.2.2. Behavior Habits

The OMLs prefer to inhabit areas of gramineous plants with vegetation coverage ranging from 15% to 75%, especially areas with coverage from 15% to 50% [1]. Typically, they are innocuous solitary individuals, but once their population density surpasses a specific threshold, approximately six individuals/m2 [43], a shift towards gregarious behavior occurs as a consequence of inter-individual contact, which prompts locusts to gather in groups, subsequently leading to detrimental effects [5,44,45]. Upon reaching the adult stage, the previously solitary nymph groups transition into flyable locust swarms [46]. In cases of insufficient food supply, locusts’ migratory habitat will be triggered [47,48], provoking these locusts to migrate into croplands, causing extensive destruction to agricultural productivity.

2.3. Data Acquisition and Processing

2.3.1. Satellite Remote Sensing Images

Time series Landsat Operational Land Imager images with a 30 m spatial resolution were employed to monitor the locust habitat dynamics. The life cycle of SLs spans from May to July, while that of ALs extends from July to October. Notably, the study area experiences its primary rainy season between May and September. Our preliminary survey identified a decline in the water level of the Xiashan Reservoir, starting in the latter half of 2014. Considering the availability of high-quality (cloud-free or low cloud cover) remote sensing images, we selected data acquired in late May or mid-June, as well as late September, from 2014 to 2018 for monitoring the habitat dynamics of the SLs and Als, respectively. A total of 10 Landsat images (two per year), each with cloud coverage below 1%, were chosen for locust habitat classification. Specific dates and cloud cover conditions for each image are provided in Table 1. All results obtained in this study were standardized to the WGS_1984_UTM_Zone_50N coordinate system (For details, see https://epsg.io/32650 (accessed on 6 May 2022)) in ArcGIS 10.6.

2.3.2. Remote Sensing-Based Meteorological Products

Hourly monthly Tropical Rainfall Measuring Mission (TRMM) data, obtained from microwave and visible infrared sensors at a spatial resolution of 0.25 degrees [49] and provided by NASA’s Goddard Earth Sciences Data and Information Services Center (NASA GES DISC, Greenbelt, MD, USA), were used to monitor the drought and flood dynamics of the study area. This dataset represents the precipitation rate (mm/h), and it has been verified to have high reliability in the study area (see Supplementary Materials). Additionally, the monthly Climate Reanalysis ERA5-Land dataset, with a spatial resolution of 11,132 m [50], provided by the European Centre for Medium-Range Weather Forecasts (ECMWF), was adopted to investigate temperature conditions for locust reproduction. OMLs typically deposit their eggs at soil depths of 5–10 cm [51], and the hatched nymphs exhibit activity within approximately 50 cm above the ground [52,53]. Therefore, this study selected soil temperature (ST) at a depth of 0–7 cm and earth surface temperature (EST) data from the ERA5-Land dataset to examine the impacts of temperature conditions on locust reproduction during various growth periods.

2.3.3. Ground Survey Data of Locusts

Ground survey data included locust occurrence, damage statistics, and control measures, sourced from the Shandong Plant Protection Station, news reports, and literature reviews. In September 2017, locusts invaded 66.67 hectares of maize fields across five villages located beyond the northeastern dam of the Xiashan Reservoir, marked as yellow points in Figure 1c (villages 1 to 5). Locust population density ranged from 3 to 5 individuals/m2, with local aggregations peaking at 100 individuals/m2, resulting in a crop yield reduction of 20% to 30% [54]. These migratory locusts originated from the barren grasslands of the Xiashan Reservoir, spanning over 500 hectares, with densities ranging from 10 to 20 individuals/m2. By June 2018, five HDSLs were identified, collectively covering 460 hectares, with densities ranging from 50 to 60 individuals/m2 and a maximum exceeding 100 individuals. One HDSL was situated in Houdian Village’s waste grasslands, depicted as a beryl green point in Figure 1c (village 6), along the southeastern reservoir bank.
To counter the 2017 locust invasion in maize fields, helicopters and drones were deployed to spray low-toxic pesticides outside the dam, treating an area of 3000 hectares. In 2018, environmentally sustainable biological control measures were implemented within a 1000 m distance of the reservoir to protect its water resources. Meanwhile, chemical pesticides were judiciously administered to manage the HDSLs located 1000 m away from the water resources, covering a total area of 2800 hectares from June to July.

2.3.4. Habitat Classes and Reference Data Selection
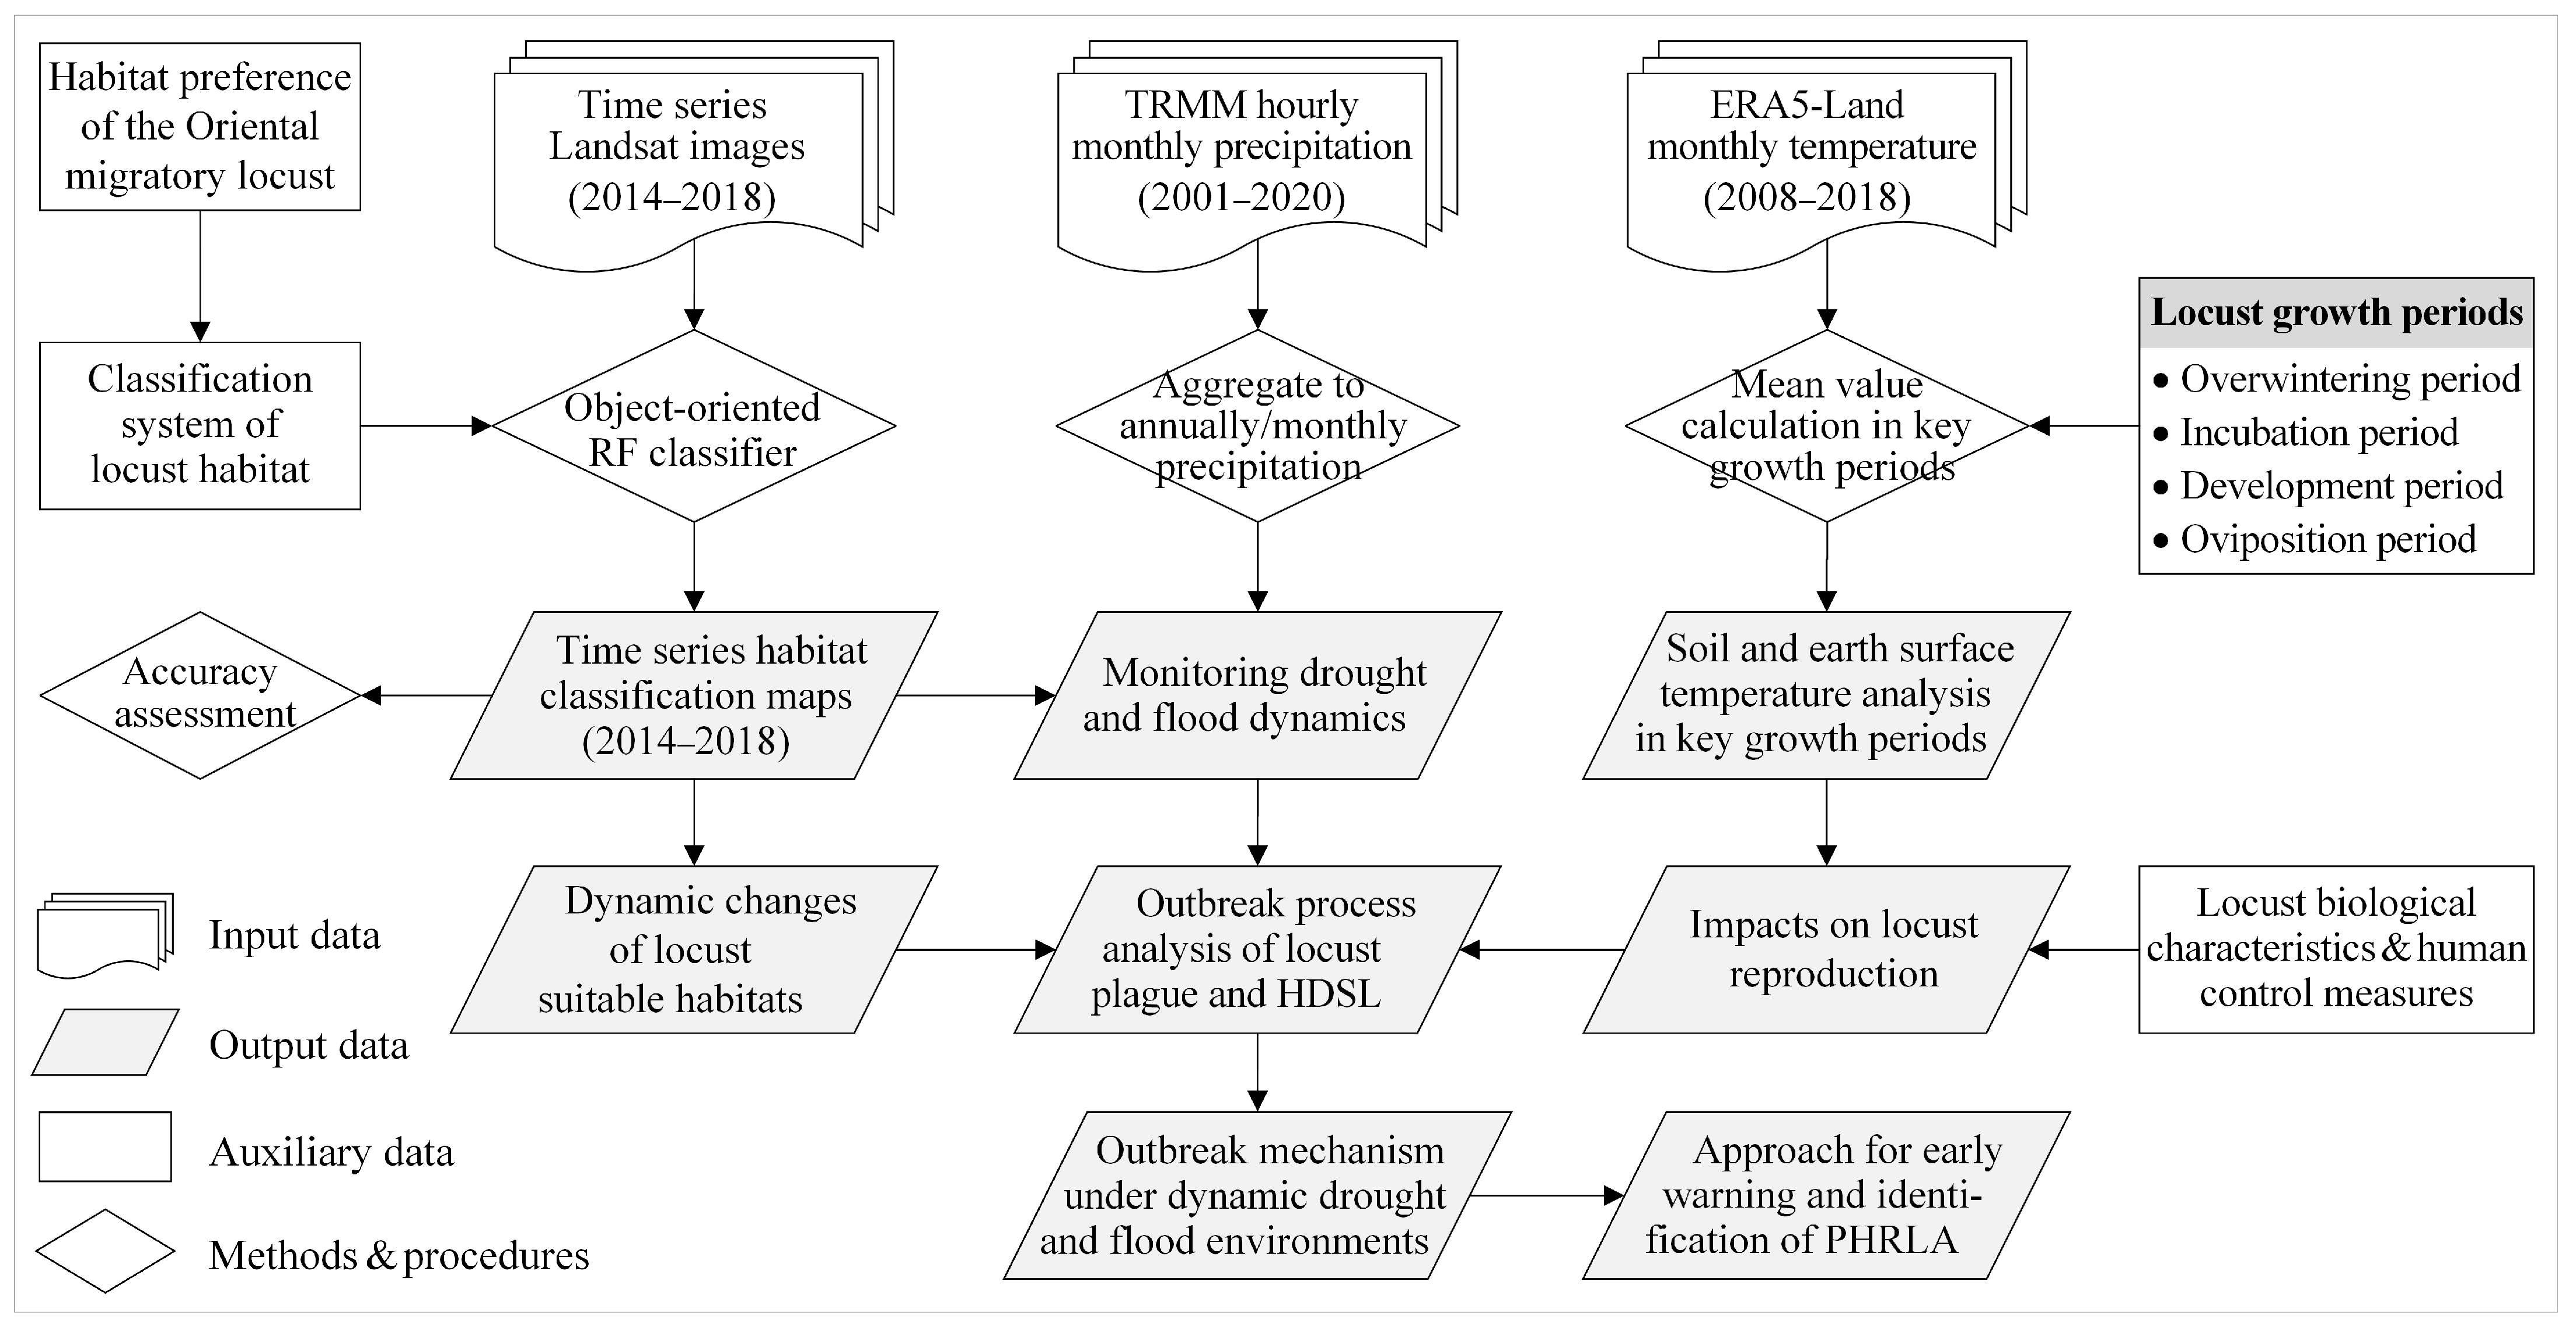
According to the habitat preference of OMLs and the ecological environment of the study area, seven habitat classes were formed in this study, i.e., cropland, reed wetland, reeds and weeds, woodland, water, artificial surface, and others. These habitat classes and their impact on locust breeding are detailed and described in Table 2.
Achieving high-precision habitat classification necessitates a reliable reference dataset, commonly known as a sample set. Hence, leveraging historical Google Earth high-resolution imagery, a sample dataset encompassing seven habitat classes was constructed from ten Landsat images. Pure pixels of only a single habitat type were visually identified. Early June and late September mark the harvesting seasons for wheat and corn within the study area, making it challenging to accurately identify cropland due to the phenomena of a foreign spectrum for the same object. To overcome this issue, an extensive collection of samples was amassed to comprehensively grasp the features of each habitat type. Table 3 presents the number of labeled reference pixels for each habitat type across the ten images. These samples were collected manually in ArcGIS 10.6 and subsequently employed in classifier training and accuracy assessment.

2.4. Methods

The methodology of this study is shown in Figure 2, which illustrates the data used and the analytical processing steps. The time series Landsat images and long-term meteorological data were used to explore the outbreak mechanism of locust plagues under dynamic drought and flood environments. Firstly, the time series habitat classification maps were generated. Then, long-term precipitation data were utilized to monitor drought and flood dynamics. Following this, the impacts of temperature conditions on locust reproduction during different growth periods were analyzed. Finally, through analysis of the outbreak process of the locust plague and HDSL regarding the dynamics of habitat and locust populations, the outbreak mechanism of locust plagues under drought and flood dynamics was elucidated. Additionally, an approach for identifying the PHRLA was proposed. The fundamental techniques and methods employed are detailed below.

2.4.1. Object-Oriented Random Forest Classifier for Habitat Classification

Habitat classification maps can reflect the distribution area of suitable habitats for locusts, while time series maps can assist in identifying flood events by illustrating the changes in the area of water in the study area. The habitat classification maps were generated by using an object-oriented random forest classifier. Firstly, the normalized difference vegetation index (NDVI), the normalized difference water index (NDWI), the normalized difference built-up index (NDBI) [55], and the built-up index (BUI) [56] were calculated (Equations (1)–(4)). These indexes are good indicators for vegetation, water bodies, built-up areas, and barren land. The simple non-iterative clustering (SNIC) method [57] was used to segment the images. Samples for habitat classification obtained in Section 2.3.4 were used for classifier training and accuracy assessment at the ratio of 7:3. The original eight bands of Landsat OLI images and the above four indexes were used as feature inputs to the object-oriented random forest model (100 trees) to generate habitat classification maps from 2014 to 2018. The classification accuracy was assessed by confusion matrixes, including the user’s accuracy, producer’s accuracy, overall accuracy, and Kappa coefficient. The whole classification process was conducted on the Google Earth Engine (GEE) platform.
NDVI = (NIR − R)/(NIR + R)
NDWI = (G − NIR)/(G + NIR)
NDBI = (SWIR − NIR)/(SWIR + NIR)
BUI = NDBI − NDVI
where G, R, NIR, and SWIR are the reflectances of the green, red, near-infrared, and shortwave infrared bands.

2.4.2. Monitoring Drought and Flood Dynamics Based on Precipitation

Precipitation is the primary factor driving dynamic changes in droughts and floods. Prolonged precipitation deficits over several years can lead to drought conditions, while short-term high-intensity rainfall events occurring within a few months can result in flooding. Therefore, this study monitored the dynamic environments of drought and flood in the study area by analyzing the temporal variations in annual and monthly precipitation. Firstly, we computed the regional average monthly precipitation rate (mm/h) for the study area using the built-in algorithms image.reduceRegion and ee.Reducer.mean on the GEE platform. Subsequently, we aggregated and constructed time series data for monthly precipitation and annual total precipitation based on Equations (5) and (6), respectively. Finally, drought monitoring was achieved by comparing the annual total precipitation for each year with the multi-year average annual precipitation for the past 20 years (2001–2020). Years with annual precipitation at least 100 mm lower than the 20-year average were defined as drought years. Flood monitoring was accomplished through the comparison of the monthly precipitation sequences and area changes of the water bodies derived from habitat classification maps. When the cumulative precipitation exceeded 250 mm over a period of two consecutive months and the area of water bodies or reed wetlands increased significantly, we considered that a flooding event had occurred.
Pmonth = Phourly × 24 × Dmonth
P year = month = 1 12 P month
where Phourly represents the monthly precipitation rate in units of mm/h. Pmonth stands for monthly precipitation in units of mm; month = 1, 2, 3, … 12. Dmonth signifies the number of days in the corresponding month, and Pyear denotes the annual total precipitation in units of mm.

2.4.3. Analysis of Temperature Conditions in Key Locust Growth Periods

The reproduction of locusts is closely related to temperature, including both soil temperature (ST) and earth surface temperature (EST). ST affects the overwintering survival rate of locust eggs, the starting time of nymph hatching, and their hatching rate [42,58,59]. EST not only influences the survival rate and growth progress of nymphs but also influences the mating processes and egg-laying quantity and rate of adults [60,61]. Both factors collectively affect the locust reproductive population and generation number. Therefore, we constructed time series of the yearly data of the average temperature for the key growth periods of SLs and ALs within the ten years leading up to locust outbreaks (2008–2018). These key growth periods include the overwintering period (December of the previous year to February of the current year), the incubation period of SL (April and May), the development and oviposition periods of SL (June and July), the incubation period of AL (July and August), and the development and oviposition periods of AL (August and September). By comparing these yearly data with the ten-year average data, we analyzed the impacts of temperature conditions on locust reproduction, providing meteorological data support for the clarification of the outbreak mechanism of locust plagues under dynamic drought and flood environments.

3. Results

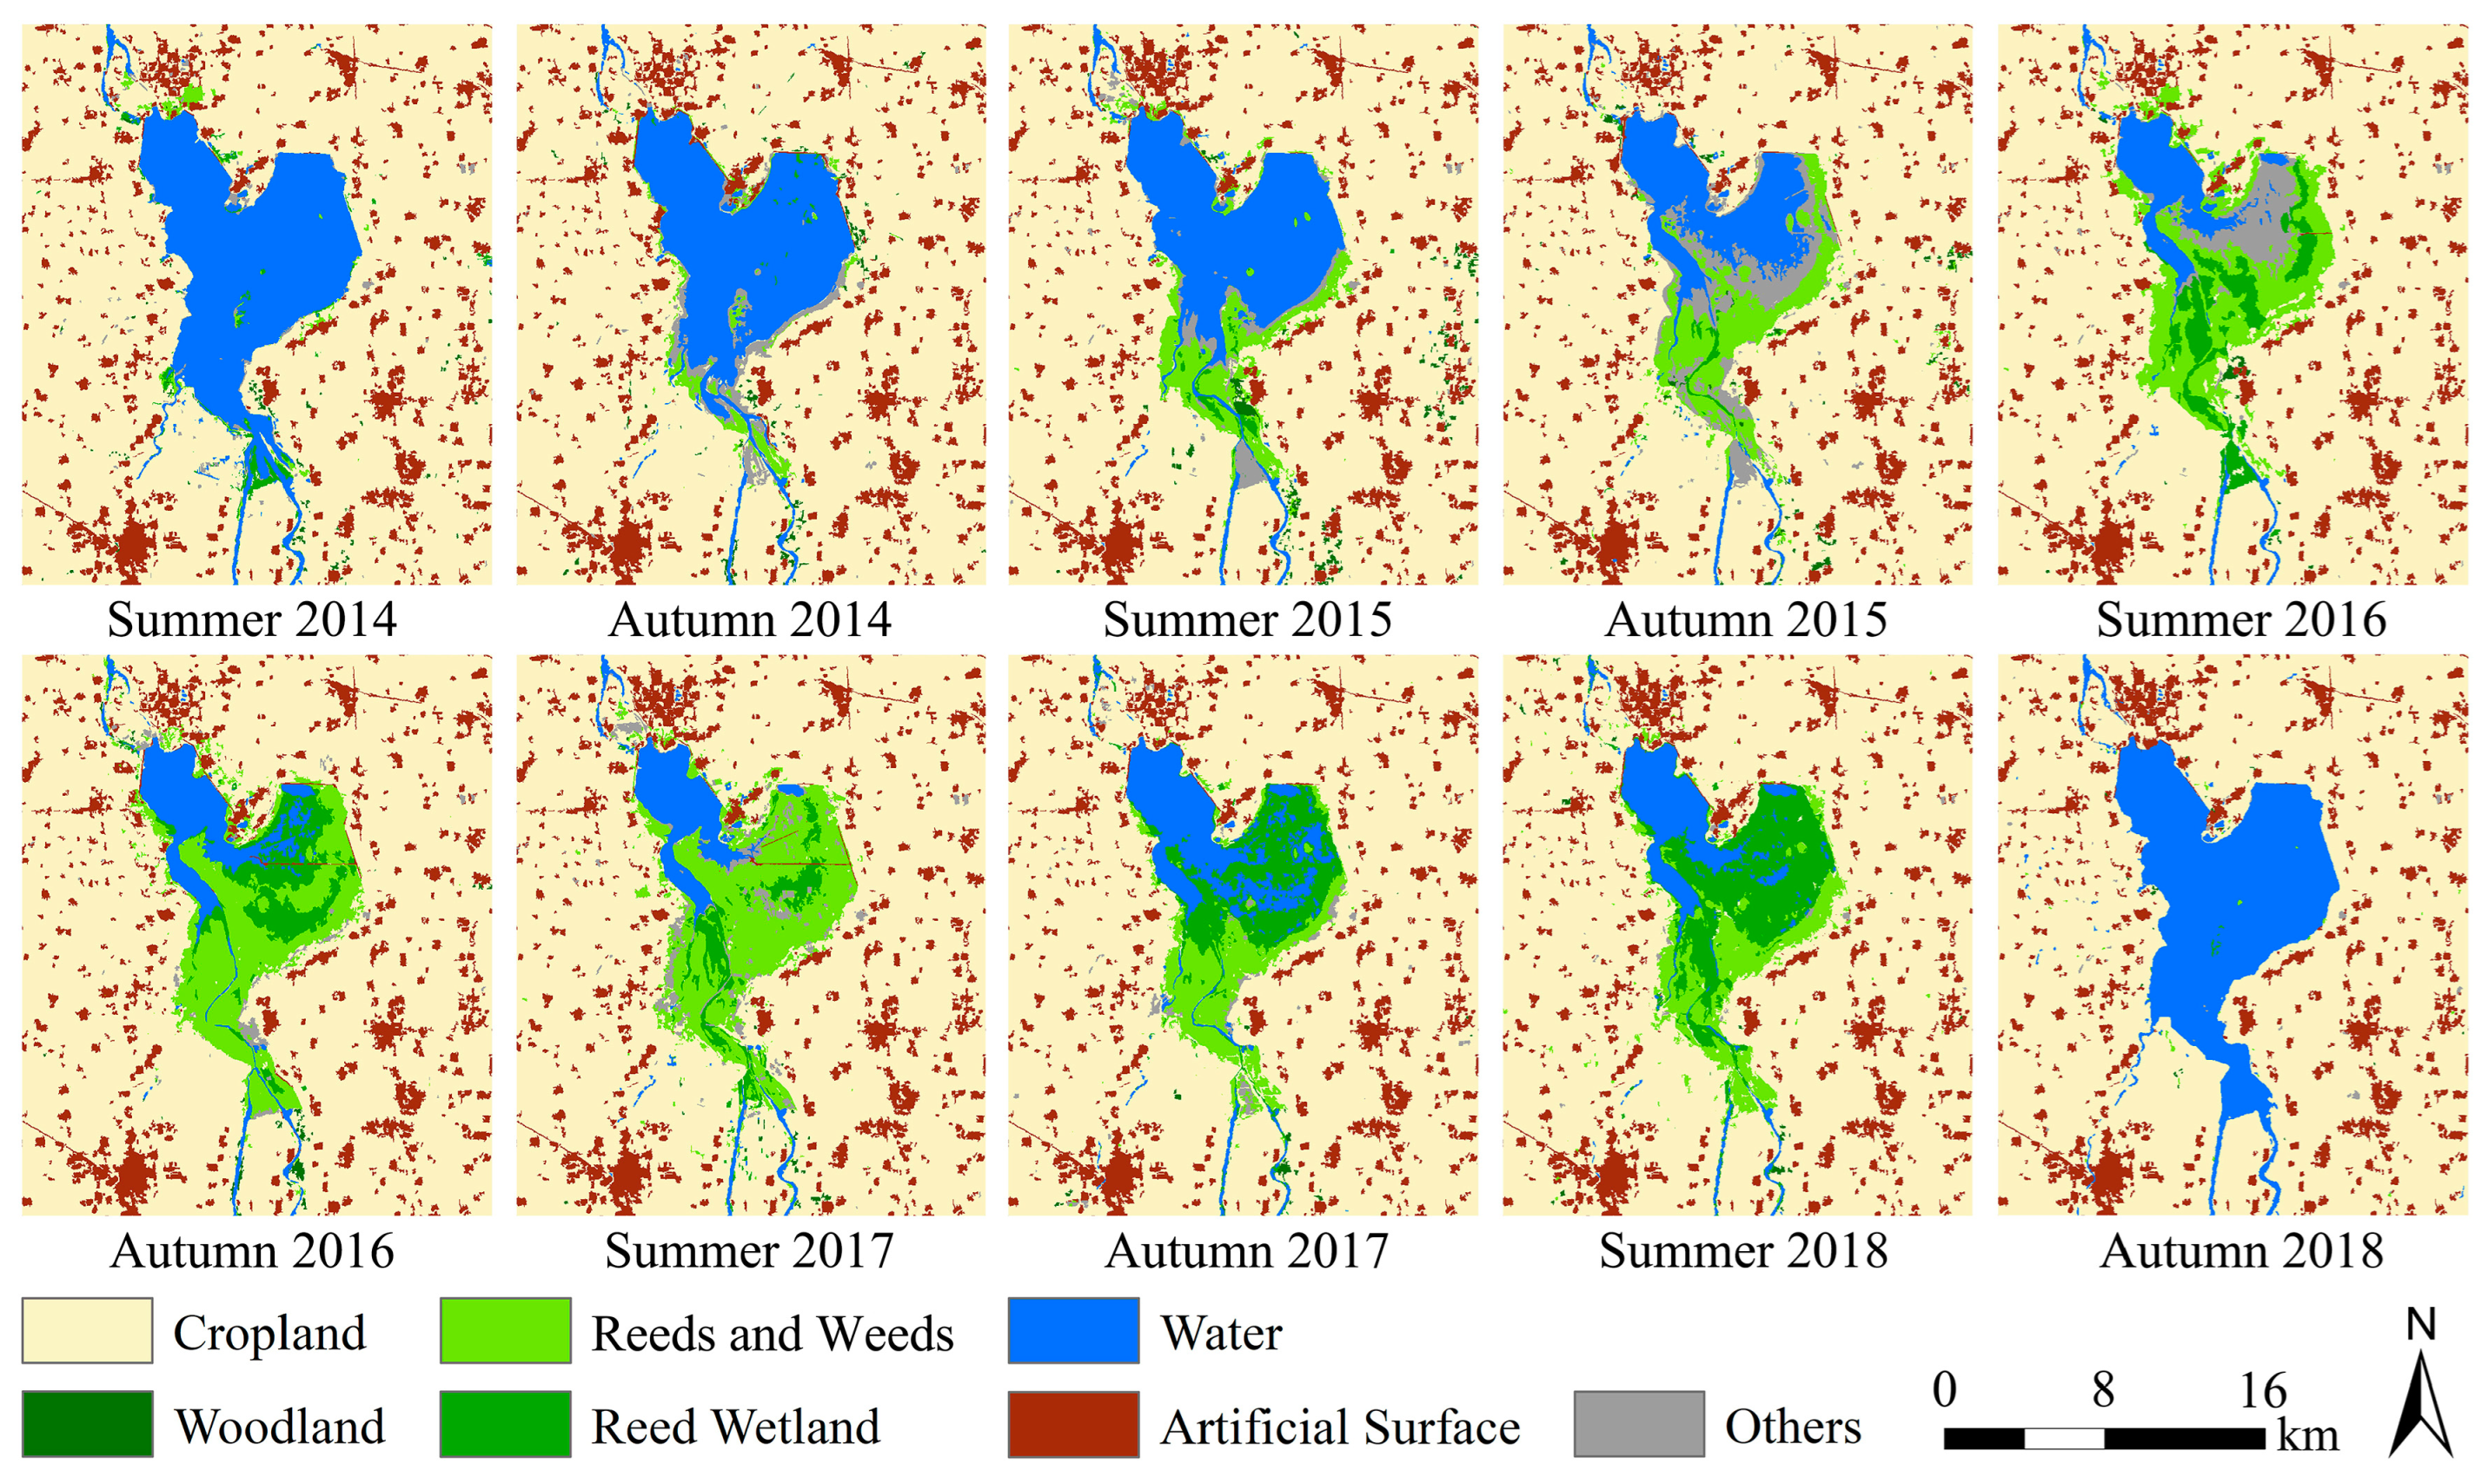
3.1. Habitat Classification Accuracy and Time Series Habitat Maps

A series of ten habitat classification maps for SLs and ALs from 2014 to 2018 were generated (Figure 3). The overall classification accuracy, as shown in Table 4, ranged from 91.58% to 94.87% with an average of 93.77%, and the average Kappa coefficient was 0.90, indicating a rather high classification precision. Nevertheless, we also observed instances of low user’s accuracies for certain habitat types (red shading cases in Table 4, lower than 70%), such as reed wetlands, reeds and weeds, woodland, and others. The analysis revealed that these instances occurred only when the habitat type area was very small (insufficient sample size). This is unlikely to affect subsequent analyses, as the classification results can ensure high accuracies for habitat types with strong impacts on locust reproduction (e.g., reeds and weeds and water) or with large areas.
As shown in Figure 3 and Figure 4, most of the study area was cropland with a stable area proportion of about 75%. The artificial surface was relatively stable, accounting for about 10%. The woodland area was the smallest, accounting for less than 1%. Other habitat types experienced significant area fluctuation. From 2014 to 2018, the water area of the Xiashan Reservoir decreased first and then increased, reaching the lowest (24.82 km2) in the summer of 2017, with the area shrinking by 75.11% from the original 99.73 km2. Simultaneously, the ranges of weeds and reeds increased at first and then decreased, and the area proportion of this habitat reached the maximum of 9.11% (62.98 km2) in the summer of 2017. The reed wetland area experienced two processes, an initial increase and then a decrease, and reached the highest (42.87 km2) in the summer of 2018, with a proportion of 6.20%. The ‘others’ habitat type, which was mainly mudflats formed by falling water levels, also experienced a trend of increasing and then decreasing, and the area was relatively large in the autumn of 2015 and the summer of 2016.
We know that the weed and reed habitat can provide the most suitable habitat for locust reproduction, including the whole process from egg hatching to nymph development and adult egg laying. The weed habitat can provide favorable plants for locusts. Figure 3 and Figure 4b demonstrated that, between the summers of 2015 and 2017, the weed and reed habitat consistently expanded from the southern upstream region of the reservoir towards the north and northeast, signifying the ongoing enlargement of suitable habitats for locusts. Simultaneously, the expanded weed habitat from summer 2016 to autumn 2017 could also offer sufficient food supply for the probable growing locust populations. All of these advantageous habitat conditions supported the multi-generation reproduction of the locusts.

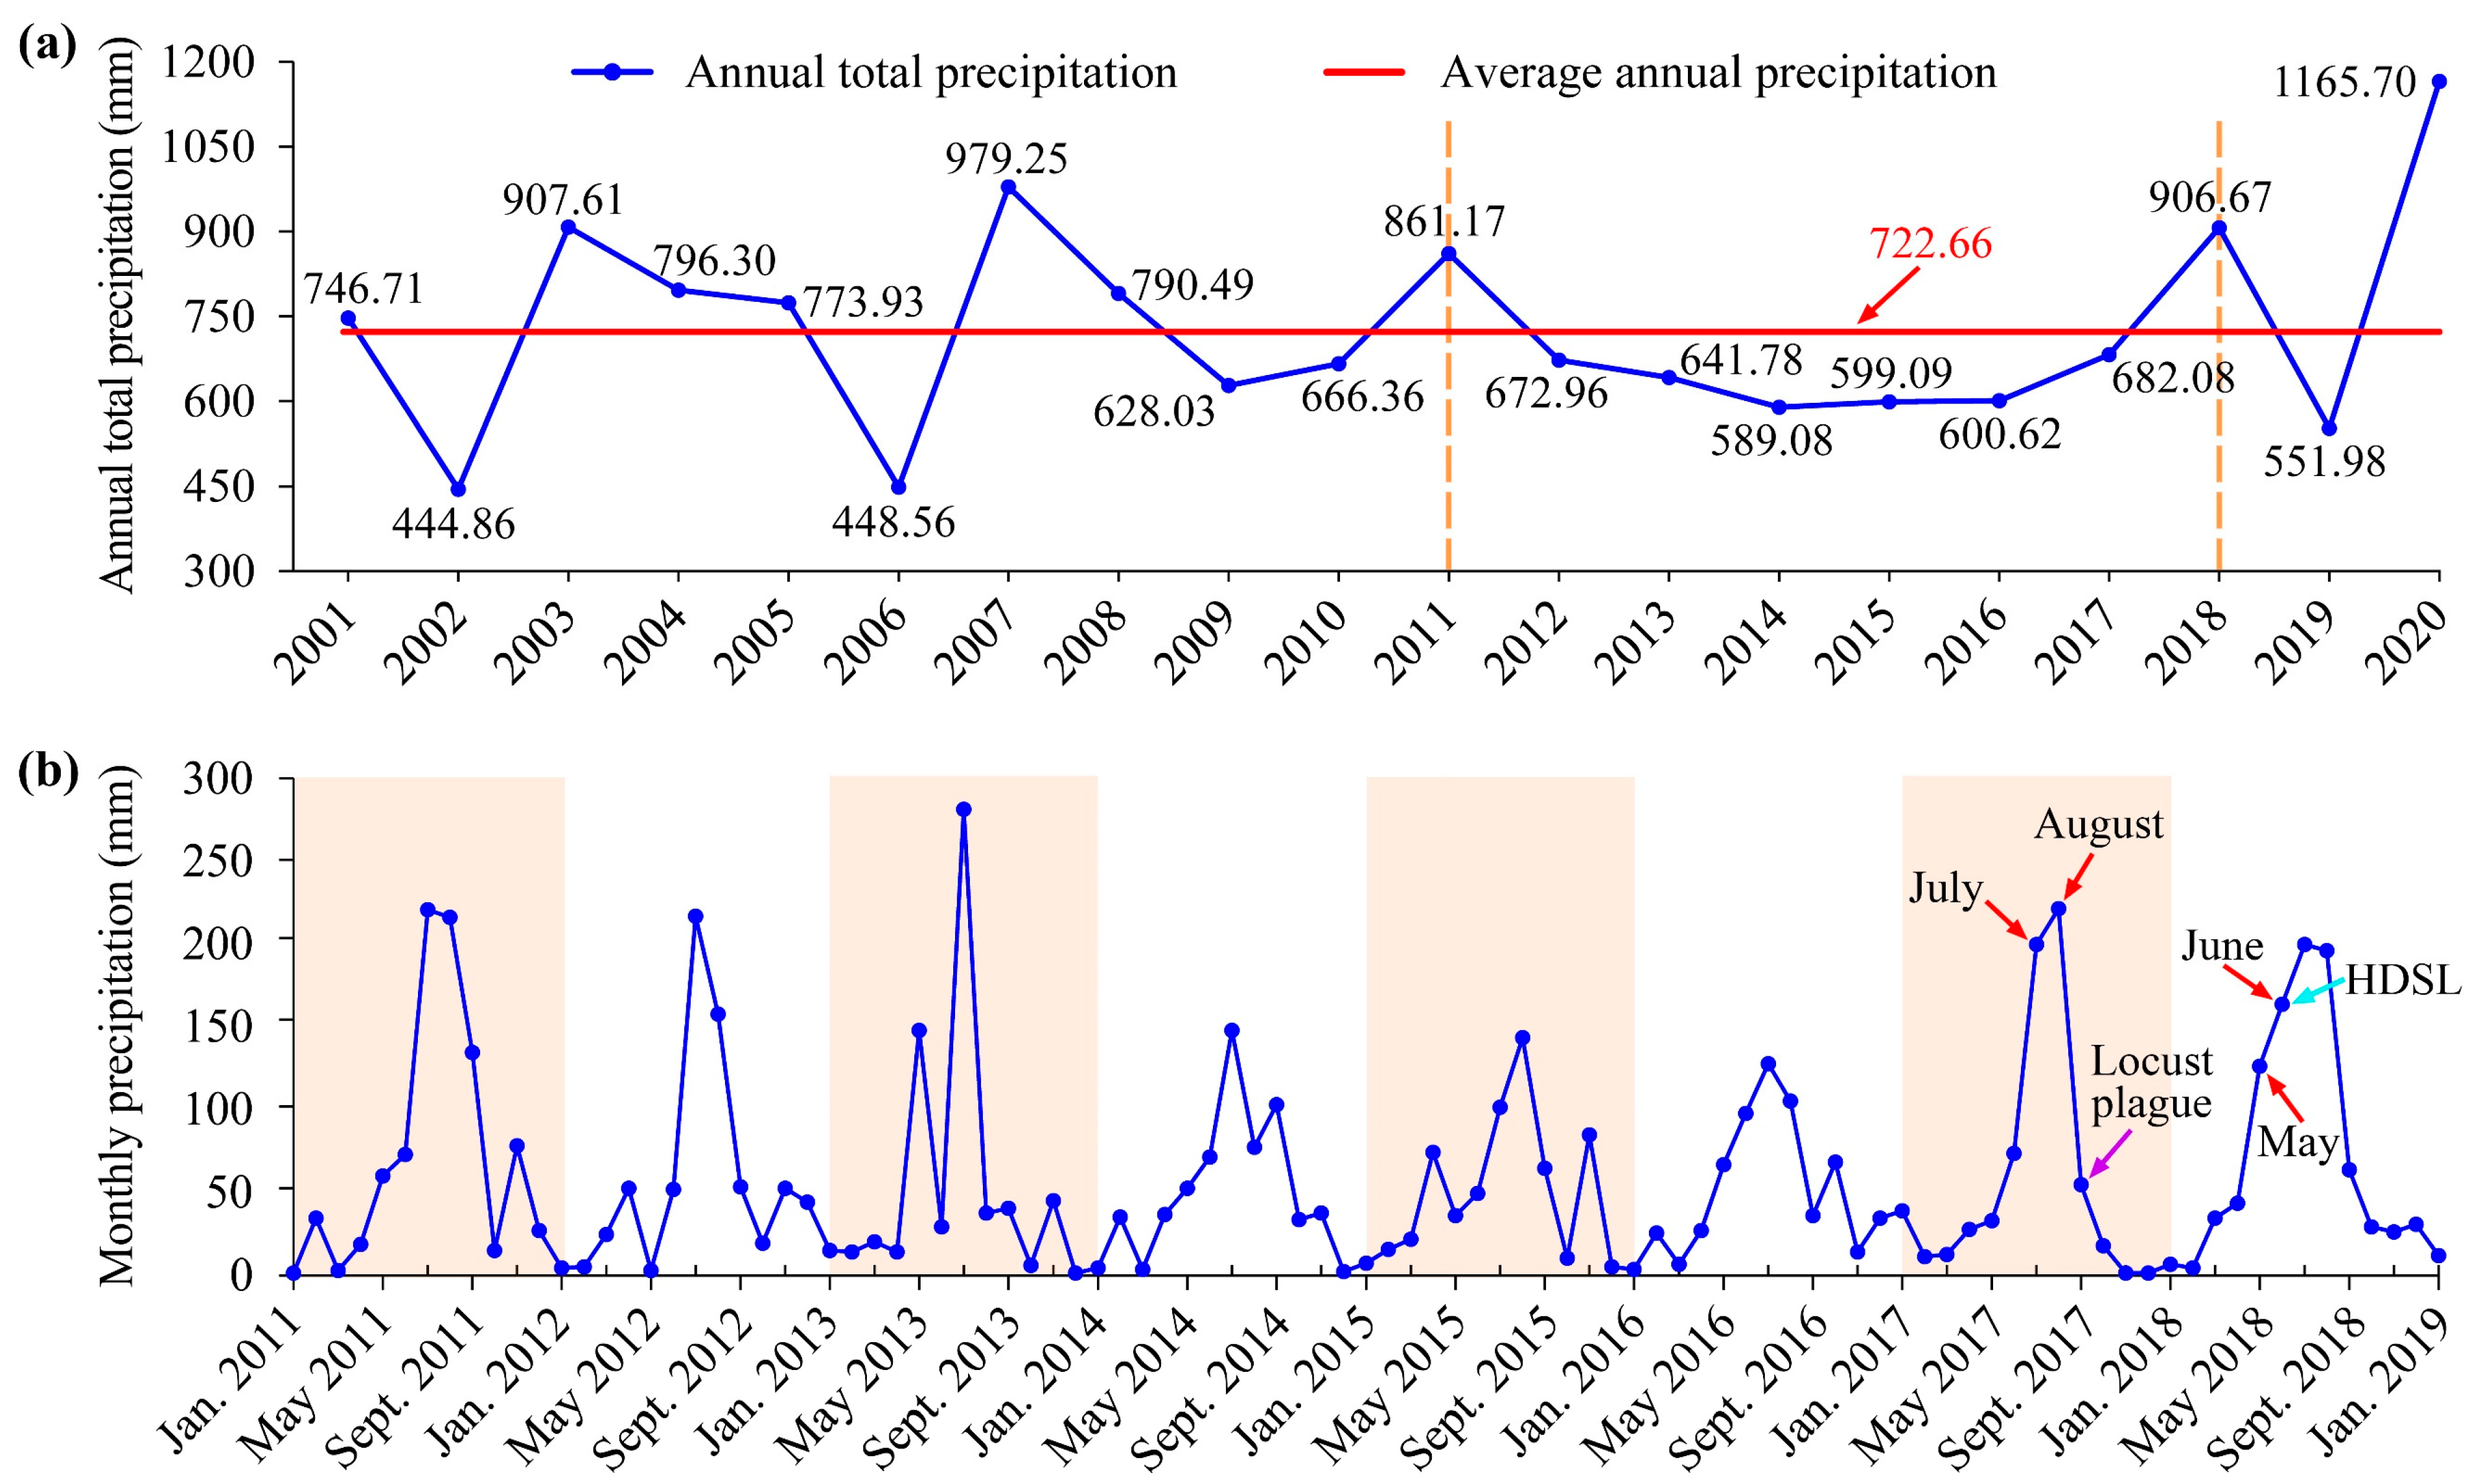
3.2. Dynamic Drought and Flood Environments of the Study Area

The interannual precipitation in the study area from 2001 to 2020 revealed that the precipitation during the years 2012 to 2017 was consistently lower than the 20-year average (722.66 mm). Notably, the years 2014 to 2016 experienced particularly low annual precipitation, reaching only 600 mm (Figure 5a), which indicated a prolonged period of severe drought in the study area from 2014 to 2016. The monthly rainfall statistics for the years 2011 to 2018 further confirmed the severe droughts during these three years, with the rainy season (primarily July and August) exhibiting significantly lower rainfall compared to other years (Figure 5b). Concurrently, the time series habitat maps for the study area corroborated this finding, showing a continuous decrease in the area of the water body from the summer of 2014 to the summer of 2017. The consecutive drought led to the exposure of the reservoir’s bed, resulting in the formation of mudflats and the proliferation of reeds and weeds (Figure 3 and Figure 4b).
It was also observed that the total annual rainfall in 2017 showed an obvious increase compared to the previous three years (Figure 5a). The monthly rainfall in the rainy season, namely July and August, nearly returned to the normal level with precipitation reaching 198 mm and 220 mm, respectively (Figure 5b). This suggested that the Xiashan Reservoir received a substantial amount of precipitation recharge, leading to the possible submergence of certain previously dry areas within the reservoir. This speculation was confirmed by habitat changes, as extensive reeds and weeds during the summer of 2017 transitioned into reed wetlands (typically with the lower part of the reeds flooded in water) during the autumn (Figure 3 and Figure 4b). As for the year 2018, the total annual precipitation was significantly higher than the average, by approximately 184 mm. Additionally, the monthly precipitation results indicated that the rainy season in 2018 arrived earlier, with May and June experiencing higher-than-normal rainfall (reaching 125 mm and 157 mm, respectively) (Figure 5). The habitat distribution maps showed that following a period of dry and little rain in winter, there was an increase of approximately 11.71 km2 of reed wetlands along the southern riverbank of the reservoir in early June, indicating a flooding process occurred there.
In summary, the Xiashan Reservoir experienced distinct dynamic drought and flood environments before the locust outbreak. It underwent a prolonged three-year drought from 2014 to 2016, followed by two flooding processes in the autumn of 2017 and the summer of 2018.

3.3. Impacts of Temperature Conditions on Locust Reproduction

Temperature is a crucial meteorological factor that consistently influences the growing stages of locusts. We plotted the change curves of ST and EST during the different growth periods of locusts in the study area for the ten years preceding the locust outbreak (2008–2018) (Figure 6) to analyze the impacts of temperature conditions on locust reproduction.
The results indicated that during the overwintering period in the study area from 2014 to 2017, ST was consistently higher than the ten-year average (Figure 6a), suggesting higher overwinter survival rates of locust eggs during this period [51,62]. In particular, in 2017, soil temperatures were 1.1 °C higher than the average level. Except for the summer of 2015, ST during the incubation period of SLs and ALs in the study area from 2014 to 2018 was significantly higher than the ten-year average (Figure 6b,d), indicating that locusts had higher hatching rates and emerged earlier for four consecutive years [42,58,59]. Locust nymphs primarily engage in activities within 50 cm above the ground before molting into adults, and higher EST can promote nymph development, reduce maturation duration, and increase the egg-laying rate and quantity [60,61]. During 2014–2018, the study area exhibited higher EST during the locust development and oviposition periods than in previous years (Figure 6c,e), greatly facilitating the locust nymph development and egg-laying capacity, potentially increasing the possibility of the multi-generation reproduction of locusts.
In summary, over the five years leading up to the locust outbreak (2014–2018), both ST during the overwintering and incubation periods and EST during the nymph development and oviposition periods provided extremely favorable temperature conditions for locust reproduction, promoting multiple years of the continuous and prolific reproduction of locusts.

4. Discussion

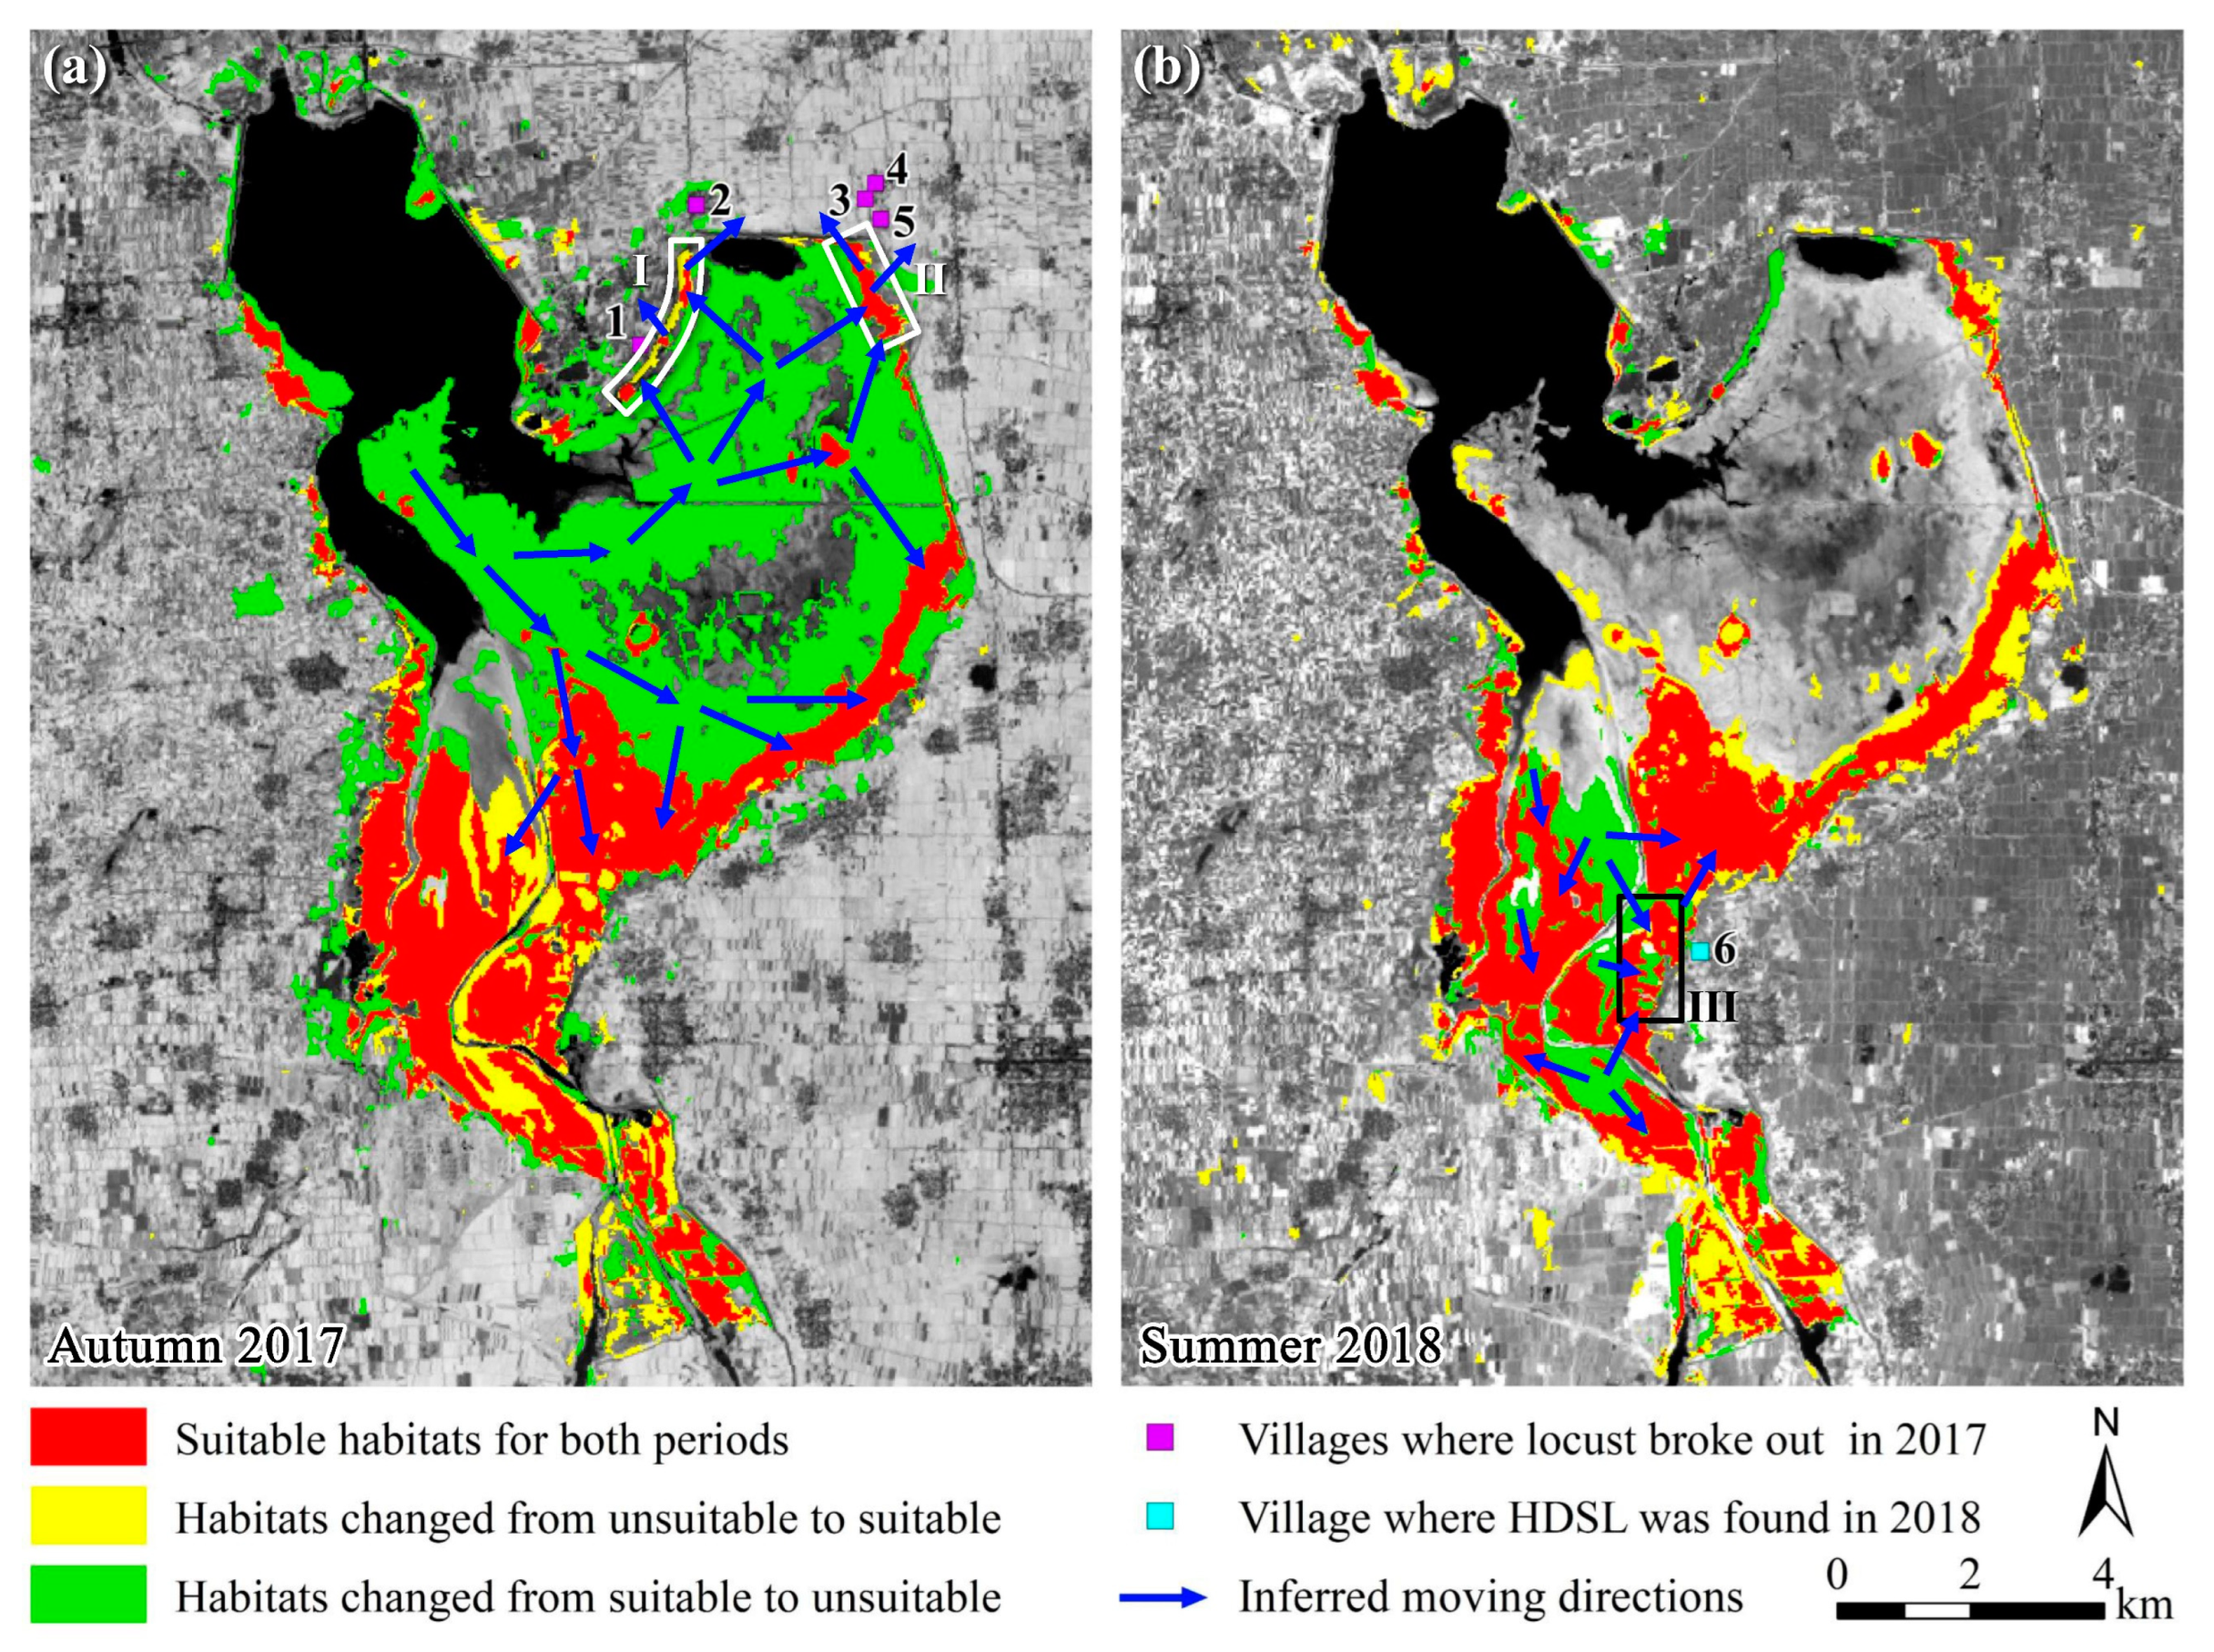
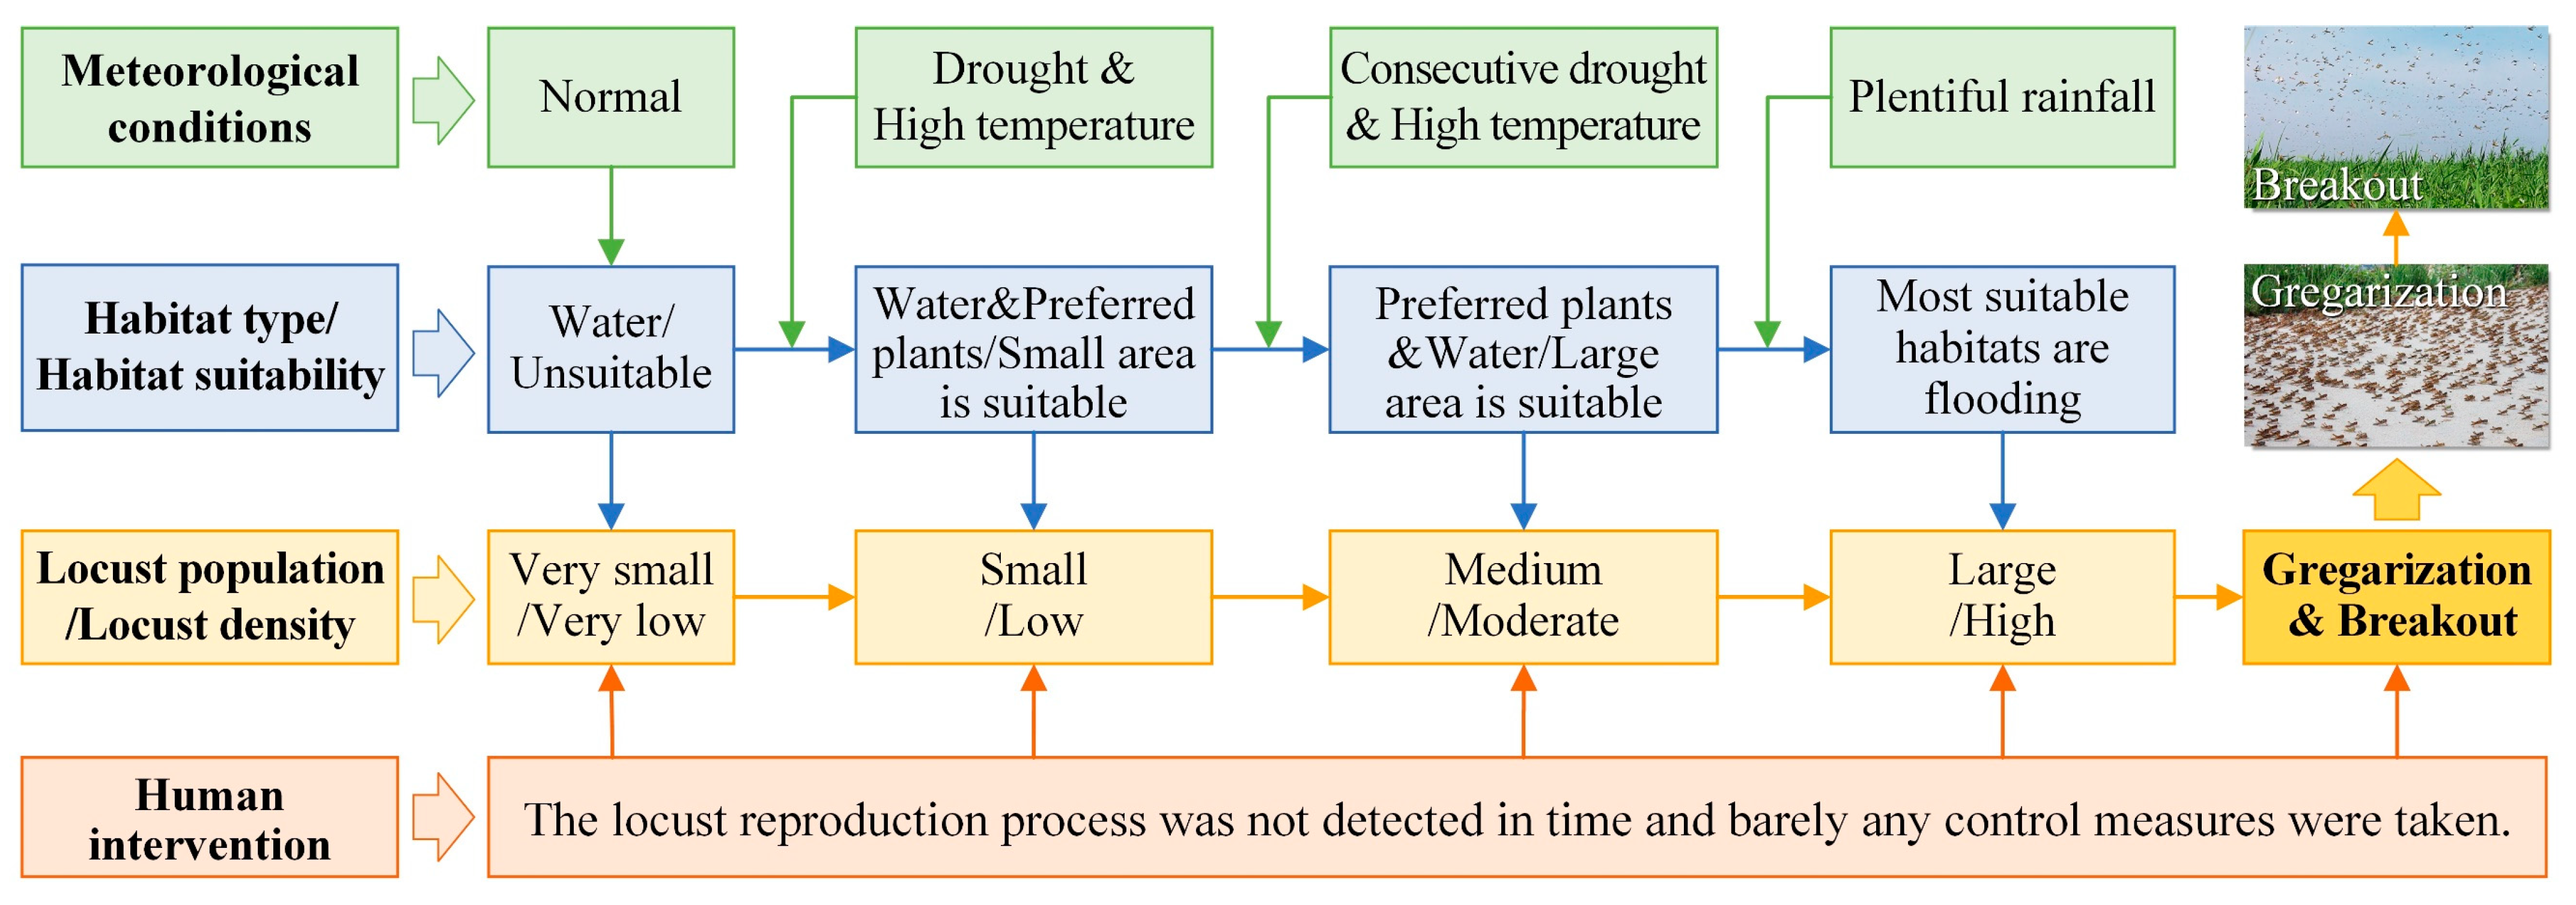
4.1. Outbreak Process of the Locust Plague and the HDSL

Clarifying the outbreak process of the locust plague in 2017 and the HDSL in 2018 is of great significance for understanding the outbreak mechanism of the locust plague and then locating the PHRLA. Therefore, combining the meteorological conditions and the habitat dynamics of locusts, this study analyzed the outbreak process of the locust plague from two aspects: population accumulation and aggregation of locusts.
  • Consecutive drought and high temperature promoted locust reproduction
From 2014 to 2016, three consecutive years of persistent drought led to a 75% reduction in the water area of the Xiashan Reservoir (Figure 4 and Figure 5). The lower soil moisture content and sparse vegetation caused by the prolonged drought provided ideal spawning sites for locusts, as they prefer to lay eggs in dry, sparsely vegetated, and high-temperature areas [61]. The expanding ranges of reeds and weeds within the reservoir area provided abundant host vegetation and suitable breeding habitats for locusts. In the summer of 2017, the suitable habitat range expanded to cover more than 60% of the reservoir area (Figure 3 and Figure 4). Previous studies proved that locust outbreaks are more likely to occur under conditions of continuous drought and mild winters [5,32]. From 2014 to 2017, the study area experienced four consecutive years of mild winters, and soil temperatures and earth surface temperatures during the key growth periods of locusts were significantly higher than historical averages (Figure 6). These temperature conditions greatly increased the overwintering survival rate of eggs, advanced the hatching period of nymphs, shortened the maturation period of nymphs, enhanced the egg-laying capacity of adults [42,51,59,62,63,64], and resulted in an exponential increase in locust populations. On the other hand, as the largest water source protection area in Shandong Province, the Xiashan Reservoir was off-limits to humans, which led to the locusts’ multiple generations going undetected and uncontrolled. All of these advantages related to host plants, climate, and human intervention contributed to the rapid growth of locust populations [54].
In summary, the consecutive drought and concurrent significant high temperatures from 2014 to 2016 provided extensive suitable habitats and optimal meteorological conditions for locust reproduction. Coupled with the absence of human intervention, locusts were able to complete multiple generations of reproduction over multiple years, accumulating a sufficient population base for the outbreak of locust plagues.
2.
Flooding-induced habitat compression promoted locust gregarization
In the late spring and early summer of 2017, as locusts continued to hatch, the population of summer locusts further increased. In July and August, abundant rainfall significantly flooded a large area in the northern part of the Xiashan Reservoir, reducing the suitable habitat for locusts from 62.98 km2 to 28.69 km2, a decrease of 54.45% (Figure 3, Figure 4 and Figure 5). Concurrently, locusts kept moving towards higher ground in the north and east of the reservoir and the upstream south (blue arrows in Figure 7a). In September, autumn locusts continued to hatch, and by this time, there remained only a very small area of suitable habitat in the northeastern part of the reservoir (white boxes I and II in Figure 7a). This led to locusts aggregating and increasing in density, reaching up to 100 individuals/m2 [54], triggering locusts to transition from a solitary to a gregarious phase with mass migration capability [1,48,65]. At this point, the remaining suitable habitat in the northeast could no longer satisfy the locusts’ feeding needs, prompting their takeoff and spread to surrounding villages (magenta squares in Figure 7a, villages 1–5), where they consumed crops, resulting in a locust plague. In contrast, the southern part of the reservoir had a larger and continually expanding suitable habitat (yellow areas in Figure 7a), providing locusts with ample host plants, and they did not engage in migration.
Although chemical control measures in September 2017 eliminated some locusts in the reservoir area, the majority of autumn locusts had already completed oviposition [1,51], providing a source population for the hatching of summer locusts in 2018. Unusually early and heavy rainfall in May and June 2018 (Figure 5b) created new suitable habitats in some areas along the Weihe River upstream of the reservoir and in the northern part of the reservoir (yellow areas in Figure 7b, approximately 10.18 km2 in size). However, these areas were not within the core distribution of locusts from the previous year. Simultaneously, flooding caused by the precipitation resulted in the inundation of some reed and weed habitats, forming reed wetlands (green areas in Figure 7b, approximately 8.33 km2 in size), leading to a 29.03% reduction in the suitable habitat. Additionally, May and June were the hatching and growing periods for locusts, and after one generation of reproduction, the locust population grew exponentially. It was inferred that locusts would move in the direction indicated by the blue arrows in Figure 7b. The continuous influx of locusts increased the locust density in large waste grasslands, forming multiple HDSLs (red areas in Figure 7b). The region within the black rectangular box III corresponds to the later-discovered HDSL in Houdian Village (beryl green square in Figure 7b, village 6), with a density reaching 50–60 individuals/m2.
To sum up, the dynamic drought and flood environments facilitated the outbreak of the locust plague in the Xiashan Reservoir. Three consecutive years of drought and associated high temperatures from 2014 to 2016 provided abundant suitable habitats and optimal meteorological conditions for locusts, resulting in multi-generational reproduction and the accumulation of a substantial locust population base. The two flooding events in the autumn of 2017 and the summer of 2018 continually reduced locusts’ living habitats, causing locust density to increase, leading to aggregation and mass migration. This, in turn, resulted in the locust plague in the northeast and extensive HDSLs in the central part of the reservoir.

4.2. Outbreak Mechanism of Locust Plagues under Drought and Flood Dynamics

A locust plague outbreak results from an increasing population density, which fosters locust aggregation and drives the transition of locusts from harmless solitary individuals to devastating gregarious swarms, triggering the migratory behavior of locusts [10,24,44,45,47,48]. An elevated population density hinges on the foundational quantity of the locust population, which is strongly infected by the meteorological conditions and variations in the suitable habitat range. Taking the locust plague and the HDSL in the Xiashan Reservoir as a case study, we elucidated the outbreak mechanism of locust plagues under drought and flood dynamics (Figure 8).
The OML exhibits a “water attachment” characteristic, wherein fluctuations in water levels can form beaches, wetlands, and grasslands around the water body, which serve as suitable habitats for locusts to spawn, hatch, and develop [33]. Therefore, the OML is often distributed in proximity to rivers, lakes, reservoirs, and other water bodies. During locust outbreaks, locusts disperse into surrounding croplands, posing a threat to agricultural production. In normal years, when the water body maintains its standard level, the suitable locust habitat remains limited, resulting in a very low locust population and density. However, when droughts occur and water levels decline, some water areas are replaced by gramineous plants favored by locusts, such as reeds or weeds, leading to a small increase in the suitable habitat. Droughts are frequently accompanied by elevated temperatures and warm winters [6,33], which facilitate locust reproduction. During this period, locust populations remain small with low densities. If droughts continue, the water area further reduces, expanding the habitat with plants preferred by locusts and forming large areas of suitable habitats. If high temperatures persist, multiple generations of locusts reproduce, causing the population to grow to a medium level, along with a moderate density. In such circumstances, if exceptionally heavy rainfall occurs during locust key growth periods, these suitable habitats become flooded due to plentiful rainfall, quickly shrinking in size. Additionally, the reproduction of a new generation of locusts contributes to population growth, sharply increasing the locust density to a high level, ultimately leading to the formation of an HDSL.
Consequently, locusts aggregate (as shown in the second picture in Figure 8), and their phase transforms from solitary to gregarious [5,10]. The resulting nymph groups can be highly destructive. As nymphs mature into adults, their food consumption increases by 3 to 7 times [1,10]. When the diminished suitable habitat can no longer meet the food requirements of locusts, mature locust swarms migrate to nearby croplands (as depicted in the first picture in Figure 8), dealing a devastating blow to agricultural production, thereby sparking a locust plague outbreak. It is essential to note that this outbreak mechanism operates with minimal human intervention throughout the entire process, meaning that locusts are not detected promptly, and no control measures are implemented.

4.3. Approach for Early Warning and Identifying Potential High-Risk Locust Areas

The timely identification of the PHRLA is paramount for implementing effective preventive management strategies to mitigate the potential damage caused by locust outbreaks. Based on the preceding analysis, it is evident that the outbreak of locust plagues correlates with prolonged periods of drought and high temperatures, followed by unusually heavy rainfall during key locust growth periods. In terms of habitat conditions, a locust plague can only materialize when there exists a specific range of suitable habitats for an extended period, allowing locusts to undergo multiple generations and reach a cumulative population base. Given these essential conditions for locust outbreaks, we propose the following three-step approach for early warning and identifying PHRLA.
  • Monitoring drought and flood patterns. Firstly, select water bodies (e.g., rivers, lakes, reservoirs, etc.) and their surrounding areas as the primary focus areas considering the “water attachment” feature of OMLs. Next, assess whether the annual precipitation in the target area over the past 3–5 years has been below the ten-year average (assuming no locusts have been reported in the focus area over the past decade) to detect droughts. If no drought occurs, the locust outbreak risk is low. If a drought is just beginning, continuous meteorological monitoring of the target area is necessary. If a consecutive drought occurs, proceed to the second step. If the target area experiences increased rainfall following a prolonged drought, proceed to the third step.
  • Monitoring variations in suitable habitats. Carry out multi-year habitat classification mapping from the year prior to the commencement of a consecutive drought to the current year and analyze the area changes in the suitable habitat. If there is a consistent increase in the suitable habitat area, it suggests that locusts may have completed multi-generation reproduction, potentially leading to the formation of HDSL. In such cases, it is necessary to strengthen field investigations and take measures promptly to reduce the locust population and density, thereby achieving an early warning of the PHRLA and mitigating the risk of locust outbreaks.
  • Identifying potential high-risk locust areas. If the target area experiences a sudden increase in rainfall after a prolonged drought and the suitable habitat area shows a trend of an initial increase followed by a decrease, there is a higher risk of a locust plague. First, generate the distribution maps of the suitable habitats before and after rainfall. Then, based on variations in suitable habitat size and distribution and the surrounding topography of water bodies before and after the rainfall, analyze the potential locust movement directions and speculate the possible locations of HDSL. Furthermore, based on the land cover types in the surrounding areas, especially the croplands, identify the PHRLA.

5. Conclusions

Using time series satellite imagery and meteorological products and taking locust outbreaks in 2017 and 2018 in the Xiashan Reservoir as study cases, this study quantitatively analyzed the impact of drought–flood dynamics and temperature on locust habitats, reproduction, and aggregation. The generated habitat classification maps based on the object-oriented random forest classifier achieved an average overall accuracy of 93.77% and Kappa coefficient of 0.90. The results revealed that three consecutive years of drought from 2014 to 2016 resulted in a 75% reduction in the water surface area, expanding the suitable habitat (mainly reeds and weeds) to 60% of the reservoir area. Three years of warm winters and high temperatures during the key growth periods of locusts, combined with continuously expanding suitable habitats promoted multi-generational locust reproduction. The substantial flooding events in 2017 and 2018, driven by plentiful rainfall during key growth periods, reduced the suitable habitat by approximately 54% and 29%, respectively. This compression led to a high locust density, causing the locust plague and high-density spots of locust (HDSL). Therefore, monitoring changes in drought and flood patterns around water bodies and variations in the suitable habitat size and distribution, as well as the surrounding topography, can realize the early warning and identification of potential high-risk areas for locust outbreaks. These findings hold significant importance in enhancing locust monitoring and early warning capabilities in the context of climate change, reducing chemical pesticide usage, thus safeguarding food and ecological security, and ensuring sustainable agriculture.
This study elaborates on the outbreak mechanism of OML plagues in the context of climate change-induced dynamic drought and flooding environments using the locust plague in the Xiashan Reservoir as an example. In China, the distribution of OMLs primarily includes four ecotypes: riverine locust areas, coastal locust areas, lake and reservoir locust areas, and waterlogged locust areas. In the future, more targeted and in-depth research on top of the view proposed in this study is required to explore the outbreak mechanisms of locusts in the other three types of locust areas to comprehensively facilitate climate change-related locust prevention and management efforts.

Supplementary Materials

The following supporting information can be downloaded at: https://www.mdpi.com/article/10.3390/rs15215206/s1, Figure S1: Reliability verification of the TRMM precipitation data in the study area.

Author Contributions

Conceptualization, L.Z., W.H. and Y.D.; methodology, L.Z.; software, L.Z., H.L.; validation, H.L.; formal analysis, L.Z.; investigation, Y.G.; resources, J.C.; writing—original draft preparation, L.Z.; writing—review and editing, J.C., L.Z., Y.D., H.L., Y.G. and H.M.; visualization, L.Z.; supervision, J.C.; funding acquisition, L.Z., W.H. and H.L. All authors have read and agreed to the published version of the manuscript.

Funding

This research was funded by the National Natural Science Foundation of China (42171323), the Natural Science Foundation of Guangdong Province (2023A1515011261), the Fundamental Research Foundation of Shenzhen Technology and Innovation Council (JCYJ20220818101617038), the Scientific research project of Ecology Environment Bureau of Shenzhen Municipality (SZDL2023001387), the International Cooperation Funding from Chinese Academy of Sciences (183611KYSB20200080), the SINO-EU, Dragon 5 proposal: Application of Sino-Eu Optical Data into Agronomic Models to Predict Crop Performance and to Monitor and Forecast Crop Pests and Diseases (ID 57457), and the GEO-PDRS: Global Vegetation Pest and Disease Dynamic Remote Sensing Monitoring and Forecasting, 2023–2025.

Data Availability Statement

Not applicable.

Acknowledgments

The authors gratefully thank the Shandong Plant Protection Station for providing information on locust occurrence records and control measures. We also appreciate the academic editor and reviewers for their insightful comments which greatly helped us improve the quality of this manuscript.

Conflicts of Interest

The authors declare no conflict of interest.

References

  1. Zhu, E.; Chen, Z. Comprehensive Control Technical Manual of Oriental Migratory Locust; China Agriculture Press: Beijing, China, 2010. [Google Scholar]
  2. Tu, X.; Hu, G.; Fu, X.; Zhang, Y.; Ma, J.; Wang, Y.; Gould, P.J.L.; Du, G.; Su, H.; Zhang, Z.; et al. Mass windborne migrations extend the range of the migratory locust in East China. Agric. For. Entomol. 2020, 22, 41–49. [Google Scholar] [CrossRef]
  3. Wang, X.; Li, G.; Xu, W.; Kong, D.; Gao, X.; Wang, S.; Feng, C. The locust plagues in the Yangtze River Delta of China during the Ming and Qing Dynasties. Nat. Hazards 2022, 115, 2333–2350. [Google Scholar] [CrossRef]
  4. Meynard, C.N.; Lecoq, M.; Chapuis, M.P.; Piou, C. On the relative role of climate change and management in the current desert locust outbreak in East Africa. Glob. Chang. Biol. 2020, 26, 3753–3755. [Google Scholar] [CrossRef] [PubMed]
  5. Peng, W.; Ma, N.L.; Zhang, D.; Zhou, Q.; Yue, X.; Khoo, S.C.; Yang, H.; Guan, R.; Chen, H.; Zhang, X.; et al. A review of historical and recent locust outbreaks: Links to global warming, food security and mitigation strategies. Environ. Res. 2020, 191, 110046. [Google Scholar] [CrossRef] [PubMed]
  6. Salih, A.A.M.; Baraibar, M.; Mwangi, K.K.; Artan, G. Climate change and locust outbreak in East Africa. Nat. Clim. Chang. 2020, 10, 584–585. [Google Scholar] [CrossRef]
  7. Youngblood, J.P.; Cease, A.J.; Talal, S.; Copa, F.; Medina, H.E.; Rojas, J.E.; Trumper, E.V.; Angilletta, M.J.; Harrison, J.F. Climate change expected to improve digestive rate and trigger range expansion in outbreaking locusts. Ecol. Monogr. 2023, 93, e1550. [Google Scholar] [CrossRef]
  8. Cressman, K. Role of remote sensing in desert locust early warning. J. Appl. Remote Sens. 2013, 7, 75098. [Google Scholar] [CrossRef]
  9. Zhang, L.; Lecoq, M.; Latchininsky, A.; Hunter, D. Locust and Grasshopper Management. Annu. Rev. Entomol. 2019, 64, 15–34. [Google Scholar] [CrossRef]
  10. Sun, R.; Huang, W.; Dong, Y.; Zhao, L.; Zhang, B.; Ma, H.; Geng, Y.; Ruan, C.; Xing, N.; Chen, X.; et al. Dynamic forecast of Desert Locust presence using machine learning with a multivariate time lag sliding window technique. Remote Sens. 2022, 14, 747. [Google Scholar] [CrossRef]
  11. Lomer, C.J.; Bateman, R.P.; Dent, D.; Groote, H.; Douro-Kpindou, O.K.; Kooyman, C.; Langewald, J.; Ouambama, Z.; Peveling, R.; Thomas, M. Development of strategies for the incorporation of biological pesticides into the integrated management of locusts and grasshoppers. Agric. For. Entomol. 2011, 1, 71–88. [Google Scholar] [CrossRef]
  12. Adriaansen, C.; Woodman, J.D.; Deveson, E.; Drake, V.A. Chapter 4.1—The Australian Plague Locust—Risk and Response. In Biological and Environmental Hazards, Risks, and Disasters; Shroder, J.F., Sivanpillai, R., Eds.; Elsevier: Amsterdam, The Netherlands, 2016; pp. 67–86. [Google Scholar]
  13. Maute, K.; French, K.; Story, P.; Bull, C.M.; Hose, G.C. Short and long-term impacts of ultra-low-volume pesticide and biopesticide applications for locust control on non-target arid zone arthropods. Agric. Ecosyst. Environ. 2017, 240, 233–243. [Google Scholar] [CrossRef]
  14. Yang, P.; Ren, B. Promoting the application of green crop pest management technologies—Review on the key issues in the national technical schemes of major crop pest management for 2011 to 2017. Plant Prot. 2018, 44, 6–8. [Google Scholar]
  15. Yao, X.; Zhu, D.; Yun, W.; Peng, F.; Li, L. A WebGIS-based decision support system for locust prevention and control in China. Comput. Electron. Agric. 2017, 140, 148–158. [Google Scholar] [CrossRef]
  16. Ji, R.; Xie, B.Y.; Li, D.M.; Li, Z.; Zhang, X. Use of MODIS data to monitor the oriental migratory locust plague. Agric. Ecosyst. Environ. 2004, 104, 615–620. [Google Scholar] [CrossRef]
  17. Shi, Y.; Huang, W.; Dong, Y.; Peng, D.; Zheng, Q.; Yang, P. The influence of landscape’s dynamics on the Oriental Migratory Locust habitat change based on the time-series satellite data. J. Environ. Manag. 2018, 218, 280–290. [Google Scholar] [CrossRef] [PubMed]
  18. Klein, I.; Uereyen, S.; Eisfelder, C.; Pankov, V.; Oppelt, N.; Kuenzer, C. Application of geospatial and remote sensing data to support locust management. Int. J. Appl. Earth Obs. 2023, 117, 103212. [Google Scholar] [CrossRef]
  19. Ellenburg, W.L.; Mishra, V.; Roberts, J.B.; Limaye, A.S.; Case, J.L.; Blankenship, C.B.; Cressman, K. Detecting Desert Locust Breeding Grounds: A Satellite-Assisted Modeling Approach. Remote Sens. 2021, 13, 1276. [Google Scholar] [CrossRef]
  20. Gómez, D.; Salvador, P.; Sanz, J.; Casanova, C.; Taratiel, D.; Casanova, J.L. Desert locust detection using Earth observation satellite data in Mauritania. J. Arid Environ. 2019, 164, 29–37. [Google Scholar] [CrossRef]
  21. Moustafa, O.R.M.; Cressman, K. Using the enhanced vegetation index for deriving risk maps of desert locust (Schistocerca gregaria, Forskal) breeding areas in Egypt. J. Appl. Remote Sens. 2014, 8, 84897. [Google Scholar] [CrossRef]
  22. Waldner, F.O.; Ebbe, M.A.B.; Cressman, K.; Defourny, P. Operational monitoring of the Desert Locust habitat with Earth Observation: An assessment. ISPRS Int. J. Geo-Inf. 2015, 4, 2379–2400. [Google Scholar] [CrossRef]
  23. Cissé, S.; Ghaout, S.; Ebbe, M.A.B.; Kamara, S.; Piou, C. Field verification of the prediction model on desert locust adult phase status from density and vegetation. J. Insect Sci. 2016, 16, 74. [Google Scholar] [CrossRef] [PubMed]
  24. Geng, Y.; Zhao, L.; Huang, W.; Dong, Y.; Ma, H.; Guo, A.; Ren, Y.; Xing, N.; Huang, Y.; Sun, R.; et al. A landscape-based habitat suitability model (LHS model) for Oriental Migratory Locust area extraction at large scales: A case study along the Middle and Lower Reaches of the Yellow River. Remote Sens. 2022, 14, 1058. [Google Scholar] [CrossRef]
  25. Zhang, X.; Huang, W.; Ye, H.; Lu, L. Study on the Identification of Habitat Suitability Areas for the Dominant Locust Species Dasyhippus barbipes in Inner Mongolia. Remote Sens. 2023, 15, 1718. [Google Scholar] [CrossRef]
  26. Löw, F.; Waldner, F.; Latchininsky, A.; Biradar, C.; Bolkart, M.; Colditz, R.R. Timely monitoring of Asian Migratory locust habitats in the Amudarya delta, Uzbekistan using time series of satellite remote sensing vegetation index. J. Environ. Manag. 2016, 183, 562–575. [Google Scholar] [CrossRef]
  27. Sun, Z.; Ye, H.; Huang, W.; Qimuge, E.; Bai, H.; Nie, C.; Lu, L.; Qian, B.; Wu, B. Assessment on Potential Suitable Habitats of the Grasshopper Oedaleus decorus asiaticus in North China based on MaxEnt Modeling and Remote Sensing Data. Insects 2023, 14, 138. [Google Scholar] [CrossRef]
  28. Kimathi, E.; Tonnang, H.E.Z.; Subramanian, S.; Cressman, K.; Abdel-Rahman, E.M.; Tesfayohannes, M.; Niassy, S.; Torto, B.; Dubois, T.; Tanga, C.M.; et al. Prediction of breeding regions for the desert locust Schistocerca gregaria in East Africa. Sci. Rep. 2020, 10, 11937. [Google Scholar] [CrossRef]
  29. Shroder, J.F.; Sivanpillai, R. Biological and Environmental Hazards, Risks, and Disasters; Elsevier: Amsterdam, The Netherlands, 2016. [Google Scholar] [CrossRef]
  30. Zhang, Z.; Cazelles, B.; Tian, H.; Christian Stige, L.; Bräuning, A.; Stenseth, N.C. Periodic temperature-associated drought/flood drives locust plagues in China. Proc. R. Soc. B Biol. Sci. 2008, 276, 823–831. [Google Scholar] [CrossRef]
  31. Lin, K.E.; Wang, P.K.; Pai, P.; Lin, Y.; Wang, C. Historical droughts in the Qing dynasty (1644–1911) of China. Clim. Past 2020, 16, 911–931. [Google Scholar] [CrossRef]
  32. Fei, J.; Zhou, J. The drought and locust plague of 942–944 AD in the Yellow River Basin, China. Quat. Int. 2016, 394, 115–122. [Google Scholar] [CrossRef]
  33. Li, G.; Kong, D.; Li, F.; Liu, Q.; Wang, H. Reviews and prospects on studies of locust breeding area evolution and drainage network change in China during the historical period. Trop. Geogr. 2017, 37, 226–237. [Google Scholar]
  34. Xiao, L. Spatial-temporal distribution of locust plague and its relationship with flood/drought in North China during the Qing Dynasty. J. Palaeogeogr. 2018, 20, 1113–1122. (In Chinese) [Google Scholar]
  35. Yu, G.; Shen, H.; Liu, J. Impacts of climate change on historical locust outbreaks in China. J. Geophys. Res. 2009, 114, D18104. [Google Scholar] [CrossRef]
  36. Tratalos, J.A.; Cheke, R.A.; Healey, R.G.; Stenseth, N.C. Desert locust populations, rainfall and climate change: Insights from phenomenological models using gridded monthly data. Clim. Res. 2010, 43, 229–239. [Google Scholar] [CrossRef]
  37. Li, G.; Liu, Q.; Wang, H.; Kong, D.; Yang, X. Spatiotemporal characteristics and environmental response of locust plague in Jiangsu Province during the past one thousand years. Int. J. Nat. Disasters 2015, 24, 66–76. [Google Scholar]
  38. Huang, B.; Li, G.; Li, F.; Kong, D.; Wang, Y. The 1855 to 1859 locust plague in China. Nat. Hazards 2019, 95, 529–545. [Google Scholar] [CrossRef]
  39. Wei, Y. Analysis and Research on the Scheme of Reservoir Capacity Increase of Xiashan Reservoir. Master’s Thesis, Shandong University, Jinan, China, 2015. [Google Scholar]
  40. Tian, L.; Xing, F.; Wang, E.; Wang, X.; Zheng, Z. Changes and distributions of phytoplankton community of Xiashan Reservoir. Water Technol. 2021, 15, 17–21. [Google Scholar]
  41. Ma, J.; Han, X. Mechanism and Method of Remote Sensing Monitoring of Oriental Migratory Locust Plague; Science Press: Beijing, China, 2004. [Google Scholar]
  42. Nishide, Y.; Suzuki, T.; Tanaka, S. The hatching time of Locusta migratoria under out door conditions: Role of temperature and adaptive significance. Physiol. Entomol. 2017, 42, 146–155. [Google Scholar] [CrossRef]
  43. Zhang, L.; Li, H. The impacts of nymph population densities and stadium of Locusta migratoria manilensis (Meyen) on the changes of its social type to the scattered type. Plant Prot. Technol. Ext. 2002, 22, 3–5. [Google Scholar]
  44. Stige, L.C.; Chan, K.S.; Zhang, Z.; Frank, D.; Stenseth, N.C. Thousand-year-long Chinese time series reveals climatic forcing of decadal locust dynamics. Proc. Natl. Acad. Sci. USA 2007, 104, 16188–16193. [Google Scholar] [CrossRef]
  45. Crooks, W.T.; Cheke, R.A. Soil moisture assessments for brown locust Locustana pardalina breeding potential using synthetic aperture radar. J. Appl. Remote Sens. 2014, 8, 2378–2391. [Google Scholar] [CrossRef]
  46. Yang, X.; Zhang, K.; Wang, J.; Jia, H.; Ma, L.; Li, Y.; Duan, J. Assessment of genetic diversity and chemical composition among seven black locust populations from Northern China. Biochem. Syst. Ecol. 2020, 90, 104010. [Google Scholar] [CrossRef]
  47. Cressman, K. Chapter 4.2—Desert Locust. In Biological and Environmental Hazards, Risks, and Disasters; Shroder, J.F., Sivanpillai, R., Eds.; Elsevier: Amsterdam, The Netherlands, 2016; pp. 87–105. [Google Scholar] [CrossRef]
  48. Guo, X.; Yu, Q.; Chen, D.; Wei, J.; Yang, P.; Yu, J.; Wang, X.; Kang, L. 4-Vinylanisole is an aggregation pheromone in locusts. Nature 2020, 584, 584–588. [Google Scholar] [CrossRef] [PubMed]
  49. Huffman, G.J.; Bolvin, D.T.; Nelkin, E.J.; Wolff, D.B.; Adler, R.F.; Gu, G.; Hong, Y.; Bowman, K.P.; Stocker, E.F. The TRMM Multisatellite Precipitation Analysis (TMPA): Quasi-Global, Multiyear, Combined-Sensor Precipitation Estimates at Fine Scales. J. Hydrometeorol. 2007, 8, 38–55. [Google Scholar] [CrossRef]
  50. Muñoz-Sabater, J.; Dutra, E.; Agustí-Panareda, A.; Albergel, C.; Arduini, G.; Balsamo, G.; Boussetta, S.; Choulga, M.; Harrigan, S.; Hersbach, H.; et al. ERA5-Land: A state-of-the-art global reanalysis dataset for land applications. Earth Syst. Sci. Data 2021, 13, 4349–4383. [Google Scholar] [CrossRef]
  51. Ma, S. The population dynamics of the Oriental migratory locust (Locust migratoria manilensis Meyen) in China. Acta Entomol. Sin. 1958, 8, 1–40. [Google Scholar]
  52. Qi, X.; Wang, X.; Xu, H.; Kang, L. Influence of soil moisture on egg cold hardiness in the migratory locust Locusta migratoria (Orthoptera: Acridiidae). Physiol. Entomol. 2007, 32, 219–224. [Google Scholar] [CrossRef]
  53. Zhu, E. Occurrence and Management of the Oriental Migratory Locust in China; China Agriculture Press: Beijing, China, 1999. [Google Scholar]
  54. Yang, Q.; Liu, W.; Huang, C.; Zhu, J.; Zhang, Z.; Zhu, J.; Xie, F. Occurring analysis on high-density spot of Locusta migartoria and suggestions on its monitoring and controlling in China in 2017. China Plant Prot. 2018, 38, 37–39+47. [Google Scholar]
  55. Zha, Y.; Ni, S.; Yang, S. An effective approach to automatically extract urban land-use from TM imagery. J. Remote Sens. 2003, 7, 37–40. [Google Scholar]
  56. Prasomsup, W.; Piyatadsananon, P.; Aunphoklang, W.; Boonrang, A. Extraction Technic for Built-up Area Classification in Landsat 8 Imagery. Int. J. Environ. Sci. Dev. 2020, 11, 15–20. [Google Scholar] [CrossRef]
  57. Achanta, R.; Süsstrunk, S. Superpixels and Polygons Using Simple Non-Iterative Clustering. In Proceedings of the 2017 IEEE Conference on Computer Vision and Pattern Recognition (CVPR), Honolulu, HI, USA, 21–26 July 2017; pp. 4895–4904. [Google Scholar]
  58. Nik, N.; Martono, E.; Putra, N.S.; Suputa. Hatching of migratory locust (Locusta migratoria, L.) (Orthoptera: Acrididae) eggs at several of texture and moisture levels in semi-field laboratory. EurAsian J. Biosci. 2020, 14, 4457–4465. [Google Scholar]
  59. Woodman, J.D. Surviving a flood: Effects of inundation period, temperature and embryonic development stage in locust eggs. Bull. Entomol. Res. 2015, 105, 441–447. [Google Scholar] [CrossRef] [PubMed]
  60. Han, X. Study on Remote Sensing Mechanism and Methods for East Asian Migratory Locust Hazard Monitoring. Ph.D. Thesis, Institute of Remote Sensing Application, China Academy of Science, Beijing, China, 2003. [Google Scholar]
  61. Ji, R.; Li, D.; Xie, B.; Li, Z.; Meng, D. Spatial distribution of oriental migratory locust (Orthoptera: Acrididae) egg pod populations: Implications for site-specific pest management. Environ. Entomol. 2006, 35, 1244–1248. [Google Scholar] [CrossRef]
  62. Wu, T.; Hao, S.; Kang, L. Effects of Soil Temperature and Moisture on the Development and Survival of Grasshopper Eggs in Inner Mongolian Grasslands. Front. Ecol. Evol. 2021, 9, 727911. [Google Scholar] [CrossRef]
  63. Latchininsky, A.; Sword, G.; Sergeev, M.; Cigliano, M.; Lecoq, M. Locusts and Grasshoppers: Behavior, Ecology, and Biogeography. Psyche 2011, 2011, 578327. [Google Scholar] [CrossRef]
  64. Wang, X.; Li, G.; Wang, S.; Feng, C.; Xu, W.; Nie, Q.; Liu, Q. The effect of environmental changes on locust outbreak dynamics in the downstream area of the Yellow River during the Ming and Qing Dynasties. Sci. Total Environ. 2023, 877, 162921. [Google Scholar] [CrossRef]
  65. Simpson, S.J.; McCaffery, A.R.; Hagele, B.F. A behavioural analysis of phase change in the desert locust. Biol. Rev. 1999, 74, 461–480. [Google Scholar] [CrossRef]
Figure 1. (a) The location of the study area in China; (b) The surrounding environment of the study area; (c) The true color composite image of the study area based on the Sentinel-2 remote sensing image on 11 June 2019, with the Xiashan Reservoir in the middle. Points around the reservoir are villages where locusts broke out in 2017 (yellow) and the village where HDSL was found in 2018 (beryl green).
Remotesensing 15 05206 g001
Figure 2. Flowchart for exploring the outbreak mechanism of Oriental migratory locusts under drought and flood dynamics. Note: TRMM, Tropical Rainfall Measuring Mission; ERA5, European Centre for Medium-Range Weather Forecasts (ECMWF) Reanalysis v5; RF, Random Forest; HDSL, high-density spot of locusts; PHRLA, potential high-risk locust areas.
Remotesensing 15 05206 g002
Figure 3. Time series habitat classification maps of the study area from 2014 to 2018.
Remotesensing 15 05206 g003
Figure 4. The area proportion stacked bar chart (a) and area change curve (b) for different habitat types of the study area from 2014 to 2018. Note: Since the proportions of cropland and artificial surfaces were relatively large and stable, neither of them was suitable for locust reproduction, Figure (b) only depicts the remaining five habitat types to highlight their area fluctuations.
Remotesensing 15 05206 g004
Figure 5. (a) Annual total precipitation in the study area from 2001 to 2020; (b) Monthly precipitation in the study area from 2011 to 2018. HDSL means high-density spots of locusts.
Remotesensing 15 05206 g005
Figure 6. Soil and earth surface temperatures during key growth periods of locusts from 2008 to 2018. (a) Overwintering period (December of the previous year to February of the current year); (b) Incubation period of SL (April and May); (c) Development and oviposition periods of SL (June and July); (d) Incubation period of AL (July and August); (e) Development and oviposition periods of AL (August and September).
Remotesensing 15 05206 g006
Figure 7. Schematic diagram of the outbreak of locust plagues in 2017 and the HDSL in 2018. (a) Habitat suitability changed from summer to autumn in 2017; (b) Habitat suitability changed from autumn 2017 to summer 2018. Note: HDSL, high-density spots of locusts. The base maps are the NDVI of the later period. We consider reeds and weeds as suitable habitats as they are suitable for locust incubation, development, and oviposition, while other types are considered unsuitable habitats. The areas without color blocks were unsuitable habitats for locusts in both periods. Points 1−5 are villages invaded by locusts in 2017, and point 6 is village found HDSL in 2018. Village names can refer to Figure 1. White boxes I and II are inferred areas where locust takeoff in 2017, and box III is inferred area where HDSL formed in 2018.
Remotesensing 15 05206 g007
Figure 8. Outbreak mechanism of locust plagues under dynamic drought and flood environments.
Remotesensing 15 05206 g008
Table 1. Landsat images used for locust habitat classification.
YearsSummerAutumn
DateCloud CoverageDateCloud Coverage
201426 MayCloudless22 SeptemberCloudless
20155 June0.19%25 SeptemberCloudless
201616 JuneCloudless20 September0.87%
201725 MayCloudless23 SeptemberCloudless
20186 JuneCloudless26 September0.08%
Note: For easy reading, all dates are expressed as summer or autumn hereafter.
Table 2. Habitat classification system and their descriptions regarding suitability for locust breeding.
Habitat ClassDescription
CroplandDry land used for cultivating food crops, such as wheat, corn, millet, sorghum, rice, etc., and vegetable greenhouses used for planting potatoes, cabbages, radish, leeks, and so on. Due to routine tillage activities such as plowing and irrigation, locust eggs laid in cropland usually cannot survive, but the crops could still provide food supply when locusts break out and migrate in.
Reed wetlandAnnual pure reeds; sometimes the bottom part is submerged by water, with vegetation coverage usually higher than 75%. Because of the high soil moisture content, locusts cannot lay eggs and hatch. And it is also tricky for nymphs to develop due to the high canopy closure. When locusts become adults and flyable, reed wetlands can provide abundant food supplies since the reeds are their favorite plant food.
Reeds and weedsMixed area of reeds and other gramineous weeds on wet or semi-dry soil, with 15–75% vegetation coverage. The vegetation and soil conditions provide ideal habitats for locust breeding. The low vegetation coverage regions (15–50%) offer perfect places for locust oviposition and nymph development; the high vegetation coverage regions (50–75%) can provide adequate host plants for locust feeding.
WoodlandTimber plantations along rivers, reservoirs, and around villages, as well as natural trees along rivers and ornamental trees in urban area parks. This habitat class is unsuitable for locust breeding due to their dietary incompatibility with the prevailing vegetation.
WaterReservoirs, rivers, artificial lakes, and irrigation ditches. Water resources are invariably interconnected with soil moisture and temperature, thereby exerting a subsequent impact on the growth of the surrounding vegetation. Hence, during specific periods, the adjacent surroundings of water resources can furnish conducive habitats for locusts.
Artificial SurfaceTowns, villages, roads, and other water facilities, such as artificial dams and ditches, which are unsuitable for locust breeding.
OthersBare lands with low vegetation coverage, such as reservoir mudflats and mining areas, which are highly unsuitable for the propagation of locusts.
Table 3. The number of labeled samples for each habitat class for ten Landsat images.
PeriodNumber of Reference Pixels
CroplandReed WetlandReeds and WeedsWoodlandWaterArtificial SurfaceOthersTotal
Summer 2014745241097232324515031115,767
Autumn 2014677211596912021535289146416,882
Summer 2015663748344534326335661197221,882
Autumn 2015702626642655728445661217222,291
Summer 2016631965239482614125180259920,136
Autumn 20166420176364691601166536748921,834
Summer 2017699115644202217334522127919,312
Autumn 20176420118731921602035522870418,926
Summer 20185822256440971811384523829419,580
Autumn 2018639218146603038519825515,107
Table 4. Classification accuracy of each habitat type from 2014 to 2018.
TimePA and UA
(%)
Habitat TypeOA
(%)
Kappa
CroplandReed WetlandReeds and WeedsWoodlandWaterArtificial SurfaceOthers
Summer 2014PA94.6994.3960.0095.6199.3590.5291.0293.680.89
UA95.2480.8068.5766.4699.8992.6174.51
Autumn 2014PA95.13100.0094.6286.6799.6393.2494.5094.870.91
UA97.82100.0075.6960.4799.6392.8081.13
Summer 2015PA92.3488.5590.0887.1099.8590.7397.6492.590.89
UA95.6786.4781.1881.0099.2590.4588.76
Autumn 2015PA90.6588.2492.9382.3199.3590.0794.5791.580.88
UA96.3360.6188.1767.6099.3587.6579.20
Summer 2016PA92.8299.4691.0392.1399.2095.2393.6593.820.90
UA96.2998.4082.6360.2999.6094.8185.82
Autumn 2016PA92.8698.3093.6697.62100.0093.1090.5193.570.90
UA96.5296.6587.8672.3599.6592.3264.41
Summer 2017PA91.5298.5995.6394.8199.1792.0293.1493.090.90
UA95.3397.4296.3268.2298.3690.2379.50
Autumn 2017PA95.2397.6194.5590.98100.0092.7591.0694.850.91
UA97.0799.1993.5776.1099.5190.8675.93
Summer 2018PA94.7395.6995.7394.9499.5293.4095.2994.800.91
UA97.5799.0590.7886.6797.4789.2868.94
Autumn 2018PA94.42100.0088.8987.9399.6694.3292.0994.810.90
UA98.1550.0074.1675.0099.1590.4171.51
Remotesensing 15 05206 i001
Note: PA, Producer’s accuracy; UA, User’s accuracy; OA, Overall accuracy.
Disclaimer/Publisher’s Note: The statements, opinions and data contained in all publications are solely those of the individual author(s) and contributor(s) and not of MDPI and/or the editor(s). MDPI and/or the editor(s) disclaim responsibility for any injury to people or property resulting from any ideas, methods, instructions or products referred to in the content.

