Communication

Seasonal Variations in Ion Density, Ion Temperature, and Migrating Tides in the Topside Ionosphere Revealed by ICON/IVM

1
Electronic Information School, Wuhan University, Wuhan 430072, China
2
Guizhou Normal University, Guiyang 550025, China
3
Electrical and Computer Engineering Department, Miami University, Oxford, OH 45056, USA
*
Author to whom correspondence should be addressed.
Remote Sens. 2023, 15(21), 5205; https://doi.org/10.3390/rs15215205
Submission received: 7 October 2023 / Revised: 26 October 2023 / Accepted: 31 October 2023 / Published: 1 November 2023

Abstract

:
Based on the plasma parameters measured by the Ion Velocity Meter (IVM) instrument on the Ionospheric Connection Explorer (ICON) satellite from 2020 to 2021, we present an analysis of seasonal variations in ion density, ion temperature, and migrating tides in the low-latitude topside ionosphere. The interannual variations in total ion density and O+ density are directly impacted by solar radiation. However, the concentration of H+ is not highly related to solar activity. The measurements show that the hemispheric dividing latitude for the seasonal variation in Ti is at about 9°N. We suggest that the reason for the hemispheric dividing latitude being 9°N is because measurements at this geographical latitude represent the closest match to the geomagnetic equator. An anticorrelation in the seasonal variations between the total ion density (as well as the O+ density) and the ion temperature is observed at all observed latitudes while the correlations between H+ density and the ion temperature are positive in most of the latitudes except for serval degrees around 9°N. The latitudinal variations in the correlation coefficients lead us to suggest that thermal conduction is likely more important than ion-neutral collision in the ion energy budget at 600 km. Additionally, semiannual oscillations with peak amplitudes in winters and summers at the extra-equatorial latitudes are revealed in the observations of diurnal migrating tides in the topside ionosphere, which are different from the latitudinal and seasonal distributions of diurnal migrating tides captured in the lower thermospheric temperature and total electron content.

1. Introduction

The ion density and ion temperature in the topside ionosphere have been studied using ground-based measurements from incoherent scatter radars [1,2,3,4,5,6]. Satellite-borne instruments have also provided in situ measurements of the topside on a global scale [7,8,9,10,11,12]. Furthermore, modeling analyses have been developed to understand the behavior of ion compositions in the topside ionosphere [13,14,15,16]. In the recent two decades, in situ measurements by low-earth-orbit (LEO) satellites have provided high-temporal-resolution, observational data to understand the ion variations in the topside, such as the Republic of China Satellite 1 (ROCSAT-1), the Communication/Navigation Outage Forecasting System (C/NOFS), and the Ionospheric Connection Explorer (ICON) [17,18,19]. The ROCSAT-1 was launched into a circular orbit at the height of 600 km in 1999, which provided in situ observations of ion density, ion temperature, ion composition, and ion velocity from 35°S to 35°N [17]. The C/NOFS satellite started its mission in 2008 and measured the same ionospheric parameters as the ROCSAT-1 but at an altitude range of ~400 to 800 km [18]. However, the ROCSAT-1 ended its mission in 2014, and the C/NOFS shut down its observation in 2015. In October 2019, ICON was launched which allows us to continuously explore the topside ionosphere based on in situ observation with high temporal resolutions [20].
Many previous studies have indicated that the topside ionosphere is dominated by O+, H+, and He+ [21,22,23]. The variations in these ion densities are found to be related to solar activities [24,25,26,27]. Borgohain and Bhuyan [28] found that at 600 km the most dominant ion, O+, exhibits the minimum density before sunrise and the maximum density in the afternoon, while the density of H+, almost one-tenth the density of O+, decreases as the solar activity increases. Shen and Zhang [29] reported that the density of H+ at 670 km in winter is much greater than that in summer. The variations in ions in the topside ionosphere are also found to be modulated by many other factors, for example, plasma collisions, tidal and planetary waves, geomagnetic storms, and sudden stratospheric warmings [20,21,22,23,24,25,26,27,28,29,30,31,32,33,34]. Tidal oscillations due to solar activity play a significant role in modulating the ionosphere and thermosphere [9,35,36,37,38], especially for the westward migrating tides [39,40,41,42,43]. However, the characteristics of migrating tides in the topside ionosphere are still not well understood.
Recently, Immel et al. [44] demonstrated that the vertical plasma velocities in the topside ionosphere are highly related to the lower thermosphere winds, around 100–150 km, where atmospheric tides are the most prominent dynamics. To our knowledge, the characteristics of tidal oscillations in the topside ionosphere are not well studied. The mechanisms of the seasonal variations in the ion compositions in the topside are also rarely revealed. In the present study, observations of ion density and ion temperature obtained from ICON are used to investigate spatial and temporal variations in ions and tides in the topside ionosphere. Data and methodology are present in Section 2. Results and discussions are given in Section 3. Conclusions are summarized in Section 4.

2. Data and Methodology

The ICON satellite, launched in October 2019, aims to understand the characteristics of the ionosphere and thermosphere. It consists of four instruments, including the Michelson Interferometer for Global High-Resolution Thermospheric Imaging (MIGHTI), the Ion Velocity Meter (IVM), the Far-Ultraviolet Imager (FUV), and the Extreme-Ultraviolet Spectrometer (EUV) [20]. The effectiveness of data sets from instruments on ICON has been proven through comparisons with other satellites, ground-based equipment, and models [19,45,46]. MIGHTI can measure wind and temperature of neutral species in the lower thermosphere. EUV and FUV, respectively, measure the daytime and nighttime O+ altitudinal profiles. The column density ratio of O to N2 can be obtained from FUV. IVM measures the density, temperature, and composition of ions along the orbits of the spacecraft. In this study, in situ observations from the IVM are applied to investigate the seasonal variations in ions in the topside region. The retarding potential analyzer (RPA) in the IVM is used to measure the ion density, temperature, and composition. The current in the RPA is given by Equation (2) in Hanson et al. [47]. The retarding potential, ranging from zero to 25.5 volts, determines the energy of ions that can fly into the collector of the spacecraft. Therefore, when the retarding grid is stepped through within the range of retarding potentials, ion temperature and composition can be extracted from the normalized current-voltage characteristic with the least-square fitting method. In addition, a zero volt of the retarding potential means all the positive ions can enter the collector and total plasma density is derived. More detailed descriptions of the ion measurements based on the IVM can be found in Heelis et al. [48]. In this study, the data from the products of Level 2–7 version 05 in ICON/IVM measurements are used.
Flying at a low Earth orbit at about 15 circles per day, ICON/IVM measures the ion density and temperature every second in the range of 590–607 km. One orbit can be divided into an ascending leg and a descending leg within the latitudinal range from 27°S to 27°N. The local times of the observed data in the ascending and descending legs are not differentiated and there is a daily precession of 0.5 h at a given latitude on a given day. Therefore, it takes about 46 days to complete the 24 h local time coverage for ICON/IVM measurements. Thus, results of the daily ion densities and migrating tides are obtained based on a 46-day sliding window with a 1-day step. Details of the fitting method are provided as follows. The fitting is only performed when the data gaps are lower than 30% in each window. The observed ion density (Ni) or ion temperature (Ti) at a given latitude and a given altitude can be written as Equation (1) [49]:
N t , λ = N ¯ t + m = M M s = 1 S N s , m t w c o s s ω 0 t u + m λ + β s , m + k = K K l = 1 L N l , k p w c o s ω 0 / l t u + k λ + φ l , k
which consists of three terms on the right-hand side: the background level, migrating and non-migrating tides, and stationary and traveling planetary waves, respectively.   s ω 0 is the frequency of tides, where ω 0 = 2 π / 24 (h). The second term represents the diurnal, semidiurnal, terdiurnal, and quarterdiurnal tides with s = 1 ,   2 ,   3 ,   4 . λ ,     t , a n d   t u   are the longitude, local time, and universal time. m is the tidal zonal wavenumber. N s , m t w denotes the amplitude of migrating tides when s = m ; otherwise, N s , m t w represents the amplitudes of non-migrating tides. l   and k represent the wave periods (in days) and wavenumbers of planetary waves. β s ,   m and φ l , k are the phase of tides and planetary waves, respectively. Planetary waves, generated in the troposphere, are usually hard to propagate into the topside ionosphere. Non-migrating tides are more likely to be influenced by local factors. Nevertheless, migrating tides induced by solar radiation might be a dominant dynamic in the topside region. Thus, we extract amplitudes and phases of migrating tides with s = m . When calculating the zonal mean value, Equation (1) can be expressed as Equation (2):
1 2 π 0 2 π N t , λ d λ = N ¯ t + s = 1 S N s m t w c o s s ω 0 t + β s ,   m + N r
The zonal mean of the observed data is on the left-hand side, and the three terms on the right-hand side, respectively, represent the background level, migrating tides, and residual component N r . Thus, the least-square fitting can be performed based on Equation (2) to derive the amplitude and phase of migrating tides ( N s m t w and β s , m ). Note that the background level is regarded as the ion density or ion temperature in the following discussions. The available data from the ICON/IVM is from 22 October 2019 to 31 December 2021. The daily variations in the observations in this study are all presented from 6 December 2019, which are marked at the end date of each 46-day sliding window. Results are shown within a latitudinal resolution of 3° in case of data gaps. Note that the results in the present study are shown as a function of geographic latitudes instead of magnetic latitudes. Using the geographic latitudes can also capture the seasonal tendency of tidal waves and allow us to derive the zonal mean calculation in the above equations.

3. Observations and Discussions

The topside ionosphere is easily impacted by the geomagnetic force and the solar force. Figure 1 shows the daily indices of F10.7 indices, the sum of Kp indices per day (ΣKp), and Dst indices from 6 December 2019 to 31 December 2021, in correspondence with ICON/IVM observations. As shown in Figure 1a, the solar radiations are generally higher in 2021 than in 2020. However, the Kp and Dst indices do not have much difference between 2020 and 2021. As seen from Figure 1b, the geomagnetic activity was slightly greater around April 2021 than around April 2020. A strong geomagnetic storm (Kp > 7) occurred on 4 November 2021, which led to large values of ΣKp and Dst.

3.1. Ion Density

Figure 2 presents the daily variations in the total ion density at ~600 km. The total ion density varies from the minimum of 2.4 × 104 cm−3 to the maximum of 17 × 104 cm−3 during the more than two years of observation. The total ion density reveals similar evolutions in 2020 and 2021: The density is relatively high around January and April and comparatively low around August. Around January, a high concentration in the total ion density is observed mainly in the southern hemisphere (SH). In a latitudinal range between 0 and 9°N, another seasonal enhancement in the total ion density can be seen around April. The total ion density becomes lower after May and reaches the minimum in July/August at all latitudes from 27°S to 27°N. Note that the total ion density has different behaviors in November between 2020 and 2021. The total ion density was enhanced in both hemispheres in November 2021, while this behavior was not captured in November 2020. A strong geomagnetic storm (Kp > 7) occurred on 4 November 2021, which may have led to the enhancement of total ion density in November 2021. However, more observations are needed from other satellites to better understand this structure. The RPA on ICON/IVM also provides the ion densities separately for O+ and H+, which can be used to understand the seasonal variations in the total ion density shown in Figure 2. The densities of H+ and O+ are presented in Figure 3a and Figure 3b, respectively.
As shown in Figure 3a, the density of H+ has two tilted enhancements each year, which reveals a semiannual oscillation (SAO) in the equatorial region. The decrease in H+ density is observed twice each year around January and August in the southern hemisphere but only once around August in the northern hemisphere. Figure 3b shows the variation in the O+ density, which reveals a very different structure from the variation in the H+ density. The concentrations of O+ are annually enhanced in the summer hemisphere and decreased in the winter hemisphere, which suggests an annual oscillation (AO) in the extra-equatorial region (poleward from 10°S and 10°N). A comparison of the total ion density shown in Figure 2 and Figure 3 indicates that at 600 km, the seasonal variations in O+ are more consistent with the total ion density than the H+ density. It seems that the AO in the O+ density is largely due to the movement of the sun. In addition to the seasonal variations, the total ion density and the O+ density both reveal a higher concentration in 2021 than in 2020. Previous studies have suggested that solar activity can influence the variations in ion density in the topside ionosphere [28,29]. According to Figure 1, the solar radiations are generally higher in 2021 than in 2020, which corresponds well to the concentrations in total ion density and O+ density. However, the concentrations in H+ density (as shown in Figure 3a) do not reveal an increasing trend from 2020 to 2021 as in solar radiation. As seen from Figure 1 and Figure 3, the O+ density reveals a high correlation with the variation in solar radiations, even after sharp increases in the solar radiations in December 2020 and December 2021. However, the positive response is not observed in the concentrations of H+, which even decrease in November 2021.

3.2. Ion Temperature

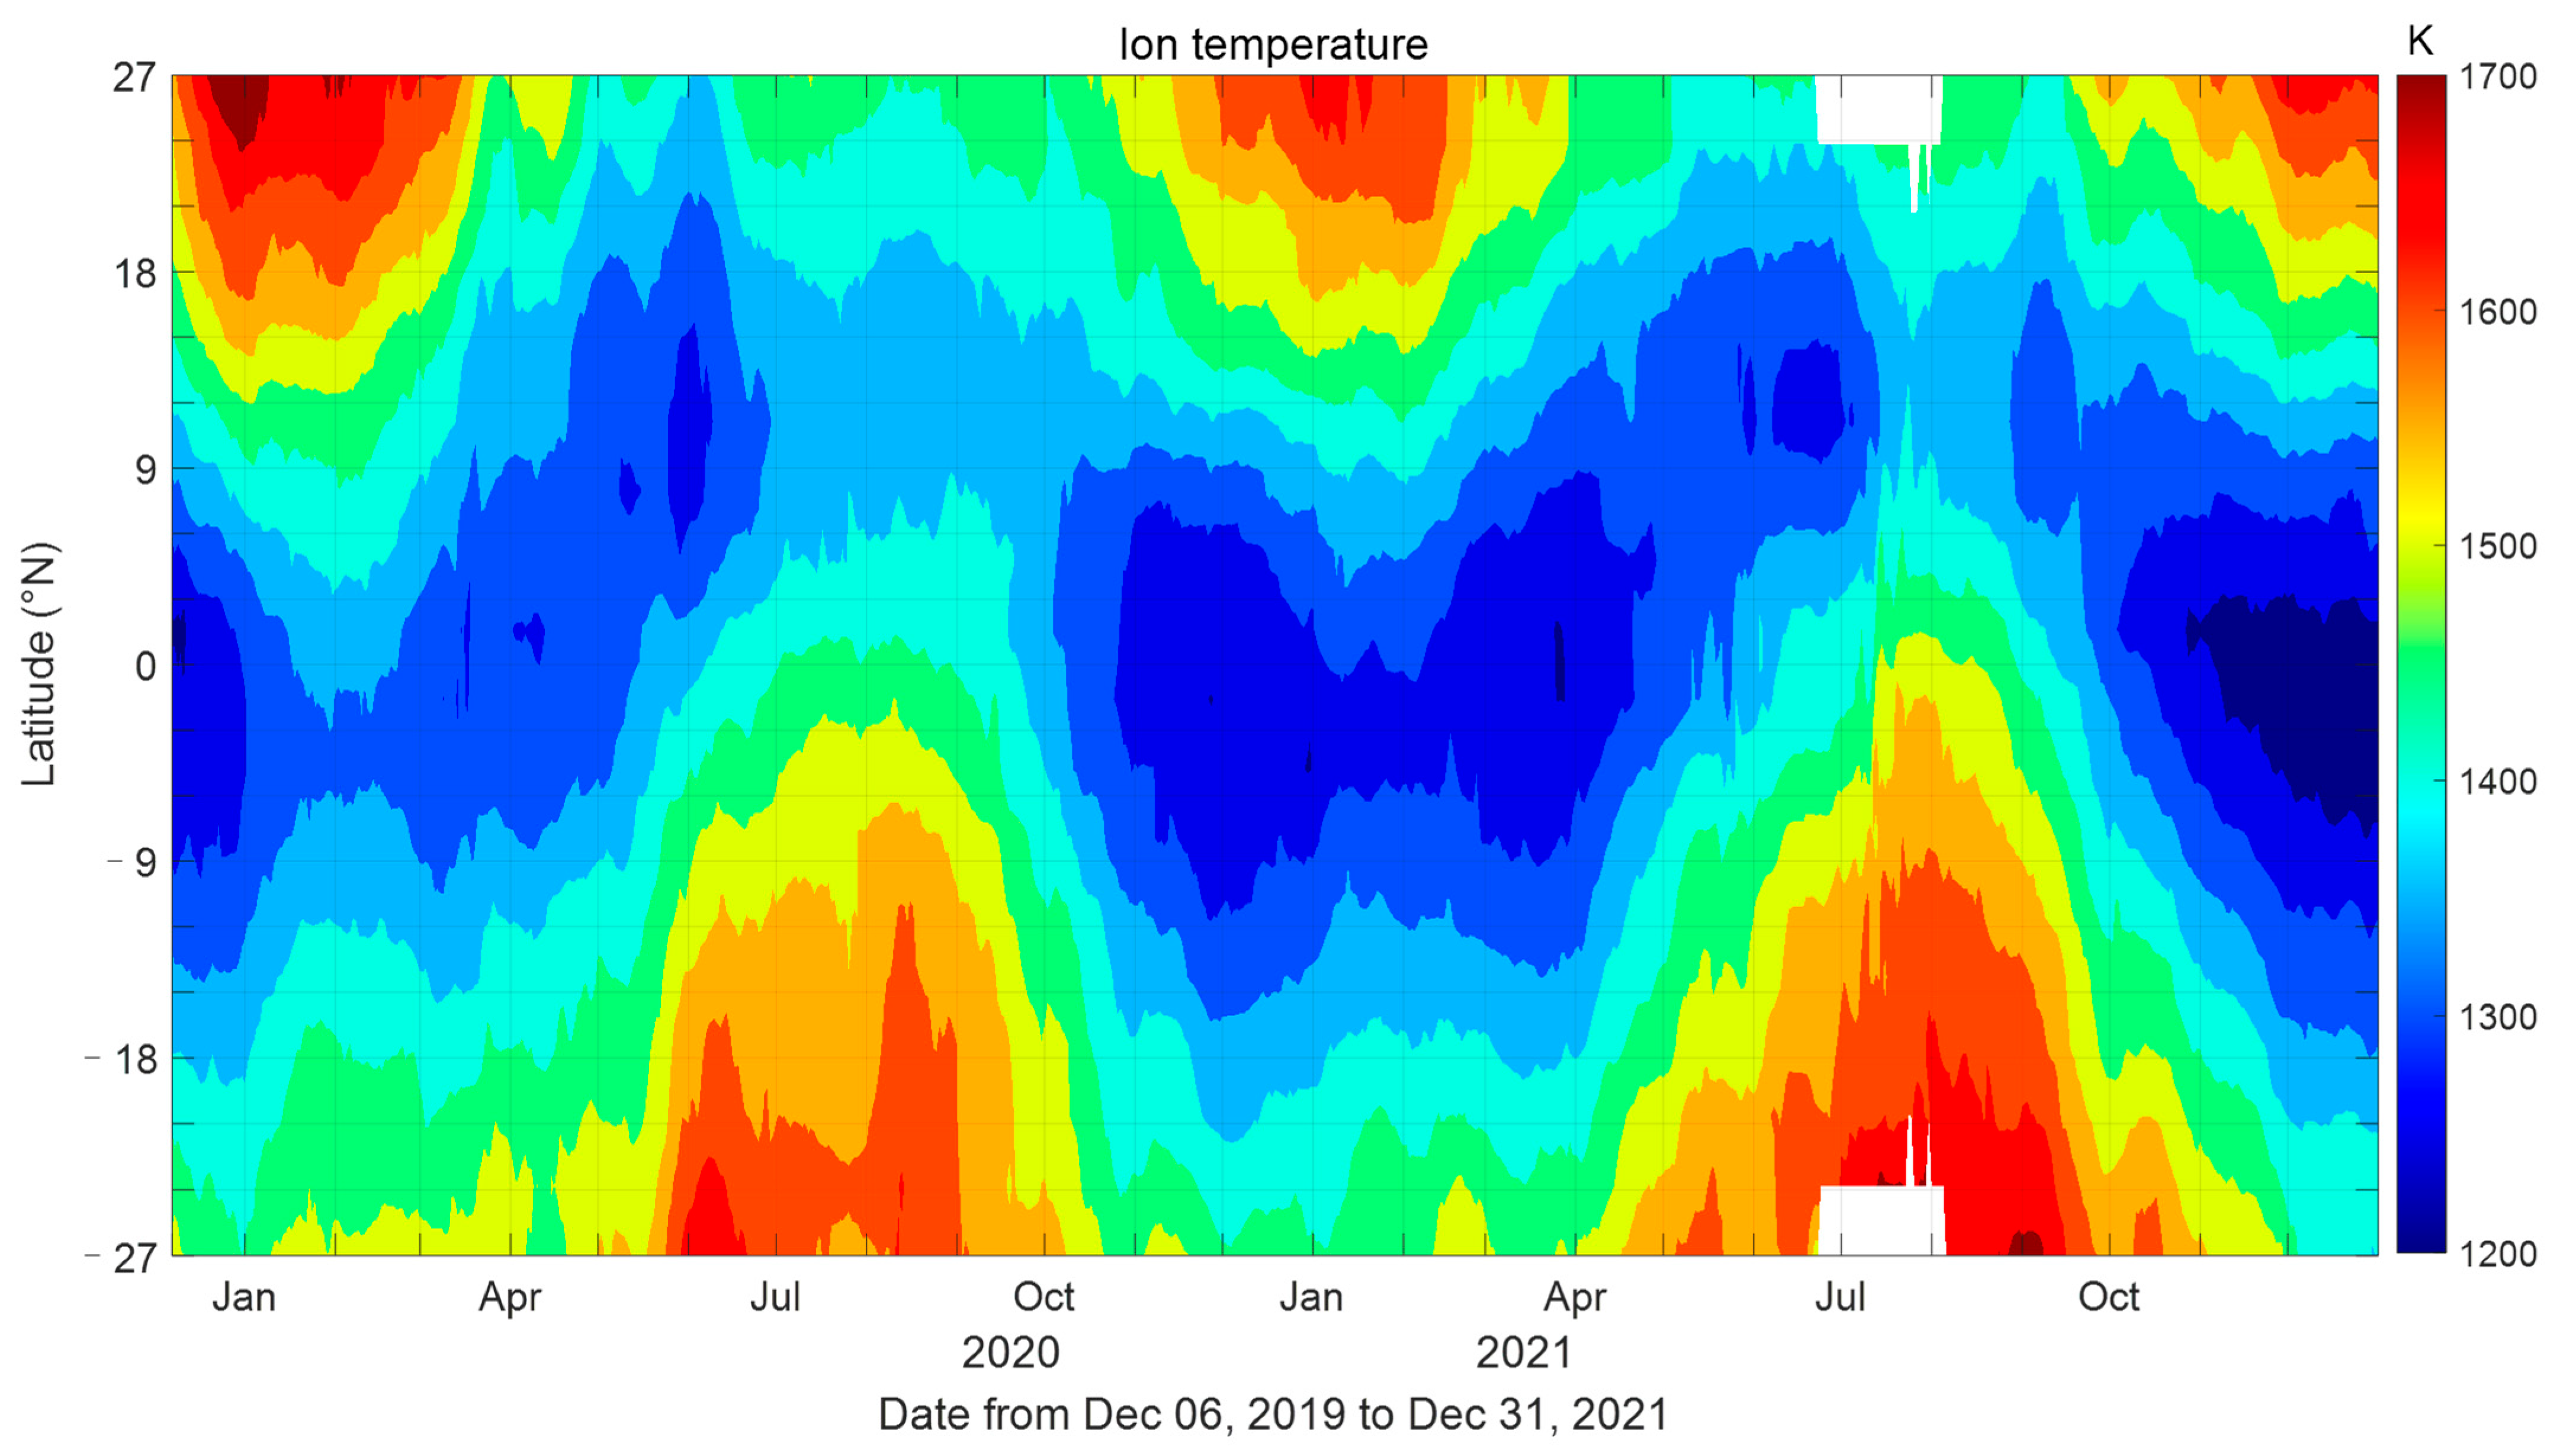
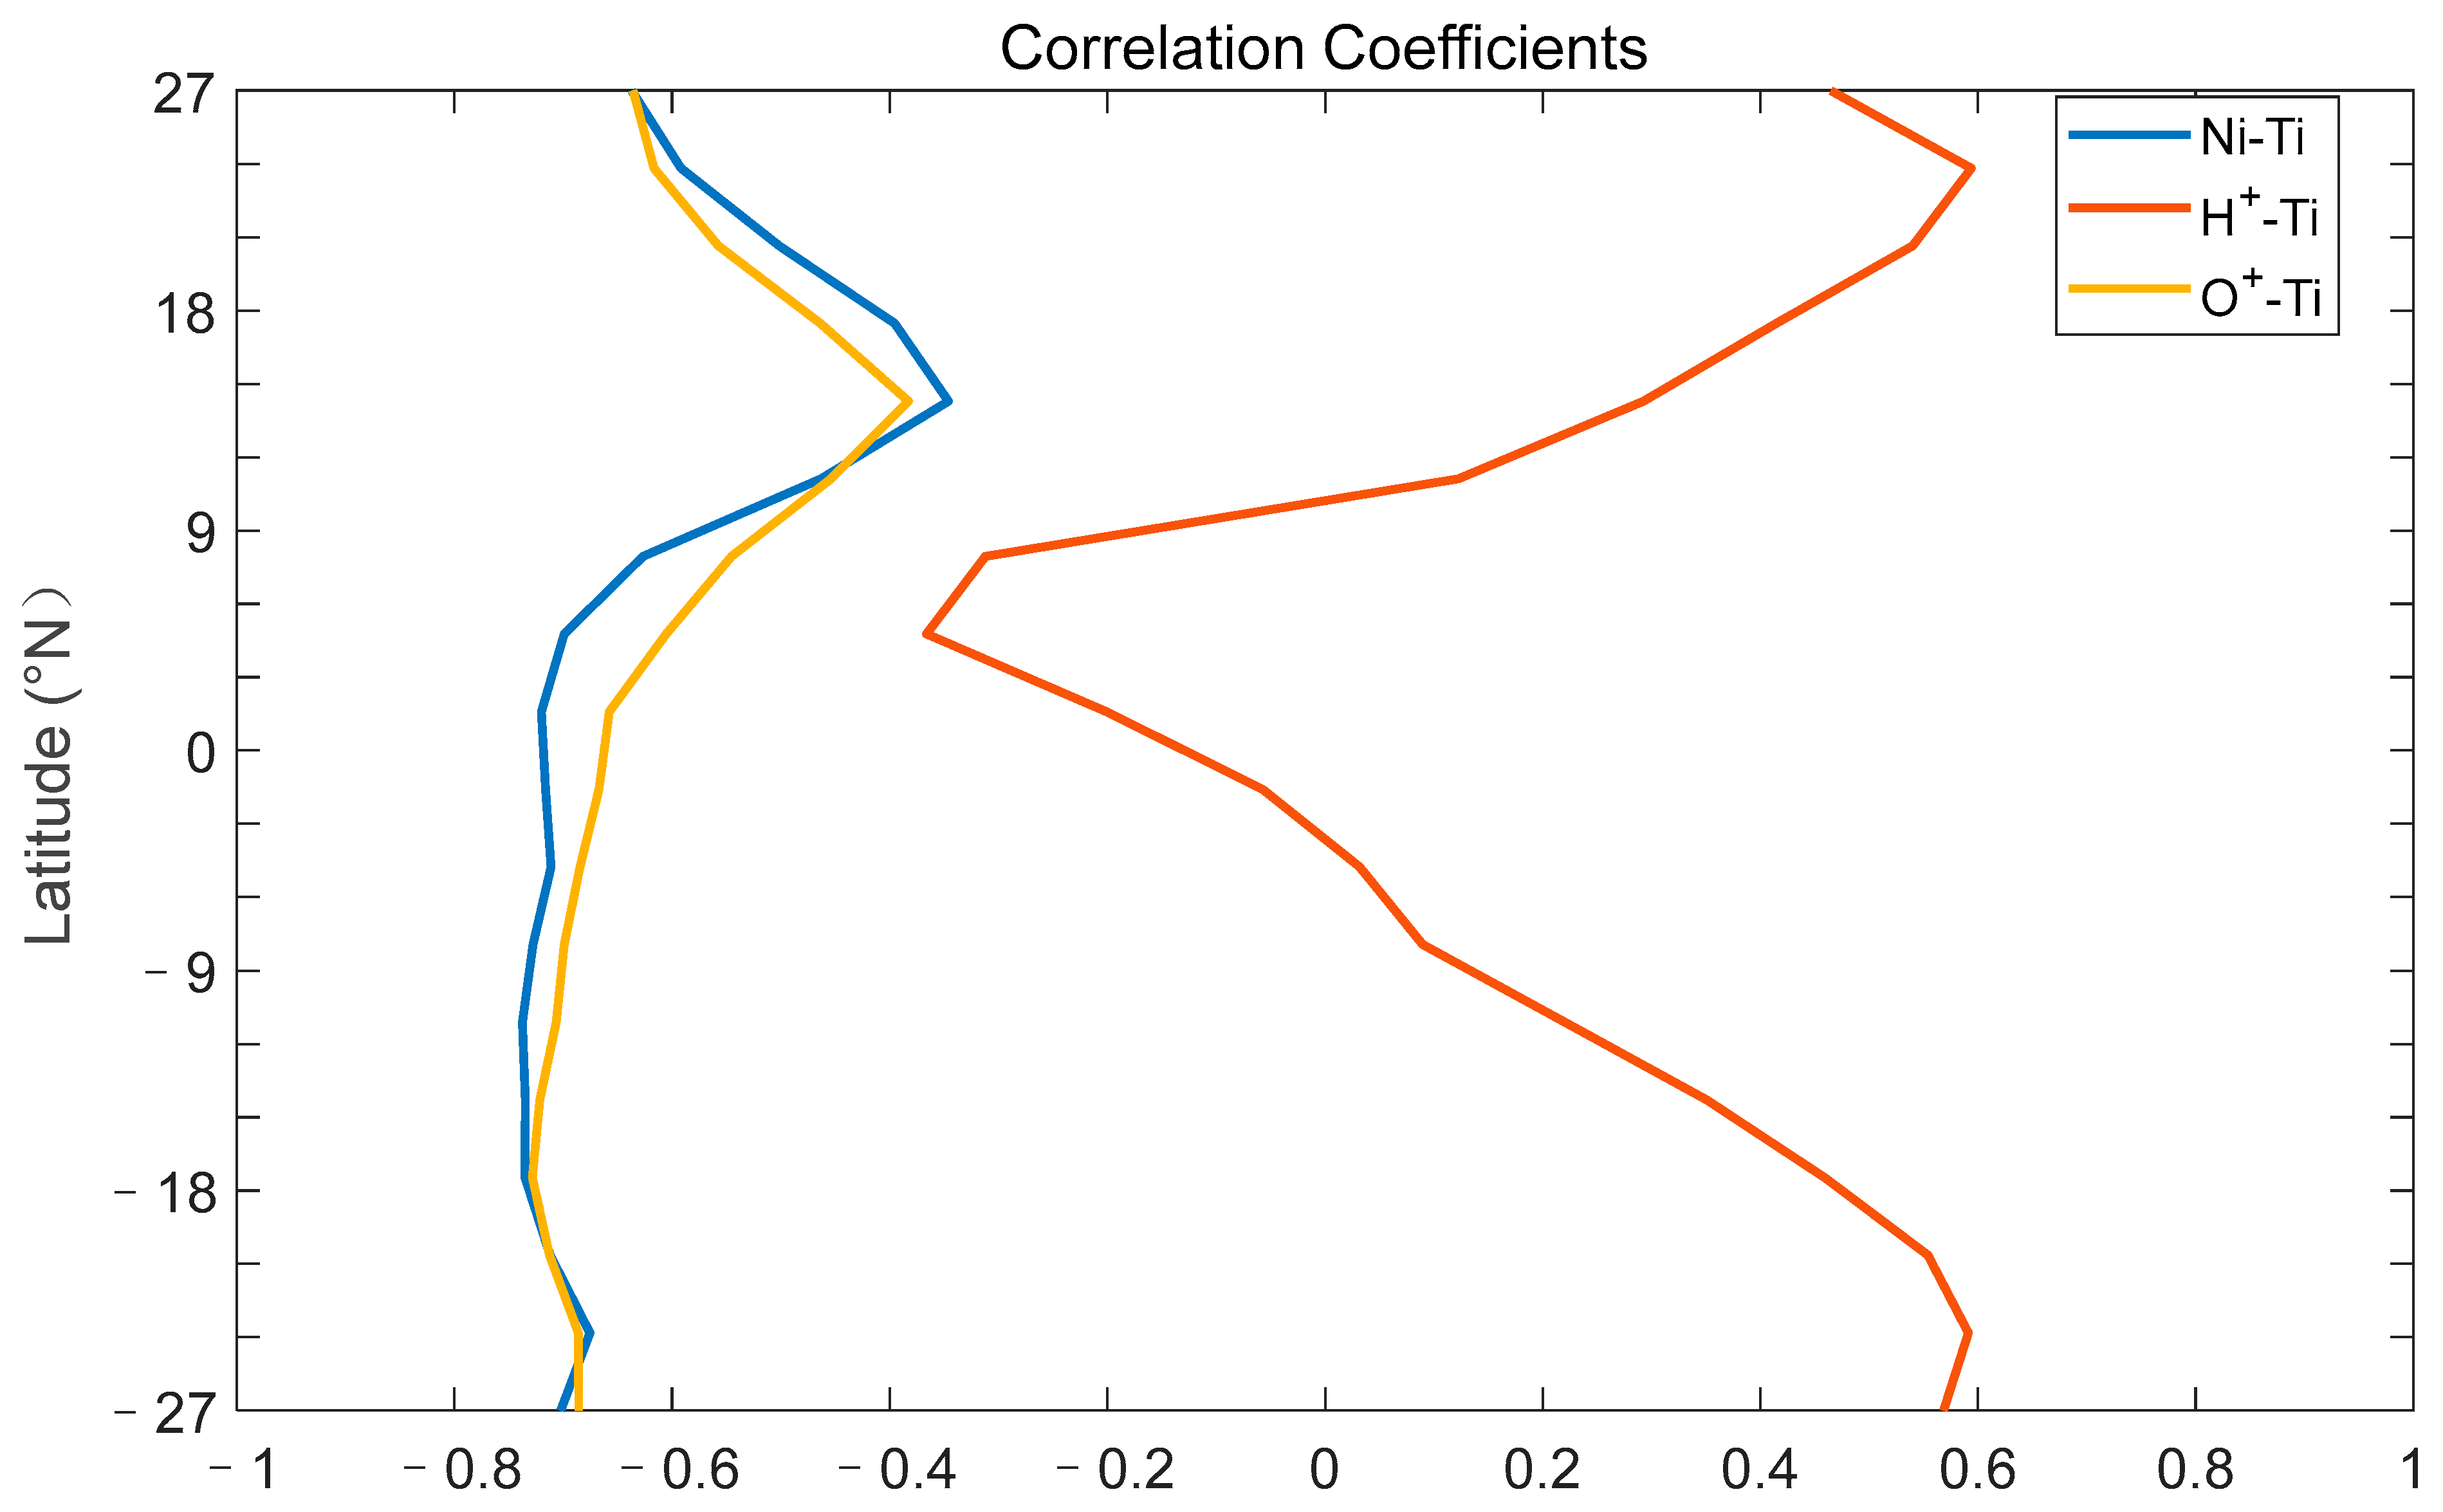
Ion temperature is another important ionospheric parameter provided by ICON/IVM. Figure 4 presents the observed daily variations in the ion temperature in the topside ionosphere from 6 December 2019 to 31 December 2021. The ion temperature is generally lower from October to January in the latitudinal range between 12°S and 12°N. Strong enhancements of the ion temperature can be seen during winter at each hemisphere, which exhibits a clear annual oscillation. As shown in Figure 2, the ion densities during winter in both hemispheres are relatively lower, which suggests that the ion temperature and ion density are anticorrelated in the topside ionosphere. In Figure 5, we further calculate the correlation coefficients between the ion temperatures and ion densities observed by ICON/IVM at each latitude.
As shown in Figure 5, the correlation coefficients are negative at each latitude between the ion temperature and the total ion density (blue). Interestingly, the correlation coefficients between ion temperature and O+ density (yellow) are consistent with the correlation coefficients between ion temperature and total ion density (blue), which are both negative at all latitudes. This feature indicates that the anticorrelation between ion temperature and total ion density is mainly caused by the anticorrelated ion temperature and O+ density. A positive correlation between ion temperature and H+ density (red) is only observed in the extra-equatorial regions. Zhou and Sulzer [50] reported the relationship between electron density and ion temperature in the topside ionosphere based on measurements from an incoherent scatter radar over Arecibo (18.3°N). They suggested that the electron density and ion temperature are not well correlated at 590 km, where the in situ measurement of the ICON/IVM is made. Our analysis also reveals a relatively lower correlation at latitudes around 18°N, while the absolute values of the negative correlation coefficients southward from 9°N are generally higher than 0.6. Zhang et al. [51] also reported the anticorrelation between total ion density and ion temperature in local daytime at low latitudes in the northern hemisphere, while a positive correlation is captured southward from 15°S. Borgohain and Bhuyan [52] suggested that the ion temperature was not related to the total ion density during the nighttime. Kakinami et al. [34] analyzed the correlation between ion density and ion temperature based on the ROCSAT-1 plasma data, while both positive and negative relations were observed.
Ions are heated by Coulomb collisions with electrons and cooled by ion-neutral collisions. Heat conduction, plasma transport, including adiabatic expansion and advection, and ion–ion collision can contribute significantly to the ion energy budget as well in the topside [53]. When local heating and cooling are balanced, as in the lower ionosphere, we expect the ion temperature to be positively correlated to the electron density in the steady state as both depend on solar irradiance. The fact that ion temperature is in anticorrelation with the O+ density indicates that ion-neutral collision is not likely the dominant cooling mechanism. Thermal conduction has been known to be important in the topside ionosphere and it is mostly along the field line. As the geomagnetic equator does not align well with the geographical equator and the geomagnetic equator is about 9°N of the geographical equator at most of the longitudes, samples from 9°N in the geophysical coordinator tend to correspond to the geomagnetic equator. In Figure 4, we see that 9°N is approximately the divisional line to make the upper part and lower part more balanced, i.e., 9°N is the hemispheric transitional latitude for Ti. We thus interpret the geographical hemispheric asymmetry to be due to the effect of the geomagnetic dip angle. Because thermal conduction is anisotropic in the geomagnetic frame and largely along the field line, it is a viable candidate in explaining the variation in the correlation coefficients in Figure 5. The negative correlation in Ti and O+ density away from the geomagnetic equator is a result of thermal conduction being the more dominant cooling mechanism for O+. This is consistent with the result obtained at Arecibo (18.3°N) by Zhou and Sulzer [50] that thermal conduction becomes dominant above 500 km for electron energy budget. Right above the geomagnetic equator (i.e., around 9 degrees northern latitude), plasma transport, ion–ion collision, and ion-neutral collision may contend for the energy budget of O+ at 600 km contributing to the smaller correlation coefficients.
One reason for the positive correlation between ion temperature and H+ density shown in Figure 5, stems from the anticorrelation between O+ density and H+ density. Plasma transport plays a large role in contributing to the anticorrelation of O+ density and H+ density away from the geomagnetic equator. When the ionosphere moves downward along the field line, a large amount of He+ and H+ are transported from the flux tube to 600 km, while O+ is pushed downward. This contributes to the anti-correlation between O+ density and H+ density (positive correlation between ion temperature and H+ density) at locations away from the geomagnetic equator as seen from observations at Arecibo by Gong et al. [5].

3.3. Migrating Tides

The amplitudes of migrating tides in the ion temperature can be obtained based on Equation (2). Figure 6 shows the daily evolutions of the amplitudes of westward propagating diurnal tide (DW1). The maximum amplitude of DW1 is above 800 K. In the SH, the amplitudes of DW1 in winters are usually larger than they are in summers, but this feature is not obvious in the NH. Nevertheless, the larger DW1 amplitudes are usually strong in the winter and summer months in both hemispheres, which exhibits a semiannual oscillation (SAO) and an annual oscillation (AO). In the lower thermosphere, the SAO and AO are also found in the amplitudes of DW1 using temperature observations [40,54]. The ionospheric total electron content (TEC) measurements also reveal the SAO and AO in the amplitudes of DW1 [43]. However, the seasonal variations in DW1 in the topside ionosphere are different from those in the lower thermosphere and the TEC. For instance, the enhancements of DW1 are around equinoxes in the lower thermosphere, but DW1 is enhanced during winter and summer in the topside ionosphere. Additionally, the peak amplitudes of DW1 in the thermospheric temperature and ionospheric TEC are located in the equator region, while larger amplitudes of DW1 in the topside ionosphere are separated in the extra-equatorial regions.
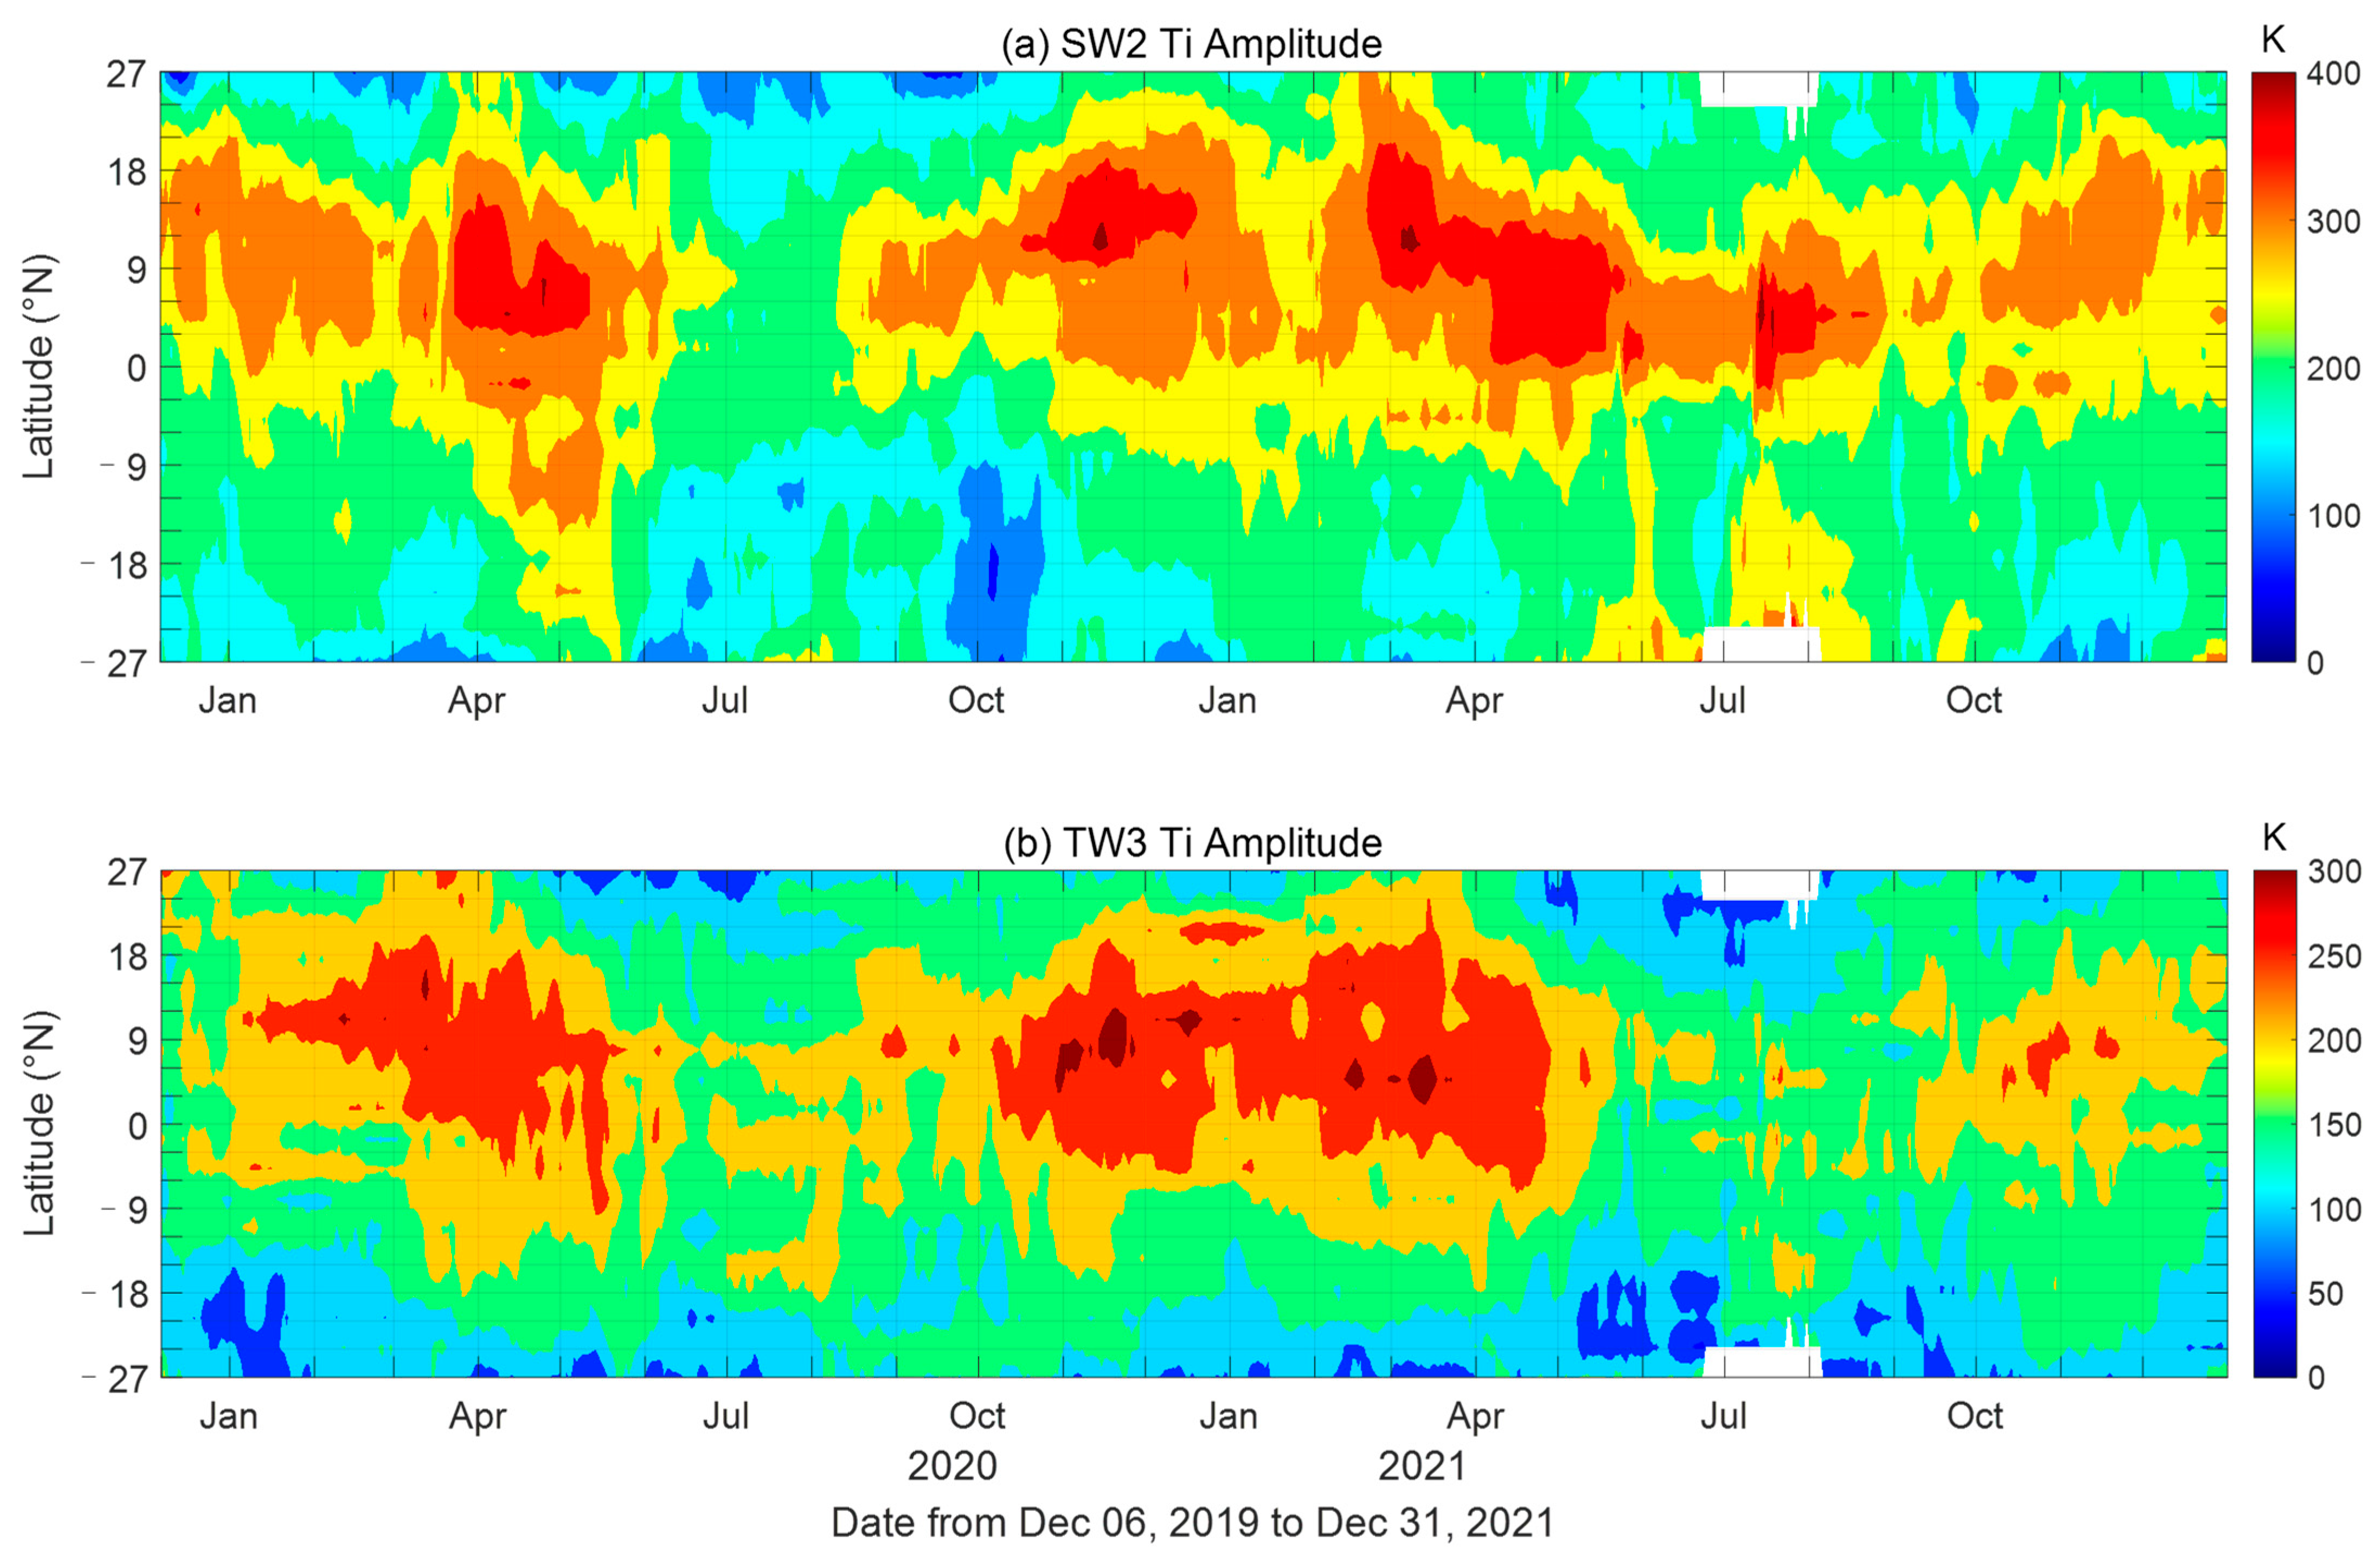
Evolutions of the amplitudes of westward propagating semidiurnal and terdiurnal tides (SW2 and TW3) are, respectively, presented in Figure 7a,b. Unlike the DW1, the feature of SAO is not obvious in the variations in the SW2 and TW3. The amplitudes of TW2 over 300 K are mainly located in the NH, while the amplitudes of TW2 are usually lower than 200 K as the latitude goes higher. The relatively lower amplitudes around 200 K in July 2020 are similar to the SW2 variations observed in ionospheric TEC [43], while the decrease in the SW2 amplitudes in July 2021 is not obvious. The spatial and seasonal variations in the TW3 amplitude are similar to that in the SW2 amplitude. The amplitudes of TW3 are enhanced twice a year and they are relatively weak around July in both hemispheres. The feature of lower amplitudes around July is similar to the seasonal variation in the TW3 in TEC observations [41]. Chang et al. [43] suggested that the amplitudes of migrating tides in TEC observations usually reveal positive correlations with the solar radiations. However, according to the results shown in Figure 6 and Figure 7, such positive correlations are not captured in the interannual variations from 2020 to 2021 in any of the migrating tidal components in the topside ionosphere. Anticorrelation between tidal winds and solar cycle activity in the mesosphere and the lower thermosphere is recently reported by Andrioli et al. [55]. By comparing the results shown in 2020 and 2021, the anticorrelation between tidal amplitude and solar radiation is only found during winter times in the component of DW1. More observations in a long-term time range are needed to further understand the correlation between tidal amplitudes and solar cycle activities in the topside ionosphere. Nevertheless, our analysis reveals the seasonal characteristics of the migrating tides in the topside ionosphere. The peaks in the DW1 amplitudes are found with a new structure in seasonal variations and latitudinal distributions, which are very different from the DW1 amplitudes in the lower thermospheric temperature and ionospheric TEC reported in previous studies.

4. Summary and Conclusions

Based on the ion density and ion temperature data obtained from the Ion Velocity Meter (IVM) instrument on the Ionospheric Connection Explorer (ICON) satellite from 2020 to 2021, we investigated the seasonal variations in ion density, ion temperature, and migrating tides in the topside ionosphere at the latitude range from 27°S to 27°N. Major conclusions are summarized as follows:
  • At 600 km, H+ density exhibits a semi-annual variation, and an annual variation is prominent in O+ density. The interannual variation in total ion density and O+ density is positively related to solar radiation from 2020 to 2021, while H+ density is not enhanced when solar radiation increases.
  • Ion temperatures measured by the ICON/IVM reveal an enhancement in the winter hemisphere and a decrease in the summer hemisphere. However, an anticorrelation between ion temperature and total ion density is found in their seasonal variations at all observational latitudes. Similar negative correlations are also captured between ion temperature and O+ density. Interestingly, these negative correlations have the largest amplitude away from the magnetic equator, which indicates that thermal conduction mainly dominates the cooling mechanism for O+ outside the magnetic equatorial region.
  • The seasonal variations in the semidiurnal and terdiurnal migrating tides in the topside ionosphere are generally consistent with the results derived from thermospheric temperature observations and ionospheric TEC measurements. However, the peak amplitudes of diurnal migrating tides in the topside ionosphere reveal different characteristics in the seasonal variations and latitudinal distributions, although semiannual oscillations are observed. The semiannual peaks are observed during winters and summers but are not during equinoxes. Additionally, the latitudinal peaks are separately located in the extra-equatorial regions but are not observed at the equator.

Author Contributions

Conceptualization, Z.M. and Y.G.; methodology, Z.M. and S.Y.; programming, Z.M., J.B. and S.Y.; validation, J.B., Q.Z. and S.Z.; formal analysis, S.Y. and J.B.; investigation, Z.M. and Y.G.; resources, Y.G. and S.Z; data curation, S.Z. and Q.Z.; writing—original draft preparation, Z.M. and S.Y.; writing—review and editing, Z.M., Y.G., Q.Z. and S.Z.; funding acquisition, Z.M, Y.G. and S.Z. All authors have read and agreed to the published version of the manuscript.

Funding

This research was funded by the National Key R&D Program of China (2022YFF0503703), the National Natural Science Foundation of China (42104145 and 42374192), and the National Youth Talent Support Program.

Data Availability Statement

ICON is supported by NASA’s Explorers Program through contracts NNG12FA45C and NNG12FA42I. ICON data are processed in the ICON Science Data Center at UCB and are available at https://icon.ssl.berkeley.edu/Data (accessed on 1 January 2022).

Acknowledgments

We acknowledge the use of the ICON data.

Conflicts of Interest

The authors declare no conflict of interest.

References

  1. Vickrey, J.F.; Swartz, W.E.; Farley, D.T. Ion transport in the topside ionosphere at Arecibo. J. Geophys. Res. Space Phys. 1979, 84, 7307–7314. [Google Scholar] [CrossRef]
  2. Erickson, P.J.; Swartz, W.E. Mid-latitude Incoherent Scatter Observations of Helium and Hydrogen Ions. Geophys. Res. Lett. 1994, 21, 2745–2748. [Google Scholar] [CrossRef]
  3. Sulzer, M.P.; González, S.A. Simultaneous measurements of O+ and H+ temperatures in the topside ionosphere over Arecibo. Geophys. Res. Lett. 1996, 23, 3235–3238. [Google Scholar] [CrossRef]
  4. Aponte, N.; Brum, C.G.M.; Sulzer, M.P.; González, S.A. Measurements of the O+ to H+ transition height and ion temperatures in the lower topside ionosphere over Arecibo for equinox conditions during the 2008–2009 extreme solar minimum. J. Geophys. Res. Space Phys. 2013, 118, 4465–4470. [Google Scholar] [CrossRef]
  5. Gong, Y.; Lv, X.; Zhou, Q.; Ma, Q.; Scott, M.; Zhang, S. Effect of temperature and vertical drift on helium ion concentration over Arecibo during solar maximum. J. Geophys. Res. Space Phys. 2019, 124, 9194–9202. [Google Scholar] [CrossRef]
  6. Gong, Y.; Lv, X.; Zhang, S.; Zhou, Q.; Ma, Z. The first observation of additional ionospheric layers over Arecibo using an incoherent scatter radar. Geophys. Res. Lett. 2022, 49, e2021GL097019. [Google Scholar] [CrossRef]
  7. González, S.A.; Fejer, B.G.; Heellis, R.A.; Hanson, W.B. Ion composition of the topside equatorial ionosphere during solar minimum. J. Geophys. Res. Space Phys. 1992, 97, 4299–4303. [Google Scholar] [CrossRef]
  8. Fejer, B.G.; Jensen, J.W.; Su, S.-Y. Quiet time equatorial F region vertical plasma drift model derived from ROCSAT-1 observations. J. Geophys. Res. Space Phys. 2008, 113, A05304. [Google Scholar] [CrossRef]
  9. Xiong, C.; Lühr, H.; Stolle, C. Seasonal and latitudinal variations of the electron density nonmigrating tidal spectrum in the topside ionospheric F region as resolved from CHAMP observations. J. Geophys. Res. Space Phys. 2014, 119, 10416–10425. [Google Scholar] [CrossRef]
  10. Shen, X.H.; Zhang, X.M.; Yuan, S.G.; Wang, L.W.; Cao, J.B.; Huang, J.P. The state-of-the-art of the China Seismo-Electromagnetic Satellite mission. Sci. China Technol. Sci. 2018, 61, 634–642. [Google Scholar] [CrossRef]
  11. Pezzopane, M.; Pignalberi, A. The ESA Swarm mission to help ionospheric modeling: A new NeQuick topside formulation for midlatitude regions. Sci. Rep. 2019, 9, 12253. [Google Scholar] [CrossRef] [PubMed]
  12. Li, J.; Chen, Y.; Liu, L.; Le, H.; Zhang, R.; Huang, H.; Li, W. Occurrence of Ionospheric Equatorial Ionization Anomaly at 840 km height observed by the DMSP satellites at solar maximum dusk. Space Weather 2021, 19, e2020SW002690. [Google Scholar] [CrossRef]
  13. Craven, P.D.; Comfort, R.H.; Richards, P.G.; Grebowsky, J.M. Comparisons of modeled N+, O+, H+, and He+ in the midlatitude ionosphere with mean densities and temperatures from Atmosphere Explorer. J. Geophys. Res. Space Phys. 1995, 100, 257–268. [Google Scholar] [CrossRef]
  14. West, K.H.; Heelis, R.A. Longitude variations in ion composition in the morning and evening topside equatorial ionosphere near solar minimum. J. Geophys. Res. Space Phys. 1996, 101, 7951–7960. [Google Scholar] [CrossRef]
  15. Su, Y.Z.; Oyama, K.-I.; Bailey, G.J.; Fukao, S.; Takahashi, T.; Oya, H. Longitudinal variations of the topside ionosphere at low latitudes: Satellite measurements and mathematical modelings. J. Geophys. Res. Space Phys. 1996, 101, 17191–17205. [Google Scholar] [CrossRef]
  16. Bilitza, D.; Altadill, D.; Truhlik, V.; Shubin, V.; Galkin, I.; Reinisch, B.; Huang, X. International Reference Ionosphere 2016: From ionospheric climate to real-time weather predictions. Space Weather 2017, 15, 418–429. [Google Scholar] [CrossRef]
  17. Su, S.Y.; Yeh, H.C.; Heelis, R.A.; Wu, J.; Yang, S.C.; Lee, L.; Chen, H.L. The ROCSAT-1 IPEI preliminary results: Low-latitude ionospheric plasma and flow variations. Terr. Atmos. Ocean. Sci. 1999, 10, 787–804. [Google Scholar] [CrossRef]
  18. de La Beaujardiere, O.; The C/NOFS Science Definition Team. C/NOFS: A mission to forecast scintillations. J. Atmos. Sol.-Terr. Phys. 2004, 66, 1573–1591. [Google Scholar] [CrossRef]
  19. Huba, J.D.; Heelis, R.; Maute, A. Large-scale O+ depletions observed by ICON in the post-midnight topside ionosphere: Data/model comparison. Geophys. Res. Lett. 2021, 48, e2020GL092061. [Google Scholar] [CrossRef]
  20. Immel, T.J.; England, S.; Mende, S.; Heelis, R.; Englert, C.; Edelstein, J. The Ionospheric Connection Explorer mission: Mission goals and design. Space Sci. Rev. 2018, 214, 13. [Google Scholar] [CrossRef]
  21. González, S.A.; Sulzer, M.P.; Nicolls, M.J.; Kerr, R.B. Solar cycle variability of nighttime topside helium ion concentrations over Arecibo. J. Geophys. Res. Space Phys. 2004, 109, A07302. [Google Scholar] [CrossRef]
  22. Ram, S.T.; Liu, C.H.; Su, S.-Y.; Heelis, R.A. A comparison of ionospheric O+/light-ion transition height derived from ion-composition measurements and the topside ion density profiles over equatorial latitudes. Geophys. Res. Lett. 2010, 37, L20107. [Google Scholar] [CrossRef]
  23. Truhlík, V.; Bilitza, D.; Trísková, L. Towards better description of solar activity variation in the International Reference Ionosphere topside ion composition model. Adv. Space Res. 2015, 55, 2099–2105. [Google Scholar] [CrossRef]
  24. Truhlík, V.; Trísková, L.; Šmilauer, J. Manifestation of solar activity in the global topside ion composition—A study based on satellite data. Ann. Geophys. 2005, 23, 2511–2517. [Google Scholar] [CrossRef]
  25. West, K.H.; Heelis, R.A.; Rich, F.J. Solar activity variations in the composition of the low-latitude topside ionosphere. J. Geophys. Res. Space Phys. 1997, 102, 295–305. [Google Scholar] [CrossRef]
  26. Sharma, D.K.; Rai, J.; Israil, M.; Subrahmanyam, P. Diurnal, seasonal and latitudinal variations of ionospheric temperatures of the topside F region over the Indian region during solar minimum (1995–1996). J. Atmos. Sol. Terr. Phys. 2005, 67, 267–274. [Google Scholar] [CrossRef]
  27. Chen, Y.; Liu, L.; Wan, W.; Yue, X.; Su, S.-Y. Solar activity dependence of the topside ionosphere at low latitudes. J. Geophys. Res. Space Phys. 2009, 114, A08306. [Google Scholar] [CrossRef]
  28. Borgohain, A.; Bhuyan, P.K. Solar cycle variation of ion densities measured by SROSS C2 and FORMOSAT-1 over Indian low and equatorial latitudes. J. Geophys. Res. Space Phys. 2010, 115, A04309. [Google Scholar] [CrossRef]
  29. Shen, X.; Zhang, X. The spatial distribution of hydrogen ions at topside ionosphere in local daytime. Terr. Atmos. Ocean. Sci. 2017, 28, 1009–1017. [Google Scholar] [CrossRef]
  30. Förster, M.; Jakowski, N. Geomagnetic Storm Effects on the Topside Ionosphere and Plasmasphere: A Compact Tutorial and New Results. Surv. Geophys. 2020, 21, 47–87. [Google Scholar] [CrossRef]
  31. Rich, F.J.; Sultan, P.J.; Burke, W.J. The 27-day variations of plasma densities and temperatures in the topside ionosphere. J. Geophys. Res. Space Phys. 2003, 108, 1297. [Google Scholar] [CrossRef]
  32. Gong, Y.; Zhou, Q.; Zhang, S. Atmospheric tides in the low-latitude E and F regions and their responses to a sudden stratospheric warming event in January 2010. J. Geophys. Res. Space Phys. 2013, 118, 7913–7927. [Google Scholar] [CrossRef]
  33. Gong, Y.; Zhou, Q.; Zhang, S.D.; Aponte, N.; Sulzer, M.; Gonzalez, S. The F region and topside ionosphere response to a strong geomagnetic storm at Arecibo. J. Geophys. Res. Space Phys. 2013, 118, 5177–5183. [Google Scholar] [CrossRef]
  34. Kakinami, Y.; Watanabe, S.; Yamamoto, M.-Y.; Chao, C.-K. Correlations between ion density and temperature in the topside ionosphere measured by ROCSAT-1. J. Geophys. Res. Space Phys. 2014, 119, 9207–9215. [Google Scholar] [CrossRef]
  35. Gong, Y.; Zhou, Q. Incoherent scatter radar study of the terdiurnal tide in the E- and F-region heights at Arecibo. Geophys. Res. Lett. 2011, 38, L15101. [Google Scholar] [CrossRef]
  36. Gong, Y.; Ma, Z.; Lv, X.; Zhang, S.; Zhou, Q.; Aponte, N.; Sulzer, M. A study on the quarterdiurnal tide in the thermosphere at Arecibo during the February 2016 sudden stratospheric warming event. Geophys. Res. Lett. 2018, 45, 13142–13149. [Google Scholar] [CrossRef]
  37. Gong, Y.; Lv, X.; Zhang, S.; Zhou, Q.; Ma, Z. Climatology and seasonal variation of the thermospheric tides and their response to solar activities over Arecibo. J. Atmos. Sol. Terr. Phys. 2021, 215, 105592. [Google Scholar] [CrossRef]
  38. Chen, G.; Li, Y.X.; Ning, B.Q.; Gong, W.L.; Yoshikawa, A.; Hozumi, K. Multi-Instrument Observations of the Atmospheric and Ionospheric Response to the 2013 Sudden Stratospheric Warming Over Eastern Asia Region. IEEE Trans. Geosci. Remote Sens. 2020, 58, 1232–1243. [Google Scholar] [CrossRef]
  39. Hagan, M.E.; Roble, R.G.; Hackney, J. Migrating thermospheric tides. J. Geophys. Res. Space Phys. 2001, 106, 12739–12752. [Google Scholar] [CrossRef]
  40. Xu, J.; Smith, A.K.; Liu, H.-L.; Yuan, W.; Wu, Q.; Jiang, G.; Mlynczak, M.G.; Russell, J.M.; Franke, S.J. Seasonal and quasi-biennial variations in the migrating diurnal tide observed by Thermosphere, Ionosphere, Mesosphere, Energetics and Dynamics (TIMED). J. Geophys. Res. Atmos. 2009, 114, D13107. [Google Scholar] [CrossRef]
  41. Luan, X.; Dou, X.; Lei, J.; Jiang, G. Terdiurnal migrating-tide signature in ionospheric total electron content. J. Geophys. Res. Space Phys. 2012, 117, A11302. [Google Scholar] [CrossRef]
  42. Liu, H.-L.; Richmond, A.D. Attribution of ionospheric vertical plasma drift perturbations to large-scale waves and the dependence on solar activity. J. Geophys. Res. Space Phys. 2013, 118, 2452–2465. [Google Scholar] [CrossRef]
  43. Chang, L.C.; Lin, C.-H.; Liu, J.-Y.; Balan, N.; Yue, J.; Lin, J.-T. Seasonal and local time variation of ionospheric migrating tides in 2007–2011 FORMOSAT-3/COSMIC and TIE-GCM total electron content. J. Geophys. Res. Space Phys. 2013, 118, 2545–2564. [Google Scholar] [CrossRef]
  44. Immel, T.J.; Harding, B.J.; Heelis, R.A. Regulation of ionospheric plasma velocities by thermospheric winds. Nat. Geosci. 2021, 14, 893–898. [Google Scholar] [CrossRef] [PubMed]
  45. He, M.; Chau, J.L.; Forbes, J.M.; Zhang, X.; Englert, C.R.; Harding, B.J. Quasi-2-day wave in low-latitude atmospheric winds as viewed from the ground and space during January–March, 2020. Geophys. Res. Lett. 2021, 48, e2021GL093466. [Google Scholar] [CrossRef]
  46. Dhadly, M.S.; Englert, C.R.; Drob, D.P.; Emmert, J.T.; Niciejewski, R.; Zawdie, K.A. Comparison of ICON/MIGHTI and TIMED/TIDI neutral wind measurements in the lower thermosphere. J. Geophys. Res. Space Phys. 2021, 126, e2021JA029904. [Google Scholar] [CrossRef] [PubMed]
  47. Hanson, W.B.; Sanatani, S.; Zuccaro, D.; Flowerday, T.W. Plasma measurements with the retarding potential analyzer on Ogo 6. J. Geophys. Res. 1970, 75, 5483–5501. [Google Scholar] [CrossRef]
  48. Heelis, R.A.; Stoneback, R.A.; Perdue, M.D.; Depew, M.D.; Morgan, W.A.; Mankey, M.W. Ion velocity measurements for the ionospheric connections explorer. Space Sci. Rev. 2017, 212, 615–629. [Google Scholar] [CrossRef]
  49. Xu, J.; Smith, A.K.; Yuan, W.; Liu, H.-L.; Wu, Q.; Mlynczak, M.G.; Russell III, J.M. Global structure and long-term variations of zonal mean temperature observed by TIMED/SABER. J. Geophys. Res. Atmos. 2007, 112, D24106. [Google Scholar] [CrossRef]
  50. Zhou, Q.H.; Sulzer, M.P. Incoherent scatter radar observations of the F-region ionosphere at Arecibo during January 1993. J. Atmos. Sol. Terr. Phys. 1997, 59, 2213–2229. [Google Scholar] [CrossRef]
  51. Zhang, X.; Shen, X.; Yuan, G. The solar cycle variations of plasma parameters and their correlations at topside ionosphere from DEMETER during 2005–2010. Adv. Space Res. 2015, 56, 1374–1388. [Google Scholar] [CrossRef]
  52. Borgohain, A.; Bhuyan, P.K. Effect of solar cycle on topside ion temperature measured by SROSS C2 and ROCSAT 1 over the Indian equatorial and low latitudes. Ann. Geophys. 2012, 30, 1645–1654. [Google Scholar] [CrossRef]
  53. Hsu, C.-T.; Heelis, R.A. Modeling the daytime energy balance of the topside ionosphere at middle latitudes. J. Geophys. Res. Space Phys. 2017, 122, 5733–5742. [Google Scholar] [CrossRef]
  54. Sridharan, S. Seasonal variations of low-latitude migrating and nonmigrating diurnal and semidiurnal tides in TIMED-SABER temperature and their relationship with source variations. J. Geophys. Res. Space Phys. 2019, 124, 3558–3572. [Google Scholar] [CrossRef]
  55. Andrioli, V.F.; Xu, J.; Batista, P.P.; Resende, L.C.A.; Da Silva, L.A.; Marchezi, J.P. New findings relating tidal variability and solar activity in the low latitude MLT region. J. Geophys. Res. Space Phys. 2022, 127, e2021JA030239. [Google Scholar] [CrossRef]
Figure 1. Daily variation in the (a) F10.7 indices (unit: solar flux unit, SFU = 10−22 W/m2/Hz), (b) sum of Kp indices per day, and (c) Dst indices from 6 December 2019 to 31 December 2021.
Remotesensing 15 05205 g001
Figure 2. Variation in the mean ion density (unit: cm−3) observed by ICON/IVM from 6 December 2019 to 31 December 2021. The contour step is 1 × 104 cm−3.
Remotesensing 15 05205 g002
Figure 3. Daily variation in the H+ and O+ densities (unit: cm−3) observed by ICON/IVM from 6 December 2019 to 31 December 2021. Contour steps are 2 × 103 cm−3 and 1 × 104 cm−3 for H+ and O+, respectively.
Remotesensing 15 05205 g003
Figure 4. Ion temperatures from 6 December 2019 to 31 December 2021, measured by ICON/IVM. The contour step is 50 K.
Remotesensing 15 05205 g004
Figure 5. Correlation coefficients at different latitudes between ion temperature and total ion density (blue), H+ density (red), and O+ density (yellow), respectively.
Remotesensing 15 05205 g005
Figure 6. Amplitudes of DW1 in temperature from 6 December 2019 to 31 December 2021, measured by ICON/IVM. The contour step is 50 K.
Remotesensing 15 05205 g006
Figure 7. Same as Figure 6 but for the amplitudes of SW2 (a) and TW3 (b). The contour step is 50 K.
Remotesensing 15 05205 g007
Disclaimer/Publisher’s Note: The statements, opinions and data contained in all publications are solely those of the individual author(s) and contributor(s) and not of MDPI and/or the editor(s). MDPI and/or the editor(s) disclaim responsibility for any injury to people or property resulting from any ideas, methods, instructions or products referred to in the content.