Abstract
Deep convolutional neural networks have greatly enhanced the semantic segmentation of remote sensing images. However, most networks are primarily designed to process imagery with red, green, and blue bands. Although it is feasible to directly utilize established networks and pre-trained models for remotely sensed images, they suffer from imprecise land object contour localization and unsatisfactory segmentation results. These networks still need to explore the domain knowledge embedded in images. Therefore, we boost the segmentation performance of remote sensing images by augmenting the network input with multiple nonlinear spectral indices, such as vegetation and water indices, and introducing a novel holistic attention edge detection network (HAE-RNet). Experiments were conducted on the GID and Vaihingen datasets. The results showed that the NIR-NDWI/DSM-GNDVI-R-G-B (6C-2) band combination produced the best segmentation results for both datasets. The edge extraction block benefits better contour localization. The proposed network achieved a state-of-the-art performance in both the quantitative evaluation and visual inspection.
1. Introduction
Remote sensing (RS) image interpretation is an effective tool for understanding the semantic content of the Earth’s surface. In recent years, as multispectral remote sensing images (MS) with high spatial resolution have become more readily available, substantial progress has been made in related research fields, such as land classification, geographic image retrieval, disaster monitoring, and mitigation [1,2,3].
Semantic segmentation (also known as land classification) assigns a class label to every pixel in a remote sensing image. In the traditional remote sensing image classification task, land classes are mainly extracted based on image features such as the spectral, texture [4], color, and spatial features of the image. The extracted features are then input into a flat classifier for land class classification. Typical classifiers include a Support Vector Machine (SVM) [5] and Random Forests (RF) [6]. Moreover, spectral indices have been well verified in classification to enhance model performance.
Spectral indices are combinations of spectral reflectance from two or more wavelengths that indicate the relative abundance of land classes of interest. The popular indices include vegetation and water indices. Vegetation indices mainly reflect the difference between vegetation reflection in visible and near-infrared wavelengths and soil background. Therefore, vegetation indices are often extracted to enhance vegetation information in hyperspectral and multispectral images. The difference vegetation index (DVI), normalized difference vegetation index (NDVI) [7], green NDVI (GNDVI) [8], ratio vegetation index (RVI) [9], and soil-adjusted vegetation index (SAVI) [10] emphasize vegetation over other land resources. Like the NDVI, the normalized difference water index (NDWI) [11] is less sensitive to an atmospheric influence than NDVI and can effectively highlight water abundance. These indices, which have been well-designed and widely applied, represent human knowledge in the remote sensing domain.
Beyond those hand-crafted features and stepwise segmentation processes presented in previous works, end-to-end semantic segmentation based on deep learning methods has attracted more attention [12]. Inspired by the superior performance and the explosion of methods in most segmentation tasks [13], efforts have been made to transfer the success of deep learning algorithms to the segmentation of MS data [12,14,15,16,17]. In those cases, the original bands of the remotely sensed images are typically input into the convolutional neural network to obtain the classification results.
However, these networks were not originally designed for remotely sensed images. They cannot sufficiently explore the spectral and spatial information of MS—the domain knowledge needs to be properly incorporated into the deep neural networks. Figure 1 shows the segmentation results obtained from multiple inputs, where the typical Res-UNet method [18] was employed. As depicted in Figure 1a, when using a three-Channel input, the boundaries obtained by the ResUNet method have a low localization accuracy. Deep neural networks are typically equipped with continuous convoluting and pooling operations, demonstrating their efficacy [19,20,21]. However, while these operations produce high levels of smoothing, they can also lead to a loss of spatial relationships between the target and surrounding pixels. Multispectral images often exhibit high spatial resolution and capture fine details of the Earth’s surface, resulting in significant spectral variability within a given scene. Adjacent land objects belonging to different land cover/use types, such as tree vs. meadow, and concrete road vs. parking lot, may exhibit subtle spectral differences and weak boundaries that are difficult to distinguish, leading to segmentation errors. Incorporating more bands and combining more information is an intuitive method to address this localization challenge. As depicted in Figure 1b,c, NIR bands, vegetation indices, and water indices are added to form the six-band and nine-band inputs. Although band stacking employed in the input layer can include more low-level edge cues, the disorderly guidance of edges results in blurring and, thus, inferior segmentation results. Therefore, a network that can harness information from multiple layers to better describe the object boundaries is essential when segmenting multispectral remote sensing images.

Figure 1.
Visual comparison of object boundaries obtained with multiple inputs and the Res-UNet network. (a) The edge was obtained from input RGB bands (3 channels), (b) from RGB-NIR+NDWI+GNDVI bands (6-channel), and (c) from RGB-NIR+NDWI+GNDVI-NDVI+DVI+RVI bands (9-channel). The white color represents the boundary of the ground truth, the red color represents the boundary obtained from the semantic segmentation, and the green color indicates the boundary where the segmentation results overlap with the ground truth.
Incorporating human domain knowledge can significantly enhance deep learning models [22]. However, the challenge lies in effectively integrating knowledge in a precise form. In this context, we incorporate knowledge in the remote sensing domain for semantic segmentation by augmenting the input and improving the architecture of a typical deep network. Specifically, we proposed a new network structure, holistic attention edge-ResUNet (HAE-RNet). The network boosts the segmentation performance of MS images by augmenting the input with multiple nonlinear spectral indices and introducing a novel holistic attention edge detection block.
The rest of the paper is organized as follows: Section 2 reviews related works. In Section 3, we describe the model architecture methods in detail. Section 4 describes the dataset used for training, the spectral band combination setting, and the algorithm testing, and provides an experimental analysis to evaluate the model’s generalization ability. Section 5 discusses the experimental results, and the major conclusions are summarized in Section 6.
2. Related work
2.1. Semantic Segmentation Methods for Deep Learning
With the rapid development of remote sensing technology, the spatial resolution of optical remote sensing images has been increasing. The traditional semantic segmentation methods cannot meet the interpretation needs of complex scenes due to the limited expressive power of hand-crafted features [23].
In 2015, Long et al. proposed Fully Convolutional Networks (FCNs) [24], which can take arbitrary-sized images as the inputs and perform dense pixel-wise estimation through convolutional layers. This advancement enabled end-to-end semantic segmentation and significantly propelled the development of the field. Inspired by FCN, the DeepLab series [25,26] adopted various convolutional structures and techniques to improve the segmentation performance and efficiency, achieving a balance between the semantic segmentation accuracy and speed. Similarly, the encoder–decoder architecture has become a commonly used deep learning approach in image semantic segmentation tasks [19,27,28,29,30,31,32]. The encoder part is responsible for feature extraction, while the decoder part restores the fine-grained details of target boundaries. The decoder incorporates upsampling operations to restore the feature maps from the encoder to the original image size and leverages skip connections or other mechanisms to fuse deep coarse features with shallow fine features, effectively enhancing the image segmentation performance, particularly in handling detail information. Much research nowadays improves the semantic labeling problem by integrating shallow and deep features through convolution, dual-path architecture [33,34,35], which better maintains the global features. These methods have made significant progress in the field of semantic segmentation, continuously driving the advancement of computer vision tasks.
2.2. Deep Learning for Multispectral Semantic Segmentation
Many effective semantic segmentation networks have been proposed in recent years. However, most of them are designed for visible RGB images. The quality of RGB images can easily degrade due to unsatisfied illumination conditions, which poses a serious challenge for networks relying solely on RGB images [14].
Integrating geometric and spectral information to improve segmentation accuracy is gaining popularity, considering the availability of drastically different, geographically registered data in the remote sensing field [33]. By combining visible and thermal bands, the network [15] was trained to achieve robust and accurate semantic segmentation with excellent performance. After recognizing that the depth channel contains complementary information to the RGB channel, convolutional neural networks were used to fuse the depth information with the RGB data [16,34,35], and as the network went deeper, these features were fused into the RGB feature maps to achieve more accurate segmentation results. Typically, there is a geometric correlation between the height information and the semantic information of a remotely sensed scene. Some recent studies [34,36] have shown that height estimation and semantic segmentation can benefit each other. By combining the advantages of multispectral data in distinguishing typical features such as water and vegetation, a multispectral semantic segmentation network (MSNet) [33] proposed a dynamic synthesis method for multi-channel remote sensing image datasets to improve the overall segmentation accuracy.
2.3. Edge Guidance in Segmentation
Textures and edges provide different information for image recognition. Edges and boundaries encode shape information while texture shows the appearance of the region [37]. The edge details of MS images are also noticed due to their complex texture characteristics.
The Markov Random Field (MRF) [38,39,40] model smoothed the initial classification map while maintaining object boundaries and integrating class co-occurrence dependencies to regularize pixels near target boundaries. This method avoids excessive smoothing and significantly improves classification accuracy, but in complex network structures, computing marginal probabilities or conditional probability distributions can become extremely complex. In previous multiscale approaches [41,42], scale space regions were neither automatically learned nor hierarchically connected. The holistically-nested edge detection (HED) [43] automatically learned rich hierarchical land class types to address the problem of ambiguity in natural image edge and object edge detection. Many studies have explored HED’s approach [44,45,46]. The high-frequency detail loss caused by continuous convolution and pooling operations and the uncertainty introduced when annotating low-contrast objects with weak boundaries induces blurred object boundaries. Therefore, the multi-scale edge information extracted by MAE-BG [47] was fed into the backbone network to complement the loss of details caused by convolution and pooling operations. MAE-BG consisted of an edge detection (ED) branch and a smoothing branch with boundary guidance (BG). The edge detection branch was designed to enhance weak edges that needed to be preserved while suppressing false responses caused by localized textures.
3. Methodology
In this section, the architecture of the proposed HAE-RNet is presented. By introducing a novel edge extraction branch to the backbone, the network is expected to properly model the object boundaries and preserve the recognition capacity of classic DCNNs. Meanwhile, by augmenting the input with extra bands, a pixel sample can be described by a set of features, including raw spectral and transformed bands calculated according to the domain knowledge of remote sensing. We couple the recognition capacity of HAE-RNet and sufficient domain knowledge provided by the augmented input bands to achieve accurate semantic segmentation results for MS imagery.
3.1. HAE-RNet for Enhancing Edge Detection Performance in MS Images
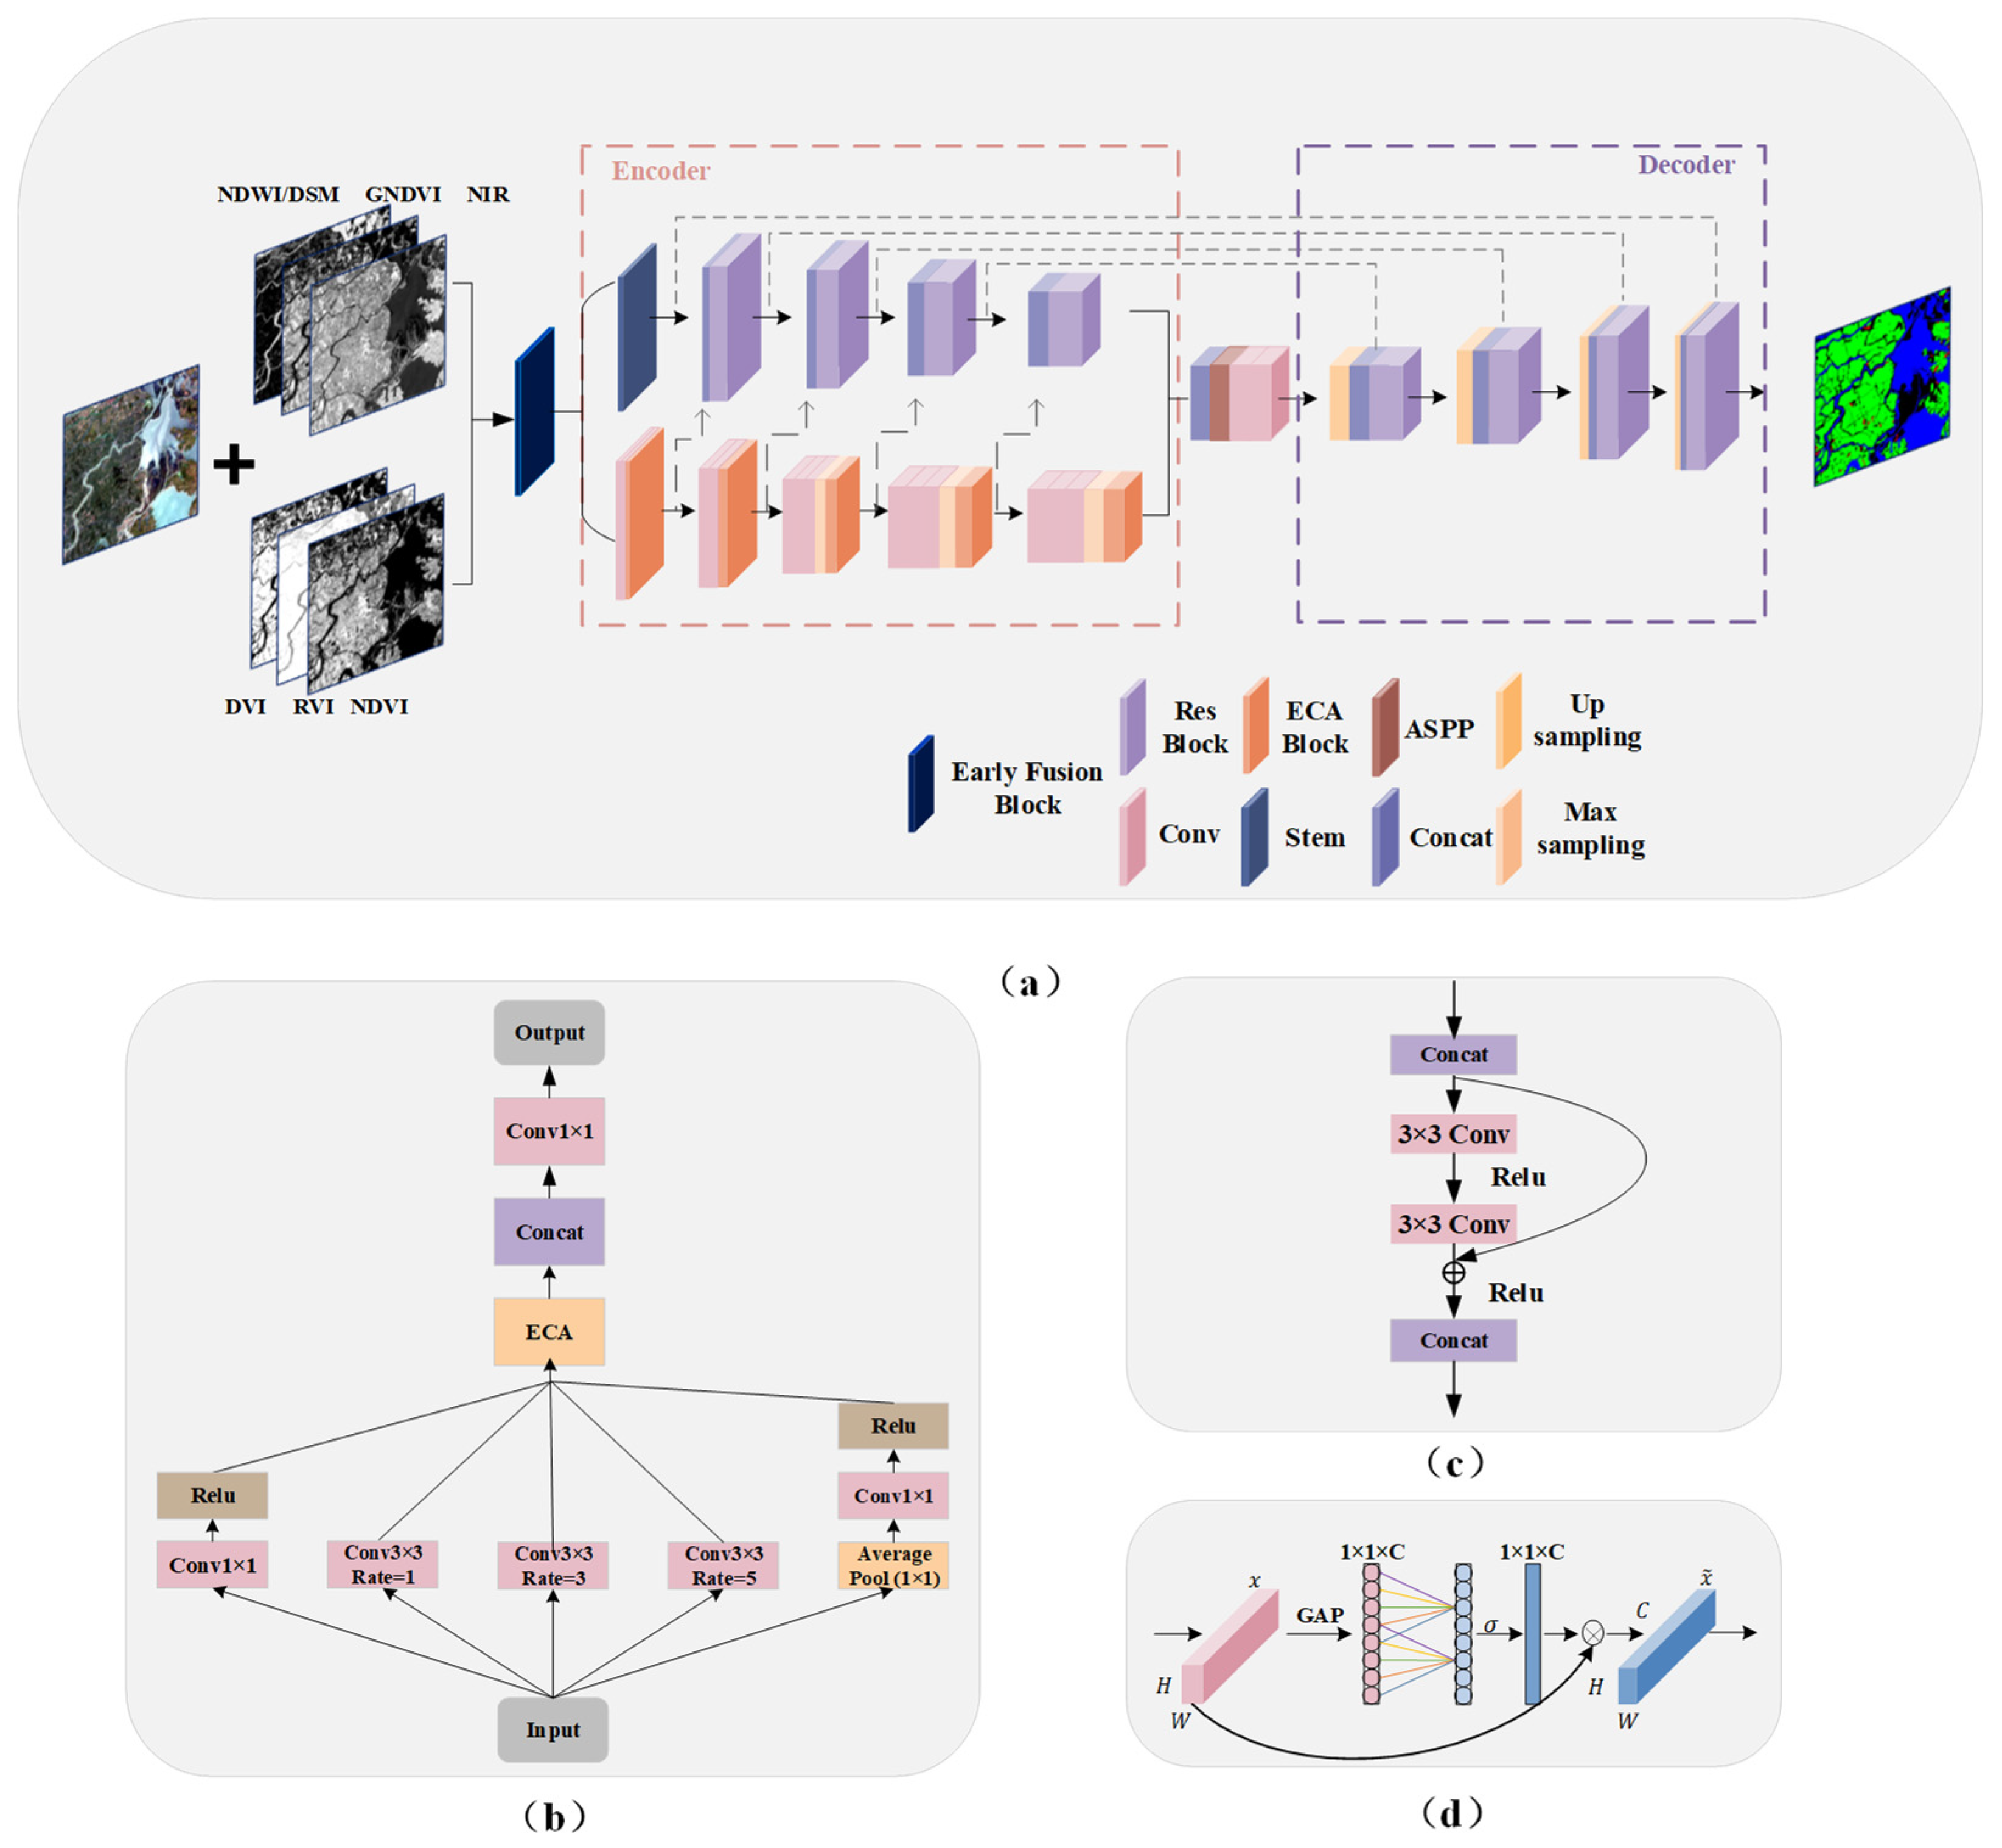
The contraction path of U-Net, acting as an encoder, captures the image’s contextual information through downsampling operations. The expansion path acts as a decoder, recovering the position information of the image through the upsampling operation, and gradually recovering the details of the object and the resolution of the image to recover the position information and further refine image details and resolution. HAE-RNet combined the advantages of ResNet, Atrous Spatial Pyramid Pooling (ASPP), attention module, and edge detection based on U-Net. As shown in Figure 2, HAE-RNet consists of the encoder, bridge, and decoder parts. The encoder part is further divided into the edge and feature extraction branches. The edge extraction branch comprises five Efficient Channel Attention (ECA) blocks and convolution blocks, while the feature extraction branch incorporates four residual blocks. The bridge section primarily comprises the ASPP block. The decoder part consists of four residual blocks. The detailed structures of ASPP, residual, and ECA blocks are shown in Figure 2b–d, respectively.
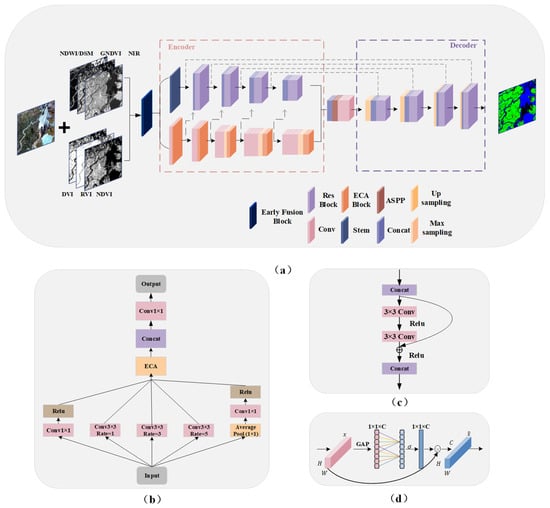
Figure 2.
The proposed HAE-RNet architecture and block details. (a) HAE-RNet is in an encoder–decoder style. (b) The ASPP Block in the bridge part. (c) The Residual Block in the encoder–decoder part. (d) The ECA Block in the encoder part.
The overall HAE-RNet network is in an encoder–decoder style and consists of stacked layers of modified ResUNet units. We used a stem module to extract land class information and avoid information loss in the initial image by aggregating pixel features with larger kernel [45]. Additionally, a composite block, formed of five ECA attention modules and convolutional blocks, is employed to extrapolate the edge features of MS. Each ECA module is used to enrich the edge information of every respective band. The operation within the ECA module designed to enhance edge details is termed as the Edge Detection Branch (ED). The ECA module is precisely designed to intensify the edge information of each band by decreasing the model complexity through channel interactions, leading to substantial enhancement in performance. Block1, the first output of the ECA attention module, which embodies the edge information features, is amalgamated with the output from the main network and input into Res Block1. Likewise, the second output of the ECA module is amalgamated with the output from Res Block1 and is inputted into Res Block2. This same process is executed for the third edge information feature output and Res Block3. Eventually, the fifth output from the ECA module, which contains edge information, is fused with Res Block4 and is fed into the bridging ASPP Block.
The bridge in the encoder structure combined the ASPP Block and convolutional blocks. The ASPP Block was typically placed at the end of the encoder to extract multiscale features by expanding the receptive field [23]. However, as the network depth increases, the large amount of target location information in RS images is severely lost. Consequently, placing the ASPP block solely at the end of the neural network becomes insufficient for extracting adequate feature information. To address this, the ASPP block was placed in the middle of the codec structure, allowing for edge localization. This arrangement facilitated the extraction of multiscale features from feature maps of different sizes using different receptive fields. The modified ResUNet network simultaneously accepted input from both visible and invisible bands. Additionally, we made improvements to the ASPP Block. By introducing the ECA Block, we enhanced the ASPP Block for multiscale learning. Compared to the traditional ASPP structure, we modified it to increase complexity and included the ECA Block to strengthen the ASPP Block further and enhance training quality.
In the encoding process, the five single-channel edge feature maps obtained in the first step are input into the four network layers following the ECA attention mechanism. To connect the encoding and decoding processes, ASPP was incorporated. While the overall structure could have been more complex, we achieved efficient improvements through simple network improvements and channel merging for multi-band inputs. We employed atrous convolution rates of (1, 3, 5) for the ASPP structure to save cost. The ASPP output of the bridge was then combined with the corresponding module in the decoder. This fusion preserves the contextual information of the network while minimizing the loss of shallow features.
The decoder module consisted of four convolutional blocks, each performing an upsampling operation to recover the image size using bilinear upsampling. Skip connections connect the output of each encoder layer to the corresponding decoder layer. Each layer of the encoder output 1, 2, 3, 4 contains the Res Block 1, 2, 3, 4 and four edge outputs that have passed through the ECA Block. Consequently, the edge structure obtained by our attention mechanism was global, and the edge features were directly input to the decoding structure. The combination layer in the network merges the encoder and decoder inputs and convolves them, normalizing them to the desired number of land classes.
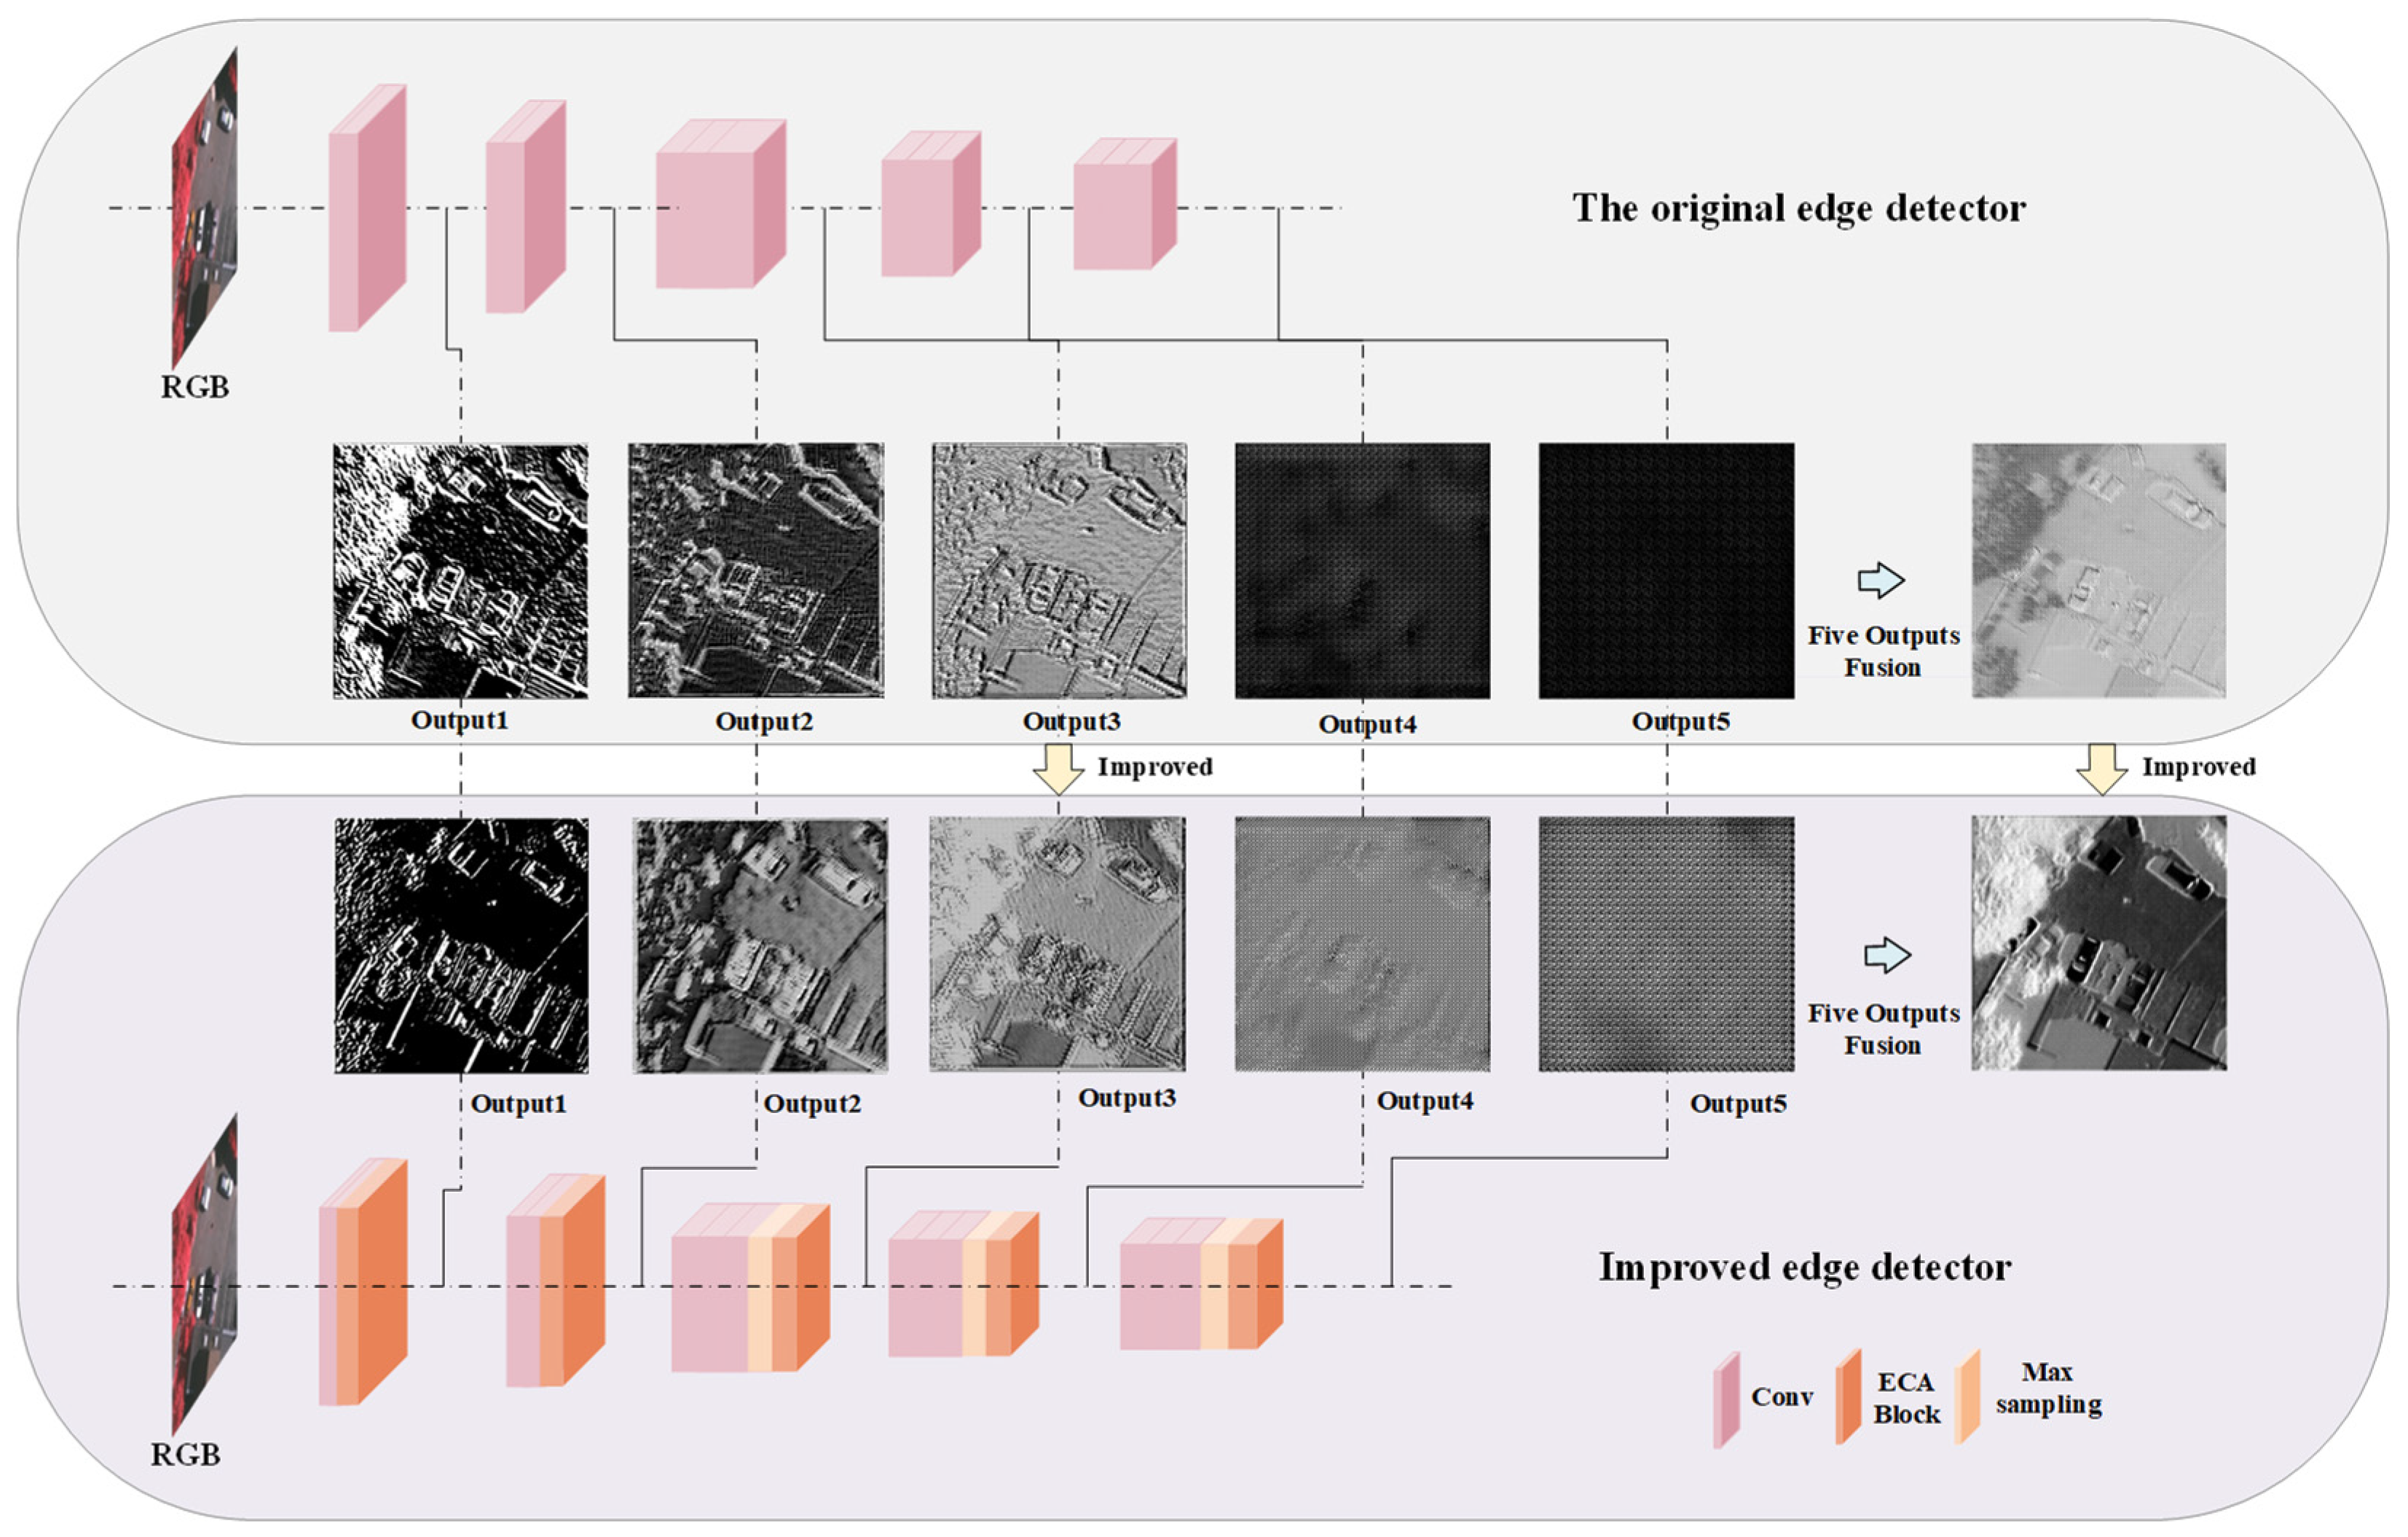
As shown in Figure 3, our innovative edge detector is designed to conduct edge extraction on five separate occasions, enabling a more intricate analysis of the subject’s contours and boundaries. To streamline the representation of the model’s results and ensure a coherent visual interpretation, we have opted to use a standard display resolution of 256 × 256 pixels across all demonstrations. This uniform approach allows for a more uncomplicated comparative analysis and an unobstructed view of the model’s proficiency in edge delineation.
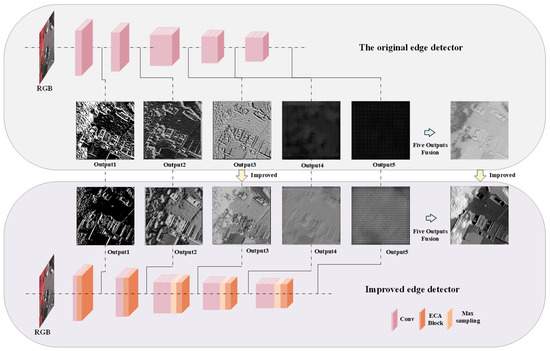
Figure 3.
Edge detection detail output map.
It is unequivocally evident from the visual representation that subsequent to meticulous refinements and enhancements made to the model, there is a conspicuous improvement in its capability to extract edges. The model now evidently outperforms the initial models that were designed for edge extraction. This enhancement is not merely nominal, but significantly pronounced, emphasizing the model’s advanced proficiency and the effectiveness of the improvements implemented.
3.2. Augmented Inputs for HAE-RNet
The objective of the multispectral semantic segmentation network was to utilize all band information in remote sensing images fully. This study introduced a priori knowledge of remote sensing scene segmentation by introducing various spectral indices for classification.
We categorized the bands of multispectral remote sensing images into the original and combined bands. The original bands were primarily utilized for extracting land classes’ color, texture, shape, and spatial relationships. On the other hand, the combined bands consisted of vegetation, water indices, and other related features. The vegetation and water indices were chosen for the band combinations because these five spectral indices can be obtained directly from existing band calculations for both the two publicly available datasets used in this paper and other optical remote sensing images, and the combined reflection operations of features in multiple wavelength ranges enhance the vegetation and water features. By splitting and reorganizing the bands, we extracted the edge and image features from both visible and invisible bands and merged them. In addition, an edge detection module was introduced into the structure to enhance the detection of feature boundaries. Highly accurate semantic segmentation results were achieved through hierarchical fusion. To verify the effectiveness of various index features, seven combinations are considered, as shown in Table 1.

Table 1.
Considered band combinations as inputs for HAE-RNet.
Original Bands-1 denotes Original Bands + NIR, Vegetation index-1 denotes NDVI, Vegetation index-2 denotes GNDVI, Vegetation index-3 denotes DVI, Vegetation index-4 denotes RVI, and All Vegetation indices consist of NDVI, GNDVI, DVI, and RVI.
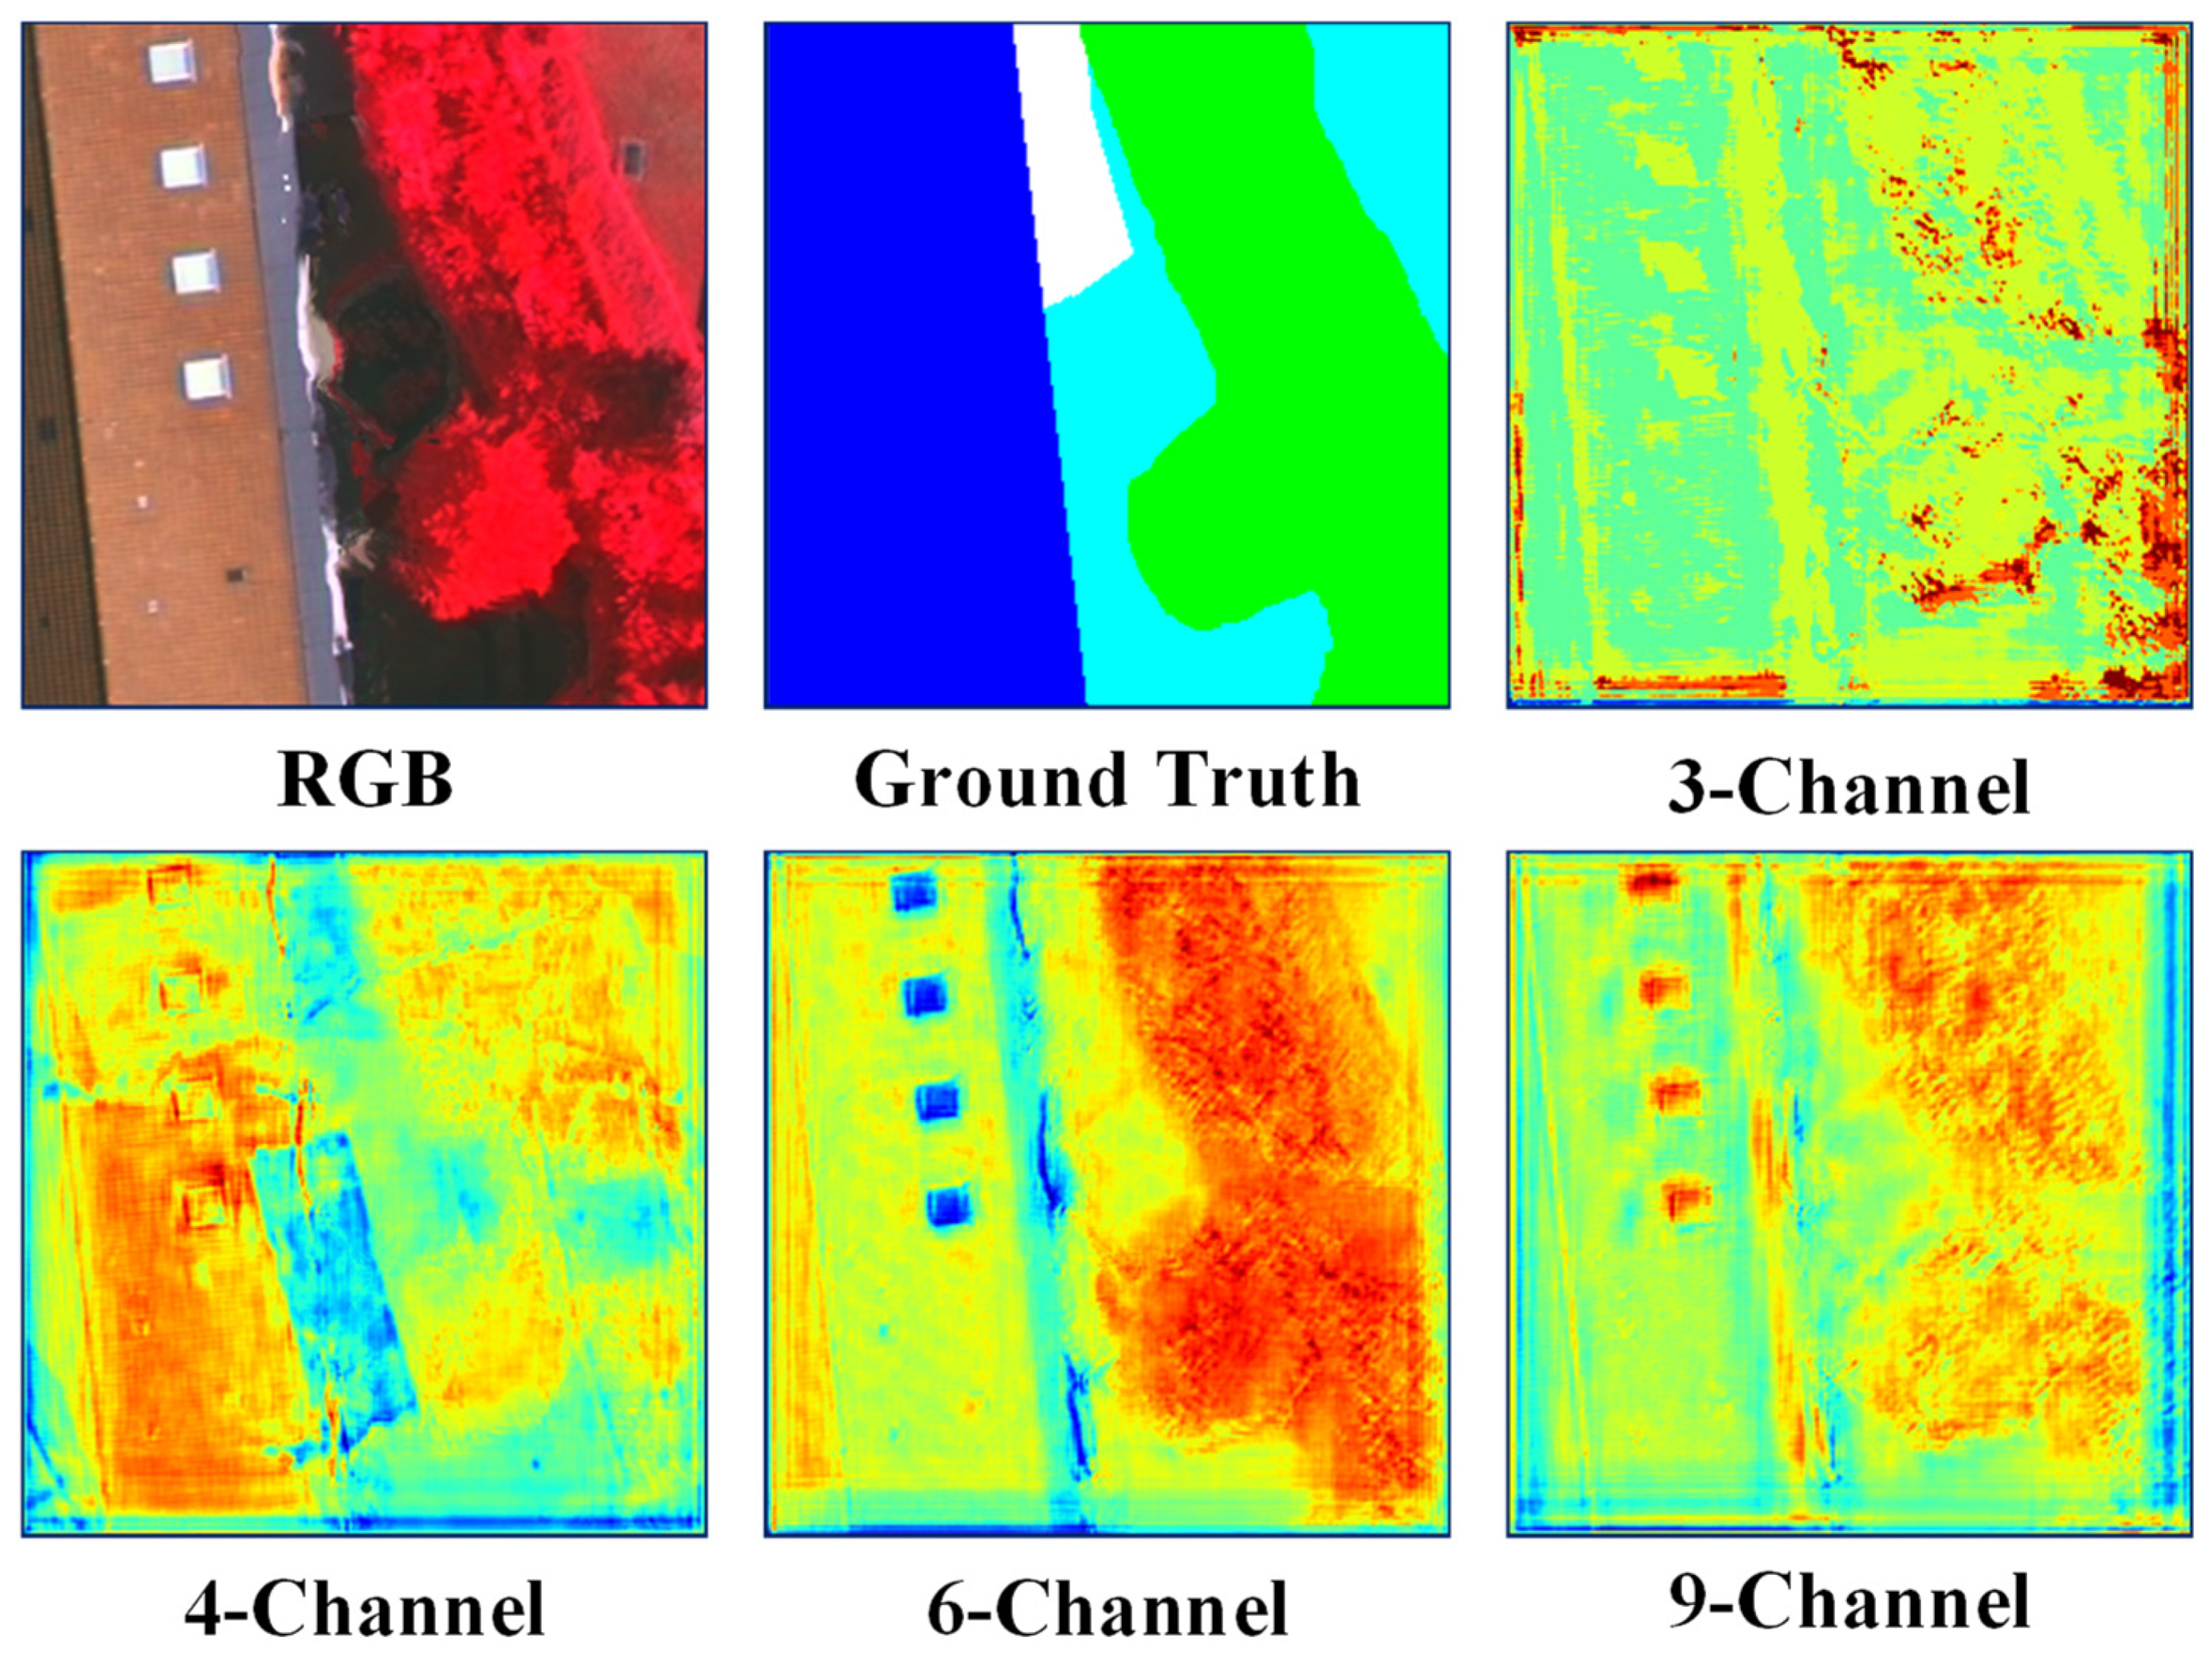
We employed a 6-channel approach as the principal method due to its superior performance compared to the alternatives. Figure 4 illustrates the belief maps for the 3-Channel, 4-Channel, 6-Channel, and 9-Channel methods. It is obvious that the 6-Channel method can get the position of the object more accurately.
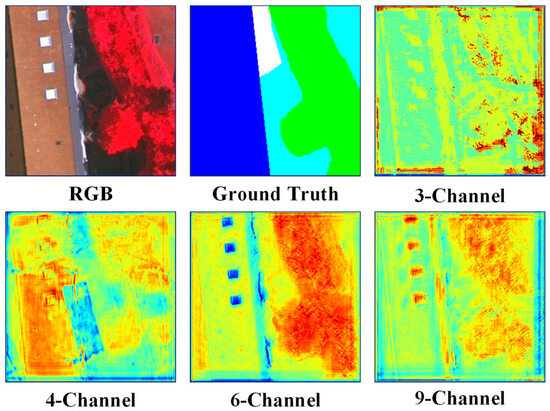
Figure 4.
3-Channel, 4-Channel, 6-Channel, and 9-Channel belief map (output of softmax function) obtained using HAE-RNet.
4. Experimental Datasets and Setting
4.1. Multispectral Remote Sensing Image Datasets
To verify the effectiveness of the proposed HAE-RNet, we selected two publicly available multispectral remote sensing image datasets, including WHU GID [48] and ISPRS Vaihingen [49].
The WHU GID dataset is a large-scale high-resolution land cover dataset based on China’s Gao fen-2 satellite imagery. It comprises 150 pixel-level annotated images with five land cover categories: buildings, farmland, forest, grassland, and water. Red is built-up, green is farmland, cyan is forests, yellow is meadows, and blue is water. The image size is 6800 × 7200, and each image consists of four bands (i.e., blue, green, red, and near-infrared bands).
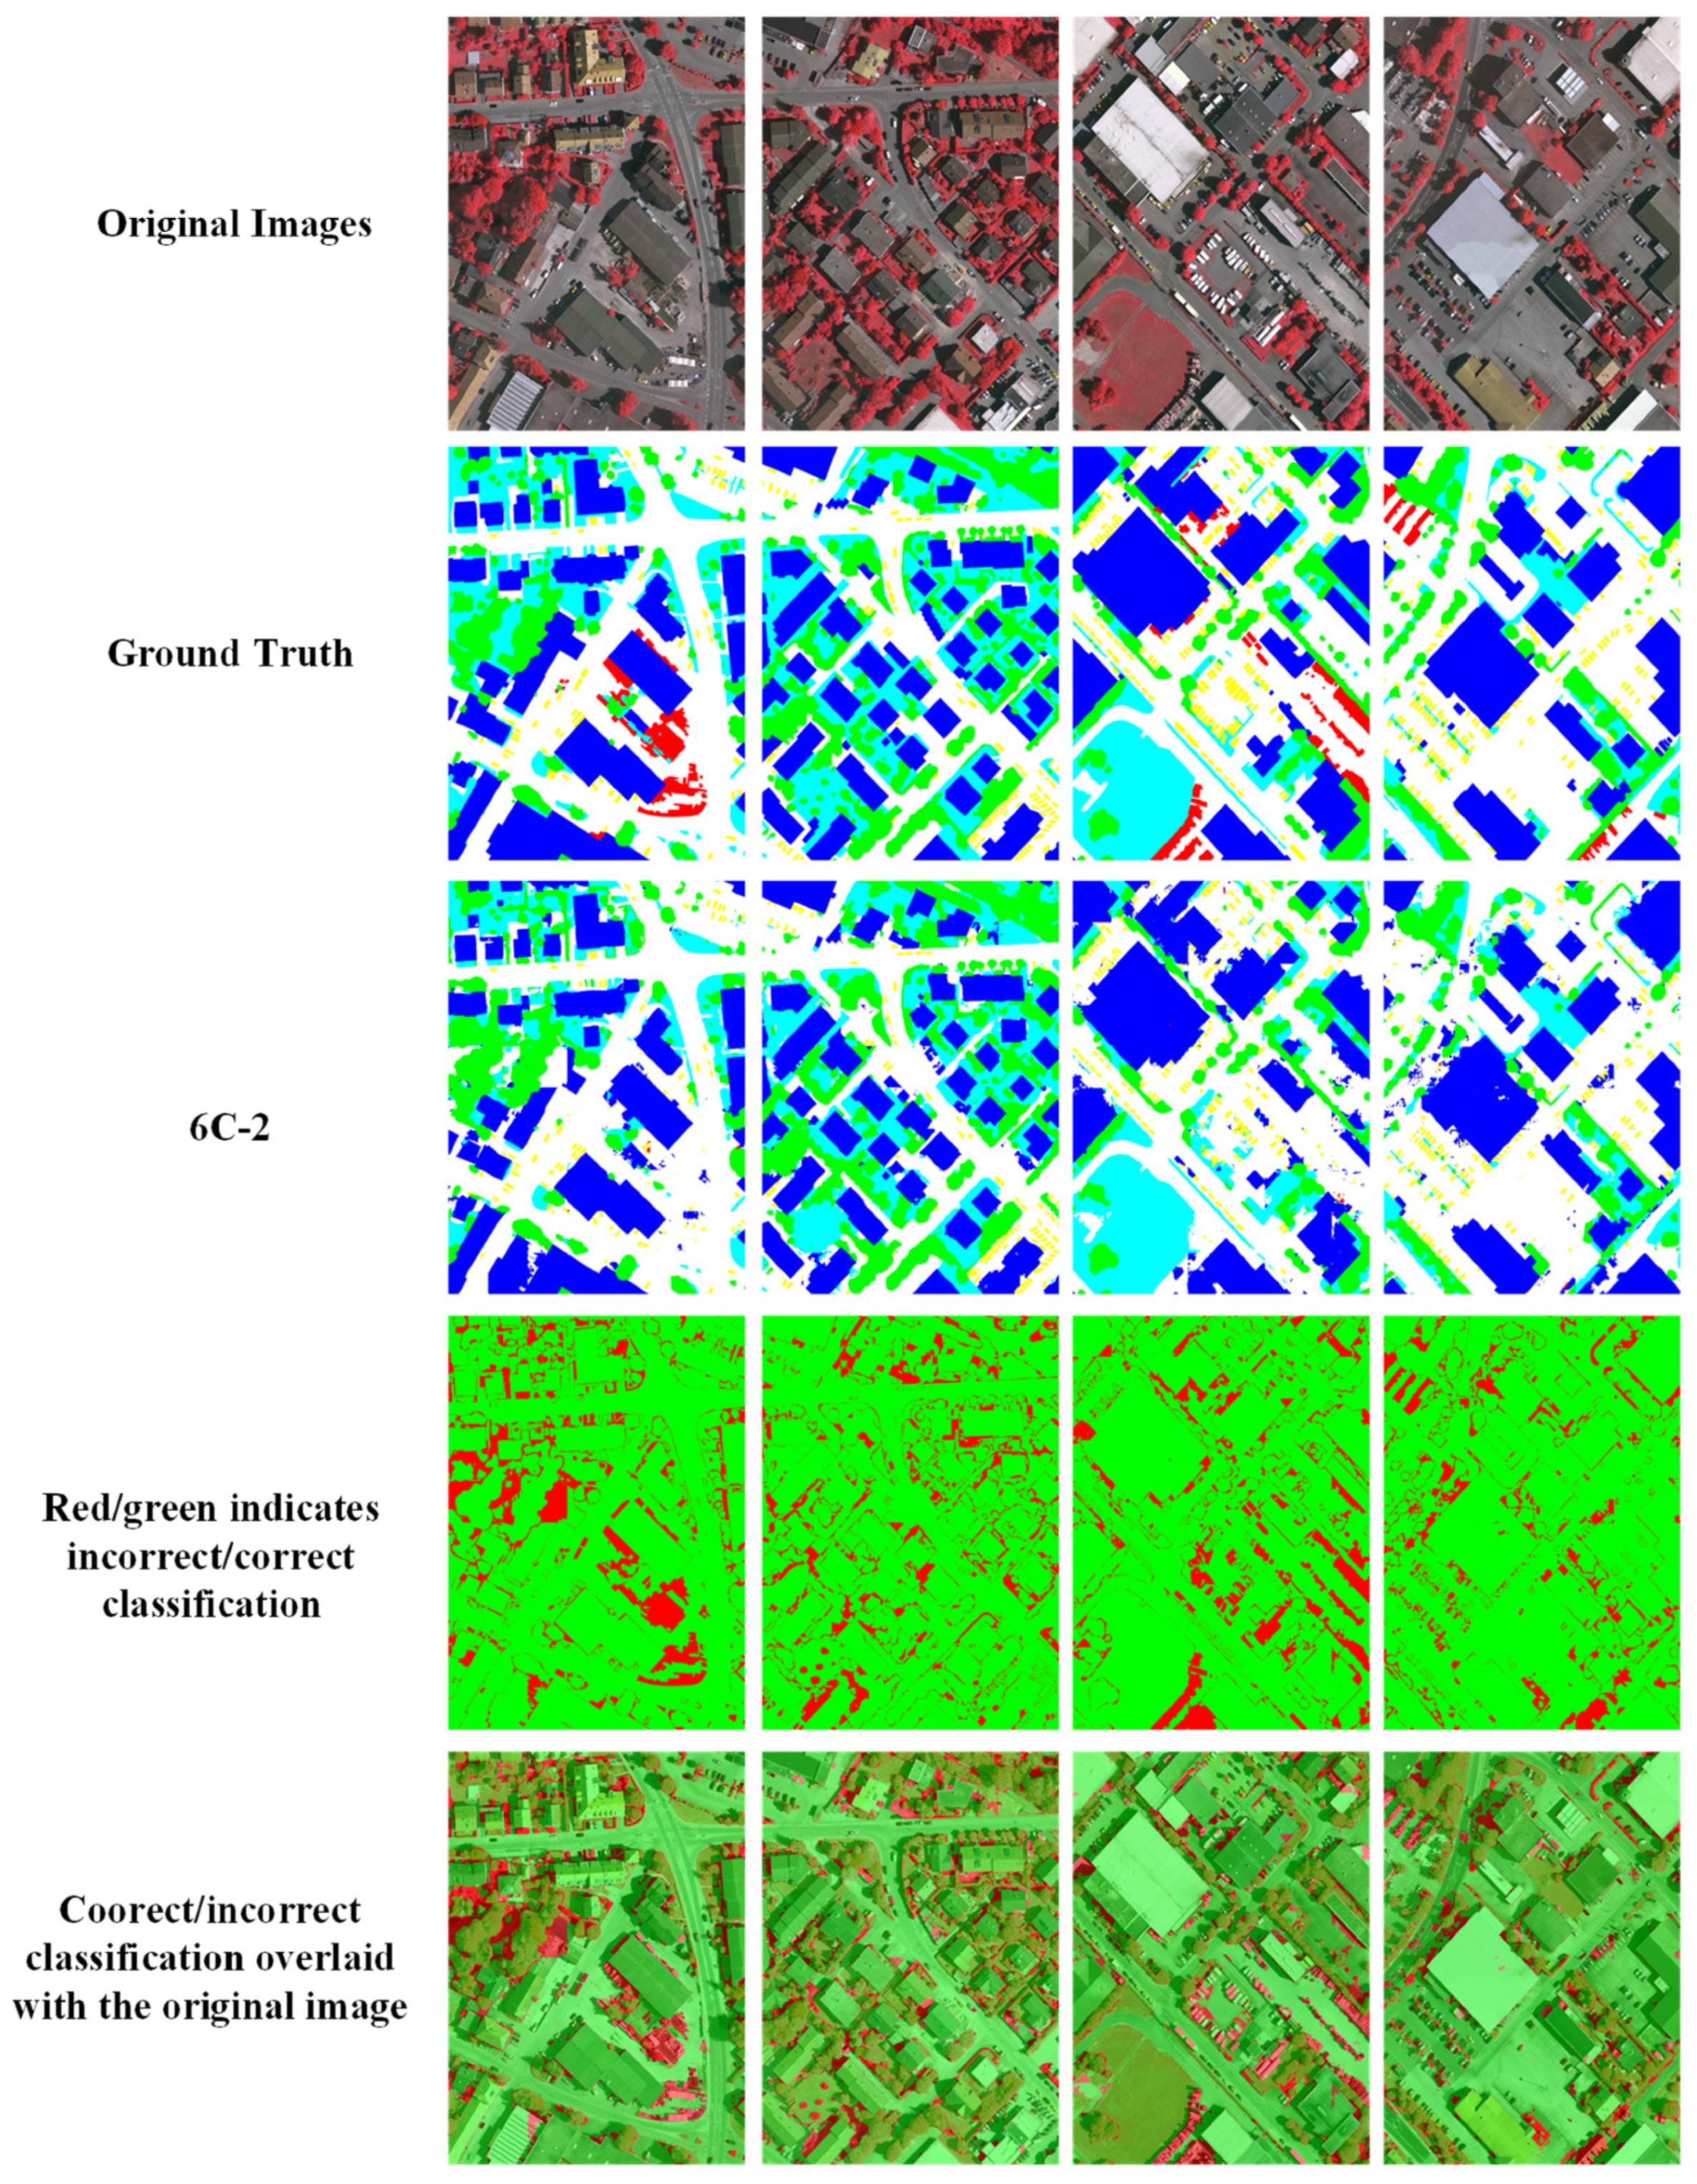
The ISPRS Vaihingen dataset includes three spectral bands (i.e., red, green, and near-infrared bands) as well as DSM (digital surface model) and NDSM (normalized digital surface model) data. The dataset consists of 33 images with an image size of about 2500 × 2000 pixels and a ground sampling distance (GSD) of approximately 9 cm. The Vaihingen dataset includes five categories of buildings, impervious surfaces, trees, low vegetation, and cars. Blue indicates buildings, white indicates impervious surfaces, green indicates trees, cyan indicates low vegetation, and yellow indicates cars.
4.2. Experimental Setting
In this experiment, the DL network was trained using the following hardware and software setup: an 8-core, 16-thread Intel i9-9900K CPU, NVIDIA RTX3090 GPU, and 24 GB of RAM. The software environment consisted of a 64-bit Microsoft Windows 10 operating system, Anaconda 5.2.0, CUDA 11.2, Python 3.8, and the DL software framework TensorFlow 2.5.0.
Xavier initialization was used with random values to initialize the transpose layer. The Adam optimizer with a learning rate of 3.5 × was employed during the experiments. The training process consisted of 350 epochs, and a batch size of 32 was used.
Data augmentation techniques based on geometric methods [50] were applied for addressing. Each batch of images in each iteration obtained a different image sample through augmentation. The augmentation process was performed in two steps. In the first step, cropping, rotation, Gaussian blur, pepper noise, and color enhancement were applied. The images obtained from the first step were further augmented in the second step, which included a horizontal, vertical, and mirror flip. The final training set was obtained after these two augmentation steps.
4.3. Evaluation Metrics for Segmentation
To comprehensively evaluate the performance of the proposed model, several well-known metrics were used, including Overall Accuracy (OA), Precision, Recall, F1 score (F1), Mean Intersection Over Union (mIoU), and Frequency Weighted Intersection over Union (FWIoU) [50], to evaluate the experimental results.
Additionally, four edge evaluation metrics were employed to analyze the quality of the object boundaries. These metrics include the Empirical Evaluation Function of Segmentation (EES) [51], Global Consistency Error (GCE) [52], Variation of Information (VoI) [53], and Probabilistic Rand Index (PRI) [54].
The EES is calculated using the Formula (1). Let = and = be the segmentation test results and the ground-truth data, respectively.
where is the image size, is the number of regions, is the number of regions with areas equal to , and represents the average color error of region . The average color error is the sum of the Euclidean distances between each spectral vector of the pixels in region i and the average vector of region . The EES metric consists of two terms in the sum: the first term is high for nonhomogeneous regions (with high ), and the second term may be high for small regions (as the number of regions with areas of may be large). Therefore, a smaller EES value denotes a better segmentation quality.
The GCE is defined based on the Local Segmentation Error (LSE) as shown in Formula (2). The calculation of the GCE is outlined in Formula (3).
where R denotes the number of elements in the set , and the symbol “\” means the difference set. Each image element in the original image is . The corresponding reference segmentation result is , and the actual segmentation result is and . GCE is a metric that takes values in the range [0, 1], and the smaller its value, the lower the global consistency error.
The VoI is defined in Formula (4). and represent the classic entropy measure associated with Stest and S segmentation results, respectively. denotes the mutual information between these two partitions.
The PRI is calculated using Formula (5). The PRI assesses the consistency of attribute co-occurrence between the actual segmentation results (test) and the ground-truth data.
For any pair of image elements (, ), let their labels in the original image be (, ), and their labels in the segmented image be (, ). A higher value indicates better attribute co-occurrence consistency between the segmentation result and the reference. The PRI value ranges from 0 to 1.
The VoI and PRI values reflect the similarity with the reference segmentation results. Higher VoI and PRI values indicate higher similarity. EES and GCE represent error values concerning the reference. Smaller EES and GCE values indicate lower errors compared to the reference.
5. Result and Discussion
In this section, we showcase the performance of the proposed method, utilize the GID and ISPRS Vaihingen datasets, and analyze their efficacy. We begin by comparing the performance of different channels in Section 5.1. Then, in Section 5.2, we evaluate the model’s performance on the GID and ISPRS Vaihingen datasets, highlighting the performance of HAE-RNet. In Section 5.3, we demonstrate the efficiency of our model for multispectral remote sensing images by comparing it with results obtained from other classical networks. Finally, we analyze and compare our network’s results with those of other state-of-the-art networks.
5.1. The Importance of Augmenting the Input with Spectral Indices
In this section, we adopted the HAE-RNet network uniformly and tested the influence of different band combinations on the two datasets. The details of the combinations and their abbreviations can be found in Table 1.
As shown in Table 2, the combination of multiple bands significantly positively affects the semantic segmentation of the GID dataset. The best segmentation results were obtained with 6C-2 (NIR-NDWI-GNDVI-R-G-B) among the different combinations. Similarly, Table 3 shows that the 6C-2 combination outperforms others on the Vaihingen dataset. Comparing 6C-2 with 9C, we observe improvements of 2.95% in OA, 2.38% in Recall, 0.65% in F1, 3.5% in mIoU, and 4.72% in FWIoU.

Table 2.
Evaluation of segmentation results for different band inputs of 3C, 4C, 6C-2, and 9C in the HAE-RNet method on the GID test set.

Table 3.
Evaluation of segmentation results for different band inputs of 3C, 4C, 6C-2, and 9C in the HAE-RNet method on the Vaihingen test set.
After comparing the effectiveness of four channels and nine channels, it was observed that six channels were more effective than nine channels in terms of gain. To understand the reason behind this, we checked multiple band combinations. It was realized that too many channel combinations could lead to information redundancy due to each channel’s varying gain effects. Additionally, a balance between accurate edge localization and spectral features necessitates including sufficient shallow semantic information.
The six bands were combined to further investigate the impact of different vegetation indices on the segmentation results, and their accuracy was analyzed. Table 4 illustrates the accuracy of the forest and water classification under different six-channel combinations. It was found that adding the vegetation index GNDVI (6C-2) led to slightly better accuracy in forest classification compared to the other six-channel combinations. Moreover, the 6C-2 channel combination achieved nearly 6% higher accuracy for water classification than the inferior six-channel combination. These findings highlight the positive influence of using the GNDVI vegetation index (6C-2) on forest classification accuracy, as the vegetation index aids in identifying and distinguishing different land cover types, thereby improving classification precision.

Table 4.
Evaluation of segmentation results for different 6-channel combinations as inputs to the HAE-RNet method on the GID test set.
As shown in Table 5, the vegetation index GNDVI (6C-2) leads to improved accuracy for buildings, impervious surfaces, and trees compared to the other six-channel combinations. Given the established gain effects of the near-infrared and DSM bands, this study separately combines these two bands with other bands. The experimental results reveal that, for the Vaihingen dataset, the combination of GNDVI and DVI data outperforms the combination of NDVI and RVI. However, when classifying low vegetation, the addition of NDVI slightly outperforms the inclusion of GNDVI.

Table 5.
Evaluation of segmentation results for different 6-channel combinations as inputs to the HAE-RNet method on the Vaihingen test set.
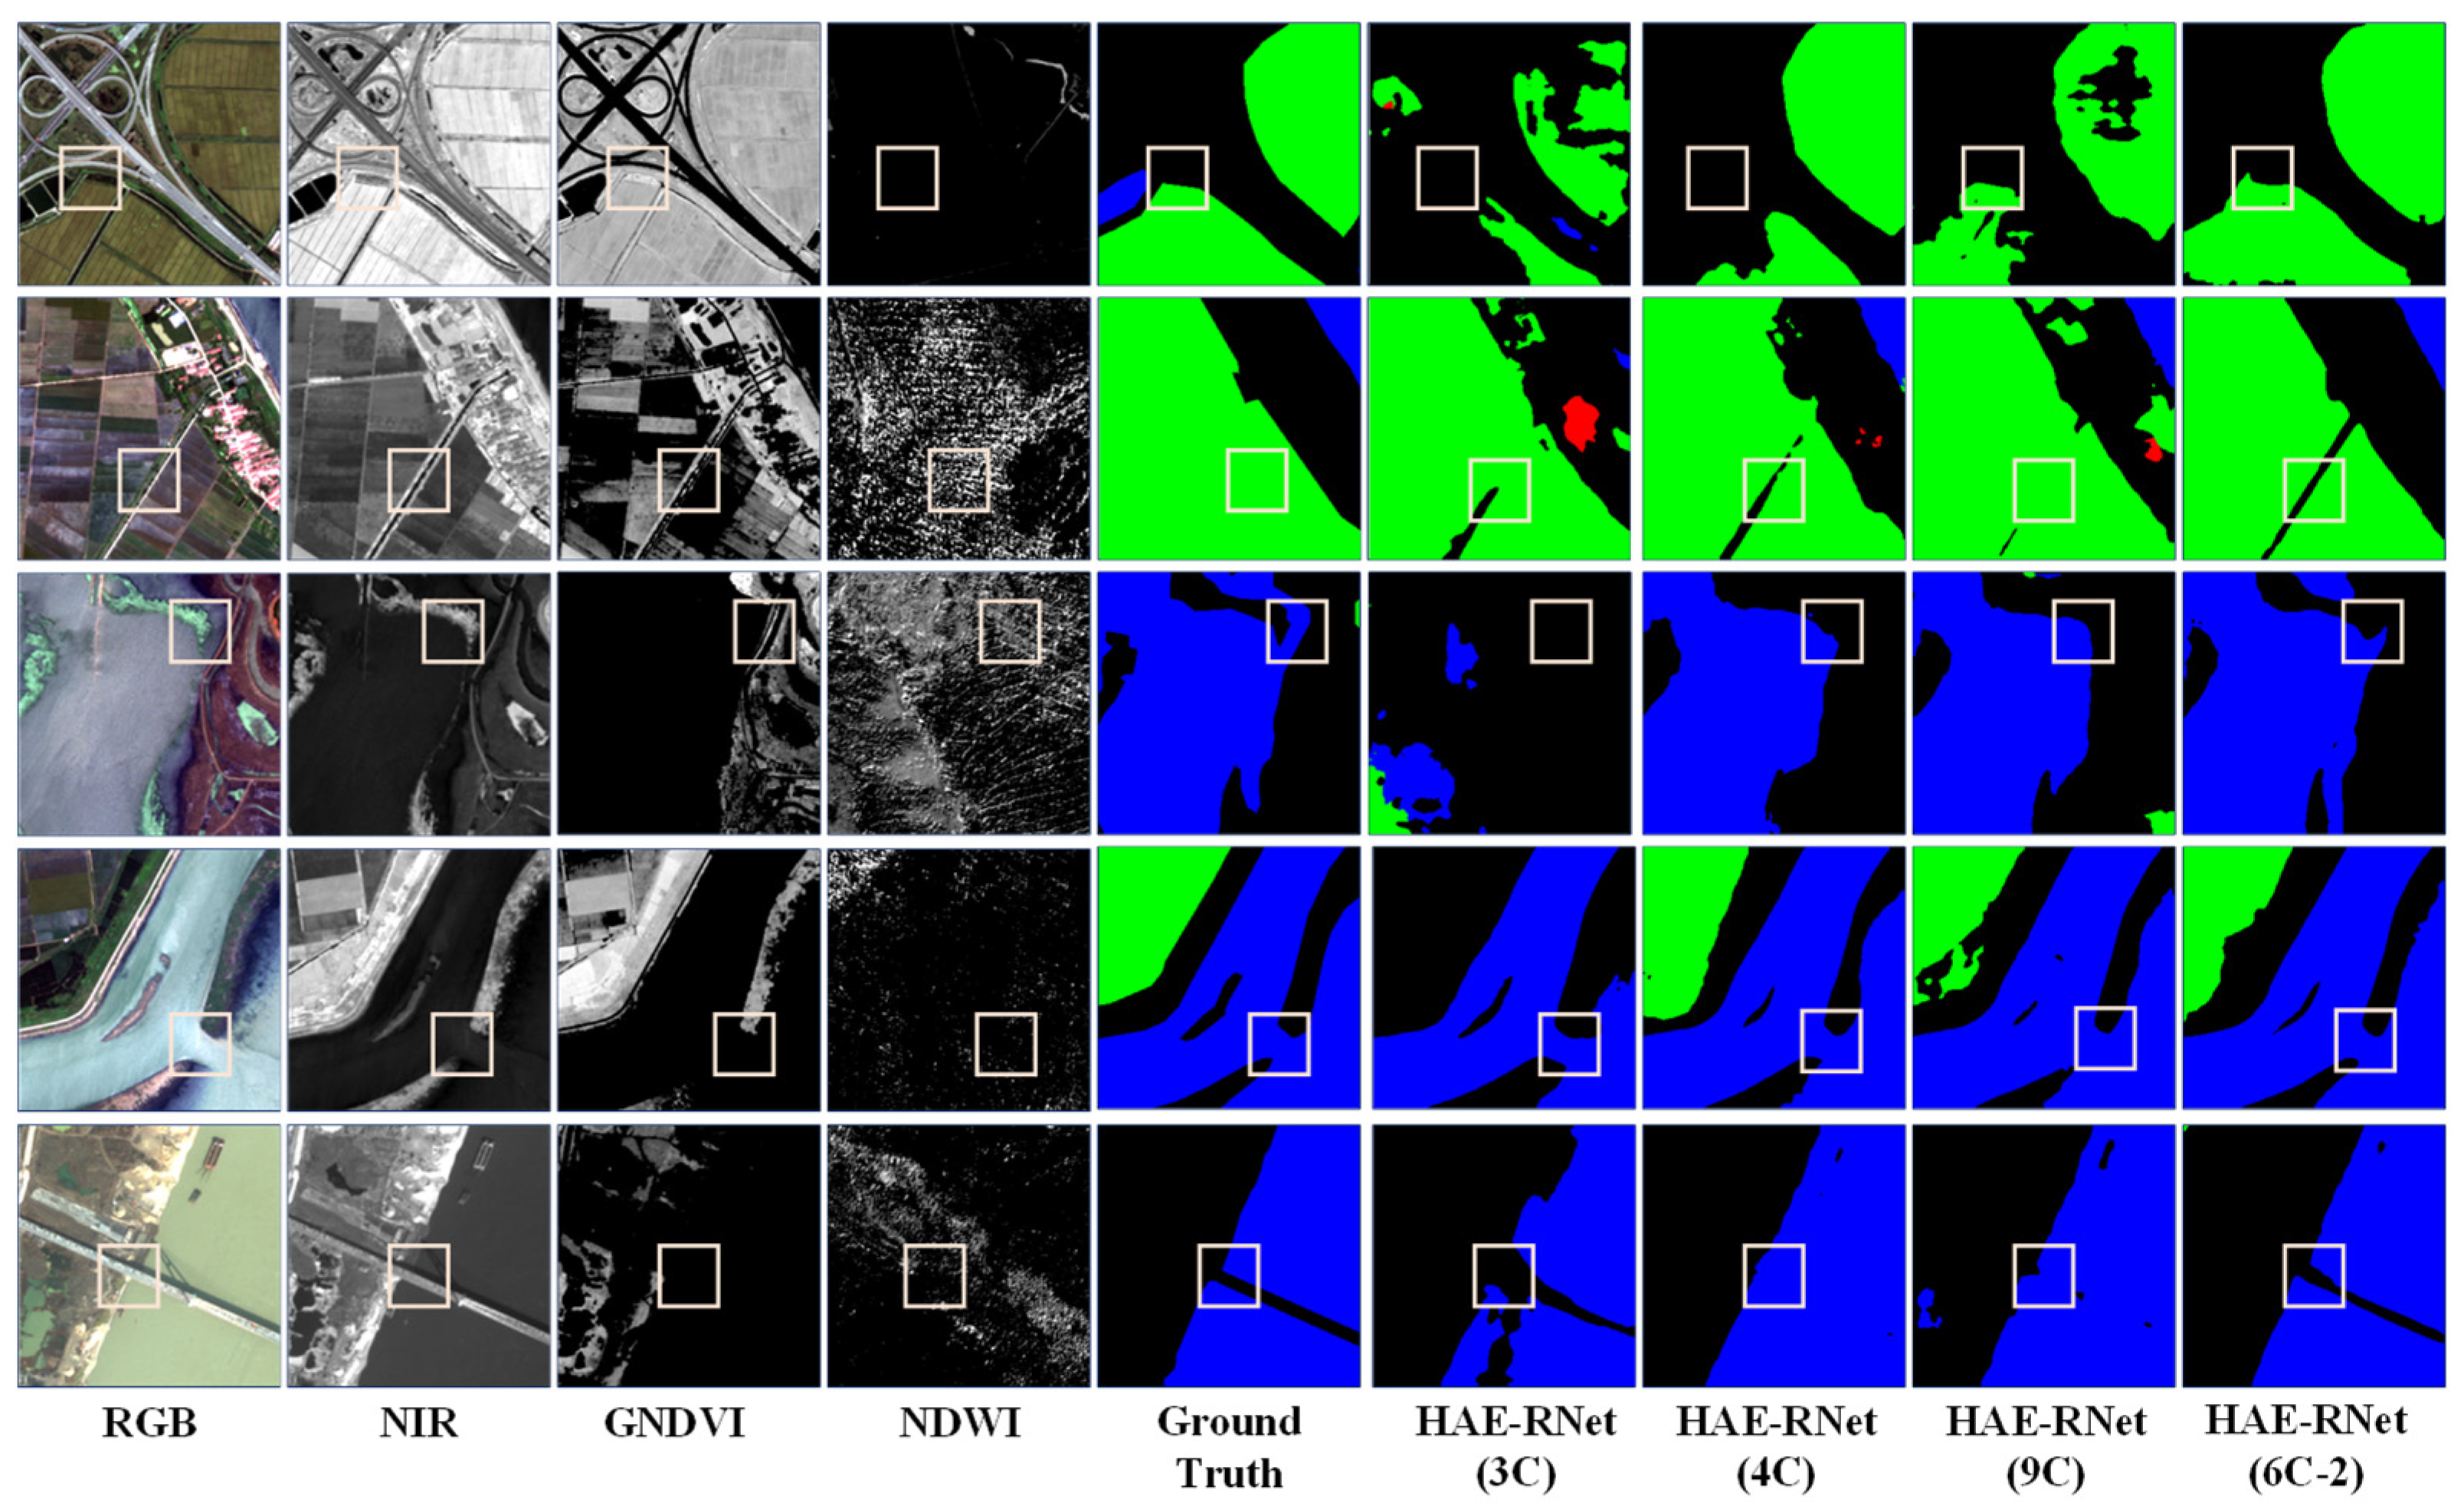
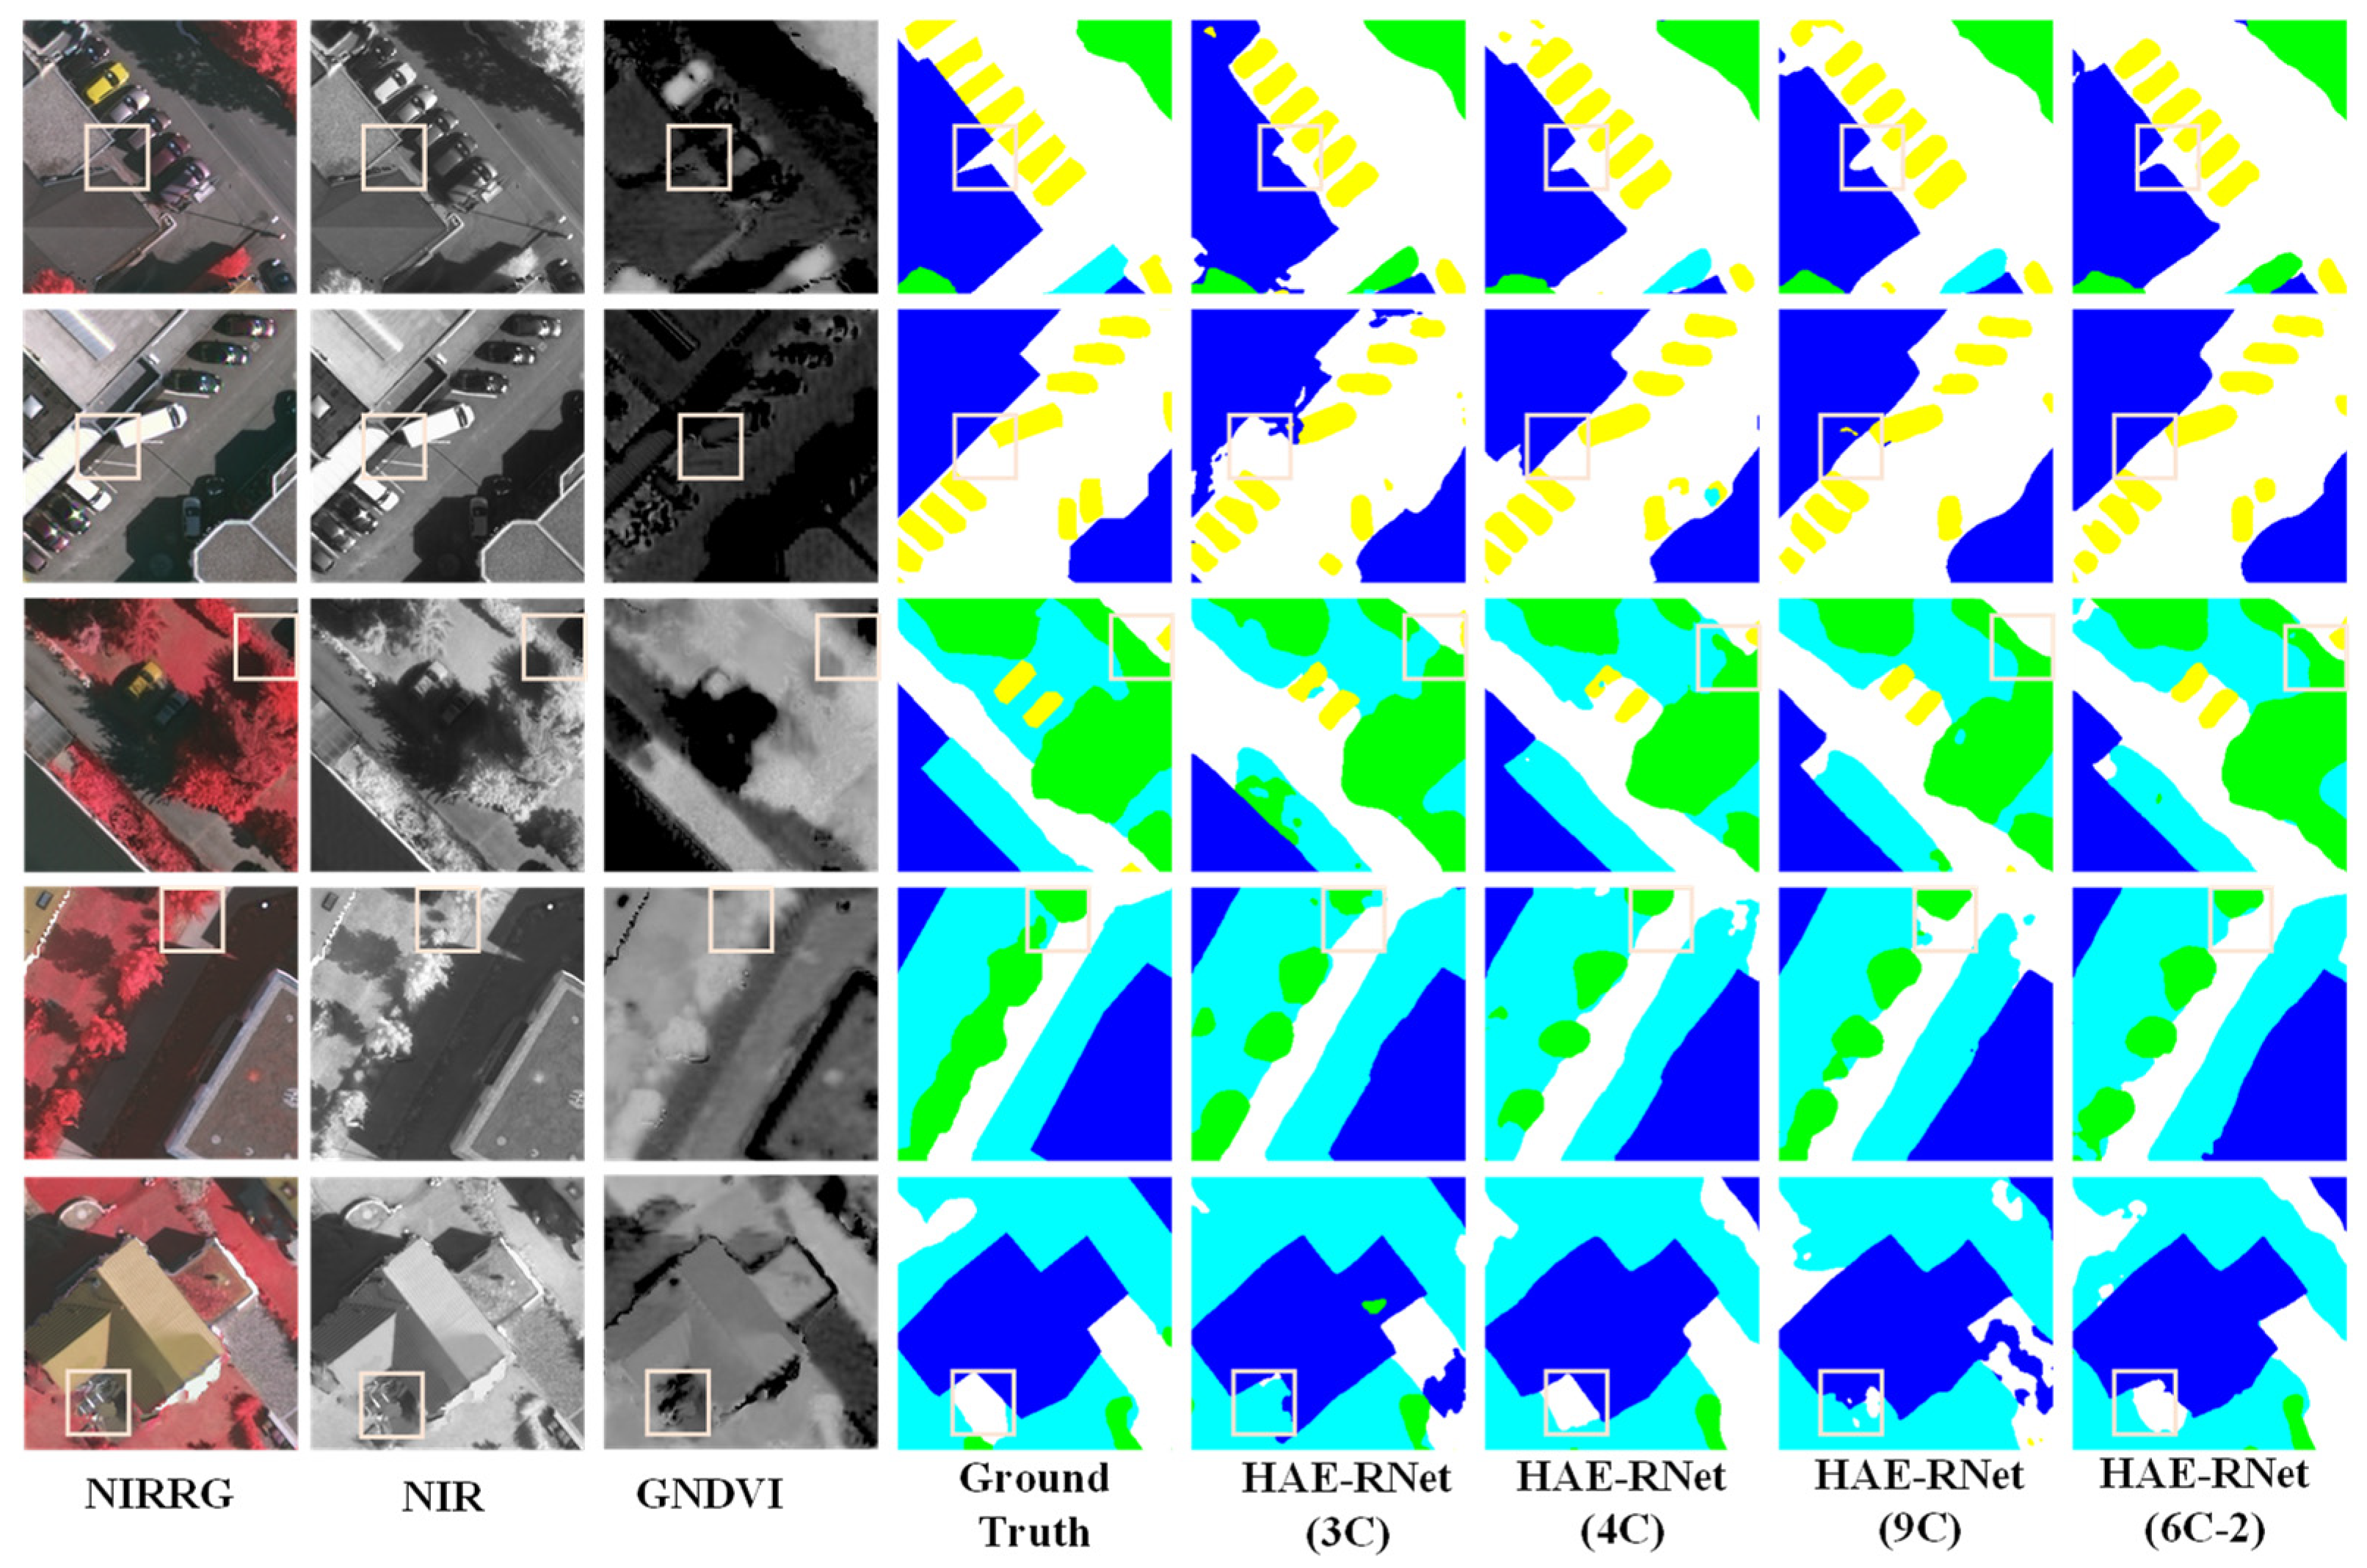
From Figure 5, it is evident that the 3C method exhibits more misclassified categories and rough edges. The 4C method demonstrates better segmentation results than the 3C method, but still needs to improve in classifying water and farmland. The 9C method shows a comparable overall segmentation performance to the 4C method but struggles with accurately identifying farmland. On the other hand, segmentation using the NDWI and GNDVI (6C-2) bands yields excellent results for the water and farmland categories, with precise edge localization. According to Figure 6, the 3C method shows numerous misclassifications and incomplete edge segmentations. Although the 4C method performs better than the 3C method regarding segmentation results, it tends to misclassify low vegetation as impervious surfaces. The 9C method exhibits some noise in the overall segmentation, particularly in edge segmentation, but it generally achieves the correct segmentation of various land covers. However, using the DSM and GNDVI (6C-2) bands for segmentation leads to improved classification results for water and farmland. It correctly classifies various land covers and achieves more accurate car segmentation than other channels, along with precise edge localization.
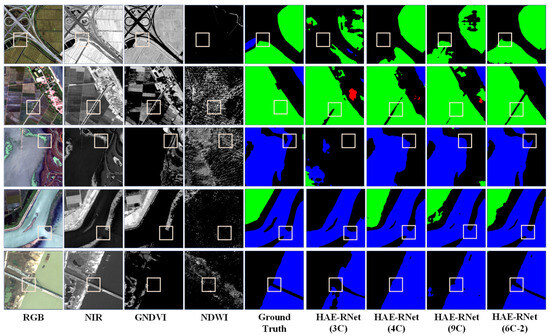
Figure 5.
Comparison of segmentation results of HAE-RNet for four channel combinations of 3C, 4C, 6C-2, and 9C on the GID test set.
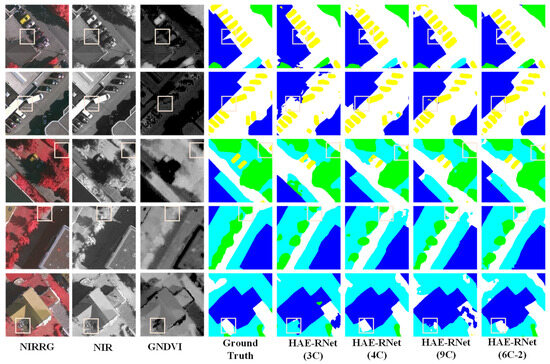
Figure 6.
Comparison of segmentation results of HAE-RNet for four channel combinations of 3C, 4C, 6C-2, and 9C on the Vaihingen test set.
5.2. HAE-RNet Performance Analysis
5.2.1. Edge Quality of Segmentation Results
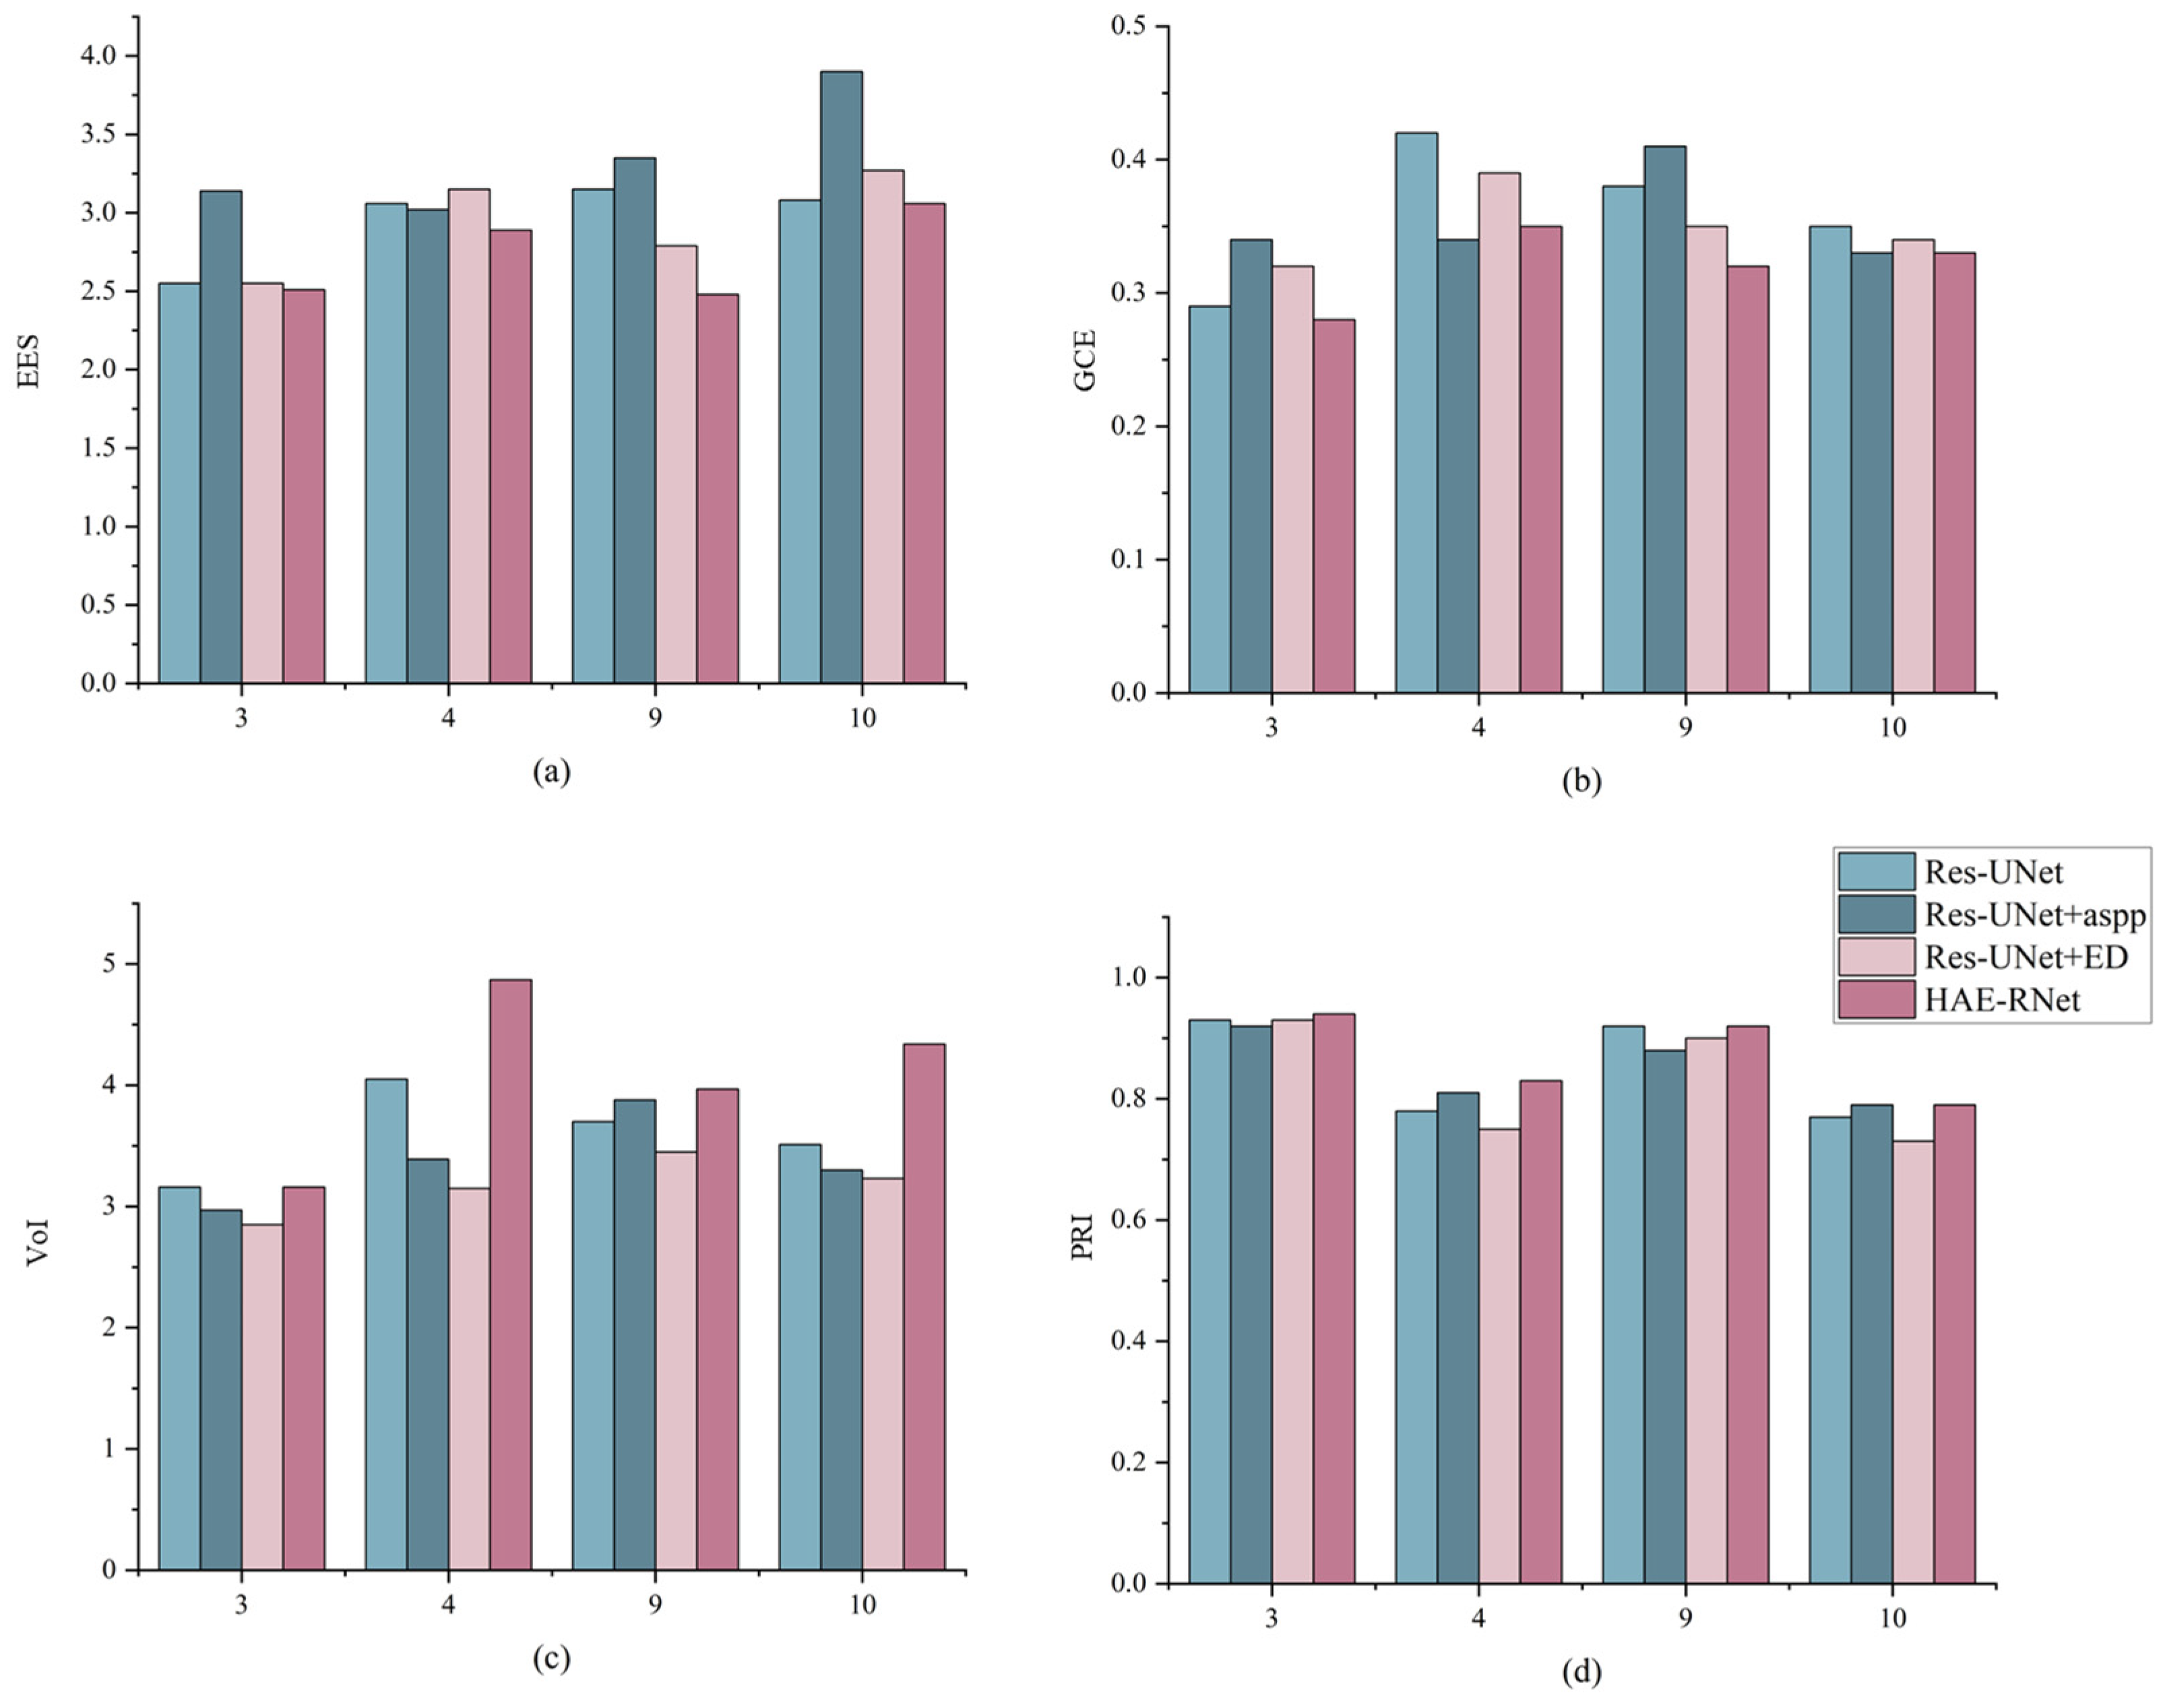
In this section, we analyze the segmentation results from the perspective of edge details. Figure 7 compares the edge segmentation results of Res-UNet, Res-UNet+aspp, Res-UNet+ED, and HAE-RNet, and the ground truth on four GID test sets, respectively. As can be seen from the figure, HAE-RNet has lower EES and GCE values and higher PRI and VoI values compared to other networks. These data demonstrated the suitability of the proposed HAE-RNet for multilevel remote sensing images and highlight the performance enhancement obtained by incorporating global edge features. In order to better demonstrate the segmentation performance of our model when multiple categories are present, we use the test set of images shown; 3, 4, 9, and 10 are all uniform for the sample class.
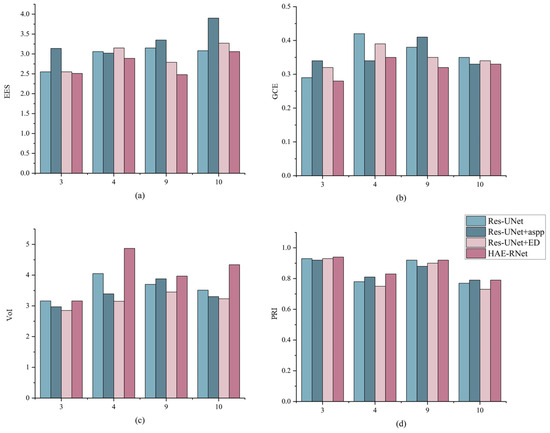
Figure 7.
Comparison of edge segmentation results for Res-UNet, Res-UNet+aspp, Res-UNet+ED, and HAE-RNet and ground truth on four GID test sets where the X-axis represents the serial numbered 3rd, 4th, 9th, and 10th images of the displayed GID test set. (a) is the result of EES values for the four networks, (b) is the result of GCE values for the four networks, (c) is the result of VoI values for the four networks, and (d) is the result of PRI values for the four networks.
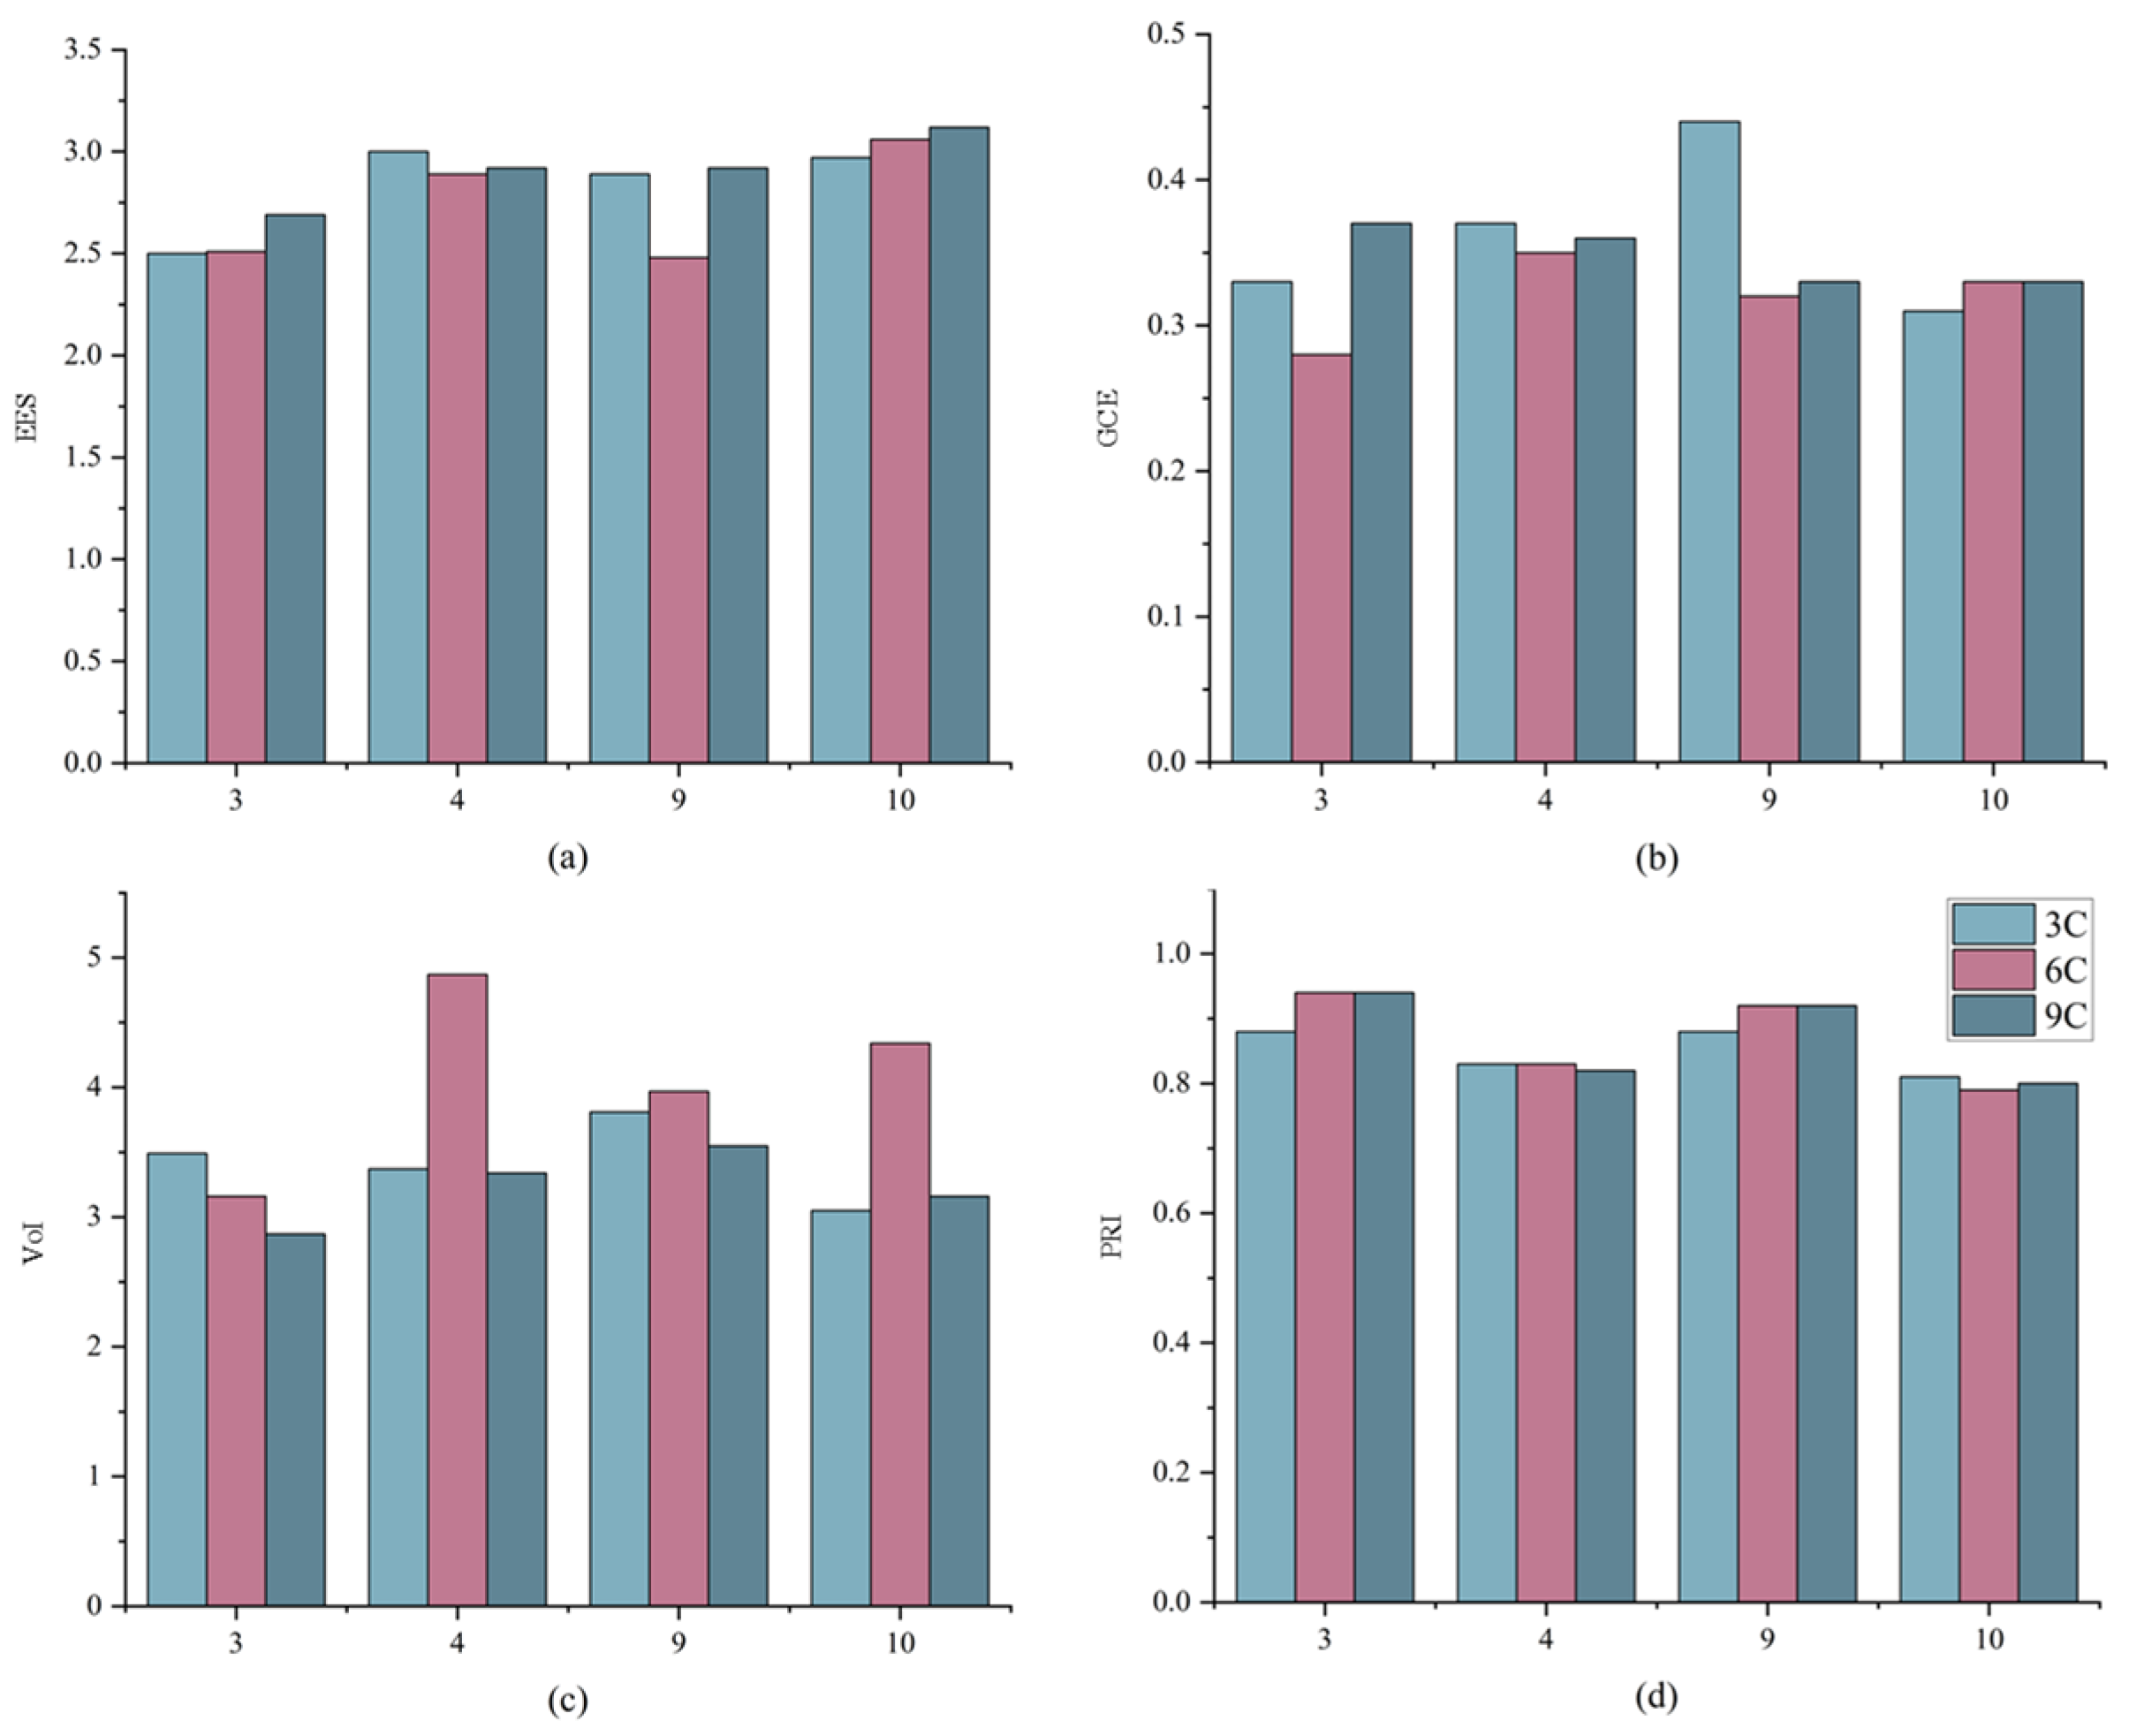
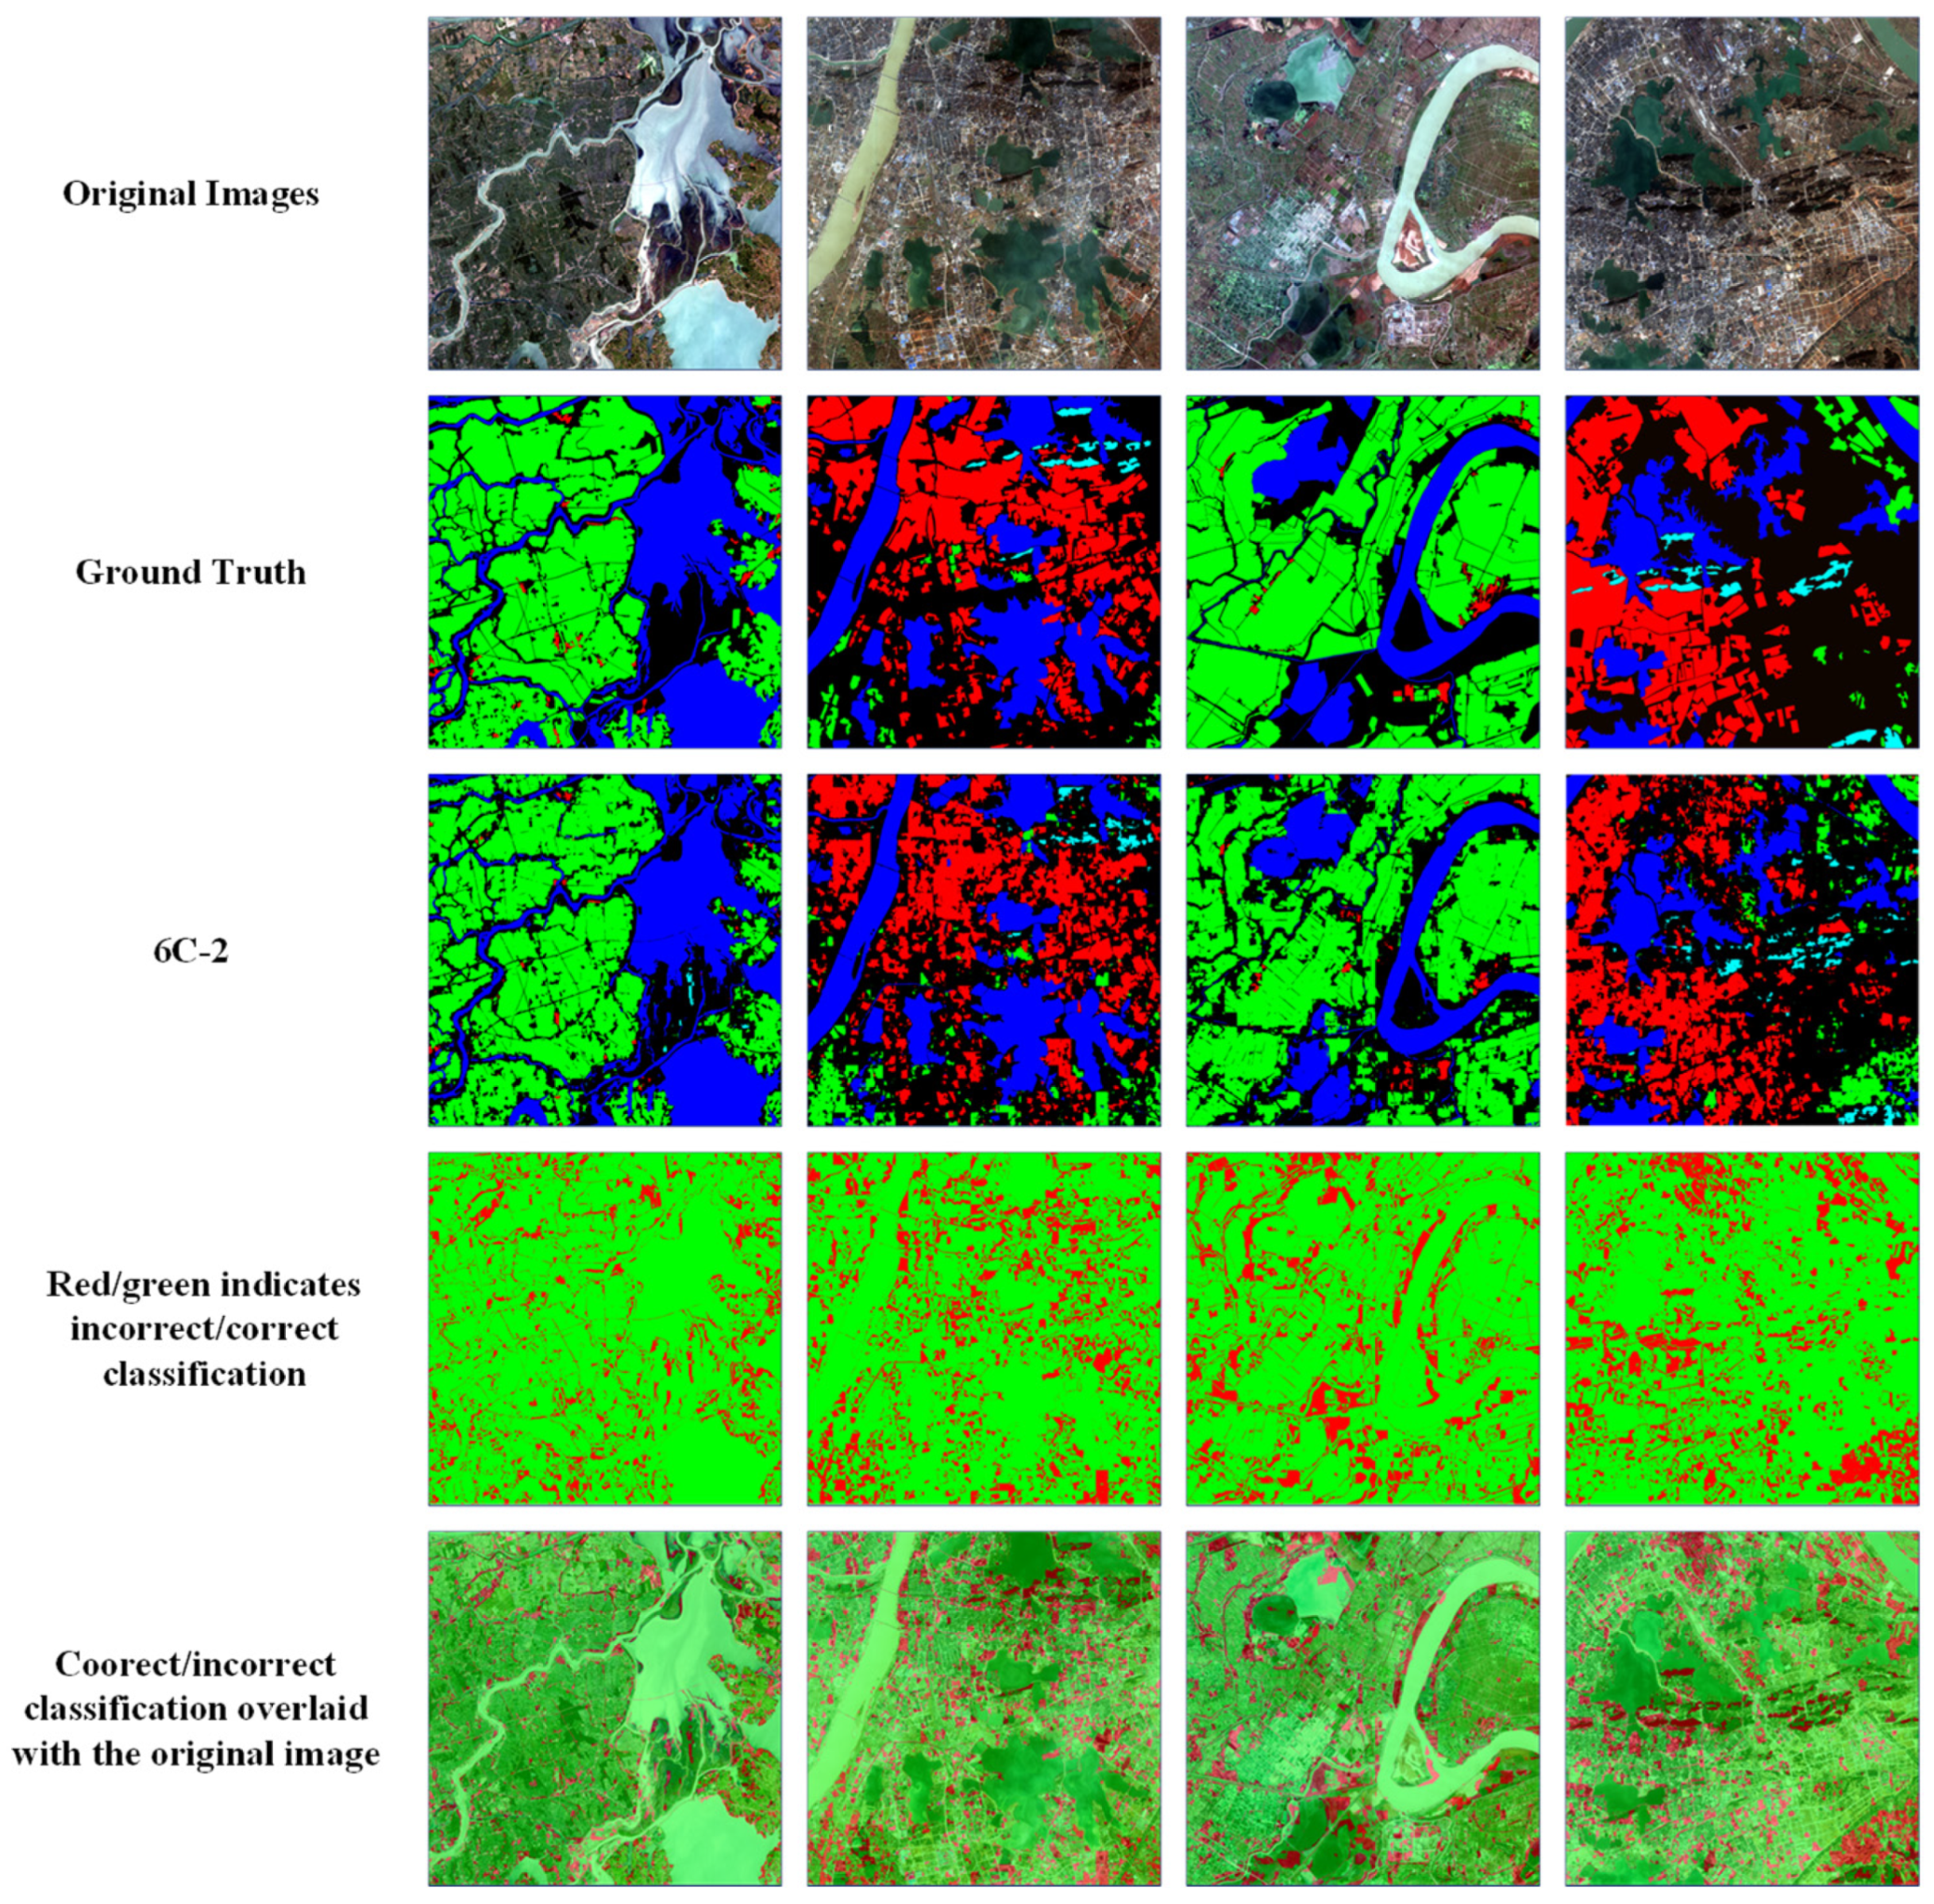
Figure 8 shows the EES, GCE, VoI, and PRI results for the four test sets in the GID dataset using HAE-RNet in different input combinations. The larger the VoI value and PRI value, the better the relative edge effect. From the results, we can see that the vegetation index and water body index we used can locate the edge information better to some extent. In Figure 7 and Figure 8, the larger the VoI value and PRI value, the better the relative edge effect. It can be seen that the VOI value and PRI value are either the highest or the second highest when using HAE-RNet and band combination 6C-2. Whereas due to the fact that the smaller the EES and GCE values, the smaller the edge error, it can be seen that the EES and GCE values are relatively minimized when adopting HAE-RNet and band combination 6C-2. To visualize the overall segmentation ability of the HAE-RNet, this section reassembles the test sets that have been cropped to their complete form for an easy comparison with the Ground Truth. This provides a clearer understanding of the strengths and weaknesses of the HAE-RNet algorithm. The results for the GID test set and the Vaihingen test set are shown in Figure 9 and Figure 10, respectively.
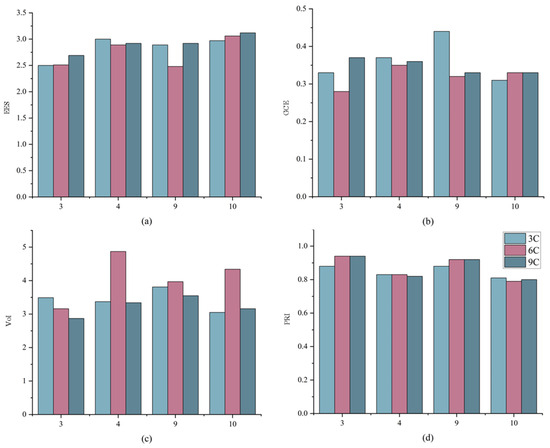
Figure 8.
Comparison of edge segmentation results for 3C, 6C, and 9C and ground truth on four GID test sets where the x-axis represents the ordinal number of the test set. (a) is the result of EES values for the four networks, (b) is the result of GCE values for the four networks, (c) is the result of VoI values for the four networks, and (d) is the result of PRI values for the four networks.
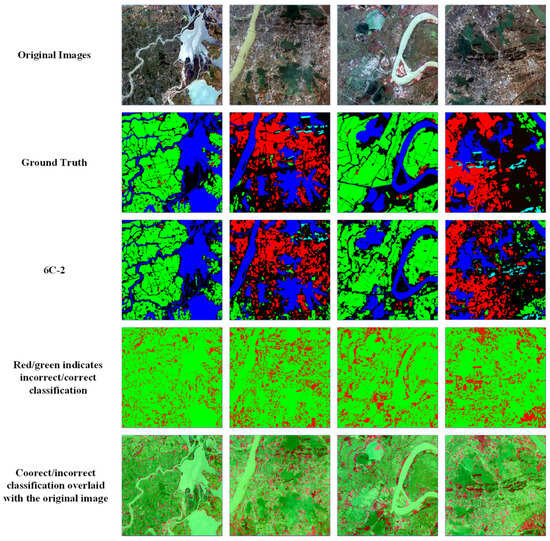
Figure 9.
Comparison of ground truth and HAE-RNet segmentation results on the GID test set. The first row is the original RGB images. The second row is the ground truth. The third is our segmentation results. The fourth row, the red/green image, is where green and red indicate correct and misclassification pixels, and the fifth row, the red/green image, is overlayed on the original images, respectively.
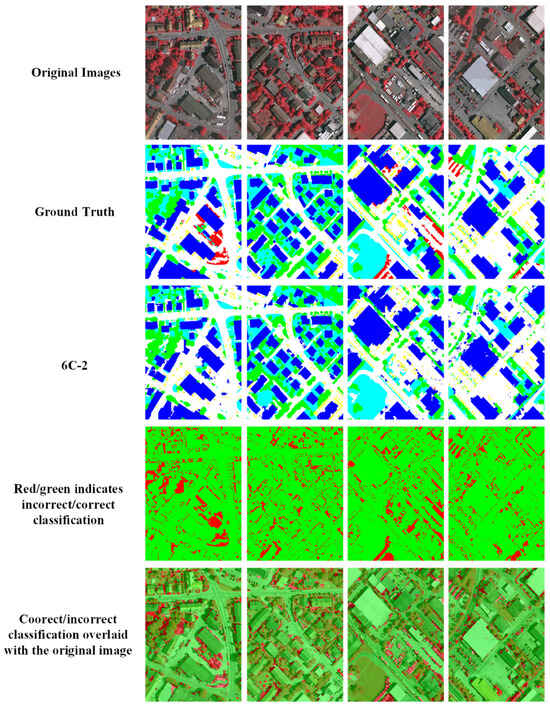
Figure 10.
Comparison of ground truth and HAE-RNet segmentation results on the Vaihingen test set. The first row is the original RGB images. The second row is the ground truth. The third is our segmentation results. The fourth row, the red/green image, is where green and red indicate correct and misclassification pixels, and the fifth row, the red/green image, is overlayed on the original images, respectively.
5.2.2. Ablation Study on the Network Architecture
Ablation experiments were conducted on the ED branch with the ECA attention mechanism and the ASPP module. The baseline model chosen for these experiments was the ResUNet, which has an encoder–decoder structure. The experiments were executed with identical settings, utilizing the GID and Vaihingen datasets to assess the significance of these two modules. Referring to the evaluation metrics in Table 6 and Table 7, incorporating the ASPP module and ED branch is determined to supply more comprehensive and rich contextual information to the semantic segmentation network. In the ablation experiments in Table 6 and Table 7, the Baseline represents the original neural network, ResUNet. ASPP represents the result after the bridge in the middle of ResUNet is replaced with the ASPP structure and ED represents our proposed edge detection approach based on the ResUNet network.

Table 6.
Evaluation of the results of the HAE-RNet ablation experiment on the GID test set.

Table 7.
Evaluation of the results of the HAE-RNet ablation experiment on the Vaihingen test set.
5.3. Comparison with Other Models
To validate the feasibility of the HAE-RNet model, we compared it not only with four classical semantic segmentation models, VGG-16, ResNet-50, U-Net, and ResUNet, but also with advanced results from other researchers.
5.3.1. Comparison with Classic Models
HAE-RNet exhibits superiority on the GID dataset, achieving the highest accuracy in all categories, with slight exceptions in farmland and clusters of buildings where other networks perform marginally better, as detailed in Table 8. HAE-RNet achieves an impressive mIoU of 96.72%, surpassing the classic semantic segmentation model VGG-16 by 3.45%. Specifically, as shown in Table 9, compared to VGG-16, it improves the segmentation accuracy by 5.51% for buildings, 3.58% for impervious surfaces, and 4.57% for trees. The overall accuracy (OA) of the HAE-RNet algorithm reaches a remarkable 89.59%, representing a significant improvement of 9.75% over the U-Net network. This exceptional performance is attributed to our use of 6C-2, which has been proven experimentally to perform best among all six channels.

Table 8.
Evaluation of segmentation results for VGG-16, ResNet-50, U-Net, Res-UNet, and HAE-RNet as input 6C-2 band on the GID test set.

Table 9.
Evaluation of segmentation results for VGG-16, ResNet-50, U-Net, Res-UNet, and HAE-RNet as input 6C-2 band on the Vaihingen test set.
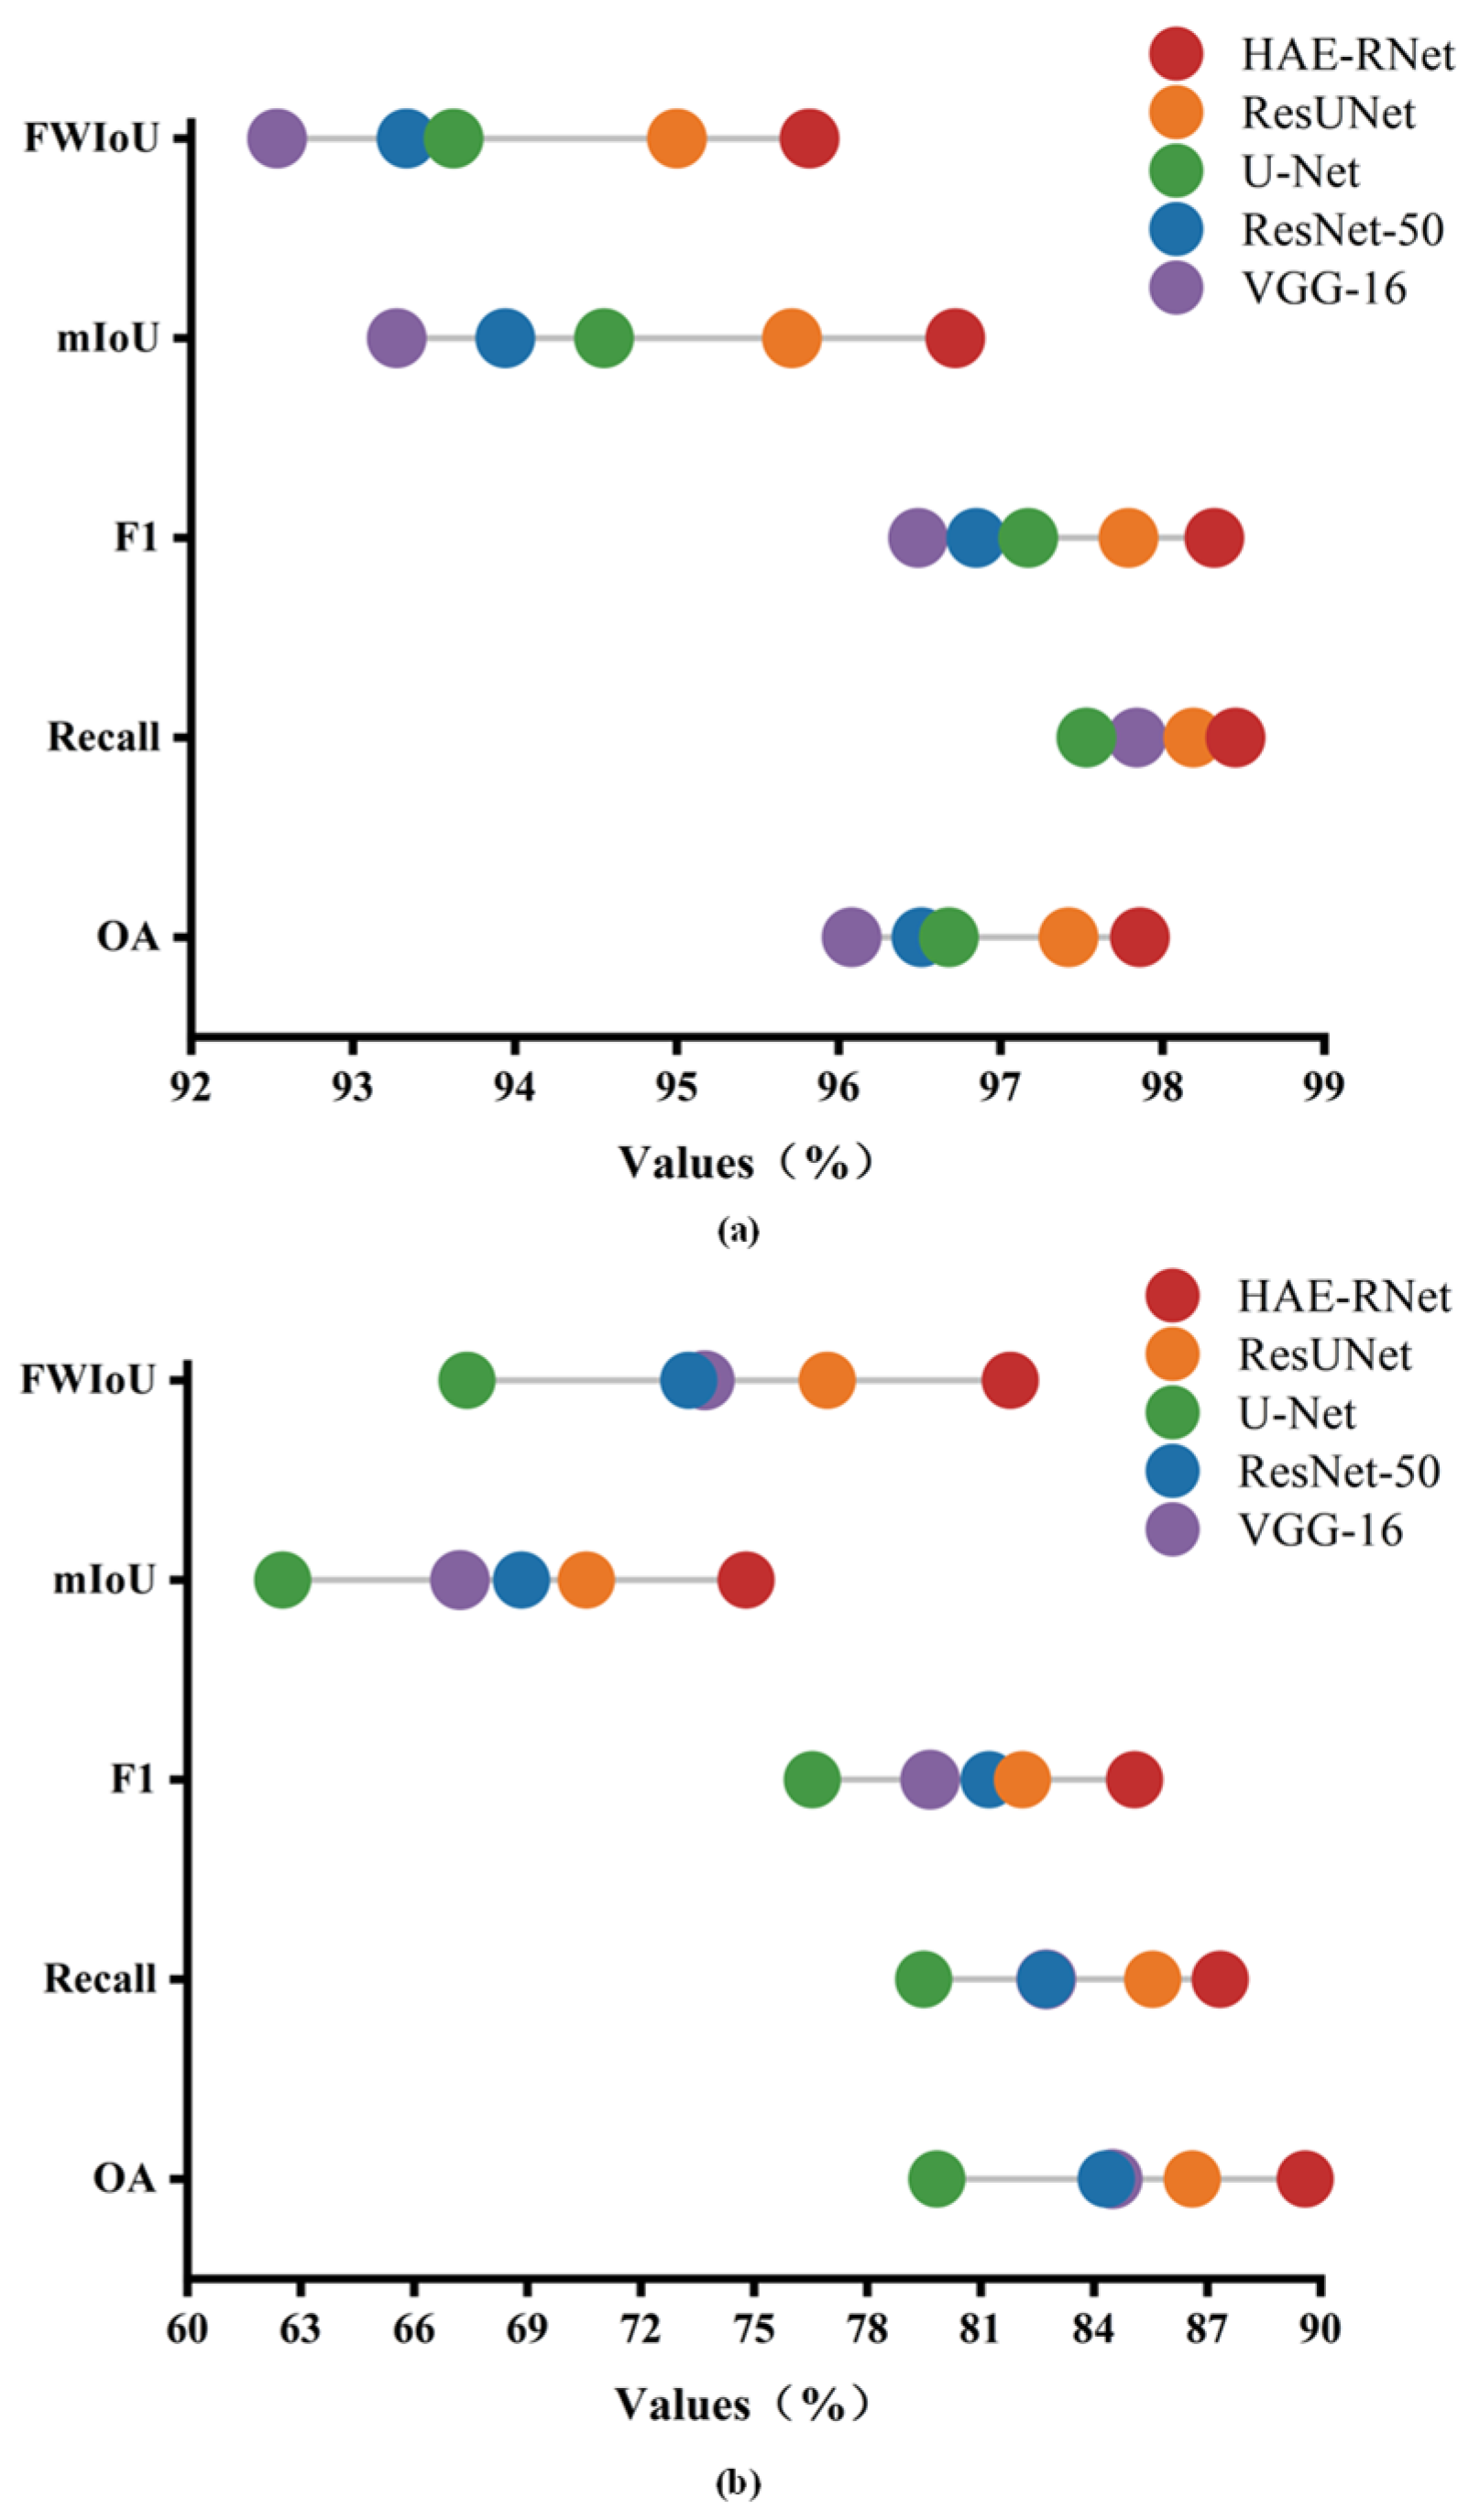
To provide a clearer and more intuitive comparison of HAE-RNet with four classic semantic segmentation algorithms (VGG-16, ResNet-50, U-Net, and Res-UNet) in terms of accuracy on the GID and Vaihingen datasets, Figure 10 displays the performance differences of the five algorithms based on the overall accuracy (OA), Recall, F1 score, mean intersection over union (mIoU), and frequency weighted intersection over union (FWIoU) on the GID and Vaihingen datasets, respectively.
As can be seen from Figure 11, HAE-RNet demonstrates the best performance on both the GID and Vaihingen datasets. The VGG-16 algorithm shows poor segmentation accuracy on the GID dataset, while the U-Net algorithm exhibits inferior segmentation results on the Vaihingen dataset.
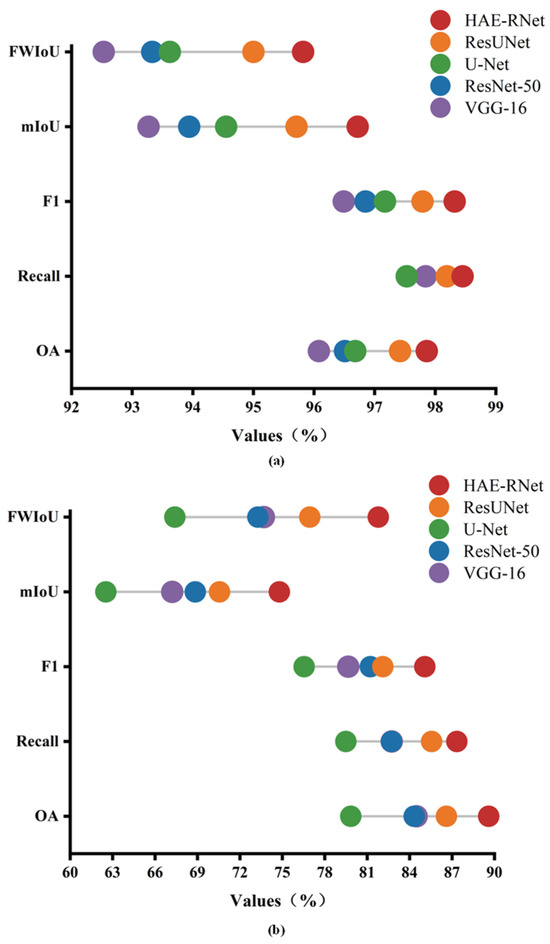
Figure 11.
OA, Recall, F1, mIoU, and FWIoU plots for VGG-16, ResNet-50, U-Net, Res-UNet, and HAE-RNet; (a) is the results on the GID test set, and (b) is the results on the Vaihingen test set.
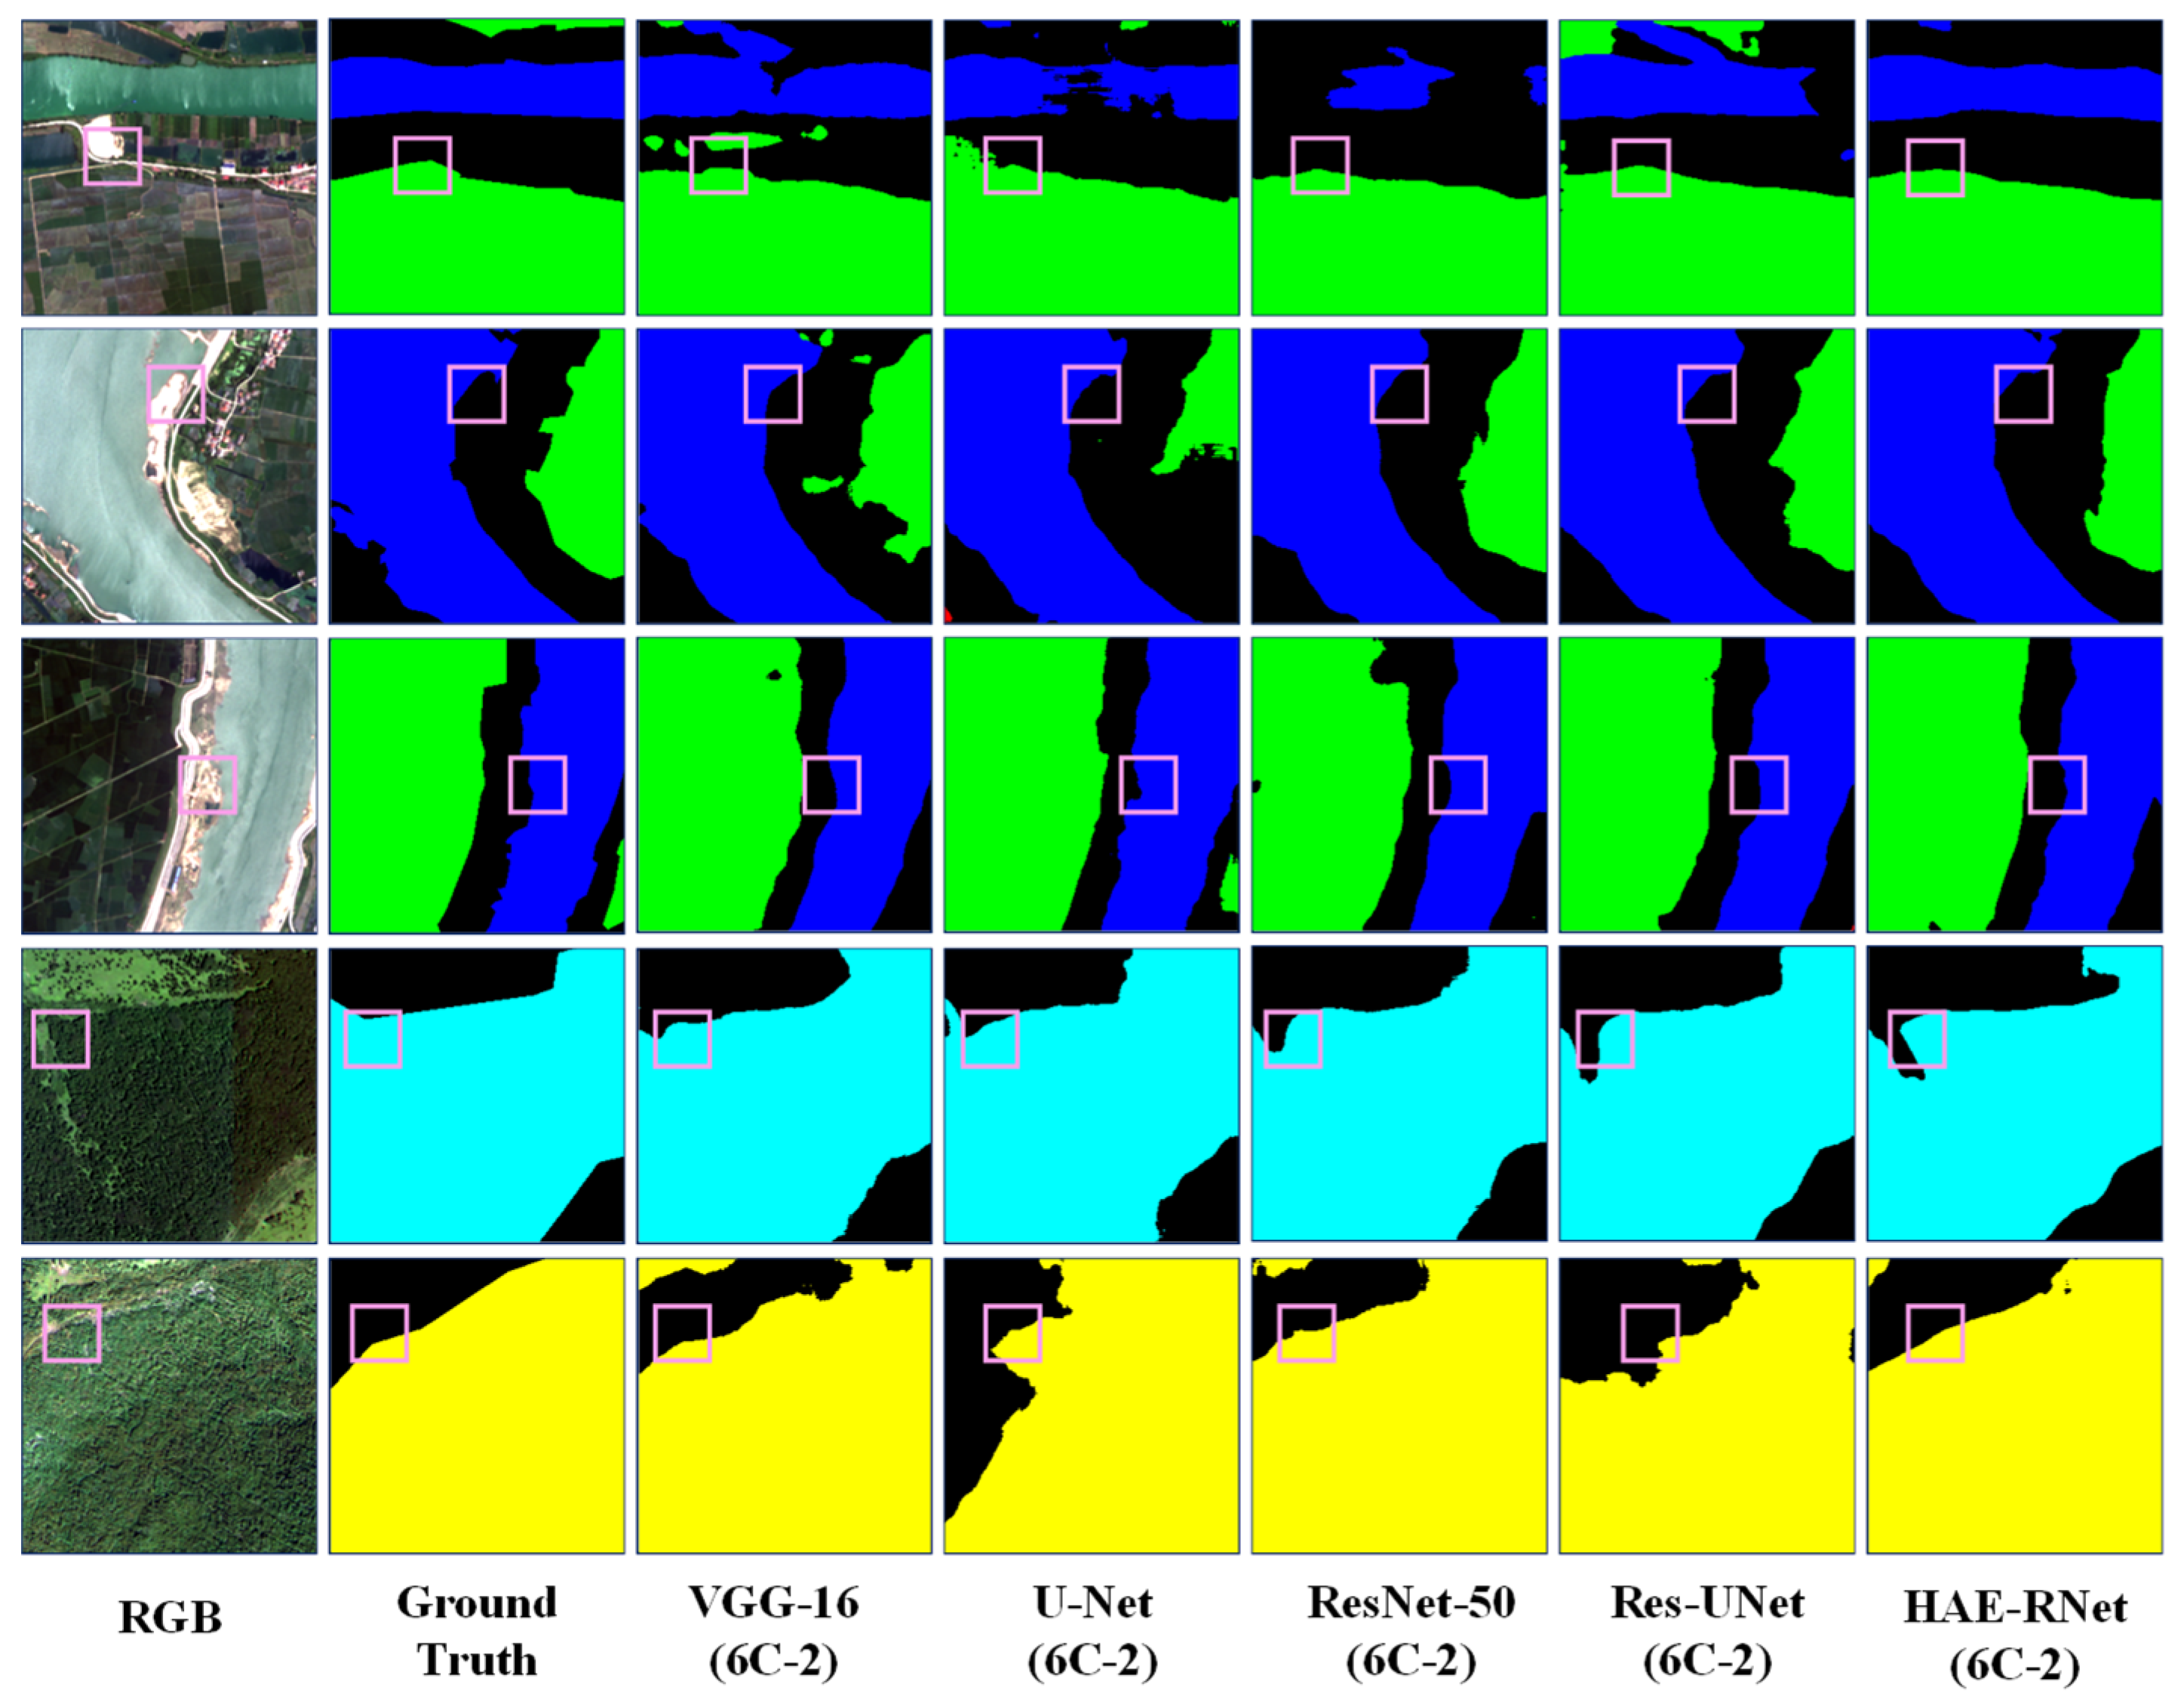
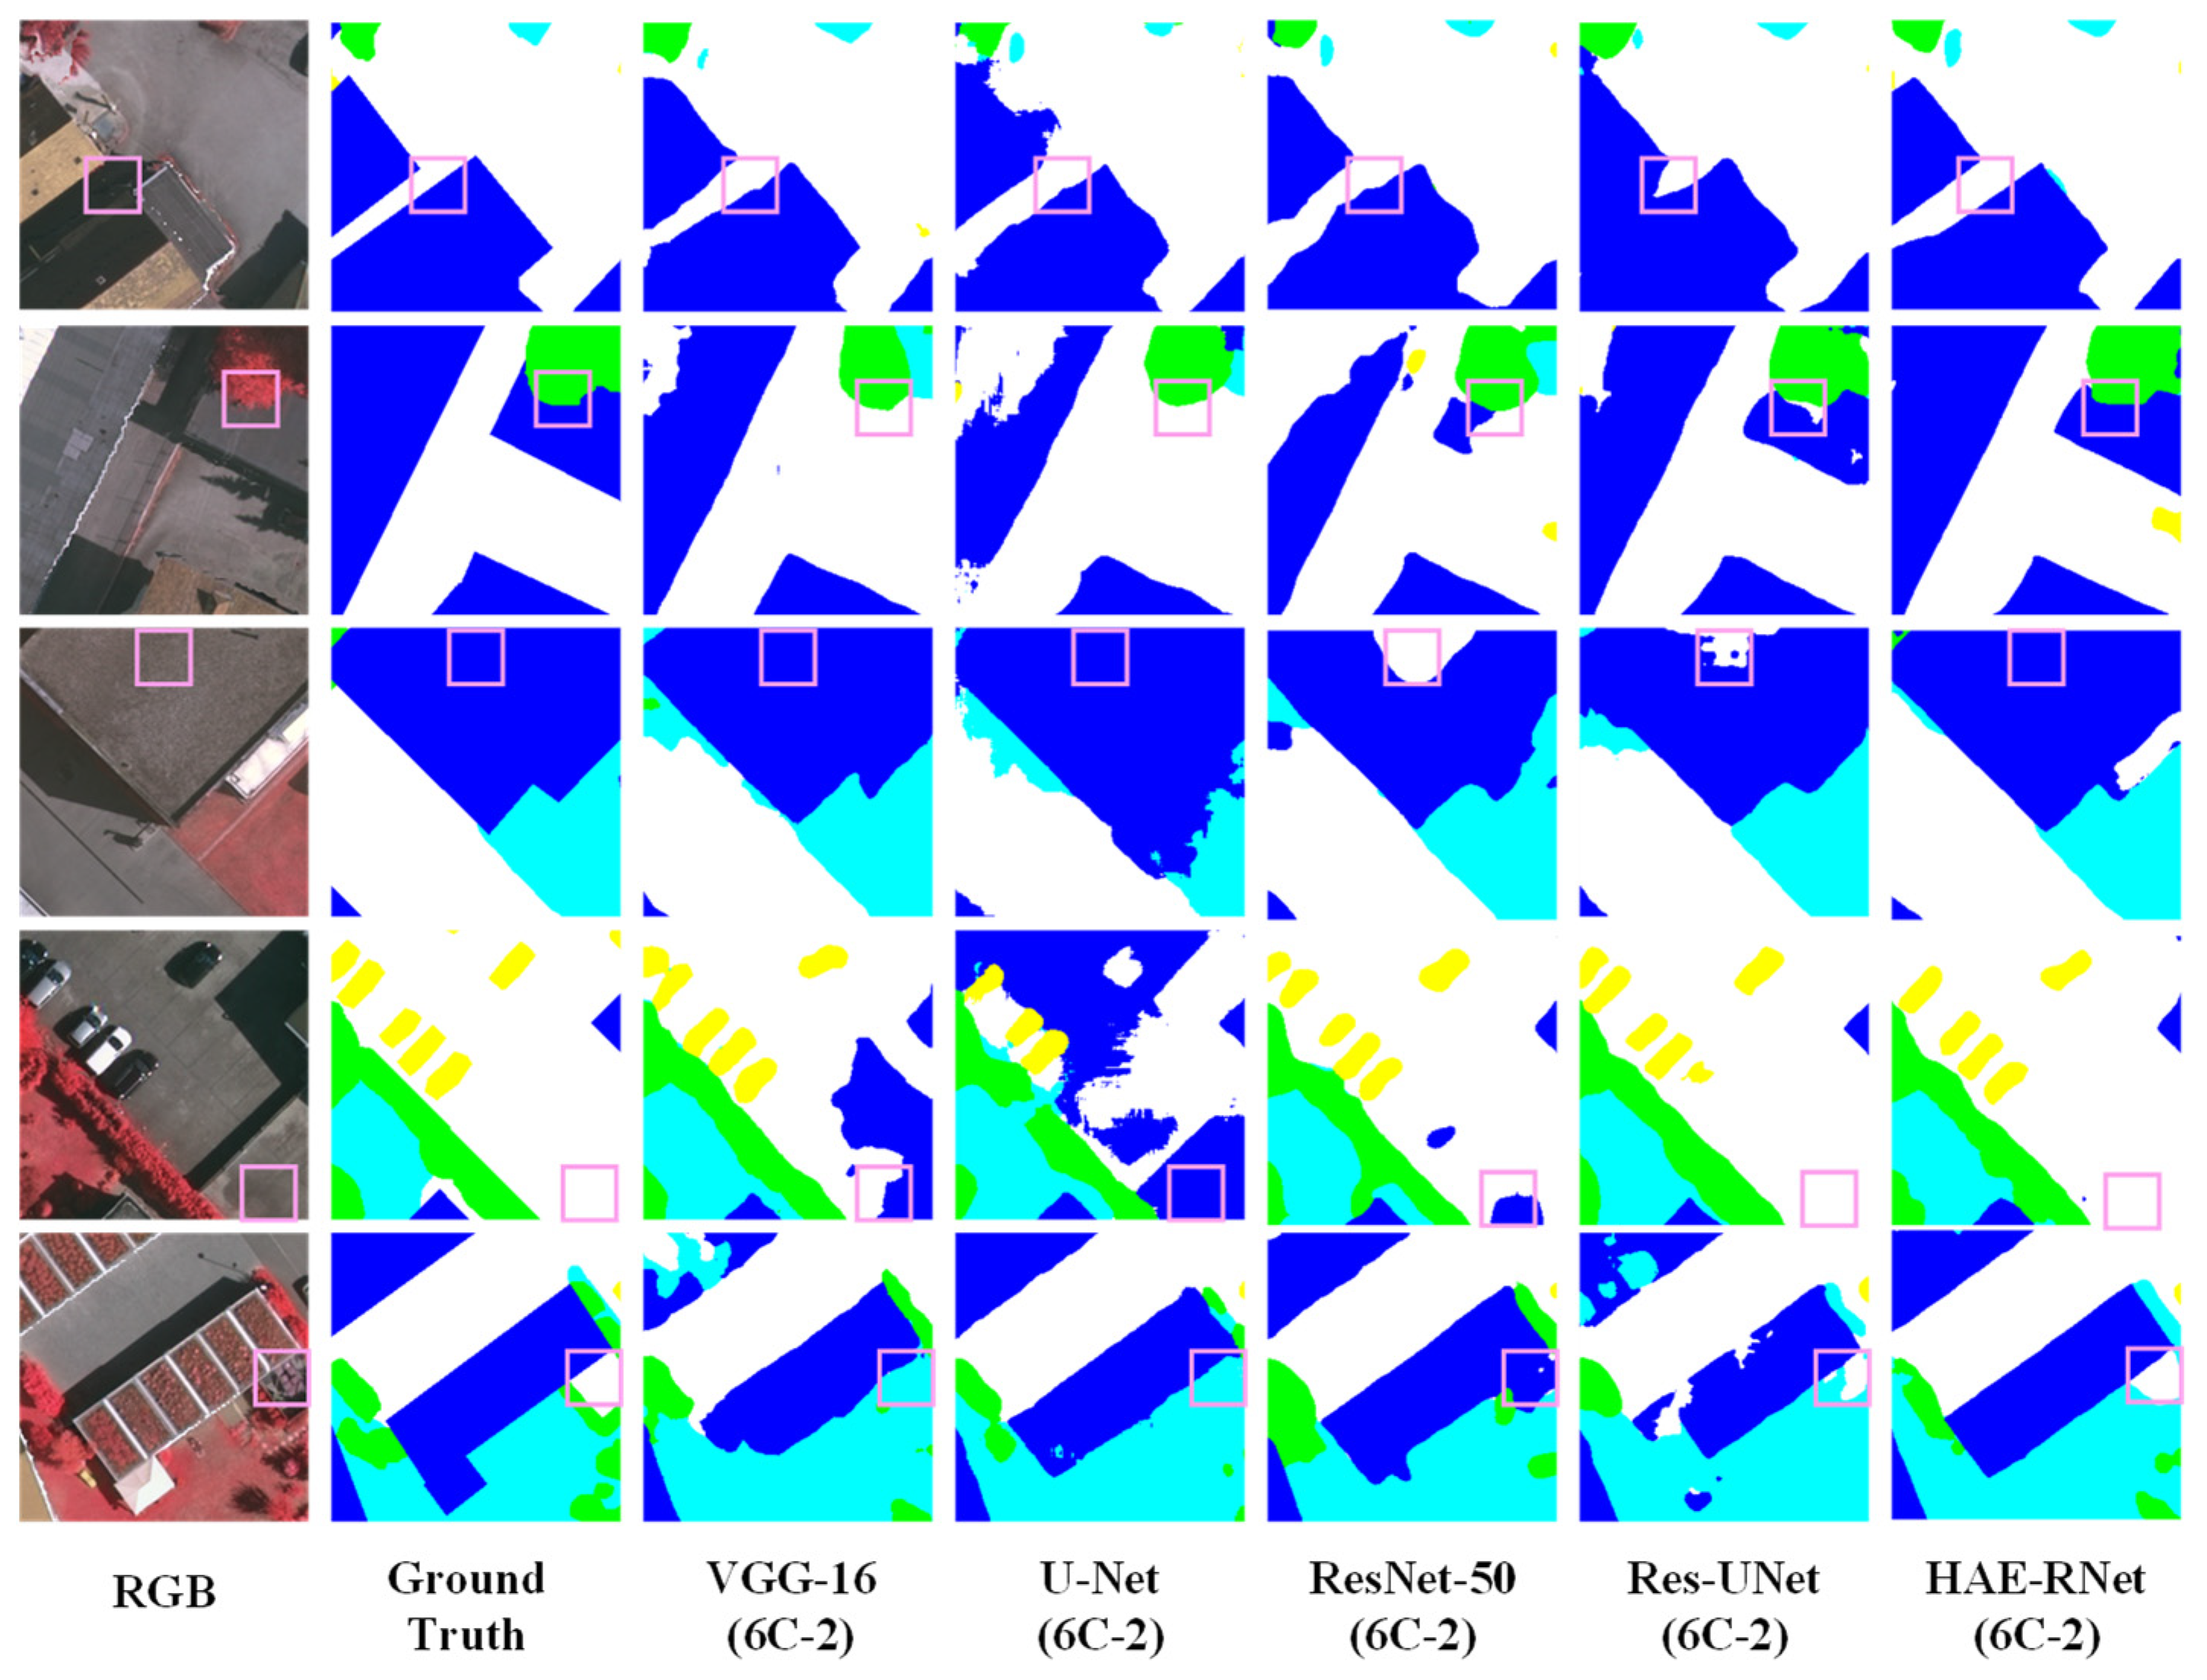
Figure 12 and Figure 13 illustrate an example of the segmentation results using the (6C-2) channel in each classical network. It is evident that our network’s segmentation results have smoother edges and can effectively segment mislabeled categories in the ground Truth. Table 10 provides information on the classical networks’ parameters, FLOPs (floating-point operations), and our improved model. Notably, our enhanced model achieves better results without the need for excessive additional modules compared to Res-UNet.
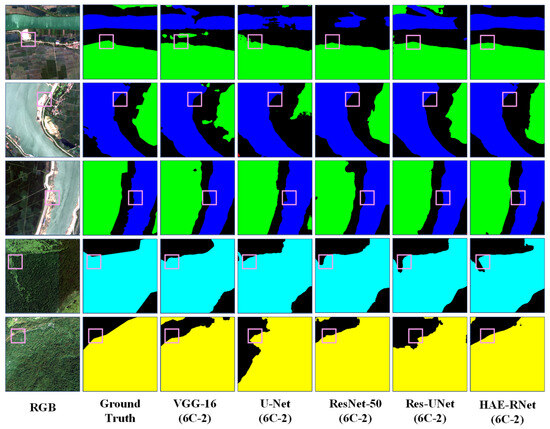
Figure 12.
Comparison of Segmentation Results of VGG-16, U-Net, ResNet-50, Res-UNet, and HAE-RNet (6C-2) on the GID Dataset.
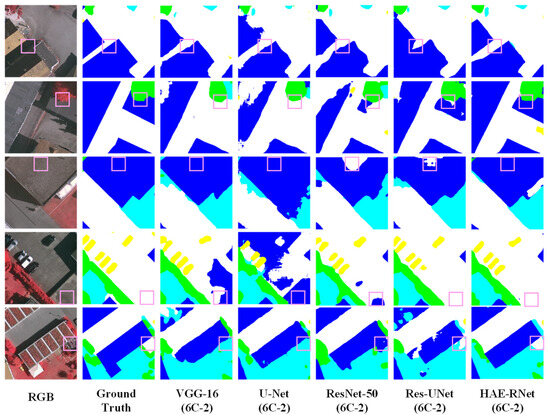
Figure 13.
Comparison of Segmentation Results of VGG-16, U-Net, ResNet-50, Res-UNet, and HAE-RNet (6C-2) on the Vaihingen Dataset.

Table 10.
Numbers of Parameters and FLOPs Used by Different Networks.
HAE-RNet exhibits notable superiority when compared to classical semantic segmentation algorithms like VGG-16, ResNet-50, U-Net, and ResUNet, demonstrating clear segmentation capabilities across forests, farmlands, grasslands, and water bodies. The VGG-16 algorithm performs poorly in terms of overall segmentation ability, and there are a lot of mis-segmentation and omission phenomena. The U-Net algorithm improves the segmentation ability, but for the U-Net algorithm, it is more accurate.
While the U-Net algorithm elevates the segmentation ability, it falls short in effectively distinguishing between segments of grassland and farmland. Conversely, the ResNet-50 algorithm exhibits more accuracy in the segmentation of grasslands and water bodies. The ResNet-50 algorithm also has errors and omissions in the categories of grass and water, but the overall segmentation effect is significantly better than that of the VGG-16 and U-Net algorithms. However, the overall segmentation effect is significantly better than that of VGG-16 and U-Net algorithms. Compared with the classic semantic segmentation algorithms, the ResUNet algorithm shows a significant improvement, but still cannot segment grass and water bodies accurately. Compared with the classic semantic segmentation algorithm, the ResUNet algorithm shows significant improvement, but it still cannot accurately segment the edge feature information of grass and water. The HAE-RNet algorithm can accurately segment water bodies, grass, and their edge features in remote sensing images, and is significantly better than other classical semantic segmentation algorithms in terms of its segmentation effect. It is significantly better than other classical semantic segmentation algorithms.
HAE-RNet compares favorably with VGG-16, ResNet-50, U-Net, and the U-Net and ResUNet classical semantic segmentation algorithms. HAE-RNet can segment cars, low vegetation, trees, and impervious surfaces. The VGG-16 algorithm and the U-Net algorithm can segment cars, low vegetation, trees, and impervious surfaces, and the segmentation of edges is more complete. The VGG-16 algorithm and U-Net algorithm have a poorer segmentation ability and more errors. The VGG-16 algorithm and U-Net algorithm have a poor segmentation ability, and there are a lot of mistakes and omissions in segmentation. ResNet-50 also makes mistakes and omissions in the segmentation of trees, low vegetation, and impervious surfaces.
ResNet-50 also has misclassification and omission in trees, low vegetation, and impermeable surfaces, but the overall segmentation effect is much better than that of the VGG-16 and U-Net algorithms. The ResUNet algorithm has pretzel noise and is less accurate in segmenting cars and buildings. HAE-RNet can accurately segment cars, buildings, impervious surfaces, and their edge features in remote sensing images, and the segmentation effect is better than other classical semantic algorithms.
HAE-RNet can accurately segment cars, buildings, and impervious surfaces and their edge features in remote sensing images, and the segmentation effect is greatly improved compared with other classical semantic segmentation algorithms.
5.3.2. Comparison with Other State-of-the-Art Frameworks
In this section, we compare the results of the HAE-RNet model with other architectures on the GID dataset and the Vaihingen dataset, as shown in Table 11 and Table 12.
Wang et al. [55] proposed the decoupling NAS (DNAS) framework, which aims to reduce the memory footprint and automatically design network architectures for high-resolution remote sensing image semantic segmentation. Based on the Deeplab v3+ network, Wang et al. [56] proposed a class feature attention mechanism incorporating an improved CFAMNet for the semantic segmentation of remote sensing images such as inaccurate edge target segmentation, the inconsistent segmentation of different types of targets, and low prediction efficiency semantic segmentation. He et al. [57] utilized the holistically nested edge detection (HED) network to detect edge information and correct the segmentation results obtained from the FCN. Li et al. [58] proposed an attentional aggregation module (AAM) to enhance multiscale feature learning via attention-guided feature aggregation. The dual attention deep fusion semantic segmentation network for large-scale satellite remote sensing images (DASSNRSI) [59] consisted of a novel encoder–decoder architecture and a weighted adaptive loss function based on focus loss. In particular, weighted adaptive focus loss (W-AFL) is successfully inferred and embedded to minimize the class imbalance problem. The multi-field-of-view depth adaptive fusion network (MFVNet) [60] took into account the differences between multiple fields-of-view (FOV). The output feature and score maps are aligned to overcome the spatial mismatch between scales by the scale alignment module. Finally, the aligned score maps are fused with the help of adaptive weight maps to produce fused prediction results. MSNet [33] bears the most similarity to our network, as both segments extract remote sensing indices. Furthermore, our results are superior to all other networks, verifying the method’s effectiveness.

Table 11.
Comparison of assessment scores generated by state-of-the-art methods on the GID test set.
Table 11.
Comparison of assessment scores generated by state-of-the-art methods on the GID test set.
| Networks | OA | Recall | F1 | mIoU | FWIoU |
|---|---|---|---|---|---|
| DPA-PSP-Net [55] | / | / | 72.56 | 67.92 | / |
| CFAMNet [56] | 85.01 | / | / | 77.22 | / |
| Cascade-Edge-FCN [57] | / | / | / | 81.06 | 89.06 |
| Correct-Edge-FCN [59] | / | / | / | 80.43 | 89.42 |
| FPN [58] | 91.0 | / | 90.1 | 82.2 | / |
| DASSN_RSI [59] | 85.49 | 83.32 | 85.37 | 74.45 | / |
| MFVNet [60] | / | / | 97.70 | 95.60 | 96.70 |
| MSNet (4C) [33] | 93.49 | 92.92 | 91.50 | 84.34 | 87.81 |
| MSNet (6C) | 93.85 | 91.49 | 91.44 | 84.23 | 88.48 |
| HAE-RNet (4C) | 95.88 | 96.98 | 96.64 | 93.60 | 92.19 |
| HAE-Rnet (6C-2) | 97.86 | 98.45 | 98.32 | 96.72 | 95.82 |
In comparison with the Vaihingen dataset, Li et al. [61] proposed a new end-to-end semantic segmentation network called the Spatial and Channel Attention Network (SCAttNet), which integrates lightweight spatial attention modules and channel attention modules to refine features adaptively. The Gated Feedback Refinement Network [62] used a gating mechanism in the encoder–decoder framework to accomplish the semantic segmentation task, combining local and global contextual information. The Convolutional Block Attention Module (CBAM) inferred attention maps sequentially along two independent dimensions (channel and spatial). Then, it multiplied the attention maps with the input feature maps for adaptive feature refinement. CBAM is a lightweight and generic module that can be seamlessly integrated into any CNN architecture with negligible overhead, and it can be end-to-end trained with basic CNNs. Keiller Nogueira et al. [63] performed remote sensing semantic segmentation through a unique training process that aggregates multiple contextual information while determining the optimal input patch size for the inference stage. This approach can be trained or fine-tuned for any semantic segmentation application.

Table 12.
Comparison of assessment scores generated by state-of-the-art methods on the Vaihingen test set.
Table 12.
Comparison of assessment scores generated by state-of-the-art methods on the Vaihingen test set.
| Networks | OA | mIoU |
|---|---|---|
| SCAttNet [61] | 85.47 | 70.20 |
| G-FRNet [62] | 85.52 | 70.77 |
| CBAM [64] | 84.96 | 69.46 |
| Dilated6 network [63] | 88.66 | / |
| HAE-RNet (6C-2) | 89.59 | 74.79 |
6. Conclusions
This paper enriched the network input with various nonlinear spectral indices, such as vegetation and water indices, and introduced a novel holistic attention edge detection network (HAE-RNet), thereby enhancing the segmentation performance of remote sensing images. Through extensive experimentation on the GID and Vaihingen datasets, HAE-RNet demonstrates significant improvements compared to classical and advanced semantic segmentation models of the same type. The model achieves high prediction accuracy and provides valuable insights into the contribution of spectral feature information, such as NIR, NDWI, GNDVI, DSM, NDVI, DVI, and RVI, when combined with visible bands. By exploring the optimal channel combinations for the datasets, we effectively utilize the multispectral image data by calculating various spectral metrics. The experimental results also validate the effectiveness of spectral indices in improving the overall segmentation accuracy. The 6C-2 data pattern proves particularly valuable in both datasets and can be leveraged in other segmentation methods to enhance accuracy further. Additionally, future work will focus on exploring more superior band combinations to continue improving segmentation performance.
Author Contributions
Conceptualization, Y.Z. (Yue Zhang) and R.Y.; methodology, Y.Z. (Yue Zhang), R.Y., Q.D. and L.W.; software, Y.Z. (Yue Zhang) and R.Y.; validation, Y.Z. (Yue Zhang), R.Y., Q.D., J.W. and L.W.; formal analysis, L.W. and Q.D.; investigation, W.X. and Y.Z. (Yili Zhao); resources, L.W., Q.D., W.X. and Y.Z. (Yili Zhao); data curation, Y.Z. (Yue Zhang) and R.Y.; writing—original draft preparation, Y.Z. (Yue Zhang) and R.Y.; writing—review and editing, Y.Z. (Yue Zhang), R.Y., L.W., Q.D., W.X. and Y.Z. (Yili Zhao); visualization, Y.Z. (Yue Zhang) and R.Y.; supervision, L.W. and Q.D.; project administration, W.X. and Y.Z. (Yili Zhao); funding acquisition, J.W., L.W., Q.D., W.X. and Y.Z. (Yili Zhao). All authors have read and agreed to the published version of the manuscript.
Funding
This work was supported in part by the Major Scientific and Technological projects of the Yunnan Province under Grant 202202AD080010; in part by the National Natural Science Foundation of China under Grants 32160369, 41961053, 32060320 and 31860182; and in part by the “Ten Thousand Talents Program” Special Project for Young Top-Notch Talents of the Yunnan Province under grant YNWR-QNBJ-2019-026.
Data Availability Statement
The data that support the findings of this study will be openly available on 1 December 2023 in a public repository, HAE-RNet, at https://github.com/970825548/HAE-RNet.
Acknowledgments
We thank the GID dataset and ISPRS for providing the Vaihingen dataset of airborne data images, which are free and publicly available. For more information, see the GID and ISPRS official website on Land-Cover Classification with High-Resolution Remote Sensing Images Using Transferable Deep Models and Test Project Urban Classification and 3D Building Reconstruction–2D Semantic Labeling Contest.
Conflicts of Interest
The authors declare no conflict of interest.
References
- Foody, G.M. Status of land cover classification accuracy assessment. Remote Sens. Environ. 2002, 80, 185–201. [Google Scholar] [CrossRef]
- Yang, Y.; Newsam, S. Geographic image retrieval using local invariant features. IEEE Trans. Geosci. Remote Sens. 2012, 51, 818–832. [Google Scholar] [CrossRef]
- Joyce, K.E.; Belliss, S.E.; Samsonov, S.V.; McNeill, S.J.; Glassey, P.J. A review of the status of satellite remote sensing and image processing techniques for mapping natural hazards and disasters. Prog. Phys. Geogr. 2009, 33, 183–207. [Google Scholar] [CrossRef]
- Haralick, R.M.; Shanmugam, K.; Dinstein, I.H. Textural features for image classification. IEEE Trans. Syst. Man Cybern. 1973, 6, 610–621. [Google Scholar] [CrossRef]
- Cortes, C.; Vapnik, V. Support-vector networks. Mach. Learn. 1995, 20, 273–297. [Google Scholar] [CrossRef]
- Breiman, L. Random forests. Mach. Learn. 2001, 45, 5–32. [Google Scholar] [CrossRef]
- Tucker, C.J. Red and photographic infrared linear combinations for monitoring vegetation. Remote Sens. Environ. 1979, 8, 127–150. [Google Scholar] [CrossRef]
- Gitelson, A.A.; Kaufman, Y.J.; Merzlyak, M.N. Use of a green channel in remote sensing of global vegetation from EOS-MODIS. Remote Sens. Environ. 1996, 58, 289–298. [Google Scholar] [CrossRef]
- Major, D.; Baret, F.; Guyot, G. A ratio vegetation index adjusted for soil brightness. Int. J. Remote Sens. 1990, 11, 727–740. [Google Scholar] [CrossRef]
- Huete, A.R. A soil-adjusted vegetation index (SAVI). Remote Sens. Environ. 1988, 25, 295–309. [Google Scholar] [CrossRef]
- Gao, B.-C. NDWI—A normalized difference water index for remote sensing of vegetation liquid water from space. Remote Sens. Environ. 1996, 58, 257–266. [Google Scholar] [CrossRef]
- Yuan, X.; Shi, J.; Gu, L. A review of deep learning methods for semantic segmentation of remote sensing imagery. Expert Syst. Appl. 2021, 169, 114417. [Google Scholar] [CrossRef]
- LeCun, Y.; Boser, B.; Denker, J.S.; Henderson, D.; Howard, R.E.; Hubbard, W.; Jackel, L.D. Backpropagation applied to handwritten zip code recognition. Neural Comput. 1989, 1, 541–551. [Google Scholar] [CrossRef]
- Sun, Y.; Zuo, W.; Liu, M. Rtfnet: Rgb-thermal fusion network for semantic segmentation of urban scenes. IEEE Robot. Autom. Lett. 2019, 4, 2576–2583. [Google Scholar] [CrossRef]
- Iwashita, Y.; Nakashima, K.; Stoica, A.; Kurazume, R. Tu-Net and Tdeeplab: Deep Learning-Based Terrain Classification Robust to Illumination Changes, Combining Visible and Thermal Imagery; IEEE: Piscataway, NJ, USA, 2019; pp. 280–285. [Google Scholar]
- Hazirbas, C.; Ma, L.; Domokos, C.; Cremers, D. Fusenet: Incorporating Depth into Semantic Segmentation via Fusion-Based cnn Architecture; Springer: Berlin/Heidelberg, Germany, 2017; pp. 213–228. [Google Scholar]
- Ha, Q.; Watanabe, K.; Karasawa, T.; Ushiku, Y.; Harada, T. MFNet: Towards Real-Time Semantic Segmentation for Autonomous Vehicles with Multi-Spectral Scenes; IEEE: Piscataway, NJ, USA, 2017; pp. 5108–5115. [Google Scholar]
- Xiao, X.; Lian, S.; Luo, Z.; Li, S. Weighted Res-Unet for High-Quality Retina Vessel Segmentation; IEEE: Piscataway, NJ, USA, 2018; pp. 327–331. [Google Scholar]
- Sei, F.K.M. Neocognitron: A Self-Organizing Neural Network Model for a Mechanism of Visual Pattern Recognition Competition and Cooperation in Neural Nets; Springer: Berlin/Heidelberg, Germany, 1982; pp. 193–202. [Google Scholar]
- Yu, D.; Wang, H.; Chen, P.; Wei, Z. Mixed pooling for convolutional neural networks. In Mixed Pooling for Convolutional Neural Networks; Springer: Berlin/Heidelberg, Germany, 2014; pp. 364–375. [Google Scholar]
- LeCun, Y.; Bottou, L.; Bengio, Y.; Haffner, P. Gradient-based learning applied to document recognition. Proc. IEEE 1998, 86, 2278–2324. [Google Scholar] [CrossRef]
- Dash, T.; Chitlangia, S.; Ahuja, A.; Srinivasan, A. Incorporating domain knowledge into deep neural networks. arXiv 2021, arXiv:2103.00180. [Google Scholar]
- Chen, L.-C.; Papandreou, G.; Kokkinos, I.; Murphy, K.; Yuille, A.L. Deeplab: Semantic image segmentation with deep convolutional nets, atrous convolution, and fully connected crfs. IEEE Trans. Pattern Anal. Mach. Intell. 2017, 40, 834–848. [Google Scholar] [CrossRef]
- Long, J.; Shelhamer, E.; Darrell, T. Fully Convolutional Networks for Semantic Segmentation. In Proceedings of the IEEE Conference on Computer Vision and Pattern Recognition, Boston, MA, USA, 7–12 June 2015; IEEE: Piscataway, NJ, USA, 2015; pp. 3431–3440. [Google Scholar]
- Chen, L.-C.; Papandreou, G.; Kokkinos, I.; Murphy, K.; Yuille, A.L. Semantic image segmentation with deep convolutional nets and fully connected crfs. arXiv 2014, arXiv:1412.7062. [Google Scholar]
- Chen, L.-C.; Zhu, Y.; Papandreou, G.; Schroff, F.; Adam, H. Encoder-decoder with atrous separable convolution for semantic image segmentation. In Proceedings of the European Conference on Computer Vision (ECCV), Munich, Germany, 8–14 September 2018; IEEE: Piscataway, NJ, USA, 2018; pp. 801–818. [Google Scholar]
- Ronneberger, O.; Fischer, P.; Brox, T. U-Net: Convolutional Networks for Biomedical Image Segmentation; Springer: Berlin/Heidelberg, Germany, 2015; pp. 234–241. [Google Scholar]
- Badrinarayanan, V.; Kendall, A.; Cipolla, R. Segnet: A deep convolutional encoder-decoder architecture for image segmentation. IEEE Trans. Pattern Anal. Mach. Intell. 2017, 39, 2481–2495. [Google Scholar] [CrossRef]
- Lin, G.; Milan, A.; Shen, C.; Reid, I. Refinenet: Multi-Path Refinement Networks for High-Resolution Semantic Segmentation. In Proceedings of the IEEE Conference on Computer Vision and Pattern Recognition, Honolulu, HI, USA, 21–26 July 2017; IEEE: Piscataway, NJ, USA, 2017; pp. 1925–1934. [Google Scholar]
- He, K.; Zhang, X.; Ren, S.; Sun, J. Deep Residual Learning for Image Recognition. In Proceedings of the IEEE Conference on Computer Vision and Pattern Recognition, Las Vegas, NV, USA, 27–30 June 2016; IEEE: Piscataway, NJ, USA, 2016; pp. 770–778. [Google Scholar]
- Diakogiannis, F.I.; Waldner, F.; Caccetta, P.; Wu, C. ResUNet-a: A deep learning framework for semantic segmentation of remotely sensed data. ISPRS J. Photogramm. Remote Sens. Environ. 2020, 162, 94–114. [Google Scholar] [CrossRef]
- Chen, K.; Zou, Z.; Shi, Z. Building extraction from remote sensing images with sparse token transformers. Remote Sens. Environ. 2021, 13, 4441. [Google Scholar] [CrossRef]
- Tao, C.; Meng, Y.; Li, J.; Yang, B.; Hu, F.; Li, Y.; Cui, C.; Zhang, W. MSNet: Multispectral semantic segmentation network for remote sensing images. GIScience Remote Sens. 2022, 59, 1177–1198. [Google Scholar] [CrossRef]
- Gupta, S.; Girshick, R.; Arbeláez, P.; Malik, J. Learning Rich Features from RGB-D Images for Object Detection and Segmentation; Springer: Berlin/Heidelberg, Germany, 2014; pp. 345–360. [Google Scholar]
- Li, Z.; Gan, Y.; Liang, X.; Yu, Y.; Cheng, H.; Lin, L. LSTM-CF: Unifying Context Modeling and Fusion with Lstms for Rgb-d Scene Labeling; Springer: Berlin/Heidelberg, Germany, 2016; pp. 541–557. [Google Scholar]
- Xing, S.; Dong, Q.; Hu, Z. SCE-Net: Self-and cross-enhancement network for single-view height estimation and semantic segmentation. Remote Sens. Environ. 2022, 14, 2252. [Google Scholar] [CrossRef]
- Hatamizadeh, A.; Terzopoulos, D.; Myronenko, A. Edge-gated CNNs for volumetric semantic segmentation of medical images. arXiv 2020, arXiv:2002.04207. [Google Scholar]
- Wang, L.; Huang, X.; Zheng, C.; Zhang, Y.; Sensing, R. A Markov random field integrating spectral dissimilarity and class co-occurrence dependency for remote sensing image classification optimization. ISPRS J. Photogramm. Remote Sens. 2017, 128, 223–239. [Google Scholar] [CrossRef]
- Zheng, C.; Wang, L.; Chen, X. A hybrid Markov random field model with multi-granularity information for semantic segmentation of remote sensing imagery. IEEE J. Sel. Top. Appl. Earth Obs. Remote Sens. Environ. 2019, 12, 2728–2740. [Google Scholar] [CrossRef]
- Zheng, C.; Zhang, Y.; Wang, L. Multigranularity multiclass-layer Markov random field model for semantic segmentation of remote sensing images. IEEE Trans. Geosci. Remote Sens. Environ. 2020, 59, 10555–10574. [Google Scholar] [CrossRef]
- Witkin, A. Scale-Space Filtering: A New Approach to Multi-Scale Description; IEEE: Piscataway, NJ, USA, 1984; pp. 150–153. [Google Scholar]
- Yuille, A.L.; Poggio, T.A. Scaling theorems for zero crossings. IEEE Trans. Pattern Anal. Mach. Intell. 1986, 1, 15–25. [Google Scholar] [CrossRef]
- Xie, S.; Tu, Z. Holistically-Nested Edge Detection. In Proceedings of the IEEE International Conference on Computer Vision, Santiago, Chile, 7–13 December 2015; IEEE: Piscataway, NJ, USA, 2015; pp. 1395–1403. [Google Scholar]
- Yang, S.; He, Q.; Lim, J.H.; Jeon, G. Boundary-guided DCNN for building extraction from high-resolution remote sensing images. Int. J. Adv. Manuf. Technol. 2022, 1–17. [Google Scholar] [CrossRef]
- Jung, H.; Choi, H.-S.; Kang, M. Boundary enhancement semantic segmentation for building extraction from remote sensed image. IEEE Trans. Geosci. Remote Sens. Environ. 2021, 60, 1–12. [Google Scholar] [CrossRef]
- Kokkinos, I. Pushing the boundaries of boundary detection using deep learning. arXiv 2015, arXiv:1511.07386. [Google Scholar]
- Yang, R.; Zheng, C.; Wang, L.; Zhao, Y.; Fu, Z.; Dai, Q. MAE-BG: Dual-stream boundary optimization for remote sensing image semantic segmentation. Geocarto Int. 2023, 38, 2190622. [Google Scholar] [CrossRef]
- Tong, X.-Y.; Xia, G.-S.; Lu, Q.; Shen, H.; Li, S.; You, S.; Zhang, L. Land-cover classification with high-resolution remote sensing images using transferable deep models. Remote Sens. Environ. 2020, 237, 111322. [Google Scholar] [CrossRef]
- International Society for Photogrammetry and Remote Sensing. 2Dsemantic Labeling Contest. Available online: http://www2.isprs.org/commissions/comm3/wg4/semantic-labeling.html (accessed on 20 March 2020).
- Garcia-Garcia, A.; Orts-Escolano, S.; Oprea, S.; Villena-Martinez, V.; Garcia-Rodriguez, J. A review on deep learning techniques applied to semantic segmentation. arXiv 2017, arXiv:1704.06857. [Google Scholar]
- Srivastava, S.; Volpi, M.; Tuia, D. Joint Height Estimation and Semantic Labeling of Monocular Aerial Images with CNNs’; IEEE: Piscataway, NJ, USA, 2017; pp. 5173–5176. [Google Scholar]
- Xess, M.; Agnes, S.A. Analysis of image segmentation methods based on performance evaluation parameters. Int. J. Comput. Eng. Res. 2014, 4, 68–75. [Google Scholar]
- Mignotte, M. A label field fusion model with a variation of information estimator for image segmentation. Inf. Fusion 2014, 20, 7–20. [Google Scholar] [CrossRef]
- Rand, W.M. Objective criteria for the evaluation of clustering methods. J. Am. Stat. Assoc. 1971, 66, 846–850. [Google Scholar] [CrossRef]
- Wang, Y.; Li, Y.; Chen, W.; Li, Y.; Dang, B. DNAS: Decoupling Neural Architecture Search for High-Resolution Remote Sensing Image Semantic Segmentation. Remote Sens. Environ. 2022, 14, 3864. [Google Scholar] [CrossRef]
- Wang, Z.; Wang, J.; Yang, K.; Wang, L.; Su, F.; Chen, X. Semantic segmentation of high-resolution remote sensing images based on a class feature attention mechanism fused with Deeplabv3+. Comput. Geosci. 2022, 158, 104969. [Google Scholar] [CrossRef]
- He, C.; Li, S.; Xiong, D.; Fang, P.; Liao, M. Remote sensing image semantic segmentation based on edge information guidance. Remote Sens. Environ. 2020, 12, 1501. [Google Scholar] [CrossRef]
- Li, R.; Wang, L.; Zhang, C.; Duan, C.; Zheng, S. A2-FPN for semantic segmentation of fine-resolution remotely sensed images. Int. J. Remote Sens. 2022, 43, 1131–1155. [Google Scholar] [CrossRef]
- Li, X.; Xu, F.; Lyu, X.; Gao, H.; Tong, Y.; Cai, S.; Li, S.; Liu, D. Dual attention deep fusion semantic segmentation networks of large-scale satellite remote-sensing images. Int. J. Remote Sens. 2021, 42, 3583–3610. [Google Scholar] [CrossRef]
- Li, Y.; Chen, W.; Huang, X.; Gao, Z.; Li, S.; He, T.; Zhang, Y. MFVNet: A deep adaptive fusion network with multiple field-of-views for remote sensing image semantic segmentation. Sci. China Inf. Sci. 2023, 66, 140305. [Google Scholar] [CrossRef]
- Li, H.; Qiu, K.; Chen, L.; Mei, X.; Hong, L.; Tao, C. SCAttNet: Semantic segmentation network with spatial and channel attention mechanism for high-resolution remote sensing images. IEEE Geosci. Remote Sens. Lett. 2020, 18, 905–909. [Google Scholar] [CrossRef]
- Islam, M.A.; Rochan, M.; Naha, S.; Bruce, N.D.; Wang, Y. Gated feedback refinement network for coarse-to-fine dense semantic image labeling. Gated feedback refinement network for coarse-to-fine dense semantic image labeling. arXiv 2018, arXiv:1806.11266. [Google Scholar]
- Nogueira, K.; Dalla Mura, M.; Chanussot, J.; Schwartz, W.R.; Dos Santos, J.A. Dynamic multicontext segmentation of remote sensing images based on convolutional networks. IEEE Trans. Geosci. Remote Sens. 2019, 57, 7503–7520. [Google Scholar] [CrossRef]
- Woo, S.; Park, J.; Lee, J.-Y.; Kweon, I.S. Cbam: Convolutional Block Attention Module. In Proceedings of the European Conference on Computer Vision (ECCV), Munich, Germany, 8–14 September 2018; IEEE: Piscataway, NJ, USA, 2018; pp. 3–19. [Google Scholar]
Disclaimer/Publisher’s Note: The statements, opinions and data contained in all publications are solely those of the individual author(s) and contributor(s) and not of MDPI and/or the editor(s). MDPI and/or the editor(s) disclaim responsibility for any injury to people or property resulting from any ideas, methods, instructions or products referred to in the content. |
© 2023 by the authors. Licensee MDPI, Basel, Switzerland. This article is an open access article distributed under the terms and conditions of the Creative Commons Attribution (CC BY) license (https://creativecommons.org/licenses/by/4.0/).


